regi report vf - babson college
TRANSCRIPT

April 11,2020
Energy & Materials Sector 1
Renewable Energy Group, Inc. (NASDAQ: REGI) – REGI for the future!
The Babson College Fund is initiating coverage on REGI with a buy rating and a $56 target price, representing a potential upside of 144%.
Company Overview Founded 1996, HQ: Ames, IA REGI provides lower carbon transportation fuels in the United States and internationally. The company utilizes an integrated production, distribution, and logistics system to convert natural fats, oils, and greases into advanced biofuels. Their revenues are mainly divided into three categories: 1) Biomass-based diesel 2) Seperated RIN sales 3) Biomass-based diesel government incentives Investment Thesis 1) REGI is best positioned to benefit from the Biodiesel Tax
Credit extension
2) Making the Energy portfolio ESG friendly and decreasing exposure to oil prices
3) Biodiesel Tax Credit reinstatement gives REGI the ability to allocate CapEx to new projects and develop their downstream strategy.
Valuation
Our weighted average target price of $56 is derived from a discounted cash flow (90%) and comparative company analysis (10%).
Stock Rating | BuyPrice Target $56Current Price $23Upside 144%Consensus $39Recommended Weight (of Energy) 7%Benchmark Weight (XLE) N/AKey Statistics 52-Wk Range $9.90 $31.50Avg. Daily Vol in MM 0.72Market Value (MM) $914Ent Value (MM) $419Shares Out (MM) 40Dividend Yield 0.00%Beta 5y 0.97% Short Interest of float 13.6%Insider Buying 3.2%Key Financials $MM 2020E 2020E 2021ERevenue 1,564,195 2,803,756 3,364,508Y/Y Growth -40.7% 79.2% 20.0%EBIT (7,939) 174,949 220,377EBITDA 40,669 227,104 272,525UFCF 481,169 17,927 54,757EV / EBITDA 10.3x 1.8x 1.5xP / E - 4.2x 3.5xFCF Yield 30.8% 0.6% 1.6%Share Price 1M 3M 12MREGI 0.1% (8.7%) 1.3%S&P 500 (3.2%) (18.2%) (8.2%)XLE (5.5%) (46.3%) (52.8%)
Price % Weight CompCo $47 10%DCF $57 90%Target Price $56Current Share Price $23Upside 144%Equity Value $2,228,408Enterprise Value $19,087
Consensus Price Target $39Different from Consensus 44.4%Consensus Rating BUY
Valuation Summary

April 11,2020
Energy & Materials Sector 2
Comparative Stock Price (LTM)
Company Overview
Renewable Energy Group, Inc. provides lower carbon transportation fuels in the United States and internationally. The company utilizes an integrated production, distribution, and logistics system to convert natural fats, oils, and greases into advanced biofuels. It operates through Biomass-Based Diesel, Services, and Corporate and Other segments. The company produces biomass-based diesel from various carbon feedstocks, including distillers corn and used cooking oils, and inedible animal fats, as well as from soybean or canola oils. It is also involved in the purchase and resale of biomass-based diesel, petroleum-based diesel, renewable identification numbers, California Low Carbon Fuel Standard credits, and raw material feedstocks acquired from third parties; and sale of biomass-based diesel produced under toll manufacturing arrangements with third party facilities using its feedstocks. In addition, the company provides day-to-day management and operational services to biomass-based diesel production facilities; and construction management and general contracting services for the construction or upgrade of biomass-based diesel production facilities. Further, it sells petroleum-based heating oils and diesel fuels, as well as operates fermentation facilities. The company owns and operates a network of 13 biorefineries, including eleven biorefineries located in the United States and two biorefineries located in Germany. Renewable Energy Group, Inc. was founded in 1996 and is headquartered in Ames, Iowa.
-75.00%
-55.00%
-35.00%
-15.00%
5.00%
25.00%
45.00%
Apr-09-2019
May-09-2019
Jun-09-2019
Jul-09-2019
Aug-09-2019
Sep-09-2019
Oct-09-2019
Nov-09-2019
Dec-09-2019
Jan-09-2020
Feb-09-2020
Mar-09-2020
REGISTER
XLE S&P

April 11,2020
Energy & Materials Sector 3
The BTC reinstatement and extension
On December 23, 2019, President Trump signed a legislation which included a retroactive reinstatement and extension of the $1 per gallon Biodiesel Tax Credit (BTC) from January 1, 2018 through December 31, 2022. The BTC is a major part of REGI’s business model and historically it has been reinstated and extended multiple times, except it took two years this time around. This meant a cash crunch for REGI in those two years, which did not allow them to allocate capital to new projects, and was building up their accounts payable as well. The reinstatement gives REGI a one-time cash payment of $800 million out of which $300 million are payables and leaves the company with $500 million of excess cash.
71.03%3.72%
25.24%
Revenue by segment
Biomass-based diesel revenue
Seperated RIN sales
Biomass based diesel government incentives

April 11,2020
Energy & Materials Sector 4
Investment Thesis 1: REGI is best positioned to benefit from Biodiesel Tax Credit extension
The HOBO spread or the heating oil/soybean oil spread is how the company can measure its raw material costs. Due to their ability to obtain a multitude of raw materials like distillers corn oil, used cooking oil, inedible animal fat, and canola oil, REGI gets a cost advantage as compared to local competitors, most of which rely on higher cost virgin vegetable oils.
With the BTC reinstatement and extension approved, we expect the biomass-based diesel industry to grow rapidly, with REGI capturing most of this growth due to the cost advantage.
Moreover, REGI has always been a trailblazer in lobbying Congress to pass biodiesel friendly legislations, and strong relations will ensure that most state governments follow this trend which has already been started by California and Oregon of providing further tax credits and various other subsidies.
The above factors should lead to an increase in the downstream demand, and the company has been preparing for that as is evident with their plant developments and future plans mentioned on latest earnings call.
Investment Thesis 2: Making the energy portfolio ESG friendly and decreasing exposure to oil prices
REGI is a company with excellent ESG value, not only due to the nature of their business, but also in the way they operate their supply chains, that completely depend upon 100% biomass-based diesel.
Due to the ability to acquire a variety of feedstocks, and the fact that a lot of their top-line is dependent on various tax credits, the company is not correlated with oil prices which gives the portfolio a much required diversification.

April 11,2020
Energy & Materials Sector 5
As seen above, the carbon reduction required, and as promised by a number of Fortune 500 companies, implies that renewable energy would be a booming industry in the near future, generating demand for renewable fuels in commercial use. This will be met by biodiesel and electricity.
Biomass-based energy would be a great replacement for a lot of that demand, considering 63% of our electricity is still currently fossil-fuel based.
REGI would be the direct beneficiary of the above thesis, which makes the case immensely stronger.
As of 2020, $90 trillion of AUM has been allocated to follow the guidelines of PRI – Principles of responsible investing which seek out high quality ESG companies.
Because the company is not followed by a lot of analysts, MSCI does not have a rating for REGI, but shown below is the SASB materiality map for the biodiesel industry.

April 11,2020
Energy & Materials Sector 6
REGI performs well in most of the factors most material to its industry, including Waste & Wastewater management, Supply chain Management, and Management of the Legal & Regulatory environment. This was reflected in REGI’s performance compared to XLE in the current bear market, a good example of the trend indicating that companies having higher ESG values perform better in a market downturn.
Investment Thesis 3: Biodiesel Tax Credit reinstatement gives REGI the ability to allocate CapEx to new projects and develop their downstream strategy
The last BTC legislation expired in December 2017. Between then and December 23, 2019, when the BTC reinstatement and extension was announced, REGI could not allocate CapEx to new projects. But they were still investing in R&D.
The $800 million one-time BTC payment, $300 million of which is payables, gives the company an excess of $500 million in cash and projects in line to allocate CapEx on.
REGI is highly unlevered with a Debt/Total Capital ratio of 6%, and therefore in a very strong position to allocate the cash effectively.
It has already started developing its downstream business with the company’s first cardlock station in Seneca and plans to build more.

April 11,2020
Energy & Materials Sector 7
The upcoming demand for renewable energy in major US cities as mentioned above creates a huge investment opportunity for REGI in the downstream supply business, for which REGI has plans in action as seen below.

April 11,2020
Energy & Materials Sector 8
Investment Catalysts
1) One-time BTC payment: The payment is to be collected in April and once the COVID-19 lockdown is relaxed, execution of existing plans can begin. This should result in massive growth in revenue in 2021 building on the company’s great performance in the last four quarters. 2) Entry into newer markets with downstream strategy: Their downstream plans allow them to enter an untapped biodiesel market leading to increased revenues in FY2021.
3) ESG trends in investing: With a lot of institutional investing moving towards investing in ESG friendly companies, REGI fits well into that criteria with very high ESG ratings due to their unique supply chain independency.
Investment Risks
1) COVID-19 timeline is extended: The current lockdown is going to affect REGI as demand for energy is currently low, and if the timeline gets extended due to a second wave of cases, it might delay the catalysts significantly.
2) BTC extension attracts competition: The BTC extension till 2022 makes the biomass-based diesel extremely attractive and will result in REGI having increased competition. But, most of REGI’s competitors are local firms that do not have the feedstock access like REGI possesses.
3) BTC does not get extended past 2022: As BTC is a major part of REGI’s business model, a decision to not extend it past 2022 is a big risk for the company, but with their lobbying network and the overall macro shift towards biodiesel, we do not expect that scenario to play out.

April 11,2020
Energy & Materials Sector 9
Industry Overview & Competitive Landscape
In North America, Diesel and Gasoline powertrains are expected to continue dominating the commercial vehicle segment in forecasts through 2025 and beyond.
Due to the overall shift towards renewable energy, due to low carbon impact projections, government requirements, and tax subsidies attained thereby, we expect this industry to have an increased use of biodiesel blends.
Over the last few years, many problems have been reported by people using biodiesel fuel. On closer investigation and speaking to people in the industry, we found that most of these difficulties can be attributed to poor-quality biodiesel fuel and
are almost identical to the problems caused by low-quality petroleum diesel.
These low-quality fuels are mostly produced by unsophisticated local firms as opposed to a nationalized operation as the one conducted by REGI.
The Biodiesel industry consists of a lot of local firms, but nobody operates at a national and international level like REGI does. This gives the company the ability to source feedstocks from all over the world including China where costs are much lower and a competitive moat in terms of the cost advantage that it enjoys over its peers.
Management
Cynthia CJ Warner – President and Chief Executive Officer
For more than 35 years, CJ has held executive positions in the energy sector in operations, business development, strategy, technology development, and environment, health, and safety. She has led operations globally for large refiners including Andeavor and BP as well as scale-up and development efforts in novel renewable energy technologies.
Chad Stone – Chief Financial Officer
In his professional experience, Mr. Stone has served as a director at PricewaterhouseCoopers in Chicago and Cincinnati, focusing primarily in the energy and utilities industry, as well as a manager at Arthur Andersen in the Chicago office.
Mr. Stone holds a Master of Business Administration in finance from the University of Chicago

April 11,2020
Energy & Materials Sector 10
Managements Expertise & Compensation:
The management has proven itself well in the past with the great lobbying efforts to reinstate BTC along with great execution of the business with limited resources in hand in the meanwhile, resulting in better than expected results in 2019. Furthermore, 55% to 75% of each executive officer’s regular annual long-term incentive award opportunity in performance-based restricted stock units tied to the achievement of stock price and return on invested capital hurdles. Insider Activity There has been a lot of insider buying in the month of March, especially after prices dropped due to the COVID-29 sell-off. This is a good sign that the stock is undervalued and management expects similar growth opportunity as the analysts.
8.00
13.00
18.00
23.00
28.00
33.00
Apr-10-2019
May-10-2019
Jun-10-2019
Jul-10-2019
Aug-10-2019
Sep-10-2019
Oct-10-2019
Nov-10-2019
Dec-10-2019
Jan-10-2020
Feb-10-2020
Mar-10-2020

April 11,2020
Energy & Materials Sector 11
Valuation Comparative Company Analysis The comp analysis uses three companies that operate in the subsectors close to REGI’s: Oil and Gas Refining and Marketing, which falls under the Energy sector. All of these companies have extensive experience within the industry with founding dates before 1990. All companies are headquartered in TX, U.S. These companies are majorly involved in downstream oil & gas and only a part of their business uses biomass-based diesel, which is why the weight of the CompCo is 10%.
$MMUS $MMUS
Company Name Ticker Founded Share Price TSO Market Cap Total Debt Cash Net Debt Minority
Interest TEV
Par Pacific Holdings, Inc. NYSE:PARR 1984 $6.70 54 359 1,042 126 916 0 1,275
CVR Energy, Inc. NYSE:CVI 1906 $15.47 101 1,555 1,243 652 591 275 2,421
Delek US Holdings, Inc. NYSE:DK 2001 $16.47 74 1,211 2,273 955 1,318 169 2,697
Average 1,041 1,519 578 942 148 2,131
Min 359 1,042 126 591 0 1,275
Max 1,555 2,273 955 1,318 275 2,697
Median 1,211 1,243 652 916 169 2,421
Renewable Energy Group NASDAQ:REGI 1996 $23.00 40 914 57 552 0 0 914
Net Debt / EBITDA Sales growth 2020E 2021E 2020E 2021E 2020E 2021E 2020E 2021E 2020E 2021E 2020E 2021E 2020E 2021E
5.56x 22.1% 4,117 5,026 165 244 ($0.27) $1.09 - 7.17 0.31x 0.25x 7.74x 5.24x 4% 5%
1.45x 23.2% 4,809 5,925 408 625 $0.43 $2.06 37.71 7.84 0.50x 0.41x 5.93x 3.87x 8% 11%
4.62x 20.5% 7,337 8,841 285 478 ($0.72) $1.51 - 11.04 0.37x 0.31x 9.45x 5.64x 4% 5%
3.88x 21.9% 5,421 6,598 286 449 ($0.19) $1.55 37.71 8.68 0.39x 0.32x 7.71x 4.92x 5.5% 6.9%
1.45x 21% 4,117 5,026 165 244 ($0.72) $1.09 37.71 7.17 0.31x 0.25x 5.93x 3.87x 4% 5%
5.56x 23% 7,337 8,841 408 625 $0.43 $2.06 37.71 11.04 0.50x 0.41x 9.45x 5.64x 8% 11%
4.62x 22% 4,809 5,925 285 478 ($0.27) $1.51 37.71 7.84 0.37x 0.31x 7.74x 5.24x 4% 5%
0.00x 79% 1,564 2,804 41 227 $0.94 $5.44 - 4.23 0.58x 0.33x 22.49x 4.03x 3% 8%
Sales EBITDA EPS (GAAP) P / E TEV / Sales TEV / EBITDA EBITDA Margin

April 11,2020
Energy & Materials Sector 12
Discounted Cash Flow Analysis The DCF analysis uses BCF projections for revenue growth from 2020 to 2024. It shows historical financials of REGI from 2016 to 2019. BTC reinstatement extends from January 1, 2018 through December 31, 2022. Though, the reinstatement is reflected starting from 2019 as accounts receivables, and then as excess cash (impacting NWC) in 2020, as when REGI actually receives the due BTC amount. Historical financials of REGI were analyzed LTM basis to arrive at future estimates, in addition to using company guidance and reported earnings for 4Q2019 (Fiscal year ends in December). Please see a summary of each of the assumptions below:
2016A 2017A 2018A 2019A 2020E 2021E 2022E 2023E 2024ETotal Revenue $2,039,067.00 $2,153,537.00 $2,380,701.00 $2,639,753.00 $1,564,194.80 $2,803,756.44 $3,364,507.73 $3,700,958.50 $4,071,054.35% growth 5.61% 10.55% 10.88% -40.74% 79.25% 20.00% 10.00% 10.00%
Biomass-based diesel $1,417,595 $1,787,308 $1,875,316 $1,875,076 $1,125,046 $2,025,082 $2,430,098 $2,673,108 $2,940,419Base $1,417,595 $1,787,308 $1,875,316 $1,875,076 $1,125,046 $2,025,082 $2,430,098 $2,673,108 $2,940,419Bear $1,417,595 $1,787,308 $1,875,316 $1,875,076 $937,538 $1,500,061 $1,650,067 $1,732,570 $1,819,199Bull $1,417,595 $1,787,308 $1,875,316 $1,875,076 $1,312,553 $2,625,106 $3,412,638 $3,924,534 $4,513,214
% growthBase 26.08% 4.92% -0.01% -40.00% 80.00% 20.00% 10.00% 10.00%Bear 26.08% 4.92% -0.01% -50.00% 60.00% 10.00% 5.00% 5.00%Bull 26.08% 4.92% -0.01% -30.00% 100.00% 30.00% 15.00% 15.00%
Seperated RIN sales $274,800 $337,501 $137,895 $98,285 $39,314 $58,971 $70,765 $77,842 $85,626Base $274,800 $337,501 $137,895 $98,285 $39,314 $58,971 $70,765 $77,842 $85,626Bear $274,800 $337,501 $137,895 $98,285 $29,486 $41,280 $45,408 $47,678 $50,062Bull $274,800 $337,501 $137,895 $98,285 $49,143 $78,628 $102,216 $117,549 $135,181
%growthBase 22.82% -59.14% -28.72% -60.00% 50.00% 20.00% 10.00% 10.00%Bear 22.82% -59.14% -28.72% -70.00% 40.00% 10.00% 5.00% 5.00%Bull 22.82% -59.14% -28.72% -50.00% 60.00% 30.00% 15.00% 15.00%
Biomass based diesel government incentives$346,672 $28,728 $367,490 $666,392 $399,835 $719,703 $863,644 $950,008 $1,045,009Base $346,672 $28,728 $367,490 $666,392 $399,835 $719,703 $863,644 $950,008 $1,045,009Bear $346,672 $28,728 $367,490 $666,392 $333,196 $533,114 $586,425 $615,746 $646,534Bull $346,672 $28,728 $367,490 $666,392 $466,474 $932,949 $1,212,833 $1,394,758 $1,603,972
%growthBase -91.71% 1179.20% 81.34% -40.00% 80.00% 20.00% 10.00% 10.00%Bear -91.71% 1179.20% 81.34% -50.00% 60.00% 10.00% 5.00% 5.00%Bull -91.71% 1179.20% 81.34% -30.00% 100.00% 30.00% 15.00% 15.00%
We expect revenues to go down by 40% in 2020 due to COVID-19. Post that, expect them to continue growing like it would have without the pandemic as we expect demand to go back to normal levels.

April 11,2020
Energy & Materials Sector 13
COGS: Modelled the COGS flat by the normalized historical number.
SG&A: Expect them to stay the same in 2020 as COVID-19 would not impact SG&A, hence a higher percentage.
Other expenses: Includes interest expense as it is currently marginal. Already restructured in a way that the first maturity is not before 2036.
Tax rate: company guidance
2016A 2017A 2018A 2019A 2020E 2021E 2022E 2023E 2024EIncome Statement
Revenue Base 2,039,067 2,153,537 2,380,701 2,639,753 1,564,195 2,803,756 3,364,508 3,700,959 4,071,054Base 2,039,067 2,153,537 2,380,701 2,639,753 1,564,195 2,803,756 3,364,508 3,700,959 4,071,054Bear 2,039,067 2,153,537 2,380,701 2,639,753 1,564,195 2,803,756 3,364,508 3,700,959 4,071,054Bull 2,039,067 2,153,537 2,380,701 2,639,753 1,564,195 2,803,756 3,364,508 3,700,959 4,071,054
COGS Base 1,867,847 2,070,301 1,962,996 2,111,324 1,360,849 2,439,268 2,927,122 3,219,834 3,541,817Base 1,867,847 2,070,301 1,962,996 2,111,324 1,360,849 2,439,268 2,927,122 3,219,834 3,541,817Bear 1,867,847 2,070,301 1,962,996 2,111,324 1,360,849 2,439,268 2,927,122 3,219,834 3,541,817Bull 1,867,847 2,070,301 1,962,996 2,111,324 1,360,849 2,439,268 2,927,122 3,219,834 3,541,817
COGS % Sales Base 91.6% 96.1% 82.5% 80.0% 87.0% 87.0% 87.0% 87.0% 87.0%Base 91.6% 96.1% 82.5% 80.0% 87.0% 87.0% 87.0% 87.0% 87.0%Bear 91.6% 96.1% 82.5% 80.0% 87.0% 87.0% 87.0% 87.0% 87.0%Bull 91.6% 96.1% 82.5% 80.0% 87.0% 87.0% 87.0% 87.0% 87.0%
SG&A Base 88,285 95,843 106,739 118,209 156,419 126,169 151,403 166,543 183,197Base 88,285 95,843 106,739 118,209 156,419 126,169 151,403 166,543 183,197Bear 88,285 95,843 106,739 118,209 156,419 128,973 154,767 170,244 187,269Bull 88,285 95,843 106,739 118,209 156,419 123,365 148,038 162,842 179,126
SG&A % Sales Base 4.3% 4.5% 4.5% 4.5% 10.0% 4.5% 4.5% 4.5% 4.5%Base 4.3% 4.5% 4.5% 4.5% 10.0% 4.5% 4.5% 4.5% 4.5%Bear 4.3% 4.5% 4.5% 4.5% 10.0% 4.6% 4.6% 4.6% 4.6%Bull 4.3% 4.5% 4.5% 4.5% 10.0% 4.4% 4.4% 4.4% 4.4%
Amortization of Intangibles Base (357) 888 183 1,632 1,682 1,688 1,681 1,688 1,695Base (357) 888 183 1,632 1,682 1,688 1,681 1,688 1,695Bear (357) 888 183 1,632 1,682 1,688 1,681 1,688 1,695Bull (357) 888 183 1,632 1,682 1,688 1,681 1,688 1,695
Amortization % Sales Base (0.0%) 0.0% 0.0% 0.1% 0.1% 0.1% 0.0% 0.0% 0.0%Base (0.0%) 0.0% 0.0% 0.1% 0.1% 0.1% 0.0% 0.0% 0.0%Bear (0.0%) 0.0% 0.0% 0.1% 0.1% 0.1% 0.0% 0.0% 0.0%Bull (0.0%) 0.0% 0.0% 0.1% 0.1% 0.1% 0.0% 0.0% 0.0%
Depreciation Base 31,825 34,283 36,324 36,298 46,926 50,468 50,468 55,514 56,995Base 31,825 34,283 36,324 36,298 46,926 50,468 50,468 55,514 56,995Bear 31,825 34,283 36,324 36,298 46,926 50,468 50,468 55,514 56,995Bull 31,825 34,283 36,324 36,298 46,926 50,468 50,468 55,514 56,995
Depreciation % Sales Base 1.6% 1.6% 1.5% 1.4% 3.0% 1.8% 1.5% 1.5% 1.4%Base 1.6% 1.6% 1.5% 1.4% 3.0% 1.8% 1.5% 1.5% 1.4%Bear 1.6% 1.6% 1.5% 1.4% 3.0% 1.8% 1.5% 1.5% 1.4%Bull 1.6% 1.6% 1.5% 1.4% 3.0% 1.8% 1.5% 1.5% 1.4%
D&A Base 31,468 35,171 36,507 37,930 48,608 52,156 52,149 57,202 58,690% Sales 1.5% 1.6% 1.5% 1.4% 3.1% 1.9% 1.5% 1.5% 1.4%Other Expenses Base (7,792) 35,407 2,874 10,491 6,257 11,215 13,458 14,804 16,284
Base (7,792) 35,407 2,874 10,491 6,257 11,215 13,458 14,804 16,284Bear (7,792) 35,407 2,874 10,491 6,257 11,215 13,458 14,804 16,284Bull (7,792) 35,407 2,874 10,491 6,257 11,215 13,458 14,804 16,284
Other Expenses % Sales Base (0.4%) 1.6% 0.1% 0.4% 0.4% 0.4% 0.4% 0.4% 0.4%Base (0.4%) 1.6% 0.1% 0.4% 0.4% 0.4% 0.4% 0.4% 0.4%Bear (0.4%) 1.6% 0.1% 0.4% 0.4% 0.4% 0.4% 0.4% 0.4%Bull (0.4%) 1.6% 0.1% 0.4% 0.4% 0.4% 0.4% 0.4% 0.4%
Tax Rate Base 8.7% 27.8% 2.0% 0.2% 4.0% 4.0% 4.0% 4.0% 4.0%Base 8.7% 27.8% 2.0% 0.2% 4.0% 4.0% 4.0% 4.0% 4.0%Bear 8.7% 27.8% 2.0% 0.2% 4.0% 4.0% 4.0% 4.0% 4.0%Bull 8.7% 27.8% 2.0% 0.2% 4.0% 4.0% 4.0% 4.0% 4.0%

April 11,2020
Energy & Materials Sector 14
Capex: 2020 company guidance was $60 million but since earnings call was before COVID-19 impact in the US, we expect that to be corrected and have modelled a base case of $40 million.
Balance Sheet 2016A 2017A 2018A 2019A 2020P 2021P 2022P 2023P 2024P
Δ NWC Base (52,020) (140,322) 554,042 (480,182) 90,030 40,727 24,436 26,880
NWC Base 232,090 180,070 39,748 593,790 113,608 203,637 244,365 268,801 295,681
AR Base 164,949 90,648 74,551 858,922 214,273 384,076 460,891 506,981 557,679Base 164,949 90,648 74,551 858,922 214,273 384,076 460,891 506,981 557,679Bear 164,949 90,648 74,551 858,922 257,128 460,891 553,070 608,377 669,214Bull 164,949 90,648 74,551 858,922 171,419 307,261 368,713 405,584 446,143
AR Days Base 30 15 11 119 50 50 50 50 50% Sales Base 30 15 11 119 50 50 50 50 50
Bear 60 60 60 60 60Bull 40 40 40 40 40
Inventories Base 145,408 135,547 168,900 161,429 104,394 187,122 224,546 247,001 271,701Base 145,408 135,547 168,900 161,429 104,394 187,122 224,546 247,001 271,701Bear 145,408 135,547 168,900 161,429 104,394 187,122 224,546 247,001 271,701Bull 145,408 135,547 168,900 161,429 104,394 187,122 224,546 247,001 271,701
Inventory Days Base 28 24 31 28 28 28 28 28 28% COGS Base 28 24 31 28 28 28 28 28 28
Bear 28 28 28 28 28Bull 28 28 28 28 28
AP Base 194,461 232,554 236,635 335,498 205,060 367,561 441,073 485,180 533,698Base 194,461 232,554 236,635 335,498 205,060 367,561 441,073 485,180 533,698Bear 194,461 232,554 236,635 335,498 205,060 367,561 441,073 485,180 533,698Bull 194,461 232,554 236,635 335,498 205,060 367,561 441,073 485,180 533,698
AP Days Base 38 41 44 58 55 55 55 55 55% COGS Base 38 41 44 58 55 55 55 55 55
Bear 55 55 55 55 55Bull 55 55 55 55 55
Cash Flow Statement 2016A 2017A 2018A 2019A 2020P 2021P 2022P 2023P 2024P
Capex Base 60,384 67,557 46,453 42,518 40,000 112,150 168,225 185,048 203,553Base 60,384 67,557 46,453 42,518 40,000 112,150 168,225 185,048 203,553Bear 60,384 67,557 46,453 42,518 35,000 56,075 134,580 148,038 162,842Bull 60,384 67,557 46,453 42,518 60,000 168,225 201,870 222,058 244,263
Capex % Sales Base 3.0% 3.1% 2.0% 1.6% 2.6% 4.0% 5.0% 5.0% 5.0%Base 3.0% 3.1% 2.0% 1.6% 2.6% 4.0% 5.0% 5.0% 5.0%Bear 3.0% 3.1% 2.0% 1.6% 2.2% 2.0% 4.0% 4.0% 4.0%Bull 3.0% 3.1% 2.0% 1.6% 3.8% 6.0% 6.0% 6.0% 6.0%

April 11,2020
Energy & Materials Sector 15
A base, bear, and bull case were analyzed by changing revenue, COGS, and SG&A expectations. Two exit methods were used to derive at an equality weighted average price: PGR and EV/EBITDA. A PGR rate of 1.5% was applied to REGI, as is industry standard. An EBITDA exit multiple of 5.3x was used, based on recent acquisitions in the industry leading to an implied 2021 EV/EBITDA of 8.25x. Lack of competitors in this particular sub sector makes it difficult to have an accurate industry estimate for comparative analysis. These methods lead to a DCF target price of $57, representing a 148% upside. See the output of the Base Case below and refer to the appendix for the Bear and Bull case.
WACC Calculation Assumption Notes Low Base High Market Risk Premium (MRP) Bloomberg 7.5% 7.5% 7.5%
Risk Free Rate (Rf) Spot rate 10-year Treasury 0.5% 0.5% 0.5%
Beta Bloomberg 0.98 0.98 0.98
Sensitivity Adjustment + / - 1.0% from Base (1.0%) - 1.0%
Cost of Equity (KE) Calculated using CAPM model 6.9% 7.9% 8.9%
Pre-tax Cost of Debt Wtd. Average Interest Rate 4.0% 4.0% 4.0%
Effective Tax Rate Guidance 1.0% 3.0% 5.0%
Post-tax Cost of Debt After-Tax Cost of Debt 4.0% 3.9% 3.8%
Debt / Total Cap Based on Current Trading Data 5.8% 5.8% 5.8%
WACC KE*E/(D+E)+KD*(1-t)*D(D/E) 6.7% 7.6% 8.5%
WACC: Calculated using the CAPM method. Calculated using the 5Y Bloomberg Beta of 0.98.
Target Price Calculation
Price % Weight
DCF (EV/EBITDA) $60 50%
DCF (PGR) $55 50%
Target Price $57
Current Share Price $23.00
Upside 148%

April 11,2020
Energy & Materials Sector 16
Base Case:
2016A 2017A 2018A 2019A 2020E 2021E 2022E 2023E 2024ERevenue 2,039,067 2,153,537 2,380,701 2,639,753 1,564,195 2,803,756 3,364,508 3,700,959 4,071,054
% Growth 5.6% 10.5% 10.9% -40.7% 79.2% 20.0% 10.0% 10.0%COGS 1,867,847 2,070,301 1,962,996 2,111,324 1,360,849 2,439,268 2,927,122 3,219,834 3,541,817
Gross Margin 8.4% 3.9% 17.5% 20.0% 13.0% 13.0% 13.0% 13.0% 13.0%SG&A 88,285 95,843 106,739 118,209 156,419 126,169 151,403 166,543 183,197Amortization of Intangibles (357) 888 183 1,632 1,682 1,688 1,681 1,688 1,695Other Expense + Interest Expense (7,792) 35,407 2,874 10,491 6,257 11,215 13,458 14,804 16,284EBIT 91,084 (48,902) 307,909 398,097 (7,939) 174,949 220,377 242,575 271,066
% Sales 4.5% (2.3%) 12.9% 15.1% (0.5%) 6.2% 6.6% 6.6% 6.7%Add: D&A 31,468 35,171 36,507 37,930 48,608 52,156 52,149 57,202 58,690Adj. EBITDA 122,552 (13,731) 344,416 436,027 40,669 227,104 272,525 299,778 329,755
% Sales 6.0% (0.6%) 14.5% 16.5% 2.6% 8.1% 8.1% 8.1% 8.1%Tax Rate 8.7% 27.8% 2.0% 0.2% 4.0% 4.0% 4.0% 4.0% 4.0%NOPAT 83,160 (35,307) 301,751 397,301 (7,621) 167,951 211,561 232,872 260,223Plus: D&A 31,468 35,171 36,507 37,930 48,608 52,156 52,149 57,202 58,690Less: Capex 60,384 67,557 46,453 42,518 40,000 112,150 168,225 185,048 203,553Less: ΔNWC (52,020) (140,322) 554,042 (480,182) 90,030 40,727 24,436 26,880Unlevered FCF 54,244 (15,673) 432,127 (161,329) 481,169 17,927 54,757 80,590 88,480
% of Sales 30.8% 0.6% 1.6% 2.2% 2.2%
Discount Period 0.75 1.75 2.75 3.75 4.75Discount Factor 0.95 0.88 0.82 0.76 0.71PV of FCF 455,409 15,767 44,753 61,207 62,446
Actual Company Reported BCF Projections
Perpetuity Growth Method
Cumulative PV of FCF 639,583
Terminal FCF 88,480
PGR 1.5%
Terminal Value 1,469,346
PV of Terminal Value 1,037,015
Enterprise Value 1,676,597
Less: Total Debt 56,543
Less: Preferred Stock 0
Less: Noncontrolling Interest 0
Plus: Cash and Cash Equivalents 552,000
Implied Equity Value 2,172,054
Shares Outstanding 39,760
Implied Share Price $55
Current Price $23.00
Upside 137.5%
Exit Multiple Method (EV/EBITDA)
Cumulative PV of FCF 639,583
Terminal Year EBITDA 329,755
Exit Multiple 5.3
Terminal Value 1,747,704
Discount factor 0.71
PV of TV 1,233,470
Enterprise Value 1,873,053
Less: Total Debt 56,543
Less: Preferred Stock 0
Less: Noncontrolling Interest 0
Plus: Cash and Cash Equivalents 552,000
Implied Equity Value 2,368,510
Shares Outstanding 39,760
Implied Share Price $60
Current Price $23.00
Upside 159.0%
EBITDA 2020 227,104
Implied EV/EBITDA 2021 8.25x

April 11,2020
Energy & Materials Sector 17
Sensitivity Analysis Sensitizing PGR and WACC
Sensitizing exit EV / EBITDA and WACC
Sensitivity Tables
$57.10 0.50% 0.75% 1.00% 1.25% 1.50%
6.6% $59 $59 $60 $61 $61
6.9% $57 $58 $59 $59 $60
7.2% $56 $57 $57 $58 $59
7.5% $55 $56 $56 $57 $58
7.8% $55 $55 $55 $56 $56
Perpetual Growth Rate
WA
CC
$57.10 4.3x 4.8x 5.3x 5.8x 6.3x
6.6% $58 $60 $61 $63 $64
6.9% $57 $58 $60 $61 $63
7.2% $56 $57 $59 $60 $62
7.5% $55 $56 $58 $59 $60
7.8% $54 $55 $56 $58 $59
WA
CC
EV / EBITDA

April 11,2020
Energy & Materials Sector 18
Football Field
This football field shows a summary of our valuation.
52-Week Trading
DCF PGR low - high 1% - 2%
DCF WACC low - high 6.4% - 8%
DCF Bear - Bull
CompCo Bear - Bull $37
$50
$54
$56
$58
$64
$61
$58
$32
$10 $20 $30 $40 $50 $60
Current Price$23
Price Target$56
April 11,2020
Energy & Materials Sector 19
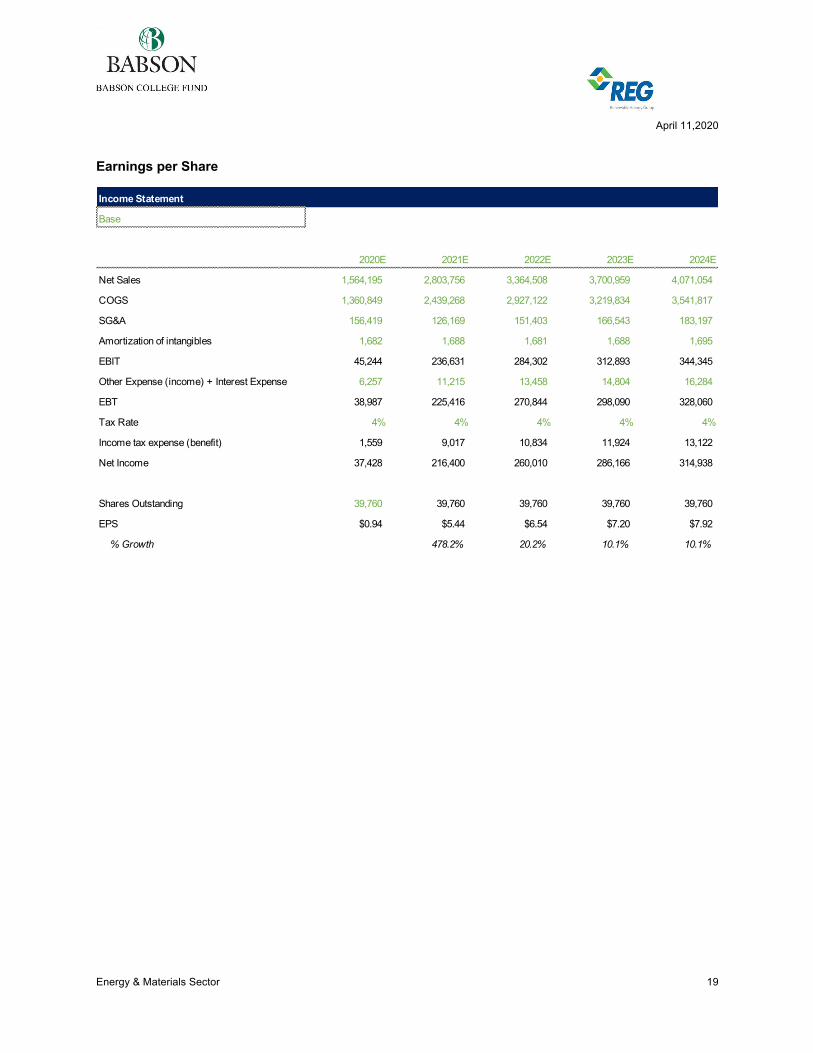
Earnings per Share
Income Statement
Base
2020E 2021E 2022E 2023E 2024E
Net Sales 1,564,195 2,803,756 3,364,508 3,700,959 4,071,054
COGS 1,360,849 2,439,268 2,927,122 3,219,834 3,541,817
SG&A 156,419 126,169 151,403 166,543 183,197
Amortization of intangibles 1,682 1,688 1,681 1,688 1,695
EBIT 45,244 236,631 284,302 312,893 344,345
Other Expense (income) + Interest Expense 6,257 11,215 13,458 14,804 16,284
EBT 38,987 225,416 270,844 298,090 328,060
Tax Rate 4% 4% 4% 4% 4%
Income tax expense (benefit) 1,559 9,017 10,834 11,924 13,122
Net Income 37,428 216,400 260,010 286,166 314,938
Shares Outstanding 39,760 39,760 39,760 39,760 39,760
EPS $0.94 $5.44 $6.54 $7.20 $7.92
% Growth 478.2% 20.2% 10.1% 10.1%

April 11,2020
Energy & Materials Sector 20
BCF versus Consensus
BCF projections vs. Consensus Base
2020E 2021E 2020E 2021E
Revenue 1,564,195 2,803,756 2,145 2,465 No COVID-19 impact in consensus% Growth 79.2% 14.9%
COGS 1,360,849 2,439,268 1,827 2,076
% Sales 87.0% 87.0% 85.2% 84.2%
SG&A Expense 156,419 126,169 111 117
% Sales 10.0% 4.5% 5.2% 4.8%
EBITDA 40,669 227,104 206 258
% Sales 2.6% 8.1% 9.6% 10.5%
D&A 48,608 52,156 37 43
% Sales 3.1% 1.9% 1.7% 1.8%
EBIT (7,939) 174,949 204 267
% Sales -0.5% 6.2% 9.5% 10.8%
Tax Rate 4% 4% 3% 3%
Net Income 37,428 216,400 205 273
% Sales 2.4% 7.7% 9.5% 11.1%
EPS $0.94 $5.44 $4.80 $6.38
BCF Consensus (Mean)

April 11,2020
Energy & Materials Sector 21
Appendix Bear Case:
2016A 2017A 2018A 2019A 2020E 2021E 2022E 2023E 2024ERevenue 2,039,067 2,153,537 2,380,701 2,639,753 1,300,220 2,074,454 2,281,900 2,395,994 2,515,794
% Growth 5.6% 10.5% 10.9% -50.7% 59.5% 10.0% 5.0% 5.0%
COGS 1,867,847 2,070,301 1,962,996 2,111,324 1,131,191 1,804,775 1,985,253 2,084,515 2,188,741
Gross Margin 8.4% 3.9% 17.5% 20.0% 13.0% 13.0% 13.0% 13.0% 13.0%
SG&A 88,285 95,843 106,739 118,209 130,022 95,425 104,967 110,216 115,727
Amortization of Intangibles (357) 888 183 1,632 1,682 1,688 1,681 1,688 1,695
Other Expense + Interest Expense (7,792) 35,407 2,874 10,491 5,201 8,298 9,128 9,584 10,063
EBIT 91,084 (48,902) 307,909 398,097 (6,883) 126,928 146,642 154,052 164,347
% Sales 4.5% (2.3%) 12.9% 15.1% (0.5%) 6.1% 6.4% 6.4% 6.5%
Add: D&A 31,468 35,171 36,507 37,930 40,689 39,028 35,909 37,628 36,916
Adj. EBITDA 122,552 (13,731) 344,416 436,027 33,806 165,956 182,552 191,680 201,264
% Sales 6.0% (0.6%) 14.5% 16.5% 2.6% 8.0% 8.0% 8.0% 8.0%
Tax Rate 8.7% 27.8% 2.0% 0.2% 4.0% 4.0% 4.0% 4.0% 4.0%
NOPAT 83,160 (35,307) 301,751 397,301 (6,608) 121,851 140,777 147,890 157,774
Plus: D&A 31,468 35,171 36,507 37,930 40,689 39,028 35,909 37,628 36,916
Less: Capex 60,384 67,557 46,453 42,518 35,000 41,489 91,276 95,840 100,632
Less: ΔNWC (52,020) (140,322) 554,042 (463,732) 77,445 20,750 11,413 11,983
Unlevered FCF 54,244 (15,673) 432,127 (161,329) 462,813 41,945 64,660 78,265 82,075% of Sales 35.6% 2.0% 2.8% 3.3% 3.3%
Discount Period 0.75 1.75 2.75 3.75 4.75Discount Factor 0.95 0.88 0.82 0.76 0.71PV of FCF 438,037 36,892 52,847 59,441 57,925
Actual Company Reported BCF Projections
Perpetuity Growth Method
Cumulative PV of FCF 645,142
Terminal FCF 82,075
PGR 1.5%
Terminal Value 1,362,976
PV of Terminal Value 961,942
Enterprise Value 1,607,084
Less: Total Debt 56,543
Less: Preferred Stock 0
Less: Noncontrolling Interest 0
Plus: Cash and Cash Equivalents 552,000
Implied Equity Value 2,102,541
Shares Outstanding 39,760
Implied Share Price $53
Current Price $23.00
Upside 129.9%
Exit Multiple Method (EV/EBITDA)
Cumulative PV of FCF 645,142
Terminal Year EBITDA 201,264
Exit Multiple 5.3
Terminal Value 1,066,697
Discount factor 0.71
PV of TV 752,838
Enterprise Value 1,397,980
Less: Total Debt 56,543
Less: Preferred Stock 0
Less: Noncontrolling Interest 0
Plus: Cash and Cash Equivalents 552,000
Implied Equity Value 1,893,437
Shares Outstanding 39,760
Implied Share Price $48
Current Price $23.00
Upside 107.1%
EBITDA 2020 33,806
Implied EV/EBITDA 2020 41.35338022
Target Price Calculation
Price % Weight
DCF (EV/EBITDA) $48 50%
DCF (PGR) $53 50%
Target Price $50
Current Share Price $23.00
Upside 118%

April 11,2020
Energy & Materials Sector 22
Bull Case:
2016A 2017A 2018A 2019A 2020E 2021E 2022E 2023E 2024ERevenue 2,039,067 2,153,537 2,380,701 2,639,753 1,828,170 3,636,683 4,727,688 5,436,841 6,252,368
% Growth 5.6% 10.5% 10.9% -30.7% 98.9% 30.0% 15.0% 15.0%
COGS 1,867,847 2,070,301 1,962,996 2,111,324 1,590,508 3,163,914 4,113,089 4,730,052 5,439,560
Gross Margin 8.4% 3.9% 17.5% 20.0% 13.0% 13.0% 13.0% 13.0% 13.0%
SG&A 88,285 95,843 106,739 118,209 182,817 160,014 208,018 239,221 275,104
Amortization of Intangibles (357) 888 183 1,632 1,682 1,688 1,681 1,688 1,695
Other Expense + Interest Expense (7,792) 35,407 2,874 10,491 7,313 14,547 18,911 21,747 25,009
EBIT 91,084 (48,902) 307,909 398,097 (8,995) 231,060 315,074 362,580 423,466
% Sales 4.5% (2.3%) 12.9% 15.1% (0.5%) 6.4% 6.7% 6.7% 6.8%
Add: D&A 31,468 35,171 36,507 37,930 56,527 67,148 72,596 83,241 89,228
Adj. EBITDA 122,552 (13,731) 344,416 436,027 47,532 298,208 387,670 445,821 512,694
% Sales 6.0% (0.6%) 14.5% 16.5% 2.6% 8.2% 8.2% 8.2% 8.2%
Tax Rate 8.7% 27.8% 2.0% 0.2% 4.0% 4.0% 4.0% 4.0% 4.0%
NOPAT 83,160 (35,307) 301,751 397,301 (8,635) 221,817 302,471 348,077 406,527
Plus: D&A 31,468 35,171 36,507 37,930 56,527 67,148 72,596 83,241 89,228
Less: Capex 60,384 67,557 46,453 42,518 60,000 218,201 283,661 326,210 375,142
Less: ΔNWC (52,020) (140,322) 554,042 (511,097) 81,804 49,349 32,077 36,889
Unlevered FCF 54,244 (15,673) 432,127 (161,329) 498,989 (11,040) 42,057 73,030 83,725% of Sales 27.3% (0.3%) 0.9% 1.3% 1.3%
Discount Period 0.75 1.75 2.75 3.75 4.75Discount Factor 0.95 0.88 0.82 0.76 0.71PV of FCF 472,275 (9,710) 34,373 55,466 59,090
Actual Company Reported BCF Projections
Exit Multiple Method (EV/EBITDA)
Cumulative PV of FCF 611,495
Terminal Year EBITDA 512,694
Exit Multiple 5.3
Terminal Value 2,717,279
Discount factor 0.71
PV of TV 1,917,763
Enterprise Value 2,529,258
Less: Total Debt 56,543
Less: Preferred Stock 0
Less: Noncontrolling Interest 0
Plus: Cash and Cash Equivalents 552,000
Implied Equity Value 3,024,715
Shares Outstanding 39,760
Implied Share Price $76
Current Price $23.00
Upside 230.8%
EBITDA 2020 47,532
Implied EV/EBITDA 2020 53.21121363
Perpetuity Growth Method
Cumulative PV of FCF 611,495
Terminal FCF 83,725
PGR 1.5%
Terminal Value 1,390,381
PV of Terminal Value 981,283
Enterprise Value 1,592,778
Less: Total Debt 56,543
Less: Preferred Stock 0
Less: Noncontrolling Interest 0
Plus: Cash and Cash Equivalents 552,000
Implied Equity Value 2,088,235
Shares Outstanding 39,760
Implied Share Price $53
Current Price $23.00
Upside 128.4%
Target Price Calculation
Price % Weight
DCF (EV/EBITDA) $76 50%
DCF (PGR) $53 50%
Target Price $64
Current Share Price $23.00
Upside 180%
April 11,2020
Energy & Materials Sector 23
Disclosures Babson College Fund The Babson College Fund (BCF) is an academic program in which selected students manage a portion of the Babson College endowment. The program seeks to provide a rich educational experience through the development of investment research skills and the acquisition of equity analysis and portfolio management experience. Please visit http://cutler.babson.edu for more information. Definition of Ratings BUY: Expected to outperform the S&P 500 producing above average returns. HOLD: Expected to perform in line with the S&P 500 producing average returns. SELL: Expected to underperform the S&P 500 producing below average returns.
References
FactSet Capital IQ Thomson/Reuters Eikon Bloomberg Company reported financials / reports / earnings calls Company Investor Relations Materials Various Analyst reports
Analyst
Paurav Barot [email protected] Eduardo Coser [email protected] Isabelle Tabak [email protected]