reference 11 - university of...
TRANSCRIPT

COMPUSTAT Chapter 11 – Reference 2/2000
i
Reference
11
Reference i
In this chapter… 1
COMPUSTAT Data Item List 2 Annual Data Items 2 Quarterly Data Items 17 Business Information File Data Items 23 Prices, Dividends, and Earnings (PDE) Data Items and Company Descriptors 25
Annual Footnotes (by Number) 26 Record 1 of IBM 360/370 General File Format Records 1 through 4 of Character ASCII File Format 26 Record 2 of IBM 360/370 General File Format Records 5 through 8 of Character ASCII File Format 34
Quarterly Footnotes (by Number) 36
Quarterly Period Footnotes (by Number) 41
COMPUSTAT Business Information File Footnotes (by Number) 42
COMPUSTAT Prices, Dividends, and Earnings (PDE) Footnotes (by Number) 44
Industry and Economic Sectors 45
Global Industry Classification Standard Codes 49


COMPUSTAT Chapter 11 – Reference 1 2/2000
In this chapter…
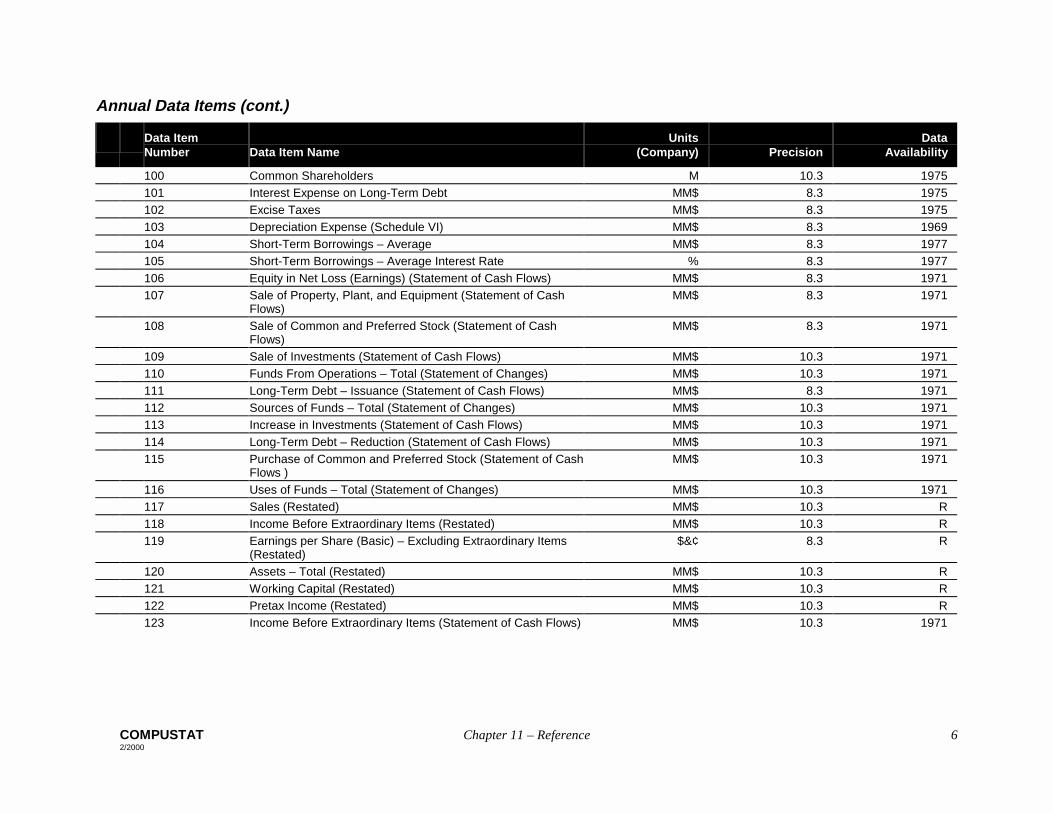
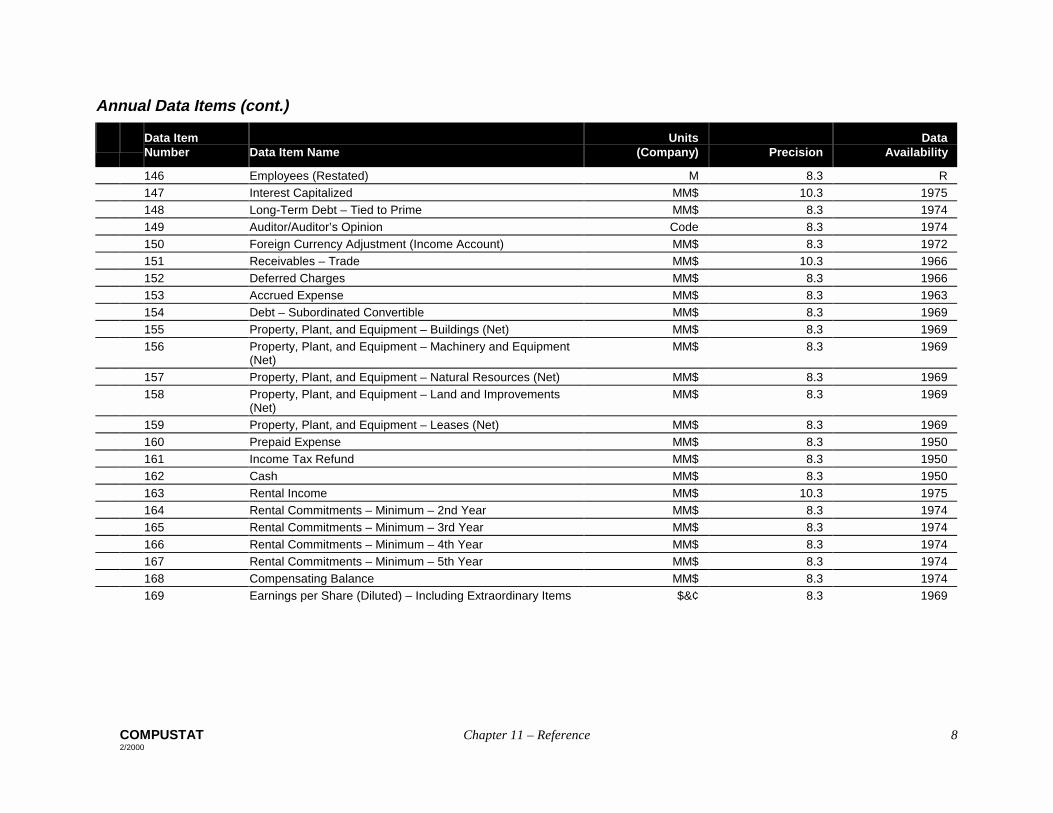
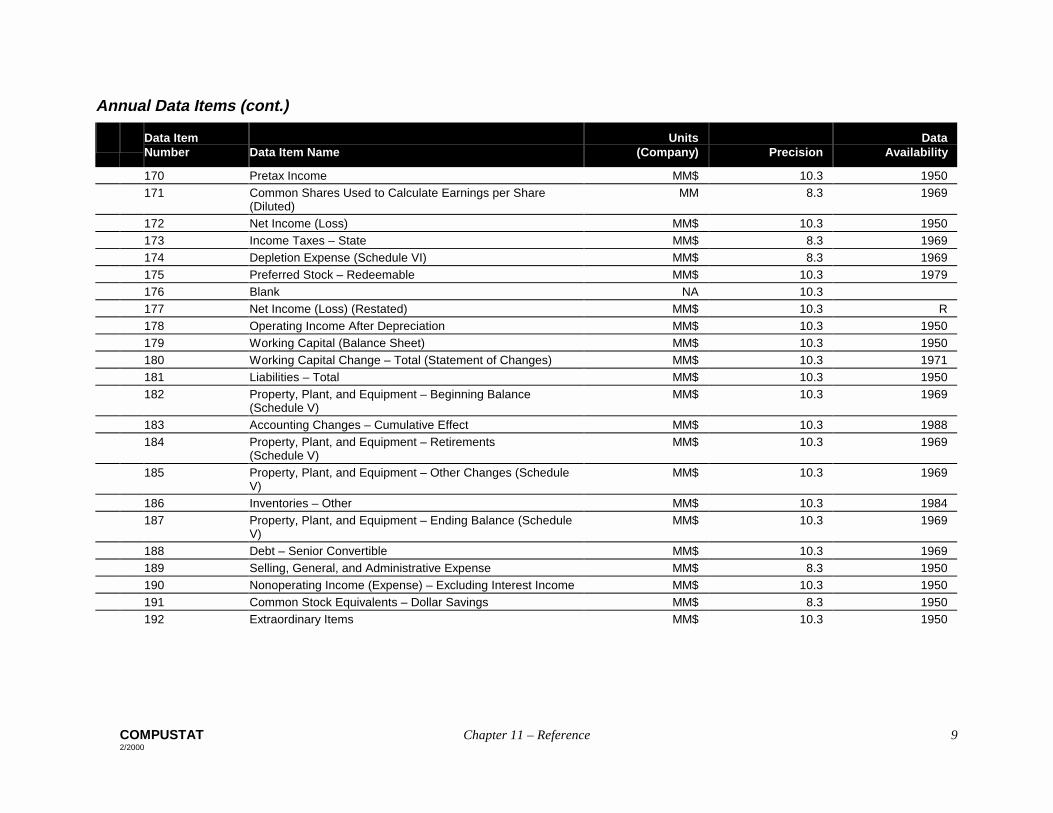
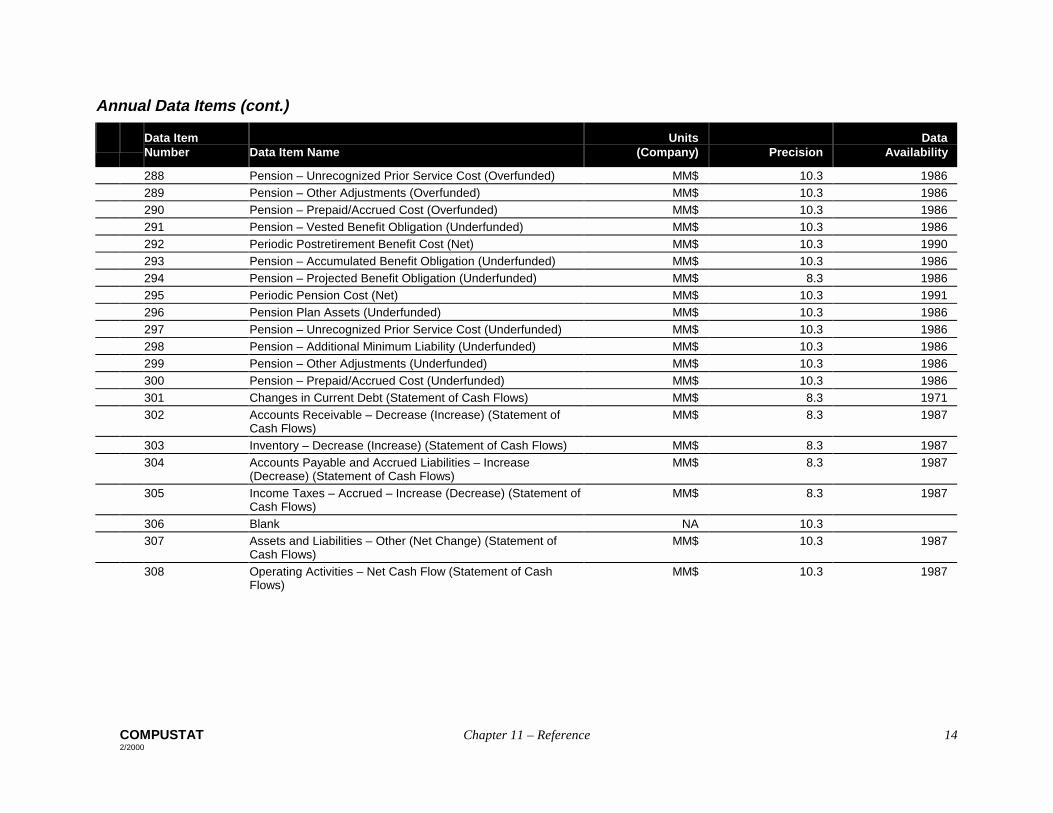
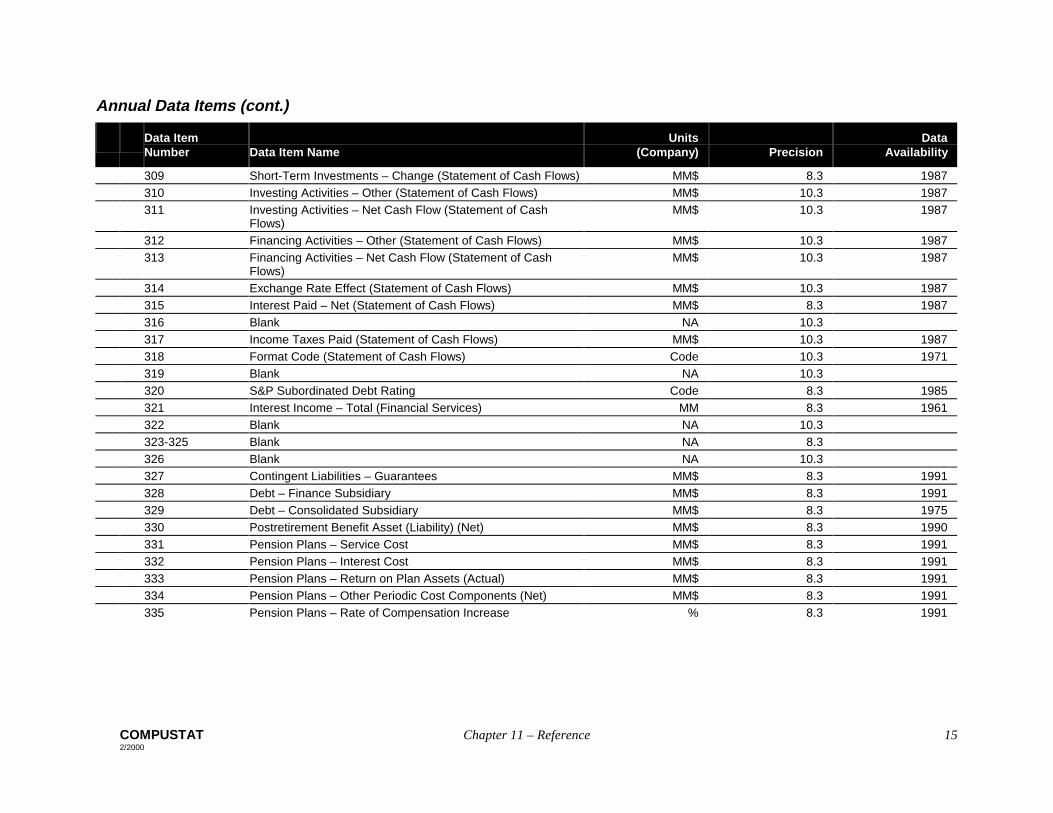
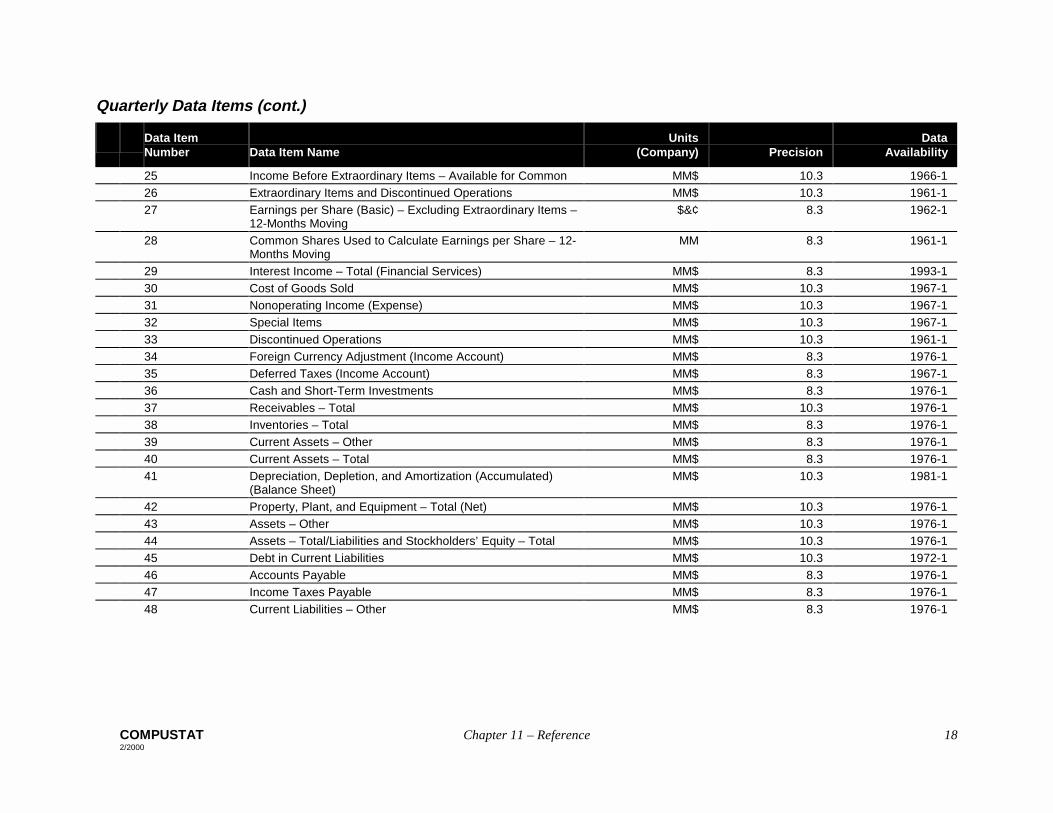
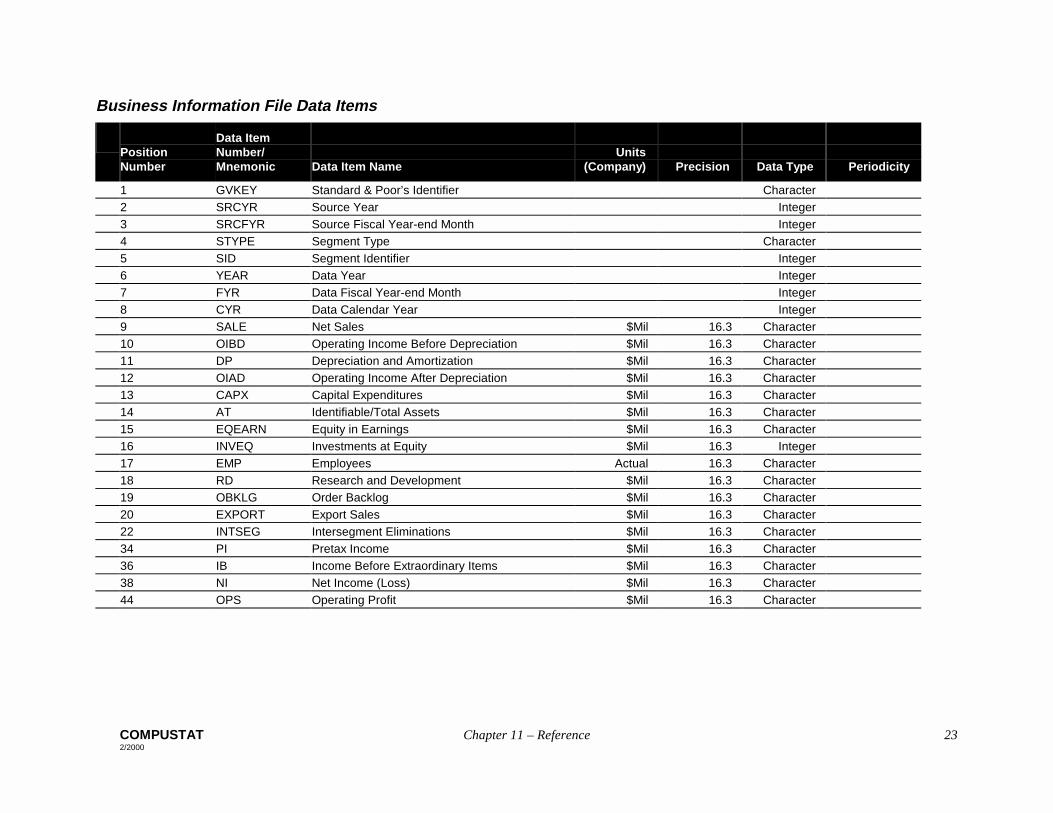
The following is a list of the data items on the COMPUSTAT Industrial database as they appear on COMPUSTAT files for individual company records. This list includes units of representation for each data item, as well as its precision on the Character ASCII files.
The last column shows the first year or quarter of availability for each data item. Time period for data availability for a company is dependent upon when that company was added to the database and/or when the data item was first added to the database. The Annual file provides the most current 20 years of data. The Quarterly file provides the most current 48 quarters and the Business Information files provide the most current 7 years of data. The first year of availability for restated items is not presented as restatements are variable and affect back years on file.
Character ASCII precision excludes decimals in the data fields. All decimals in Character ASCII precision are implied by the designated field specifications. (See the Data Definitions chapter of the User’s Guide for an explanation of each data item. The definitions are organized alphabetically by data item name.)
Units Key:
M Thousands MM Millions MM$ Millions of Dollars $&¢ Dollars and cents NA Not Available R Restated

COMPUSTAT Chapter 11 – Reference 2 2/2000
COMPUSTAT Data Item List
Annual Data Items
Data Item Number
Data Item Name
Units (Company)
Precision
Data Availability
1 Cash and Short-Term Investments MM$ 10.3 1950 2 Receivables – Total MM$ 10.3 1950 3 Inventories – Total MM$ 10.3 1950 4 Current Assets – Total MM$ 10.3 1950 5 Current Liabilities – Total MM$ 10.3 1950 6 Assets – Total/Liabilities and Stockholders’ Equity – Total MM$ 10.3 1950 7 Property, Plant, and Equipment – Total (Gross) MM$ 10.3 1950 8 Property, Plant, and Equipment – Total (Net) MM$ 10.3 1950 9 Long-Term Debt – Total MM$ 10.3 1950 10 Preferred Stock – Liquidating Value MM$ 10.3 1950 11 Common Equity – Tangible MM$ 10.3 1950 12 Sales (Net) MM$ 10.3 1950 13 Operating Income Before Depreciation MM$ 10.3 1950 14 Depreciation and Amortization MM$ 8.3 1950 15 Interest Expense MM$ 10.3 1950 16 Income Taxes – Total MM$ 8.3 1950 17 Special Items MM$ 10.3 1950 18 Income Before Extraordinary Items MM$ 10.3 1950 19 Dividends – Preferred MM$ 10.3 1950 20 Income Before Extraordinary Items – Adjusted for Common
Stock Equivalents MM$ 10.3 1950
21 Dividends – Common MM$ 10.3 1950 22 Price – Calendar Year – High $&¢ 8.3 1950 23 Price – Calendar Year – Low $&¢ 8.3 1950

COMPUSTAT Chapter 11 – Reference 3 2/2000
Annual Data Items (cont.)
Data Item Number
Data Item Name
Units (Company)
Precision
Data Availability
24 Price – Calendar Year – Close $&¢ 8.3 1950 25 Common Shares Outstanding MM 10.3 1950 26 Dividends per Share by Ex-Date $&¢ 8.3 1950 27 Adjustment Factor (Cumulative) by Ex-Date Ratio 10.6 1950 28 Common Shares Traded – Calendar Year MM 10.3 1950 29 Employees M 8.3 1950 30 Property, Plant, and Equipment – Capital Expenditures
(Schedule V) MM$ 10.3 1969
31 Investments and Advances – Equity Method MM$ 10.3 1950 32 Investments and Advances – Other MM$ 10.3 1950 33 Intangibles MM$ 8.3 1950 34 Debt in Current Liabilities MM$ 10.3 1955 35 Deferred Taxes and Investment Tax Credit (Balance Sheet) MM$ 8.3 1950 36 Retained Earnings MM$ 10.3 1963 37 Invested Capital – Total MM$ 10.3 1950 38 Minority Interest (Balance Sheet) MM$ 8.3 1950 39 Convertible Debt and Preferred Stock MM$ 8.3 1950 40 Common Shares Reserved for Conversion – Total MM 10.3 1950 41 Cost of Goods Sold MM$ 10.3 1950 42 Labor and Related Expense MM$ 10.3 1950 43 Pension and Retirement Expense MM$ 10.3 1950 44 Debt – Due in One Year MM$ 10.3 1955 45 Advertising Expense MM$ 10.3 1971 46 Research and Development Expense MM$ 8.3 1970 47 Rental Expense MM$ 10.3 1950 48 Extraordinary Items and Discontinued Operations MM$ 10.3 1950 49 Minority Interest (Income Account) MM$ 10.3 1950

COMPUSTAT Chapter 11 – Reference 4 2/2000
Annual Data Items (cont.)
Data Item Number
Data Item Name
Units (Company)
Precision
Data Availability
50 Deferred Taxes (Income Account) MM$ 8.3 1950 51 Investment Tax Credit (Income Account) MM$ 8.3 1950 52 Net Operating Loss Carry Forward – Unused Portion MM$ 8.3 1950 53 Earnings per Share (Basic) – Including Extraordinary Items $&¢ 10.4 1963 54 Common Shares Used to Calculate Earnings per Share
(Basic) MM 8.3 1950
55 Equity in Earnings MM$ 8.3 1950 56 Preferred Stock – Redemption Value MM$ 8.3 1950 57 Earnings per Share (Diluted) – Excluding Extraordinary Items $&¢ 8.3 1967 58 Earnings per Share (Basic) – Excluding Extraordinary Items $&¢ 8.3 1950 59 Inventory Valuation Method Code 8.3 1950 60 Common Equity – Total MM$ 10.3 1963 61 Nonoperating Income (Expense) MM$ 10.3 1950 62 Interest Income MM$ 10.3 1950 63 Income Taxes – Federal MM$ 8.3 1969 64 Income Taxes – Foreign MM$ 8.3 1969 65 Amortization of Intangibles MM$ 8.3 1969 66 Discontinued Operations MM$ 10.3 1950 67 Receivables – Estimated Doubtful MM$ 8.3 1969 68 Current Assets – Other MM$ 10.3 1950 69 Assets – Other MM$ 10.3 1950 70 Accounts Payable MM$ 10.3 1963 71 Income Taxes Payable MM$ 8.3 1963 72 Current Liabilities – Other MM$ 10.3 1963

COMPUSTAT Chapter 11 – Reference 5 2/2000
Annual Data Items (cont.)
Data Item Number
Data Item Name
Units (Company)
Precision
Data Availability
73 Property, Plant, and Equipment – Construction in Progress (Net)
MM$ 8.3 1969
74 Deferred Taxes (Balance Sheet) MM$ 8.3 1950 75 Liabilities – Other MM$ 10.3 1950 76 Inventories – Raw Materials MM$ 8.3 1969 77 Inventories – Work in Process MM$ 8.3 1969 78 Inventories – Finished Goods MM$ 8.3 1969 79 Debt – Convertible MM$ 8.3 1969 80 Debt – Subordinated MM$ 8.3 1969 81 Debt – Notes MM$ 8.3 1969 82 Debt – Debentures MM$ 10.3 1969 83 Long-Term Debt – Other MM$ 10.3 1969 84 Debt – Capitalized Lease Obligations MM$ 10.3 1969 85 Common Stock MM$ 8.3 1963 86 Treasury Stock (Memo Entry) MM$ 8.3 1969 87 Treasury Stock – Number of Common Shares MM 10.3 1969 88 Treasury Stock – Total Dollar Amount MM$ 8.3 1962 89 Pension Costs – Unfunded Vested Benefits MM$ 8.3 1973 90 Pension Costs – Unfunded Past or Prior Service MM$ 8.3 1973 91 Debt – Maturing in 2nd Year MM$ 8.3 1974 92 Debt – Maturing in 3rd Year MM$ 10.3 1974 93 Debt – Maturing in 4th Year MM$ 8.3 1974 94 Debt – Maturing in 5th Year MM$ 8.3 1974 95 Rental Commitments – Minimum – Five Years Total MM$ 8.3 1974 96 Rental Commitments – Minimum – 1st Year MM$ 8.3 1974 97 Retained Earnings – Unrestricted MM$ 10.3 1974 98 Order Backlog MM$ 10.3 1970 99 Retained Earnings Restatement MM$ 10.3 1969
COMPUSTAT Chapter 11 – Reference 6 2/2000
Annual Data Items (cont.)
Data Item Number
Data Item Name
Units (Company)
Precision
Data Availability
100 Common Shareholders M 10.3 1975 101 Interest Expense on Long-Term Debt MM$ 8.3 1975 102 Excise Taxes MM$ 8.3 1975 103 Depreciation Expense (Schedule VI) MM$ 8.3 1969 104 Short-Term Borrowings – Average MM$ 8.3 1977 105 Short-Term Borrowings – Average Interest Rate % 8.3 1977 106 Equity in Net Loss (Earnings) (Statement of Cash Flows) MM$ 8.3 1971 107 Sale of Property, Plant, and Equipment (Statement of Cash
Flows) MM$ 8.3 1971
108 Sale of Common and Preferred Stock (Statement of Cash Flows)
MM$ 8.3 1971
109 Sale of Investments (Statement of Cash Flows) MM$ 10.3 1971 110 Funds From Operations – Total (Statement of Changes) MM$ 10.3 1971 111 Long-Term Debt – Issuance (Statement of Cash Flows) MM$ 8.3 1971 112 Sources of Funds – Total (Statement of Changes) MM$ 10.3 1971 113 Increase in Investments (Statement of Cash Flows) MM$ 10.3 1971 114 Long-Term Debt – Reduction (Statement of Cash Flows) MM$ 10.3 1971 115 Purchase of Common and Preferred Stock (Statement of Cash
Flows ) MM$ 10.3 1971
116 Uses of Funds – Total (Statement of Changes) MM$ 10.3 1971 117 Sales (Restated) MM$ 10.3 R 118 Income Before Extraordinary Items (Restated) MM$ 10.3 R 119 Earnings per Share (Basic) – Excluding Extraordinary Items
(Restated) $&¢ 8.3 R
120 Assets – Total (Restated) MM$ 10.3 R 121 Working Capital (Restated) MM$ 10.3 R 122 Pretax Income (Restated) MM$ 10.3 R 123 Income Before Extraordinary Items (Statement of Cash Flows) MM$ 10.3 1971

COMPUSTAT Chapter 11 – Reference 7 2/2000
Annual Data Items (cont.)
Data Item Number
Data Item Name
Units (Company)
Precision
Data Availability
124 Extraordinary Items and Discontinued Operations (Statement of Cash Flows)
MM$ 10.3 1971
125 Depreciation and Amortization (Statement of Cash Flows) MM$ 10.3 1971 126 Deferred Taxes (Statement of Cash Flows) MM$ 8.3 1971 127 Cash Dividends (Statement of Cash Flows) MM$ 8.3 1971 128 Capital Expenditures (Statement of Cash Flows) MM$ 8.3 1950 129 Acquisitions (Statement of Cash Flows) MM$ 8.3 1971 130 Preferred Stock – Carrying Value MM$ 8.3 1962 131 Cost of Goods Sold (Restated) MM$ 10.3 R 132 Selling, General, and Administrative Expense (Restated) MM$ 10.3 R 133 Depreciation and Amortization (Restated) MM$ 10.3 R 134 Interest Expense (Restated) MM$ 8.3 R 135 Income Taxes – Total (Restated) MM$ 10.3 R 136 Extraordinary Items and Discontinued Operations (Restated) MM$ 10.3 R 137 Earnings per Share (Basic) – Including Extraordinary Items
(Restated) $&¢ 10.3 R
138 Common Shares Used to Calculate Earnings per Share (Basic) (Restated)
MM 10.3 R
139 Earnings per Share (Diluted) – Excluding Extraordinary Items (Restated)
$&¢ 10.3 R
140 Earnings per Share (Diluted) – Including Extraordinary Items (Restated)
$&¢ 8.3 R
141 Property, Plant, and Equipment – Total (Net) (Restated) MM$ 10.3 R 142 Long-Term Debt – Total (Restated) MM$ 10.3 R 143 Retained Earnings (Restated) MM$ 10.3 R 144 Stockholders’ Equity (Restated) MM$ 10.3 R 145 Capital Expenditures (Restated) MM$ 8.3 R
COMPUSTAT Chapter 11 – Reference 8 2/2000
Annual Data Items (cont.)
Data Item Number
Data Item Name
Units (Company)
Precision
Data Availability
146 Employees (Restated) M 8.3 R 147 Interest Capitalized MM$ 10.3 1975 148 Long-Term Debt – Tied to Prime MM$ 8.3 1974 149 Auditor/Auditor’s Opinion Code 8.3 1974 150 Foreign Currency Adjustment (Income Account) MM$ 8.3 1972 151 Receivables – Trade MM$ 10.3 1966 152 Deferred Charges MM$ 8.3 1966 153 Accrued Expense MM$ 8.3 1963 154 Debt – Subordinated Convertible MM$ 8.3 1969 155 Property, Plant, and Equipment – Buildings (Net) MM$ 8.3 1969 156 Property, Plant, and Equipment – Machinery and Equipment
(Net) MM$ 8.3 1969
157 Property, Plant, and Equipment – Natural Resources (Net) MM$ 8.3 1969 158 Property, Plant, and Equipment – Land and Improvements
(Net) MM$ 8.3 1969
159 Property, Plant, and Equipment – Leases (Net) MM$ 8.3 1969 160 Prepaid Expense MM$ 8.3 1950 161 Income Tax Refund MM$ 8.3 1950 162 Cash MM$ 8.3 1950 163 Rental Income MM$ 10.3 1975 164 Rental Commitments – Minimum – 2nd Year MM$ 8.3 1974 165 Rental Commitments – Minimum – 3rd Year MM$ 8.3 1974 166 Rental Commitments – Minimum – 4th Year MM$ 8.3 1974 167 Rental Commitments – Minimum – 5th Year MM$ 8.3 1974 168 Compensating Balance MM$ 8.3 1974 169 Earnings per Share (Diluted) – Including Extraordinary Items $&¢ 8.3 1969
COMPUSTAT Chapter 11 – Reference 9 2/2000
Annual Data Items (cont.)
Data Item Number
Data Item Name
Units (Company)
Precision
Data Availability
170 Pretax Income MM$ 10.3 1950 171 Common Shares Used to Calculate Earnings per Share
(Diluted) MM 8.3 1969
172 Net Income (Loss) MM$ 10.3 1950 173 Income Taxes – State MM$ 8.3 1969 174 Depletion Expense (Schedule VI) MM$ 8.3 1969 175 Preferred Stock – Redeemable MM$ 10.3 1979 176 Blank NA 10.3 177 Net Income (Loss) (Restated) MM$ 10.3 R 178 Operating Income After Depreciation MM$ 10.3 1950 179 Working Capital (Balance Sheet) MM$ 10.3 1950 180 Working Capital Change – Total (Statement of Changes) MM$ 10.3 1971 181 Liabilities – Total MM$ 10.3 1950 182 Property, Plant, and Equipment – Beginning Balance
(Schedule V) MM$ 10.3 1969
183 Accounting Changes – Cumulative Effect MM$ 10.3 1988 184 Property, Plant, and Equipment – Retirements
(Schedule V) MM$ 10.3 1969
185 Property, Plant, and Equipment – Other Changes (Schedule V)
MM$ 10.3 1969
186 Inventories – Other MM$ 10.3 1984 187 Property, Plant, and Equipment – Ending Balance (Schedule
V) MM$ 10.3 1969
188 Debt – Senior Convertible MM$ 10.3 1969 189 Selling, General, and Administrative Expense MM$ 8.3 1950 190 Nonoperating Income (Expense) – Excluding Interest Income MM$ 10.3 1950 191 Common Stock Equivalents – Dollar Savings MM$ 8.3 1950 192 Extraordinary Items MM$ 10.3 1950

COMPUSTAT Chapter 11 – Reference 10 2/2000
Annual Data Items (cont.)
Data Item Number
Data Item Name
Units (Company)
Precision
Data Availability
193 Short-Term Investments MM$ 10.3 1950 194 Receivables – Current – Other MM$ 10.3 1950 195 Current Assets – Other – Excluding Prepaid Expense MM$ 10.3 1950 196 Depreciation, Depletion, and Amortization (Accumulated)
(Balance Sheet) MM$ 10.3 1950
197 Price – Fiscal Year– High $&¢ 8.3 1962 198 Price – Fiscal Year – Low $&¢ 8.3 1962 199 Price – Fiscal Year – Close $&¢ 8.3 1962 200 Common Shares Reserved for Conversion – Convertible Debt MM 10.3 1984 201 Dividends per Share by Payable Date $&¢ 8.3 1971 202 Adjustment Factor (Cumulative) by Payable Date Ratio 10.6 1964 203 Common Shares Reserved for Conversion – Preferred Stock MM 10.3 1984 204 Goodwill MM$ 8.3 1988 205 Assets – Other – Excluding Deferred Charges MM$ 10.3 1950 206 Notes Payable MM$ 10.3 1955 207 Current Liabilities – Other – Excluding Accrued Expense MM$ 10.3 1963 208 Investment Tax Credit (Balance Sheet) MM$ 8.3 1950 209 Preferred Stock – Nonredeemable MM$ 10.3 1962 210 Capital Surplus MM$ 8.3 1963 211 Income Taxes – Other MM$ 10.3 1984 212 Blank NA 10.3 213 Sale of Property, Plant, and Equipment and Sale of
Investments – Loss (Gain) (Statement of Cash Flows) MM$ 8.3 1987
214 Preferred Stock – Convertible MM$ 8.3 1969 215 Common Shares Reserved for Conversion – Stock Options MM 10.3 1984 216 Stockholders’ Equity – Total MM$ 10.3 1963

COMPUSTAT Chapter 11 – Reference 11 2/2000
Annual Data Items (cont.)
Data Item Number
Data Item Name
Units (Company)
Precision
Data Availability
217 Funds From Operations – Other (Statement of Cash Flows) MM$ 10.3 1971 218 Sources of Funds – Other (Statement of Changes) MM$ 10.3 1971 219 Uses of Funds – Other (Statement of Changes) MM$ 10.3 1971 220 Depreciation (Accumulated) – Beginning Balance (Schedule
VI) MM$ 10.3 1969
221 Depreciation (Accumulated) – Retirements (Schedule VI) MM$ 8.3 1969 222 Depreciation (Accumulated) – Other Changes
(Schedule VI) MM$ 10.3 1969
223 Depreciation (Accumulated) – Ending Balance (Schedule VI)
MM$ 10.3 1969
224 Nonoperating Income (Expense) (Restated) MM$ 10.3 R 225 Minority Interest (Restated) MM$ 8.3 R 226 Treasury Stock (Dollar Amount) – Common MM$ 8.3 1982 227 Treasury Stock (Dollar Amount) – Preferred MM$ 8.3 1982 228 Currency Translation Rate $&¢ 10.4 1984 229 Common Shares Reserved for Conversion – Warrants and
Other MM 8.3 1984
230 Retained Earnings – Cumulative Translation Adjustment MM$ 8.3 1982 231 Retained Earnings – Other Adjustments MM$ 8.3 1982 232 Common Stock – per Share Carrying Value $&¢ 8.3 1982
233 Earnings per Share from Operations $&¢ 8.3 1993 234 ADR Ratio Ratio 8.3 1989 235 Common Equity – Liquidation Value MM$ 10.3 1950 236 Working Capital Change – Other – Increase (Decrease)
(Statement of Changes) MM$ 10.3 1971
237 Income Before Extraordinary Items – Available for Common MM$ 10.3 1950 238 Marketable Securities Adjustment (Balance Sheet) MM$ 8.3 1975

COMPUSTAT Chapter 11 – Reference 12 2/2000
Annual Data Items (cont.)
Data Item Number
Data Item Name
Units (Company)
Precision
Data Availability
239 Interest Capitalized – Net Income Effect MM$ 8.3 1975 240 Inventories – LIFO Reserve MM$ 8.3 1975 241 Debt – Mortgages and Other Secured MM$ 10.3 1981 242 Dividends – Preferred – In Arrears MM$ 8.3 1975 243 Pension Benefits – Present Value of Vested MM$ 10.3 1980 244 Pension Benefits – Present Value of Nonvested MM$ 10.3 1980 245 Pension Benefits – Net Assets MM$ 10.3 1980 246 Pension Benefits – Assumed Rate of Return % 8.3 1980 247 Pension Benefits – Information Date MMDDYY 10.3 1980 248 Acquisition – Income Contribution MM$ 8.3 1974 249 Acquisition – Sales Contribution MM$ 8.3 1974 250 Property, Plant, and Equipment – Other (Net) MM$ 10.3 1969 251 Depreciation (Accumulated) – Land and Improvements MM$ 8.3 1984 252 Depreciation (Accumulated) – Natural Resources MM$ 8.3 1984 253 Depreciation (Accumulated) – Buildings MM$ 8.3 1984 254 Depreciation (Accumulated) – Machinery and Equipment MM$ 8.3 1984 255 Depreciation (Accumulated) – Leases MM$ 8.3 1984 256 Depreciation (Accumulated) – Construction in Progress MM$ 8.3 1984 257 Depreciation (Accumulated) – Other MM$ 10.3 1984 258 Net Income – Adjusted for Common Stock Equivalents MM$ 10.3 1966 259 Retained Earnings – Unadjusted MM$ 10.3 1982 260 Property, Plant, and Equipment – Land and Improvements at
Cost MM$ 8.3 1984
261 Property, Plant, and Equipment – Natural Resources at Cost MM$ 8.3 1984 262 Blank NA 10.3 263 Property, Plant, and Equipment – Buildings at Cost MM$ 8.3 1984

COMPUSTAT Chapter 11 – Reference 13 2/2000
Annual Data Items (cont.)
Data Item Number
Data Item Name
Units (Company)
Precision
Data Availability
264 Property, Plant, and Equipment – Machinery and Equipment at Cost
MM$ 8.3 1984
265 Property, Plant, and Equipment – Leases at Cost MM$ 8.3 1984 266 Property, Plant, and Equipment – Construction in Progress at
Cost MM$ 8.3 1984
267 Property, Plant, and Equipment – Other at Cost MM$ 10.3 1984 268 Debt – Unamortized Debt Discount and Other MM$ 8.3 1984 269 Deferred Taxes – Federal MM$ 8.3 1984 270 Deferred Taxes – Foreign MM$ 8.3 1984 271 Deferred Taxes – State MM$ 8.3 1984 272 Pretax Income – Domestic MM$ 10.3 1984 273 Pretax Income – Foreign MM$ 10.3 1984 274 Cash and Cash Equivalents – Increase (Decrease) (Statement
of Cash Flows) MM$ 10.3 1971
275 Blank NA 10.3 276 S&P Major Index Code – Historical Code 8.3 1976 277 S&P Industry Index Code – Historical Code 8.3 1976 278 Fortune Industry Code Code 8.3 1982 279 Fortune Rank Code 8.3 1982 280 S&P Long-Term Domestic Issuer Credit Rating – Historical Code 8.3 1985 281 Blank Code 8.3 1978 282 S&P Common Stock Ranking Code 8.3 1985 283 S&P Short-Term Domestic Issuer Credit Rating – Historical Code 8.3 1985 284 Pension – Vested Benefit Obligation (Overfunded) MM$ 10.3 1986 285 Pension – Accumulated Benefit Obligation (Overfunded) MM$ 10.3 1986 286 Pension – Projected Benefit Obligation (Overfunded) MM$ 8.3 1986 287 Pension Plan Assets (Overfunded) MM$ 10.3 1986
COMPUSTAT Chapter 11 – Reference 14 2/2000
Annual Data Items (cont.)
Data Item Number
Data Item Name
Units (Company)
Precision
Data Availability
288 Pension – Unrecognized Prior Service Cost (Overfunded) MM$ 10.3 1986 289 Pension – Other Adjustments (Overfunded) MM$ 10.3 1986 290 Pension – Prepaid/Accrued Cost (Overfunded) MM$ 10.3 1986 291 Pension – Vested Benefit Obligation (Underfunded) MM$ 10.3 1986 292 Periodic Postretirement Benefit Cost (Net) MM$ 10.3 1990 293 Pension – Accumulated Benefit Obligation (Underfunded) MM$ 10.3 1986 294 Pension – Projected Benefit Obligation (Underfunded) MM$ 8.3 1986 295 Periodic Pension Cost (Net) MM$ 10.3 1991 296 Pension Plan Assets (Underfunded) MM$ 10.3 1986 297 Pension – Unrecognized Prior Service Cost (Underfunded) MM$ 10.3 1986 298 Pension – Additional Minimum Liability (Underfunded) MM$ 10.3 1986 299 Pension – Other Adjustments (Underfunded) MM$ 10.3 1986 300 Pension – Prepaid/Accrued Cost (Underfunded) MM$ 10.3 1986 301 Changes in Current Debt (Statement of Cash Flows) MM$ 8.3 1971 302 Accounts Receivable – Decrease (Increase) (Statement of
Cash Flows) MM$ 8.3 1987
303 Inventory – Decrease (Increase) (Statement of Cash Flows) MM$ 8.3 1987 304 Accounts Payable and Accrued Liabilities – Increase
(Decrease) (Statement of Cash Flows) MM$ 8.3 1987
305 Income Taxes – Accrued – Increase (Decrease) (Statement of Cash Flows)
MM$ 8.3 1987
306 Blank NA 10.3 307 Assets and Liabilities – Other (Net Change) (Statement of
Cash Flows) MM$ 10.3 1987
308 Operating Activities – Net Cash Flow (Statement of Cash Flows)
MM$ 10.3 1987
COMPUSTAT Chapter 11 – Reference 15 2/2000
Annual Data Items (cont.)
Data Item Number
Data Item Name
Units (Company)
Precision
Data Availability
309 Short-Term Investments – Change (Statement of Cash Flows) MM$ 8.3 1987 310 Investing Activities – Other (Statement of Cash Flows) MM$ 10.3 1987 311 Investing Activities – Net Cash Flow (Statement of Cash
Flows) MM$ 10.3 1987
312 Financing Activities – Other (Statement of Cash Flows) MM$ 10.3 1987 313 Financing Activities – Net Cash Flow (Statement of Cash
Flows) MM$ 10.3 1987
314 Exchange Rate Effect (Statement of Cash Flows) MM$ 10.3 1987 315 Interest Paid – Net (Statement of Cash Flows) MM$ 8.3 1987 316 Blank NA 10.3 317 Income Taxes Paid (Statement of Cash Flows) MM$ 10.3 1987 318 Format Code (Statement of Cash Flows) Code 10.3 1971 319 Blank NA 10.3 320 S&P Subordinated Debt Rating Code 8.3 1985 321 Interest Income – Total (Financial Services) MM 8.3 1961 322 Blank NA 10.3 323-325 Blank NA 8.3 326 Blank NA 10.3 327 Contingent Liabilities – Guarantees MM$ 8.3 1991 328 Debt – Finance Subsidiary MM$ 8.3 1991 329 Debt – Consolidated Subsidiary MM$ 8.3 1975 330 Postretirement Benefit Asset (Liability) (Net) MM$ 8.3 1990 331 Pension Plans – Service Cost MM$ 8.3 1991 332 Pension Plans – Interest Cost MM$ 8.3 1991 333 Pension Plans – Return on Plan Assets (Actual) MM$ 8.3 1991 334 Pension Plans – Other Periodic Cost Components (Net) MM$ 8.3 1991 335 Pension Plans – Rate of Compensation Increase % 8.3 1991

COMPUSTAT Chapter 11 – Reference 16 2/2000
Annual Data Items (cont.)
Data Item Number
Data Item Name
Units (Company)
Precision
Data Availability
336 Pension Plans – Anticipated Long-Term Rate of Return on Plan Assets
% 8.3 1991
337 Risk-Adjusted Capital Ratio – Tier 1 Ratio 8.3 1993 338 Blank NA 10.3 339 Interest Expense – Total (Financial Services) MM 8.3 1961 340 Net Interest Income (Tax Equivalent) MM 8.3 1977 341 Nonperforming Assets – Total MM 8.3 1993 342 Provision for Loan/Asset Losses MM 8.3 1961 343 Reserve for Loan/Asset Losses MM 8.3 1961 344 Net Interest Margin Ratio 8.3 1993 345 Blank NA 10.3 346 Blank NA 8.3 347 Blank NA 10.3 348 Risk-Adjusted Capital Ratio – Total Ratio 8.3 1993 349 Net Charge-Offs MM 8.3 1961 350 Blank NA 10.3

COMPUSTAT Chapter 11 – Reference 17 2/2000
Quarterly Data Items
Data Item Number
Data Item Name
Units (Company)
Precision
Data Availability
1 Selling, General, and Administrative Expense MM$ 8.3 1967-1 2 Sales (Net) MM$ 10.3 1961-1 3 Minority Interest (Income Account) MM$ 8.3 1967-1 4 Research and Development Expense MM$ 8.3 1989-1 5 Depreciation and Amortization MM$ 8.3 1961-1 6 Income Taxes – Total MM$ 8.3 1961-1 7 Earnings per Share (Diluted) – Including Extraordinary Items $&¢ 8.3 1967-1 8 Income Before Extraordinary Items MM$ 10.3 1961-1 9 Earnings per Share (Diluted) – Excluding Extraordinary Items $&¢ 8.3 1967-1 10 Income Before Extraordinary Items – Adjusted for Common
Stock Equivalents MM$ 10.3 1966-1
11 Earnings per Share (Basic) – Including Extraordinary Items $&¢ 8.3 1961-1 12 Price – Close – 1st Month of Quarter $&¢ 8.3 1962-1 13 Price – Close – 2nd Month of Quarter $&¢ 8.3 1962-1 14 Price – Close – 3rd Month of Quarter $&¢ 8.3 1962-1 15 Common Shares Used to Calculate Earnings per Share
(Basic) MM 10.3 1961-1
16 Dividends per Share by Ex-Date $&¢ 8.3 1962-1 17 Adjustment Factor (Cumulative) by Ex-Date Ratio 10.6 1962-1 18 Common Shares Traded MM 10.3 1966-1 19 Earnings per Share (Basic) – Excluding Extraordinary Items $&¢ 8.3 1961-1 20 Dividends – Common – Indicated Annual $&¢ 8.3 1962-1 21 Operating Income Before Depreciation MM$ 8.3 1966-1 22 Interest Expense MM$ 8.3 1967-1 23 Pretax Income MM$ 10.3 1961-1 24 Dividends – Preferred MM$ 8.3 1966-1
COMPUSTAT Chapter 11 – Reference 18 2/2000
Quarterly Data Items (cont.)
Data Item Number
Data Item Name
Units (Company)
Precision
Data Availability
25 Income Before Extraordinary Items – Available for Common MM$ 10.3 1966-1 26 Extraordinary Items and Discontinued Operations MM$ 10.3 1961-1 27 Earnings per Share (Basic) – Excluding Extraordinary Items –
12-Months Moving $&¢ 8.3 1962-1
28 Common Shares Used to Calculate Earnings per Share – 12-Months Moving
MM 8.3 1961-1
29 Interest Income – Total (Financial Services) MM$ 8.3 1993-1 30 Cost of Goods Sold MM$ 10.3 1967-1 31 Nonoperating Income (Expense) MM$ 10.3 1967-1 32 Special Items MM$ 10.3 1967-1 33 Discontinued Operations MM$ 10.3 1961-1 34 Foreign Currency Adjustment (Income Account) MM$ 8.3 1976-1 35 Deferred Taxes (Income Account) MM$ 8.3 1967-1 36 Cash and Short-Term Investments MM$ 8.3 1976-1 37 Receivables – Total MM$ 10.3 1976-1 38 Inventories – Total MM$ 8.3 1976-1 39 Current Assets – Other MM$ 8.3 1976-1 40 Current Assets – Total MM$ 8.3 1976-1 41 Depreciation, Depletion, and Amortization (Accumulated)
(Balance Sheet) MM$ 10.3 1981-1
42 Property, Plant, and Equipment – Total (Net) MM$ 10.3 1976-1 43 Assets – Other MM$ 10.3 1976-1 44 Assets – Total/Liabilities and Stockholders’ Equity – Total MM$ 10.3 1976-1 45 Debt in Current Liabilities MM$ 10.3 1972-1 46 Accounts Payable MM$ 8.3 1976-1 47 Income Taxes Payable MM$ 8.3 1976-1 48 Current Liabilities – Other MM$ 8.3 1976-1

COMPUSTAT Chapter 11 – Reference 19 2/2000
Quarterly Data Items (cont.)
Data Item Number
Data Item Name
Units (Company)
Precision
Data Availability
49 Current Liabilities – Total MM$ 10.3 1976-1 50 Liabilities – Other MM$ 10.3 1976-1 51 Long-Term Debt – Total MM$ 10.3 1972-1 52 Deferred Taxes and Investment Tax Credit (Balance Sheet) MM$ 8.3 1976-1 53 Minority Interest (Balance Sheet) MM$ 8.3 1975-1 54 Liabilities – Total MM$ 10.3 1976-1 55 Preferred Stock – Carrying Value MM$ 8.3 1972-1 56 Common Stock MM$ 8.3 1972-1 57 Capital Surplus MM$ 8.3 1972-1 58 Retained Earnings MM$ 10.3 1972-1 59 Common Equity – Total MM$ 10.3 1972-1 60 Stockholders’ Equity – Total MM$ 10.3 1972-1 61 Common Shares Outstanding MM 10.3 1971-1 62 Invested Capital – Total MM$ 10.3 1972-1 63 Price – High – 1st Month of Quarter $&¢ 8.3 1962-1 64 Price – High – 2nd Month of Quarter $&¢ 8.3 1962-1 65 Price – High – 3rd Month of Quarter $&¢ 8.3 1962-1 66 Price – Low – 1st Month of Quarter $&¢ 8.3 1962-1 67 Price – Low – 2nd Month of Quarter $&¢ 8.3 1962-1 68 Price – Low – 3rd Month of Quarter $&¢ 8.3 1962-1 69 Net Income (Loss) MM$ 10.3 1961-1 70 Interest Expense – Total (Financial Services) MM$ 8.3 1970-1 71 Preferred Stock – Redeemable MM$ 8.3 1978-1 72 Dividends per Share by Payable Date $&¢ 8.3 1962-1 73 Working Capital Change – Other – Increase (Decrease)
(Statement of Changes) MM$ 10.3 1984-1

COMPUSTAT Chapter 11 – Reference 20 2/2000
Quarterly Data Items (cont.)
Data Item Number
Data Item Name
Units (Company)
Precision
Data Availability
74 Cash and Cash Equivalents – Increase (Decrease) (Statement of Cash Flows)
MM$ 10.3 1984-1
75 Changes in Current Debt (Statement of Cash Flows) MM$ 10.3 1984-1 76 Income Before Extraordinary Items (Statement of Cash Flows) MM$ 8.3 1984-1 77 Depreciation and Amortization (Statement of Cash Flows) MM$ 8.3 1984-1 78 Extraordinary Items and Discontinued Operations (Statement
of Cash Flows) MM$ 8.3 1984-1
79 Deferred Taxes (Statement of Cash Flows) MM$ 8.3 1984-1 80 Equity in Net Loss (Earnings) (Statement of Cash Flows) MM$ 8.3 1984-1 81 Funds From Operations – Other (Statement of Cash Flows) MM$ 10.3 1984-1 82 Funds From Operations – Total (Statement of Changes) MM$ 8.3 1984-1 83 Sale of Property, Plant, and Equipment (Statement of Cash
Flows) MM$ 8.3 1984-1
84 Sale of Common and Preferred Stock (Statement of Cash Flows)
MM$ 8.3 1984-1
85 Sale of Investments (Statement of Cash Flows) MM$ 10.3 1984-1 86 Long-Term Debt – Issuance (Statement of Cash Flows) MM$ 8.3 1984-1 87 Sources of Funds – Other (Statement of Changes) MM$ 8.3 1984-1 88 Sources of Funds – Total (Statement of Changes) MM$ 8.3 1984-1 89 Cash Dividends (Statement of Cash Flows) MM$ 8.3 1984-1 90 Capital Expenditures (Statement of Cash Flows) MM$ 8.3 1984-1 91 Increase in Investments (Statement of Cash Flows) MM$ 10.3 1984-1 92 Long-Term Debt – Reduction (Statement of Cash Flows) MM$ 8.3 1984-1 93 Purchase of Common and Preferred Stock (Statement of Cash
Flows) MM$ 8.3 1984-1
94 Acquisitions (Statement of Cash Flows) MM$ 8.3 1984-1

COMPUSTAT Chapter 11 – Reference 21 2/2000
Quarterly Data Items (cont.)
Data Item Number
Data Item Name
Units (Company)
Precision
Data Availability
95 Uses of Funds – Other (Statement of Changes) MM 8.3 1984-1 96 Uses of Funds – Total (Statement of Changes) MM$ 8.3 1984-1 97 Net Interest Income (Tax Equivalent) MM$ 8.3 1993-1 98 Treasury Stock – Total Dollar Amount MM$ 8.3 1972-1 99 Nonperforming Assets – Total MM$ 8.3 1993-1 100 Adjustment Factor (Cumulative) by Payable Date Ratio 10.6 1962-1 101 Working Capital Change – Total (Statement of Changes) MM$ 8.3 1984-1 102 Sale of Property, Plant, and Equipment and Sale of
Investments – Loss (Gain) (Statement of Cash Flows) MM$ 8.3 1987-1
103 Accounts Receivable – Decrease (Increase) (Statement of Cash Flows)
MM$ 8.3 1987-1
104 Inventory – Decrease (Increase) (Statement of Cash Flows) MM$ 10.3 1987-1 105 Accounts Payable and Accrued Liabilities – Increase
(Decrease) (Statement of Cash Flows) MM$ 8.3 1987-1
106 Income Taxes – Accrued – Increase (Decrease) (Statement of Cash Flows)
MM$ 8.3 1987-1
107 Assets and Liabilities – Other (Net Change) (Statement of Cash Flows)
MM$ 10.3 1987-1
108 Operating Activities – Net Cash Flow (Statement of Cash Flows)
MM$ 10.3 1987-1
109 Short-Term Investments – Change (Statement of Cash Flows) MM$ 8.3 1987-1 110 Investing Activities – Other (Statement of Cash Flows) MM$ 10.3 1987-1 111 Investing Activities – Net Cash Flow (Statement of Cash
Flows) MM$ 10.3 1987-1
112 Financing Activities – Other (Statement of Cash Flows) MM$ 10.3 1987-1 113 Financing Activities – Net Cash Flow (Statement of Cash
Flows) MM$ 10.3 1987-1
114 Exchange Rate Effect (Statement of Cash Flows) MM$ 10.3 1987-1

COMPUSTAT Chapter 11 – Reference 22 2/2000
Quarterly Data Items (cont.)
Data Item Number
Data Item Name
Units (Company)
Precision
Data Availability
115 Interest Paid – Net (Statement of Cash Flows) MM$ 8.3 1987-1 116 Income Taxes Paid (Statement of Cash Flows) MM$ 8.3 1987-1 117 Accounting Changes – Cumulative Effect MM$ 10.3 1989-1 118 Property, Plant, and Equipment – Total (Gross) MM$ 10.3 1976-1 119 Extraordinary Items MM$ 10.3 1966-1 120 Common Stock Equivalents – Dollar Savings MM$ 10.3 1961-1 121 Currency Translation Rate $&¢ 10.4 1991-1 122 Accounts Payable – Expanded MM$ 10.3 1976-1 123 Blank NA 10.4 124-170 Blank NA 10.3 171 Provision for Loan/Asset Losses MM$ 8.3 1970-1 172 Reserve for Loan/Asset Losses MM$ 8.3 1970-1 173 Net Interest Margin Ratio 8.3 1993-1 174 Risk-Adjusted Capital Ratio – Tier 1 Ratio 8.3 1993-1 175 Risk-Adjusted Capital Ratio – Total Ratio 8.3 1993-1 176 Net Charge-Offs MM$ 8.3 1970-1 177 Earnings per Share from Operations $&¢ 8.3 1993-1 178 Earnings per Share from Operations – 12 Months Moving $&¢ 8.3 1993-1 179-232 Blank NA 8.3
COMPUSTAT Chapter 11 – Reference 23 2/2000
Business Information File Data Items
Position Number
Data Item Number/ Mnemonic
Data Item Name
Units
(Company)
Precision
Data Type
Periodicity
1 GVKEY Standard & Poor’s Identifier Character 2 SRCYR Source Year Integer 3 SRCFYR Source Fiscal Year-end Month Integer 4 STYPE Segment Type Character 5 SID Segment Identifier Integer 6 YEAR Data Year Integer 7 FYR Data Fiscal Year-end Month Integer 8 CYR Data Calendar Year Integer 9 SALE Net Sales $Mil 16.3 Character 10 OIBD Operating Income Before Depreciation $Mil 16.3 Character 11 DP Depreciation and Amortization $Mil 16.3 Character 12 OIAD Operating Income After Depreciation $Mil 16.3 Character 13 CAPX Capital Expenditures $Mil 16.3 Character 14 AT Identifiable/Total Assets $Mil 16.3 Character 15 EQEARN Equity in Earnings $Mil 16.3 Character 16 INVEQ Investments at Equity $Mil 16.3 Integer 17 EMP Employees Actual 16.3 Character 18 RD Research and Development $Mil 16.3 Character 19 OBKLG Order Backlog $Mil 16.3 Character 20 EXPORT Export Sales $Mil 16.3 Character 22 INTSEG Intersegment Eliminations $Mil 16.3 Character 34 PI Pretax Income $Mil 16.3 Character 36 IB Income Before Extraordinary Items $Mil 16.3 Character 38 NI Net Income (Loss) $Mil 16.3 Character 44 OPS Operating Profit $Mil 16.3 Character

COMPUSTAT Chapter 11 – Reference 24 2/2000
Business Information File Data Items (cont.)
Position
Data Item Number/ Mnemonic
Data Item Name
Units
(Company)
Precision
Data Type
Periodicity
48 SALEF Footnote 1 – Sales Character 49 OPINCF Footnote 2 – Operating Profit Character 50 CAPXF Footnote 3 – Capital Expenditures Character 51 EQEARNF Footnote 4 – Equity in Earnings Character 52 EMPF Footnote 5 – Employees Character 53 RDF Footnote 6 – Research and Development Character

COMPUSTAT Chapter 11 – Reference 25 2/2000
Prices, Dividends, and Earnings (PDE) Data Items and Company Descriptors
Mnemonic Data Item Name Units Precision
CUMADJ Adjustment Factor (Cumulative) by Ex-Date Ratio 10.6 RAWADJ Adjustment Factor (Raw) by Ex-Date Ratio 10.6 DIVRTE Annualized Dividend Rate $&¢ 8.3 BKV Book Value per Share $&¢ 10.3 YEAR Calendar Year Date CHEQVM Cash Equivalent Distributions per Share by Ex-Date $&¢ 8.3 CSHOQ Common Shares Outstanding MM 10.3 CSHTRM Common Shares Traded MM 10.3 CSFSM Common Stock Float Shares – Canada MM 10.3 CONAME Company Name NA CIC CUSIP Issue Number and Check Digit Code CNUM CUSIP Issuer Code Code DIV Dividends per Share by Ex-Date $&¢ 8.3 ERN Earnings per Share – 12 Months Moving $&¢ 8.3 OEPS12 Earnings per Share from Operations – 12 Months Moving $&¢ 10.3 ZLIST Exchange Listing and S&P Major Index Code Code FILE File Identification Code Code FYR Fiscal Year-end Month of Data NA EPSH12 Historical Earnings per Share $&¢ 8.3 DNUM Industry Classification Code Code INAME Industry Name NA NAVM Net Asset Value per Share $&¢ 10.3 NAICS North American Industry Classification System Code PRCC Price – Close $&¢ 10.3 PRCH Price – High $&¢ 10.3 PRCL Price – Low $&¢ 10.3 XREL S&P Industry Index Relative Code Code SMBL Stock Ticker Symbol Code 4YEAR 4 Digit Calendar Year Date

COMPUSTAT Chapter 11 – Reference 26 2/2000
Annual Footnotes (by Number)
Record 1 of IBM 360/370 General File Format Records 1 through 4 of Character ASCII File Format
Footnote Slot #
Data Item Being Footnoted (Including Data Item #)
Footnote Code
Description
1 Sales (Net) (#12) AA Reflects a merger or acquisition AB Reflects a significant merger/acquisition whereby the effects on the
prior year’s sales constitute 50% or more of the reported sales for that year
AC Reflects an accounting change AR Combination of AA and AZ AS Combination of AA and AC AT Combination of AC and AZ AZ Excludes discontinued operations BA Includes excise taxes BB Includes other income/excludes some operating revenues BC Includes sales of leased departments BS Combination of BA and BB BT Combination of BB and BC DB Some or all data is not available because of a fiscal year change DZ Some or all data is not available because the company has been in
operation less than one year or presents more than or less than 12 months of data in its statements. If presented, data represents either nine-11 months or 13-15 months of information
FA Combination of AA and BA FB Combination of AA and BB FC Combination of AA and BC FD Combination of AB and BA FE Combination of AB and BB FF Combination of AB and BC

COMPUSTAT Chapter 11 – Reference 27 2/2000
Annual Footnotes (by Number)
Record 1 of IBM 360/370 General File Format Records 1 through 4 of Character ASCII File Format (cont.)
Footnote Slot #
Data Item Being Footnoted (Including Data Item #)
Footnote Code
Description
1 (cont.) FG Combination of AC and BA FH Combination of AC and BB FJ Combination of AC and BC FK Combination of AC and BS FL Combination of AZ and BS FW Combination of AR and BB FX Combination of AZ and BA FY Combination of AZ and BB FZ Combination of AZ and BC
2 Cost of Goods Sold (#41) AC Reflects an accounting change BD Reduced by an amount of depreciation which should be allocated to
Selling, General, and Administrative Expense FI Combination of AC and BD
3 Research and Development Expense (#46) BF Includes customer- or government-sponsored research and development
BG Includes engineering expense 4 Rental Expense (#47) BR Includes royalties
QH Net of Rental Income RH Combination of BR and QH
5 Depreciation and Amortization (#14) AC Reflects an accounting change ER Does not reflect an exact amount LR Combination of AC and ER

COMPUSTAT Chapter 11 – Reference 28 2/2000
Annual Footnotes (by Number)
Record 1 of IBM 360/370 General File Format Records 1 through 4 of Character ASCII File Format (cont.)
Footnote Slot #
Data Item Being Footnoted (Including Data Item #)
Footnote Code
Description
6 Interest Expense (#15) AC Reflects an accounting change GA S&P estimate (from 1973 forward, S&P no longer estimates interest
expense) QA Net of either interest income, interest capitalized or both WA Combination of AC and QA
7 Income Taxes – Federal (#63) Income Taxes – Foreign (#64) Income Taxes – State (#173) Income Taxes – Other (#211)
TN Federal, Foreign, State and Other Incomes Taxes are not classified by current and deferred
8 Investment Tax Credit (#51) TA Computed using amortized method or cost reduction basis method TF Computed using flow through method
9 Income Taxes – Total (#16) AC Reflects an accounting change BH Includes other taxes FP Combination of AC and BH
10 Income Before Extraordinary Items (#18) Net Income (Loss) (#172)
AC Reflects an accounting change GI Combination of AC and GP GP Some or all data is pro forma
11 Income Before Extraordinary Items – Adjusted for Common Stock Equivalents (#20)
BZ Includes effect of conversion of preferred stock and/or convertible debt

COMPUSTAT Chapter 11 – Reference 29 2/2000
Annual Footnotes (by Number)
Record 1 of IBM 360/370 General File Format Records 1 through 4 of Character ASCII File Format (cont.)
Footnote Slot #
Data Item Being Footnoted (Including Data Item #)
Footnote Code
Description
12 Earnings per Share (Basic) – Including Extraordinary Items (#53)
Earnings per Share (Basic) – Excluding Extraordinary Items (#58)
AC Adoption of FASB #128 BJ Includes equity in earnings nonconsolidated subsidiaries NB Combination of BJ and NC NC Earnings per Share is an S&P calculation and may disagree with
company reports NQ Combination of NC and QJ NS Combination of NC and RA QJ Earnings per Share is based on the effect of common stock
equivalents RA Combination of BJ and QJ
13 Capital Expenditures (Statement of Cash Flows) (#128)
QB Net of current year’s sales, retirements, and/or disposals of Property, Plant, and Equipment
14 Rental Commitment – Minimum – 1st Year (#96) Rental Commitment – Minimum – 2nd Year (#164) Rental Commitment – Minimum – 3rd Year (#165) Rental Commitment – Minimum – 4th Year (#166) Rental Commitment – Minimum – 5th Year (#167)
QH Net of Rental Income
COMPUSTAT Chapter 11 – Reference 30 2/2000
Annual Footnotes (by Number)
Record 1 of IBM 360/370 General File Format Records 1 through 4 of Character ASCII File Format (cont.)
Footnote Slot #
Data Item Being Footnoted (Including Data Item #)
Footnote Code
Description
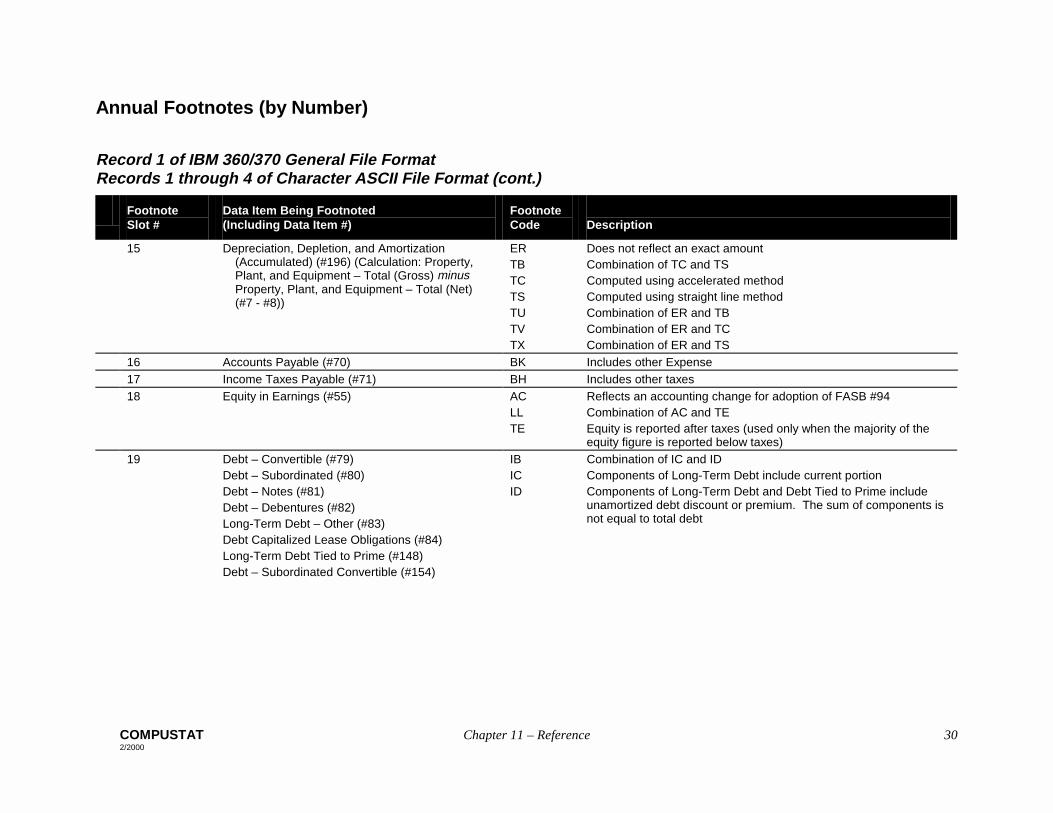
15 Depreciation, Depletion, and Amortization (Accumulated) (#196) (Calculation: Property, Plant, and Equipment – Total (Gross) minus Property, Plant, and Equipment – Total (Net) (#7 - #8))
ER Does not reflect an exact amount TB Combination of TC and TS TC Computed using accelerated method TS Computed using straight line method TU Combination of ER and TB TV Combination of ER and TC TX Combination of ER and TS
16 Accounts Payable (#70) BK Includes other Expense 17 Income Taxes Payable (#71) BH Includes other taxes 18 Equity in Earnings (#55) AC Reflects an accounting change for adoption of FASB #94
LL Combination of AC and TE TE Equity is reported after taxes (used only when the majority of the
equity figure is reported below taxes) 19 Debt – Convertible (#79)
Debt – Subordinated (#80) Debt – Notes (#81) Debt – Debentures (#82) Long-Term Debt – Other (#83) Debt Capitalized Lease Obligations (#84) Long-Term Debt Tied to Prime (#148) Debt – Subordinated Convertible (#154)
IB Combination of IC and ID IC Components of Long-Term Debt include current portion ID Components of Long-Term Debt and Debt Tied to Prime include
unamortized debt discount or premium. The sum of components is not equal to total debt

COMPUSTAT Chapter 11 – Reference 31 2/2000
Annual Footnotes (by Number)
Record 1 of IBM 360/370 General File Format Records 1 through 4 of Character ASCII File Format (cont.)
Footnote Slot #
Data Item Being Footnoted (Including Data Item #)
Footnote Code
Description
20 Long-Term Debt – Total (#9) ES Includes current portion of Long-Term Debt QT Reflects an accounting change to conform with FASB #21 (net of
discount or premium) (from October 1971 forward) 21 Blank 22 Labor and Related Expense (#42) XB Excludes employee benefits 23 Debt – Capitalized Lease Obligations (#84) AC Reflects an accounting change for retroactive adoption of FASB #13 24 Debt – Maturing in 2nd Year (#91)
Debt – Maturing in 3rd Year (#92) Debt – Maturing in 4th Year (#93) Debt – Maturing in 5th Year (#94)
EA Debt commitments include interest on capitalized leases
25 Employees (#29) IE Includes significant (10% or more) seasonal or part-time employees 26 Preferred Stock – Liquidating Value (#10)
Preferred Stock – Redemption Value (#56) ET Includes dividends in arrears
27 Assets – Total/Liabilities and Stockholders’ Equity – Total (#6)
GB Certain classifications such as Current Assets, Current Liabilities, and Debt Due in One Year are S&P estimates because the company reports an unclassified Balance Sheet
GL Combination of GB and TL TL Company in bankruptcy or liquidation
28 Common Stock (#85) JD Reflects adjustments for stock splits or dividends JN Recapitalization of Common Stock is reflected in both the
Adjustment Factor (Cumulative) Ex-Date and the Adjustment Factor (Cumulative) Payable Date
JP Recapitalization of Common Stock is not reflected in either the Adjustment Factor (Cumulative) Ex-Date or the Adjustment Factor (Cumulative) Payable Date
JX Combination of JD and JP JZ Combination of JD and JN LO Combination of JD and TO TO Reflects leveraged buyouts

COMPUSTAT Chapter 11 – Reference 32 2/2000
Annual Footnotes (by Number)
Record 1 of IBM 360/370 General File Format Records 1 through 4 of Character ASCII File Format (cont.)
Footnote Slot #
Data Item Being Footnoted (Including Data Item #)
Footnote Code
Description
29 Retained Earnings (#36) JD Reflects adjustments for stock splits or dividends 30 Foreign Currency Adjustment (Income Account)
(#150) AC Reflects an accounting change
31 Property, Plant, and Equipment – Total (Net) (#8) TG Company uses successful efforts method of accounting TH Company uses full cost method of accounting
32 Source Document Code (no data item number – 2-digit code)
00 No source document 03 Annual Report/Auditor’s Report 04 Uniform Statistical Report (USR) 05 10-K/20-F 09 Summary Annual Report 13 Annual Report + Quarterly Supplement 13 Annual Report + Statistical Supplement 14 10-K + Quarterly Supplement 14 10-K + Statistical Supplement 15 Annual Report + 10-K + Quarterly Supplement 15 Annual Report + 10-K + Statistical Supplement 37 Prospectus 43 Annual Report + USR
47 Annual Report + 10-K + P-1.2 + T2-A1 53 Annual Report + 10-K 54 10-K + USR 55 Annual Report + 10-K + USR 56 Annual Report + 10-K + USR + Statistical Supplement 88 Subsequent period source 99 No source document
1Supplemental reports for airlines

COMPUSTAT Chapter 11 – Reference 33 2/2000
Annual Footnotes (by Number)
Record 1 of IBM 360/370 General File Format Records 1 through 4 of Character ASCII File Format (cont.)
Footnote Slot #
Data Item Being Footnoted (Including Data Item #)
Footnote Code
Description
33 Month of Deletion (Industrial Annual Research File only – 2-digit code)
01 – 12 January – December
34 Year of Deletion (Industrial Annual Research File only – 2-digit code)
The last two digits of a given year appear in this slot
35 Reason for Deletion Code (Industrial Annual Research File only)
01 Acquisition or merger 02 Bankruptcy – Chapter 11 03 Liquidation – Chapter 7 04 Reverse acquisition (from 1983 forward) 05 No longer fits original file format (from 1978 forward) 06 Leveraged buyout 09 Now a private company 10 Other (no longer files with SEC)

COMPUSTAT Chapter 11 – Reference 34 2/2000
Annual Footnotes (by Number)
Record 2 of IBM 360/370 General File Format Records 5 through 8 of Character ASCII File Format
Footnote Slot #
Data Item Being Footnoted (Including Data Item #)
Footnote Code
Description
1 Operating Income After Depreciation (#178) AC Reflects an accounting change ER Does not reflect an exact amount LR Combination of AC and ER
2 Acquisition – Sales Contribution (#249 AE Combination of purchase method and pooling of interest method AI Pooling of interest method of acquisition AP Purchase method of acquisition
3 Debt – Senior Convertible (#188) IB Combination of IC and ID IC Components of Long-Term Debt include current portion ID Components of Long-Term Debt Tied to Prime include unamortized
debt discount or premium. The sum of components is not equal to total debt
4 Depreciation, Depletion, and Amortization (Accumulated) (#196)
ER Does not reflect an exact amount TB Combination of TC and TS TC Computed using accelerated method TS Computed using straight line method TU Combination of ER and TB TV Combination of ER and TC TX Combination of ER and TS
5 Capital Surplus (#210) JD Reflects adjustments for stock splits or dividends 6 Selling, General, and Administrative Expense
(#189) AC Reflects an accounting change
7 Pretax Income – Domestic (#272) Pretax Income – Foreign (#273)
JJ The sum of Pretax Income – Domestic and Pretax – Foreign differs from the sum of pretax income on the Income Statement
8 Pension – Prepaid/Accrued Cost (Overfunded) (#290)
IK Includes foreign plans as reported by the company or as calculated by S&P
COMPUSTAT Chapter 11 – Reference 35 2/2000
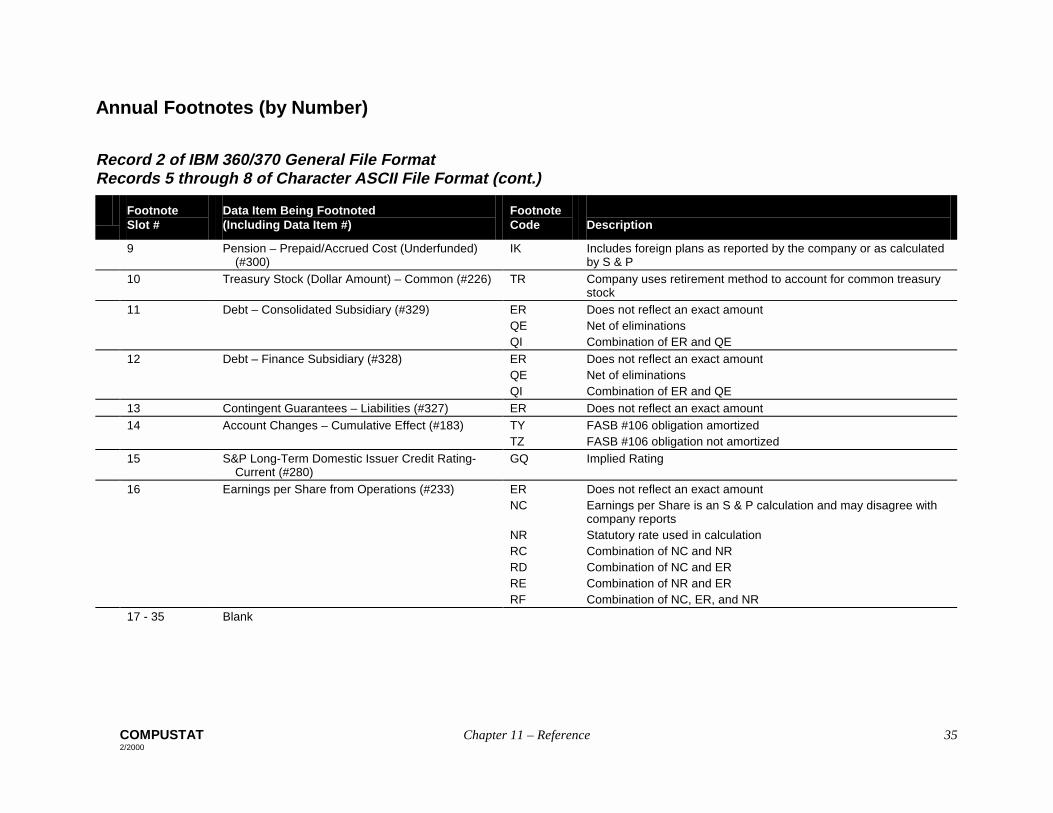
Annual Footnotes (by Number)
Record 2 of IBM 360/370 General File Format Records 5 through 8 of Character ASCII File Format (cont.)
Footnote Slot #
Data Item Being Footnoted (Including Data Item #)
Footnote Code
Description
9 Pension – Prepaid/Accrued Cost (Underfunded) (#300)
IK Includes foreign plans as reported by the company or as calculated by S & P
10 Treasury Stock (Dollar Amount) – Common (#226) TR Company uses retirement method to account for common treasury stock
11 Debt – Consolidated Subsidiary (#329) ER Does not reflect an exact amount QE Net of eliminations QI Combination of ER and QE
12 Debt – Finance Subsidiary (#328) ER Does not reflect an exact amount QE Net of eliminations QI Combination of ER and QE
13 Contingent Guarantees – Liabilities (#327) ER Does not reflect an exact amount 14 Account Changes – Cumulative Effect (#183) TY FASB #106 obligation amortized
TZ FASB #106 obligation not amortized 15 S&P Long-Term Domestic Issuer Credit Rating-
Current (#280) GQ Implied Rating
16 Earnings per Share from Operations (#233) ER Does not reflect an exact amount NC Earnings per Share is an S & P calculation and may disagree with
company reports NR Statutory rate used in calculation RC Combination of NC and NR RD Combination of NC and ER RE Combination of NR and ER RF Combination of NC, ER, and NR
17 - 35 Blank

COMPUSTAT Chapter 11 – Reference 36 2/2000
Quarterly Footnotes (by Number)
Footnote Slot #
Data Item Being Footnoted (Including Data Item #)
Footnote Code
Description
1 Sales (Net) (#2) AA Reflects a merger or acquisition AB Reflects a significant merger/acquisition whereby the effects on the
prior year’s sales constitute 50% or more of the reported sales for that year
AC Reflects an accounting change AR Combination of AA and AZ AS Combination of AA and AC AT Combination of AC and AZ AZ Excludes discontinued operations BA Includes excise taxes BB Includes other income/excludes some operating revenues BC Includes sales of leased departments BS Combination of BA and BB BT Combination of BB and BC CA Includes six months of a merger or acquisition CB Includes nine months of a merger or acquisition CC Includes 12 months of a merger or acquisition CE Excludes six months of discontinued operations CF Excludes nine months of discontinued operations CG Excludes 12 months of discontinued operations DB Some or all data is not available because of a fiscal year change DZ Some or all data is not available because the company has been in
operation less than one year or presents more than or less than 12 months of data in its statements. If presented, data represents either 9-11 months or 13-15 months of information
FA Combination of AA and BA FB Combination of AA and BB FC Combination of AA and BC FD Combination of AB and BA FE Combination of AB and BB
COMPUSTAT Chapter 11 – Reference 37 2/2000
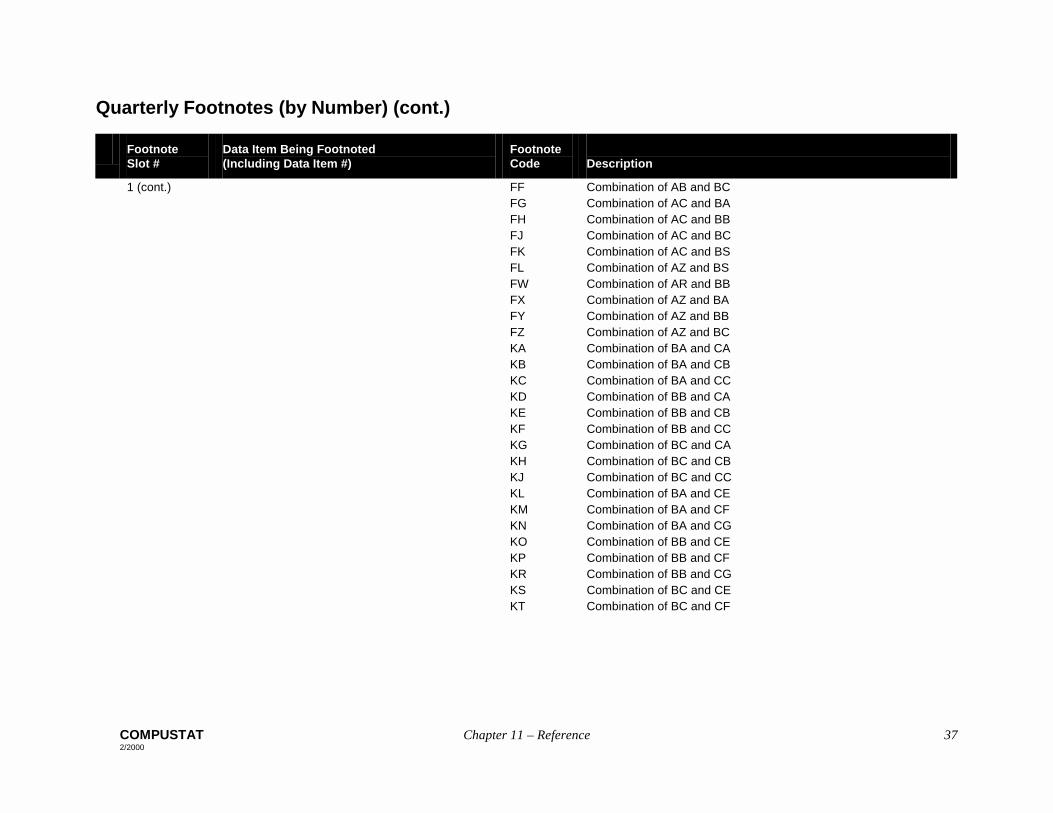
Quarterly Footnotes (by Number) (cont.)
Footnote Slot #
Data Item Being Footnoted (Including Data Item #)
Footnote Code
Description
1 (cont.) FF Combination of AB and BC FG Combination of AC and BA FH Combination of AC and BB FJ Combination of AC and BC FK Combination of AC and BS FL Combination of AZ and BS FW Combination of AR and BB FX Combination of AZ and BA FY Combination of AZ and BB FZ Combination of AZ and BC KA Combination of BA and CA KB Combination of BA and CB KC Combination of BA and CC KD Combination of BB and CA KE Combination of BB and CB KF Combination of BB and CC KG Combination of BC and CA KH Combination of BC and CB KJ Combination of BC and CC KL Combination of BA and CE KM Combination of BA and CF KN Combination of BA and CG KO Combination of BB and CE KP Combination of BB and CF KR Combination of BB and CG KS Combination of BC and CE KT Combination of BC and CF

COMPUSTAT Chapter 11 – Reference 38 2/2000
Quarterly Footnotes (by Number) (cont.)
Footnote Slot #
Data Item Being Footnoted (Including Data Item #)
Footnote Code
Description
1 (cont.) KU Combination of BC and CG 2 Depreciation and Amortization (#5) AC Reflects an accounting change
ER Does not reflect an exact amount LR Combination of AC and ER
3 Income Taxes – Total (#6) AC Reflects an accounting change BH Includes other taxes FP Combination of AC and BH
4 Income Before Extraordinary Items (#8) Net Income (Loss) (#69)
AC Reflects an accounting change AU Combination of AC and US, GP and US or GI and US GI Combination of AC and GP GP Some or all data is pro forma US Reports in U.S. Dollars
5 Income Before Extraordinary Items – Adjusted for Common Stock Equivalents (#10)
BZ Includes effects of preferred stock conversion and/or convertible debt
6 Earnings per Share (Basic) – Including Extraordinary Items (#11)
Earnings per Share (Basic) – Excluding Extraordinary Items (#19)
AC Adoption of FASB #128 NC Earnings per Share is an S&P calculation and may disagree with
company reports NL Combination of NC and QL NQ Combination of NC and QJ QJ Earnings per Share is based on the effect of common stock
equivalents QL Earnings per Share is net of all dilution as the company reports only
diluted earnings per share 7 Interest Expense (#22) AC Reflects an accounting change
GA S&P estimate (from 1973 forward, S&P no longer estimates interest expense)
QA Net of either interest income, interest capitalized, or both WA Combination of AC and QA
8 Cost of Goods Sold (#30) AC Reflects an accounting change BD Reduced by an amount of depreciation which should be allocated to
Selling, General, and Administrative Expense FI Combination of AC and BD
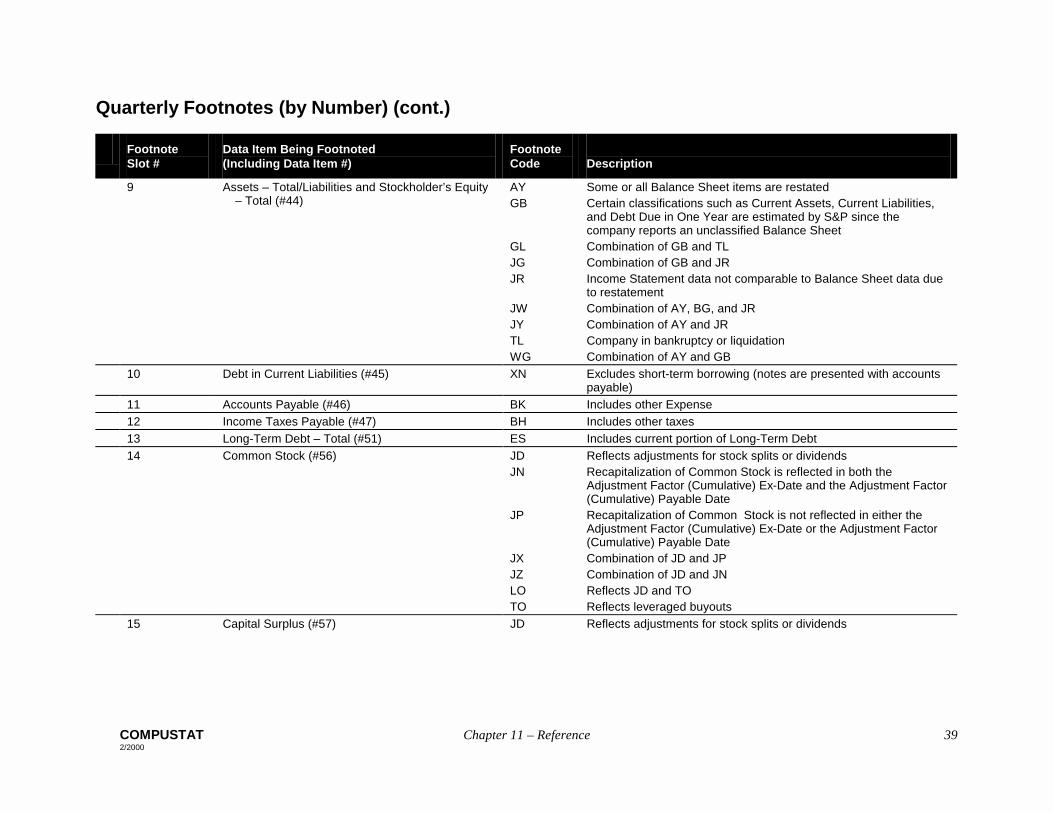
COMPUSTAT Chapter 11 – Reference 39 2/2000
Quarterly Footnotes (by Number) (cont.)
Footnote Slot #
Data Item Being Footnoted (Including Data Item #)
Footnote Code
Description
9 Assets – Total/Liabilities and Stockholder’s Equity – Total (#44)
AY Some or all Balance Sheet items are restated GB Certain classifications such as Current Assets, Current Liabilities,
and Debt Due in One Year are estimated by S&P since the company reports an unclassified Balance Sheet
GL Combination of GB and TL JG Combination of GB and JR JR Income Statement data not comparable to Balance Sheet data due
to restatement JW Combination of AY, BG, and JR JY Combination of AY and JR TL Company in bankruptcy or liquidation WG Combination of AY and GB
10 Debt in Current Liabilities (#45) XN Excludes short-term borrowing (notes are presented with accounts payable)
11 Accounts Payable (#46) BK Includes other Expense 12 Income Taxes Payable (#47) BH Includes other taxes 13 Long-Term Debt – Total (#51) ES Includes current portion of Long-Term Debt 14 Common Stock (#56) JD Reflects adjustments for stock splits or dividends
JN Recapitalization of Common Stock is reflected in both the Adjustment Factor (Cumulative) Ex-Date and the Adjustment Factor (Cumulative) Payable Date
JP Recapitalization of Common Stock is not reflected in either the Adjustment Factor (Cumulative) Ex-Date or the Adjustment Factor (Cumulative) Payable Date
JX Combination of JD and JP JZ Combination of JD and JN LO Reflects JD and TO TO Reflects leveraged buyouts
15 Capital Surplus (#57) JD Reflects adjustments for stock splits or dividends

COMPUSTAT Chapter 11 – Reference 40 2/2000
Quarterly Footnotes (by Number) (cont.)
Footnote Slot #
Data Item Being Footnoted (Including Data Item #)
Footnote Code
Description
16 Retained Earnings (#58) JD Reflects adjustments for stock splits or dividends 17 Foreign Currency Adjustment (Income Account)
(#34) AC Reflects an accounting change
18 Research and Development Expense (#4) BF Includes customer- or government-sponsored research and development
BG Includes engineering expense 19 Common Shares Outstanding (#61) JQ Report date differs from Balance Sheet date 20 Selling, General, and Administrative Expense (#1) AC Reflects an accounting change 21 Capital Expenditures (#90) QB Net of current year’s sales, retirements, and/or disposals of
Property, Plant, and Equipment 22 Depreciation, Depletion, and Amortization
(Accumulated) (Balance Sheet) (#41) ER Does not reflect an exact amount
23 Account Changes – Cumulative Effect (#117) TY FASB #106 transition obligation amortized TZ FASB #106 transition obligation not amortized
24 Earnings per Share from Operations (#177) ER Does not reflect an exact amount NC Earnings per Share is an S&P calculation and may disagree with
company reports NR Statutory rate used in calculation RC Combination of NC and NR RD Combination of NC and ER RE Combination of NR and ER RF Combination of NC, ER, and NR
25 - 60 Blank

COMPUSTAT Chapter 11 – Reference 41 2/2000
Quarterly Period Footnotes (by Number)
Footnote Slot #
Data Item Being Footnoted
Footnote Code
Description
1 Comparability Status AA Reflects a merger or acquisition AB Reflects a major merger resulting in the formation of a new
company AC Reflects an accounting change AR Combination of AA and AZ AS Combination of AA and AC AT Combination of AC and AZ DB Some or all data is not available because the company has been in
operation less than one year or less that one year of data is available
2 Company Status Alert TL Company in bankruptcy or liquidation TO Reflects leveraged buyouts
3 S&P Senior Debt Rating GQ Implied rating

COMPUSTAT Chapter 11 – Reference 42 2/2000
COMPUSTAT Business Information File Footnotes (by Number)
Footnote Slot #
Data Item Being Footnoted
Data Item Mnemonic
Footnote Code
Description
1 Sales – Net Footnote SALEF BA Includes excise taxes BB Includes other income BS Combination of BB and BA DB Some or all data is not available due to a fiscal year change (no
longer collected after February 7, 2000) DZ Less than one year of data (no longer collected after February 7,
2000) EN Includes inter-company/inter-departmental/inter-geographic sales HG Excludes other operating income HH Includes unconsolidated subsidiaries HK Unaudited data (no longer collected after February 7, 2000) UA Combination of EN and BA UB Combination of BB and EN YA Combination of HK and BB (no longer collected after February 7,
2000) YB Combination of HK and HG (no longer collected after February 7,
2000) YC Combination of HK and EN (no longer collected after February 7,
2000) YD Combination of HK and BA (no longer collected after February 7,
2000) YE Combination of HK and BS (no longer collected after February 7,
2000) YF Combination of HK and UA (no longer collected after February 7,
2000) YG Combination of HK and UB (no longer collected after February 7,
2000)

COMPUSTAT Chapter 11 – Reference 43 2/2000
COMPUSTAT Business Information File Footnotes (by Number) (cont.)
Footnote Slot #
Data Item Being Footnoted
Data Item Mnemonic
Footnote Code
Description
2 Operating Profit (Loss) Footnote
OPSF GP Some or all data is pro forma (no longer collected after February 7, 2000)
GR Combination of GP and MB (no longer collected after February 7, 2000)
GS Combination of GP and MA (no longer collected after February 7, 2000)
MA Net of income taxes (no longer collected after February 7, 2000) MB Pretax income (no longer collected after February 7, 2000)
3 Capital Expenditures Footnote
CAPXF CH Includes acquisition amounts (no longer collected after February 7, 2000)
QB Net of current year’s retirements and disposals (no longer collected after February 7, 2000)
4 Equity in Earnings Footnote
EQEARNF TE Equity reported after taxes (no longer collected after February 7, 2000)
5 Employees Footnote EMPF LD Includes significant seasonal or part-time employees (no longer collected after February 7, 2000)
6 Research and Development Footnote
RDF BG Includes engineering expense (no longer collected after February 7, 2000)

COMPUSTAT Chapter 11 – Reference 44 2/2000
COMPUSTAT Prices, Dividends, and Earnings (PDE) Footnotes (by Number)
Data Item Being Footnoted
Data Item Mnemonic
Footnote Code
Description
Dividends per Share by Ex-Date DIV GA S & P Estimate IP Includes declared dividends having an option to be paid in shares IQ Includes extra, special, or bonus dividend IR Includes a liquidating dividend NF Combination of IP and IQ NI Combination of GA and IQ NM Combination of GA and IP NN Combination of GA, IP, and IQ
Adjustment Factor (Raw) by Ex-Date RAWADJ JH Reflects a distribution of stock in another issue of the same company
JN Reflects recapitalization JP Reflects recapitalization. The adjustment factor does not reflect the
complete transaction. JS Reflects a distribution of stock from another issue of the same
company JT Combination of JH and JN or JP JV Combination of JH and JS
Comparability Status (Footnote Only) JI Stock distribution in an issue of another company, such as a spin-off
Issue Status Alert (Footnote Only) TT Trading has been suspended
COMPUSTAT Chapter 11 – Reference 45 2/2000
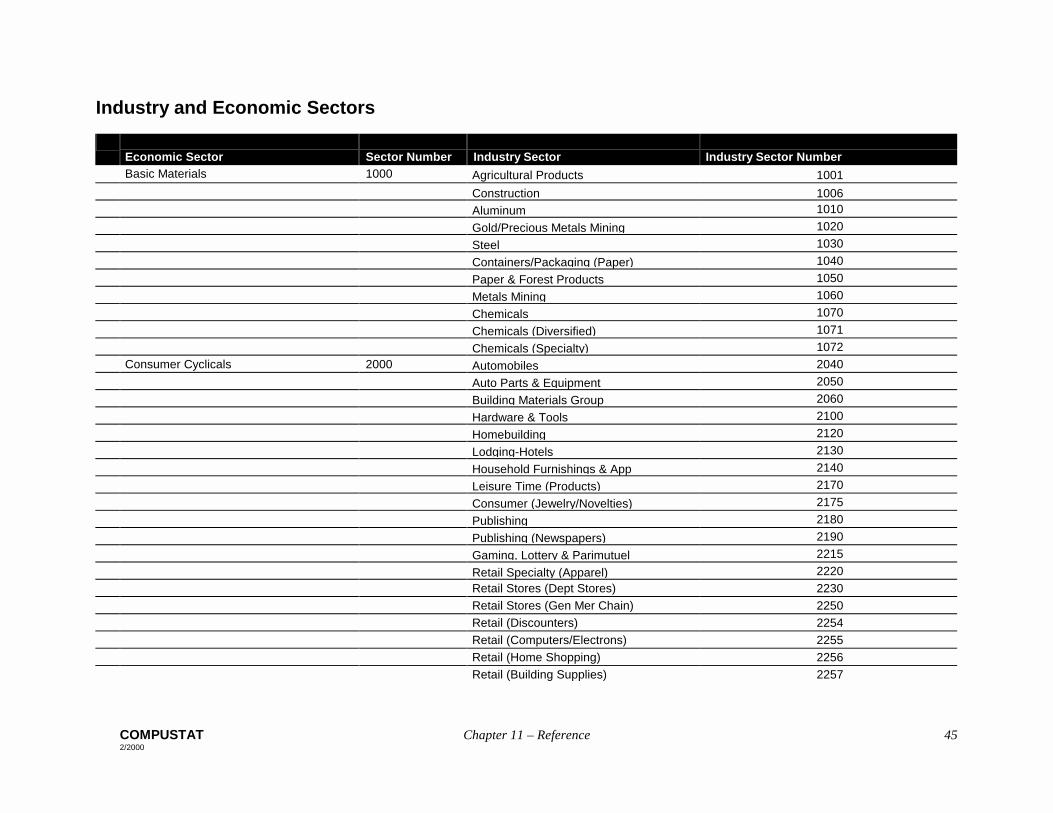
Industry and Economic Sectors
Economic Sector
Sector Number Industry Sector
Industry Sector Number
Basic Materials 1000 Agricultural Products 1001 Construction 1006 Aluminum 1010 Gold/Precious Metals Mining 1020 Steel 1030 Containers/Packaging (Paper) 1040 Paper & Forest Products 1050 Metals Mining 1060 Chemicals 1070 Chemicals (Diversified) 1071 Chemicals (Specialty) 1072 Consumer Cyclicals 2000 Automobiles 2040 Auto Parts & Equipment 2050 Building Materials Group 2060 Hardware & Tools 2100 Homebuilding 2120 Lodging-Hotels 2130 Household Furnishings & App 2140 Leisure Time (Products) 2170 Consumer (Jewelry/Novelties) 2175 Publishing 2180 Publishing (Newspapers) 2190 Gaming, Lottery & Parimutuel 2215 Retail Specialty (Apparel) 2220
Retail Stores (Dept Stores) 2230 Retail Stores (Gen Mer Chain) 2250 Retail (Discounters) 2254 Retail (Computers/Electrons) 2255 Retail (Home Shopping) 2256 Retail (Building Supplies) 2257

COMPUSTAT Chapter 11 – Reference 46 2/2000
Industry and Economic Sectors (cont.)
Economic Sector
Sector Number Industry Sector
Industry Sector Number
Retail (Specialty) 2260
Footwear 2270 Textiles (Apparel) 2290 Textiles (Home Furnishings) 2291 Textiles (Specialty) 2292 Services (Advertising/Mktg) 2400 Services (Commercial/Consum) 2410
Consumer Staples 3000 Beverages (Alcoholic) 3010 Beverages (Non-Alcoholic) 3020 Broadcasting-TV,Radio,Cable 3030 Distributors (Food & Health) 3035 Foods 3040 Tobacco 3050 Household Prod (Non-Durable) 3060 Housewares 3065 Personal Care 3070
Entertainment 3080 Specialty Printing 3100 Retail Stores (Drug Store) 3140 Services (Employment) 3200 Services (Facils/Enviromntl) 3210 Retail Stores (Food Chains) 3240 Restaurants 3250
Health Care 3500 Health Care (Diversified) 3510 Health Care (Drugs) 3520 Health Care (Drugs/Pharms) 3530 Health Care (Hospital Mgmt) 3540 Health Care (Long Term Care) 3550 Health Care (Managed Care) 3560 Health Care (Med Prods/Sups) 3570

COMPUSTAT Chapter 11 – Reference 47 2/2000
Industry and Economic Sectors (cont.)
Economic Sector
Sector Number Industry Sector
Industry Sector Number
Health Care (Special Serv) 3580
Biotechnology 3590
Energy 4000 Oil & Gas (Refining & Mktg) 4010 Oil & Gas (Drilling & Equip) 4020 Oil (Int’l Integrated) 4040 Oil (Domestic Integrated) 4050 Oil & Gas (Exploration/Prod) 4060
Financials 5000 Investment Banking/Brokerage 5010 Savings & Loan Companies 5020
Banks (Regional) 5025 Banks (Major Regional) 5030 Banks (Money Center) 5040 Consumer Finance 5060 Insurance Brokers 5070 Insurance (Life/Health) 5080 Insurance (Multi-Line) 5090 Insurance (Property/Casualty) 5100 Financial (Diversified) 5110 Investment Management 5150
Capital Goods 6000 Office Equipment & Supplies 6010 Trucks & Parts 6015 Aerospace/Defense 6020 Containers (Metal & Glass) 6060 Electrical Equipment 6070 Engineering & Construction 6071 Machinery (Diversified) 6100 Manufacturing (Diversified) 6110 Manufacturing (Specialized) 6111 Metal Fabricators 6115 Waste Management 6120

COMPUSTAT Chapter 11 – Reference 48 2/2000
Industry and Economic Sectors (cont.)
Economic Sector
Sector Number Industry Sector
Industry Sector Number
Technology 8000 Communications Equipment 8030
Computers (Software/Service) 8040 Photography/Imaging 8045 Computer (Hardware) 8050 Computers (Networking) 8051 Computers (Peripherals) 8052 Electronics (Component Dist) 8053 Electronics (Instrument) 8070 Electronics (Semiconductors) 8080 Electronics (Defense) 8090 Equipment (Semiconductor) 8100 Services (Computer Systems) 8200 Services (Data Processing) 8300
Communication Services 8600 Cellular/Wireless Telecomms 8610 Telephone 8620
Telephone Long Distance 8630
Utilities 9000 Electric Companies 9010 Natural Gas (Distr-Pipe Line) 9020 Water Utilities 9040 Power Producers (Independ) 9100
Transportation 9500 Shipping 9500 Air Freight 9510 Airlines 9520 Railroads 9530 Truckers 9540
COMPUSTAT Chapter 11 – Reference 49 2/2000
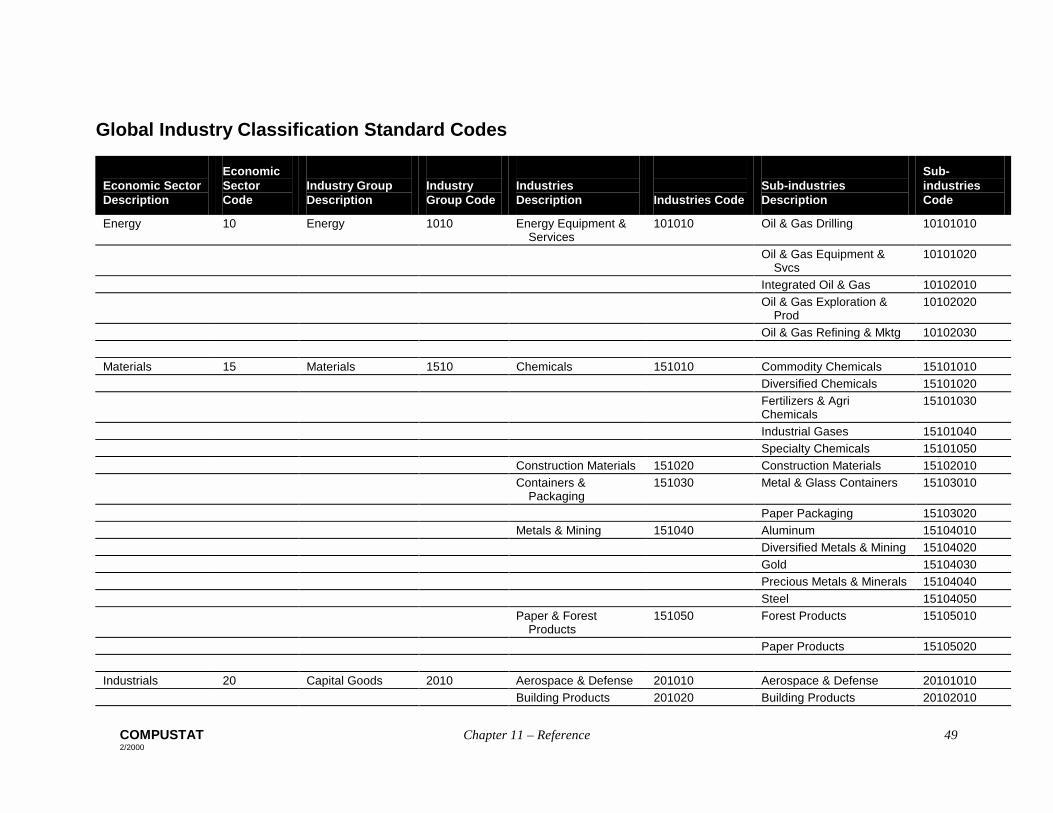
Global Industry Classification Standard Codes
Economic Sector Description
Economic Sector Code
Industry Group Description
Industry Group Code
Industries Description
Industries Code
Sub-industries Description
Sub-industries Code
Energy 10 Energy 1010 Energy Equipment & Services
101010 Oil & Gas Drilling 10101010
Oil & Gas Equipment & Svcs
10101020
Integrated Oil & Gas 10102010 Oil & Gas Exploration &
Prod 10102020
Oil & Gas Refining & Mktg 10102030 Materials 15 Materials 1510 Chemicals 151010 Commodity Chemicals 15101010 Diversified Chemicals 15101020 Fertilizers & Agri
Chemicals 15101030
Industrial Gases 15101040 Specialty Chemicals 15101050 Construction Materials 151020 Construction Materials 15102010 Containers &
Packaging 151030 Metal & Glass Containers 15103010
Paper Packaging 15103020 Metals & Mining 151040 Aluminum 15104010 Diversified Metals & Mining 15104020 Gold 15104030 Precious Metals & Minerals 15104040 Steel 15104050 Paper & Forest
Products 151050 Forest Products 15105010
Paper Products 15105020 Industrials 20 Capital Goods 2010 Aerospace & Defense 201010 Aerospace & Defense 20101010 Building Products 201020 Building Products 20102010

COMPUSTAT Chapter 11 – Reference 50 2/2000
Global Industry Classification Standard Codes (cont.)
Economic Sector Description
Economic Sector Code
Industry Group Description
Industry Group Code
Industries Description
Industries Code
Sub-industries Description
Sub-industries Code
Industrials (cont.) 20 Capital Goods (cont.)
2010 Construction & Engineering
201030 Construction & Engineering 20103010
Electrical Equipment 201040 Electrical Components & Equip
20104010
Heavy Electrical Equipment 20104020 Industrial
Conglomerates 201050 Industrial Conglomerates 20105010
Machinery 201060 Construction & Farm Mach 20106010 Industrial Machinery 20106020 Trading Companies &
Distrib 201070 Trading Companies &
Distrib 20107010
Commercial Svcs & Supplies
2020 Commercial Svcs & Supplies
202010 Commercial Printing 20201010
Data Processing Services 20201020 Diversified Commercial
Svcs 20201030
Employment Services 20201040 Environmental Services 20201050 Office Services & Supplies 20201060 Transportation 2030 Air Freight & Couriers 203010 Air Freight & Couriers 20301010 Airlines 203020 Airlines 20302010 Marine 203030 Marine 20303010 Road & Rail 203040 Railroads 20304010 Trucking 20304020 Trans Infrastructure 203050 Airport Services 20305010 Highways & Railtracks 20305020 Marine Ports & Services 20305030

COMPUSTAT Chapter 11 – Reference 51 2/2000
Global Industry Classification Standard Codes (cont.)
Economic Sector Description
Economic Sector Code
Industry Group Description
Industry Group Code
Industries Description
Industries Code
Sub-industries Description
Sub-industries Code
Consumer Discretionary
25 Automobiles & Components
2510 Auto Components 251010 Auto Parts & Equipment 25101010
Tires & Rubber 25101020 Automobiles 251020 Automobile Manufacturers 25102010 Motorcycle Manufacturers 25102020 Consumer
Durables & Apparel 2520 Household Durables 252010 Consumer Electronics 25201010
Home Furnishings 25201020 Homebuildings 25201030 Household Appliances 25201040 Housewares & Specialties 25201050 Leisure Equipment &
Products 252020 Leisure Products 25202010
Photographic Products 25202020 Textiles & Apparel 252030 Apparel & Accessories 25203010 Footwear 25203020 Textiles 25203030 Hotels Restaurants
& Leisure 2530 Hotels Restaurants &
Leisure 253010 Casinos & Gaming 25301010
Hotels 25301020 Leisure Facilities 25301030 Restaurants 25301040 Media 2540 Media 254010 Advertising 25401010 Broadcasting & Cable TV 25401020 Movies & Entertainment 25401030 Publishing & Printing 25401040 Retailing 2550 Distributors 255010 Distributors 25501010 Internet & Catalog
Retail 255020 Catalog Retail 25502010
Internet Retail 25502020

COMPUSTAT Chapter 11 – Reference 52 2/2000
Global Industry Classification Standard Codes (cont.)
Economic Sector Description
Economic Sector Code
Industry Group Description
Industry Group Code
Industries Description
Industries Code
Sub-industries Description
Sub-industries Code
Consumer Discretionary (cont.)
25 Retailing (cont.) 2550 Multiline Retail 255030 Department Stores 25503010
General Merchandise Stores
25503020
Specialty Retail 255040 Apparel Retail 25504010 Computer & Electronics Rtl 25504020 Home Improvement Retail 25504030 Specialty Stores 25504040 Consumer Staples 30 Food & Drug
Retailing 3010 Food & Drug Retailing 301010 Drug Retail 30101010
Food Distributors 30101020 Food Retail 30101030 Food Beverage &
Tobacco 3020 Beverages 302010 Brewers 30201010
Distillers & Vintners 30201020 Soft Drinks 30201030 Food Products 302020 Agricultural Products 30202010 Meat Poultry & Fish 30202020 Packaged Foods 30202030 Tobacco 302030 Tobacco 30203010 Household &
Personal Prods 3030 Household Products 303010 Household Products 30301010
Personal Products 303020 Personal Products 30302010

COMPUSTAT Chapter 11 – Reference 53 2/2000
Global Industry Classification Standard Codes (cont.)
Economic Sector Description
Economic Sector Code
Industry Group Description
Industry Group Code
Industries Description
Industries Code
Sub-industries Description
Sub-industries Code
Health Care 35 Health Care Equipment & Svcs
3510 Health Care Equipment & Supp
351010 Health Care Equipment 35101010
Health Care Supplies 35101020 Health Care Providers
& Svcs 351020 Health Care Distrib & Svcs 35102010
Health Care Facilities 35102020 Managed Health Care 35102030 Pharmaceuticals &
Biotech 3520 Biotechnology 352010 Biotechnology 35201010
Pharmaceuticals 352020 Pharmaceuticals 35202010 Financials 40 Banks 4010 Banks 401010 Banks 40101010 Diversified
Financials 4020 Diversified Financials 402010 Consumer Finance 40201010
Diversified Financial Svcs 40201020 Multi-Sector Holdings 40201030 Insurance 4030 Insurance 403010 Insurance Brokers 40301010 Life & Health Insurance 40301020 Multi-line Insurance 40301030 Property & Casualty Insur 40301040 Reinsurance 40301050 Real Estate 4040 Real Estate 404010 Real Estate Investment
Trust 40401010
Information
Technology 45 Software &
Services 4510 Internet Software &
Services 451010 Internet Software &
Services 45101010
IT Consulting & Services
451020 IT Consulting & Services 45102010
Software 451030 Application Software 45103010 Systems Software 45103020 Technology
Hardware & Equip 4520 Communications
Equipment 452010 Networking Equipment 45201010

COMPUSTAT Chapter 11 – Reference 54 2/2000
Global Industry Classification Standard Codes (cont.)
Economic Sector Description
Economic Sector Code
Industry Group Description
Industry Group Code
Industries Description
Industries Code
Sub-industries Description
Sub-industries Code
Information Technology (cont.)
45 Technology Hardware & Equip (cont.)
4520 Communications Equipment (cont.)
452010 Telecommunications Equipment
45201020
Computers & Peripherals
452020 Computer Hardware 45202010
Computer Storage & Periphs
45202020
Electronic Equip & Instru
452030 Electronic Equip & Instr 45203010
Office Electronics 452040 Office Electronics 45204010 Semiconductor Equip
& Prods 452050 Semiconductor Equipment 45205010
Semiconductors 45205020 Telecommunication
Services 50 Telecommunication
Services 5010 Diversified Telecomm
Svcs 501010 Alternative Carriers 50101010
Integrated Telecommunication
50101020
Wireless Telecomm Svcs
501020 Wireless Telecomm Svcs 50102010
Utilities 55 Utilities 5510 Electric Utilities 551010 Electric Utilities 55101010 Gas Utilities 551020 Gas Utilities 55102010 Multi-Utilities 551030 Multi-Utilities 55103010 Water Utilities 551040 Water Utilities 55104010