compustat tools for transfer pricing analysis … · compustat tools for transfer pricing analysis...
TRANSCRIPT

COMPUSTAT TOOLSFOR TRANSFER PRICING ANALYSISDEVELOPED BY THE APA PROGRAM
March 5, 1998
CONTENTS
1. Introduction and Summary . . . . . . . . . . . . . . . . . . . . 22. Installation . . . . . . . . . . . . . . . . . . . . . . . . . . . . . . . . 53. Running TPTOOL . . . . . . . . . . . . . . . . . . . . . . . . . . 64. Reading the Printout . . . . . . . . . . . . . . . . . . . . . . . . 115. Asset Intensity Adjustment Formulas . . . . . . . . . . . 146. Overall Logic . . . . . . . . . . . . . . . . . . . . . . . . . . . . . 167. Year Alignment Calculations . . . . . . . . . . . . . . . . . . 218. Interquartile Range Calculations . . . . . . . . . . . . . . . 23
APPENDIX A: Report TemplateAPPENDIX B: Sample Printout of ResultsAPPENDIX C: Text File of Concept Definitions
1The development team was led by Robert Weissler and included Dave Wallenstein, DonnaMcComber, and Tracy Gomes. The team received assistance from Dwight Toscano, a ComputerSpecialist with the Office of the Associate Chief Counsel (International); and from Howard Bernheim,the Compustat sales representative. Beta testing is in progress by the APA Program and one or moreIRS economists in the field.
If you have questions about the software or documentation, please contact Robert Weissler attelephone 202-917-3216 or 202-874-4360, or at fax 202-874-3990.
2The APA Program developed and tested the software on PCPlus version 6.2.
3A modified version of TPTOOL, in file TPTOOLQU.RPT, is also provided. See the lastbullet below.
- 2 -
1. Introduction and Summary
This document describes software tools for transfer pricing analysis developed by the AdvancePricing Agreement (APA) Program within the IRS’ Office of Associate Chief Counsel (International).1 The software runs on PCPlus, a service of Compustat (a subsidiary of Standard & Poors).2 Thesoftware consists of: (1) a PCPlus report named TPTOOL (in file TPTOOL.RPT),3 and (2) a set ofuser-defined PCPlus “concepts” (akin to macros in a spreadsheet or word processing program),named TPCONC (in file TPCONC.TXT), which are used by TPTOOL. TPTOOL will computeprofit level indicators (PLIs) for a set of comparable firms, both before and after asset intensityadjustments designed to put the comparable firms on the same footing as the taxpayer or tested party. Based on user-supplied information, TPTOOL offers the following capabilities:
C Handles three different types of case/PLI. The first, called “inbound”, is for a testedparty that purchases from a related party. It is typically used for foreign-owned U.S.distributors. The PLI used is operating margin (operating profit divided by sales). Thesecond case, called “maquiladora,” is used for maquiladoras. The PLI used isoperating profit divided by total costs. The third case, called “outbound”, is used for atested party, other than a maquiladora, that sells to a related party. The PLI used isoperating profit divided by total costs, as for maquiladoras, but the asset intensityadjustments performed are somewhat different.
C Calculates PLIs for any 5 consecutive years.
C Aligns the comparable firms’ years so that they always have at least six months’ overlapwith the tested party’s taxable year. (Compustat stated that PCPlus will not do thisautomatically. The software includes special programming to accomplish this

4One could easily edit TPTOOL to print the companies in another order, such as alphabeticallyby company name.
5Unfortunately, the report cannot be modified to do “data pooling,” in which each year’sobservation of each comparable firm is considered separately, and all such observations are put in a
- 3 -
alignment.)
C In calculating asset intensity adjustments, optionally performs an adjustment for “otheroperating assets,” defined as plant, property, and equipment.
C In doing asset intensity adjustments, optionally uses either start-of-year or end-of-yearfinancial ratios when the average of both is not available.
C In computing both unadjusted and adjusted PLIs, corrects for LIFO reserves, andoptionally makes certain assumptions when certain LIFO reserve data are unavailable.
C Computes the weighted average unadjusted and adjusted PLI for the last n of theseyears, where n can be from 1 to 5. Requires that a comparable firm, to be consideredto have an available average, must have data available for at least m of the last n years,where m can be from 1 to n. Ranks the firms by the weighted average unadjusted oradjusted PLI, and prints the firms in rank order.4
C Using the ranking just mentioned, computes the IRS-defined median and interquartilerange. (Compustat stated that PCPlus would not compute the IRS-defined interquartilerange. The software includes special programming to perform this calculation.) However, this feature causes TPTOOL to start up slowly: Initially calling up the reporttakes about ten minutes on the APA Program’s PC (a 133 MHz Pentium with 32megabytes of RAM), although once loaded the report runs without undue delay. Toavoid the slow calling up, one can make a modified copy of the report by deleting thelast three columns from the report template. The modified report, which does notcompute interquartile ranges and medians, takes about one minute to call up on theAPA Program’s PC. The modified report has been provided to you in a file calledTPTOOLQU.RPT, which stands for “TPTOOL Quick.”
It is hoped that this software, without modification, will be useful and easy to use for transferpricing analysis. However, the software was written so as to facilitate modification by the user to suitspecial needs. Possible modifications would be to use different PLIs; to use different formulas for assetintensity adjustments (e.g., to substitute a different definition of “other operating assets”); and to usedifferent algorithms for how to proceed when certain data are unavailable. Some possible modificationsare discussed below.5 (Of course, one should keep an unmodified archival copy of the report and
common pool.
- 4 -
concepts files.)
This document assumes a familiarity with transfer pricing, and in particular with the concepts ofasset intensity adjustments and interquartile range. It also assumes familiarity with Compustat’s PCPlus. (PCPlus questions can be answered by the user’s sales representative or by Compustat’s help line at 1-800-523-4534.)
Section 2 describes how to install TPTOOL and TPCONC (in case they are not alreadyinstalled on the PC you use to run Compustat’s PCPlus). Sections 3 and 4 explain respectively how torun TPTOOL and how to interpret the printout from a run. Reading sections 1-4 will be sufficient ifyou only want to run the software without modification. Section 5 gives the asset intensity adjustmentformulas used. Section 6 describes the software’s overall logic and explains the meaning of most of theconcepts in TPCONC; this section is especially useful if you contemplate modifying the software. Sections 7 and 8 explain in detail the logic behind the year alignment and interquartile range calculationsrespectively. Read these only if they interest you or if you suspect that these calculations are not beingdone correctly. Appendices give the TPTOOL report template; a sample printout of results; and aprintout of TPCONC, the concepts text file.
The usefulness of this software is somewhat limited by limitations or problems with Compustat’sPCPlus software system. First, long waits to call up the report may make it preferable to use amodified version of the report that omits interquartile range calculations (see the last bullet above). Second, slowness and possible other system limitations prevented the APA Program’s softwaredevelopment team from including calculations to perform Tukey filters (see section 6(E) below). Third,an apparent limitation in the capacity to import concept definitions makes installing this software morecumbersome (see section 2 below).
Fourth, the APA Program’s software development team has demonstrated a system bug inwhich the same report can be run twice with different answers produced. This bug has beenreproduced by our Compustat sales representative on his own PC. The problem has occurred withTPTOOL as well as a much simpler report written and used by the team. This could call into questionresults from TPTOOL, as well as results from other Compustat reports. Compustat has not yetprovided an analysis of this problem. The tentative analysis by the APA Program’s softwaredevelopment team is as follows.
So far, the problem has only shown up with reports that have one or more "defined names,"which are variables whose value the user enters just before the report is run. The problem occurs whenthe same report is run twice, with different values for one or more variables. Sometimes the printout ofresults from the second run incorrectly reflects the values input for the first run. (If one instead runs the

- 5 -
report with the second set of values immediately after starting up the Compustat PCPlus program, onegets the correct answers in the printout.) This error pattern suggests a problem with "memory caching,"by which to save time a computer will save values calculated or retrieved to use again when needed,rather than having to calculate or find them again. Memory caching is as common to computers asbreathing is to humans, and almost as necessary. However, a computer also needs to realize when anold value is no longer correct, in which case a new value must be calculated or retrieved. The teamhypothesizes that the problem at hand arises because the Compustat software in some cases does notrealize this.
The reports most typically run by IRS personnel have no "defined names," so perhaps theproblem at hand would not affect them. However, the Compustat software does memory caching insome contexts even with reports that have no defined names, so perhaps a memory caching problemcould surface then too. The most aggressive approach to preventing the problem from occurring mightbe to start up Compustat's PCPlus program, run one report once, shut down PCPlus, start up PCPlusagain, run one report once, shut down PCPlus, etc.
2. Installation
To install the tools on your computer (assumed already to be running Compustat’s PCPlus),you need a diskette with two files: TPTOOL.RPT, and TPCONC.TXT.
First, import the concepts from TPCONC.TXT as follows. At the PCPlus main menu, choose“File”, “Import”. In the dialog box, specify “concepts” as the type of item to be imported; specify thefile TPCONC.TXT on the appropriate drive; and click on “Import.”
Two of the concepts, PLIAVG and ADJPLIAVG, apparently have definitions that are too longfor PCPlus to import correctly. PCPlus generates the following two error messages during theimporting process:
(AWEIGHTYA5+ADJPLIYA5-ADJPLIYA5,0),0) - Cannot add a concept that hasno formulas.
]+SALE[-10] - Cannot add a concept that has no formula.
PCPlus does import the two concepts mentioned, but truncates their definitions, leaving out the last halfline or so of the definitions. You will need first to find the full definitions in Appendix C, and then to editthese two concepts to restore the missing end of the definition. To edit a concept, from the mainPCPlus screen, click on “Databases,” then on “Concept”. Type in the concept name (e.g., PLIAVG)on the top line (the line labeled “CONCEPT”), and hit “Enter.” The concept’s definition will appear. Go to the end of the definition (scrolling if necessary) and add the missing characters. Click the

6Experienced PCPlus users may notice that this is contrary to normal practice with PCPlus. Normally, when one runs a report using Absolute Years, one would choose the PCPlus-defined “fiscal
- 6 -
“Accept” box, and answer that you do wish to overwrite the old definition. It may take a minute for thecomputer to store the new definition.
If you have any preexisting user-defined concepts with the same names as concepts inTPCONC.TXT, PCPlus will alert you to the problem during the importing process. One approach isto tell PCPlus not to overwrite those concepts; note which ones they are; rename the preexistingconcepts; and reimport the concepts from TPCONC.TXT. (The concepts in TPCONC.TXT weregiven somewhat unusual names in the hope of avoiding such conflicts.)
Next, copy file TPTOOL.RPT (and, if desired, TPTOOLQU.RPT, the modified version thatloads more quickly) into the appropriate directory on your hard drive, normally spws\csrpts. Thereport will then be ready to run just like any other PCPlus report.
It is expected that successive versions of the software will be released. The version number isgiven in the title line of TPTOOL.RPT, which shows up in the report template and in the printout ofresults. The concept TPVERSION in file TPCONC.TXT also gives the version number.
3. Running TPTOOL
Before running TPTOOL, build a set of comparable firms and save the set as a file in PCPlus’default set directory, normally spws\cssets. The filename must have the extension “.set”. Also,compute the tested party’s financial ratios called for below.
When you start up TPTOOL, follow the following steps:
(1) You will be asked to enter companies or a set of companies. Enter the set youhave saved, in the following format. If the set is called NAME.SET, type in$NAME.
(2) Select the period as follows:
(a) Select Absolute Years (not Calendar Years or Relative Years).
(b) Choose the year in which the tested party’s last fiscal year underconsideration ends. For example, if the tested party’s last year ends inany month of 1996, choose “Y96".6

year” in which the tested party’s year ends. This departure from normal practice is necessary becausethe software does its own year alignment calculations, as de scribed in sections 6(C) and 7.
7This discussion assumes that you are performing an asset intensity adjustment that adjusts thecomparable firms to bring their asset levels equal to those of the tested party. An alternative form ofasset intensity adjustment involves adjusting both the tested party and the comparable firms to bringtheir asset levels to zero. This “zero asset” adjustment is more complex but is considered by someeconomists to be more accurate in some circumstances. If you wish to do a zero asset adjustment,enter zeroes for all of the financial ratios discussed in the text. (But do not enter zeroes for the interestrates.) You will then need to compute the proper adjustments for the tested party (this software will notdo that for you).
8One can easily edit TPTOOL to “hide” undesired columns from the printout.
- 7 -
(c) Click on “Accept.”
(3) Click on “OK”.
You will then be prompted to enter a series of “defined names,” data that the program uses asinput. Entering this data takes a few minutes. If you plan to make similar runs in the future, it is smart tosave a copy of the report (give it your own name) after you have entered the data and run the report t. When you call the report up in the future, the same data will be there; you will need only to make anychanges desired. It is also smart, after running the report, to print the report template itself (in additionto the results discussed in section 4), as a complete record of the data you used.
The defined names include several of the tested party’s financial ratios for the five yearsinvolved, which are used to compute asset intensity adjustments to PLIs. The defined names use theconvention that a “1" at the end of the name refers to the most recent year, a “2" the previous year, andso on up to “5". (The concept names discussed in section 6 use the same convention.) However, whenreferring directly to years, a different convention is used: 0 refers to the most recent year, -4 to theearliest year. The numerators of the ratios are, respectively (1) average accounts payable, (2) averagetrade accounts receivable, (3) average inventory, and (4) average other operating assets (defined asplant, property, and equipment). The denominators are sales for inbound cases, total costs formaquiladora cases; and cost of goods sold for outbound cases. To compute these ratios, the testedparty must be put on a FIFO basis for inventory accounting.7
You do not necessarily have to enter the ratios for all five years. For example, if you areinterested only in a three-year period, enter the ratios for years 0, -1, and -2. The printout will showthat asset-intensity-adjusted PLIs for the other years are unavailable. Or you could enter no ratios atall; while no adjusted PLIs would be computed, the printout would still show unadjusted PLIs.8
9Other definitions of other operating assets are possible. To use a different definition, one can(1) redefine concept OOA, now defined as PPENT, to use the new definition for the comparable firms,and (2) use the new definition in computing the tested party’s financial ratios.
- 8 -
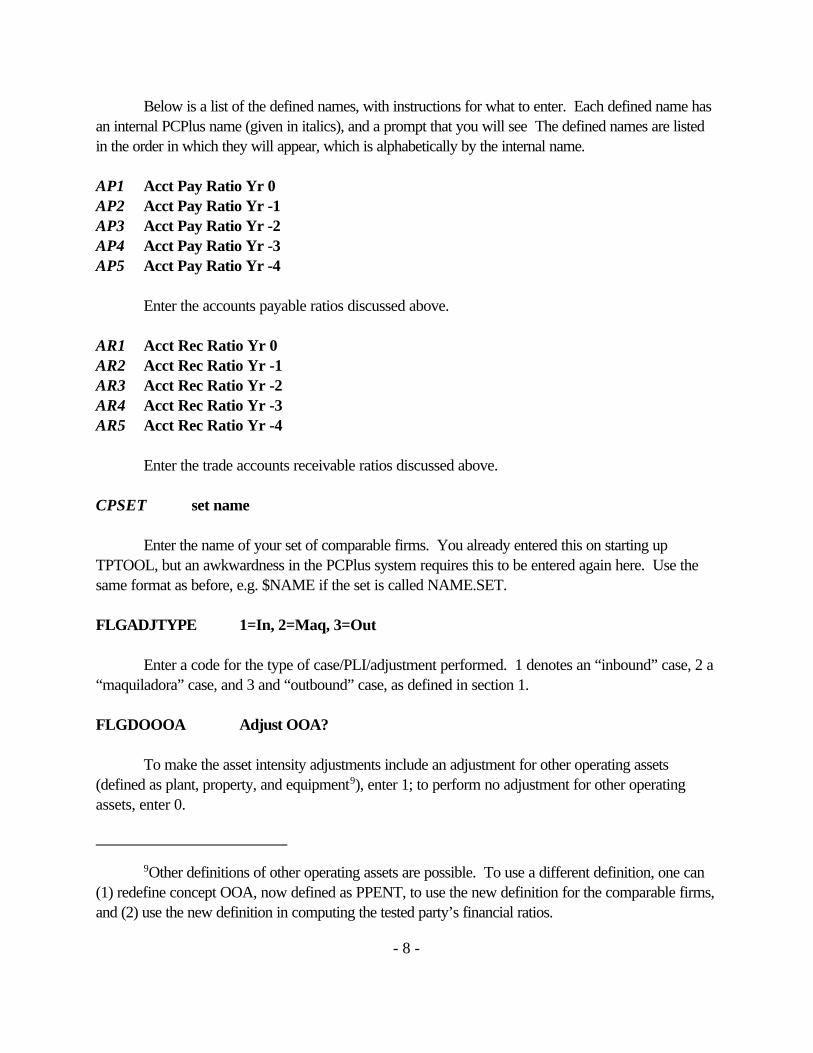
Below is a list of the defined names, with instructions for what to enter. Each defined name hasan internal PCPlus name (given in italics), and a prompt that you will see The defined names are listedin the order in which they will appear, which is alphabetically by the internal name.
AP1 Acct Pay Ratio Yr 0AP2 Acct Pay Ratio Yr -1AP3 Acct Pay Ratio Yr -2AP4 Acct Pay Ratio Yr -3AP5 Acct Pay Ratio Yr -4
Enter the accounts payable ratios discussed above.
AR1 Acct Rec Ratio Yr 0AR2 Acct Rec Ratio Yr -1AR3 Acct Rec Ratio Yr -2AR4 Acct Rec Ratio Yr -3AR5 Acct Rec Ratio Yr -4
Enter the trade accounts receivable ratios discussed above.
CPSET set name
Enter the name of your set of comparable firms. You already entered this on starting upTPTOOL, but an awkwardness in the PCPlus system requires this to be entered again here. Use thesame format as before, e.g. $NAME if the set is called NAME.SET.
FLGADJTYPE 1=In, 2=Maq, 3=Out
Enter a code for the type of case/PLI/adjustment performed. 1 denotes an “inbound” case, 2 a“maquiladora” case, and 3 and “outbound” case, as defined in section 1.
FLGDOOOA Adjust OOA?
To make the asset intensity adjustments include an adjustment for other operating assets(defined as plant, property, and equipment9), enter 1; to perform no adjustment for other operatingassets, enter 0.

10The decision logic is embodied in the concepts APAV, RECTRAV, INVTAV, andOOAAV. One could use different logic by changing the definitions of those concepts. (For example,one might want in some cases to use total accounts receivable if trade accounts receivable isunavailable.)
11The decision logic is embodied in the concept LIFRDIF. One could change the logic byredefining this concept.
- 9 -
FLGFDGDAT Make certain assumptions when certain financial data ratios areunavailable
Enter 1 to make the assumption described here; enter 0 to not do so. Normally, for acomparable firm, the average level of accounts payable, accounts receivable, inventory, and otheroperating assets is computed as the average of the starting and ending values for the year. Theassumption in question is that, if only the starting or the ending value is available for a particular year,that value will be used as a proxy for the unavailable average. In such cases, without such anassumption, data for that year needed to perform asset intensity adjustments will be consideredunavailable, so no adjusted PLI will be computed.10
FLGFDGLIF Make certain assumptions when certain LIFO reserve data areunavailable?
Enter 1 to make certain assumptions, as described, if certain data on LIFO reserves areunavailable; enter 0 to not make these assumptions. (This should only affect companies that do LIFOaccounting for inventory. For companies that do FIFO accounting for inventory, the lifo reservesshould all be zero.)
Normally, accountants adjust cost of goods sold (COGS) by subtracting the differencebetween the year-end LIFO reserve and the year-beginning LIFO reserve. TPTOOL performs thisadjustment in computing all PLIs (both with and without asset intensity adjustments). If FLGFDGLIF isset to 1, then if this difference cannot be computed because the data are unavailable, the difference willbe assumed to be zero. If FLGFDGLIF is set to 0 and the needed data are not available, no PLI(adjusted or unadjusted) for that year can be computed for that company.11
Normally, the software computes the average LIFO reserve for a given year as the average ofthe year-end LIFO reserve and the year-beginning LIFO reserve. The average LIFO reserve is usedto adjust the average inventory level, which is needed to make asset intensity adjustments. IfFLGFDGLIF equals 1, then, if this average is not available, then (1) either the year-end or year-beginning figure will be used by itself, if available, and (2) if neither the year-end or year-beginningLIFO reserve is available, then the average LIFO reserve will be assumed to be zero. If FLGFDGLIFis set to 0 and the needed data are not available, asset intensity adjustments cannot be performed for

12The decision logic is embodied in concept LIFRAV. To change the logic, one could redefinethis concept.
- 10 -
that year for that company, so no adjusted PLI can be computed.12
FLGRANK Rnk 0=un, 1=adj
Enter 0 to rank companies by the weighted average unadjusted PLI; enter 1 to rank companiesby the weighted average adjusted PLI. Interquartile ranges will be determined for either unadjusted oradjusted PLIs according to this flag.
INT1 Int Rate, Year 0INT2 Int Rate, Year -1INT3 Int Rate, Year -2 INT4 Int Rate, Year -3INT5 Int Rate, Year -4
Enter the interest rates to be used for the asset intensity adjustments. To be most accurate, therate should probably correspond to the precise taxable years of the tested party.
INVT1 Inventory Ratio Yr 0INVT2 Inventory Ratio Yr-1INVT3 Inventory Ratio Yr-2INVT4 Inventory Ratio Yr-3INVT5 Inventory Ratio Yr-4
Enter the inventory ratios discussed above.
OOA1 OOA Ratio, Year 0OOA2 OOA Ratio, Year -1OOA3 OOA Ratio, Year -2OOA4 OOA Ratio, Year -3OOA5 OOA Ratio, Year -4
Enter the other operating assets ratios discussed above.
TPFYEND TP’s fye (1 to 12)
Enter the number of the month (1 to 12) in which the tested party’s fiscal year ends. Thisinformation will be used to align the years of the comparable companies to always have at least six
- 11 -
months overlap with the year of the tested party.
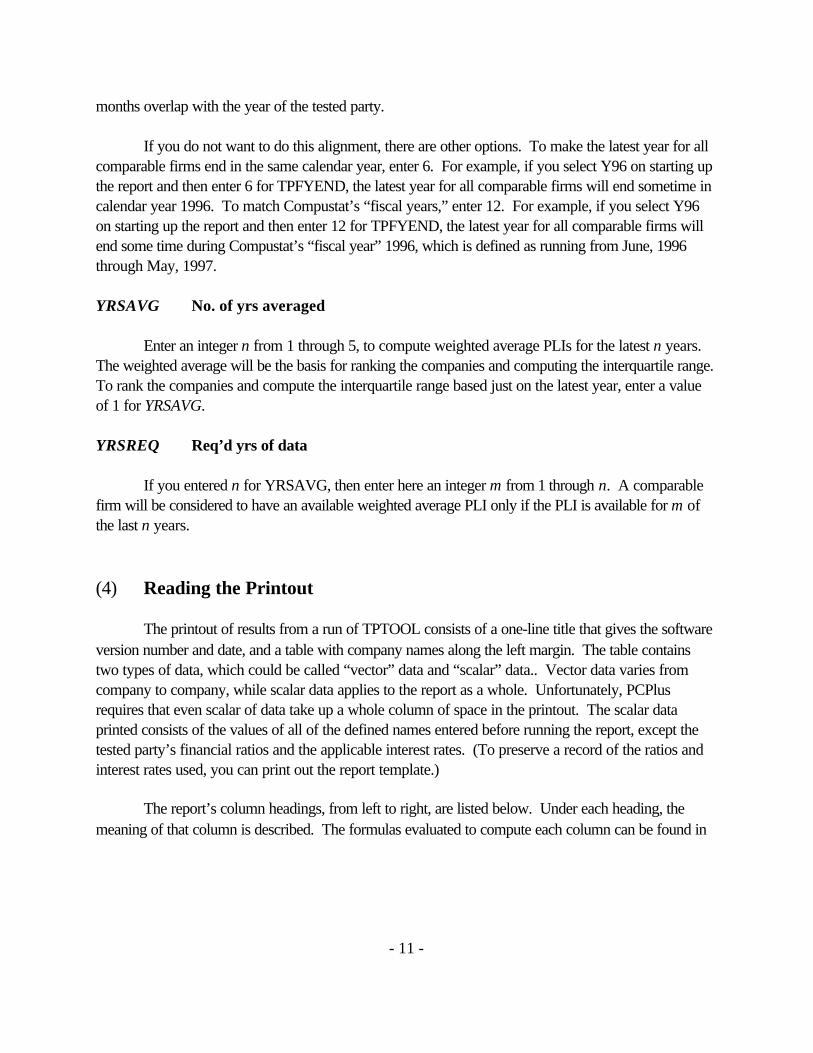
If you do not want to do this alignment, there are other options. To make the latest year for allcomparable firms end in the same calendar year, enter 6. For example, if you select Y96 on starting upthe report and then enter 6 for TPFYEND, the latest year for all comparable firms will end sometime incalendar year 1996. To match Compustat’s “fiscal years,” enter 12. For example, if you select Y96on starting up the report and then enter 12 for TPFYEND, the latest year for all comparable firms willend some time during Compustat’s “fiscal year” 1996, which is defined as running from June, 1996through May, 1997.
YRSAVG No. of yrs averaged
Enter an integer n from 1 through 5, to compute weighted average PLIs for the latest n years. The weighted average will be the basis for ranking the companies and computing the interquartile range. To rank the companies and compute the interquartile range based just on the latest year, enter a valueof 1 for YRSAVG.
YRSREQ Req’d yrs of data
If you entered n for YRSAVG, then enter here an integer m from 1 through n. A comparablefirm will be considered to have an available weighted average PLI only if the PLI is available for m ofthe last n years.
(4) Reading the Printout
The printout of results from a run of TPTOOL consists of a one-line title that gives the softwareversion number and date, and a table with company names along the left margin. The table containstwo types of data, which could be called “vector” data and “scalar” data.. Vector data varies fromcompany to company, while scalar data applies to the report as a whole. Unfortunately, PCPlusrequires that even scalar of data take up a whole column of space in the printout. The scalar dataprinted consists of the values of all of the defined names entered before running the report, except thetested party’s financial ratios and the applicable interest rates. (To preserve a record of the ratios andinterest rates used, you can print out the report template.)
The report’s column headings, from left to right, are listed below. Under each heading, themeaning of that column is described. The formulas evaluated to compute each column can be found in
13One column in the report is “hidden,” meaning that it does not show up on the screen or in theprintout. This column, with formula SELAVG and column heading “Selected Wtd. Average,” is usedto sort the companies for printout.
- 12 -
the report template.13
Company Name
The company’s name.
Ticker
The abbreviation by which PCPlus identifies the company.
compyradj
(This column is here to facilitate debugging. It prints the value of compyradj, a conceptdiscussed in Section 7. You do not need to worry about it.)
TP’s End Mo.
The month in which the tested party’s fiscal year ends. (The convention used throughout formonths is that 1 denotes January, 2 denotes February, and so on.)
End Mo.
The month in which the comparable company’s fiscal year ends.
Latest Yr ends in
Gives the calendar year in which the comparable company’s latest fiscal year underconsideration ends. This could be different for different companies because of the software’s yearalignment feature, by which the latest fiscal year for each comparable company has at least six monthsoverlap with the tested party’s latest fiscal year under consideration.
Case Type
This column gives the value of the defined name FLGADJTYPE. This flag has value 1 forinbound cases, 2 for maquiladora cases, and 3 for outbound cases, as defined in section 1.

- 13 -
Adjust OOA?
This column gives the value of the defined name FLGDOOOA. A value of 1 means that theasset intensity adjustment will include an adjustment for other operating assets; a value of 0 means thatthe asset intensity adjustment will not include an adjustment for other operating assets.
Project data?
This column gives the value of the defined name FLGFDGDAT. A value of 1 means thatcertain assumptions will be made if certain data are unavailable concerning a company’s accountspayable, trade accounts receivable, inventory, and other operating assets; a value of 0 means that thoseassumptions will not be made.
Project Lifo Res.?
This column gives the value of the defined name FLGFDGLIF. A value of 1 means thatcertain assumptions will be made if certain data are unavailable concerning a company’s LIFOreserves; a value of 0 means that those assumptions will not be made.
Unadj. PLI [-4]Adj. PLI [-4]Unadj. PLI [-3]Adj. PLI [-3]Unadj. PLI [-2]Adj. PLI [-2]Unadj. PLI [-1]Adj. PLI [-1]Unadj. PLI [0]Adj. PLI [0]
These ten columns give profit level indicators for individual years. Year 0 denotes the latestyear under consideration, year -1 the year before that, and so on until -4, which denotes the earliestyear. “Unadj.” denotes that the profit level indicator is computed without asset intensity adjustments;“Adj.” denotes that the profit level indicator is computed with asset intensity adjustments. For ease ofreading, the columns for adjusted profit level indicators are printed in bold face.
Avg’ing Period
This column prints the value of the defined name YRSAVG, which gives the number of years forwhich weighted average profit level indicators are computed. (The averaging period’s latest year isalways the latest of the five years shown in the previous columns. Thus, if less than five years are

- 14 -
averaged, the earlier years get omitted.)
Need Years
This column gives the value of the defined name YRSREQ, which gives the minimum number ofyears in the averaging period for which a profit level indicator must be available, in order for a weightedaverage profit level indicator to be considered available.
Avail. Unadj.
The number of years during the averaging period for which an unadjusted PLI is available.
Avail. Adj.
The number of years during the averaging period for which an adjusted PLI is available.
Rank by Adj.?
This column gives the value of the defined name FLGRANK. The value is 1 if the companiesare to be ranked by weighted average adjusted profit level indicators; the value is 0 if the companiesare to be ranked by weighted average unadjusted profit level indicators.
Rank
The company’s rank. The company with the highest profit level indicator has rank 1.
Wtd.. Ave. Unadj. PLIWtd. Ave. Adj. PLI
These columns give the weighted average unadjusted and adjusted profit level indicators,respectively, for the averaging period.
(5) Asset Intensity Adjustment Formulas
This section describes the formulas used to perform asset intensity adjustments. The formulasare slightly different for the three case types: inbound, maquiladora, and outbound (defined in section1). The formulas used were selected by APA Program economists; others have at times usedsomewhat different formulas.
Certain conventions will be used in the formulas below. In the absence of parentheses,
- 15 -
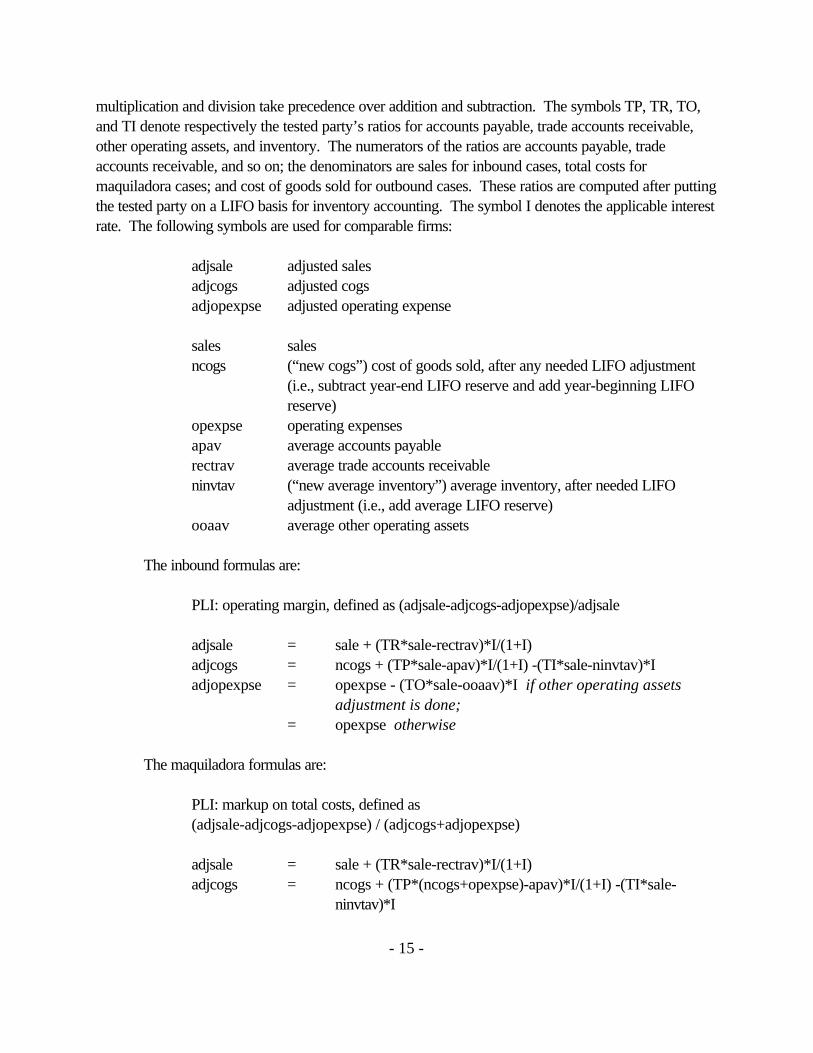
multiplication and division take precedence over addition and subtraction. The symbols TP, TR, TO,and TI denote respectively the tested party’s ratios for accounts payable, trade accounts receivable,other operating assets, and inventory. The numerators of the ratios are accounts payable, tradeaccounts receivable, and so on; the denominators are sales for inbound cases, total costs formaquiladora cases; and cost of goods sold for outbound cases. These ratios are computed after puttingthe tested party on a LIFO basis for inventory accounting. The symbol I denotes the applicable interestrate. The following symbols are used for comparable firms:
adjsale adjusted salesadjcogs adjusted cogsadjopexpse adjusted operating expense
sales salesncogs (“new cogs”) cost of goods sold, after any needed LIFO adjustment
(i.e., subtract year-end LIFO reserve and add year-beginning LIFOreserve)
opexpse operating expensesapav average accounts payablerectrav average trade accounts receivableninvtav (“new average inventory”) average inventory, after needed LIFO
adjustment (i.e., add average LIFO reserve)ooaav average other operating assets
The inbound formulas are:
PLI: operating margin, defined as (adjsale-adjcogs-adjopexpse)/adjsale
adjsale = sale + (TR*sale-rectrav)*I/(1+I)adjcogs = ncogs + (TP*sale-apav)*I/(1+I) -(TI*sale-ninvtav)*Iadjopexpse = opexpse - (TO*sale-ooaav)*I if other operating assets
adjustment is done;= opexpse otherwise
The maquiladora formulas are:
PLI: markup on total costs, defined as(adjsale-adjcogs-adjopexpse) / (adjcogs+adjopexpse)
adjsale = sale + (TR*sale-rectrav)*I/(1+I)adjcogs = ncogs + (TP*(ncogs+opexpse)-apav)*I/(1+I) -(TI*sale-
ninvtav)*I
- 16 -
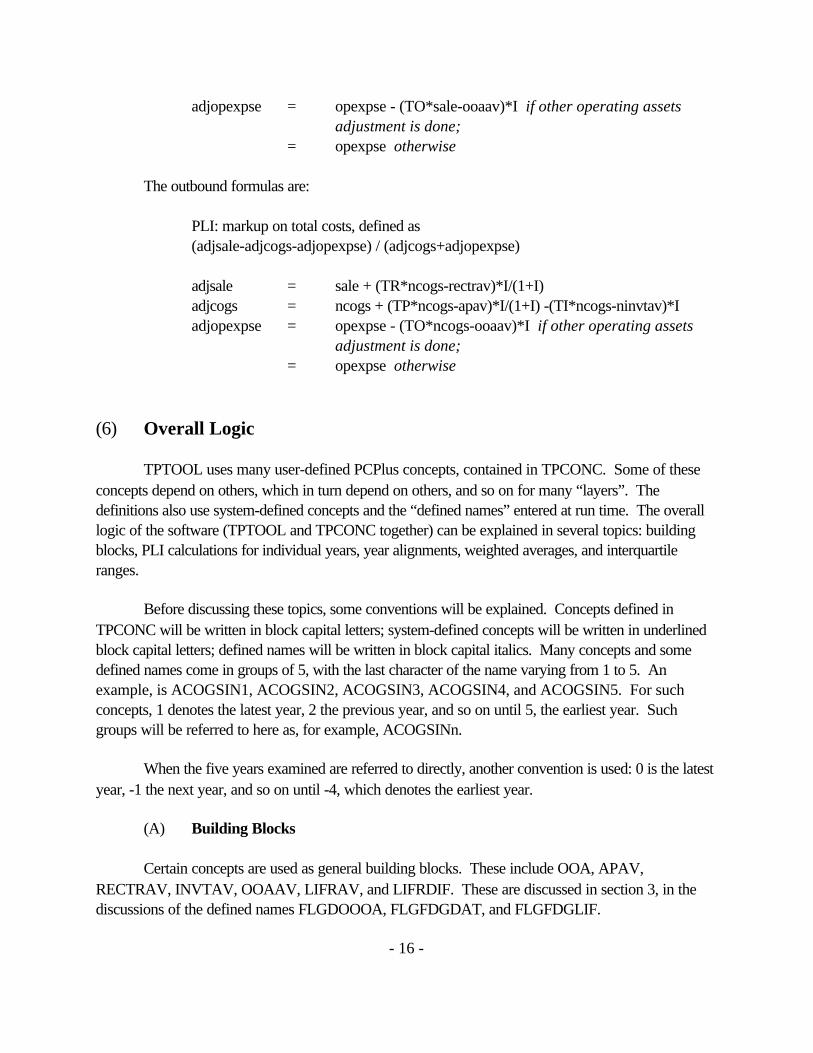
adjopexpse = opexpse - (TO*sale-ooaav)*I if other operating assetsadjustment is done;
= opexpse otherwise
The outbound formulas are:
PLI: markup on total costs, defined as(adjsale-adjcogs-adjopexpse) / (adjcogs+adjopexpse)
adjsale = sale + (TR*ncogs-rectrav)*I/(1+I)adjcogs = ncogs + (TP*ncogs-apav)*I/(1+I) -(TI*ncogs-ninvtav)*Iadjopexpse = opexpse - (TO*ncogs-ooaav)*I if other operating assets
adjustment is done;= opexpse otherwise
(6) Overall Logic
TPTOOL uses many user-defined PCPlus concepts, contained in TPCONC. Some of theseconcepts depend on others, which in turn depend on others, and so on for many “layers”. Thedefinitions also use system-defined concepts and the “defined names” entered at run time. The overalllogic of the software (TPTOOL and TPCONC together) can be explained in several topics: buildingblocks, PLI calculations for individual years, year alignments, weighted averages, and interquartileranges.
Before discussing these topics, some conventions will be explained. Concepts defined inTPCONC will be written in block capital letters; system-defined concepts will be written in underlinedblock capital letters; defined names will be written in block capital italics. Many concepts and somedefined names come in groups of 5, with the last character of the name varying from 1 to 5. Anexample, is ACOGSIN1, ACOGSIN2, ACOGSIN3, ACOGSIN4, and ACOGSIN5. For suchconcepts, 1 denotes the latest year, 2 the previous year, and so on until 5, the earliest year. Suchgroups will be referred to here as, for example, ACOGSINn.
When the five years examined are referred to directly, another convention is used: 0 is the latestyear, -1 the next year, and so on until -4, which denotes the earliest year.
(A) Building Blocks
Certain concepts are used as general building blocks. These include OOA, APAV,RECTRAV, INVTAV, OOAAV, LIFRAV, and LIFRDIF. These are discussed in section 3, in thediscussions of the defined names FLGDOOOA, FLGFDGDAT, and FLGFDGLIF.

14These concepts by themselves actually would compute the profit level indicators for years thatare not always properly aligned to the tested party’s fiscal year. As discussed in subsection C below,concepts that build on these concepts accomplish the year alignment.
- 17 -
Another building block is OPEXPSE, operating expense. This is de fined as selling, general,and administrative expenses plus depreciation (XSGA+DP) if available, and otherwise as sales minuscost of goods sold minus operating income after depreciation (SALE-COGS-OIADP).
(B) PLI Calculations for Individual Years
The concepts PLIn and ADJPLIn represent, respectively, the unadjusted and adjusted profitlevel indicators for individual years.14 The definitions of these concepts select the appropriate profitlevel indicator based on the case/adjustment type (the value of FLGADJTYPE).
PLIn is defined as UOMINn (unadjusted operating margin, inbound) for case type 1;UMRKMAQn (unadjusted markup, maquiladora) for case type 2; and UMRKOUTn (unadjustedmarkup, outbound) for case type 3. These concepts in turn are defined in terms of the building blockslisted above, and system-defined concepts.
ADJPLIn is defined as AOMINn (adjusted operating margin, inbound) for case type 1;AMRKMAQn (adjusted markup, maquiladora) for case type 2; and AMRKOUTn (adjusted markup,outbound) for case type 3. These concepts in turn are defined in terms of the building blocks listedabove, system-defined concepts, defined names (the tested party’s financial ratios, and applicableinterest rates), and some other concepts defined in TPCONC. For the inbound case, these otherconcepts are ASALEINn (adjusted sales), AOEINn (adjusted operating expenses), and ACOGSINn(adjusted cost of goods sold). For the maquiladora case, these concepts are ASALEMAQn (adjustedsales), AOEMAQn (adjusted operating expenses), and ACOGSMAQn (adjusted cost of goods sold). For the outbound case, these concepts are ASALEOUTn (adjusted sales), AOEOUTn (adjustedoperating expenses), and ACOGSOUTn (adjusted cost of goods sold). The mathematical formulasused for asset intensity adjustments for these three cases are given in section 5 above.
It would be straightforward to add a new case type. One would need to define appropriateunadjusted and adjusted PLIs; edit the definitions of PLIn and ADJPLIn to include this new choice; andmake some other changes regarding weighted averages, as discussed in subsection D below.
(C) Year Alignment
As discussed in section 3 (under the defined name TPFYEND), the software aligns the years ofthe comparable companies to overlap at least six months with the years in question of the tested party. To do this, the software computes concept COMPYRADJ (comparable year adjustment), which will

15One could in principle simplify the structure of the concepts used by instead codingCOMPYRADJ directly into time references, e.g. PLIYA1[COMPYRADJ]. However, this approachdoes not work properly in PCPlus. The software development team documented this issue forCompustat and requested advice, but has not received an explanation of what the problem is and ofwhat approaches will or will not work. Perhaps concepts are not in general able to be used in timereferences.
- 18 -
always have value 0 or -1. If the value is 0, no adjustment is necessary. If the value is -1, the softwaretells PCPlus to use data one year earlier from what PCPlus would normally choose. The calculation ofCOMPYRADJ depends on the concept FYRVAL, which gives a company’s fiscal year end (a value 1to 12, depending on the month). FYRVAL is defined in terms of the system concept FYR; if FYR isnot available for the most recent year, previous years are checked to find a value. (Section 7 explainsin detail the formula used to compute COMPYRADJ.)
The concepts PLIYAn (year-aligned unadjusted profit level indicators) and ADJPLIYAn(year-aligned adjusted profit level indicators) use COMPYRADJ to accomplish this alignment. Forexample, PLIYA1 is defined to be PLI1 if COMPYRADJ equals 0, but to be PLI1[-1] ifCOMPYRADJ equals 0. The other nine definitions are analogous. PCPlus propagates the timereference [-1] backward through all calculations that go into defining these concepts, so that from thebeginning the calculations will use data from the correct years.15
(D) Weighted Averages
The software computes the weighted unadjusted and adjusted average profit level indicator foreach comparable firm, using the latest n of the five years examined, where n is the value of YRSAVG. The concepts representing these weighted averages are PLIAVG and ADJPLIAVG respectively. Onlyyears for which the profit level indicator in question is available are counted in the weighted average. The weighting is by sales for inbound cases, and by total costs (costs of goods sold plus operatingexpenses) for maquiladora and outbound cases. (For ADJPLIAVG, the weighting is by the adjustedsales or total costs.)
The weights used for each year are represented by the concepts UWEIGHTn (weight forunadjusted profit level indicator) and AWEIGHTn (weight for adjusted profit level indicator). Thedefinitions of these concepts in turn select the appropriate quantities depending on the case type. However, UWEIGHTn and AWEIGHTn, by themselves, do not always properly align the comparablefirm’s year to that of the taxpayer. The proper alignment is computed by the concepts UWEIGHTYAn(year-aligned weight for unadjusted profit level indicator) and AWEIGHTYAn (year-aligned weight foradjusted profit level indicator). As discussed in subsection C above, the adjustment to the PCPlus timereference propagates backward for all calculations.

16PCPlus does not seem to have a way to automatically return “not available”. The definitionsof PLIAVG and ADJPLIAVG use the formula SALE[30]+SALE[-10], which is designed to return“not available”.
The logic behind the definitions of PLIAVG and ADJPLIAVG is as follows. First, a test ismade whether enough of the years in question have a profit level indicator available. If not, a “notavailable” is returned as already described. Next, a fraction is formed. The numerator is the sum, foreach appropriate year, of the profit level indicator times the weighting used for that year. Thedenominator is the sum, for each appropriate year, of the weighting used for that year. A year is“appropriate” if (1) it is within the averaging period, and (2) the profit level indicator is available for thatyear. The contributions for each year are coded so that a year that does not meet these two criteria willcontribute zero to both the numerator and denominator. (In the denominator, the addition andsubtraction of the profit level indicator, which would seem to be a useless net addition of zero, isdesigned to return a “not available” if the profit level indicator is not available, to force that year’scontribution to zero.)
17The sorting of companies for printout is actually done on the basis of the value a “hidden”column in the report, one that does not show up on the screen or in the printout. This column hasformula SELAVG (the selected weighted average).
- 19 -
The software considers that a weighted average profit level indicator is available only if a profitlevel indicator is available for at least m of these n years, where m is the value of YRSREQ. To applythis test, the software computes YRSAVAILU, the number of these n years for which the unadjustedPLI is available; and YRSAVAILA, the number of these n years for which the adjusted PLI isavailable. The definitions of PLIAVG and ADJPLIAVG are written to return “not available” ifYRSAVAILU and YRSAVAILA respectively are less than m.16
Subsection B above mentioned that it would be straightforward to add a new case type. Inaddition to the steps mentioned there, one would also have to edit the definitions of AWEIGHTn andUWEIGHTn to give the weighting definitions for the new case type.
(E) Ranking and Interquartile Ranges
The software ranks the comparable companies. If FLGRANK is 0, the ranking is by theweighted average unadjusted profit level indicator (PLIAVG). If FLGRANK equals 1, the ranking isby the weighted average adjusted profit level indicator (ADJPLIAVG). The company with rank 1 hasthe highest weighted average profit level indicator. The firms are printed in rank order, starting with thehighest profit level indicator.17 Companies for which the weighted average profit level indicator inquestion in unavailable are listed at the end, alphabetically by company name. (It would be easy to editthe report, for example, to instead print all companies in alphabetical order by company name.) Thesoftware uses the concept SELAVG (selected average), which is defined as PLIAVG or ADJPLIAVG

- 20 -
depending on FLGRANK.
The software then computes interquartile range and median according to the definition inTreasury Regulation 1.482-1(e)(2)(iii)(C); computes the Tukey range, identifies outliers, andrecomputes the interquartile range and median. However, inclusion of these features in TPTOOLcauses the report to take about ten minutes to load when first called up. (After that, it does not runparticularly slowly.) If one removes the pertinent columns from the report, it will load in about oneminute instead. (The columns must be deleted, not merely “hidden”.) An intermediate option is toremove just the three columns that give the recomputed interquartile range and median after the Tukeyfilter. The report will then load in about three minutes.
The interquartile range calculations are based on the weighted average unadjusted or adjustedPLI, depending on FLGRANK. Only companies for which the pertinent weighted average is availableare considered. The concepts IQRBOT, IQRMED, and IQRTOP represent the bottom, median, andtop, respectively, of the interquartile range. Section 8 describes the logic behind how these conceptsare computed.
Some development versions of the software additionally computed the Tukey Range, identifiedoutliers, and recomputed the interquartile range and median with those outliers excluded. However,these features involves such complex calculations that they considerably slowed down the system. (Thereport took perhaps twenty minutes to load, though it did not run particularly slowly.) As the overallsoftware complexity increased, the complexity of these particular features apparently became too muchfor PCPlus to handle, at least running on the APA Program’s Pentium computer under Windows NT;attempts to add those features to the report cause the computer to freeze. The pertinent concepts havebeen kept in TPCONC, but the development team has been unable to do final testing on these features. These concepts are as follows.
The concepts TUKBOT and TUKTOP represent the bottom and top of the Tukey rangerespectively, defined as follows:
TUKTOP = IQRTOP + 1.5 * (IQRTOP - IQRBOT)TUKBOT = IQRBOT - 1.5 * (IQRTOP - IQRBOT)
The concepts IQRBOTNEW, IQRMEDNEW, and IQRTOPNEW represent the interquartile rangebottom, median, and top, respectively, after all companies lying outside the Tukey range are eliminated.The definitions of these concepts are the same as for IQRBOT, IQRMED, and IQRTOP, except thatinstead of performing the calculation on the initial set entered by the user, the calculations are performedon that subset of the initial set that lies within the Tukey range. (Where “CPSET” occurs in the formulasfor IQRBOT, IQRMED, and IQRTOP, the formulas for IQRBOTNEW, IQRMEDNEW, andIQRTOPNEW contain instead “@SET(CPSET,@INRANGE(SELAVG,TUKBOT,TUKTOP))”.)
- 21 -
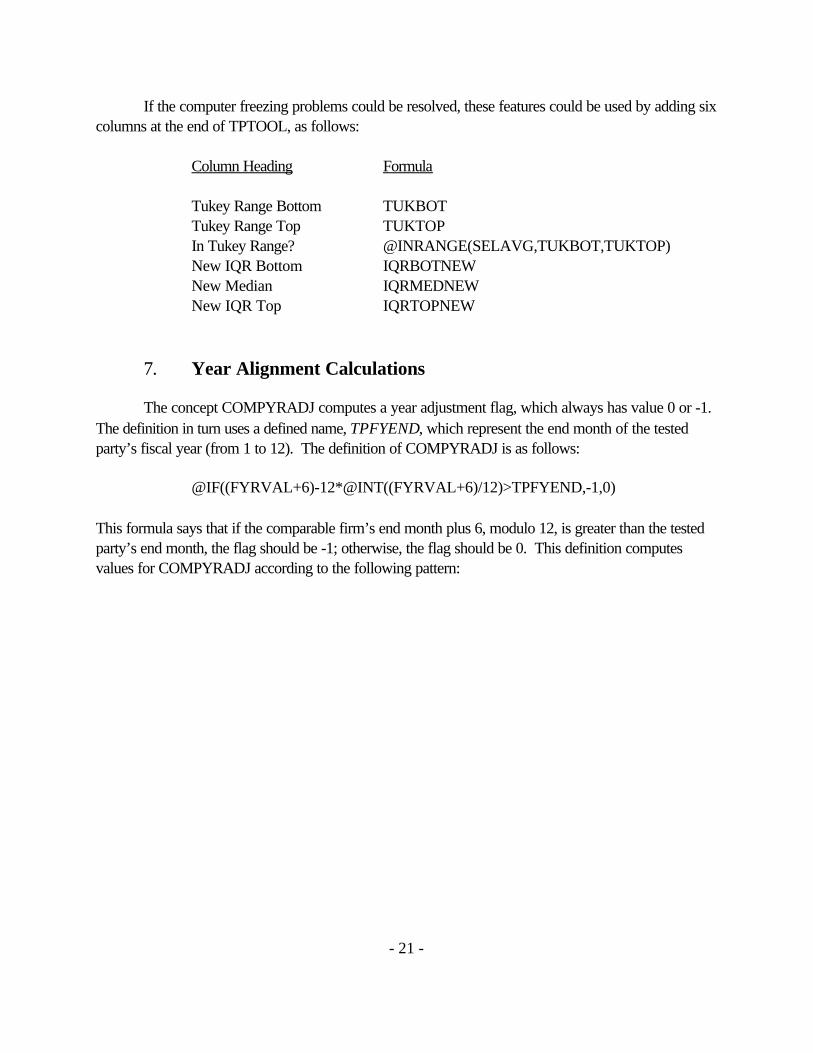
If the computer freezing problems could be resolved, these features could be used by adding sixcolumns at the end of TPTOOL, as follows:
Column Heading Formula
Tukey Range Bottom TUKBOTTukey Range Top TUKTOPIn Tukey Range? @INRANGE(SELAVG,TUKBOT,TUKTOP)New IQR Bottom IQRBOTNEWNew Median IQRMEDNEWNew IQR Top IQRTOPNEW
7. Year Alignment Calculations
The concept COMPYRADJ computes a year adjustment flag, which always has value 0 or -1. The definition in turn uses a defined name, TPFYEND, which represent the end month of the testedparty’s fiscal year (from 1 to 12). The definition of COMPYRADJ is as follows:
@IF((FYRVAL+6)-12*@INT((FYRVAL+6)/12)>TPFYEND,-1,0)
This formula says that if the comparable firm’s end month plus 6, modulo 12, is greater than the testedparty’s end month, the flag should be -1; otherwise, the flag should be 0. This definition computesvalues for COMPYRADJ according to the following pattern:

- 22 -
Comparablecompany’send month 6 5 4 3 2 1 12 11 10 9 8 7 6
TP’s endmonth 9
12 0 0 0 0 0 0 0 0 0 0 0 0
11 0 0 0 0 0 0 0 0 0 0 0 0
10 -1 0 0 0 0 0 0 0 0 0 0 0
9 -1 -1 0 0 0 0 0 0 0 0 0 0
8 -1 -1 -1 0 0 0 0 0 0 0 0 0
7 -1 -1 -1 -1 0 0 0 0 0 0 0 0
6 -1 -1 -1 -1 -1 0 0 0 0 0 0 0
5 -1 -1 -1 -1 -1 -1 0 0 0 0 0 0
4 -1 -1 -1 -1 -1 -1 -1 0 0 0 0 0
3 -1 -1 -1 -1 -1 -1 -1 -1 0 0 0 0
2 -1 -1 -1 -1 -1 -1 -1 -1 -1 0 0 0
1 -1 -1 -1 -1 -1 -1 -1 -1 -1 -1 0 0
One can verify, case by case, that this pattern satisfies the following criterion. A comparablecompany’s year selected as the PCPlus-defined “fiscal year” (y+COMPYRADJ) will always have atleast six months overlap with the fiscal year (as normally defined) of a tested party that ends incalendar year y. (Recall that PCPLUS defines, for example, fiscal year 96 as any year ending fromJune, 1996 through May, 1997.) So if, as prescribed in section 3, one runs TPTOOL usingCompustat’s “Absolute Years” (which are defined as following the PCPLUS-defined “fiscal years”),but specifies the year to be the calendar year during which the tested party’s last fiscal year (as

18An alternative approach that the development team explored would involve running TPTOOLon Compustat’s “Calendar Year” basis. The pattern of adjustments would be less confusing, as wouldbe the formula to compute the adjustment flag. However, the flag would then have three possiblevalues: 1, 0, and -1. Compustat’s staff recommended sticking with Compustat-defined fiscal-year-based runs, which Compustat’s staff believed were less likely to present PCPlus system problems.
- 23 -
ordinarily defined) ends, one will get the desired overlap.18
8. Interquartile Range Calculations
The concepts IQRBOT, IQRMED, and IQRTOP compute the bottom of the interquartilerange, the median, and the top of the interquartile range, respectively. This section provides a proof orexplanation that the definitions of these concepts actually accomplish this.
A. The Core Calculation of IQ Range Boundaries
Suppose that we have a set of n firms with available data for the profit level indicator desired,ranked 1 through n, where firm 1 has the highest profit level and firm n the lowest.
To calculate the interquartile range boundaries, it is useful to consider separately the caseswhere n is or is not divisible by 4. The calculation for each case will be put in a somewhat funny form,in order that later the two cases may be handled in the same way.
(i) If n is divisible by 4
If n is divisible by 4, the top of the IQ range will be the average of the values for firms withranks n/4 and (n/4)+1. (See reg. 1(e)(2)(iii)(C). Exactly 75 percent of the firms are at or below thevalue of the firm with rank (n/4)+1. Example: with 16 firms, exactly 75 percent of the firms are at orbelow the value of the firm with rank 5.)
Similarly, the bottom of the IQ range will be the average of the values for firms with ranks 3n/4and (3n/4)+1. (See reg. 1(e)(2)(iii)(C). Exactly 25 percent of the firms are at or below the value of thefirm with rank (3n/4)+1. Example: with 16 firms, exactly 25 percent of the firms are at or below thevalue of the firm with rank 13.)
Define int(x) as the greatest integer that is less than or equal to x. Since n is divisible by 4, thefollowing are true:
n/4 = int(n/4) = int((n-1)/4)+1

- 24 -
(n/4)+1 = int(n/4)+1
3n/4 = int(3n/4) = int((3n-1)/4)+1
(3n/4)+1 = int(3n/4)+1
So one could restate the previous two paragraphs as follows. The top of the IQ range will be theaverage of the values for firms with ranks int((n-1)/4)+1 and int(n/4)+1. The bottom of the IQ rangewill be the average of the values for firms with ranks int((3n-1)/4)+1and int(3n/4)+1.
(ii) If n is not divisible by 4
If n is not divisible by 4, the top of the IQ range will be the value of the firm with rankint(n/4)+1. (See reg. 1(e)(2)(iii)(C). Slightly more than 75 percent of the firms are at or below the firmwith rank int(n/4)+1. Less than 75 percent of the firms are at or below the firm with rank int(n/4)+2. Example: with 15 firms, 12 firms (slightly more than 75 percent) are at or below the firm with rankint(15/4)+1 = 4. Less than 75 percent of the firms are at or below the firm with rank 5.)
Similarly, the bottom of the IQ range will be the value of the firm with rank int(3n/4)+1. (Seereg. 1(e)(2)(iii)(C). Slightly more than 25 percent of the firms are at or below the firm with rankint(3n/4)+1. Less than 25 percent of the firms are at or below the firm with rank int(3n/4)+2. Example:with 15 firms, 4 firms (slightly more than 25 percent) are at or below the firm with rank int(15*3/4)+1 =12. Less than 25 percent of the firms are at or below the firm with rank 13.)
Since n is not divisible by 4, int(n/4) = int((n-1)/4) and int(3n/4) = int((3n-1)/4). So one couldrestate the previous two paragraphs as follows. The top of the IQ range is the average of the values forthe firms with rank int(n/4)+1 or int((n-1)/4)+1. (There is only one such firm, since these ranks are thesame.) The bottom of the IQ range is the average of the value for the firms with rank int(3n/4)+1 orint((3n-1)/4)+1. (There is only one such firm, since these ranks are the same.)
(iii) Combining the Two Cases
The last paragraphs respectively of subsections (i) and (ii) above give the same calculation forthe two different cases. To get the top of the IQ range, take the average value of all firms (there will beeither one or two such firms) that have either rank int(n/4)+1 or rank int((n-1)/4)+1. To get the bottomof the IQ range, take the average value of all firms (there will be either one or two such firms) that haveeither rank int(3n/4)+1 or rank int((3n-1)/4)+1.
B. The Concept Definitions
The concept definitions are as follows:

- 25 -
IQRTOP:
@cavg(selavg,@set(cpset,@or(
@rank(selavg,cpset)=(@int(@ccount(selavg,cpset)/4)+1),@rank(selavg,cpset)=(@int((@ccount(selavg,cpset)-
1)/4)+1))))
IQRMED:
@cmed(selavg,@set(cpset,@isvalue(selavg)=1))
IQRBOT:
@cavg(selavg,@set(cpset,@or(
@rank(selavg,cpset)=(@int(@ccount(selavg,cpset)*3/4)+1),@rank(selavg,cpset)=(@int((@ccount(selavg,cpset)*3-
1)/4)+1))))
For the top of the IQ range, the last three lines of the formula specify the ranks described in thelast paragraph of subsection A above. The set of firms entered at runtime is called cpset. The valuebeing used for the firms is selavg, the selected weighted average adjusted operating margin. Thefunction @ccount returns the number of elements of cpset for which selavg is available; this function letsthe software ignore all elements of cpset for which the data are unavailable. The second line in thisformula builds a set consisting of all of the elements of cpset with the ranks specified on the last twolines. The first line of the formula takes the average of the value of selavg for all elements of this set.
For the bottom of the IQ range, the same explanation applies.
For the median, the second line of the formula constructs a set consisting of the elements ofcpset for which selavg is available. The first line of the formula takes the median value of selavg for thatset. (If one tried to take the median directly from cpset, then if at least half of the elements of cpset didnot have selavg available, Compustat’s median function @cmed would return the answer as undefined.)