reef restoration for kāne'ohe bay - university of...
TRANSCRIPT

January - May 2016
Reef Restoration for Kāne'ohe Bay
PROGRESS REPORT DEPARTMENTMENT OF LAND AND NATURAL RESOURCES DIVISION OF AQUATIC RESOURCES

1. MANAGEMENT PLAN ACTIONS IMPLEMENTED
For the period of January – May 2016, the project has made significant progress on the work plan
milestones outlined in the Reef Restoration Work Plan for Kāne‘ohe Bay, O’ahu (Table 1). All baseline
monitoring surveys have been completed to map the initial percent cover of coral and algae throughout
the restoration area. Multiple meetings resulted in a prioritization of the restoration patch reefs; Marker
12 remains the primary priority area. Priority of additional patch reefs was based on cover of coral and
algae, size of reef, and location within Kāne‘ohe Bay. A more detailed description of this process can be
found in the monitoring plan. Urchin outplanting began on April 14, 2016 with the translocation of 697
wild collector sea urchins (Tripneustes gratilla) to Reef 40. More information on this update can be found
in the Target Species section of this report. The larval rearing process has also begun in the DAR Urchin
Hatchery for release into the restoration area. This report marks the first progress report submitted from
the project; reports will be delivered bi-annually in December and May. The next progress report will be
delivered in December 2016.
Table 1 Work plan progress for January - May 2016
Action Who is responsible Timeframe Progress Accomplishments Notes
Conduct baseline monitoring surveys.
Monitoring Coordinator, Project Technicians
March – May 2016
Complete
2016 SNAP patch reef assessment complete 4/2016; Marker 12 assessment completed 5/2016
Prioritize reef restoration efforts
DAR Aquatic Biologist, Trustees
March 2016
Complete Prioritization complete 4/2016
Marker 12 is priority restoration site, patch reefs are prioritized based on size, location, and coral and algae cover
Outplant native sea urchins to restoration area.
Project Technicians, DAR Urchin Hatchery
April 2016 - end of project
In progress
Urchin hatchery grow-out began 4/2016, first urchins transplanted to restoration area 4/14/2016
Bi-annual reporting to the Cape Flattery trustee council.
Monitoring Coordinator, DAR Aquatic Biologist
May 2016, December 2016
In progress
First progress report submitted to trustee council May 2016
Follow-up monitoring of coral and algae conducted annually.
March – April 2017
Not in progress
Site maintenance of additional outplanting of urchins.
Not in
progress
Continuation of the project on priority reefs
Not in
progress

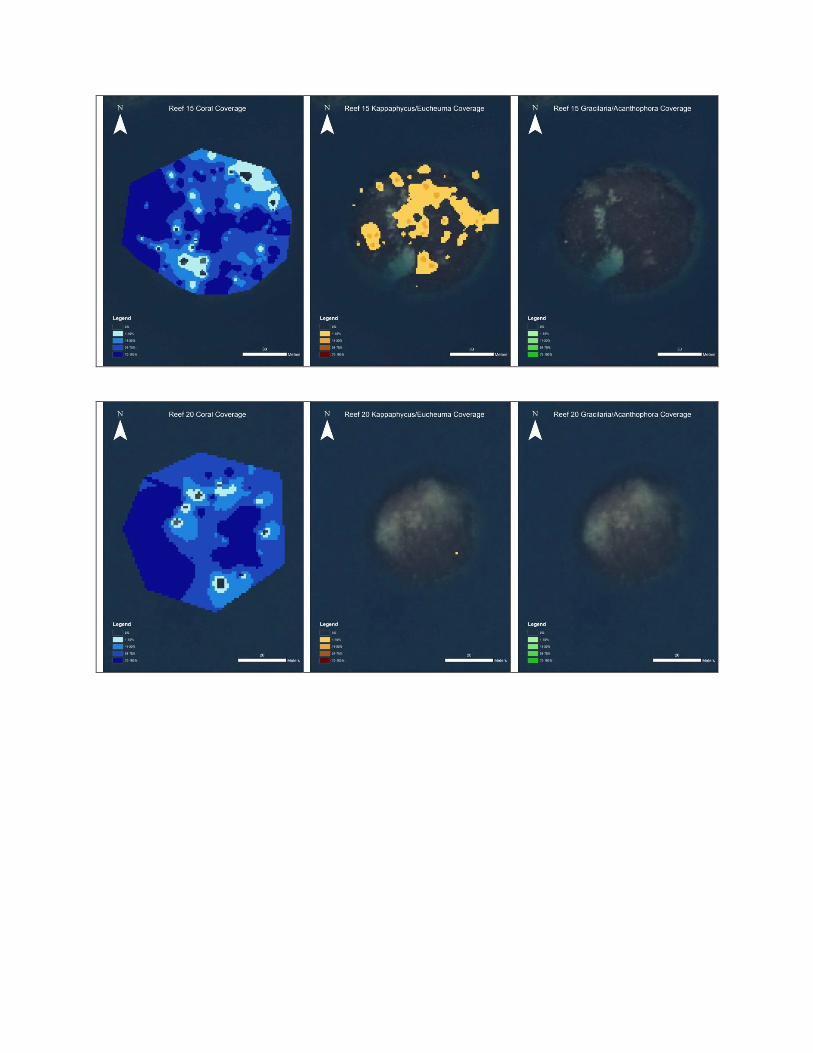
2. ALGAE AND CORAL PERCENT COVER
A baseline snapshot, or SNAP survey, was conducted on 14 reefs (12 restoration reefs and two control
reefs) between March – May 2016 to determine initial levels of live coral and invasive algae (Table 2).
Based on the area of algae, the team also determined the number of sea urchins needed to stock the
target two urchins per square meter of invasive algae (Euchema/Kappaphycus + Gracilaria/Acanthophora
covered area). Details on the survey methodology are available in the monitoring plan.
Table 2 Results of the SNAP Survey Baseline Assessment
2016 SNAP Survey
Reef Name Reef Area (m2)
Average Percent
Coral
Area of Coral (m2)
Average Percent
Euchema/ Kappahycus
Area of Euchema/
Kappahycus (m2)
Average Percent
Gracilaria/ Acanthophora
Area of Gracilaria/
Acanthophora (m2)
Number of urchins needed
(2 urchins/m2 of algae)
Marker 12 275,764 16.86 149,101 0.06 2,684 .54 17,538 40,444
20 3,316 64.50 3,284 0.001 1 0 0 2
23 3,119 68.77 4,996 0.34 208 0 0 416
24 8,258 54.90 10,780 0.01 21 0 0 42
28 13,974 44.93 14,530 0.36 425 1.65 1,942 4,734
30 21,528 39.94 20,386 0.13 422 0 0 844
31 20,742 44.41 21,686 0.05 182 0 0 364
38 9,707 39.04 8,646 0.48 692 0.003 7 1,398
40 4,645 63.03 4,618 1.67 784 0 0 1,568
41 25,893 51.22 24,752 1.71 58,877 0.04 173 118,100
43 21,852 69.28 24,727 0.36 1,229 0 0 2,458
44 50,115 40.30 46,039 0.21 1,257 0.01 33 2,580
15 - control
8,570 59.86 8,458 1.40 1,753 0 0 3,506
9 - control
32,404 40.27 27,162 0.06 290 0 0 580
TOTALS/ AVERAGES
499,887 49.81 369,165 0.49 15,825 0.16 19,693 71,036
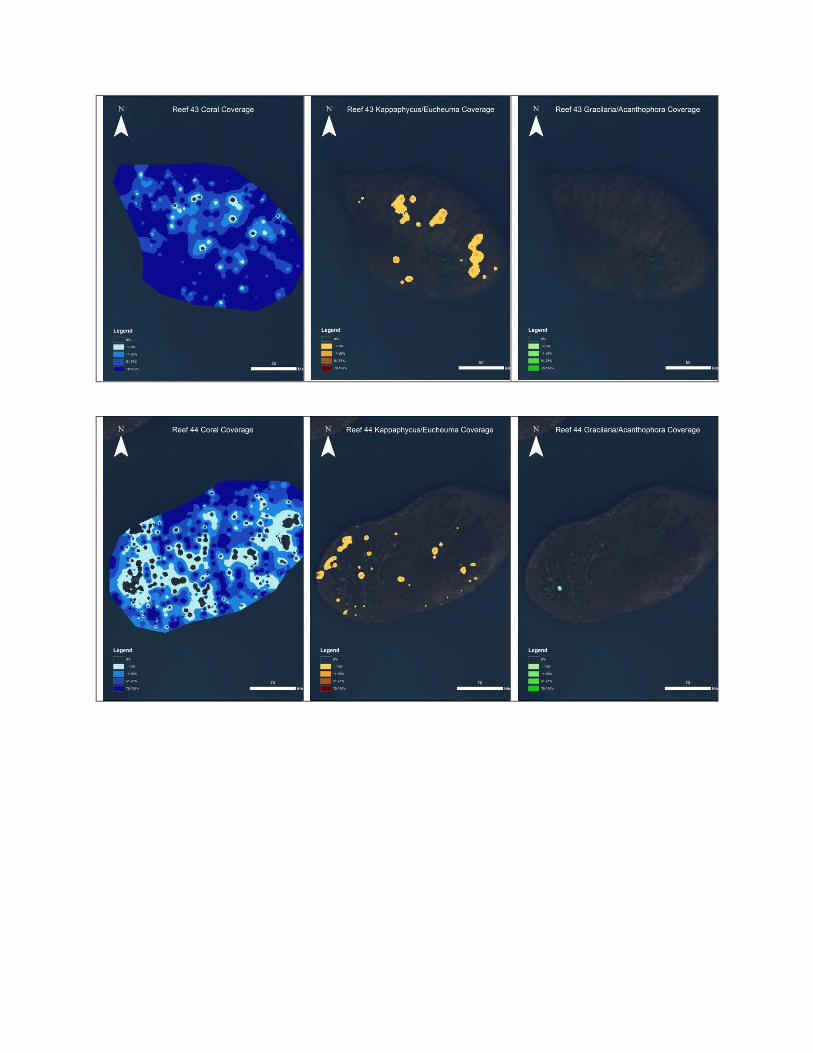
CORAL
Coral was present throughout the restoration area (Figure 1). Coral cover was variable and ranged from
39% to 69% with an average of 50% for the entire restoration area (Table 2). Reef 43 had the highest
coral average percentage, while reef 38 had the lowest (Figure 2). The total area of the restoration area
covered by coral is estimated at 369,165 m2. Additional reef-specific maps can be found in Appendix I.
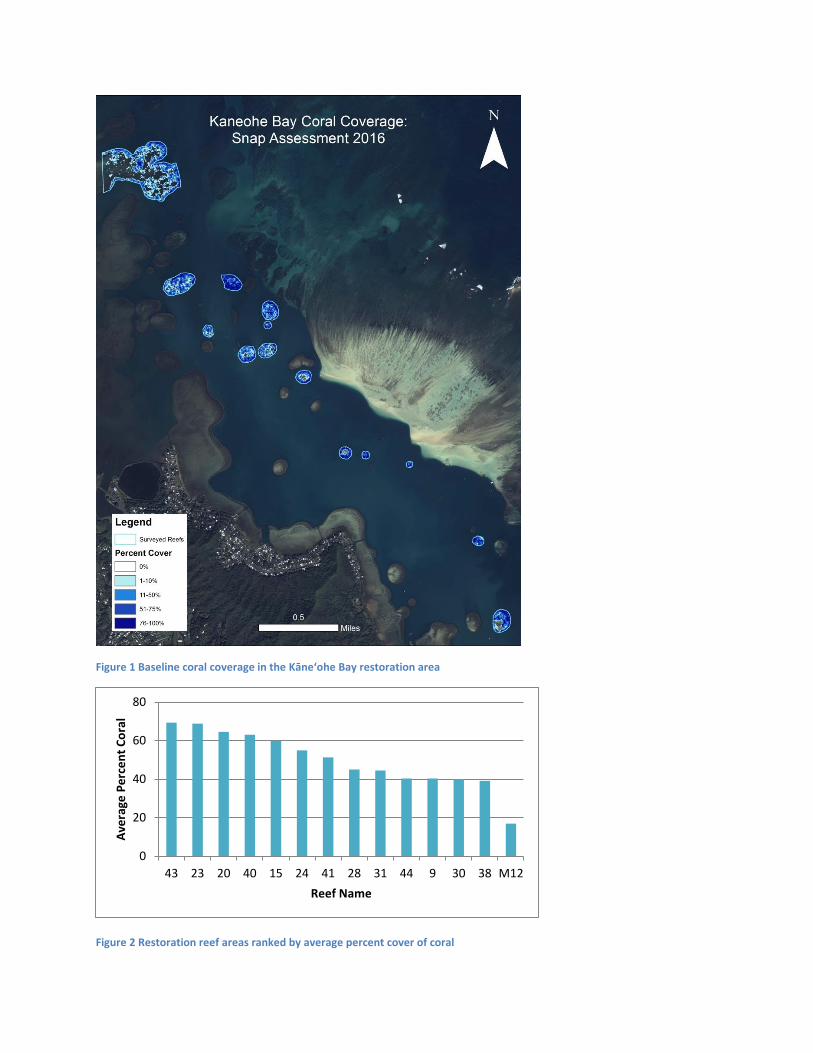
Figure 1 Baseline coral coverage in the Kāne‘ohe Bay restoration area
Figure 2 Restoration reef areas ranked by average percent cover of coral
0
20
40
60
80
43 23 20 40 15 24 41 28 31 44 9 30 38 M12
Ave
rage
Pe
rce
nt
Co
ral
Reef Name

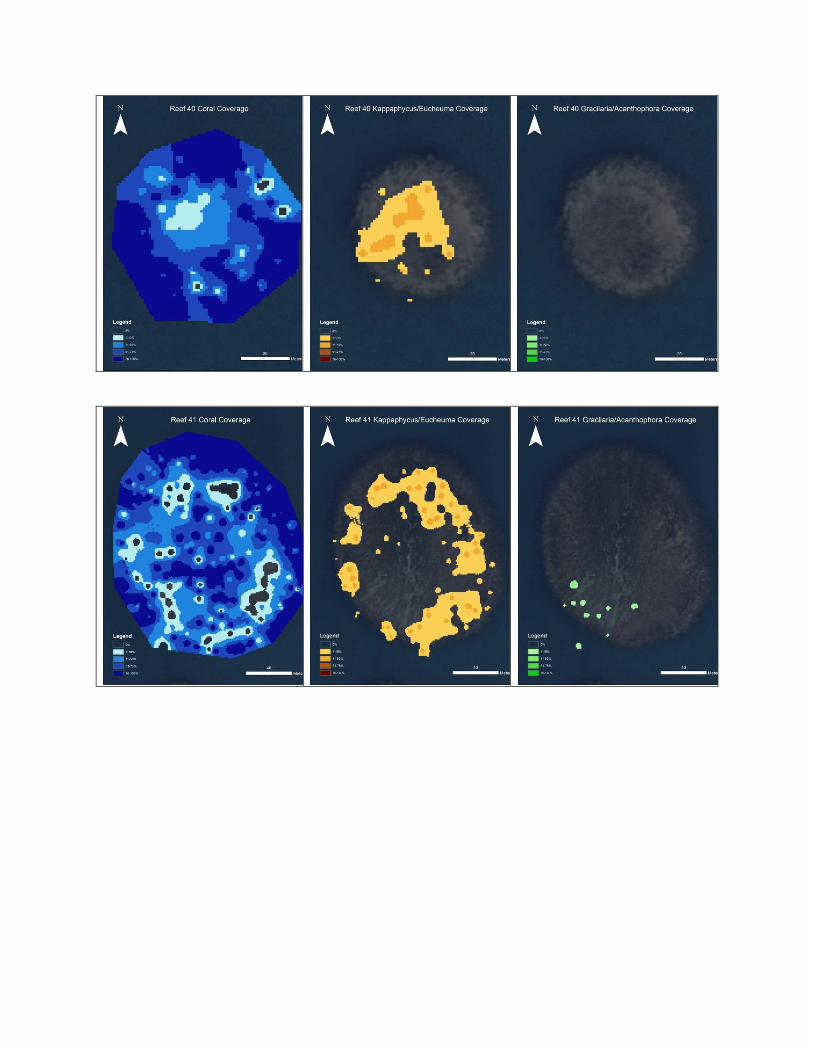
INVASIVE ALGAE
Invasive algae was found throughout the restoration area (Figure 5,6). Euchema/Kappaphycus was
distributed throughout the restoration area and varies from 0.001% to 1.71% with an average of 0.49%
(Table 2). The baseline assessment revealed that the highest average percentage of invasive algae
occurred on Reefs 41 (1.71%) and 40 (1.67%) (Figure 3).
Gracilaria/Acanthophora was also distributed throughout portions of the restoration area. Average cover
varies from 0 to 1.65, with an average of 0.16 (Table 2). The highest average percentage of
Gracilaria/Acanthophora was on Reef 28 (Figure 4).
Figure 3 Restoration reef areas ranked by average percent cover of Euchema spp. and Kappaphycus spp.
Figure 4 Restoration reef areas ranked by average percent cover of Gracilaria and Acanthophora
0
0.4
0.8
1.2
1.6
2
41 40 15 38 43 28 23 44 30 M12 9 31 24 20
Ave
rage
Pe
rce
nt
Euch
em
a/K
app
aph
ycu
s
Reef Name
0
0.4
0.8
1.2
1.6
2
28 M12 41 44 38 40 15 43 23 30 9 31 24 20
Ave
rage
Pe
rce
nt
Gra
cila
ria/
Aca
nth
op
ho
ra
Reef Name
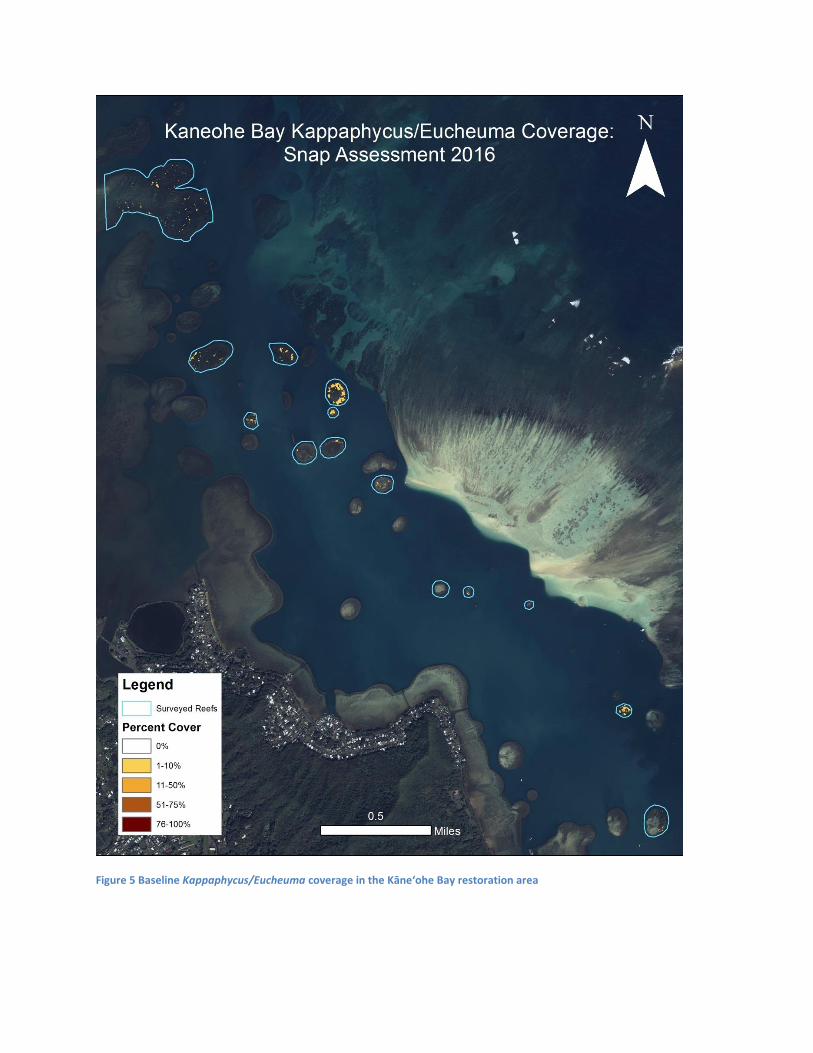
Figure 5 Baseline Kappaphycus/Eucheuma coverage in the Kāne‘ohe Bay restoration area
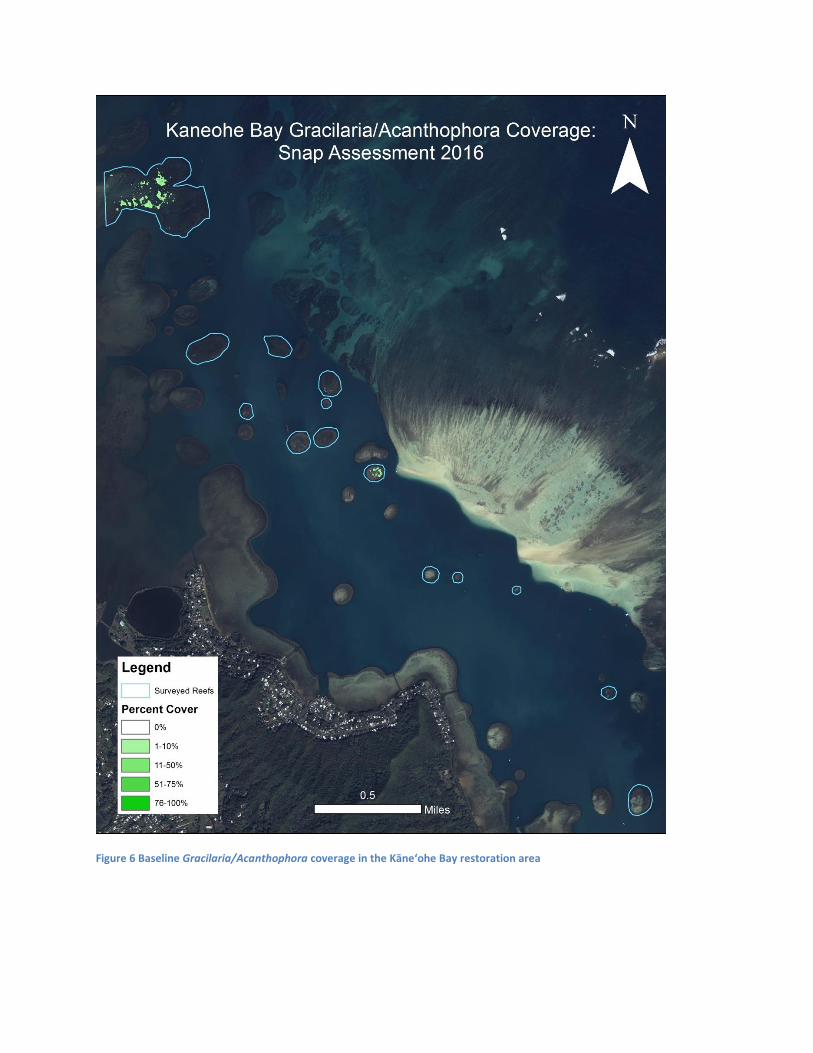
Figure 6 Baseline Gracilaria/Acanthophora coverage in the Kāne‘ohe Bay restoration area

3. NUMBER AND DENSITY OF TARGET SPECIES
Since the project initiation, the DAR Urchin Hatchery has begun operations to produce hatchery-raised
collector sea urchins (Tripneustes gratilla) for the restoration area (Table 3). As of May 2016, 6,721 liters
of phytoplankton have been produced to feed urchin larvae and 210 Kg of macroalgae for juvenile
urchins. A total of 98 wild, adult urchins have been spawned in the hatchery to collect gametes for
cultured urchins destined for the restoration area. The number of urchin larvae moved into tanks for the
settlement and grow out phases for this reporting period was 32,952. Typically, the hatchery expects
approximately 2% survival of competent larvae to outplant based on historical results from 2012 – 2014.
The hatchery-raised urchins are currently in the grow-out phase and will be moved to restoration reefs
when they reach adequate transplantation size. The urchins take approximately 3-5 months from
spawning in the hatchery to outplanting to the reef. The hatchery anticipates to produce approximately
87,000 urchins by the next progress report in December for this restoration area.
Table 3 DAR Urchin Hatchery monitoring metrics for January - May 2016
food production urchin production
Date phytoplankton produced (L)
macroalgae produced
(Kg)
urchins spawned
larvae moved into settlement/grow
out phase (X1000)
hatchery urchins
outplanted
Jan 2016 8 66 0 0 0
Feb 2016 2,593 99 41 15,256 0
Mar 2016 4,120 45 57 17,696 0
Apr 2016 3,909 92 60 0 0
May 2016 40 18,000
Totals 6,721 210 98 32,952 0
On April 14, 2016 the project team translocation 697 wild urchins from Sand Island, Oahu to Kāne‘ohe
Bay, Oahu (Table 4). The urchins were brought to an area within Reef 40 that was determined to be
covered in invasive algae in the baseline assessment.
Table 4 Urchin Transplants for January - May 2016
Date Urchin source
Reef Number Number of
Urchins Released
Area treated (m2) Work Hours
Number of team
members
Total Hours
4/14/2016 wild - sand
island 40 697 1,183 4.3 1 4.3
Totals 40 697 1,183 4.3
OTHER PROGRESS
The project successfully hired a Monitoring Coordinator and a temporary technician through the
Hawaii Coral Reef Initiative (HCRI) in January 2016. The hiring process for two additional
technicians began in April 2016, candidates are currently being interviewed.
Two boat motors were purchased for the project’s vessel costing approximately $30,000.
Additional purchases include basic dive and field gear for project staff.
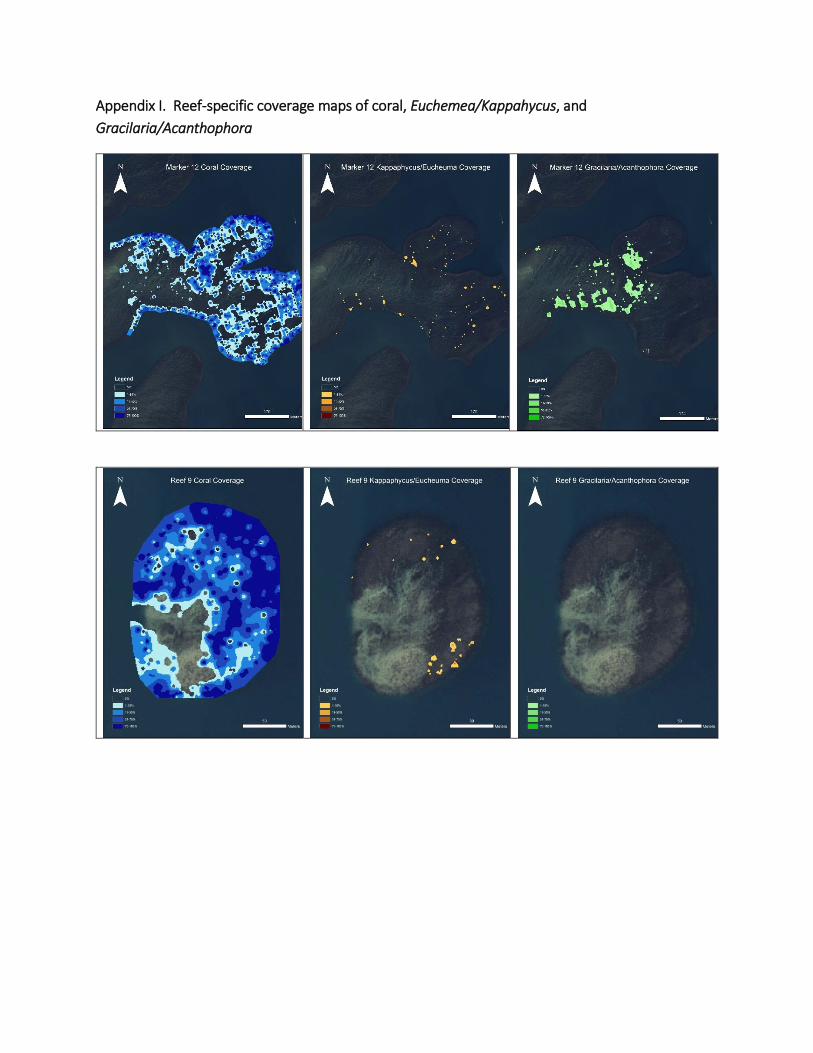
Appendix I. Reef-specific coverage maps of coral, Euchemea/Kappahycus, and
Gracilaria/Acanthophora