reduction of tire road noise by acoustic absorption ... · absorption coefficient ... reduction of...
TRANSCRIPT
HAL Id: hal-00546107https://hal.archives-ouvertes.fr/hal-00546107
Submitted on 13 Dec 2010
HAL is a multi-disciplinary open accessarchive for the deposit and dissemination of sci-entific research documents, whether they are pub-lished or not. The documents may come fromteaching and research institutions in France orabroad, or from public or private research centers.
L’archive ouverte pluridisciplinaire HAL, estdestinée au dépôt et à la diffusion de documentsscientifiques de niveau recherche, publiés ou non,émanant des établissements d’enseignement et derecherche français ou étrangers, des laboratoirespublics ou privés.
Reduction of tire road noise by acoustic absorption:Numerical evaluation of the pass-by noise levelreduction using the normal incidence acoustic
absorption coefficientJ. F. Hamet
To cite this version:J. F. Hamet. Reduction of tire road noise by acoustic absorption: Numerical evaluation of the pass-bynoise level reduction using the normal incidence acoustic absorption coefficient. Rapport de recherche.2004, 25p. <hal-00546107>

INSTITUT NATIONAL DE RECHERCHE
SUR LES TRANSPORTS ET LEUR SECURITE
JF Hamet
Reduction of tire road noise by acousticabsorption
Numerical evaluation of the pass-by noise level reduction
using the normal incidence acoustic absorption coefficient
LTE 0423October 2004

The authors :
Jean-Francois HametDirecteur de Recherche au Laboratoire Transports et Environnement25, avenue Francois Mitterrand – Case 24, 69675 Bron [email protected]
LTE 0423 1

Bibliographic notice
1 Research department (1stauthor) 2 Project N 3 INRETSLaboratoire Transports et Environnement (LTE) SILVIA (silent roads)4 TitleReduction of tire road noise by acoustic absorption5 Sub-title 6 LanguageNumerical evaluation of the pass-by noise level reduction usingthe normal incidence acoustic absorption coefficient
Engl
7 Author(s) 8 Ext. collaborationJF Hamet9 Name, address, financing, co-editor 10 Ncontract, conv.
GRD2/2000/3020211 Date of publication
October 200412 Comments
This report is an INRETS-LTE edition of the SILVIA -INRETS-013-WP2 report ”Estimation
of the attenuation of rolling noise by acoustic absorption”, dated 19/09/2004.13 Summary
Part of INRETS task in the SILVIA project is to study the influence of the pavementcharacteristics on the generation and the propagation of road traffic noise using existing models.This work addresses the reduction of tire-road noise by absorption effects. It aims at findinga numerical correspondence between the two quantities generally available from measurements:pass-by noise noise levels at 7.5 m distance and acoustic absorption at normal incidence.Estimations are made using an omnidirectional point source for modeling the tyre, and theimage method for modeling the reflection of the porous pavement. The approach is validatedby comparing calculations to published experimental results.A numerical correspondence is found between the absorption coefficient in normal incidence andthe pass by level difference obtained between a source over the absorbing surface and the sourceover a reflecting surface. The absorption and attenuation curves in function of frequency havesimilar shapes but are slightly shifted in frequency.A numerical law is evaluated for standard pass-by measurement conditions (microphone at 7.5 mdistance and 1.2 m height). The law is formulated in 1/3 octave values between the frequencyshifted absorption coefficient and the attenuation:
∆Lp(fc, 81o) = −11.9× < ao(fsh., 0) > dB
The law does not depend on frequency.
14 Keywords 15 Distribution PUBLIC
tire road noise, acoustic absorption, noise reduction, mea-surement, modelling
INRETS/RR/04-537-ENG
16 Number of pages 17 Price 18 Confidential until 19 Bibliography25
LTE 0423 2

Fiche bibliographique
1 UR (1ierauteur) 2 Projet no 3 INRETSLaboratoire Transports et Environnement (LTE) SILVIA (silent roads)4 TitreReduction of tire road noise by acoustic absorption5 Sous-titre 6 LangueNumerical evaluation of the pass-by noise level reduction usingthe normal incidence acoustic absorption coefficient
Engl
7 Auteur(s) 8 Rattachement ext.JF Hamet9 Nom adresse financeur, co-editeur 10 Ncontrat, conv.
GRD2/2000/3020211 Date de publication
October 200412 Remarques
Ce rapport est l’edition INRETS-LTE du rapport SILVIA -INRETS-011-WP2 ”Estimation of
the attenuation of rolling noise by acoustic absorption”, publie le 08/08/200313 Resume
Une des contributions de l’INRETS au projet SILVIA est d’evaluer l’influence des caracteris-tiques de la chaussee sur la generation et la propagation du bruit de trafic routier, en utilisantles modeles existants.Le travail aborde dans ce rapport concerne la reduction du bruit de contact pneumatique-chaussee par absorption acoustique de la chaussee. Il vise a trouver une correspondancenumerique entre deux quantites generalement disponibles; le niveau de bruit au passage a 7.5 dedistance et le coefficient d’absorption acoustique en onde plane du revetement, mesure sous in-cidence normale.Les evaluations sont effectuees en utilisant pour le rayonnement du pneumatique le modele d’unesource ponctuelle omnidirectionnelle et la methode des images pour modeliser la reflexion acous-tique de la surface du revetement. L’approche est valide en comparant les calculs aux resultatsexperimentaux trouves dans la litterature.Une correspondance est recherchee entre le coefficient d’absorption acoustique en incidence nor-male et la difference des niveaux de bruit au passage evaluee entre le cas de la source sur lasurface absorbante et celui de la source sur une surface reflechissante. Les courbes d’absorptionacoustique et de reduction de bruit ont des formes similaires mais sont legerement decalees enfrequence.Une loi numerique est evaluee pour les niveaux de bruit au passage mesures dans les conditionsstandard (microphone a 7.5m de distance horizontale et a 1.2m de hauteur). La loi est formuleeen 1/3 octave entre le coefficient d’absorption acoustique, decale en frequence, et la reductionde niveau de bruit.
∆Lp(fc, 81o) = −11.9× < ao(fsh., 0) > dB
La loi est la meme pour les 1/3 octave consideres.14 Mots-cles 15 Diffusion libre
Bruit pneumatique chaussee, absorption acoustique, reduc-tion, mesure, modelisation
INRETS/RR/04-537-ENG
16 Nombres de pages 17 Prix 18 Confidentiel jusqu’au 19 Bibliographie25
LTE 0423 3

Introduction
Acoustic absorption and porosity are two factors reckoned to contribute to traffic noisereduction. Both exists only on porous1 pavements. Part of the difficulty is to determinetheir respective contributions: reduction by the porosity of the air pumping generation ,reduction by the acoustic absorption of the noise once radiated.
A goal of SILVIA project Task 2.2 Model application is to study the influence of thepavement characteristics on the generation and the propagation of road traffic noise usingexisting models.
This work addresses the reduction of tire-road noise by absorption effects. It aims atfinding a numerical correspondence between the two quantities generally available frommeasurements: pass-by noise noise levels at 7.5 m distance and acoustic absorption atnormal incidence.
Estimations are made using an omnidirectional point source for modeling the tyre, andthe image method for modeling the reflection of the porous pavement. The approach isvalidated by comparing calculations to published experimental results.
A numerical correspondence is found between the absorption coefficient in normal incidenceand the pass by level difference obtained between a source over the absorbing surface andthe source over a reflecting surface. The absorption and attenuation curves in function offrequency have similar shapes but are slightly shifted in frequency.
A numerical law is evaluated for standard pass-by measurement conditions (microphoneat 7.5 m distance and 1.2 m height). The law is formulated in 1/3 octave values betweenthe frequency shifted absorption coefficient and the attenuation:
∆Lp(fc, 81o) = −11.9× < ao(fsh., 0) > dB
The law does not depend on frequency.
1Similar to Sandberg in his tyre/road reference book, the term porous is used for facility, althoughpervious would be more appropriate.
LTE 0423 4

Contents
1 Experimental observations 6
2 Modeling approach 102.1 The model . . . . . . . . . . . . . . . . . . . . . . . . . . . . . . . . . . . . . 10
2.1.1 Point source over an absorbing surface . . . . . . . . . . . . . . . . . 102.1.2 Attenuation by absorption effect . . . . . . . . . . . . . . . . . . . . 112.1.3 Acoustic impedance of a multiple layer . . . . . . . . . . . . . . . . . 112.1.4 Modeling of the porous medium . . . . . . . . . . . . . . . . . . . . 12
2.2 Experimental validation . . . . . . . . . . . . . . . . . . . . . . . . . . . . . 122.2.1 Physical characteristics determined from the absorption measurements 122.2.2 Physical characteristics adjusted to the attenuation values . . . . . . 12
3 Parametric study 153.1 Influence of the geometry . . . . . . . . . . . . . . . . . . . . . . . . . . . . 153.2 Influence of the physical characteristics . . . . . . . . . . . . . . . . . . . . . 17
3.2.1 Layer thickness . . . . . . . . . . . . . . . . . . . . . . . . . . . . . . 173.2.2 Tortuosity of the porous medium . . . . . . . . . . . . . . . . . . . . 173.2.3 Porosity of the porous medium . . . . . . . . . . . . . . . . . . . . . 17
4 Acoustic absorption and noise attenuation 194.1 Acoustic absorption for plane waves and spherical waves . . . . . . . . . . . 194.2 Reflection coefficient and noise reduction . . . . . . . . . . . . . . . . . . . . 204.3 Absorption coefficient and noise reduction . . . . . . . . . . . . . . . . . . . 204.4 Estimating ∆LPB from ao . . . . . . . . . . . . . . . . . . . . . . . . . . . . 214.5 Example . . . . . . . . . . . . . . . . . . . . . . . . . . . . . . . . . . . . . . 23
5 Conclusion 24
Bibliography 25
LTE 0423 5

1 – Experimental observations
Tire road noise is generally seen to decrease with texture depth. On very smooth sur-faces however tire road noise may increase when texture depth decreases (Fig. 1.1). Onstandard surfaces, a decrease of road roughness results in a decrease of tire vibrations andconsequently in noise. On very smooth surfaces a sealing effect occurs between the roadand the tire surface as the road gets smoother [1]: air pumping phenomena occur.
Figure 1.1: Relation between the noise level LA of a tire rolling at 40 km/h and 80 km/hon dry surfaces and the mean texture depth Rp of these surfaces (from [2])
Porosity strongly reduces air pumping noise. Porous pavements also have acousticabsorption properties and consequently acoustic attenuation properties. This was alreadyreckoned in the 70’s: tread-cavity pressure difference can be neutralized through the surfaceporosity [...] Porosity results in better sound absorption properties. [1]
Sandberg and Descornet [3] observed in the late 70’s that the measured tire roadnoise level difference between an acoustically absorbing surface and a perfectly reflectingsurface was higher than the measured difference on sound propagation over these surfaces1
Oshino [4] more recently measured the tire/road noise over three surfaces: a denseasphalt pavement and two porous pavements. He also measured the attenuation due tosound absorption for a source placed at each tire and engine position, including multiplereflection under the car body (Fig 1.2).
By removing the absorption effect from the pass-by results on the drainage pavements(Fig 1.3 zone A) he estimated the noise reduction due to porosity (Fig 1.3 zone B ).
1The two surfaces were considered to have ”similar” texture spectra
LTE 0423 6

Chapter 1 – Experimental observations
Figure 1.2: attenuation due to sound absorption during multiple reflection (passenger car)(from [4]).
Figure 1.3: Tire/road noise on a drainage asphalt pavement and on a dense asphalt pave-ment.Top: passenger car, 60 km/h - Bottom: heavy truck, 60 km/h.Zone A: sound reduction effect due to sound absorption.The curve A + ∆LT is the expected tire/road noise level with the absorption effect sup-pressed. (from [4]).
LTE 0423 7

Chapter 1 – Experimental observations
”Proefvak Welschap” experiment [5] In the 90’s controlled pass-by measurementswere performed in the frame of the Dutch research project ”Proefvak Welschap”. Pass by1/3 octave levels were evaluated at 60 km/h and 120 km/h (Fig 1.4).
Figure 1.4: 1/3 octave spectra of porous surfaces relative to the reference surface No4(0 dB)From [5]
Two porous surfaces turn out to have the same type of rolling course (porous layerwith 4/8 grading): one is a single layer 4 cm thick, the other a double layer (lower layer:11/16 grading, 4.5 cm thick; upper layer: 4/8 grading, 2.5 cm thick).
It can thus be expected that the tire noise generation (vibration and air pumping)is the same on both surfaces and that pass-by noise level differences should be due todifferences in the acoustic absorption properties of the pavements.
The measured level differences are given Table 1.1. They depend little on speed. Atlow frequencies both surfaces yield the same tire road noise as expected. The doublelayer becomes ”quieter” than the single layer in the octave 800 Hz, ”noisier” in the octave1600 Hz, quieter again in the octave 3200 Hz (Fig 1.4).
km/h 500 630 800 1000 1250 1600 2000 2500 3150 4000
60 -2 -4 -7 -5 +3 +5.5 +2.5 -3 -2.5 +2120 0 -4 -5.5 -5 +2 +5 +2 -2 -1 +2
Table 1.1: sound level differences between track 7 (double layer) and track 8 (single layer).The differences were read from Fig 1.4.
LTE 0423 8

Chapter 1 – Experimental observations
The acoustic absorption was measured on cores, in normal incidence using a stationarywave tube. Results are drawn Fig 1.5. The absorption coefficient of the single layer ismaximum at 1040 Hz while it is maximum at 550 Hz for the double layer.
Figure 1.5: Acoustic absorption coefficient in normal incidence.Top: single layer. Bottom: double layer. From [5]
As expected qualitatively, each porous layer turns out to be quieter than the other whenits acoustic absorption is higher: there is some correspondence between sound absorptionand tire noise reduction.
LTE 0423 9

2 – Modeling approach
The tire source is modeled by by an omnidirectional point source. This is a great simplifi-cation of the phenomena at stake. It may nevertheless give relevant information regardingnoise attenuation over absorbing surfaces. It will be checked later on by comparing theresults to those obtained using another model which takes into account the noise radiatedby a vibrating tyre over an absorbing surface.
2.1 The model
2.1.1 Point source over an absorbing surface
The geometry of the problem is given Fig 2.1: the acoustic pressure field created by thepoint source over the surface is made of a direct field and a reflected field. The reflectedfield is obtained using an image method1: the acoustic reflection is formulated using areflection coefficient Q(f, θ). The pressure level Lp is written
Lp(f) = Lw(f) − 10 ∗ log(4πr2s) + 20 ∗ log |1 +
ri
rsQ(f, θ) eik∆r| (2.1)
with Lw(f) the acoustic power of the source at frequency f , ∆r = |ri − rs|.
Figure 2.1: Geometry of source and receiver
The reflection coefficient2 Q(f, θ) is expressed in terms of the plane wave reflection
1The principle, easily justified for a reflection by a porous half space, has been ”heuristically” extendedto reflection by single or multiple layers [6]. The validity of this extension will eventually be addressed inanother report.
2Q depends on several factors as can be seen in Eq 2.2; we write Q(f, θ) to stress the dependency onfrequency and angle of ”incidence”, similarly for Rp(f, θ)
LTE 0423 10
Chapter 2 – Modeling approach
coefficient Rp(f, θ) (cf. for instance [7, 8]):
Q(f, θ) = Rp(f, θ) + [1 − Rp(f, θ)] F (w)
F (w) = 1 + iπ1/2we−w2
erfc(−iw)
w =1 + i
2(kori)
1/2 [cos θ + ρoco/Z(f, θ)] (2.2)
Rp(f, θ) =cos θ − ρoco/Z(f, θ)
cos θ + ρoco/Z(f, θ)(2.3)
ρoco the air impedance, θ the angle with respect to the surface normal, Z(f, θ) the surfaceimpedance for plane-wave, ko = 2πf/co the wave number in air, ri the distance betweenthe the image source and the receiver (Fig 2.1).
2.1.2 Attenuation by absorption effect
The acoustic absorption effect of the pavement will be characterized by the difference∆LPB in pass-by maximum sound pressure level between what is observed over the ab-sorbing surface (0 < Q < 1) and what is observed over a perfectly reflecting surface(Q = 1). For the point source model it is :
∆LPB(f) = 20 log |1 +ri
rsQ(f, θ) eik∆r| − 20 log |1 +
ri
rseik∆r| (2.4)
Tyre noise radiation is reckoned to be most important in the vicinity of the contact zone,the source will thus be placed on the surface, i.e. hs = 0. Consequently ri = rs and∆r = 0.
The estimation of the pass-by tyre noise level reduction is then given by the expression
∆LPB(f, θ) = 20 log [|1 + Q(f, θ)|/2] (2.5)
When Q = 1 (full reflection), ∆LPB = 0, there is no difference in the pass-by levels(both surfaces are fully reflecting); when Q = 0 (full absorbtion) the pass-by level overthe absorbing surface differs by ∆LPB = −6 dB from the one over the perfectly reflectingsurface.
2.1.3 Acoustic impedance of a multiple layer
The attenuation by acoustic absorption depends on the reflection coefficient Q(f, θ), whichitself depends on the geometry (θ and ri) and on the acoustic impedance Z(f, θ) of thesurface.
For the general case of a multiple layer, the acoustic impedance is obtained by iterationstarting from the lower layer [9]: the ’top’ impedance Z of each successive layer is givenby
Z = WW + ZB coth γe
ZB + W coth γe(2.6)
where ZB and e are the ’backing’ impedance and the thickness of the layer, W and γ itsspecific acoustic impedance and propagation constant given by3:
W =ρc
µγ = i
ω
cµ µ =
√
1 − c2o
c2sin2 θ (2.7)
ρ and c are the complex density and celerity of the layer medium. The expressions takeinto account the oblique incidence throughout the quantity µ ( [6, 9] for instance).
3The convention eiωt is used here
LTE 0423 11

Chapter 2 – Modeling approach
2.1.4 Modeling of the porous medium
The modelling used here for porous media is the phenomenological model [10,11]: a porousmedium is characterized by three physical parameters: its specific airflow resistance Rs,porosity4 Ω, and tortuosity K. The complex density and celerity of the medium are givenby
ρ = ρoK
Ω[1 − ifµ/f ] c = co
1√K
[1 − ifµ/f ]−1/2
[
1 +γp − 1
1 + if/fθ
]
−1/2
(2.8)
fµ =1
2π
Rs
ρo
Ω
Kfθ =
1
2π
1
Npr
Rs
ρo(2.9)
γp = 1.4 and Npr = 0.71 are the specific heat ratio and Prandtl number for air.
2.2 Experimental validation
In the ”Proefvak Welschap” experiment the pass-by noise levels were measured with amicrophone at 5 m height [5]
hs hr dr θ
0 5 m 7.5 m 56o
Table 2.1: Geometry used for the for the experiment [5].
2.2.1 Physical characteristics determined from the absorption measure-ments
The physical characteristics of the two layers are estimated from the absorption values(Fig 1.5), the results are given Table 2.2. For the estimation it is assumed that the
e Rs Ω K[cm] [kNs/m3]
single layer 4.24 25.8 0.20 2.6
double: upper layer 2.83 25.8 0.20 2.6double: lower layer 3.85 21.0 0.24 5
Table 2.2: Physical characteristics estimated from measured absorption values (Fig1.5)
characteristics of the double layer rolling course (upper layer) are the same that those ofthe single layer. Calculated and measured absorption values are drawn Fig 2.2.
The estimated ∆LPB values of the two porous pavements, are drawn Fig 2.3 (graph tothe left). The corresponding difference between the pavements ∆LPB,double −∆LPB,single
is drawn on the graph to the right together with the experimental values. The calculatedvalues seem somewhat shifted w.r.t. the experimental values.
2.2.2 Physical characteristics adjusted to the attenuation values
The observed differences may be due various causes: too simple a modeling, erroneousvalues for the characteristics, etc. The objective of this work is not to restitute the realitybut to check whether a simple model can give a satisfactory estimation of this reality.
4air filled pores connected to the upper surface
LTE 0423 12

Chapter 2 – Modeling approach
125 250 500 1000 2000 4000
0.1
0.2
0.3
0.4
0.5
0.6
0.7
0.8
0.9
1absorption
INR
ET
S_a
o_m
eier
monodouble
Figure 2.2: Normal incidence absorption coefficient of the single and double layer.Lines: using values from Table 2.2. Circles: experimental values
.
125 250 500 1000 2000 4000−10
−9
−8
−7
−6
−5
−4
−3
−2
−1
0
1
Hz
∆ Lp(f)
dB
att_
von_
m
singledouble
125 250 500 1000 2000 4000−10
−8
−6
−4
−2
0
2
4
6
8
10
∆ Lp, double
− ∆ Lp, single
dB
Hz
att_
von_
m
Figure 2.3: Left: ∆LPB(f) of the single and the double layer pavements. Right: resultingpass-by noise level differences between the two pavements - The calculations (lines andcircles) are made using Table 2.2 values. The experimental values are those of Table 1.1.
Changing the thickness of the layers as indicated Table 2.3 improves the correspon-dence between measured and calculated attenuations5 (Figure 2.4, graph to the right) butdegrades the correspondence between the absorption coefficients (Fig 2.5).
Conclusion Despite these discrepancies it appears that the pass-by noise level differ-ences between these two porous pavements6 can be explained by a difference in theiracoustic absorption properties. The pass-by level difference can reasonably be estimatedusing the simple omnidirectional point source model.
5There may be other combinations which yield a good fit.6which have a same surface texture
LTE 0423 13

Chapter 2 – Modeling approach
e [cm] Rs [kNs/m3] Ω K
single layer 3.0 25.8 0.20 2.6
double: upper layer 2 25.8 0.20 2.6double: lower layer 3.0 21.0 0.24 5
Table 2.3: Physical characteristics fitted for the excess attenuation (Fig 2.4)
125 250 500 1000 2000 4000−10
−9
−8
−7
−6
−5
−4
−3
−2
−1
0
1
Hz
∆ Lp(f)
dB
att_
von_
m
singledouble
125 250 500 1000 2000 4000−10
−8
−6
−4
−2
0
2
4
6
8
10
∆ Lp, double
− ∆ Lp, single
dB
Hz
att_
von_
m
Figure 2.4: Left: ∆LPB(f) of the single and the double layer pavements. Right: resultingdifference between the two pavements. - The calculations (lines and circles) are madeusing Table 2.3 values. The experimental values are those of Table 1.1.
125 250 500 1000 2000 4000
0.1
0.2
0.3
0.4
0.5
0.6
0.7
0.8
0.9
1absorption
INR
ET
S_a
o_m
eier
monodouble
Figure 2.5: Absorption coefficient in normal incidence. Full line: adjusted to absorptionmeasurements (Table 2.2). Dotted line : adjusted to attenuation (Table 2.3).
LTE 0423 14

3 – Parametric study
The pass-by noise levels of the ”Proefvak Welschap” experiment were measured with amicrophone at a height hr = 5 m while the standard height for this kind of measurementsis hr = 1.2 m. For the modeling, the source was positioned on the ground surface:(hs = 0 m) while it is rather considered to be at about 1 cm to 5 cm height [12].
Questions thus raise regarding the absorption effect observed at a standard microphoneheight, the sensitivity of the results to the source height, etc. These points are addressedthrough a parametric study. Evaluations will be made for deviations from a standardsituation. The references will be a single porous layer with characteristics of Table 3.1 andthe standard pass-by measurement geometry as given Table 3.2.
e Rs Ω K
4 cm 20 kNs/m3 0.20 4
Table 3.1: Characteristics of the reference layer
hs hr dr θ
0 1.2 m 7.5 m 81o
Table 3.2: Standard geometry conditions
The plane wave absorption coefficient of the layer at normal incidence is drawn Fig-ure 3.1.
125 250 500 1000 2000 40000
0.2
0.4
0.6
0.8
1Reference layer
Atte
nuat
ion_
para
m
frequency [Hz]
abso
rptio
n co
effic
ient
Figure 3.1: Plane wave absorption coefficient at normal incidence of the reference layer
3.1 Influence of the geometry
Microphone height
As indicated, the pass-by levels of the ”Proefvak Welschap” experiment were measuredwith a microphone at a height hr = 5 m. The motivation of the authors was that the
LTE 0423 15
Chapter 3 – Parametric study
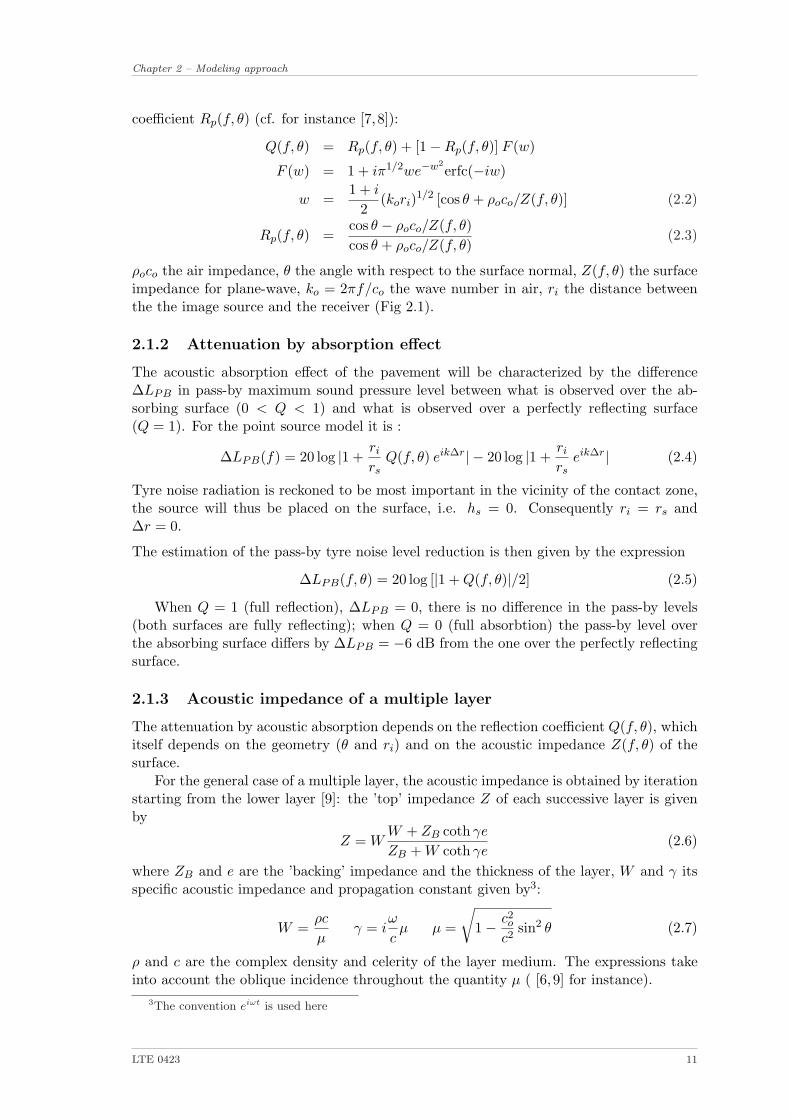
acoustic effect of the absorbing surfaces would be reduced. The modeling confirms thishypothesis: the reduction for hr =1.2 m is more important than for hr =5 m (Figure 3.2).
125 250 500 1000 2000−20
−15
−10
−5
0
5
∆ L P
B [d
B]
frequency [Hz]
atte
nuat
ion_
para
m
variable : mic position
hr = 1.2 m
hr = 3.5 m
hr = 5.0 m
Figure 3.2: Influence of the microphone height
Choosing hr =3 m instead of hr =5 m does not change much the results.
Source height
For a microphone at hr = 1.2 m height, ∆LPB does not vary much when the source heightchanges from 1 cm to 4 cm or 8 cm (Figure 3.3 graph to the left).
125 250 500 1000 2000−20
−15
−10
−5
0
5
∆ L P
B [d
B]
frequency [Hz]
atte
nuat
ion_
para
m
variable : source postion
hs = 0 cm
hs = 4 cm
hs = 8 cm
125 250 500 1000 2000 4000−20
−15
−10
−5
0
5
∆ L P
B [d
B]
frequency [Hz]
atte
nuat
ion_
para
m_t
iers
variable : source postion
hs = 0 cm
hs = 4 cm
hs = 8 cm
Figure 3.3: Influence of the source height. Left: with hr = 1.2 m. Right: with hr = 5.0 m.
The situation is not the same for a microphone at hr = 5 m: pronounced interferencesoccur in the high frequency range, creating large differences in a narrow frequency range.The results are thus given in 1/3 bands1 to smooth out the interference effects.
The results obtained with a source at hs = 4 cm are close to those obtained with asource on the surface. With a source at hs = 8 cm the interference (k∆r = π) occurs withinthe considered frequency range (around 2000 Hz); in the neighborhood of the interferencethe reflecting surface appears less noisy than the absorbing surface2.
Horizontal distance
A deviation of 50 cm from the dr = 7.5 m standard value has little effect on the attenuation.
1i.e. taking for ∆LPB 1/3 differences between 1/3 octave levels, not differences between levels at thecentral frequencies.
2For hr =1.2 m the interference occurs beyond 6000 Hz.
LTE 0423 16

Chapter 3 – Parametric study
125 250 500 1000 2000−20
−15
−10
−5
0
5
∆ L P
B [d
B]
frequency [Hz]
atte
nuat
ion_
para
m
variable : Horizontal distance
dr = 7.00 m
dr = 7.50 m
dr = 8.00 m
125 250 500 1000 2000 4000−20
−15
−10
−5
0
5
∆ L P
B [d
B]
frequency [Hz]
atte
nuat
ion_
para
m_t
iers
variable : Horizontal distance
dr = 7.00 m
dr = 7.50 m
dr = 8.00 m
Figure 3.4: Influence of the horizontal distance. Left: hr = 1.2 m. Right: hr = 5.0 m.
3.2 Influence of the physical characteristics
In this part the term ’acoustic absorption’ in the figure captions refers to the plane waveacoustic absorption coefficient at normal incidence.
3.2.1 Layer thickness
125 250 500 1000 2000 40000
0.2
0.4
0.6
0.8
1
Atte
nuat
ion_
para
m
frequency [Hz]
abso
rptio
n co
effic
ient
variable : Layer Thickness
e = 2.0 cme = 4.0 cme = 8.0 cm
125 250 500 1000 2000−20
−15
−10
−5
0
5
∆ L P
B [d
B]
frequency [Hz]
atte
nuat
ion_
para
m
variable : Layer Thickness
e = 2.0 cme = 4.0 cme = 8.0 cm
Figure 3.5: Influence of the layer thickness.Left: acoustic absorption. - Right: attenuation ∆LPB
The evolution of ∆LPB somewhat follows the evolution of the acoustic absorption, par-ticularly regarding the shift of the frequencies at which minimum attenuation/ maximumabsorption occur.
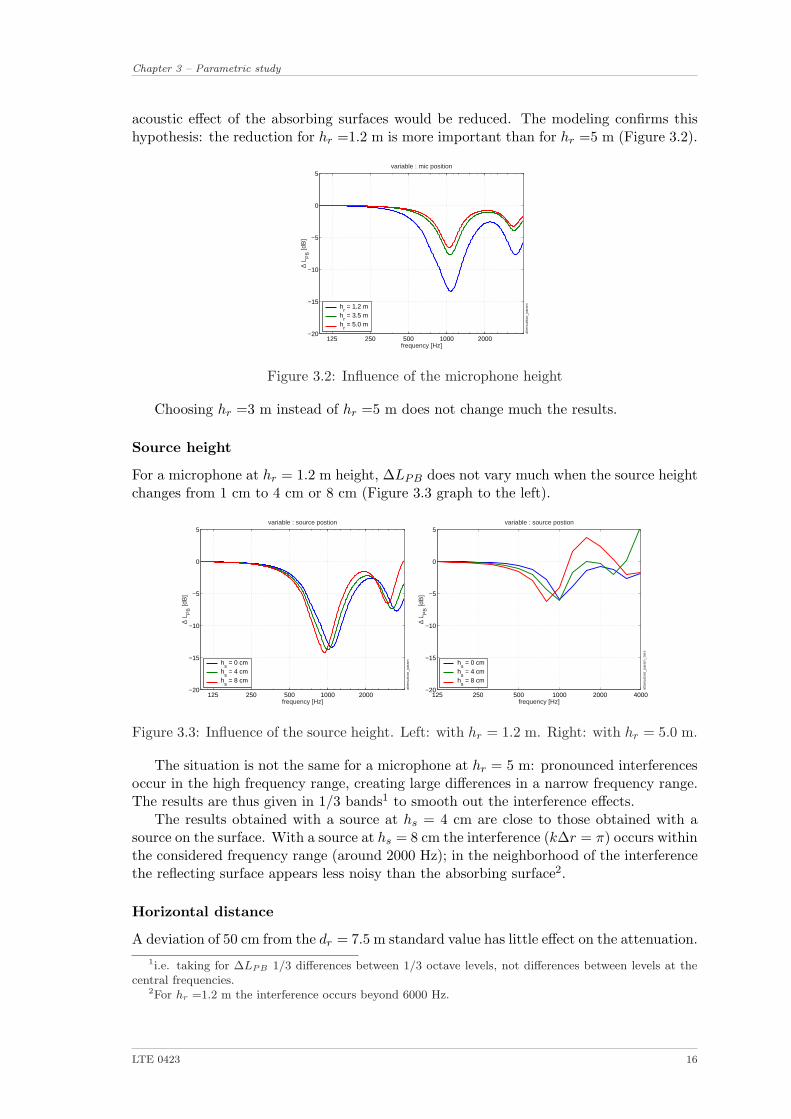
3.2.2 Tortuosity of the porous medium
Same comments as above, except that the tortuosity has little effect on the maximumabsorption while it changes the minimum attenuation.
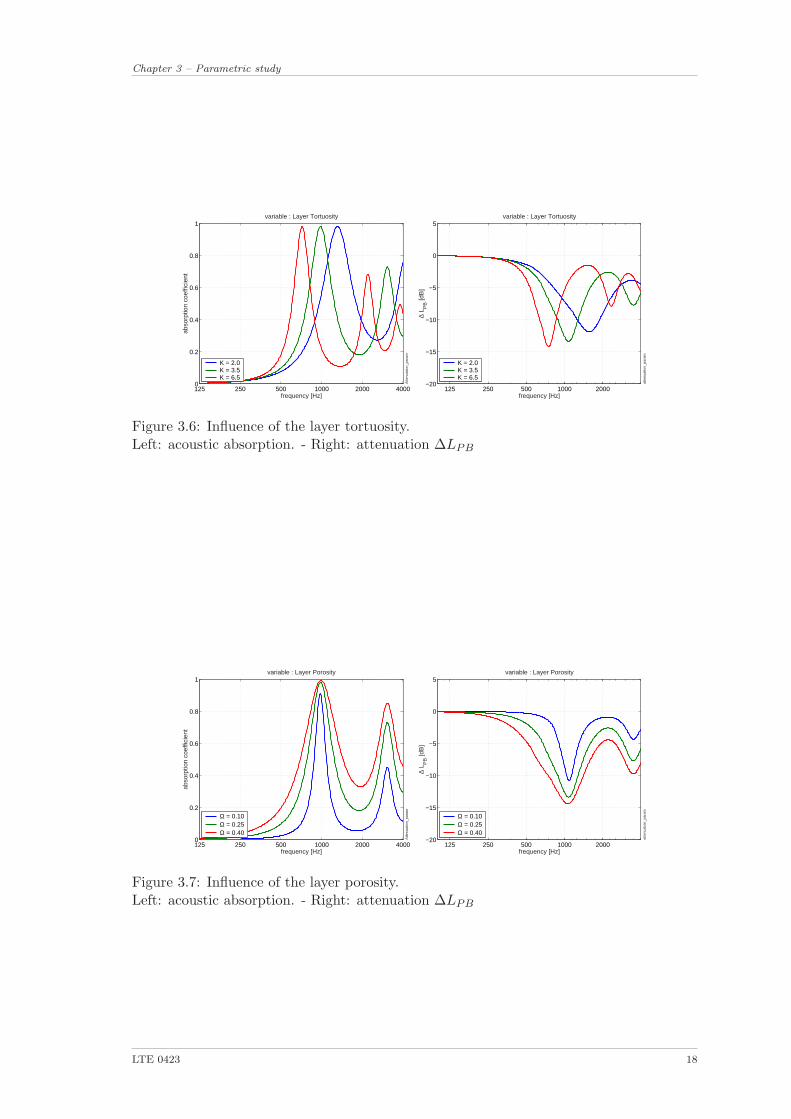
3.2.3 Porosity of the porous medium
The porosity widens the zone of the extremum.
LTE 0423 17
Chapter 3 – Parametric study
125 250 500 1000 2000 40000
0.2
0.4
0.6
0.8
1
Atte
nuat
ion_
para
m
frequency [Hz]
abso
rptio
n co
effic
ient
variable : Layer Tortuosity
K = 2.0K = 3.5K = 6.5
125 250 500 1000 2000−20
−15
−10
−5
0
5
∆ L P
B [d
B]
frequency [Hz]
atte
nuat
ion_
para
m
variable : Layer Tortuosity
K = 2.0K = 3.5K = 6.5
Figure 3.6: Influence of the layer tortuosity.Left: acoustic absorption. - Right: attenuation ∆LPB
125 250 500 1000 2000 40000
0.2
0.4
0.6
0.8
1
Atte
nuat
ion_
para
m
frequency [Hz]
abso
rptio
n co
effic
ient
variable : Layer Porosity
Ω = 0.10Ω = 0.25Ω = 0.40
125 250 500 1000 2000−20
−15
−10
−5
0
5
∆ L P
B [d
B]
frequency [Hz]
atte
nuat
ion_
para
m
variable : Layer Porosity
Ω = 0.10Ω = 0.25Ω = 0.40
Figure 3.7: Influence of the layer porosity.Left: acoustic absorption. - Right: attenuation ∆LPB
LTE 0423 18

4 – Acoustic absorption and noise attenuation
In the parametric study, sound attenuation and acoustic absorption appeared to be instrong correspondence. A priori it does not have to be so:
• the acoustic absorption deals with energy values, 1 − |Rp|2 for plane waves 1 − |Q|2for spherical waves, while the attenuation deals with modulus and phase values:20 ∗ log |1 + Rp| for the plane waves, 20 ∗ log |1 + Q| for the spherical waves,
• the observed correspondence occurs between the plane wave acoustic absorption innormal incidence 1−|Rp(f, 0o)|2 and the spherical wave attenuation at quite obliqueincidence 20 ∗ log |1 + Q(f, 81o)| for the standard pass-by geometry.
These points will be addressed in this chapter.
The absorbing layer and the geometry conditions used for the numerical evaluations arethe standards of the preceding chapter (Tables 3.1 and 3.2).
4.1 Acoustic absorption for plane waves and spherical waves
The acoustic absorption coefficients 1−|Rp|2 for plane waves 1−|Q|2 for spherical waves aredrawn Figure 4.2 in normal incidence condition (graph to the left) and oblique incidencecondition (graph to the right).
125 250 500 1000 2000 40000
0.1
0.2
0.3
0.4
0.5
0.6
0.7
0.8
0.9
1normal incidence
abso
rptio
n co
effic
ient
ao_a
sphe
_com
par
planespherical
125 250 500 1000 2000 40000
0.1
0.2
0.3
0.4
0.5
0.6
0.7
0.8
0.9
1
oblique indicence − hr = 1.2 m
abso
rptio
n co
effic
ient
ao_a
sphe
_com
par
1−|Rp(0)|
spherical
Figure 4.1: Plane-wave and spherical-wave absorption coefficients. Left: normal incidence.Right: θ = 81o
The absorbing properties of the pavement in normal and oblique incidence are quitedifferent:
• At normal incidence (left graph), high values are observed in narrow frequency ranges(∼ 100 Hz and 3000 Hz)
• At oblique incidence, with here a rather high angle with respect to the normal(θ ∼ 81o), the absorption is important from 1000 Hz on.
LTE 0423 19

Chapter 4 – Acoustic absorption and noise attenuation
As expected the coefficients at normal incidence are close. At oblique incidence differencesare mainly observed in the low frequency range.
4.2 Reflection coefficient and noise reduction
The noise reduction ∆LPB = 20 ∗ log(|1 + Q(f, θ)|/2) can be estimated using the planewave reflection coefficient, i.e. by the quantity 20 ∗ log(|1 + Rp(f, θ)|/2), provided theevaluation is made at the actual angle of incidence (Figure 4.2 graph to the right).
125 250 500 1000 2000 4000−12
−10
−8
−6
−4
−2
0
dB
frequency [Hz]
atte
nuat
ion∆ L
p20 log |1+ R
p(0)|
125 250 500 1000 2000 4000−12
−10
−8
−6
−4
−2
0
dB
frequency [Hz]
atte
nuat
ion∆ L
p20 log |1+ R
p(81°)|
Figure 4.2: Noise reduction ∆LPB(f, 81o) and estimation 20 ∗ log(|1 + Rp|/2) . Left:Rp(f, 0). Right: Rp(f, 81o)
The estimation cannot be made using the normal incidence plane wave reflection coefficientRp(f, 0): the result is erroneous (Figure 4.2 graph to the left).
4.3 Absorption coefficient and noise reduction
125 250 500 1000 2000 4000
0
0.5
1
∆ Lp vs. normal absorption
abso
rptio
n
125 250 500 1000 2000 4000−10
−5
0
∆ L p
125 250 500 1000 2000 4000
0
0.5
1
abso
rptio
n
∆ Lp vs. oblique absorption
125 250 500 1000 2000 4000−10
−5
0∆
L p
Figure 4.3: Noise reduction ∆LPB(f, 81o) and plane wave absorption coefficient a = 1 −|Rp|2. Left: normal incidence absorption coefficient ao(f). Right: oblique (θ = 81o)incidence absorption coefficient a81(f)
A strong correspondence is observed between the plane wave (energetic) absorptioncoefficient a and the pass-by noise level reduction ∆LPB, but strangely enough, this cor-respondence occurs between the normal incidence absorption coefficient ao(f) and theoblique incidence pass-by noise reduction ∆LPB(f, 81o) (Figure 4.3 graph to the left).The reason of this will not be addressed in this report.
LTE 0423 20

Chapter 4 – Acoustic absorption and noise attenuation
4.4 Estimating ∆LPB from ao
The following conventions are used:
< ao(fc) >≡ 1
∆fc
∫ fcsup
fcinf
ao(f)df =1
∆fc
∫ fcsup
fcinf
[
1 − |Rp(f, 0)|2]
df (4.1)
∆LPB(fc, θ) = 10 logE(fc, Q)
E(fc, 1)(4.2)
E(fc, Q) =
∫ fcsup
fcinf
|1 + Q(f, θ)|2 df (4.3)
< ao(fc) > is the average of the acoustic absorption coefficient in normal incidence, takenover the 1/3 octave bandwidth (central frequency fc, frequency bandwidth ∆fc = fcsup −fcinf ).
A set of values < ao >,∆LPB is used to evaluate the correspondence between theacoustic absorption and the pass-by noise level reduction. It is created by considering asingle porous layer and by changing its characteristics (within realistic ranges of values).
Relation between ∆LPB and < ao(fsh) > in each 1/3 octave
0 0.5 1−15
−10
−5
0
250 Hz
∆ L P
B
0 0.5 1−15
−10
−5
0
315 Hz
0 0.5 1−15
−10
−5
0
400 Hz
0 0.5 1−15
−10
−5
0
500 Hz
0 0.5 1−15
−10
−5
0
630 Hz
∆ L P
B
0 0.5 1−15
−10
−5
0
800 Hz
0 0.5 1−15
−10
−5
0
1000 Hz
0 0.5 1−15
−10
−5
0
1250 Hz
0 0.5 1−15
−10
−5
0
1600 Hz
∆ L P
B
< ao(f
sh.)>
0 0.5 1−15
−10
−5
0
2000 Hz
< ao(f
sh.)>
0 0.5 1−15
−10
−5
0
2500 Hz
< ao(f
sh.)>
0 0.5 1−15
−10
−5
0
3150 Hz
< ao(f
sh.)>
ao_a
tt_co
rr
Figure 4.4: Relation between < ao(fsh) >) and ∆LPB
It can be observed in the parametric study that the ao(f) and ∆LPB(f, 81o) curvesare slightly shifted in frequency (see also Figure 4.3, graph to the left). This is taken intoaccount in the numerical evaluation by frequency shifting the ao curve. The third octaveao mean value for the frequency band with central frequency fc expressed in terms of the
LTE 0423 21

Chapter 4 – Acoustic absorption and noise attenuation
shifting coefficient C is
< ao(fsh) >=1
∆fc
∫ fcsup
fcinf
ao(f/C)df (4.4)
The < ao(fsh) >,∆LPB correspondence is found to be best for C = 0.91. This caseis drawn Figure 4.4. It is seen to be indeed very strong, and somewhat independent offrequency.
In the remaining < ao(fsh) > will implicitly mean C = 0.91
Relation between ∆LPB and < ao(fsh) > independently of frequency
Plotting the whole set < ao(fsh) >,∆LPB(fc, 81o) on a single graph (Figure 4.5, graphto the left) yields a satisfactory correspondence.
The regression law is found to be:
∆LPB(fc, 81o) = −11.9× < ao(fsh) > dB (4.5)
Remark If a correspondence is looked for between the attenuation ∆LPB(fc, 81o) andthe usual absorption coefficient ao(fc) in normal incidence, the result is less satisfactory(Figure 4.5, graph to the right) although the same trend remains.
0 0.2 0.4 0.6 0.8 1−15
−10
−5
0
mean < ao(f / 0.91) >
∆ L P
B [d
B]
ao_a
tt_co
rr
0 0.2 0.4 0.6 0.8 1−15
−10
−5
0
ao (f
c)
∆ L P
B [d
B]
ao_a
tt_co
rr
Figure 4.5: Relation between ao and ∆LPB - Left: using the mean of the frequency shiftedcoefficient:< ao(fsh) > - Right: using the standard absorption coefficient: ao(fc)
LTE 0423 22

Chapter 4 – Acoustic absorption and noise attenuation
4.5 Example
Two estimations obtained using Eq 4.5 are illustrated Figure 4.6. The graph on the left isobtained on the standard single layer (characteristics of Table 3.1), the graph to the rightis obtained on a layer twice as thick.
125 250 500 1000 2000 4000−20
−15
−10
−5
0
5
∆ L P
B [d
B]
frequency [Hz]
ao_a
tt_ve
rif
∆ LPB
−11.9 × ao(f)
−11.9 × <ao(f
sh)>
125 250 500 1000 2000 4000−20
−15
−10
−5
0
5
∆ L P
B [d
B]
frequency [Hz]
ao_a
tt_ve
rif
∆ LPB
−11.9 × ao(f)
−11.9 × <ao(f
sh)>
Figure 4.6: ∆LPB (blue bars) and its estimations. Yellow circles: −11.9× < ao(fsh., 0) >- Dotted curve : −11.9 × ao(fc)Left: standard layer 4 cm thick. Right: layer 8 cm thick
The numerical estimation of ∆LPB using Eq 4.5 (yellow circles on the graph) is rathersatisfactory considering the simplicity of the formula. For these two examples, the evenmore simple estimation ∆LPB = −11.9 × ao(fc) appears to be also acceptable (dottedcurve on the graphs).
LTE 0423 23

5 – Conclusion
The pass-by noise reduction observed on porous surfaces as compared to impervious sur-faces (ceteris paribus) is attributed to two factors: a decrease of the air pumping noisegeneration due to porosity effect, a reduction of the radiated noise due to absorption andpropagation effects. The study addresses the reduction of the radiated noise and focuseson tyre/ road noise.
The tyre/road source is modeled by a simple omnidirectional point source placed directlyon the surface. This is a great simplification of the source. The results will deserve to becompared to evaluations obtained with models taking into account the actual dimensionsof the tyre, the horn effect etc.
The propagation effects are evaluated using the image source method. This method, de-veloped for a simple interface between two semi infinite media has been extended to singleand multiple layers in some heuristic way. Although it is now used extensively by many,it will be checked in a further study by comparing it to another method.
The model explains rather well differences in pass-by levels measured over two poroussurfaces of similar rolling course and different acoustic absorption.
A numerical correspondence is found between the absorption coefficient in normal inci-dence and the pass by level difference obtained between a source over the absorbing surfaceand the source over a reflecting surface. The absorption and attenuation curves in functionof frequency have similar shapes but are slightly shifted in frequency.
A numerical law is evaluated for standard pass-by measurement conditions (microphoneat 7.5 m distance and 1.2 m height). The law is formulated in 1/3 octave values betweenthe frequency shifted absorption coefficient and the attenuation:
∆Lp(fc, 81o) = −11.9× < ao(fsh., 0) > dB
The law is independent of the 1/3 octave frequency.
LTE 0423 24

Bibliography
[1] N-A. Nilsson. Possible methods of reducing external tire noise. In Internationaltire-noise conference (INTROC), Stockholm, 1979.
[2] W. Liedl. Der einfluss derfahrbahn aus das gerausch profilloser reifen und ein beitragzu seiner erklarung. l’influence de l’etat de la route sur le bruit des pneus lisses et sonexplication. Automobil-Industrie, 22 (3)(3 sept 1977), 1977.
[3] U. Sandberg and G. Descornet. Road surface influence on tire/road noise - part 1. InInternoise, pages 259–272, Miami, 1980.
[4] Y. Oshino, T. Mikami, H. Ohnishi, and H Tachibana. Investigation into road vehiclenoise reduction by drainage asphalt pavement. Journal of the Acoustical Society ofJapan (E), 20(1):75–84, 1999.
[5] A. von Meier, G.J. van Blokland, and G.G. van Bochove. Reduction of trafic noiseby road surface design and tyre-road matching. Technical Report MP.94.1.1, M+P,1994.
[6] Kai Ming Li, Tim Waters-Fuller, and K. Attenborough. Sound propagation froma point source over extended reaction ground. Journal of the Acoustical Society ofAmerica, 104(2) Pt.1(August 1998):679–685, 1998.
[7] T.F.W. Embleton, J.E. Piercy, and N. Olson. Outdoor sound propagationover groundof finite impedance. Journal of Acoustical Society of America, 59(2)(Feb. 1976):267–277, 1975.
[8] Michael R. Stinson. A note on the use of an approximate formula to predict a soundfields above an impedance plane due to a point source. JASA, 98(3)(September1995):1810–1812, 1995.
[9] J-F. Hamet. Modelisation acoustique d’une chaussee drainante. coefficientd’absorption acoustique en incidence oblique d’un systeme multicouches. TechnicalReport N101, INRETS, 1989.
[10] J-F. Hamet. Modelisation acoustique d’un enrobe drainant. prise en compte desphenomenes de thermoconductivite dans une nouvelle formulation phenomenologique.Technical Report N159, INRETS, 1992.
[11] J-F. Hamet and M. Berengier. Acoustic characteristics of porous pavements: a newphenomenological model. In Internoise, volume II, pages 641–646, Leuven, 1993.
[12] M-A. Pallas, D. Gaulin, and M. Berengier. Vertical description of the noise sources ofa moving pasenger car. In International conference on sound and vibration, Garmish-Partenkirchen, 2000.
LTE 0423 25