reduced graphene oxide films as transparent counter-electrodes for dye-sensitized solar cells
TRANSCRIPT

Available online at www.sciencedirect.com
www.elsevier.com/locate/solener
Solar Energy 86 (2012) 716–724
Reduced graphene oxide films as transparent counter-electrodes fordye-sensitized solar cells
Rui Cruz, David Alfredo Pacheco Tanaka, Adelio Mendes ⇑
LEPAE – Departamento de Engenharia Quımica, Faculdade de Engenharia, Universidade do Porto, Rua Dr. Roberto Frias, s/n 4200-465 Porto, Portugal
Received 10 September 2011; received in revised form 11 November 2011; accepted 18 November 2011Available online 14 December 2011
Communicated by: Associate Editor Frank Nuesch
Abstract
Stand-alone graphene-based films were prepared from graphene oxide (GO) nanoplatelets and their use as counter-electrodes (CEs) indye-sensitized solar cells (DSCs) was investigated. The graphene-based CEs were produced by spray deposition of GO and chemicallyreduced GO, followed by thermal annealing under an inert atmosphere. These GO-based CEs were shown to have similar transparencyas a reference CE made of Pt. Consistent with impedance data from symmetrical half-cells, DSCs assembled with such GO-based CEsexhibited relative efficiencies of ca. 75% comparatively to the reference Pt CE. The possibility of obtaining transparent (transmittancehigher than 80%) and reasonable catalytic films for DSCs (energy conversion efficiency of 2.64%) from GO nanoplatelets was demon-strated. The need for reduction of the graphene oxide nanoplatelets prior to deposition was not observed, allowing for a simplified CEmanufacturing process. However, further work is still needed to equal or surpass the performance of Pt CEs.� 2011 Elsevier Ltd. All rights reserved.
Keywords: Dye-sensitized solar cell; Graphene oxide; Transparent counter-electrode; Annealing; Thermal reduction
1. Introduction
In the last few years, the interest in dye-sensitized solarcells (DSCs) has grown considerably as they are seen as apromising alternative to conventional photovoltaic devicesfor producing electrical power due to their potential forlow production costs.
A conventional DSC comprises (O’Regan and Gratzel,1991): a dye-absorbed mesoporous nanocrystalline TiO2
film deposited onto a transparent conductive oxide(TCO) coated glass substrate, an iodide/triiodide redoxcouple-based electrolyte and a TCO coated glass substratecovered by a catalytic material acting as a the counter-electrode (CE). The CE plays a key role in DSC as itreceives electrons from the external circuit and reduces(electrocatalyzes) the redox species in the electrolyte used
0038-092X/$ - see front matter � 2011 Elsevier Ltd. All rights reserved.
doi:10.1016/j.solener.2011.11.010
⇑ Corresponding author.E-mail address: [email protected] (A. Mendes).
for regenerating the sensitizer after electron injection. TheCE is usually made of a thin layer of platinum (Pt); however,due to the scarcity nature of this noble metal (Smestadet al., 1994), it is important to develop new low-cost CEsusing materials that are simultaneously abundant, non-toxic and capable of yielding DSCs of relatively high con-version efficiency. An ideal CE should have low electricalresistance and high electrocatalytic activity towards theiodide/triiodide (I�=I�3 ) redox reaction, while being stableand as transparent as possible. Transparency is not manda-tory but offers added value to numerous applications(facades, windows, roof panels, etc.). Moreover it enablesits use in other applications, such as tandem cells (Gratzel,1999; Yamaguchi et al., 2009).
Previous studies have tried to reproduce the Pt’s cata-lytic activity by using different carbonaceous materials –carbon black (CB) (stand alone or with graphite powder)(Kitamura et al., 2001; Imoto et al., 2003; Murakamiet al., 2006; Murakami and Gratzel, 2008; Denaro et al.,

R. Cruz et al. / Solar Energy 86 (2012) 716–724 717
2009), activated carbon (Imoto et al., 2003) or single(Suzuki et al., 2003) or multi-wall carbon nanotubes(Ramasamy et al., 2008; Cha et al., 2009; Chou et al.,2009); these materials are low cost, resistant to corrosionand have good electrocatalytic activity towards the reduc-tion of triiodide. The active sites responsible for catalysisare located at the edges of the carbon crystals (Murakamiet al., 2006) and their performance is also strongly affectedby the available surface area for reaction (Imoto et al.,2003; Murakami and Gratzel, 2008). In order for these car-bononaceous CEs to have comparable efficiencies to Pt CE,they have to be several lm-thick (Murakami et al., 2006;Murakami and Gratzel, 2008) and thus opaque.
Amidst the carbon materials, graphene has emerged aspotential catalyst for DSC. Graphene, the elementarystructure of graphite, is an atomically thick sheet composedof sp2 carbon atoms arranged in a flat honeycomb structure(Geim and Novoselov, 2007). The most promising path forproducing graphene related compounds, from both scale-up and cost perspectives, is starting from graphene oxide(GO) obtained by a chemical oxidation method and laterreduce it either chemically or thermally (Titelman et al.,2005; Li et al., 2008). The reduced graphene oxide(RGO) possesses some oxygen-containing functionalgroups (AOH and @O) on the planes and ACOOH andcarbonyl groups decorating the periphery of the planes(Si and Samulski, 2008), that, along with lattice surfacedefects produced during the oxidation of the graphenesheets, are believed to be responsible for the electrocatalyticactivity (Hong et al., 2008; Murakami and Gratzel, 2008;Trancik et al., 2008; Wang et al., 2008; Xu et al., 2008;Roy-Mayhew et al., 2010; Zhang et al., 2010; Wan et al.,2011). Owing to that, its use as a CE material is favoredin opposition to perfect, fully-reduced and defect-free,graphene. Additionally, graphene has an exceptional spe-cific high surface area and because it has a higher oxidationpotential than Pt, it should provide more resistance to elec-trocorrosion (Roy-Mayhew et al., 2010).
So far, simultaneously transparent and very efficientCEs comprised solely of graphene have not yet beenobtained. Hong et al. (2008) have used 1-pyrenebutyrate(PB�) functionalized graphene dispersed in a organicmatrix composite of PEDOT: PSS yielding a very transpar-ent CE with a relative difference in efficiency of less ca. 30%than that of a Pt CE. The polymer was used to act as theconductive support with graphene being the responsiblefor the catalysis. Polymer matrixes are often used to avoidagglomeration of powder reduced graphene sheets, butthey prevent the free flowing of electrons (Wang et al.,2008). Choi et al. (2011b) used an hybrid structure ofgraphene and multi-walled carbon nanotubes (GMWNTs)to produce a 3% efficiency DSC.
Zhang et al. (2010) used an ethylcelulose and terpineolprintable paste, containing chemically reduced GO, to fab-ricate a CE with an efficiency of 2.94%, after annealing itat 450 �C in air for 15 min. Roy-Mayhew et al. (2010)have prepared CEs made of graphene functionalized with
oxygen-containing groups (produced from a thermal exfo-liation method) with the aid of a mixture of surfactants andPEO (polyethylene oxide). After carbonizing the electrodesat 350 �C in air, the opaque CE yielded a relative differencein efficiency of ca. 90% compared to a Pt CE. Huh et al.(2011), reported a CE made from partially reduced graph-ene oxide (reduction obtained by annealing the GO at250 �C for 2 min in air) resulting in a ultrathin film withgood transparency but with an efficiency of 2.30%, ca.40% of that of a Pt CE. Very recently Kavan et al. (2010)have used commercially available graphene to fabricate aCE by drop-casting, without any annealing. The producedCE exhibited a transmittance of �85% (k = 550 nm) andan efficiency of 5%, a 72.5% relative efficiency comparedto a Pt CE. Choi et al. (2011a) have used a electrophoretictechnique to deposit chemically RGO, followed by anneal-ing at 600 �C for 1 min, to fabricate a CE with a 85% trans-mittance (k = 550 nm) and a 2.3% efficiency. From thework developed by other authors up to this point, it seemsthat the best results are achieved when RGO (typicallyobtained by chemical reduction) is used.
In this paper we report stand-alone graphene CEs yield-ing similar transparencies and relative efficiencies of ca.75% comparatively to a Pt CE. The graphene-based CEswere produced from depositing both GO and chemicallyRGO over a TCO coated glass substrate, followed byannealing under an inert atmosphere. The obtained resultssuggest that efficient and transparent graphene counterelectrodes can be obtained directly from GO nanoplatelets,thus reducing the complexity of the manufacturing process.Further optimization of the manufacturing procedure isunder study.
2. Experimental
2.1. Preparation of graphene oxide and chemically reduced
graphene oxide
The production of graphene oxide was carried out usingthe modified Hummer’s method (Hummers and Offeman,1958; Stankovich et al., 2007). Graphite was added to asolution of H2SO4 at room temperature; the solution wascooled at 0 �C using an ice bath and then KMnO4 wasadded gradually. The mixture was heated at 35 �C and stir-red for 2 h. After that, water was added into the mixture at0 �C (ice bath). Then H2O2 (30%) was added until no gas isproduced. The solid was filtered, washed with HCl (0.1 M)and water. The graphene oxide was dried under vacuum atroom temperature for 24 h and then triturated using a mor-tar. The as-prepared GO powder, was first exfoliated inwater, for 4 h in a basic pH (ca. 9), with the help ofNH3, 6 M, using an ultrasonic bath. Then, the GO aqueouscolloid was centrifuged twice at 5000 rpm for 30 min. Tochemically reduce the graphite oxide platelets, hydrazine(N2H4 in water, 2 M) and NH3, 6 M, were added to aGO solution and stirred for 30 min. Then the mixturewas heated at 90 �C for 3 h and afterwards centrifuged at

718 R. Cruz et al. / Solar Energy 86 (2012) 716–724
5000 rpm for 30 min to remove aggregates and largersheets. According to particle size distribution analysis (datanot shown here), GO and chemically RGO platelets haddiameters of ca. 2 lm.
2.2. Counter-electrode and half-cell (symmetric dummy cell)
fabrication
For all CEs, conductive fluorine-doped tin oxide (FTO)coated glass substrates (2 mm-thick, 2.5 cm � 2.5 cm, sheetresistance 15 X square�1, Dyesol) were used. Prior to use,FTO-coated glass substrates were washed in an ultrasonicbath with detergent (Alconox, VWR) for 60 min and thenethanol for 45 min. The CE based on Pt (Pt CE) was pre-pared by depositing a Pt paste (Pt-Catalyst T/SP, Solaro-nix) onto the entire surface of the conductive glass usingdoctor-blade, followed by heat treatment at 400 �C for15 min. Graphene-based CEs were prepared by spray depo-sition using a Revell 39101 airbrush, with the aid of a com-pressed flow of reconstituted air. Distance between thesubstrate and the spray nozzle was approximately 10 cm.GO and of chemically reduced GO ethanolic suspensionswith a concentration of 0.06 mg catalytic material per gramof suspension, were prepared from aqueous colloids ofboth materials. These ethanolic suspensions exhibited anegligible sedimentation. The suspensions were sprayedonto the conductive glass substrates placed on a pre-heatedhot-plate at ca. 120 �C. The films were then annealed for60 min at 400 �C under an inert atmosphere. The CEformed by deposition of GO and posterior annealing isreferred hereinafter as annealed GO, or AGO; the CE pre-pared by deposition of chemically RGO and posteriorannealing is referred hereinafter as annealed RGO, orARGO. The AGO and ARGO load applied to each elec-trode was ca. 0.01 mg cm�2.
A half-cell configuration, consisting of two identicalFTO-coated glass substrates coated with the catalyticmaterials (Hauch and Georg, 2001), was used for the elec-trochemical impedance spectroscopy (EIS) study. The half-cell was sealed with a 25-lm thick Surlyn frame (Solaronix)at 100 �C for 15 s. After sealing, the cells were filled with aniodide based electrolyte solution (organic iodide salt, 10–30 wt.%, iodine 10 wt.%, inorganic iodide salt 10 wt.%,imidazole compound 10 wt.% in 3-methoxypropionitrile60 wt.%, EL-HSE, Dyesol) through a pre-drilled 1 mmdiameter hole. These holes were then sealed using a meltedSurlyn disc and a thin glass lamella. The active area, i.e.,the area of the electrode in contact with the electrolyte,was 3 cm2. Half-cells were assembled in duplicate for eachcatalytic material and reproducibility assessed.
2.3. Dye-sensitized solar cell fabrication
DSCs with an active area of 0.6 cm2 were fabricatedaccording to the following procedure: FTO-coated glasssubstrates (2 mm-thick, 2.5 cm � 1.8 cm) were washed inan ultrasonic bath with detergent (Alconox, VWR) and
then ethanol. A TiO2 electrode (photoanode) with a thick-ness of ca. 4–6 lm, was obtained by spreading a TiO2 paste(20-nm sized TiO2 particles, DSL18R-T – Dyesol) onto theconducting glass using the doctor blade technique. Thedeposited paste was sintered in air at 500 �C for 30 min.After cooling to 70 �C, the TiO2 electrode was sensitizedby immersing it in a N719 dye solution (0.3 mM in ethanol,Dyesol) at room temperature for more than 12 h. After-wards the dye-sensitized electrode was rinsed with ethanoland dried in moisture-free environment. Pt and graphene-based CEs were prepared as described above (in Sec-tion 2.2). Each specimen was prepared in duplicate. Thephotoanode and the counter-electrode were sealed with a25-lm thick Surlyn frame at 100 �C for 15 s. After sealing,the cells were filled with an electrolyte solution (iodidebased, EL-HSE Dyesol, Dyesol) through a pre-drilled1 mm diameter hole done in the counter-electrode side.The hole was sealed using a melted Surlyn disc and a thinglass lamella. Reproducibility was achieved for all DSCs.
2.4. Transmittance measurements
Transmittance measurements of the different CEs werecarried out using an UV/VIS/NIR spectrophotometer(Lambda 750, Perkin Elmer). Graphene and Pt films weredeposited on bare and FTO-covered glass substrates. Mea-surements were taken from the coated side. The relativedifference in transmittance between the DSC made withgraphene-based CEs and the Pt-DSC, Ds550 nm, was calcu-lated based on transmittance measured at a wavelength of550 nm, s550 nm, according to the following equation:
Ds550 nm ¼s550 nm;grapheneCE � s550 nm;Pt
s550 nm;Pt� 100 ð1Þ
2.5. Half-cell and dye-sensitized solar cell characterization
The half-cells (HCs) were characterized by electrochem-ical impedance spectroscopy (EIS). EIS experiments werecarried out with a ZENNIUM workstation (Ref. 2425-C,Zahner Elektrik, Germany). The frequency range was100 mHz–100 kHz and the magnitude of the modulationsignal was 10 mV. All the measurements were performedat room temperature in the dark at 0 V and 0.4 V. A ZViewsoftware (Scribner Associates Inc.) was used to process theEIS data. Current density–voltage (I–V) measurementswere also carried out in the dark with a scan rate of100 mV s�1 ranging from �1 V to 1 V.
DSCs were characterized by measuring their currentdensity–voltage (I–V) characteristics and EIS. For I–V
characterization A 150 W xenon light source (Oriel classA solar simulator, Newport USA) irradiating100 mW cm�2 (1 sun light-intensity) at the surface of theDSC and equipped with an air mass filter of 1.5 (Newport,USA) was used. The simulator was calibrated using a singlecrystal Si photodiode (Newport, USA). The I–V character-istics were obtained applying an external potential bias and

70
80
90
100
350 550 750 950 1150
Tra
nsm
itta
nce
/ %
Wavelength / nm
FTO glass
GO
AGO
(a)
70
80
90
100
350 550 750 950 1150
Tra
nsm
itta
nce
/ %
Wavelength / nm
FTO glass
RGO
ARGO
(b)
70
80
90
100
350 850 1350 1850
Tra
nsm
itta
nce
/ %
Wavelength / nm
(c)
ARGO
Pt
AGO
Fig. 1. Transmittance spectra of the CEs made of different materials: (a)GO before and after annealing (AGO) on FTO-coated glass substrate; (b)chemically reduced GO (RGO) before and after annealing (ARGO) onFTO-coated glass substrate; (c) Pt, ARGO and RGO on bare glass.
R. Cruz et al. / Solar Energy 86 (2012) 716–724 719
measuring the generated photocurrent. The photovoltaicparameters (short-circuit current density, Jsc; open-circuitvoltage, Voc; fill factor, FF;) were extracted from the I–V
curve and used to calculate the DSC’s efficiency, g:
g ¼ V OCJ SCFFIS
� 100 ð2Þ
where IS is the intensity of the incident light. The relativedifference in energy conversion efficiency, Dg, between theDSC made with graphene-based CEs and the Pt-DSCwas calculated according to the following equation:
Dg ¼ggrapheneCE � gPt
gPt� 100 ð3Þ
For EIS characterization, a ZENNIUM workstation(Ref. 2425-C, Zahner Elektrik, Germany) was used. Thesemeasurements were performed at room temperature at0.8 V (close to typical open-circuit voltages), in darkconditions.
3. Results and discussion
Graphene with structural defects and oxygen-functionalgroups attached can be used as a stand-alone material formaking DSC’s CE. Graphene defects and functionalgroups promote the electrocatalysis (Hong et al., 2008;Murakami and Gratzel, 2008; Trancik et al., 2008; Wanget al., 2008; Xu et al., 2008; Roy-Mayhew et al., 2010;Zhang et al., 2010; Wan et al., 2011) while the grapheneplatelets are good electronic conductors (Geim and Novoselov,2007). In this work, CE based on graphene oxide of twotypes, RGO and GO, were prepared and critically com-pared with a reference Pt CE.
The use of GO solutions, rather than using RGO,would render a less complex method of preparing CEs.Due to the good solubility properties of GO, it is easierto control the characteristics of the solution to be depos-ited (concentration, etc.) hence providing a tighter controlin the final characteristics of the CE film. Furthermore,the tuning of the surface characteristics (such as morphol-ogy or wettability) is possible upon the use of differentsolvents (Rafiee et al., 2010) or treatments, such as expo-sure to an argon plasma (Wang et al., 2008). Spray depo-sition of ethanolic suspensions yields the mostreproducible results, allowing for a relatively easy deposi-tion; this technique combines small droplet size with rapidevaporation avoiding the concentration process that takesplace upon slow solvent loss (Gilje et al., 2007; Tranciket al., 2008).
3.1. Transmittance measurements
Graphene films were deposited on FTO-coated glass andbare glass. Bare glass was used to assess possible interfer-ences caused by the FTO surface on the graphene films.Transmittance of the different CEs was evaluated and theresults are shown in Fig. 1.
Fig. 1a and b, shows the same trend for both types ofgraphene films concerning transparency, which decreasedafter annealing. Annealing the graphene films under inertatmospheres favors the elimination of oxygen functionalgroups due to thermal-induced decomposition, partiallyrestituting the electronic conjugation (Wang et al., 2008;Xu et al., 2010). Furthermore, annealing enables a betterordering of graphene sheets; accordingly, the films becomedenser and smother, with a lower surface roughness (Wanget al., 2010), and thus less transparent. The graphene films

Rs
2Rct ZN
½C
Fig. 2. Electrical analogue used for fitting the electrochemical impedancespectra data of half-cells.
720 R. Cruz et al. / Solar Energy 86 (2012) 716–724
were also proved to be very transparent for a very largewavelength region (Vis and near infrared) – Fig. 1c. Table 1summarizes the results obtained for AGO, ARGO and Ptfilms prepared on bare and FTO-coated glass substrates,for transmittance measured at a wavelength of 550 nm,s550 nm (Trancik et al., 2008; Wang et al., 2010). Resultsindicate that FTO does not cause any kind of optical inter-ference when graphene sheets are attached on top of it. Bothgraphene films exhibit a high transmittance compared to thePt film, with the ARGO film being even more transparentthan the reference CE. The ARGO film exhibits a highertransparency compared with the AGO film. A possible rea-soning is that as the GO platelets have a greater solubility,the material is less likely to form bundles when sprayed; theGO platelets would therefore be better dispersed, forming amore cohesive film with less openings through which lightcould travel through. Besides the restacking of the graphenesheets to a denser state that takes places during the anneal-ing, the GO film also loses oxygen functional groups yield-ing sp2 character which is more graphitized and ergo lesstransparent (Wang et al., 2010). However, the exact extentof these two phenomena was not determined as it was notwithin the scope of this work.
3.2. Electrochemical impedance spectroscopy of half-cells
Electrochemical impedance spectroscopy (EIS) was usedto assess the catalytic activity of ARGO, AGO and Pt CEsassembled in half-cells. Measurements were taken at roomtemperature, in the dark, at bias voltages of 0 V and 0.4 V.The reference CE made of Pt is normally characterized at0 V because the sensitivity of the characterization methodis maximum (Hauch and Georg, 2001). However, grapheneCE has especial charge carrier mobility behavior (Geimand Novoselov, 2007) that makes desirable to assess its cat-alytic activity closer to a DSC’s real operating conditions,i.e. at a potential difference between 0.4 V and 0. 6 V (typ-ical maximum power point). For example Kavan et al.(2010), reported half-cells made of graphene CEs exhibitinga charge transfer resistance ca. 50–100 times higher thanmade of Pt CE, while the correspondent DSC had a relativedifference in efficiency of only less 27.5% (Pt based cell ismore efficient).
The half-cell’s EIS spectra were fitted to the electricalanalogue shown in Fig. 2, based on the Randles-typecircuit:
In Fig. 2, Rs, is the series resistance, including the TCO’ssheet resistance and the cell’s contact resistances. The
Table 1Transmittance measured at 550 nm, s550 nm, for the tested CEs depositedon different substrates.
CE s550 nm (%)
On bare glass On FTO glass Ds550 nm (%)
Pt 93 85 –ARGO 94 86 1.3AGO 89 81 �4.4
catalytic regeneration of triiodide at the counter-electrode ischaracterized by parameters Rct and C, the charge transferresistance and the capacitance of the electrical double layerat the electrodes, respectively. In the same electrical ana-logue is also represented the diffusion of triiodide withinthe electrolyte solution, described by the Nernst diffusionimpedance ZN. Due to non-idealities, the capacitance wasreplaced by a constant phase element, CPE (Hauch andGeorg, 2001). Good agreement was achieved for all sam-ples between the measured and fitted data. The fitting ofthe EIS experimental data was accomplished with ZView�
software (Scribner Associates Inc.). Additionally, I–V mea-surements were carried out in order to observe the behaviorof the CEs at different voltages. An ideal CE should exhibita great catalytic activity and high electroactivity/low over-potential and transparency. Experimentally, this meansthat the CEs should have a low charge transfer resistance(Rct) since it is directly related to the ability of the materialto catalyse the reduction of I�3 at the CE/electrolyte inter-face; regarding the CE’s capacitance, since it representsthe ability of the film to quickly reduce the electrolyte, itshould be also as low as possible.
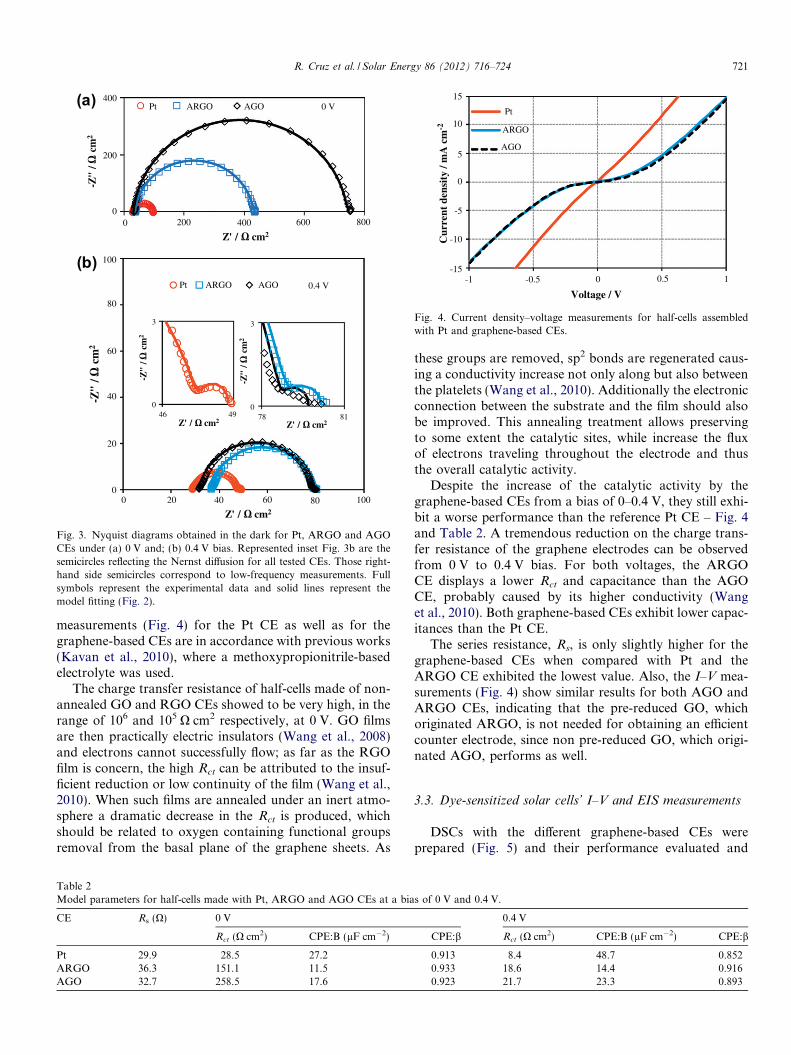
Fig. 3 shows the Nyquist diagrams of CEs in half-cellconfiguration at two bias (0 V and 0.4 V). Left-hand sidesemicircles correspond to high-frequency measurements(more than 10 Hz) and reflect the charge-transfer resistanceand double layer capacitance of the counter-electrode;while right-hand side semicircles (when present) result fromlow-frequency measurements (less than 10 Hz) and areassociated with the Nernst diffusion impedance. Contraryto the Pt CE, when no bias is applied the graphene CEsshow no Nernst diffusion impedance (ZN) (Kavan et al.,2010; Roy-Mayhew et al., 2010). However, as biasincreases, a second low range frequency semicircle, corre-sponding to the Nernst diffusion, becomes apparent(Roy-Mayhew et al., 2010).
Table 2 shows the model parameters obtained from fit-ting the EIS data of half-cells made of Pt, ARGO andAGO CEs, for 0 V and 0.4 V bias. Fig. 4 shows the corre-sponding I–V curves.
From Table 2 it can be seen that for 0 V, the Pt CE’scharge transfer resistance (Rct) is well above the 10 X cm2
threshold recommended for high performance cells (Tranciket al., 2008). However, because of the used half-cell config-uration, the electrode area in contact with the electrolyte(3 cm2) is much greater than traditionally used area(61 cm2). As such, the total resistance of the half-cellbecome affected by the larger area used. Moreover, I–V
0
200
400
0 200 400 600 800
0 VPt ARGO AGO(a)
0
20
40
60
80
100
0 20 40 60 80 100
0.4 VPt ARGO AGO
(b)
0
3
0
3
78 8146 49
Fig. 3. Nyquist diagrams obtained in the dark for Pt, ARGO and AGOCEs under (a) 0 V and; (b) 0.4 V bias. Represented inset Fig. 3b are thesemicircles reflecting the Nernst diffusion for all tested CEs. Those right-hand side semicircles correspond to low-frequency measurements. Fullsymbols represent the experimental data and solid lines represent themodel fitting (Fig. 2).
-15
-10
-5
0
5
10
15
-1 -0.5 0 0.5 1
Cur
rent
den
sity
/ m
A c
m-2
Voltage / V
Pt
ARGO
AGO
Fig. 4. Current density–voltage measurements for half-cells assembledwith Pt and graphene-based CEs.
R. Cruz et al. / Solar Energy 86 (2012) 716–724 721
measurements (Fig. 4) for the Pt CE as well as for thegraphene-based CEs are in accordance with previous works(Kavan et al., 2010), where a methoxypropionitrile-basedelectrolyte was used.
The charge transfer resistance of half-cells made of non-annealed GO and RGO CEs showed to be very high, in therange of 106 and 105 O cm2 respectively, at 0 V. GO filmsare then practically electric insulators (Wang et al., 2008)and electrons cannot successfully flow; as far as the RGOfilm is concern, the high Rct can be attributed to the insuf-ficient reduction or low continuity of the film (Wang et al.,2010). When such films are annealed under an inert atmo-sphere a dramatic decrease in the Rct is produced, whichshould be related to oxygen containing functional groupsremoval from the basal plane of the graphene sheets. As
Table 2Model parameters for half-cells made with Pt, ARGO and AGO CEs at a bia
CE Rs (O) 0 V
Rct (O cm2) CPE:B (lF cm�2)
Pt 29.9 28.5 27.2ARGO 36.3 151.1 11.5AGO 32.7 258.5 17.6
these groups are removed, sp2 bonds are regenerated caus-ing a conductivity increase not only along but also betweenthe platelets (Wang et al., 2010). Additionally the electronicconnection between the substrate and the film should alsobe improved. This annealing treatment allows preservingto some extent the catalytic sites, while increase the fluxof electrons traveling throughout the electrode and thusthe overall catalytic activity.
Despite the increase of the catalytic activity by thegraphene-based CEs from a bias of 0–0.4 V, they still exhi-bit a worse performance than the reference Pt CE – Fig. 4and Table 2. A tremendous reduction on the charge trans-fer resistance of the graphene electrodes can be observedfrom 0 V to 0.4 V bias. For both voltages, the ARGOCE displays a lower Rct and capacitance than the AGOCE, probably caused by its higher conductivity (Wanget al., 2010). Both graphene-based CEs exhibit lower capac-itances than the Pt CE.
The series resistance, Rs, is only slightly higher for thegraphene-based CEs when compared with Pt and theARGO CE exhibited the lowest value. Also, the I–V mea-surements (Fig. 4) show similar results for both AGO andARGO CEs, indicating that the pre-reduced GO, whichoriginated ARGO, is not needed for obtaining an efficientcounter electrode, since non pre-reduced GO, which origi-nated AGO, performs as well.
3.3. Dye-sensitized solar cells’ I–V and EIS measurements
DSCs with the different graphene-based CEs wereprepared (Fig. 5) and their performance evaluated and
s of 0 V and 0.4 V.
0.4 V
CPE:b Rct (O cm2) CPE:B (lF cm�2) CPE:b
0.913 8.4 48.7 0.8520.933 18.6 14.4 0.9160.923 21.7 23.3 0.893

ARGO AGOPt
Fig. 5. DSCs assembled with an ARGO, AGO and Pt CE.
00
20
40
60
80
100
20 40 60 80 100
Pt
ARGO
AGO
(a)
0
10
20
30
40
0.1 1 10 100 1000 10000 100000
-Pha
se /
deg
Frequency / Hz
Pt
ARGO
AGO
(b)
Fig. 7. Nyquist (a) and Bode (b) diagrams obtained in the dark under0.8 V bias for DSCs assembled with Pt, ARGO and AGO CEs.
722 R. Cruz et al. / Solar Energy 86 (2012) 716–724
critically compared with the reference Pt CE. Fig. 6 showsthe I–V characteristic curves for the DSCs. The corre-sponding photovoltaic parameters (short-circuit currentdensity, Jsc; open-circuit voltage, Voc; fill factor, FF; andefficiency, g) are summarized in Table 3. The EIS resultspresented in Fig. 7 were obtained in dark conditions atan applied voltage of 0.8 V, which is approximately theopen circuit voltage of a DSC cell.
The DSCs with graphene-based CEs underperformedcompared to the DSC equipped with the Pt CE. The resultspresented in Table 3 show that the relative difference inenergy conversion efficiency, Dg, between the DSC madewith graphene-based CEs and the Pt-DSC is ca. �25%(�24.6% for the AGO CE and �27.5% for the ARGOCE). The main difference between the cells is the FF thatfor ARGO-DSC is 0.44 and for AGO-DSC is 0.46 whilefor Pt-DSC is 0.61, whilst Jsc and Voc are similar. This issupported by Fig. 7b where the phase peak intensity at�10 Hz, attributed to resistances in the semiconductor, isroughly the same for all three CEs. The left-hand side semi-circle of the Nyquist diagram – Fig. 7a – corresponding to
0
2
4
6
8
0 0.2 0.4 0.6 0.8
Cur
rent
den
sity
/ m
A c
m-2
Voltage / V
Pt
ARGO
AGO
Fig. 6. I–V characteristics measured at 1 sun (100 mW m�2; AM 1.5 G) ofDSCs assembled with Pt, ARGO and AGO CEs.
Table 3Photovoltaic parameters for DSCs assembled with the ARGO, AGO andPt CEs.
CE VOC (V) JSC (mA cm�2) FF g (%) Dg (%)
Pt 0.74 8.03 0.61 3.50 –ARGO 0.73 8.08 0.44 2.54 �27.5AGO 0.72 8.11 0.46 2.64 �24.6
the high-frequency peak at �1–10 kHz (see Bode diagramin Fig. 7b) reflects the catalysis and charge transfer resis-tance that takes place at the counter-electrode interface.For the graphene-based CEs it can be seen that for both,their high-frequency peak in the Bode diagram shiftedtowards a lower frequency value and correspondently theirleft-hand semicircle in the Nyquist diagram enlarged, anindication of a higher charge-transfer resistance. Therefore,comparatively to the Pt CE, they have higher kinetic elec-tron lifetimes and longer redox reaction times, thus yieldinglower FFs (Toivola et al., 2007). The smaller FFs that theAGO and ARGO CE’s exhibit could be attributed to aninefficient contact between the electrolyte and the catalystlayer or poor electronic connection between the graphenefilms and the TCO substrate.
Typically, when using impedance analysis of half-cells toaccess the CEs electrocatalytic activity, the evaluation istraditionally made based on the charge-transfer resistance(Rct) measured at the CE/electrolyte interface. Half-cell’sEIS results seemed to suggest that the ARGO CE shouldhave yielded a DSC with a better performance than theAGO CE (as consequence of the smaller Rct and the highercurrent density); this can also be observed in Fig. 7b wherefor the DSC made with the ARGO CE its phase peak is ata higher frequency. However, the cell that originatedhigher efficiency was the one made with the AGO CE.The ARGO CE has a higher series resistances Rs –

R. Cruz et al. / Solar Energy 86 (2012) 716–724 723
Fig. 7b and also as previously seen in Fig. 3b – most likelydue to a higher ohmic resistance displayed by its catalyticlayer, that undermines its superior catalytic ability (thelower Rct and capacitance value’s) (Seo et al., 2010; Aitolaet al., 2011). Consequently it lowers the DSC’s FF and itsenergy conversion efficiency. The assessment of the perfor-mance of graphene-based CEs using the electrochemicalcharacterization of half-cells should therefore take in con-sideration all of the EIs parameters, as DSC is a very com-plex system. To accurately predict the CE impact on aDSC’s performance, based on such electrochemical param-eters, the use of DSC simulator is recommended (Andradeet al., 2011).
The results that were achieved in this work comparefavorably with the ones reported previously, concerninggraphene-based CEs which are simultaneously transparentand efficient (Kavan et al., 2010; Choi et al., 2011a; Huhet al., 2011). The relative efficiency of the DSC assembledwith the ARGO CE is remarkably similar to a grapheneCE reported by Kavan et al. (2010). However, ARGOCE is more transparent, s550 nm = 94% vs. s550 nm = 85%for Kavan et al. Furthermore, the AGO CE has marginallybetter efficiency and higher transparency, s550 nm = 89% vs.s550 nm = 85% for Kavan et al. The energy conversion effi-ciency obtained for the AGO CE is also comparable withresults reported by Choi et al. (2011a) (2.64% vs. 2.3%,respectively), were it is also slightly more transparent,s550 nm = 89% vs. s550 nm = 85% for Choi et al. Addition-ally, the AGO CE is based on GO deposition followedby annealing, making the CE fabrication a much simplerprocess.
The results that were obtained suggest that GO could beused to produce a transparent and efficient CE, averting theneed to use chemically reduced GO. However, the AGOCE should be optimized and the fabrication and morphol-ogy characteristics of the GO related to the performance ofthe resulted CE when inserted in a DSC.
4. Conclusions
Graphene-based films were prepared from grapheneoxide nanoplatelets and their use as CEs in DSCs wasinvestigated. The graphene-based CEs were produced byspray deposition of GO (AGO samples) or chemicallyreduced GO (ARGO samples) on FTO glass sheets, fol-lowed by thermal annealing. Conventional counter-elec-trodes of Pt were also prepared and used and reference.
The prepared CEs were used to make half-cells andcharacterized by electrochemical impedance spectroscopy.This characterization is normally performed at 0 V but,because the especial behavior displayed by graphene, thecharacterization at 0.4 V was shown to be moremeaningful.
The graphene oxide-based CEs were shown to havesimilar transparency to the Pt reference CE. Consistentwith impedance data from half-cells, DSCs assembled withsuch graphene oxide-based CEs exhibited efficiencies of
ca. 75% compared to when using the Pt CE. Transparent(s550 nm > 80%) and highly catalytically active CEs wereobtained from spray deposition of GO nanoplatelets fol-lowed by annealing under an inert atmosphere. This novelmethod of producing graphene CEs preserves the activitycatalytic sites while greatly increases the graphene sheetselectrical conductivity. Consequently, the need of pre-reducing the graphene nanoplatelets prior to deposition iseliminated, making the CE manufacture significantly sim-pler. However further material and process optimizationis needed to equal the performance of conventional Pt CEs.
Acknowledgments
Rui Cruz is grateful to the Portuguese Foundation forScience and Technology (FCT) and Efacec – Engenhariae Sistemas S.A. for his Ph.D grant (SFRH/BDE/33439/2008). This work was accomplished under the projectSolarSel – SI IDT – 3423/2008, co-financed by the Euro-pean Regional Development Fund and the PortugueseGovernment through ADI – Agencia de Inovac�ao, underthe framework of the QREN Initiative, through the Oper-ational Programme for Competitiveness Factors. Fruitfuldiscussion with Dr. Luisa Andrade is also acknowledged.
References
Aitola, K., Halme, J., Halonen, N., Kaskela, A., Toivola, M., Nasibulin,A.G., Kordas, K., Toth, G., Kauppinen, E.I., Lund, P.D., 2011.Comparison of dye solar cell counter electrodes based on differentcarbon nanostructures. Thin Solid Films 519, 8125–8134.
Andrade, L., Sousa, J., Ribeiro, H.A., Mendes, A., 2011. Phenomeno-logical modeling of dye-sensitized solar cells under transient condi-tions. Solar Energy 85, 781–793.
Cha, S.I., Koo, B.K., Seo, S.H., Lee, D.Y., 2009. Pt-free transparentcounter electrodes for dye-sensitized solar cells prepared from carbonnanotube micro-balls. Journal of Materials Chemistry 20, 659–662.
Choi, H., Hwang, S., Bae, H., Kim, S., Kim, H., Jeon, M., 2011a.Electrophoretic graphene for transparent counter electrodes in dye-sensitised solar cells. Electronics Letters 47, 281–283.
Choi, H., Kim, H., Hwang, S., Choi, W., Jeon, M., 2011b. Dye-sensitizedsolar cells using graphene-based carbon nano composite as counterelectrode. Solar Energy Materials and Solar Cells 95, 323–325.
Chou, C.-S., Yang, R.-Y., Weng, M.-H., Huang, C.-I., 2009. Theapplicability of SWCNT on the counter electrode for the dye-sensitizedsolar cell. Advanced Powder Technology 20, 310–317.
Denaro, T., Baglio, V., Girolamo, M., Antonucci, V., Arico, A.S.,Matteucci, F., Ornelas, R., 2009. Investigation of low cost carbona-ceous materials for application as counter electrode in dye-sensitizedsolar cells. Journal of Applied Electrochemistry 39, 2173–2179.
Geim, A.K., Novoselov, K.S., 2007. The rise of graphene. NatureMaterials 6, 183–191.
Gilje, S., Han, S., Wang, M., Wang, K.L., Kaner, R.B., 2007. A chemicalroute to graphene for device applications. Nano Letters 7, 3394–3398.
Gratzel, M., 1999. The artificial leaf, bio-mimetic photocatalysis. Cattech3, 3–17.
Hauch, A., Georg, A., 2001. Diffusion in the electrolyte and charge-transfer reaction at the platinum electrode in dye-sensitized solar cells.Electrochimica Acta 46, 3457–3466.
Hong, W.J., Xu, Y.X., Lu, G.W., Li, C., Shi, G.Q., 2008. Transparentgraphene/PEDOT-PSS composite films as counter electrodes of dye-sensitized solar cells. Electrochemistry Communications 10, 1555–1558.

724 R. Cruz et al. / Solar Energy 86 (2012) 716–724
Huh, S.H., Choi, S.-H., Ju, H.-M., 2011. Thickness-dependent solar powerconversion efficiencies of catalytic graphene oxide films in dye-sensitized solar cells. Current Applied Physics 11, S352–S355.
Hummers, W.S., Offeman, R.E., 1958. Preparation of graphitic oxide.Journal of the American Chemical Society 80, 1339.
Imoto, K., Takahashi, K., Yamaguchi, T., Komura, T., Nakamura, J.,Murata, K., 2003. High-performance carbon counter electrode for dye-sensitized solar cells. Solar Energy Materials and Solar Cells 79, 459–469.
Kavan, L., Yum, J.H., Gratzel, M., 2010. Optically transparent cathodefor dye-sensitized solar cells based on graphene nanoplatelets. ACSNano, 165–172.
Kitamura, T., Maitani, M., Matsuda, M., Wada, Y., Yanagida, S., 2001.Improved solid-state dye solar cells with polypyrrole using a carbon-based counter electrode. Chemistry Letters 30, 1054–1055.
Li, D., Muller, M.B., Gilje, S., Kaner, R.B., Wallace, G.G., 2008.Processable aqueous dispersions of graphene nanosheets. NatureNanotechnology 3, 101–105.
Murakami, T., Gratzel, M., 2008. Counter electrodes for DSC: applica-tion of functional materials as catalysts. Inorganica Chimica Acta 361,572–580.
Murakami, T.N., Ito, S., Wang, Q., Nazeeruddin, M.K., Bessho, T.,Cesar, I., Liska, P., Humphry-Baker, R., Comte, P., Pechy, P.,Gratzel, M., 2006. Highly efficient dye-sensitized solar cells based oncarbon black counter electrodes. Journal of The ElectrochemicalSociety 153, A2255–A2261.
O’Regan, B., Gratzel, M., 1991. A low-cost, high-efficiency solar-cellbased on dye-sensitized colloidal TiO2 films. Nature 353, 737–740.
Rafiee, J., Rafiee, M.A., Yu, Z.-Z., Koratkar, N., 2010. Superhydrophobicto superhydrophilic wetting control in graphene films. AdvancedMaterials 22, 2151–2154.
Ramasamy, E., Lee, W.J., Lee, D.Y., Song, J.S., 2008. Spray coated multi-wall carbon nanotube counter electrode for tri-iodide (I-3(-)) reductionin dye-sensitized solar cells. Electrochemistry Communications 10,1087–1089.
Roy-Mayhew, J.D., Bozym, D.J., Punckt, C., Aksay, I.A., 2010. Func-tionalized graphene as a catalytic counter electrode in dye-sensitizedsolar cells. ACS Nano 4, 6203–6211.
Seo, S.H., Kim, S.Y., Koo, B.-K., Cha, S.-I., Lee, D.Y., 2010. Influence ofelectrolyte composition on the photovoltaic performance and stabilityof dye-sensitized solar cells with multiwalled carbon nanotube cata-lysts. Langmuir 26, 10341–10346.
Si, Y., Samulski, E.T., 2008. Synthesis of water soluble graphene. NanoLetters 8, 1679–1682.
Smestad, G., Bignozzi, C., Argazzi, R., 1994. Testing of dye sensitizedTiO2 solar cells I: Experimental photocurrent output and conversionefficiencies. Solar Energy Materials and Solar Cells 32, 259–272.
Stankovich, S., Dikin, D.A., Piner, R.D., Kohlhaas, K.A., Kleinhammes,A., Jia, Y., Wu, Y., Nguyen, S.T., Ruoff, R.S., 2007. Synthesis ofgraphene-based nanosheets via chemical reduction of exfoliatedgraphite oxide. Carbon 45, 1558–1565.
Suzuki, K., Yamaguchi, M., Kumagai, M., Yanagida, S., 2003. Applica-tion of carbon nanotubes to counter electrodes of dye-sensitized solarcells. Chemistry Letters 32, 28–29.
Titelman, G.I., Gelman, V., Bron, S., Khalfin, R.L., Cohen, Y., Bianco-Peled, H., 2005. Characteristics and microstructure of aqueouscolloidal dispersions of graphite oxide. Carbon 43, 641–649.
Toivola, M., Peltokorpi, L., Halme, J., Lund, P., 2007. Regenerativeeffects by temperature variations in dye-sensitized solar cells. SolarEnergy Materials and Solar Cells 91, 1733–1742.
Trancik, J.E., Barton, S.C., Hone, J., 2008. Transparent and catalyticcarbon nanotube films. Nano Letters 8, 982–987.
Wan, L., Wang, S., Wang, X., Dong, B., Xu, Z., Zhang, X., Yang, B.,Peng, S., Wang, J., Xu, C., 2011. Room-temperature fabrication ofgraphene films on variable substrates and its use as counter electrodesfor dye-sensitized solar cells. Solid State Sciences 13, 468–475.
Wang, S.J., Geng, Y., Zheng, Q., Kim, J.-K., 2010. Fabrication of highlyconducting and transparent graphene films. Carbon 48, 1815–1823.
Wang, X., Zhi, L.J., Mullen, K., 2008. Transparent, conductive grapheneelectrodes for dye-sensitized solar cells. Nano Letters 8, 323–327.
Xu, Y., Bai, H., Lu, G., Li, C., Shi, G., 2008. Flexible graphene films viathe filtration of water-soluble noncovalent functionalized graphenesheets. Journal of the American Chemical Society 130, 5856–5857.
Xu, Y.F., Long, G.K., Huang, L., Huang, Y., Wan, X.J., Ma, Y.F., Chen,Y.S., 2010. Polymer photovoltaic devices with transparent grapheneelectrodes produced by spin-casting. Carbon 48, 3308–3311.
Yamaguchi, T., Uchida, Y., Agatsuma, S., Arakawa, H., 2009. Series-connected tandem dye-sensitized solar cell for improving efficiency tomore than 10%. Solar Energy Materials and Solar Cells 93, 733–736.
Zhang, D.W., Li, X.D., Chen, S., Li, H.B., Sun, Z., Yin, X.J., Huang,S.M., 2010. Graphene Nanosheet Counter-Electrodes for Dye-Sensi-tized Solar Cells. IEEE, New York.