photovoltaic performance of dye-sensitized solar cell
TRANSCRIPT
JNS 4 (2014) 75-82
Photovoltaic Performance of Dye-Sensitized Solar Cell (DSSC) Fabricated by Silver Nanoclusters-Decorated TiO2 Electrode via Photochemical Reduction Technique A. Ehteram a,*, M. Hamadanian b,c, S. Z. Mirdamadian b, V. Jabbari b
a Department of Electrical Engineering, Kashan Branch, Islamic Azad University, Kashan, IRAN b Institute of Nanosciences and Nanotechnology, University of Kashan, Kashan, IRAN c Department of Physical Chemistry, Faculty of Chemistry, University of Kashan, Kashan, IRAN
Abstract In this investigation, Ag@TiO2 nanocomposite was prepared by deposition of silver nanoclusters onto commercial TiO2 nanoparticles (known as P25 TiO2) via photodeposition technique as clean and simple photochemical route. The synthesized Ag@TiO2 nanocomposite was utilized in the fabrication of dye-sensitized solar cell (DSSC) chiefly because, compared to pure TiO2, the electron affinity of Ag@TiO2 nanocomposites is higher which enhances the photo-generated excitons lifetime, and as result, reduces the rate of photo-generated charge carriers recombination. Additionally, we found that via deposition of silver nanoclusters, TiO2 absorption in visible light region was considerably improved due to the surface Plasmon phenomenon. XRD results proved existence of anatase and rutile phases within TiO2 structure. Finally, photovoltaic performance and solar energy conversion efficiency of TiO2 and Ag@TiO2 electrode-based DSSC were compared and discussed. 2014 JNS All rights reserved
Article history: Received 6/1/2014 Accepted 25/2/2014 Published online 1/3/2014
Keywords: TiO2 Silver Photodeposition DSSC Photovoltaic
*Corresponding author: E-mail address: [email protected] Phone: +98 31 54450460 Fax: +98 31 55550056
1. Introduction TiO2 is among the widely used material in solar
energy applications such as photovoltaic solar cells [1,2], water and air purification [3], and as UV absorbent in cosmetics [4]. It has been largely employed in bulk heterojunction solar cells (BHJ) and dye-sensitized solar cells (DSSC) in order to gain high energy conversion efficiencies along
with low cost, easy fabrication, low level of toxicity, and a long-term stability [5]. However, the rapid recombination rate of e−/h+ on the TiO2 nanoparticles limit to obtain high efficiency TiO2 nanoparticle-based solar cells low [1,5].
The charge separation plays an important role in determining energy conversion efficiency for producing solar fuels and solar electricity in TiO2-
76
A. Ehteram et al./ JNS 4 (2014) 75-82
based solar cells [6,7], photoelectrocatalysis [8] and photocatalysis systems [9]. As a key step in solar energy conversion, photo-generated e−/h+ pairs must be separated and then transferred to surface of the semiconductors [10,11]. Therefore, a deep understanding of charge separation process within photo-excited semiconductors is needed for the fabrication of a productive solar light energy conversion system.
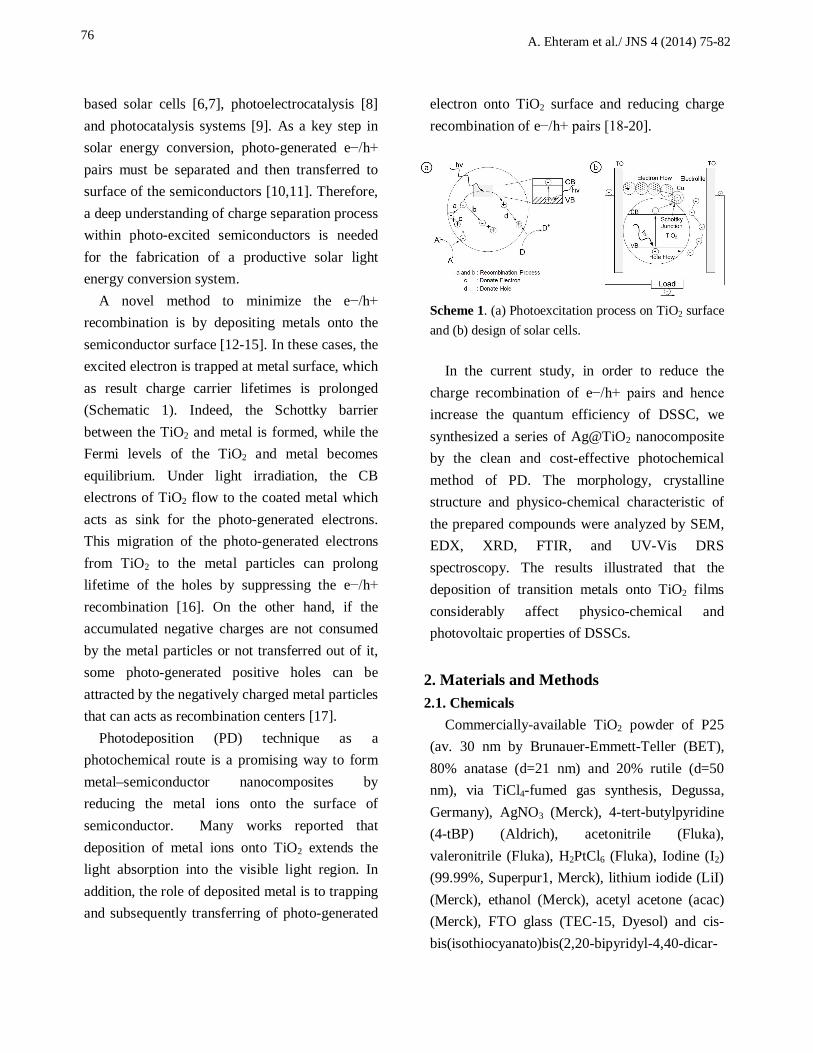
A novel method to minimize the e−/h+ recombination is by depositing metals onto the semiconductor surface [12-15]. In these cases, the excited electron is trapped at metal surface, which as result charge carrier lifetimes is prolonged (Schematic 1). Indeed, the Schottky barrier between the TiO2 and metal is formed, while the Fermi levels of the TiO2 and metal becomes equilibrium. Under light irradiation, the CB electrons of TiO2 flow to the coated metal which acts as sink for the photo-generated electrons. This migration of the photo-generated electrons from TiO2 to the metal particles can prolong lifetime of the holes by suppressing the e−/h+ recombination [16]. On the other hand, if the accumulated negative charges are not consumed by the metal particles or not transferred out of it, some photo-generated positive holes can be attracted by the negatively charged metal particles that can acts as recombination centers [17].
Photodeposition (PD) technique as a photochemical route is a promising way to form metal–semiconductor nanocomposites by reducing the metal ions onto the surface of semiconductor. Many works reported that deposition of metal ions onto TiO2 extends the light absorption into the visible light region. In addition, the role of deposited metal is to trapping and subsequently transferring of photo-generated
electron onto TiO2 surface and reducing charge recombination of e−/h+ pairs [18-20].
Scheme 1. (a) Photoexcitation process on TiO2 surface and (b) design of solar cells.
In the current study, in order to reduce the
charge recombination of e−/h+ pairs and hence increase the quantum efficiency of DSSC, we synthesized a series of Ag@TiO2 nanocomposite by the clean and cost-effective photochemical method of PD. The morphology, crystalline structure and physico-chemical characteristic of the prepared compounds were analyzed by SEM, EDX, XRD, FTIR, and UV-Vis DRS spectroscopy. The results illustrated that the deposition of transition metals onto TiO2 films considerably affect physico-chemical and photovoltaic properties of DSSCs.
2. Materials and Methods 2.1. Chemicals
Commercially-available TiO2 powder of P25 (av. 30 nm by Brunauer-Emmett-Teller (BET), 80% anatase (d=21 nm) and 20% rutile (d=50 nm), via TiCl4-fumed gas synthesis, Degussa, Germany), AgNO3 (Merck), 4-tert-butylpyridine (4-tBP) (Aldrich), acetonitrile (Fluka), valeronitrile (Fluka), H2PtCl6 (Fluka), Iodine (I2) (99.99%, Superpur1, Merck), lithium iodide (LiI) (Merck), ethanol (Merck), acetyl acetone (acac) (Merck), FTO glass (TEC-15, Dyesol) and cis-bis(isothiocyanato)bis(2,20-bipyridyl-4,40-dicar-
77
A. Ehteram et al./ JNS 4 (2014) 75-82
boxylato)-ruthenium(II)bis-tetrabutyl ammonium (N719), Dyesol) were used as received without further purification. H2O was purified by distillation and filtration (Milli-Q).
2.2. Photodeposition of Silver Nanoclusters onto TiO2
To prepare Ag@TiO2 nanocomposite, AgNO3 (0.5% in respect to TiO2) along with 0.4 gr of TiO2 P25 were added to 100 ml of deionized water (water acts as hole scavenger) and the solution was purged with high-purity N2 atmosphere during stirring. Afterward, the resulting solution was transferred to a quartz reactor and then its head was covered and was put under UV irradiation for 12 hours, under vigorous stirring. After that the precursor was separated by centrifugation and washed with deionized water for several times. The dried samples were dried at 100°C for 12 h and were used.
The photo-reduction of the metal ions (Eq. 1) is accompanying the elimination of photo-generated holes using water oxidation (Eq. 2) as follows: Mn+ + ne- → Mo (1) 2H2O + 4h+ → O2 + 4H+ (2)
2.3. Electrodes and Cell Preparation
Electrophoretic deposition (EPD) was utilized to preparation of TiO2-based electrodes used in DSSCs. During EPD, the cleaned FTO glass remained at a positive potential (anode) while a pure steel mesh was used as the counter (cathode) electrode. The linear distance between the two electrodes was about 2cm. Power was supplied by a Motech Programmable Dc source meter. The applied voltage was 10 V. The deposition cycle was 15 times with each time of 15 s, and the temperature of the electrolyte solution was 25 °C. The coated substrates were air dried. The
apparent area of the film was 1.5×1.5 cm2. The resulting layer was annealed at 500 oC in air for 30 min.
2.4. Solar Cells Assembly
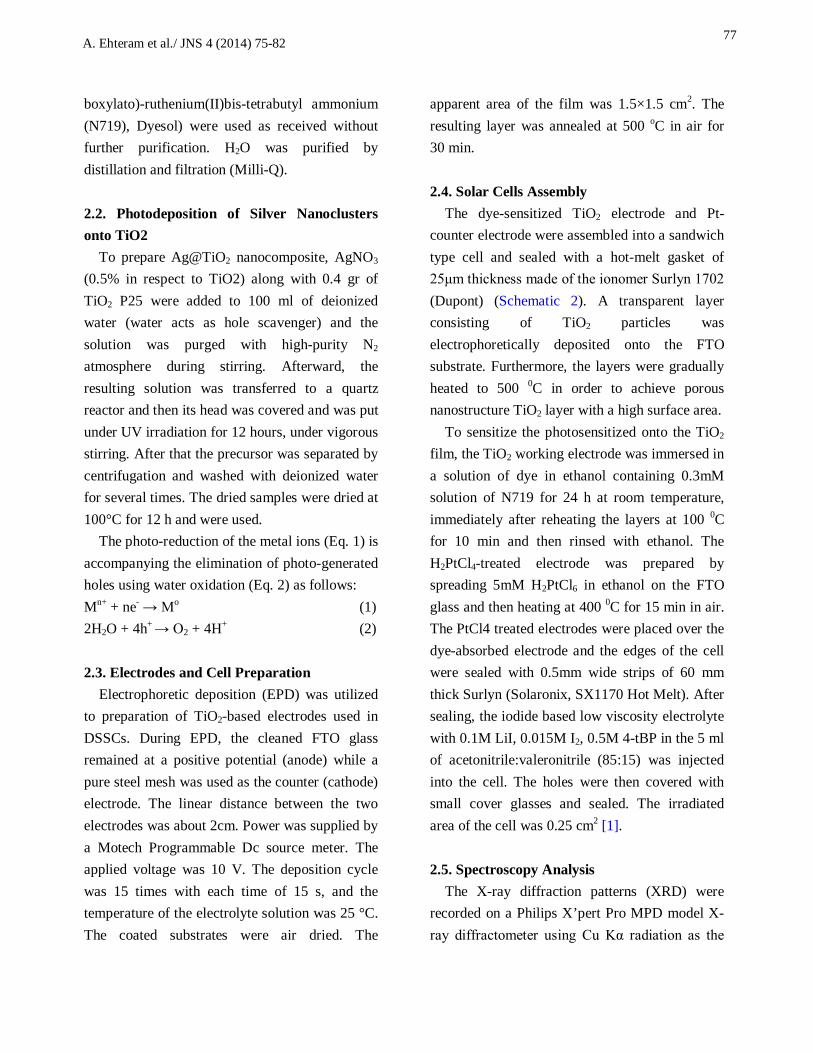
The dye-sensitized TiO2 electrode and Pt-counter electrode were assembled into a sandwich type cell and sealed with a hot-melt gasket of 25μm thickness made of the ionomer Surlyn 1702 (Dupont) (Schematic 2). A transparent layer consisting of TiO2 particles was electrophoretically deposited onto the FTO substrate. Furthermore, the layers were gradually heated to 500 0C in order to achieve porous nanostructure TiO2 layer with a high surface area.
To sensitize the photosensitized onto the TiO2 film, the TiO2 working electrode was immersed in a solution of dye in ethanol containing 0.3mM solution of N719 for 24 h at room temperature, immediately after reheating the layers at 100 0C for 10 min and then rinsed with ethanol. The H2PtCl4-treated electrode was prepared by spreading 5mM H2PtCl6 in ethanol on the FTO glass and then heating at 400 0C for 15 min in air. The PtCl4 treated electrodes were placed over the dye-absorbed electrode and the edges of the cell were sealed with 0.5mm wide strips of 60 mm thick Surlyn (Solaronix, SX1170 Hot Melt). After sealing, the iodide based low viscosity electrolyte with 0.1M LiI, 0.015M I2, 0.5M 4-tBP in the 5 ml of acetonitrile:valeronitrile (85:15) was injected into the cell. The holes were then covered with small cover glasses and sealed. The irradiated area of the cell was 0.25 cm2 [1].
2.5. Spectroscopy Analysis
The X-ray diffraction patterns (XRD) were recorded on a Philips X’pert Pro MPD model X-ray diffractometer using Cu Kα radiation as the
78
A. Ehteram et al./ JNS 4 (2014) 75-82
X-ray source. The diffractograms were recorded in the 2θ range of 10- 80º. The morphology was revealed by a scanning electron microscope (SEM, Philips XL- 30ESM, Holland) equipped with an energy dispersive X-ray detector (EDX, EDAX Genenis- 4000, USA) operated at 25 kV with spot size 4. UV-Vis DRS spectra of the samples were recorded by a Shimadzu 1800 spectrometer.
Scheme 2. Configuration of the DSSC.
Photovoltaic measurements employed an AM
1.5 solar simulator. The power of the simulated light was calibrated to be 100 mWcm-2 by using a reference Si photodiode equipped with an IR-cutoff filter (KG-3, Schott), which was calibrated at three solar-energy institutes (ISE (Germany), NREL (USA), SRI (Switzerland)). I-V curves were obtained by applying an external bias to the cell and measuring the generated photocurrent with a Keithley model 2400 digital source meter. The voltage step and delay time of photocurrent were 10MV and 40 ms, respectively. Based on I–V curve, the fill factor (FF) is defined as: FF = Pmax /(JSC×VOC) = Jmax × Vmax /(JSC×VOC) (3)
Where Jmax and Vmax are the photocurrent and photovoltage for maximum power output (Pmax), JSC and VOC are the short-circuit photocurrent and open-circuit photovoltage, respectively. The overall energy conversion efficiency (η) is defined as: η = JSC × VOC× FF / Pin (4)
3. Results and Discussions 3.1. Crystalline Structure
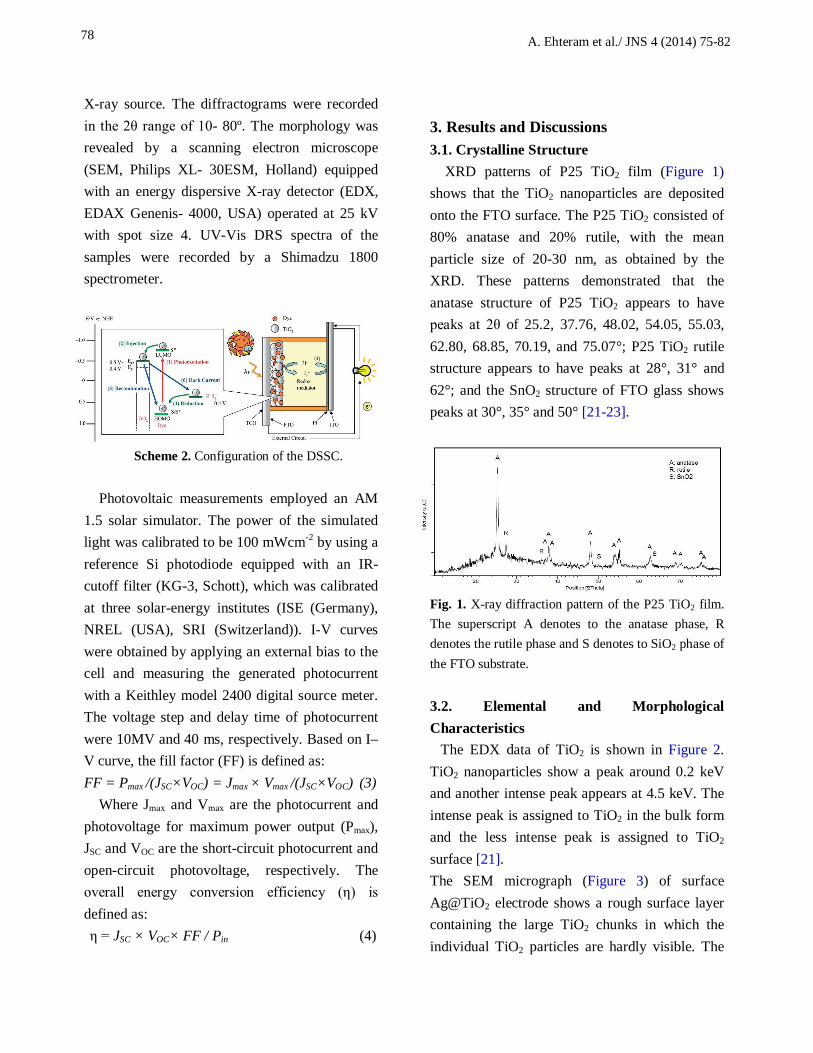
XRD patterns of P25 TiO2 film (Figure 1) shows that the TiO2 nanoparticles are deposited onto the FTO surface. The P25 TiO2 consisted of 80% anatase and 20% rutile, with the mean particle size of 20-30 nm, as obtained by the XRD. These patterns demonstrated that the anatase structure of P25 TiO2 appears to have peaks at 2θ of 25.2, 37.76, 48.02, 54.05, 55.03, 62.80, 68.85, 70.19, and 75.07°; P25 TiO2 rutile structure appears to have peaks at 28°, 31° and 62°; and the SnO2 structure of FTO glass shows peaks at 30°, 35° and 50° [21-23].
Fig. 1. X-ray diffraction pattern of the P25 TiO2 film. The superscript A denotes to the anatase phase, R denotes the rutile phase and S denotes to SiO2 phase of the FTO substrate.
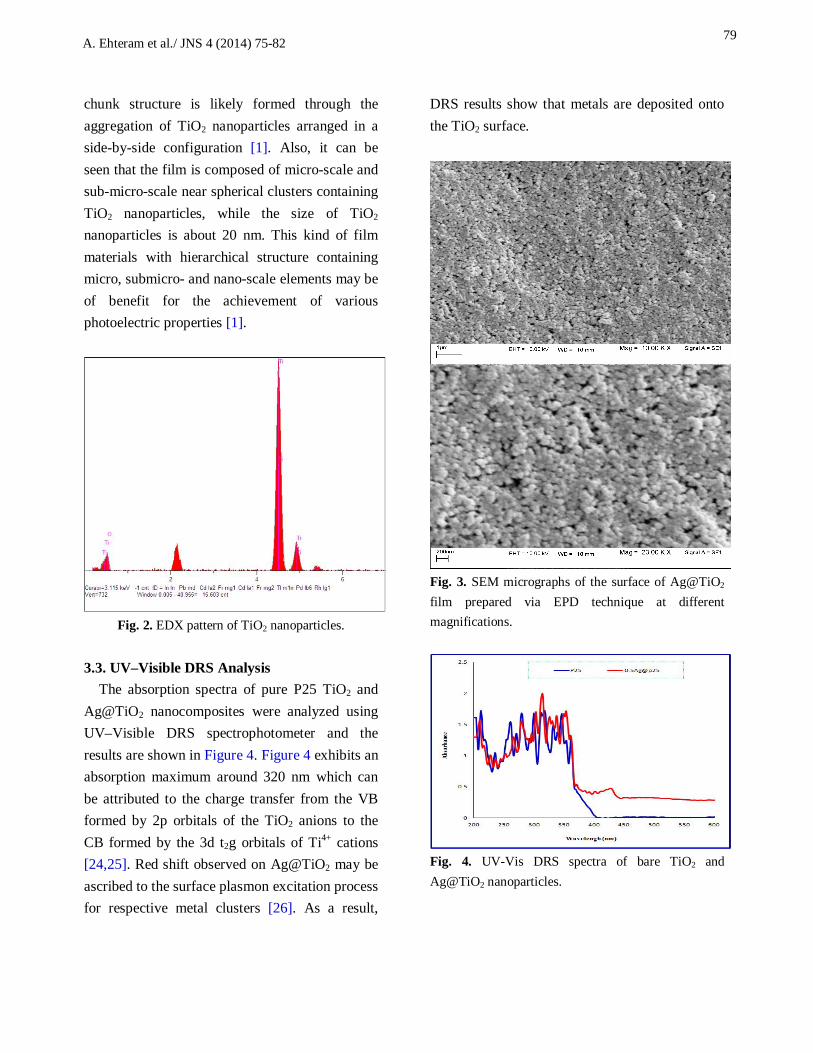
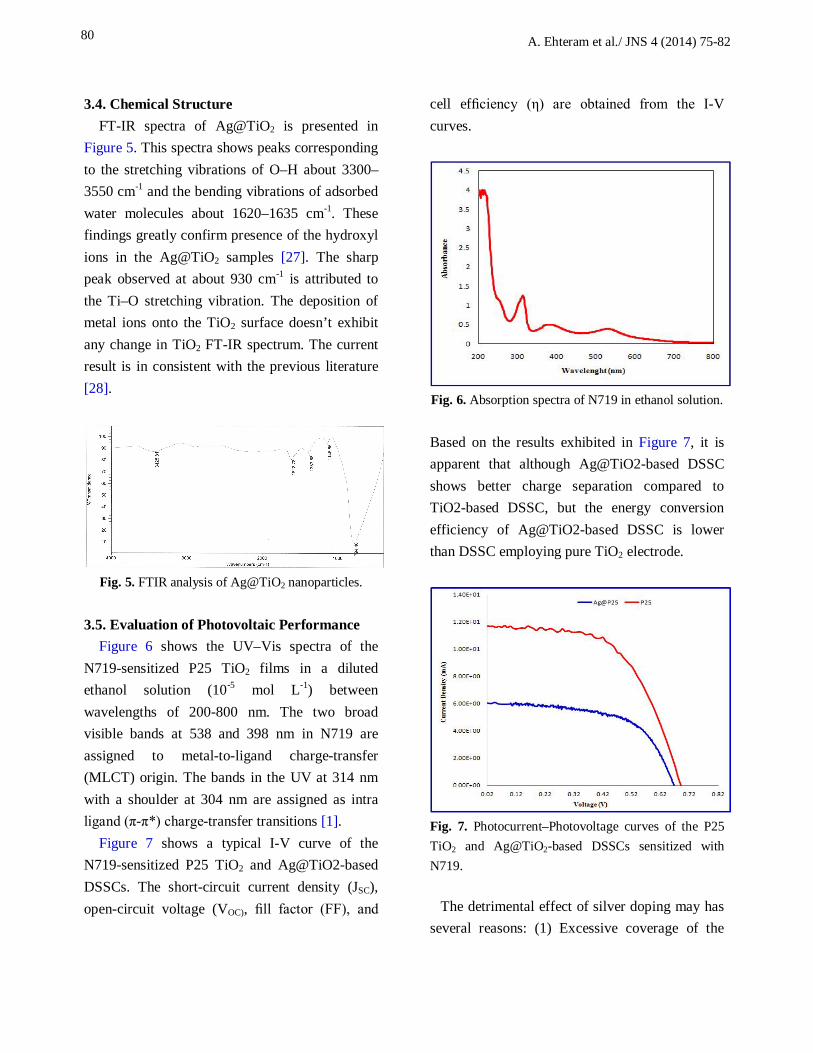
3.2. Elemental and Morphological Characteristics The EDX data of TiO2 is shown in Figure 2. TiO2 nanoparticles show a peak around 0.2 keV and another intense peak appears at 4.5 keV. The intense peak is assigned to TiO2 in the bulk form and the less intense peak is assigned to TiO2 surface [21]. The SEM micrograph (Figure 3) of surface Ag@TiO2 electrode shows a rough surface layer containing the large TiO2 chunks in which the individual TiO2 particles are hardly visible. The
79
A. Ehteram et al./ JNS 4 (2014) 75-82
chunk structure is likely formed through the aggregation of TiO2 nanoparticles arranged in a side-by-side configuration [1]. Also, it can be seen that the film is composed of micro-scale and sub-micro-scale near spherical clusters containing TiO2 nanoparticles, while the size of TiO2 nanoparticles is about 20 nm. This kind of film materials with hierarchical structure containing micro, submicro- and nano-scale elements may be of benefit for the achievement of various photoelectric properties [1].
Fig. 2. EDX pattern of TiO2 nanoparticles.
3.3. UV–Visible DRS Analysis
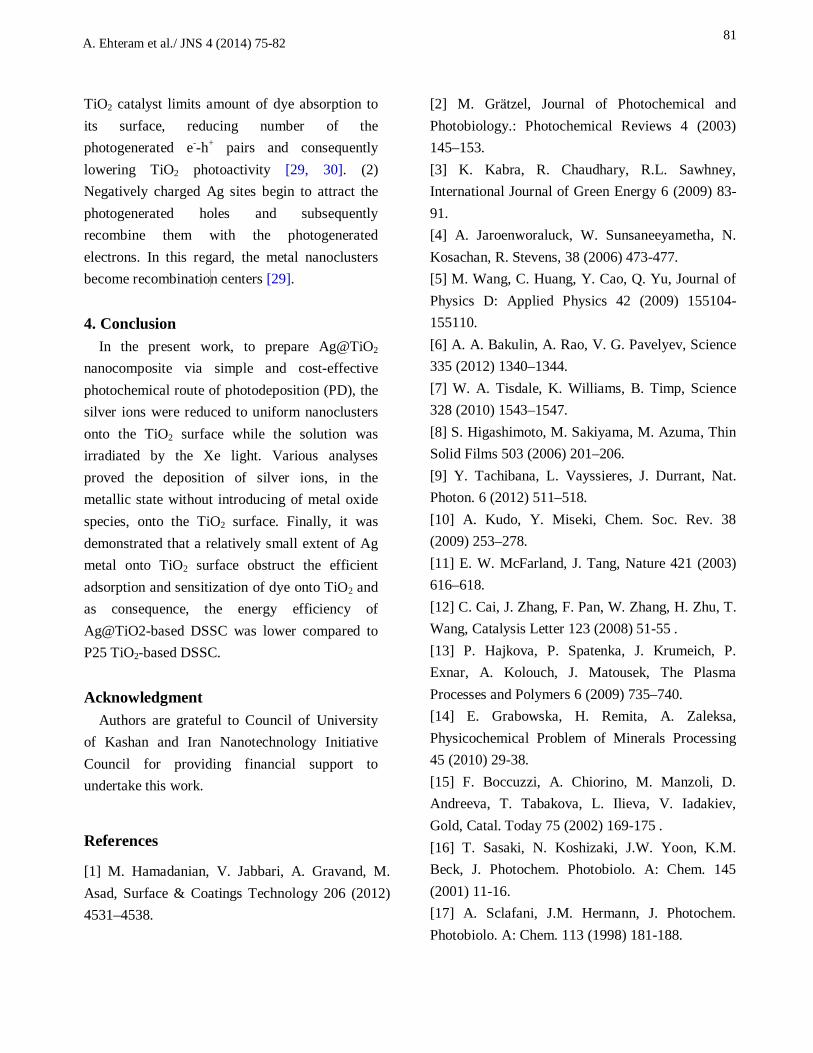
The absorption spectra of pure P25 TiO2 and Ag@TiO2 nanocomposites were analyzed using UV–Visible DRS spectrophotometer and the results are shown in Figure 4. Figure 4 exhibits an absorption maximum around 320 nm which can be attributed to the charge transfer from the VB formed by 2p orbitals of the TiO2 anions to the CB formed by the 3d t2g orbitals of Ti4+ cations [24,25]. Red shift observed on Ag@TiO2 may be ascribed to the surface plasmon excitation process for respective metal clusters [26]. As a result,
DRS results show that metals are deposited onto the TiO2 surface.
Fig. 3. SEM micrographs of the surface of Ag@TiO2 film prepared via EPD technique at different magnifications.
Fig. 4. UV-Vis DRS spectra of bare TiO2 and Ag@TiO2 nanoparticles.
80
A. Ehteram et al./ JNS 4 (2014) 75-82
3.4. Chemical Structure FT-IR spectra of Ag@TiO2 is presented in
Figure 5. This spectra shows peaks corresponding to the stretching vibrations of O–H about 3300–3550 cm-1 and the bending vibrations of adsorbed water molecules about 1620–1635 cm-1. These findings greatly confirm presence of the hydroxyl ions in the Ag@TiO2 samples [27]. The sharp peak observed at about 930 cm-1 is attributed to the Ti–O stretching vibration. The deposition of metal ions onto the TiO2 surface doesn’t exhibit any change in TiO2 FT-IR spectrum. The current result is in consistent with the previous literature [28].
Fig. 5. FTIR analysis of Ag@TiO2 nanoparticles.
3.5. Evaluation of Photovoltaic Performance
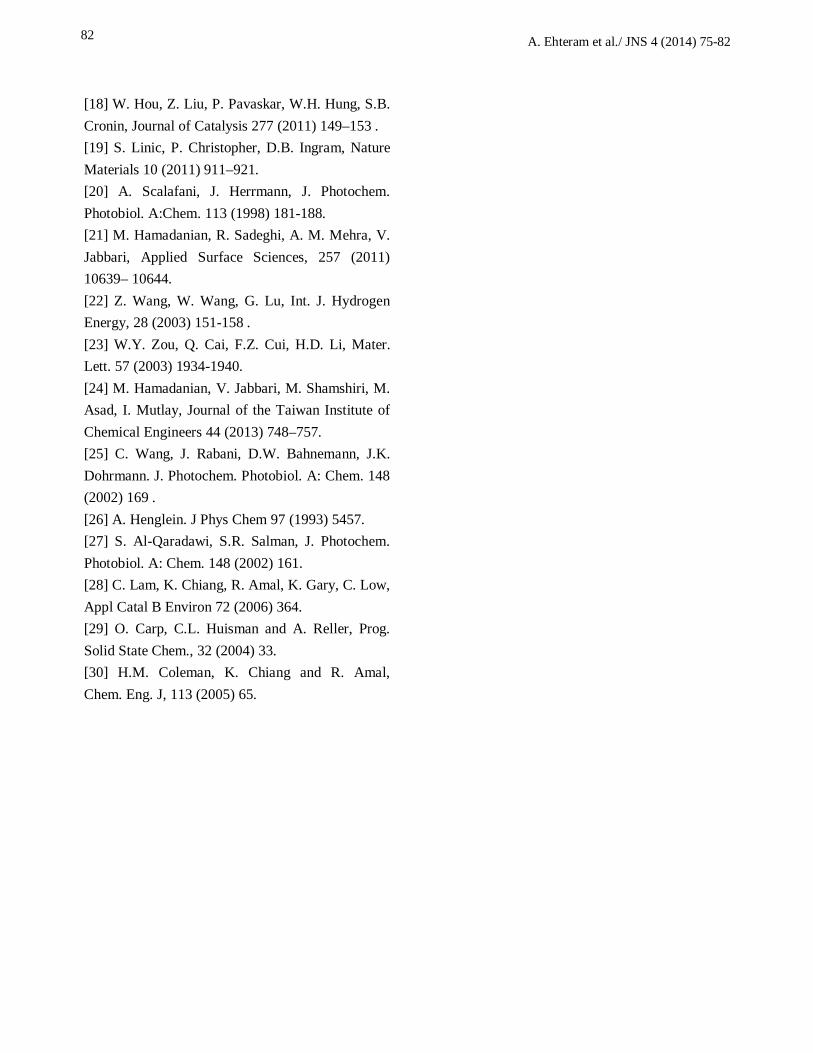
Figure 6 shows the UV–Vis spectra of the N719-sensitized P25 TiO2 films in a diluted ethanol solution (10-5 mol L-1) between wavelengths of 200-800 nm. The two broad visible bands at 538 and 398 nm in N719 are assigned to metal-to-ligand charge-transfer (MLCT) origin. The bands in the UV at 314 nm with a shoulder at 304 nm are assigned as intra ligand (π-π*) charge-transfer transitions [1].
Figure 7 shows a typical I-V curve of the N719-sensitized P25 TiO2 and Ag@TiO2-based DSSCs. The short-circuit current density (JSC), open-circuit voltage (VOC), fill factor (FF), and
cell efficiency (η) are obtained from the I-V curves.
Fig. 6. Absorption spectra of N719 in ethanol solution.
Based on the results exhibited in Figure 7, it is apparent that although Ag@TiO2-based DSSC shows better charge separation compared to TiO2-based DSSC, but the energy conversion efficiency of Ag@TiO2-based DSSC is lower than DSSC employing pure TiO2 electrode.
Fig. 7. Photocurrent–Photovoltage curves of the P25 TiO2 and Ag@TiO2-based DSSCs sensitized with N719. The detrimental effect of silver doping may has several reasons: (1) Excessive coverage of the
81
A. Ehteram et al./ JNS 4 (2014) 75-82
TiO2 catalyst limits amount of dye absorption to its surface, reducing number of the photogenerated e--h+ pairs and consequently lowering TiO2 photoactivity [29, 30]. (2) Negatively charged Ag sites begin to attract the photogenerated holes and subsequently recombine them with the photogenerated electrons. In this regard, the metal nanoclusters become recombinatio n centers [29].
4. Conclusion
In the present work, to prepare Ag@TiO2 nanocomposite via simple and cost-effective photochemical route of photodeposition (PD), the silver ions were reduced to uniform nanoclusters onto the TiO2 surface while the solution was irradiated by the Xe light. Various analyses proved the deposition of silver ions, in the metallic state without introducing of metal oxide species, onto the TiO2 surface. Finally, it was demonstrated that a relatively small extent of Ag metal onto TiO2 surface obstruct the efficient adsorption and sensitization of dye onto TiO2 and as consequence, the energy efficiency of Ag@TiO2-based DSSC was lower compared to P25 TiO2-based DSSC.
Acknowledgment
Authors are grateful to Council of University of Kashan and Iran Nanotechnology Initiative Council for providing financial support to undertake this work.
References
[1] M. Hamadanian, V. Jabbari, A. Gravand, M. Asad, Surface & Coatings Technology 206 (2012) 4531–4538.
[2] M. Grätzel, Journal of Photochemical and Photobiology.: Photochemical Reviews 4 (2003) 145–153. [3] K. Kabra, R. Chaudhary, R.L. Sawhney, International Journal of Green Energy 6 (2009) 83-91. [4] A. Jaroenworaluck, W. Sunsaneeyametha, N. Kosachan, R. Stevens, 38 (2006) 473-477. [5] M. Wang, C. Huang, Y. Cao, Q. Yu, Journal of Physics D: Applied Physics 42 (2009) 155104-155110. [6] A. A. Bakulin, A. Rao, V. G. Pavelyev, Science 335 (2012) 1340–1344. [7] W. A. Tisdale, K. Williams, B. Timp, Science 328 (2010) 1543–1547. [8] S. Higashimoto, M. Sakiyama, M. Azuma, Thin Solid Films 503 (2006) 201–206. [9] Y. Tachibana, L. Vayssieres, J. Durrant, Nat. Photon. 6 (2012) 511–518. [10] A. Kudo, Y. Miseki, Chem. Soc. Rev. 38 (2009) 253–278. [11] E. W. McFarland, J. Tang, Nature 421 (2003) 616–618. [12] C. Cai, J. Zhang, F. Pan, W. Zhang, H. Zhu, T. Wang, Catalysis Letter 123 (2008) 51-55 . [13] P. Hajkova, P. Spatenka, J. Krumeich, P. Exnar, A. Kolouch, J. Matousek, The Plasma Processes and Polymers 6 (2009) 735–740. [14] E. Grabowska, H. Remita, A. Zaleksa, Physicochemical Problem of Minerals Processing 45 (2010) 29-38. [15] F. Boccuzzi, A. Chiorino, M. Manzoli, D. Andreeva, T. Tabakova, L. Ilieva, V. Iadakiev, Gold, Catal. Today 75 (2002) 169-175 . [16] T. Sasaki, N. Koshizaki, J.W. Yoon, K.M. Beck, J. Photochem. Photobiolo. A: Chem. 145 (2001) 11-16. [17] A. Sclafani, J.M. Hermann, J. Photochem. Photobiolo. A: Chem. 113 (1998) 181-188.
82
A. Ehteram et al./ JNS 4 (2014) 75-82
[18] W. Hou, Z. Liu, P. Pavaskar, W.H. Hung, S.B. Cronin, Journal of Catalysis 277 (2011) 149–153 . [19] S. Linic, P. Christopher, D.B. Ingram, Nature Materials 10 (2011) 911–921. [20] A. Scalafani, J. Herrmann, J. Photochem. Photobiol. A:Chem. 113 (1998) 181-188. [21] M. Hamadanian, R. Sadeghi, A. M. Mehra, V. Jabbari, Applied Surface Sciences, 257 (2011) 10639– 10644. [22] Z. Wang, W. Wang, G. Lu, Int. J. Hydrogen Energy, 28 (2003) 151-158 . [23] W.Y. Zou, Q. Cai, F.Z. Cui, H.D. Li, Mater. Lett. 57 (2003) 1934-1940. [24] M. Hamadanian, V. Jabbari, M. Shamshiri, M. Asad, I. Mutlay, Journal of the Taiwan Institute of Chemical Engineers 44 (2013) 748–757. [25] C. Wang, J. Rabani, D.W. Bahnemann, J.K. Dohrmann. J. Photochem. Photobiol. A: Chem. 148 (2002) 169 . [26] A. Henglein. J Phys Chem 97 (1993) 5457. [27] S. Al-Qaradawi, S.R. Salman, J. Photochem. Photobiol. A: Chem. 148 (2002) 161. [28] C. Lam, K. Chiang, R. Amal, K. Gary, C. Low, Appl Catal B Environ 72 (2006) 364. [29] O. Carp, C.L. Huisman and A. Reller, Prog. Solid State Chem., 32 (2004) 33. [30] H.M. Coleman, K. Chiang and R. Amal, Chem. Eng. J, 113 (2005) 65.