recruiting for ideas: how firms exploit the prior...
TRANSCRIPT

MANAGEMENT SCIENCEVol. 57, No. 1, January 2011, pp. 129–150issn 0025-1909 �eissn 1526-5501 �11 �5701 �0129
informs ®
doi 10.1287/mnsc.1100.1253©2011 INFORMS
Recruiting for Ideas: How Firms Exploit the PriorInventions of New Hires
Jasjit SinghINSEAD, Singapore 138676, [email protected]
Ajay AgrawalRotman School of Management, University of Toronto, Toronto, Ontario M5S 3E6, Canada; and
National Bureau of Economic Research, Cambridge, Massachusetts 02138,[email protected]
When firms recruit inventors, they acquire not only the use of their skills but also enhanced access totheir stock of ideas. But do hiring firms actually increase their use of new recruits’ prior inventions? Our
estimates suggest they do, quite significantly in fact, by approximately 219% on average. However, this doesnot necessarily reflect widespread “learning by hiring.” In fact, we estimate that a recruit’s exploitation of herown prior ideas accounts for almost half of the above effect, with much of the diffusion to others being limitedto the recruit’s immediate collaborative network. Furthermore, although one might expect the recruit’s role todiminish rapidly as her tacit knowledge diffuses across her new firm, our estimates indicate that her importanceis surprisingly persistent over time. We base these findings on an empirical strategy that exploits the variationover time in hiring firms’ citations to the recruits’ premove patents. Specifically, we employ a difference-in-differences approach to compare premove versus postmove citation rates for the recruits’ prior patents andcorresponding matched-pair control patents. Our methodology has three benefits compared to previous studiesthat also examine the link between labor mobility and knowledge flow: (1) it does not suffer from the upwardbias inherent in the conventional cross-sectional comparison, (2) it generates results that are robust to a morestringently matched control sample, and (3) it enables a temporal examination of knowledge flow patterns.
Key words : inventor mobility; access to ideas; knowledge spillovers; learning by hiring; difference indifferences; coarsened exact matching; collaborative networks; patent citations
History : Received August 28, 2009; accepted August 4, 2010, by Kamalini Ramdas, entrepreneurship andinnovation. Published online in Articles in Advance November 19, 2010.
1. IntroductionThe link between recruiting inventors and using theirstock of prior ideas is important, yet we know surpris-ingly little about it. There is a broad consensus thatinnovation is central to many firms’ strategies andthe basis for their competitive advantage. Yet a firm’spast experience and extant stock of knowledge con-strains innovation, making the innovation trajectoryhighly path dependent (Nelson and Winter 1982, Dosi1988). Firms need to balance this natural tendencytoward exploitation of familiar knowledge with delib-erate mechanisms that facilitate exploration of distantknowledge (March 1991), especially because combin-ing ideas drawn from different sources is often impor-tant for innovation success (Weitzman 1998, Fleming2001, Chesbrough 2003, Singh and Fleming 2010).Recruiting an individual from outside the organiza-tion may enhance a firm’s access to external ideas andthus better enable it to complement the exploitationof native ideas with the exploration of foreign ideas.But how much do firms really increase their use of anew recruit’s stock of prior ideas? To the extent they
do, how do they do it? Furthermore, to what extentdo firms really exhibit “learning by hiring”? Finally,given the temporal nature of diffusion, how does thisprocess evolve over time? We set out to address thesequestions.1
Scholars from a variety of schools of thought havesuggested that interfirm mobility could be a keymechanism driving diffusion of ideas across firms.Noting that knowledge spillovers through mobilitycan take place despite the source firm’s use of legalmeasures to prevent them, economist Arrow (1962,p. 615) remarks: “Mobility of personnel among firmsprovides a way of spreading information. Legallyimposed property rights can provide only a par-tial barrier, since there are obviously enormous dif-ficulties in defining in any sharp way an item ofinformation and differentiating it from other similarsounding items.” Proponents of institutional theory,
1 Our focus is on an individual moving from one firm to anotherexisting firm. A related literature emphasizes knowledge transferthrough mobility in the context of new firm formation (Agarwalet al. 2004, Gompers et al. 2005, Klepper and Sleeper 2005).
129
INFORMS
holds
copyrightto
this
article
and
distrib
uted
this
copy
asa
courtesy
tothe
author(s).
Add
ition
alinform
ation,
includ
ingrig
htsan
dpe
rmission
policies,
isav
ailableat
http://journa
ls.in
form
s.org/.

Singh and Agrawal: Recruiting for Ideas: How Firms Exploit the Prior Inventions of New Hires130 Management Science 57(1), pp. 129–150, © 2011 INFORMS
such as DiMaggio and Powell (1983), suggest thatinterfirm movement of personnel is a particularlyimportant mechanism through which innovations dif-fuse among competitors in an industry. Analogously,the resource-based view of the firm acknowledgesthat recruitment from outside can enable firms tobypass constraints on growth imposed by relyingsolely on internally grown resources and capabilities(Penrose 1959, Barney 1991).At an aggregate level, scholars have also linked
regional economic growth to enhanced access to ideasafforded by interfirm mobility. In her monograph onregional advantage, Saxenian (1994, pp. 34–37) charac-terizes the relationship between recruiting and accessto ideas as central to explaining the exceptional eco-nomic growth of northern California: “Silicon Val-ley was quickly distinguished by unusually highlevels of job hopping. During the 1970s, averageannual employee turnover exceeded 35 percent inlocal electronics firms and was as high as 59 per-cent in small firms � � � � Early efforts to take legalaction against departed employees proved inconclu-sive or protracted, and most firms came to accepthigh turnover as a cost of business in the region � � � �This decentralized and fluid environment acceleratedthe diffusion of technological capabilities and know-how within the region.” Several studies that examinethe effects of restrictions on interfirm mobility dueto noncompete covenants find support for this view(Franco and Mitchell 2008, Marx et al. 2009, Samilaand Sorenson 2011).While the above research assumes a link between
mobility and knowledge flow, several studies explic-itly estimate aspects of this relationship, particularlyin the context of mobile inventors. In one of the firstsuch studies, Almeida and Kogut (1999) show thatlocations with greater intraregional labor mobilitybetween firms tend to have more localized knowledgeflows. In another study, Song et al. (2003) illustratethat mobile inventors build upon ideas from theirprevious firm more often than do other inventorsat the hiring firm. In yet another influential article,Rosenkopf and Almeida (2003) examine firm pairsand show that dyads that experience more labormobility between them also demonstrate greater sub-sequent knowledge flow. These pioneering studies, allbased on a methodology employing patent data forexamining the mobility–knowledge flow relationship,have inspired a large field of research using simi-lar data and methods to sharpen our understandingof various aspects of this relationship (e.g., Agrawalet al. 2006, Singh 2007, Oettl and Agrawal 2008,Agarwal et al. 2009, Corredoira and Rosenkopf 2010).Although the resulting literature has advanced the
field significantly, it remains subject to two related
limitations associated with drawing causal infer-ences from cross-sectional data on inventor mobil-ity and knowledge use. The first limitation concernsunobserved heterogeneity. The destination firm ismore likely to use an idea of inherently higherquality or greater firm-specific relevance, irrespectiveof whether it hires the inventor. However, inventorsof such ideas might also have a different likelihood ofbeing recruited (Hoisl 2007), thus presenting a selec-tion problem wherein an observed cross-sectional cor-relation between mobility and knowledge use doesnot reflect the true effect of mobility. The second con-cerns the endogeneity of a firm’s decision to hire.For example, a firm may be more inclined to recruitan individual who works in a domain that the firmintends to focus on in the future. This could coin-cide with the firm also employing other mechanismsto improve its access to external knowledge in thatdomain (including the recruit’s prior stock of ideas).This would again produce a mobility–knowledgeflow correlation without the former being a (fully)causal precursor to the latter. Not accounting for suchendogeneity will lead to an upward bias if we inter-pret the estimates as boosts in the use of ideas causedby an instance of mobility.2
Recognizing these inherent limitations of a cross-sectional research design for making causal infer-ences, Rosenkopf and Almeida (2003, p. 764) offer thischallenge: “Future research should attempt to utilizefully developed longitudinal databases to explore allpossible temporal and causal links.” We take up thatchallenge here. Therefore, in addition to offering aconceptual contribution, this study also advances themethodology employed in prior empirical researchon mobility and knowledge flow in three signif-icant ways. First, rather than basing our analysison aggregate citation counts, we demonstrate howthe use of disaggregated longitudinal citation datagenerates sharper insights into how different indi-viduals in a recruiting firm use a specific piece ofknowledge associated with a mobile inventor. Sec-ond, we employ a “difference-in-differences” (DD)approach to account for heterogeneity across patents.This avoids making the typical (strong) assumptionregarding cross-sectional comparability of the levelsof citations received by “focal” patents (i.e., thoseinvolving an inventor who subsequently moves) and
2 To be clear, prior literature does attempt to deal with the afore-mentioned issues by using technologically matched control patentsas a benchmark for cross-sectional comparison. However, givennecessarily imperfect matching, such challenges are unavoidable inany cross-sectional research design. The concerns become particu-larly salient in the typical mobility-related study that employs therelatively aggregate three-digit technology match, because that islikely too coarse to sufficiently capture all relevant characteristicsof the underlying knowledge.
INFORMS
holds
copyrightto
this
article
and
distrib
uted
this
copy
asa
courtesy
tothe
author(s).
Add
ition
alinform
ation,
includ
ingrig
htsan
dpe
rmission
policies,
isav
ailableat
http://journa
ls.in
form
s.org/.

Singh and Agrawal: Recruiting for Ideas: How Firms Exploit the Prior Inventions of New HiresManagement Science 57(1), pp. 129–150, © 2011 INFORMS 131
“control” patents (i.e., other similar patents). Instead,our identification strategy only relies upon comparingchanges in citation rates over time. Third, to furtheraddress concerns regarding comparability of the focaland control patents, we replicate our initial analysis,which is based on a conventional matching approach,with a more stringent matching procedure.We begin our analysis with a sample based on
the matching criteria most prior studies employ: thethree-digit technology classification and the applica-tion year.3 This method, predicated on the comparisonof postmove citation levels for focal versus controlpatents to estimate the effect of mobility, rests onthe assumption that a three-digit technology matchsuffices for addressing heterogeneity across patents.However, we find evidence that this assumption isnot reasonable; destination firms cite focal patents at ahigher rate than control patents even before the move.In recognition of this systematic difference betweenfocal and control patents, we use the DD approachto “difference out” the premove citation trend associ-ated with focal patents. This allows us to distinguishthe component of the postmove citation rate that ismore likely due to the “treatment” (attributable tothe move) from the component that is due to “selec-tion” (attributable to the kind of inventor who is morelikely to move). Our DD analysis reveals that hiringan inventor is associated with a firm increasing itsuse of the new recruit’s prior ideas significantly: byapproximately 219% on average.We repeat our DD estimation using an alternative
sample based on a more stringent matching proce-dure employing “coarsened exact matching” (CEM)(Iacus et al. 2009). The additional matching crite-ria we employ are based on information related tothe patent’s premove citations, the inventor’s careerhistory, and the lag between the patent’s applica-tion and grant dates. As the extensive literature onmatching emphasizes, using appropriately stringentmatching reduces endogeneity concerns as well asthe sensitivity of the subsequent regression-based esti-mation on specific functional form assumptions. Inour case, eliminating the premove citation rate differ-ences between focal and control patents particularlyimproves their comparability in terms of expectedfuture citation rates. We find the DD estimates basedon this more stringent matching to be very similar tothose found using the previous analysis.Having estimated the extent to which a desti-
nation firm uses its new recruit’s prior ideas, wenext turn our attention to examining the mecha-nism through which the firm accomplishes this. The
3 Jaffe et al. (1993) pioneer this matching procedure. Thompsonand Fox-Kean (2005) propose refinements to this technology-basedmatching while also discussing the inherent challenges of usingsuch a matching approach.
extant literature emphasizes the idea of “learning byhiring” (Song et al. 2003, Rosenkopf and Almeida2003), which effectively assumes that the recruit’s tacitknowledge diffuses internally and becomes part ofthe firm’s overall knowledge base shortly after therecruit’s arrival. However, Simon (1991, p. 126) cau-tions against such assumptions: “We must be care-ful about reifying the organization and talking aboutit as ‘knowing’ something or ‘learning’ something.It is usually important to specify where in the orga-nization particular knowledge is stored, or who haslearned it � � � � Since what has been learned is storedin individual heads, its transience or permanencedepends on what people leave behind them whenthey depart from an organization or move from oneposition to another. Has what they have learned beentransmitted to others or stored in ways that will per-mit it to be recovered when relevant?”The above remark motivates our next set of analy-
ses, where we distinguish between self-exploitation ofthe recruit’s prior ideas and increased usage by oth-ers in the firm. We discover that almost half of theboost in the use of the recruit’s prior ideas is due tothe recruit herself building upon her own prior ideasafter arriving at her new firm.4 To the extent thatthe recruit’s tacit knowledge does diffuse through thedestination firm, we are also interested in estimatinghow widely this occurs. On the one hand, knowledgemay diffuse narrowly, through close interpersonal tiessuch as those formed by collaboration (Hansen 1999,Singh 2005, Singh et al. 2010). On the other hand,the presence of alternate intrafirm diffusion mecha-nisms might reduce the reliance on such ties, enablinga wider employee base to build upon the recruit’sprior ideas. When we exclude idea use by the recruitas well as by the collaborative network she forms inher new firm, we find that other inventors account foronly about a third of the overall boost realized by thehiring firm. Next, when we focus specifically on thetemporal pattern of citations, expecting that the roleof the recruit might diminish shortly after she arrivesas her tacit knowledge diffuses throughout the desti-nation firm, we instead find that her role persists overtime to a surprising degree.These findings suggest the need to temper the
prevalent learning-by-hiring view with recognitionthat, at least in our sample, we must attribute almosthalf of the knowledge boost to what can better bedescribed as “exploiting by hiring.” This has impor-tant implications for how we should interpret themobility–knowledge flow link, given that reliance on
4 Our results are consistent with the findings of Tzabbar et al.(2009), who report that having the recruit on an inventing teamsignificantly increases the likelihood of the team exploiting one ofthe recruit’s prior inventions.
INFORMS
holds
copyrightto
this
article
and
distrib
uted
this
copy
asa
courtesy
tothe
author(s).
Add
ition
alinform
ation,
includ
ingrig
htsan
dpe
rmission
policies,
isav
ailableat
http://journa
ls.in
form
s.org/.
Singh and Agrawal: Recruiting for Ideas: How Firms Exploit the Prior Inventions of New Hires132 Management Science 57(1), pp. 129–150, © 2011 INFORMS
a single employee for an important piece of knowl-edge may confer significant bargaining power to thatindividual (Becker 1962, Lazear 1986, Coff 1997, Moen2005, Groysberg et al. 2008). This echoes Peteraf’s(1993, p. 187) remark: “For example, a brilliant, NobelPrize–winning scientist may be a unique resource, butunless he has firm-specific ties, his perfect mobilitymakes him an unlikely source of sustainable advan-tage.” In addition, to the extent that the individualalso chooses her collaborators (who seem to enjoypreferential access to her ideas), she might furtherinfluence the knowledge diffusion process in a waythat is suboptimal for the firm.We organize the remainder of the paper as fol-
lows. In §2, we outline our empirical frameworkand distinguish it from the traditional cross-sectionalapproach. In §3, we describe the construction of ourtwo data sets, one corresponding to the conventionalmatching procedure and the other based on morestringent matching criteria. In §4, we present ourempirical results. Finally, in §5, we discuss the impli-cations of our findings, limitations of our study, andpotential directions for future research.
2. Empirical Framework2.1. Patent Data, Mobility, and the Use of IdeasMicrolevel data suitable for examining the linkbetween mobility and knowledge flows are hard tocome by. A notable exception is patent data, whichresearchers have commonly employed for this pur-pose. These data include detailed information on eachpatent, including inventor names, application andgrant dates, assignee organization (if any), techno-logical classification, etc. This information is particu-larly useful on two dimensions. First, it enables theresearcher to infer interfirm mobility by chronologi-cally tracing individual inventors as they appear onpatents assigned to different firms at different times.Second, tracking citations that a patent receives allowsinference regarding subsequent use of a particularidea. Admittedly, both of these patent-based measuresare far from perfect, a point we elaborate on in thediscussion section.
2.2. A Cross-Sectional Comparison ofCitation Rates
We begin by implementing a method of examiningthe link between mobility and knowledge flows thatfollows “best practice” from existing studies. To doso, we first create a sample of patents represent-ing ideas developed by inventors who subsequentlychange firms. We refer to these as “focal patents.”Second, we match each focal patent with a com-parable “control patent” with the same three-digittechnology class and application year. Finally, we
examine cross-sectional differences between the focaland control patents in terms of the number of cita-tions they receive from the destination firm (the firmthat recruits the focal inventor) in the period follow-ing the move.Formally, we define CITESi� t as the number of cita-
tions a patent i (focal or control) receives from the des-tination firm in year t (any year following the move).The cross-sectional estimation equation we employ(using observations just from the postmove period) is
CITESi� t = f(�R RECRUITi + �XXi
+ �t−appyear�i� + �t + i� t
)� (1)
Here, RECRUITi is an indicator variable thatequals 1 for a focal patent and 0 for the correspond-ing control patent. Rather than assuming a specificfunctional form for the temporal pattern of citations,the above model follows a nonparametric approach inaccounting for patent age using yearly indicator vari-ables for the gap between patent i’s application yearand the citing year t being considered, and citing yearusing different indicator variables for each calendaryear t.5
The baseline expectation is that �R should be pos-itive and significant. In other words, the destinationfirm should cite prior patents of recruits more thanthe corresponding control patents. The vector Xi rep-resents the variables we use to control for variation inkey observables associated with the destination firm,the source firm, the inventor, and the patent.Although commonly employed, such a cross-
sectional approach leaves open a concern regardingunobserved heterogeneity across inventors and theirpatents. For example, better inventors may generatehigher-quality ideas (that naturally receive more cita-tions from others, including from the destination firm)and might also be more aggressively recruited. A focalpatent is also more likely to come from a specificknowledge domain of greater relevance for the desti-nation firm, despite the corresponding control beingdrawn from the same broad three-digit technologyclass. In either case, the recruit’s patent would receivemore citations from the destination firm, irrespectiveof the move. To better identify the component of theboost in knowledge use that is directly attributable tothe move, we next turn to a difference-in-differences
5 Our goal is to appropriately control for patent age and citing yeareffects without necessarily identifying them separately. Given thatperfect collinearity would result if patent age and citing year effectsare included as full sets of indicator variables, we omit one of theindicator variables. All our findings are robust to instead followingthe Rysman and Simcoe (2008) and Mehta et al. (2009) approachof using indicator variables only for the citing year and accountingfor patent age by including the squared, cubic, and fourth terms ofpatent age.
INFORMS
holds
copyrightto
this
article
and
distrib
uted
this
copy
asa
courtesy
tothe
author(s).
Add
ition
alinform
ation,
includ
ingrig
htsan
dpe
rmission
policies,
isav
ailableat
http://journa
ls.in
form
s.org/.

Singh and Agrawal: Recruiting for Ideas: How Firms Exploit the Prior Inventions of New HiresManagement Science 57(1), pp. 129–150, © 2011 INFORMS 133
research design that allows us to distinguish betweenthe component of the boost in postmove citation ratethat is more likely due to “treatment” (i.e., the move)versus “selection” (i.e., differences in the kind ofinventors who move versus those who do not).
2.3. A Difference-in-Differences Approach forExamining the Effect of Mobility
A DD approach for examining the mobility–knowl-edge flow link exploits the fact that we observecitations received by the focal and control patentsnot just postmove but also in the years precedingthe move. Although postmove differences confoundmobility-related knowledge acquisition with differ-ences in quality and/or relevance, we can disentan-gle these effects by taking into account differencesin citation rates that exist before the move. In effect,the premove difference in citation rates for focal ver-sus control patents can serve as a benchmark againstwhich to examine the postmove difference to iden-tify the component of the latter difference that isattributable to the move itself.6
Implementing this logic needs a patent-yeardata set that includes observations from the years notjust after but also before the move. Defining a newindicator variable, POSTMOVEi� t , as equal to 1 forobservations that involve a patent i from an inven-tor who actually moves and are from a citing year tthat falls in the postmove period, the estimation equa-tion is
CITESi� t = f(�R RECRUITi + �RP POSTMOVEi� t
+ �P PAIR_POSTMOVEi� t + �XXi
+ �t−appyear�i� + �t + i� t
)� (2)
Here, �R captures systematic differences in focal ver-sus control patents that exist even before the move.The additional indicator variable, PAIR_POSTMOVE,is defined as equal to 1 for focal and also controlpatent observations that occur in the (focal) postmoveperiod for a matched pair. As a result, �P estimatesthe “counterfactual” change in the citation rate at thetime of the move had the move not actually takenplace. Although the above equation can be estimatedusing a pooled model, the more natural approach is touse matched-pair fixed effects. The coefficient of realinterest is �RP , which will be positive and significantif mobility really does lead to the destination firm’sincreased use of the recruit’s prior ideas.
6 In the online appendix provided in the e-companion to this paper(which is available as part of the online version that can be foundat http://mansci.journal.informs.org/), Figure A1 and related notesprovide further intuition of how the DD approach conceptually dif-fers from the cross-sectional approach described above. For a moregeneral overview of the DD methodology, see Angrist and Pischke(2009, Chap. 5). See Murray and Stern (2007) and Furman and Stern(2011) for instructive applications in the context of citations.
The above estimation relies upon an assumption ofstrict one-to-one comparability of focal and controlpatents. Such an assumption is necessary when carry-ing out univariate DD analysis (of the kind reportedlater in Tables 4 and 5). However, because con-trol patents do not actually involve a move, match-ing does not ensure perfect comparability. Therefore,our preferred approach is not to include a separatePAIR_POSTMOVE variable, but rather we use thecontrol patents only to help account for effects asso-ciated with a patent’s application year and age (cap-tured using a series of indicator variables).Also, although the above framework allows for
a systematic difference between focal and controlpatents using the RECRUIT variable, we can gener-alize it to allow individual patents to be differentin unobserved ways (e.g., because inventor charac-teristics we do not observe). In particular, we canemploy patent fixed effects analysis to detect “abnor-mal” within-patent changes in the citation rate to apatent after an inventor moves. The estimation wouldtherefore rely only on a deviation in the patent’s post-mobility citation rate from its own estimated expectedrate, where the expected rate is derived by extrap-olating from the premove citation rate and assum-ing a temporal trend analogous to other patents withsimilar technological and temporal characteristics. Weexpress the resulting model as
CITESi� t = f(�RP POSTMOVEi� t + i
+ �t−appyear�i� + �t + i� t
)� (3)
Here, i reflects the fixed (time invariant) effect corre-sponding to patent i. Because the fixed effect absorbsunique patent characteristics, the model no longerincludes direct effects of time-invariant, patent-levelvariables (RECRUITi and Xi in the previous models).However, we can still estimate the DD coefficient �RP .7
2.4. A More Stringent Matching Procedure forSample Construction
The above DD research design essentially replacesthe conventional (strong) assumption of comparabil-ity of postmove citation levels of focal versus controlpatents with a weaker assumption regarding com-parability in terms of changes in the citation rateover time. However, one might still worry whetherthe conventional matching criteria (three-digit tech-nology class and application year) really produce a
7 See Murray and Stern (2007) for a similar specification. Becausethe lag between the application and the move varies even acrossfocal patents, we can estimate �RP using just the focal patent sub-sample as well. Although we do report findings from such analy-sis, particularly to ensure that our findings are not too sensitive tothe specific control patents included, our preferred approach is toinclude appropriately matched control patents in the sample.
INFORMS
holds
copyrightto
this
article
and
distrib
uted
this
copy
asa
courtesy
tothe
author(s).
Add
ition
alinform
ation,
includ
ingrig
htsan
dpe
rmission
policies,
isav
ailableat
http://journa
ls.in
form
s.org/.

Singh and Agrawal: Recruiting for Ideas: How Firms Exploit the Prior Inventions of New Hires134 Management Science 57(1), pp. 129–150, © 2011 INFORMS
control sample comparable to the focal patents evenunder these weaker assumptions. As described indetail in §3.2, we construct an alternate set of controlpatents based on a more stringent match and use thatsample in the subsequent empirical analysis.A more stringent matching procedure offers two
potential benefits (Imbens 2004). First, to the extentthat the likelihood of “treatment” (in our case,the “mobility event”) correlates with the additionalmatching criteria employed, it reduces concerns aboutendogeneity-related biases. Second, more stringentmatching reduces sensitivity of the findings to specificfunctional form assumptions (Moffitt 2004).Given that a key concern above is comparability
of patents in terms of citation rates, our more strin-gent matching procedure explicitly includes amongthe additional matching criteria premove citationsreceived by focal and control patents, both overall andfrom the destination firm in particular. We also matchon the patenting history of the inventor in termsof the number of past patents and years since thefirst patent. Finally, we also use the grant delay (i.e.,the lag between the application and grant date) as amatching criterion to allow for the possibility that thegrant delay may itself be a result of important patentcharacteristics or that the start of a patent’s “citationclock” is more appropriately modeled using its grantdate rather than application date (Mehta et al. 2009).The consistency of matching-based estimates nor-
mally relies upon a “selection on observables”assumption. Because the likelihood of “treatment”might also depend on unobservables or on observ-ables that are impractical to fully match on, evenseemingly stringent matching only reduces endogene-ity concerns, rather than eliminating them (Heckmanand Navarro-Lozano 2004). Therefore, given theweaker underlying assumptions discussed above, wecontinue to employ a DD approach even when usingthe more stringently matched sample.
2.5. Our Preferred Regression ModelBecause patent citations involve count data skewedto the right (and overdispersed relative to Poisson),scholars commonly employ negative binomial mod-els for estimating parameters. For comparability withprevious research, we therefore start with negativebinomial regressions that illustrate some of our keypoints using models that are commonly employed inrelated literature. We employ robust standard errors,with clustering on the inventor to account for non-independence of observations pertaining to the samecited patent and to different patents involving thesame inventor. We then implement analogous regres-sions using the corresponding linear (ordinary leastsquares) models, which have the benefit of allowingmore fine-grained indicator variables for technology
(at the three-digit level rather than two-digit levelpractical for nonlinear models), inventor location (U.S.state or non-U.S. country), inventor age (in years), andgrant delay (in months).For our preferred implementation of DD, how-
ever, we employ patent fixed effects to better addressconcerns regarding unobserved heterogeneity acrosspatents (e.g., differences in the intrinsic quality or rel-evance to the destination firm that the pooled mod-els do not capture). Our preferred approach is toemploy linear regression specifications with patentfixed effects, though the results reported in this paperare robust to employing a conditional fixed effectsPoisson framework instead (Wooldridge 1999).8 Thereason we prefer linear models here is that, in addi-tion to the usual challenges related to including toomany fine-grained indicator variables or interpretingDD coefficients (especially when comparing acrossdifferent models), such nonlinear conditional fixedeffects models also drop a large fraction of the samplethat has no within-patent variation in the dependentvariable (because of zero citations being so prevalent,especially among observations on control patents).9
3. Data Set Construction3.1. Constructing the “Original Sample” of Focal
and Control PatentsWe merge patent data obtained directly from theUnited States Patent and Trademark Office withthe National Bureau of Economic Research (NBER)patent data set (Jaffe and Trajtenberg 2002) and theNational University of Singapore/Melbourne Busi-ness School patent, data set. We enhance these alongtwo dimensions. First, for each assigned patent, wedetermine the assignee organization by carrying outan assignee name cleanup followed by a parent-subsidiary match.10 Second, we use not just inventornames but also other data fields (i.e., technologyclassification, inventor address, collaborator names,
8 We implement this in Stata using the “xtqmlp” procedure (writ-ten by Tim Simcoe and available for download at http://people.bu.edu/tsimcoe/code/xtpqml.txt), which corrects the standarderrors from a fixed effects Poisson model for overdispersion(Rysman and Simcoe 2008). This addresses concerns regardinginterpreting a conditional fixed effects negative binomial modelas a true fixed effects estimator (Wooldridge 1999, Allison andWaterman 2002).9 For an excellent discussion on the trade-offs involved in choosingbetween linear and nonlinear models in such settings, see Angristand Pischke (2009).10 We build upon the assignee matching procedure used by Singh(2005, 2007), who relies upon NBER Compustat identifiers, differ-ent corporate ownership directories, and Internet sources. To fur-ther reduce any possibility of misclassifying spelling differences,name changes, or acquisitions as instances of mobility, we manuallydouble-checked instances of algorithmically detected mobility.
INFORMS
holds
copyrightto
this
article
and
distrib
uted
this
copy
asa
courtesy
tothe
author(s).
Add
ition
alinform
ation,
includ
ingrig
htsan
dpe
rmission
policies,
isav
ailableat
http://journa
ls.in
form
s.org/.

Singh and Agrawal: Recruiting for Ideas: How Firms Exploit the Prior Inventions of New HiresManagement Science 57(1), pp. 129–150, © 2011 INFORMS 135
Figure 1 Sample Construction
Original firm
Destination firm
Controlpatent
Same applicationyear and three-digit
technology
Comparecitation rates
Recruit’spatent
Inventor recruitedby destination firm
Notes. We begin by identifying a set of focal patents (“Recruit’s patents”), each created by a single inventor who subsequently moves to another firm betweenthe 3rd and 10th year after the focal patent’s application date. (Excluding the first two years ensures a premove observation window, data upon which the DDapproach relies.) In constructing the original sample, we match each focal patent with a “control” patent (from a different firm and by a single inventor whoshows no evidence of moving in the first 12 years) such that the control patent has the same application year and three-digit primary technology class. Wefollow a similar procedure in constructing the CEM sample except that we use additional observables (including premove citation and inventor information) tocarry out a more stringent match.
citation information) to create a unique identifier foreach inventor on all patents.11
To obtain a data set of reasonable size while allow-ing a sufficient time window for observing subse-quent inventor mobility and citations, we start withpatents with application years 1981–1990 (across alltechnology classes). In detecting instances of subse-quent interfirm mobility, we follow the prior liter-ature and infer mobility through observed changesin the assignee firm on successive patents filed byindividual inventors (Almeida and Kogut 1999, Songet al. 2003).12
We restrict our sample (both focal and control) topatents with a single inventor to facilitate unambigu-ous conceptualization of interfirm mobility (or lackthereof) for any given patent. From this subset, wedraw our sample of focal patents for which the inven-tor exhibits interfirm mobility any time between (andincluding) the 3rd and 10th years following the appli-cation year (we exclude the first and last two years sothat there is at least some pre- and postmove citationdata for each patent to facilitate meaningful DD esti-mation when we employ cited patent fixed effects).One challenge is that even when we observe two
successive patents from the same inventor but at dif-ferent firms, we cannot pinpoint the inventor’s exactmove date within this window. We thus base all anal-yses reported in this paper on mobility events forwhich this window is four years or less, because adetailed temporal examination would not be as useful
11 We base our name matching approach on Singh (2008), whosealgorithms are similar to procedures implemented by Trajtenberg(2006) and Fleming et al. (2007).12 Patent data are only effective for identifying instances of mobil-ity where an inventor successfully files for patents both before andafter a move. In the discussion section, we elaborate on the poten-tial concerns arising from this.
for cases where the move date is too uncertain. There-fore, we drop about 30% of all observed interfirmmobility events.13
Because we do not have exact information aboutthe move date, we start by calculating the halfwaypoint between the last observed date at the sourcefirm and the first observed date at the destinationfirm. However, although the move could have takenplace any time after the start of this window, it wouldprobably have taken place at least a few monthsbefore the end of the window because of a lagbetween an inventor joining a new firm and filinga patent there. Furthermore, we take the temporalunit of analysis to be the year, rather than the day ormonth, to avoid any pretence of a precisely estimatedmove date. These two factors lead us to define thebeginning of the calendar year of the window mid-point calculated above as our “move date” estimate.Given the uncertainty, this somewhat ad hoc estimateis unlikely to do much worse than more sophisticatedheuristics. Moreover, it facilitates analysis by allow-ing classification of each calendar year as being eithercompletely before or after a given move, allowing usto work with a patent-year panel.As the next step, we follow previous research in
matching each focal patent with a corresponding con-trol patent (Figure 1). We choose the control patent
13 Of the remaining, the uncertainty is zero to two years for 65%of the cases and three to four years for the rest. Thus, an estimateof the move year based on the midpoint is off by not more thanone year in two-thirds of the cases and not more than two yearsfor the rest. One might worry about representativeness of the finalsample. For example, because longer time windows imply fewerpatents per year, the dropped observations could pertain to lessproductive inventors. To rule out the possibility of any resultingbiases, we redo the analyses reported in this paper using differentwindow cutoffs. The main results remain qualitatively unchanged.
INFORMS
holds
copyrightto
this
article
and
distrib
uted
this
copy
asa
courtesy
tothe
author(s).
Add
ition
alinform
ation,
includ
ingrig
htsan
dpe
rmission
policies,
isav
ailableat
http://journa
ls.in
form
s.org/.

Singh and Agrawal: Recruiting for Ideas: How Firms Exploit the Prior Inventions of New Hires136 Management Science 57(1), pp. 129–150, © 2011 INFORMS
Figure 2 A Longitudinal Data Set of Citations Received from the Destination Firm
Recruit’spatent
Controlpatent
R1984 R1985 R1986 R1987 R1988 R1989 R1990 R1991 R1992 R1993 R1994 R1995
1983
1983
Recruit’smove date
C1984 C1985 C1986 C1987 C1988 C1989 C1990 C1991 C1992 C1993 C1994 C1995
Rt = Citations received by the recruit’s prior patent from the destination firm in year t
Ct = Citations received by the matched control patent from the destination firm in year t
Notes. We use each of the two matched samples described in the notes to Figure 1 to construct a longitudinal patent-year data set of citations. Each of the tworesulting data sets has 12 yearly observations for each cited patent, corresponding to the 12 years directly following the patent’s application year. In the aboveexample, the focal and corresponding control patent originate in year 1983, so each of them gives rise to one observation per year for the period 1984–1995.Taking the move date as January 1, 1988, we classify the observations corresponding to 1984–1987 as premove and the observations corresponding to1988–1995 as postmove. Following this procedure, we construct the original sample with 95,424 observations (3�976× 12× 2) corresponding to the 3,976focal patents and as many control patents. In contrast, the CEM sample has 61,032 observations (2�543× 12× 2), because we drop the focal patents thatcannot find a more stringent match.
such that it originates in another firm, it also hasa single inventor, and its inventor does not exhibitany interfirm mobility in the 12 years that follow.14
We use control patents to account for general shiftsin the technological focus of the destination firmbecause such shifts will be reflected in an increasedlikelihood of citing not just the focal patent but alsothe control patent. In the relatively infrequent caseswhere we cannot match the focal patent with a con-trol patent on the above criteria, we drop the patentfrom the sample. These steps lead to a final sample of7,852 patents, exactly half (3,976) of which are associ-ated with an inventor who subsequently moves (focalpatents), and the other half are the corresponding con-trol patents. For each of these, we count the annualnumber of citations made by the destination firm inthe 12 years following the application year (Figure 2).Having 12 observations for each patent results in apatent-year panel of 95,424 observations (the “origi-nal” sample).Table 1 summarizes the key variables.15 Our first
dependent variable, all cites, includes all citations the
14 Same-firm patents are inappropriate as controls because themobile inventor is likely to carry knowledge about not just her ownpatent but also about other same-technology patents from the samefirm. So using those as controls would systematically underestimatethe benefits from mobility.15 Note that the average citation rates reported are small becausethe probability of a specific firm citing a specific patent in aspecific yearis low. For example, all cites has a nonzero value for only around1.8% of the observations in the original sample.
recruit’s patent receives from the hiring firm in thefocal year. We define the next dependent variable, citesexcluding inventor self-cites, analogously to all cites butexclude self-citations made by inventors to their ownpatents. By eliminating an inventor’s citations, thisvariable measures the use of an idea by individualsat the destination firm other than the inventor her-self, hence excluding self-exploitation by the recruit.To examine the breadth of intrafirm knowledge dif-fusion, we construct another dependent variable, citesexcluding inventor self-cites and collaborator cites, as thecount of citations made by those in the destinationfirm that have not directly collaborated (as coauthorson previous patents) with the inventor before the cit-ing year.16
Our two key explanatory variables are recruit andpostmove. We use the indicator recruit to identifyinventions made by individuals who are subsequentlyrecruited and move to a new firm, the so-called des-tination firm. In other words, we use recruit to dis-tinguish between our “treated” versus “untreated,”or control, patents. We classify a given patent-yearobservation for a focal patent as occurring afterthe estimated move date using the indicator vari-able postmove. In initial models, we also employ aseparate indicator variable pair postmove that is one
16 If a cited patent’s inventor and some of her former collaboratorsdevelop a new patent that cites her previous patent, we classifythat citation as an inventor self-cite rather than a collaborator cite.We classify a citation as a collaborator cite only when the citedinventor herself is not involved.
INFORMS
holds
copyrightto
this
article
and
distrib
uted
this
copy
asa
courtesy
tothe
author(s).
Add
ition
alinform
ation,
includ
ingrig
htsan
dpe
rmission
policies,
isav
ailableat
http://journa
ls.in
form
s.org/.

Singh and Agrawal: Recruiting for Ideas: How Firms Exploit the Prior Inventions of New HiresManagement Science 57(1), pp. 129–150, © 2011 INFORMS 137
Table 1 Variable Definitions and Summary Statistics
Variables Mean Std. dev. Min Max
Dependent variablesAll cites All citations to the focal patent from the destination firm (in the given year) 0�018 0�200 0 11Cites excluding inventor
self-citesDestination firm citations coming from individuals other than the patent’s
inventor herself0�013 0�164 0 11
Cites excluding inventorself-cites and collaboratorcites
Destination firm citations coming from individuals other than the patent’sinventor herself or any of her prior collaborators
0�011 0�147 0 11
Explanatory and control variablesRecruit Indicator for whether the given patent is a focal patent involving a move or
a control patent0�50 0�50 0 1
Destination firm patents Number of patents assigned to the destination firm in the five yearspreceding the inventor’s move year
1�041�9 1�433�1 0 8�260
Destination same-class patents Number of destination firm patents that belong to the same three-digittechnology class as the focal patent
26�9 75�8 0 1�375
Original firm patents Number of patents assigned to the original firm in the five years precedingthe focal patent’s application year
1�120�1 1�157�0 0 5�504
Claims Number of claims made by the focal patent 11�53 9�36 1 155Patent references Number of backward citations that the focal patent makes to other patents 6�78 7�01 0 171Nonpatent references Number of nonpatent references made by the focal patent 0�86 2�28 0 37Inventor patents Number of previous patents successfully applied for by the same inventor 7�76 13�07 0 202Inventor age Number of years since the inventor applied for her first successful patent 4�47 4�34 0 26U.S. inventor Indicator for whether the focal patent’s inventor has a U.S. address or not 0�54 0�50 0 1Grant delay The delay between application date and grant date for the focal patent
(in months)22�69 10�82 1 136
Timing-related variablesPostmove
For a focal patent, this is an indicator for whether the citing year falls afterthe move. For a control patent, this is always defined as 0.
0�318 0�466 0 1
Pair postmove For both the focal and the control patents in a matched pair, this is anindicator for whether the citing year falls after the move for the focalpatent in that pair.
0�636 0�481 0 1
Premove period 1 For a focal patent, this is an indicator for whether the citing year is the1st or 2nd year before the move. For a control patent, this is always 0.
0�083 0�276 0 1
Premove period 2 For a focal patent, this is an indicator for whether the citing year is the3rd or 4th year before the move. For a control patent, this is always 0.
0�055 0�227 0 1
Premove period 3 For a focal patent, this is an indicator for whether the citing year is the5th or 6th year before the move. For a control patent, this is always 0.
0�029 0�168 0 1
Premove period 4 For a focal patent, this is an indicator for whether the citing year is the1st or 2nd year before the move. For a control patent, this is always 0.
0�012 0�109 0 1
Premove period 5 For a focal patent, this is an indicator for whether the citing year is the7th or 8th year before the move. For a control patent, this is always 0.
0�003 0�057 0 1
Postmove period 1 For a focal patent, this is an indicator for whether the citing year is the1st or 2nd year after the move. For a control patent, this is always 0.
0�083 0�276 0 1
Postmove period 2 For a focal patent, this is an indicator for whether the citing year is the3rd or 4th year after the move. For a control patent, this is always 0.
0�080 0�271 0 1
Postmove period 3 For a focal patent, this is an indicator for whether the citing year is the5th or 6th year after the move. For a control patent, this is always 0.
0�071 0�257 0 1
Postmove period 4 For a focal patent, this is an indicator for whether the citing year is the7th or 8th year after the move. For a control patent, this is always 0.
0�054 0�227 0 1
Postmove period 5 For a focal patent, this is an indicator for whether the citing year is the9th or 10th year after the move. For a control patent, this is always 0.
0�029 0�167 0 1
Notes. We report summary statistics based on the original sample constructed as illustrated in Figures 1 and 2. This sample has 95,424 observations, arisingfrom 12 yearly observations for each of the 3,976 focal cited patents and another 12 yearly observations for each of the 3,976 control patents.
for not just the focal but also the control patentsin each matched pair for observations correspond-ing to the focal patent’s postmove period. However,as already discussed in the previous section, ourpreferred models (that use patent fixed effects) donot include this variable, thus avoiding the impliedassumption of strict one-to-one comparability of focal
and control patents. Note that this issue is irrelevantfor models estimated using the focal patent subsam-ple, where a separate pair postmove variable cannot beestimated in any case.For the pooled estimation models, we employ sev-
eral control variables (that are time invariant withina patent, and hence dropped in the preferred models
INFORMS
holds
copyrightto
this
article
and
distrib
uted
this
copy
asa
courtesy
tothe
author(s).
Add
ition
alinform
ation,
includ
ingrig
htsan
dpe
rmission
policies,
isav
ailableat
http://journa
ls.in
form
s.org/.

Singh and Agrawal: Recruiting for Ideas: How Firms Exploit the Prior Inventions of New Hires138 Management Science 57(1), pp. 129–150, © 2011 INFORMS
that employ patent fixed effects). Specifically, we con-trol for key observed characteristics of (1) the desti-nation firm (overall level of inventive activity, level ofinventive activity in the same technology class as therecruit’s patent),17 (2) the source firm (overall level ofinventive activity), (3) the inventor (number of priorpatents, number of years since first patent, U.S. res-ident indicator), and (4) the patent itself (number ofclaims, number of patent references, number of non-patent references, technology area).18
3.2. Constructing the “CEM Sample” Using MoreStringent Matching
Table 2 summarizes several characteristics of focal ver-sus control patents for the original sample and showsthat the two subsamples differ significantly on severalkey dimensions. In particular, focal patents systemati-cally (1) receive more overall citations, (2) receive morepremove citations from the destination firm, and (3)are created by more experienced inventors.To achieve more stringent matching, we employ the
CEM approach (Iacus et al. 2009).19 Specifically, weconstruct a sample that matches patents not just onthe three-digit technology class and application yearbut also on discrete buckets based on five additionalcriteria: (1) number of premove citations receivedoverall (four buckets: 0, 1–2, 3–7, and 8 or more);(2) number of premove citations received from thedestination firm specifically (four buckets: 0, 1, 2–3,and 4 or more); (3) number of previous patents bythis inventor (three buckets: 0 or 1, 2–12, and 13 ormore); (4) number of years since the first patent bythis inventor (three buckets: 0 or 1, 2–9, and 10 ormore); and (5) number of days delay between theapplication and grant date (three buckets: 490 or less,491–832, and 833 or more).20
17 To prevent circularity, wherein the move itself affects the size ofthe patent pool, we calculate the patent pool as of the move yearitself (rather than as of a citing year subsequent to the move).18 Whereas the pooled negative binomial models employ technol-ogy indicators at the two-digit NBER subcategory level, the pooledlinear models employ indicators at the three-digit technology classlevel. Also, we only use inventor age, U.S. inventor, and grant delay inthe pooled negative binomial models, but the pooled linear estima-tion allows us to use a full set of indicator variables for inventor age(in years), inventor location (U.S. state or non-U.S. country), andgrant delay (in months). For more on the importance of saturatingsuch models, particularly on the temporal dimension, see Levinand Stephan (1991), Hall et al. (2007), and Mehta et al. (2009).19 For a recent application of this technique, see Azoulayet al. (2010).20 Choosing the matching criteria involves a trade-off between thestringency of the match and the fraction of the sample for whicha match can be found. We choose to be most stringent on criteria(1) and (2) to ensure that premove citation patterns are practicallyidentical for the recruit versus control patents. For criteria (3), (4),and (5), we form boundaries for the three buckets using the 25thand 75th percentiles as cutoffs.
Table 2 Focal vs. Control Patents in the “Original Sample”(3,976 Patent Pairs)
Focal patents Control patents
Mean Std. dev. Mean Std. dev.
Cumulative overallpremove citations
2�98 4�50 2�42 3�88
Cumulative premovecitations fromdestination
0�063 0�461 0�023 0�272
Inventor patents 9�13 14�64 5�87 12�27Inventor age 4�98 4�29 3�96 4�32Grant delay 22�78 10�72 22�59 10�91Claims 11�73 9�68 11�32 9�02Patent references 6�92 7�40 6�64 6�58Nonpatent references 0�88 2�32 0�84 2�23Originality 0�34 0�27 0�35 0�28
Notes. The “originality” measure (taken from the NBER database) computesthe breadth of search as one minus the Herfindahl index of the backwardcitations made by a patent to different technology classes, and is undefinedfor the small fraction of patents (less than 4% of the sample) that have nobackward citations. The means of a majority of the reported characteristics(all except grant delay, nonpatent references, and originality) differ betweenthe focal and control subsamples at the 5% significance level, motivating theneed for a more stringent matching approach.
With this set of criteria and corresponding buck-ets, we are able to find matches for 2,543 of the 3,976mobile inventor patents from the original sample,resulting in a final sample of 5,086 (2�543 × 2) citedpatents. Again following a procedure similar to theone illustrated in Figure 2, we construct a patent-yeardata set of 61,032 (5�086×12) observations, which wecall the “CEM sample.” As the statistics reported inTable 3 demonstrate, the focal and control patents inthis sample are indeed better matched than in theoriginal sample summarized in Table 2.
4. ResultsWe now report our findings on four topics: (1) a com-parison of our estimates for the mobility–knowledgeflow relationship using the traditional cross-sectionalmethod versus our DD approach, (2) an estimate ofthe sensitivity of our findings to the more stringentlymatched CEM sample, (3) an estimate of the fractionof the boost in use of the recruit’s prior ideas that isdue not to “learning” but rather to exploitation ofthose ideas by the recruit herself, and (4) an examina-tion of temporal trends, including the persistence overtime of the recruit as the destination firm’s primaryuser of her stock of prior ideas.
4.1. Summary Statistics for Citation RatesBefore delving into the regression analysis, we presentthe basic intuition behind a DD approach using sum-mary statistics for the premove and postmove sub-samples corresponding to the focal as well as control
INFORMS
holds
copyrightto
this
article
and
distrib
uted
this
copy
asa
courtesy
tothe
author(s).
Add
ition
alinform
ation,
includ
ingrig
htsan
dpe
rmission
policies,
isav
ailableat
http://journa
ls.in
form
s.org/.

Singh and Agrawal: Recruiting for Ideas: How Firms Exploit the Prior Inventions of New HiresManagement Science 57(1), pp. 129–150, © 2011 INFORMS 139
Table 3 Focal vs. Control Patents in the “CEM Sample”(2,543 Patent Pairs)
Focal patents Control patents
Mean Std. dev. Mean Std. dev.
Cumulative overallpremove citations
2�55 3�76 2�50 3�83
Cumulative premovecitations fromdestination
0�010 0�136 0�010 0�136
Inventor patents 7�59 11�36 7�40 14�52Inventor age 4�50 4�05 4�61 4�18Grant delay 23�11 10�62 22�95 10�58Claims 11�39 9�01 11�18 8�67Patent references 6�40 5�97 6�38 5�25Nonpatent references 0�85 2�14 0�78 1�98Originality 0�33 0�28 0�34 0�28
Notes. The CEM sample has fewer patent pairs than the original sample(2,543 in contrast to 3,976 in Table 2) because we drop focal patents forwhich we find no match. The CEM procedure requires a match not just onthe three-digit technology class and application year but also on discretebuckets based on five additional criteria: (1) number of premove citationsreceived overall (four buckets: 0, 1–2, 3–7, and 8 or more); (2) number ofpremove citations received from the destination firm specifically (four buck-ets: 0, 1, 2–3, and 4 or more); (3) number of previous patents by this inventor(three buckets: 0, 1, 2–12, and 13 or more); (4) number of years since thefirst patent by this inventor (three buckets: 0 or 1, 2–9, and 10 or more);and (5) number of days delay between the application and grant date (threebuckets: 490 or less, 491–832, and 833 or more). None of the means dif-fer between the focal and control subsamples at the 5% significance level,indicating a closer match than that in Table 2.
patents.21 Table 4 reports the means for all cites foreach of these four subsamples from the original sam-ple. Recall from Table 1 that this variable is a count ofall citations a patent receives from the destination firmin a given year, including self-citations made by therecruit. For the postmove period, focal patents have agreater average annual citation rate (0.0396) than con-trol patents (0.0061), reflecting a difference of 0.0335citations per year. However, it is worth noting thatthe annual citation rate is greater for the focal patentseven in the premobility period (0.0140 versus 0.0051,reflecting a difference of 0.0089). The DD intuition isthat, rather than attributing the whole postmobilitydifference to the move itself, it is more reasonable toattribute to the move only the difference, 0.0246 (i.e.,0�0335 − 0�0089), between the postmobility and pre-mobility differences.
21 By construction, inventors of control patents do not movebetween firms. So, in reporting summary statistics and initialregression models that are directly motivated by the summarystatistics, we apply the move date of each focal patent to its corre-sponding matched control patent as a “counterfactual” move date.However, recognizing that control patents do not actually involvea move, all our preferred regression models (on which we baseour key conclusions) drop this approach and instead “throw thecontrols back in the pot.”
We now turn to the analogous calculation forthe variable cites excluding inventor self-cites, whichexcludes self-citations made by the mobile inventor.Note that all cites and cites excluding inventor self-citesare identical premove because the inventor is not yetan employee of the destination firm; therefore, by con-struction, there are no inventor self-cites from the des-tination firm that involve this inventor in the premoveperiod. The postmove mean for cites excluding inven-tor self-cites for recruits’ patents is 0.0250, which issignificantly smaller than the corresponding all citesmean of 0.0396, suggesting that roughly 37% (i.e., 1−�0�0250/0�0396�) of the overall citations are self-citesby the mover. Repeating the earlier calculation forcites excluding inventor self-cites leads to a DD sum-mary statistic of 0.0100, which is less than half thecorresponding all cites DD statistic of 0.0246. In otherwords, inventor self-citations appear to play a promi-nent role in the overall citation patterns seeminglyassociated with mobility.Table 5 reports the corresponding summary statis-
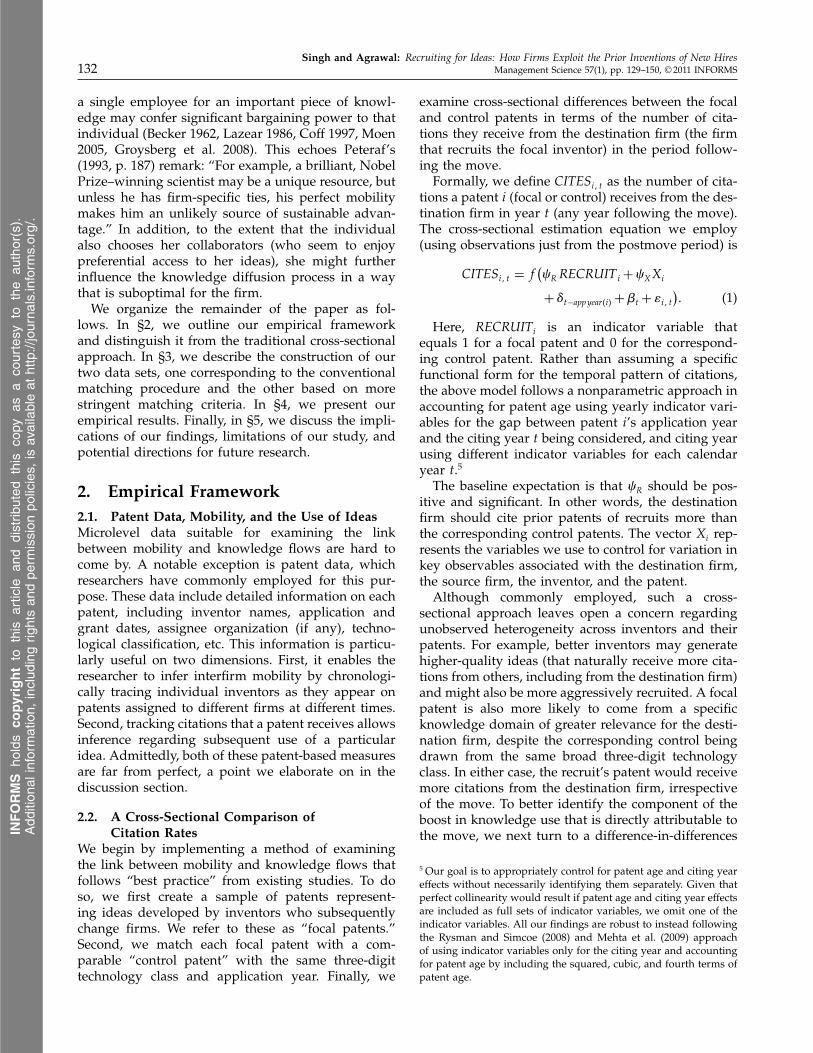
tics for the CEM sample. The premove means for cita-tions received are now very similar for focal versuscontrol patents because the cumulative premove cita-tion count is one of the matching criteria for CEM.22
Thus, the estimated DD effect now (roughly) coin-cides with a direct comparison of the focal and controlpatent citation rates after the move.The two main insights from Table 4 persist in
Table 5. First, there is a positive DD effect for all cites,suggesting an increase in citation rate attributable tomobility (with the magnitude 0.0296 being somewhatgreater but not too dissimilar from the value of 0.0246reported in Table 4 for the original sample). Second,comparing the DD statistic for cites excluding inventorself-cites with that for all cites (0.0167 versus 0.0296,respectively) again suggests that only a fraction ofthe apparent increase associated with the move arisesfrom “learning by hiring”; a significant component ofthe destination firm’s jump in usage of the recruit’sprior ideas is due to the recruit herself.
4.2. Regression Analysis Usingthe “Original Sample”
We now turn to the regression framework for amore rigorous analysis of the link between mobil-ity and knowledge flow. Table 6 reports our base-line analysis using the original sample, employing allcites as the dependent variable. Column (1) reportscross-sectional findings from the postmove subsam-ple, in effect replicating the current “best practice” of
22 Note that the focal patents successfully matched during CEMhave systematically lower premove citation rates (compare Tables 4and 5). We offer possible implications of this in the discussionsection.
INFORMS
holds
copyrightto
this
article
and
distrib
uted
this
copy
asa
courtesy
tothe
author(s).
Add
ition
alinform
ation,
includ
ingrig
htsan
dpe
rmission
policies,
isav
ailableat
http://journa
ls.in
form
s.org/.

Singh and Agrawal: Recruiting for Ideas: How Firms Exploit the Prior Inventions of New Hires140 Management Science 57(1), pp. 129–150, © 2011 INFORMS
Table 4 Annual Patent Citation Frequency for the “Original Sample”
Average annual citations received from the destination firm
Premove Postmove
Focal Subsample mean: Subsample mean: First difference (row):patents All cites= 0�0140 All cites= 0�0396 All cites= 0�0256
Cites excluding inventor self-cites= 0�0140 Cites excluding inventor self-cites= 0�0250 Cites excluding inventor self-cites= 0�0110�N = 17�383� �N = 30�329� �N = 47�712�
Control Subsample mean: Subsample mean: First difference (row):patents All cites= 0�0051 All cites= 0�0061 All cites= 0�0010
Cites excluding inventor self-cites= 0�0051 Cites excluding inventor self-cites= 0�0061 Cites excluding inventor self-cites= 0�0010�N = 17�383� �N = 30�329� �N = 47�712�
First difference (column): First difference (column): Difference in differences:All cites= 0�0089 All cites= 0�0335 All cites= 0�0246Cites excluding inventor self-cites= 0�0089 Cites excluding inventor self-cites= 0�0189 Cites excluding inventor self-cites= 0�0100�N = 34�766� �N = 60�658� �N = 95�424�
Notes. This analysis is based on the original sample described in Table 2. Each cell summarizes the average value of the all cites and cites excluding inventorself-cites variables in the corresponding subsample (see Table 1 for variables definitions). Note that all cites and cites excluding inventor self-cites are identicalpremove because the inventor is not yet an employee of the destination firm; therefore, by construction, there are no inventor self-cites from the destinationfirm in the premove period.
employing such comparisons of the postmove citationfrequency for focal versus control patents.23 The esti-mates appear to be both statistically and economicallyquite significant: the citation rate implied by the nega-tive binomial regression coefficients is 566% (e1�896 −1)greater in the focal sample than in the control sample.However, the DD analysis reported in column (2)
highlights why interpreting the above effect as beingentirely due to the inventor move itself is inap-propriate. The positive and significant coefficient onrecruit, despite having a separate term for postmove,demonstrates that focal patents systematically receivemore citations even before the “mobility event” takesplace. Stated another way, the cross-sectional anal-ysis employed in column (1) confounds selectioneffects with treatment effects. Nevertheless, becausethe estimate of the coefficient on postmove is pos-itive and significant in column (2), we have evi-dence consistent with an increase in knowledge useassociated with mobility (even though the effect issmaller than a cross-sectional analysis would leadus to believe). Because interpreting the magnitudeof effects in nonlinear models (particularly in cross-model comparison) is not straightforward, we post-pone that discussion until we come to our preferredspecification below: linear models with patent fixedeffects.We next replicate the pooled analyses from columns
(1) and (2) using linear models before turning to fixedeffects specifications. As the results in column (4)show, there is again clear evidence that focal patents
23 For variables that are highly skewed, the pooled regression analy-sis employs a logarithmic transformation, first adding one to allowfor transformation even in instances where the value could be zero.The results are robust to changing the size of the offset or usinguntransformed variables for the analysis.
are systematically more highly cited even premove.24
As a benchmark, note that the average number ofcitations received by a control patent in the post-move subsample is 0.0061 (Table 4). Compared withthe column (3) estimate of 0.0356, this represents a584% (0.0356/0.0061) increase in citations to the focalpatents; this is similar in magnitude to the column (1)estimate discussed earlier.The specification employed in column (4) again
takes into account the concern that a cross-sectionalassociation between mobility and citations confoundsselection with treatment. The estimates suggest thatonce we use recruit to account for the systematic dif-ference between focal and control patents that existseven before the move, a move is associated with asmaller but still significant increase of 0.0251 citationsper year. Compared to the average number of cita-tions received by the focal patents prior to the mobil-ity event (0.0140 from Table 4), this estimate impliesa 179% (0.0251/0.0140) increase in the citation rate.The results in column (4) also suggest that selectionaccounts for almost one-third, 29% �0�0101/�0�0101+0�0251�), of the effect that a cross-sectional approachlike column (3) would (incorrectly) attribute to theinventor move.
24 Given that we are working with highly disaggregated data (cita-tions to a specific patent from a specific firm in a specific year),the low R2 values are not a surprise. The more important statisticshere are the F -statistic for the model as a whole and the t-statisticsfor key variables, which are statistically significant. If increasing R2
were an end in itself, we would use a more aggregate unit of analy-sis (e.g., firm pairs) to remove unsystematic individual-level noise.However, doing so would not utilize the longitudinal microlevelinformation we want to exploit. In fact, a low R2 value is commonwhen using such disaggregated data; prominent examples includelabor market outcomes (e.g., Angrist and Krueger 1994, Malamudand Pop-Eleches 2010) and short-term stock returns (e.g., Llorenteet al. 2002).
INFORMS
holds
copyrightto
this
article
and
distrib
uted
this
copy
asa
courtesy
tothe
author(s).
Add
ition
alinform
ation,
includ
ingrig
htsan
dpe
rmission
policies,
isav
ailableat
http://journa
ls.in
form
s.org/.
Singh and Agrawal: Recruiting for Ideas: How Firms Exploit the Prior Inventions of New HiresManagement Science 57(1), pp. 129–150, © 2011 INFORMS 141
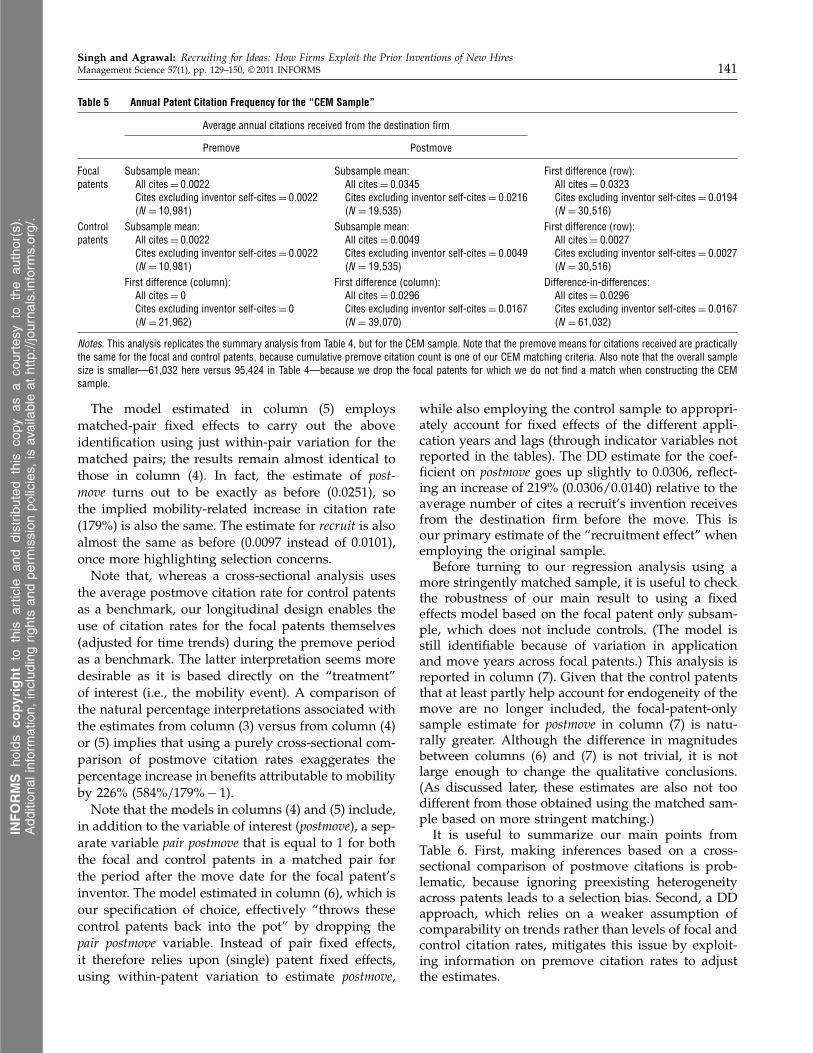
Table 5 Annual Patent Citation Frequency for the “CEM Sample”
Average annual citations received from the destination firm
Premove Postmove
Focal Subsample mean: Subsample mean: First difference (row):patents All cites= 0�0022 All cites= 0�0345 All cites= 0�0323
Cites excluding inventor self-cites= 0�0022 Cites excluding inventor self-cites= 0�0216 Cites excluding inventor self-cites= 0�0194�N = 10�981� �N = 19�535� �N = 30�516�
Control Subsample mean: Subsample mean: First difference (row):patents All cites= 0�0022 All cites= 0�0049 All cites= 0�0027
Cites excluding inventor self-cites= 0�0022 Cites excluding inventor self-cites= 0�0049 Cites excluding inventor self-cites= 0�0027�N = 10�981� �N = 19�535� �N = 30�516�
First difference (column): First difference (column): Difference-in-differences:All cites= 0 All cites= 0�0296 All cites= 0�0296Cites excluding inventor self-cites= 0 Cites excluding inventor self-cites= 0�0167 Cites excluding inventor self-cites= 0�0167�N = 21�962� �N = 39�070� �N = 61�032�
Notes. This analysis replicates the summary analysis from Table 4, but for the CEM sample. Note that the premove means for citations received are practicallythe same for the focal and control patents, because cumulative premove citation count is one of our CEM matching criteria. Also note that the overall samplesize is smaller—61,032 here versus 95,424 in Table 4—because we drop the focal patents for which we do not find a match when constructing the CEMsample.
The model estimated in column (5) employsmatched-pair fixed effects to carry out the aboveidentification using just within-pair variation for thematched pairs; the results remain almost identical tothose in column (4). In fact, the estimate of post-move turns out to be exactly as before (0.0251), sothe implied mobility-related increase in citation rate(179%) is also the same. The estimate for recruit is alsoalmost the same as before (0.0097 instead of 0.0101),once more highlighting selection concerns.Note that, whereas a cross-sectional analysis uses
the average postmove citation rate for control patentsas a benchmark, our longitudinal design enables theuse of citation rates for the focal patents themselves(adjusted for time trends) during the premove periodas a benchmark. The latter interpretation seems moredesirable as it is based directly on the “treatment”of interest (i.e., the mobility event). A comparison ofthe natural percentage interpretations associated withthe estimates from column (3) versus from column (4)or (5) implies that using a purely cross-sectional com-parison of postmove citation rates exaggerates thepercentage increase in benefits attributable to mobilityby 226% (584%/179%− 1).
Note that the models in columns (4) and (5) include,in addition to the variable of interest (postmove), a sep-arate variable pair postmove that is equal to 1 for boththe focal and control patents in a matched pair forthe period after the move date for the focal patent’sinventor. The model estimated in column (6), which isour specification of choice, effectively “throws thesecontrol patents back into the pot” by dropping thepair postmove variable. Instead of pair fixed effects,it therefore relies upon (single) patent fixed effects,using within-patent variation to estimate postmove,
while also employing the control sample to appropri-ately account for fixed effects of the different appli-cation years and lags (through indicator variables notreported in the tables). The DD estimate for the coef-ficient on postmove goes up slightly to 0.0306, reflect-ing an increase of 219% (0.0306/0.0140) relative to theaverage number of cites a recruit’s invention receivesfrom the destination firm before the move. This isour primary estimate of the “recruitment effect” whenemploying the original sample.Before turning to our regression analysis using a
more stringently matched sample, it is useful to checkthe robustness of our main result to using a fixedeffects model based on the focal patent only subsam-ple, which does not include controls. (The model isstill identifiable because of variation in applicationand move years across focal patents.) This analysis isreported in column (7). Given that the control patentsthat at least partly help account for endogeneity of themove are no longer included, the focal-patent-onlysample estimate for postmove in column (7) is natu-rally greater. Although the difference in magnitudesbetween columns (6) and (7) is not trivial, it is notlarge enough to change the qualitative conclusions.(As discussed later, these estimates are also not toodifferent from those obtained using the matched sam-ple based on more stringent matching.)It is useful to summarize our main points from
Table 6. First, making inferences based on a cross-sectional comparison of postmove citations is prob-lematic, because ignoring preexisting heterogeneityacross patents leads to a selection bias. Second, a DDapproach, which relies on a weaker assumption ofcomparability on trends rather than levels of focal andcontrol citation rates, mitigates this issue by exploit-ing information on premove citation rates to adjustthe estimates.
INFORMS
holds
copyrightto
this
article
and
distrib
uted
this
copy
asa
courtesy
tothe
author(s).
Add
ition
alinform
ation,
includ
ingrig
htsan
dpe
rmission
policies,
isav
ailableat
http://journa
ls.in
form
s.org/.

Singh and Agrawal: Recruiting for Ideas: How Firms Exploit the Prior Inventions of New Hires142 Management Science 57(1), pp. 129–150, © 2011 INFORMS
Table 6 Regression Analysis (“Original Sample”)
(1) (2) (3) (4) (5) (6) (7)Dependent variable: All cites All cites All cites All cites All cites All cites All citesRegression model: Negative Negative Linear Linear Linear Linear Linear
binomial binomial (pair FE) (patent FE) (Patent FE)Patent-year sample: Original sample Original sample Original sample Original sample Original sample Original sample Original sample
(postmove only) (postmove only) (focal only)
Recruit 1�896∗∗∗ 1�017∗∗∗ 0�0356∗∗∗ 0�0101∗∗∗ 0�0097∗∗∗
�0�137� �0�213� �0�0034� �0�0022� �0�0021�Postmove 0�907∗∗∗ 0�0251∗∗∗ 0�0251∗∗∗ 0�0306∗∗∗ 0�0367∗∗∗
�0�230� �0�0037� �0�0028� �0�0023� �0�0043�Pair postmove 0�157 0�0033 0�0061∗∗∗
�0�207� �0�0025� �0�0023�ln(destination same-class patents) 0�428∗∗∗ 0�497∗∗∗ 0�0085∗∗∗ 0�0075∗∗∗
�0�050� �0�048� �0�0012� �0�0010�ln(destination firm patents) −0�215∗∗∗ −0�202∗∗∗ −0�0039∗∗∗ −0�0028∗∗∗
�0�045� �0�040� �0�0010� �0�0007�ln(original firm patents) 0�013 0�003 0�0010 0�0008 0�0011
�0�040� �0�038� �0�0013� �0�0009� �0�0009�ln(claims) 0�085 0�096 0�0049∗∗ 0�0041∗∗ 0�0046∗∗
�0�083� �0�078� �0�0024� �0�0018� �0�0021�ln(patent references) 0�027 0�074 0�0009 0�0019 0�0018
�0�083� �0�077� �0�0028� �0�0019� �0�0024�ln(nonpatent references) 0�149 0�073 0�0036 0�0018 −0�0002
�0�093� �0�091� �0�0027� �0�0020� �0�0029�ln(inventor patents) −0�129 −0�112 −0�0013 −0�0007 0�0006
�0�092� �0�085� �0�0018� �0�0013� �0�0022�ln(inventor age) 0�112 0�053
�0�105� �0�098�U.S. inventor 0�662∗∗∗ 0�611∗∗∗
�0�156� �0�138�ln(grant delay) 0�123 −0�011
�0�136� �0�131�
Number of observations 60,658 95,424 60,658 95,424 95,424 95,424 47,712Number of cited patents 7,952 7,952 7,952 7,952 7,952 7,952 3,976Log likelihood −5,238 −6,806Wald chi2 841�9∗∗∗ 48,236∗∗∗
R2 0�037 0�029 0�014 0�004 0�006F -statistic 4�47∗∗∗ 5�43∗∗∗ 5�76∗∗∗ 12�06∗∗∗ 9�02∗∗∗
Notes. All models include yearly indicator variables for the citing year and patent age. The pooled linear models in columns (3) and (4) do not include variablesinventor age, U.S. inventor, and grant delay used in the columns (1) and (2) because more fine-grained indicator variables for the inventor age (in years),inventor location (U.S. states or non-U.S. countries), and patent grant delay (in months) have been used instead but not shown. We use robust standard errorsclustered on the identity of the inventor in all four of these pooled models. We employ matched pair fixed effects (FE) (with standard errors clustered for eachpair) in column (5), and employ patent fixed effects in columns (6) and (7). Whereas column (6) reports our preferred estimation approach that employs amatched sample, the column (7) analysis is a robustness check using just the focal patent subsample. Detailed timing analysis corresponding to column (6)appears in Figure 3, revealing an upward trend in focal patent citations even before the move year, motivating the need for more stringent matching.
∗∗p < 0�05; ∗∗∗p < 0�01.
However, even a DD approach leaves importantendogeneity-related concerns unaddressed. For exam-ple, an unobserved factor (such as a shift in the spe-cific domain focus of the firm that the technologymatch does not capture) might drive both the hiringof a specific individual and an increased use of theirideas. One way to investigate this further is to exam-ine the temporal pattern of citations in more detail.Such a detailed examination (described later in thecontext of Figure 3) reveals evidence that the destina-tion firm does indeed increase its use of the inventor’s
ideas even in the years leading up to the move. Thisheightens concerns that unexplained time trends notdirectly related to the move might in part be drivingthe DD findings.
4.3. Estimates Based on More Stringent Matching(“CEM Sample”)
It is desirable that focal and control patents show asimilar citation trend before a move so that one canmore reasonably assume they would have followedparallel paths in the postmove period had the move
INFORMS
holds
copyrightto
this
article
and
distrib
uted
this
copy
asa
courtesy
tothe
author(s).
Add
ition
alinform
ation,
includ
ingrig
htsan
dpe
rmission
policies,
isav
ailableat
http://journa
ls.in
form
s.org/.

Singh and Agrawal: Recruiting for Ideas: How Firms Exploit the Prior Inventions of New HiresManagement Science 57(1), pp. 129–150, © 2011 INFORMS 143
Table 7 Regression Analysis (“CEM Sample”)
(1) (2) (3) (4) (5) (6) (7)Dependent variable: All cites All cites All cites All cites All cites All cites All citesRegression model: Negative Negative Linear Linear Linear Linear Linear
binomial binomial (Pair FE) (Patent FE) (Patent FE)Patent-year sample: CEM sample CEM sample CEM sample CEM sample CEM sample CEM sample CEM sample
(postmove only) (postmove only) (focal only)
Recruit 1�927∗∗∗ 0�007 0�0316∗∗∗ 0�0012 0�0008�0�185� �0�376� �0�0040� �0�0013� �0�0010�
Postmove 1�945∗∗∗ 0�0295∗∗∗ 0�0290∗∗∗ 0�0341∗∗∗ 0�0447∗∗∗
�0�407� �0�0039� �0�0029� �0�0025� �0�0048�Pair postmove 0�895∗∗∗ 0�0069∗∗ 0�0095∗∗∗
�0�319� �0�0028� �0�0026�ln(destination same-class patents) 0�450∗∗∗ 0�509∗∗∗ 0�0076∗∗∗ 0�0056∗∗∗
�0�067� �0�066� �0�0013� �0�0009�ln(destination firm patents) −0�275∗∗∗ −0�272∗∗∗ −0�0037∗∗∗ −0�0024∗∗∗
�0�059� �0�057� �0�0011� �0�0007�ln(original firm patents) −0�066 −0�063 −0�0016 −0�0010 0�0010
�0�051� �0�049� �0�0018� �0�0012� �0�0012�ln(claims) −0�014 −0�014 0�0022 0�0012 0�0029
�0�108� �0�106� �0�0032� �0�0021� �0�0026�ln(patent references) 0�207∗ 0�182∗ 0�0050 0�0033 0�0029
�0�113� �0�107� �0�0035� �0�0023� �0�0022�ln(nonpatent references) 0�053 0�082 −0�0009 −0�0000 0�0027
�0�125� �0�121� �0�0029� �0�0019� �0�0025�ln(inventor patents) −0�175 −0�133 −0�0022 −0�0013 0�0007
�0�117� �0�114� �0�0023� �0�0015� �0�0023�ln(inventor age) 0�158 0�092
�0�145� �0�141�U.S. inventor 0�544∗∗∗ 0�411∗∗
�0�198� �0�188�ln(grant delay) −0�103 −0�119
�0�192� �0�183�
Number of observations 39,070 61,032 39,070 61,032 61,032 61,032 30,516Number of cited patents 5,086 5,086 5,086 5,086 5,086 5,086 2,543Log likelihood −4,153 −4,525Wald chi2 988�9∗∗∗ 42,198∗∗∗
R2 0�033 0�025 0�021 0�006 0�009F -statistic 2�93∗∗∗ 3�48∗∗∗ 6�15∗∗∗ 11�35∗∗∗ 7�94∗∗∗
Notes. The regression models employed here are similar to the ones employed in the corresponding columns in Table 6, but using the CEM sample. The samplesizes are smaller since patents for which the CEM procedure does not find a match are not included. Unlike in Table 6, the estimates for recruit in columns (2),(4), and (5) are practically zero because the cumulative premove citation count is now one of the matching criteria. Further evidence of CEM-based matchingworking well is that Figure 4, which depicts more detailed timing analysis corresponding to column (6), shows no premove trend in the citation rate. FE, fixedeffects.
∗p < 0�1; ∗∗p < 0�05; ∗∗∗p < 0�01.
not taken place. We address this using the CEM sam-ple, which largely eliminates premove citation ratedifferences by construction.We replicate all the specifications from Table 6 in
Table 7 by employing the CEM sample instead of theoriginal sample. The estimated coefficient for recruit inthe DD models shown in columns (2), (4), and (5) arenow close to zero, which is not surprising given thatpremove citations are among the matching criteria forour CEM procedure. Furthermore, as an analysis ofthe temporal pattern shows (illustrated in Figure 4and described in §4.5), the CEM sample demonstratesno evidence of the destination firm increasing its use
of the focal patents more than the control patents inthe years leading up to the move. This reduces signif-icantly the above endogeneity-related concerns.Interestingly, the linear estimates for the DD coef-
ficient of interest—postmove—are very similar in theCEM sample to those reported in the correspond-ing models for the original sample in Table 6. (Notethat the nonlinear coefficient estimates in the first twocolumns are not directly comparable across tables.)For example, comparing our preferred specification—column (6)—across tables, we find that the estimateof interest (postmove) is 0.0306 in Table 6 and onlyslightly greater, 0.0341, in Table 7. The fact that the
INFORMS
holds
copyrightto
this
article
and
distrib
uted
this
copy
asa
courtesy
tothe
author(s).
Add
ition
alinform
ation,
includ
ingrig
htsan
dpe
rmission
policies,
isav
ailableat
http://journa
ls.in
form
s.org/.

Singh and Agrawal: Recruiting for Ideas: How Firms Exploit the Prior Inventions of New Hires144 Management Science 57(1), pp. 129–150, © 2011 INFORMS
Table 8 Learning by Hiring?
(1) (2) (3)Dependent Variable: All cites Cites excluding Cites excluding
inventor inventor self-citesself-cites and collaborator cites
Regression model: Linear Linear Linear(patent FE) (patent FE) (patent FE)
Patent-year sample: CEM sample CEM sample CEM sample
Postmove 0�0341∗∗∗ 0�0188∗∗∗ 0�0128∗∗∗
�0�0025� �0�0021� �0�0018�Number of observations 61,032 61,032 61,032Number of cited patents 5,086 5,086 5,086F -statistic 11�35∗∗∗ 6�06∗∗∗ 3�97∗∗∗
Notes. This analysis is based on the CEM sample. (We report the analogousanalysis for the original sample in Table A1 of the online appendix.) In col-umn (1), we replicate the results from column (6) of Table 7 using all citesas the dependent variable. (We have again not reported the estimates for theindicator variables to conserve space.) In column (2), we examine the extentto which the estimated boost in citation rates after mobility diminishes whencitation counts exclude inventor self-cites. In column (3), we analyze theextent to which the estimated boost in citation rates after mobility diminisheswhen citation counts also exclude cites made by the recruit’s collaboratorsin the destination firm. FE, fixed effects.
∗∗∗p < 0�01.
estimates do not seem sensitive to the control sam-ple employed offers additional confidence in usingthe DD approach. We base the remaining analysesreported in this paper on specifications akin to thosein column (6) in Table 7, i.e., using linear models withpatent fixed effects and employing the CEM sample,although the key findings are robust to alternativespecifications and samples.25
4.4. Learning by Hiring?Next, we explore the extent to which the increase inuse of the recruit’s prior ideas is due to subsequentself-exploitation by the recruit herself versus broaderlearning by hiring (i.e., diffusion to others in the des-tination firm). This analysis, using the CEM sample,is reported in Table 8.For ease of comparison, we reproduce the aggre-
gate findings (using all cites as the dependent vari-able) from column (6) of Table 7 in column (1) ofTable 8. The analysis reported in column (2) of Table 8uses cites excluding inventor self-cites as the dependentvariable instead. The estimate for postmove is now
25 Comparing Tables 6 and 7, one might wonder why the CEM sam-ple demonstrates a (slightly) greater postmove increase in citationrate than the original sample. This difference is driven primarily bya few focal patents that are highly cited before a move but do notfind a match using the stringent CEM criteria. When we repeat theTable 6 analysis using the same focal patents (but original controls)as in the CEM sample, the estimates (not reported) are actuallysomewhat greater than the corresponding CEM-based findings inTable 7. This is in line with the intuition that, for a given sampleof focal patents, less stringent matching leads to a larger estimatedeffect of mobility.
0.0188, which represents only 55% (0.0188/0.0341) ofthe destination firm’s overall increase in the use of therecruit’s prior ideas. In other words, almost half of theboost in use of the recruit’s prior ideas has nothingto do with firm learning at all; rather, it is due to therecruit building upon her own prior ideas.26
We further explore the limits to widespread dif-fusion of the tacit knowledge associated with therecruit’s prior ideas by excluding not only the inven-tor’s self-citations but also citations made by theinventor’s collaborators (individuals who appear ascoinventors with the recruit on past patents). Withthis goal, the analysis reported in column (3) usescites excluding inventor self-cites and collaboratorcites as the dependent variable. The estimated coeffi-cient on postmove is 0.0128, and represents only 38%(0.0128/0.0341) of the overall postmove effect from col-umn (1). This further suggests that learning by hiringis actually quite localized; on average, only just over athird of the hiring firm’s boost in the use of a recruit’sstock of prior ideas is due to individuals other thanthe recruit and her collaborators.
4.5. A Closer Look at Temporal Trends inKnowledge Use
To examine the temporal patterns of citations receivedby a patent from a destination firm, we use indica-tor variables (summarized in Table 1) correspondingto five postmove two-year periods (postmove period 1through postmove period 5) and four premove two-yearperiods (premove period 2 through premove period 5) inthe fixed effects regression analysis, with the two-yearperiod immediately preceding the move (correspond-ing to premove period 1) being the reference. For ease ofvisual interpretation, we plot the coefficient estimatesfor the original and CEM samples in Figures 3 and 4,respectively, with the corresponding regression esti-mates reported in the online appendix as Tables A2and A3, respectively.The analysis based on the original sample (Fig-
ure 3) reveals evidence of the destination firm increas-ing its use of the inventor’s ideas to some extenteven in the years leading up to the move. In con-trast, the corresponding analysis for the CEM sample(Figure 4) demonstrates no evidence of the destina-tion firm increasing its use of the focal patents morethan the control patents in the years leading up tothe move. This is consistent with the CEM procedurereducing endogeneity-related concerns through use ofstringent matching. Therefore, we base the rest of thediscussion on Figure 4 (though the temporal effects
26 As Table A1 in the online appendix shows, the results remainqualitatively similar if we employ the original sample instead, withthe relative importance of self-exploitation (versus learning by hir-ing) now estimated to be even greater.
INFORMS
holds
copyrightto
this
article
and
distrib
uted
this
copy
asa
courtesy
tothe
author(s).
Add
ition
alinform
ation,
includ
ingrig
htsan
dpe
rmission
policies,
isav
ailableat
http://journa
ls.in
form
s.org/.

Singh and Agrawal: Recruiting for Ideas: How Firms Exploit the Prior Inventions of New HiresManagement Science 57(1), pp. 129–150, © 2011 INFORMS 145
Figure 3 Estimated Temporal Trends in Destination Firm Citations for the “Original Sample”
–0.04
–0.03
–0.02
–0.01
0.00
0.01
0.02
0.03
0.04
Premoveperiod 5
Premoveperiod 4
Premove2
Premoveperiod 1
Postmoveperiod 1
Postmoveperiod 2
Postmoveperiod 3
Postmoveperiod 4
Postmoveperiod 5
Rel
ativ
e ci
tatio
n ra
te e
stim
ated
for
the
perio
dAll cites
Cites excluding inventor-self cites
Recruit’smove date
period Premove
period 3
Notes. This figure plots the detailed temporal pattern behind the DD finding from column (6) of Table 6. The coefficient estimates plotted here are reported inTable A2 in the online appendix. Each of the periods plotted on the horizontal axis is two years long (see Table 1). Because the reference period is premoveperiod 1, the DD coefficient for that period is zero by definition. The upward trend in citation rate before the move year suggests the need for more stringentmatching.
associated with mobility seem qualitatively similar forFigure 3).Figure 4 facilitates three observations. First, with
respect to both of our dependent variables, all citesand cites excluding inventor self-cites, there is a sharpdiscontinuity in the annual citation rate at the time ofthe mobility event (without any discernable increasein the years leading up to it). Although the tight tim-ing of the mobility–idea usage relationship does notnecessarily imply causality, it is certainly consistentwith the assertion that recruiting facilitates enhancedaccess to an individual’s ideas.Second, a comparison of the estimated citation rate
for cites excluding inventor self-cites versus all cites inthe period immediately following the mobility eventillustrates that the recruit accounts for approximatelyhalf (45%) of the hiring firm’s increased use of herideas right after she arrives, i.e., during the first twoyears.Third, and perhaps most surprisingly, comparing
the findings for cites excluding inventor self-cites ver-sus all cites over the duration of the postmove period,we see that the recruit continues to account for morethan a third of the citations (between 34% and 42%) toher prior ideas for the next three periods (six years).Although one might expect the recruit’s relative roleto diminish rapidly as the knowledge associated withher ideas diffuses across her new firm, this actuallyoccurs quite gradually: during the first eight yearsafter a move there is only a gradual increase (from55% up to 66%) in the fraction of cites that are notinventor self-cites. In other words, the importance of
the recruit to the hiring firm (in terms of her directinvolvement in the firm’s use of her prior ideas) issurprisingly persistent over time.
5. Discussion and ConclusionWhat are the implications of our findings for man-agers and policymakers? Let us start with our mainfinding that firms do indeed increase their use oftheir recruits’ prior ideas. From the policy maker’sperspective, it is tempting to conclude from this thatrestrictions on interfirm mobility, such as noncom-pete covenants, are detrimental to the circulation ofideas and knowledge spillovers that would other-wise enhance regional growth. From the point of viewof the source firm, one might infer that mobility ofemployees leads to “leakage” of ideas to competitors,an outcome that must be guarded against. Finally,for the hiring firm, poaching employees from oth-ers might seem an attractive way to access externalideas. Although there may be merit to all of the abovearguments, one should be cautious in drawing strongnormative prescriptions directly from our results. Wedescribe some of the key nuances in our interpretationbelow.First, the policy implications are not obvious. On
the one hand, when mobility is restricted, ideas areless likely to circulate among different firms in theform of knowledge spillovers, which may indeedinhibit growth. On the other hand, firms may be morewilling to invest in innovation and human capitaldevelopment for their employees when they are less
INFORMS
holds
copyrightto
this
article
and
distrib
uted
this
copy
asa
courtesy
tothe
author(s).
Add
ition
alinform
ation,
includ
ingrig
htsan
dpe
rmission
policies,
isav
ailableat
http://journa
ls.in
form
s.org/.

Singh and Agrawal: Recruiting for Ideas: How Firms Exploit the Prior Inventions of New Hires146 Management Science 57(1), pp. 129–150, © 2011 INFORMS
Figure 4 Estimated Temporal Trends in Destination Firm Citations for the “CEM Sample”
–0.01
0.00
0.01
0.02
0.03
0.04
period 5Premoveperiod 4
Premoveperiod 3
Premoveperiod 2
Premoveperiod 1
Postmoveperiod 1
Postmoveperiod 2
Postmoveperiod 3
Postmoveperiod 4
Postmoveperiod 5
Rel
ativ
e ci
tatio
n ra
te e
stim
ated
for
the
perio
d
Recruit’smove date
All cites
Cites excluding inventor-self cites
Premove
Notes. Following a procedure analogous to Figure 3, this figure plots the detailed temporal patterns behind the DD findings from column (6) of Table 7. Theestimates are reported in Table A3 in the online appendix. There is no evidence of an upward premove citation trend as seen in Figure 3, indicating that themore stringent matching is working as expected.
worried about inventors leaving and sharing theirideas with competitors. Our study in itself is insuffi-cient to determine which effect dominates.Second, the implications for the source firm are
also nuanced. Although the source firm has lost anemployee, that individual’s use and diffusion of theideas that she generated while at the source firm mayincrease the value of those ideas, some of which thesource firm might realize through licensing, sale ofthe intellectual property, or some type of strategicpartnership. In addition, if she maintains ties withindividuals in the source firm, then these ties mightbecome a conduit enabling the source firm to betteraccess external ideas (Agrawal and Henderson 2002,Singh 2005, Agrawal and Goldfarb 2008, Agrawalet al. 2008, Corredoira and Rosenkopf 2010).Third, even the implications for the hiring firm
are not straightforward. Our findings temper the“learning-by-hiring” view prevalent in the literature.Although others at the destination firm do learnabout the recruit’s ideas, we find that the role therecruit and her immediate collaborators play in real-izing the destination firm’s use of her prior ideas isparticularly prominent. This implies that the distribu-tion of bargaining power between the recruit and thedestination firm may favor the recruit. The extent towhich the firm itself is able to capture rents from bet-ter access to the recruit’s ideas is therefore not obvious(Becker 1962, Lazear 1986, Coff 1997).Managers may be tempted to conclude from the
above that active steps are needed to ensure that the
ideas of new recruits are more widely dispersed andthat a smart strategy is therefore to increase invest-ments in systems for sharing knowledge and conse-quently reduce the firm’s dependence on the recruitherself. However, before adopting such a view wemust consider why we observe the recruit playingsuch a prominent role. Although sharing knowledgecreates benefits, it also incurs costs. Such costs mayarise from an increased need for coordination andthe opportunity cost of inventors’ time required bythe knowledge transfer process. Individuals engage inknowledge sharing up to the point where their privatemarginal benefit from doing so equals their privatemarginal cost. Therefore, the absence of knowledgesharing among particular individuals in a firm reflectsthat the benefits from doing so do not outweigh thecosts from the perspective of at least one of the indi-viduals involved. Firms should only intervene in theknowledge-sharing process if they have reason tobelieve that employees are underinvesting in the shar-ing of knowledge with each other relative to whatis best for the firm. Employee incentives or invest-ments in systems to promote knowledge sharing maybe very effective, but managers should keep in mindthat pursuing such a strategy relies on the existenceof a divergence between the objective of the firm andthat of its employees.More broadly, we must clarify a general limita-
tion to a causal interpretation of our findings. Recallthat we construct our sample by identifying patentsassociated with inventors who subsequently move
INFORMS
holds
copyrightto
this
article
and
distrib
uted
this
copy
asa
courtesy
tothe
author(s).
Add
ition
alinform
ation,
includ
ingrig
htsan
dpe
rmission
policies,
isav
ailableat
http://journa
ls.in
form
s.org/.

Singh and Agrawal: Recruiting for Ideas: How Firms Exploit the Prior Inventions of New HiresManagement Science 57(1), pp. 129–150, © 2011 INFORMS 147
to another firm, interpret this “mobility event” asthe “treatment” and examine its affect on patternsof knowledge flow. But mobility is endogenous, notrandom; firms make deliberate choices about whoto recruit for a reason. So what we estimate is notthe “treatment effect” per se (the effect of recruit-ment on knowledge flow under random assignmentof mobility), but rather the “treatment effect on thetreated” (the effect of recruitment conditional on asample of individuals that are actually recruited).Although our use of a longitudinal data set, a DDestimation approach, and more stringent matchingmoves us closer to a causal interpretation than previ-ous related studies, we have not resolved the causalityissue completely.One must be careful about extending our findings
from the treated sample to the overall populationbecause the two may have importantly different prop-erties. Even if the qualitative results reported in thepaper hold for the overall population, the magnitudeof the effect could be quite different. For example,if firms recruit the inventors whose ideas they valuemost, then the ideas of the marginal inventor, the“last” inventor to be recruited, may be less valuablethan those of the average recruited inventor. This is animportant caveat to the simplistic interpretation thatfirms can increase their access to particular ideas byrecruiting the inventor.In terms of our own interpretation, we prefer using
the term “facilitates” rather than “causes.” Even if hir-ing an inventor does not cause the firm to increase itsuse of that individual’s ideas, it may facilitate greateruse thereof. However, even this (weaker) interpreta-tion that mobility facilitates knowledge use has limi-tations. For example, consider a scenario where a firmincreases its use of a particular inventor’s ideas (with-out help from the inventor) at exactly the same timethat it hires the inventor (for other reasons). Althoughthe increase in idea use would take place even in theabsence of recruitment, our DD model is not able todistinguish this scenario from an observationally sim-ilar one where the recruitment does facilitate a subse-quent rise in idea use. (However, if instead the firmbegins to use the ideas before the move takes place,then our methodology will correctly spot that themove does not drive the boost in the use of the idea.)Although we have emphasized the benefits of more
stringent matching in making progress on some ofthe above issues, the fact that an appropriate matchcannot be found for a significant fraction of the focalpatents also raises questions. As already noted, theCEM sample is comprised of patents that, on average,are of lower quality and/or relevance to the destina-tion firm than those that comprise the original sam-ple. On the one hand, this raises concerns regardinggeneralizability of the findings. On the other hand,
if greater premove citation is symptomatic of moresevere endogeneity issues, excluding them might bedesirable. We have no way of determining whichsample is most suitable. However, it is reassuring tonote that our (preferred) DD-based estimates for theoriginal sample are not too different from those pro-duced using the CEM sample.The focus of our study is on how mobility enhances
access to premove knowledge associated with therecruit herself. However, while acknowledging previ-ous caveats regarding including a pair postmove vari-able in some of our models, one can (speculatively)interpret the related findings as providing sugges-tive evidence that hiring facilitates a firm’s overall“absorptive capacity” in a knowledge domain (Cohenand Levinthal 1989). Referring back to column (5) inTable 7, note that even the estimate for pair postmoveis significant (even though smaller than the main DDestimate postmove). One possible (conservative) inter-pretation is that this reflects the destination firm’schange in focus toward knowledge domains relatedto the recruit’s expertise (from which we also drawthe control patent). However, we can also give thisestimated coefficient a (more speculative) interpreta-tion that the recruit is responsible for improving thefirm’s absorptive capacity in this domain, hence driv-ing the postmove boost in citations made even to thecontrol patent. Indeed, if we carry out regression anal-yses analogous to Table 8 using matched-pair fixedeffects (instead of patent fixed effects) to separatelyidentify a pair postmove effect, we would find thatthe increase in the firm’s use of the control patentgoes from 0.0095 in terms of all cites to 0.0052 interms of cites excluding inventor self-cites, suggestingthat the mover is responsible for a significant portion(almost half) of the increase in citations to the controlpatent as well. This absorptive capacity interpretationis intriguing and worthy of further research.One promising way forward on the causality issue
is to find sources of exogenous variation in mobility,such as closure of establishments (Dahl and Sorenson2010), changes in noncompete laws (Marx et al. 2009),or death of close colleagues (Azoulay et al. 2010, Oettl2009). Even in the absence of such natural experi-ments or instruments, however, progress can be madeby more explicitly modeling the likelihood of beingexposed to the (endogenous) treatment. For exam-ple, Azoulay et al. (2009) apply the “inverse proba-bility of treatment weighted” estimation approach tomodel a life scientist’s selection into patenting behav-ior by employing rich data on time-varying charac-teristics of individuals. Researchers could use similarmethodologies for modeling mobility events based onobservables, although doing so convincingly is likelyto involve extensive compilation of individual-leveldata. Future research on mobility could also benefit
INFORMS
holds
copyrightto
this
article
and
distrib
uted
this
copy
asa
courtesy
tothe
author(s).
Add
ition
alinform
ation,
includ
ingrig
htsan
dpe
rmission
policies,
isav
ailableat
http://journa
ls.in
form
s.org/.

Singh and Agrawal: Recruiting for Ideas: How Firms Exploit the Prior Inventions of New Hires148 Management Science 57(1), pp. 129–150, © 2011 INFORMS
from stronger links to the rich literature on job match-ing (e.g., Jovanovic 1979, Simon and Warner 1992),explicitly incorporating the dynamic process whereininterfirm mobility is a result of individuals and firmsoptimizing their match in the labor market.In addition to the econometric issues raised above,
we also acknowledge measurement issues that the lit-erature using patent-based measures is still grapplingwith, and that are beyond the scope of the currentstudy to resolve. First, patent citations are far fromperfect as a measure of knowledge flows. One justi-fication for their use is that they have been found tocorrelate well with actual knowledge flows (Jaffe andTrajtenberg 2002, Chap. 12; Duguet and MacGarvie2005). Note that using citations as an indicator ofknowledge flows entails a weaker assumption thanclaiming that they are the mechanism behind theseflows.27 Nevertheless, it is worth recognizing that cita-tions may be added for reasons such as avoiding liti-gation or clarifying claims, with a large fraction addedby lawyers or patent examiners rather than the inven-tors themselves (Alcacer and Gittelman 2006). It is stillnot clear how to interpret such citations. For example,to the extent that inventors have strategic motives foromitting citations, including examiner-added citationsmight actually be desirable (Lampe 2011). Althoughwe would have liked to do a robustness analysisdropping examiner-added citations, these data are notavailable in machine-readable form for our study’stime period.Using patent data to detect instances of mobility is
not without problems. These data are only effectivefor identifying instances of mobility where an inven-tor successfully files patents both before and aftera move.28 Even in a setting (like ours) where onedoes not need to measure the overall extent of mobil-ity, systematically ignoring certain types of mobility
27 As an analogy, a PhD student’s citation of his advisor’s researchpapers may suggest that he built upon the advisor’s ideas, evenif he actually acquired those ideas by working closely with theadvisor rather than by reading his publications.28 Because patents only capture a fraction of mobility instances, wedo not use these data to estimate the overall impact of mobility. Forexample, it is inappropriate to use patent data to compare the rel-ative importance of mobility versus alternative channels of knowl-edge diffusion. In our sample, the fraction of citations received fromthe destination firm compared to all citations to a recruit’s priorpatent is 2.1% before a move versus 4.7% after a move (consistentwith our main finding that there is a mobility-related jump in cita-tions). However, given the inherent undermeasurement of recruit-ing activity when employing patent data, such statistics cannot beused to infer the relative importance of mobility versus other chan-nels of knowledge diffusion. Furthermore, we know that mobil-ity shapes the structure of interpersonal networks, which in turnaffects knowledge flows (Singh 2005, Fleming et al. 2007, Breschiand Lissoni 2009), yet our method does not capture these indirecteffects of mobility.
could produce biases—which could go in either direc-tion. For example, omitting individuals that do notpatent after a move because their role is just to trans-fer knowledge to others (e.g., as a technical man-ager) would lead to a downward bias. On the otherhand, omitting individuals who stop patenting andalso stop transferring knowledge (e.g., their knowl-edge becomes outdated or they move into a nontech-nical role) would instead produce an upward bias.Despite the above caveats, our paper does offer
a methodological contribution to the study of themobility–knowledge flow link that is more generallyapplicable than just the specific question examinedhere. Other researchers can apply our idea-level, lon-gitudinal, DD framework in examining a broad rangeof mobility-related questions. For example, one couldexamine the destination firm’s use of not just therecruit’s own prior inventions (as in this study), but ofany prior knowledge that the mobile inventor couldserve as a carrier for. This might include access toother knowledge originating from the mover’s orig-inal firm, network, or geographic context. In addi-tion, one might examine how mobility affects not justthe destination firm’s use of the recruit’s stock ofideas, but also use by the source firm and third par-ties. Extending beyond just usage of knowledge thatexisted before a move, researchers could also examineother interesting mobility-related relationships usingour approach, such as measuring changes in the pro-ductivity of the mover herself or of other employeeswho might benefit or lose out because of the move(Groysberg et al. 2008). Identification issues are likelyto be accentuated when examining such questions(Lacetera et al. 2004), although our framework, per-haps with adjustments, might still be useful.More generally, any line of inquiry related to the
antecedents and consequences of mobility will greatlybenefit from investigating longitudinal data andemphasizing temporal patterns that bring us closerto uncovering underlying relationships and micro-level mechanisms. In this paper, we have offered oneapproach for moving this topic forward. The relation-ship between inventor mobility and the use of ideasis economically important for both firm strategy andpublic policy, and we still have much to learn.
6. Electronic CompanionAn electronic companion to this paper is available aspart of the online version that can be found at http://mansci.journal.informs.org/.
AcknowledgmentsThe authors contributed equally. They thank INSEAD,the Martin Prosperity Institute, and the Social Sciencesand Humanities Research Council of Canada for fund-ing this research. They are grateful to departmental edi-tor Kamalini Ramdas and two anonymous reviewers for
INFORMS
holds
copyrightto
this
article
and
distrib
uted
this
copy
asa
courtesy
tothe
author(s).
Add
ition
alinform
ation,
includ
ingrig
htsan
dpe
rmission
policies,
isav
ailableat
http://journa
ls.in
form
s.org/.

Singh and Agrawal: Recruiting for Ideas: How Firms Exploit the Prior Inventions of New HiresManagement Science 57(1), pp. 129–150, © 2011 INFORMS 149
thoughtful and constructive feedback. They also thankRajshree Agarwal, James Costantini, Iain Cockburn, PushanDutt, Lee Fleming, Jeff Furman, Martin Gargiulo, JavierGimeno, Avi Goldfarb, Henrich Greve, Bill Kerr, KwanghuiLim, Matt Marx, Ilian Mihov, Amine Ouazad, JohannesPennings, Andrew Shipilov, Brian Silverman, Olav Soren-son, Scott Stern, Man Zhang, and seminar participants atDuke University, Georgia Tech, Harvard Business School,INSEAD, National University of Singapore, the NBER Pro-ductivity Lunch, the University of North Carolina, andthe Wharton Technology Conference for comments. Theyacknowledge use of the NBER and National Universityof Singapore–Melbourne Business School patent data sets.Errors remain their own.
ReferencesAgarwal, R., M. Ganco, R. Ziedonis. 2009. Reputations for
toughness in patent enforcement: Implications for knowledgespillovers via inventor mobility. Strategic Management J. 30(13)1349–1374.
Agarwal, R., R. Echambadi, A. Franco, M. B. Sarkar. 2004. Knowl-edge transfer through inheritance: Spin-out generation, devel-opment, and survival. Acad. Management J. 47(4) 501–522.
Agrawal, A., A. Goldfarb. 2008. Restructuring research: Communi-cation costs and the democratization of university innovation.Amer. Econom. Rev. 98(4) 1578–1590.
Agrawal, A., R. Henderson. 2002. Putting patents in context:Exploring knowledge transfer from MIT. Management Sci. 48(1)44–60.
Agrawal, A., I. Cockburn, J. McHale. 2006. Gone but not forgotten:Labor flows, knowledge spillovers, and enduring social capital.J. Econom. Geography 6(5) 571–591.
Agrawal, A., D. Kapur, J. McHale. 2008. How do spatial and socialproximity influence knowledge flows? Evidence from patentdata. J. Urban Econom. 64(2) 258–269.
Alcacer, J., M. Gittelman. 2006. Patent citations as a measure ofknowledge flows: The influence of examiner citations. Rev.Econom. Statist. 88(4) 774–779.
Allison, P. D., R. P. Waterman. 2002. Sociol. Methodology 32(1)247–265.
Almeida, P., B. Kogut. 1999. The localization of knowledge and themobility of engineers in regional networks. Management Sci.45(7) 905–917.
Angrist, J. D., A. B. Krueger. 1994. Why do World War II veteransearn more than nonveterans? J. Labor Econom. 12(1) 74–97.
Angrist, J. D., J. Pischke. 2009. Mostly Harmless Economet-rics: An Empiricist’s Companion. Princeton University Press,Princeton, NJ.
Arrow, K. J. 1962. Economic welfare and the allocation of resourcesfor invention. R. R. Nelson, ed. The Rate and Direction of Inven-tive Activity: Economic and Social Factors, Vol. 13. NBER SpecialConference Series, Princeton University Press, Princeton, NJ,609–625.
Azoulay, P., W. Ding, T. Stuart. 2009. The impact of academicpatenting on the rate, quality and direction of (public) researchoutput. J. Indust. Econom. 57(4) 637–676.
Azoulay, P., J. S. Graff Zivin, J. Wang. 2010. Superstar extinction.Quart. J. Econom. 125(2) 549–589.
Barney, J. 1991. Firm resources and sustained competitive advan-tage. J. Management 17(1) 99–120.
Becker, G. S. 1962. Investment in human capital: A theoretical anal-ysis. J. Political Econom. 70(5) 9–49.
Breschi, S., F. Lissoni. 2009. Mobility of skilled workers andco-invention networks: An anatomy of localized knowledgeflows. J. Econom. Geography 9(4) 439–468.
Chesbrough, H. 2003. Open Innovation. Harvard Business SchoolPress, Boston.
Coff, R. W. 1997. Human assets and management dilemmas: Cop-ing with hazards on the road to resource-based theory. Acad.Management Rev. 22(2) 374–402.
Cohen, W. M., D. A. Levinthal. 1989. Innovation and learning: Thetwo faces of R&D. Econom. J. 99(397) 569–596.
Corredoira, R. A., L. Rosenkopf. 2010. Should auld acquaintancebe forgot? The reverse transfer of knowledge through mobilityties. Strategic Management J. 31(2) 159–181.
Dahl, M. S., O. Sorenson. 2010. The migration of technical workers.J. Urban Econom. 67(1) 33–45.
DiMaggio, P., W. W. Powell. 1983. The iron cage revisited: Institu-tional isomorphism and collective rationality in organizationalfields. Amer. Sociol. Rev. 48(2) 147–160.
Dosi, G. 1988. Sources, procedures and microeconomic effects ofinnovation. J. Econom. Literature 26(3) 1120–1171.
Duguet, E., M. MacGarvie. 2005. How well do patent citations mea-sure knowledge spillovers? Evidence from French innovationsurveys. Econom. Innovation New Tech. 14(5) 375–393.
Fleming, L. 2001. Recombinant uncertainty in technological search.Management Sci. 47(1) 117–132.
Fleming, L., C. King, A. Juda. 2007. Small worlds and innovation.Organ. Sci. 18(6) 938–954.
Franco, A. M., M. F. Mitchell. 2008. Covenants not to compete, labormobility, and industry dynamics. J. Econom. Management Strat-egy 17(3) 581–606.
Furman, J. L., S. Stern. 2011. Climbing atop the shoulders ofgiants: The impact of institutions on cumulative research. Amer.Econom. Rev. Forthcoming.
Gompers, P., J. Lerner, D. Scharfstein. 2005. Entrepreneurial spawn-ing: Public corporations and the genesis of new ventures, 1986to 1999. J. Finance 60(2) 517–614.
Groysberg, B., L.-E. Lee, A. Nanda. 2008. Can they take it withthem? The portability of star knowledge workers’ perfor-mance. Management Sci. 54(7) 1213–1230.
Hall, B. H., J. Mairesse, L. Turner. 2007. Identifying age, cohortand period effects in scientific research productivity: Discus-sion and illustration using simulated and actual data on Frenchphysicists. Econom. Innovation New Tech. 16(2) 159–177.
Hansen, M. T. 1999. The search-transfer problem: The role of weakties in sharing knowledge across organization subunits. Admin.Sci. Quart. 44(1) 82–111.
Heckman, J., S. Navarro-Lozano. 2004. Using matching, instrumen-tal variables, and control functions to estimate economic choicemodels. Rev. Econom. Statist. 86(1) 30–67.
Hoisl, K. 2007. Tracing mobile inventors—The causality betweeninventor mobility and inventor productivity. Res. Policy 36(5)619–636.
Iacus, S. M., G. King, G. Porro. 2009. Causal inference withoutbalance checking: Coarsened exact matching. Working paper,Harvard University, Cambridge, MA.
Imbens, G. W. 2004. Nonparametric estimation of average treatmenteffects under exogeneity: A review. Rev. Econom. Statist. 86(1)4–29.
Jaffe, A. B., M. Trajtenberg. 2002. Patents, Citations, and Innovations:AWindow on the Knowledge Economy.MITPress, Cambridge,MA.
Jaffe, A. B., M. Trajtenberg, R. Henderson. 1993. Geographic local-ization of knowledge spillovers as evidenced by patent cita-tions. Quart. J. Econom. 108(3) 577–598.
Jovanovic, B. 1979. Job matching and the theory of turnover. J. Polit-ical Econom. 87(5) 972–990.
Klepper, S., S. Sleeper. 2005. Entry by spin-offs. Management Sci.51(8) 1291–1306.
INFORMS
holds
copyrightto
this
article
and
distrib
uted
this
copy
asa
courtesy
tothe
author(s).
Add
ition
alinform
ation,
includ
ingrig
htsan
dpe
rmission
policies,
isav
ailableat
http://journa
ls.in
form
s.org/.

Singh and Agrawal: Recruiting for Ideas: How Firms Exploit the Prior Inventions of New Hires150 Management Science 57(1), pp. 129–150, © 2011 INFORMS
Lacetera, N., I. M. Cockburn, R. M. Henderson. 2004. Do firmschange capabilities by hiring new people? A study of the adop-tion of science-based drug discovery. A. M. McGahan, J. A. C.Baum, eds. Advances in Strategic Management, Vol. 21. JAI Press,Greenwich, CT, 133–159.
Lampe, R. 2011. Strategic citation. Rev. Econom. Statist. Forthcoming.Lazear, E. P. 1986. Raids and offer matching. Res. Labor Econom.
8 141–165.Levin, S. G., P. E. Stephan. 1991. Research productivity over the
life cycle: Evidence for academic scientists. Amer. Econom. Rev.81(1) 114–132.
Llorente, G., R. Michaely, G. Saar, J. Wang. 2002. Dynamic volume-return relation of individual stocks. Rev. Financial Stud. 15(4)1005–1047.
Malamud, O., C. Pop-Eleches. 2010. General education versus voca-tional training: Evidence from an economy in transition. Rev.Econom. Statist. 92(1) 43–60.
March, J. G. 1991. Exploration and exploitation in organizationallearning. Organ. Sci. 2(1) 71–87.
Marx, M., D. Strumsky, L. Fleming. 2009. Mobility, skills, andthe Michigan non-compete experiment. Management Sci. 55(6)875–889.
Mehta, A., M. Rysman, T. Simcoe. 2009. Identifying the age pro-file of patent citations: New estimates of knowledge diffu-sion. J. Appl. Econometrics, ePub ahead of print September 1,http://onlinelibrary.wiley.com/doi/10.1002/jae.1086/abstract.
Moen, J. 2005. Is mobility of technical personnel a source of R&Dspillovers? J. Labor Econom. 23(1) 81–114.
Moffitt, R. A. 2004. Introduction to the symposium on the econo-metrics of matching. Rev. Econom. Statist. 86(1) 1–3.
Murray, F., S. Stern. 2007. Do formal intellectual property rightshinder the free flow of scientific knowledge? An empirical testof the anti-commons hypothesis. J. Econom. Behav. Organ. 63(4)648–687.
Nelson, R. R., S. G. Winter. 1982. An evolutionary theory of eco-nomic change. Belknap, Cambridge, MA.
Oettl, A. 2009. Productivity and helpfulness: A new taxonomy forstar scientists. Working paper, Georgia Institute of Technology,Atlanta.
Oettl, A., A. Agrawal. 2008. International labor mobility and knowl-edge flow externalities. J. Internat. Bus. Stud. 39 1242–1260.
Penrose, E. T. 1959. The Theory of the Growth of the Firm. Blackwell,Oxford, UK.
Peteraf, M. A. 1993. The cornerstones of competitive advantage:A resource-based view. Strategic Management J. 14(3) 179–191.
Rosenkopf, L., P. Almeida. 2003. Overcoming local search throughalliances and mobility. Management Sci. 49(6) 0751–0766.
Rysman, M., T. Simcoe. 2008. Patents and the performance of vol-untary standard-setting organizations. Management Sci. 54(11)1920–1934.
Samila, S., O. Sorenson. 2011. Non-compete covenants: Incentivesto innovate or impediments to growth. Management Sci. Forth-coming.
Saxenian, A. L. 1994. Regional Advantage: Culture and Competition inSilicon Valley and Route 128. Harvard University Press, Cam-bridge, MA.
Simon, C. J., J. Warner. 1992. Matchmaker, matchmaker: The effectof old boy networks on job match quality, earnings, and tenure.J. Labor Econom. 10(3) 306–330.
Simon, H. A. 1991. Bounded rationality and organizational learn-ing. Organ. Sci. 2(1) 125–134.
Singh, J. 2005. Collaborative networks as determinants of knowl-edge diffusion patterns. Management Sci. 51(5) 756–770.
Singh, J. 2007. Asymmetry of knowledge spillovers between MNCsand host country firms. J. Internat. Bus. Stud. 38(5) 764–786.
Singh, J. 2008. Distributed R&D, cross-regional knowledge integra-tion and quality of innovative output. Res. Policy 37(1) 77–96.
Singh, J., L. Fleming. 2010. Lone inventors as sources of break-throughs: Myth or reality? Management Sci. 56(1) 41–56.
Singh, J., M. T. Hansen, J. M. Podolny. 2010. The world is not smallfor everyone: Inequity in searching for knowledge in organi-zations. Management Sci. 56(9) 1415–1438.
Song, J., P. Almeida, G. Wu. 2003. Learning by hiring: When ismobility more likely to facilitate interfirm knowledge transfer?Management Sci. 49(4) 351–365.
Thompson, P., M. Fox-Kean. 2005. Patent citations and the geog-raphy of knowledge spillovers: A reassessment. Amer. Econom.Rev. 95(1) 450–460.
Trajtenberg, M. 2006. The “names game”: Harnessing inventors’patent data for economic research. NBERWorking Paper 12479,National Bureau of Economic Research, Cambridge, MA.
Tzabbar, D., B. S. Silverman, B. S. Aharonson. 2009. Learning by hir-ing or hiring to avoid learning? Organizational exploration viaindividuals’ exploitation. Working paper, University of CentralFlorida, Orlando.
Weitzman, M. 1998. Recombinant growth. Quart. J. Econom. 113(2)331–360.
Wooldridge, J. M. 1999. Distribution-free estimation of some non-linear panel data models. J. Econometrics 90(1) 77–97.
INFORMS
holds
copyrightto
this
article
and
distrib
uted
this
copy
asa
courtesy
tothe
author(s).
Add
ition
alinform
ation,
includ
ingrig
htsan
dpe
rmission
policies,
isav
ailableat
http://journa
ls.in
form
s.org/.