recovery of biomass-derived valuable...
TRANSCRIPT
Sanna Hellstén
RECOVERY OF BIOMASS-DERIVED VALUABLE COMPOUNDS USING CHROMATOGRAPHIC AND MEMBRANE SEPARATIONS
Acta Universitatis Lappeenrantaensis 556
Thesis for the degree of Doctor of Science (Technology) to be presented with due permission for public examination and criticism in the Auditorium 1383 at Lappeenranta University of Technology, Lappeenranta, Finland on the 12th of December, 2013, at noon.

Supervisors Professor Tuomo Sainio Faculty of Technology Department of Chemical Technology Lappeenranta University of Technology Finland Professor Mika Mänttäri Faculty of Technology Department of Chemical Technology Lappeenranta University of Technology Finland Reviewers Professor Alois Jungbauer Institute of Applied Microbiology University of Natural Resources and Life Sciences, Vienna Austria Professor Susana Luque Department of Chemical and Environmental Engineering University of Oviedo Spain Opponent Professor Malte Kaspereit Institute of Separation Science and Technology Friedrich-Alexander-Universität Erlangen-Nürnberg Germany Custos Professor Tuomo Sainio Faculty of Technology Department of Chemical Technology Lappeenranta University of Technology Finland
ISBN 978-952-265-528-8 ISBN 978-952-265-529-5 (PDF)
ISSN-L 1456-4491 ISSN 1456-4491
Lappeenrannan teknillinen yliopisto Yliopistopaino 2013
ABSTRACT
Sanna Hellstén Recovery of biomass-derived valuable compounds using chromatographic and membrane separations Lappeenranta 2013 114 p. Acta Universitatis Lappeenrantaensis 556 Diss. Lappeenranta University of Technology ISBN 978-952-265-528-8, ISBN 978-952-265-529-5 (PDF), ISSN 1456-4491
Utilization of biomass-based raw materials for the production of chemicals and materials is gaining an increasing interest. Due to the complex nature of biomass, a major challenge in its refining is the development of efficient fractionation and purification processes.
Preparative chromatography and membrane filtration are selective, energy-efficient separation techniques which offer a great potential for biorefinery applications. Both of these techniques have been widely studied. On the other hand, only few process concepts that combine the two methods have been presented in the literature. The aim of this thesis was to find the possible synergetic effects provided by combining chromatographic and membrane separations, with a particular interest in biorefinery separation processes. Such knowledge could be used in the development of new, more efficient separation processes for isolating valuable compounds from complex feed solutions that are typical for the biorefinery environment.
Separation techniques can be combined in various ways, from simple sequential coupling arrangements to fully-integrated hybrid processes. In this work, different types of combined separation processes as well as conventional chromatographic separation processes were studied for separating small molecules such as sugars and acids from biomass hydrolysates and spent pulping liquors.
The combination of chromatographic and membrane separation was found capable of recovering high-purity products from complex solutions. For example, hydroxy acids of black liquor were successfully recovered using a novel multistep process based on ultrafiltration and size-exclusion chromatography. Unlike any other separation process earlier suggested for this challenging separation task, the new process concept does not require acidification pre-treatment, and thus it could be more readily integrated into a pulp-mill biorefinery.
In addition to the combined separation processes, steady-state recycling chromatography, which has earlier been studied for small-scale separations of high-value compounds only, was found a promising process alternative for biorefinery applications. In comparison to conventional batch chromatography, recycling chromatography provided higher product purity, increased the production rate and reduced the chemical consumption in the separation of monosaccharides from biomass hydrolysates. In addition, a significant further improvement in the process performance was obtained when a membrane filtration unit was integrated with recycling chromatography.
In the light of the results of this work, separation processes based on combining membrane and chromatographic separations could be effectively applied for different biorefinery

applications. The main challenge remains in the development of inexpensive separation materials which are resistant towards harsh process conditions and fouling.
Keywords: preparative chromatography, membrane filtration, biorefinery, recycling chromatography, hydroxy acids
UDC: 543.544:547.47:66.081.3:66.081.6:66.067.1
ACKNOWLEDGEMENTS
This work has been carried out at Lappeenranta University of Technology in the Laboratory of Separation Technology during 2011–2013. Graduate School in Chemical Engineering (GSCE), FuBio Joint Research 2 programme of Finnish Bioeconomy Cluster (FIBIC), and LUT Centre for Separation Technology (CST) are acknowledged for funding.
I wish to express my deepest gratitude to my supervisors, Prof. Tuomo Sainio and Prof. Mika Mänttäri. I highly appreciate their scientific expertise and enthusiasm, and the support and guidance they have kindly provided has been crucial for the completion of this work. Doc. Mari Kallioinen deserves also warm thanks for all her helpful advice and for the encouragement. In addition, I wish to acknowledge Prof. Marjatta Louhi-Kultanen for giving me the opportunity to start my doctoral studies.
I am indebted to the pre-examiners of this thesis, Prof. Susana Luque and Prof. Alois Jungbauer, for their valuable comments that greatly helped to improve the thesis.
I am much obliged to many of my colleagues who kindly provided their help during this work. First of all, I wish to thank Jani Siitonen, Jari Heinonen and Jussi Lahti for all the precious guidance and for the inspiring discussions. In addition, I thank all the following people who have been involved in carrying out the experiments and analyses: Mikko Tyster, Ilkka Suppula, Teemu Puustinen, Marisa Mäntylä, Tuomas Nevalainen, Liisa Puro, Helvi Turkia, Anne Hyrkkänen, and Jarkko Kuivanen. I am also thankful to Klaus Niemelä and Stella Rovio of VTT for the good collaboration.
I wish to thank all my co-workers in the Laboratory of Separation Technology for creating a very nice working atmosphere. Special thanks go to Daria for sharing the office and for always cheering me up.
I am deeply grateful to my parents who have been supportive throughout my studies. I also want to thank all my friends for their understanding and encouragement. Finally, the most enormous thanks belong to my husband, Mikko, for his extreme patience and continuous support.
Lappeenranta, December 2013
Sanna Hellstén

LIST OF PUBLICATIONS
This thesis is based on the following peer-reviewed scientific journal articles, which are referred to in the text by the Roman numerals I-IV.
I Hellstén, S., Sainio, T., Steady state recycling chromatography in acid–sugar separation on an ion-exchange resin, Sep. Sci. Technol., 47 (2012) 2358–2365.
II Hellstén, S., Siitonen, J., Mänttäri, M., Sainio, T., Steady state recycling chromatography with an integrated solvent removal unit – Separation of glucose and galactose, J. Chromatogr. A, 1251 (2012) 122–133.
III Hellstén, S., Heinonen, J., Sainio, T., Size-exclusion chromatographic separation of hydroxy acids and sodium hydroxide in spent pulping liquor, Sep. Purif. Technol., 118 (2013) 234–241.
IV Hellstén, S., Lahti, J. Heinonen, J., Kallioinen, M., Mänttäri, M., Sainio, T., Purification process for recovering hydroxy acids from soda black liquor, Chem. Eng. Res. Des., in press, http://dx.doi.org/10.1016/j.cherd.2013.06.001.
The author’s contribution in the publications
I The author analysed the experimental data and conducted the numerical simulation study. The manuscript was written together with the co-author.
II The author made the numerical simulation study. The manuscript was written together with the co-authors.
III The author planned the laboratory experiments together with the co-authors, carried out the experiments and analysed the data. The capillary electrophoresis (CE) analyses were done by collaborators. The manuscript was written together with the co-authors.
IV The author planned and carried out the experiments with the help of an assistant (except the UF experiments which were carried out by a co-author), analysed the data and wrote the manuscript together with the co-authors. The CE analyses were done by collaborators.

Table of contents
1 Introduction ....................................................................................................................... 15
2 Objectives and structure of the work .................................................................................. 18
2.1 Aims and scope of the study ........................................................................................ 18
2.2 Outline ........................................................................................................................ 19
3 Preparative chromatography .............................................................................................. 21
3.1 Separation materials and mechanisms.......................................................................... 21
3.1.1 Adsorption ............................................................................................................ 22
3.1.2 Ion-exclusion ........................................................................................................ 23
3.1.3 Size-exclusion ...................................................................................................... 25
3.2 Principles of batch chromatography............................................................................. 26
3.2.1 Quantitative description of phase equilibria in chromatographic separation ........... 27
3.2.2 Mass transfer in a chromatography column ........................................................... 29
3.2.3 Evaluation of process performance ....................................................................... 31
3.3 Recycling chromatography .......................................................................................... 33
3.3.1 Closed-loop recycling and peak-shaving ............................................................... 33
3.3.2 Steady-state recycling (SSR) chromatography....................................................... 34
3.4 Continuous chromatography ........................................................................................ 36
3.5 Biorefinery applications of chromatography ................................................................ 39
3.5.1 Processing of biomass hydrolysates ...................................................................... 39
3.5.2 Product recovery from fermentation broths ........................................................... 40
3.5.3 Fractionation and purification of oligomers and polymers ..................................... 41
3.5.4 Desalting .............................................................................................................. 41
3.5.3 Fractionation of black liquor ................................................................................. 41
4 Membrane filtration ........................................................................................................... 43
4.1 Classification of membrane separation processes......................................................... 43
4.2 Membrane materials and separation mechanisms ......................................................... 44
4.2.1 MF and UF membranes: Sieving effect ................................................................. 45
4.2.2 NF membranes: Electrostatic exclusion................................................................. 46
4.2.3 RO membranes: Solution–diffusion ...................................................................... 47
4.3 Concentration polarisation ........................................................................................... 48
4.4 Design of membrane processes .................................................................................... 48
4.5 Evaluation of process performance .............................................................................. 50
4.6 Membrane technology in biorefineries ........................................................................ 51

4.6.1 Recovery of sugars from biomass hydrolysates ..................................................... 52
4.6.2 Separation of lignin and hydroxy carboxylic acids of black liquor ......................... 53
4.6.3 Recovery of acids from fermentation broths .......................................................... 54
5 Combinations of chromatographic and membrane separationS ........................................... 56
5.1 Tandem separation processes ...................................................................................... 57
5.2 Multi-unit hybrid separation processes ........................................................................ 59
5.2.1 Steady-state recycling chromatography with solvent removal ............................... 59
5.2.2 Hybrid separation processes for in-situ product recovery ...................................... 61
5.3 Single-unit hybrid separation processes ....................................................................... 62
5.3.1 Membrane chromatography .................................................................................. 62
5.3.2 Membrane filtration-cum-chromatography device ................................................. 62
6 Challenges to separation materials in biorefinery environment ........................................... 64
6.1 Fouling........................................................................................................................ 64
6.1.1 Effects of fouling .................................................................................................. 64
6.1.2 Prevention of fouling ............................................................................................ 65
6.2 Durability of separation materials under extreme conditions ........................................ 66
6.3 Analysis of fouling and chemical deterioration ............................................................ 67
7 Materials and methods ....................................................................................................... 69
7.1 Raw materials ............................................................................................................. 69
7.2 Chromatographic separations ...................................................................................... 69
7.2.1 Resins ................................................................................................................... 69
7.2.2 Batch chromatography .......................................................................................... 70
7.2.3 Recycling chromatography ................................................................................... 70
7.2.4 SMB separation of hydroxy acids and NaOH ........................................................ 71
7.3 Membrane separations ................................................................................................. 72
7.3.1 Membranes ........................................................................................................... 72
7.3.2 Equipment and filtration procedure ....................................................................... 73
7.4 Other separation techniques for purification of hydroxy acids ..................................... 74
7.5 Analyses ..................................................................................................................... 75
7.6 Simulation and numerical process optimization ........................................................... 75
8 Results and discussion ....................................................................................................... 77
8.1 Recycling chromatography for recovering sugars from biomass hydrolysates .............. 77
8.2 Hybrid SSR-SR process for sugar separation ............................................................... 80
8.3 Tandem separation process for fractionation of black liquor ........................................ 81
8.3.1 Lignin removal using UF ...................................................................................... 82
8.3.2 Separation of NaOH and carboxylic acids using batch chromatography ................ 84
8.3.3 Separation of NaOH and carboxylic acids using a continuous SMB process.......... 86
8.3.4 Purification of hydroxy acid fractions ................................................................... 90
8.4 Prospective advanced separation processes .................................................................. 91
8.4.1 NF for fractionation of hydroxy acids ................................................................... 93
8.4.2 Chromatographic fractionation of hydroxy acids ................................................... 95
9 Conclusions ....................................................................................................................... 98
References .......................................................................................................................... 100

SYMBOLS AND ABBREVIATIONS
Symbols
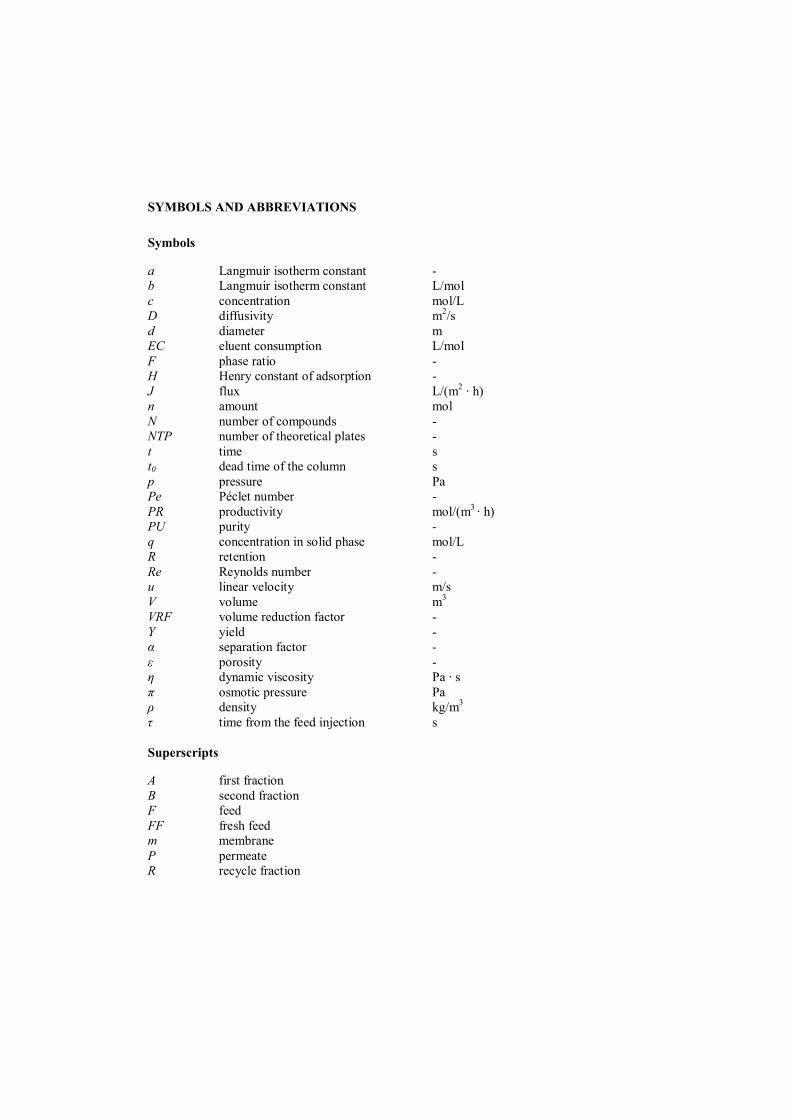
a Langmuir isotherm constant - b Langmuir isotherm constant L/mol c concentration mol/L D diffusivity m2/s d diameter m EC eluent consumption L/mol F phase ratio - H Henry constant of adsorption - J flux L/(m2 · h) n amount mol N number of compounds - NTP number of theoretical plates - t time s t0 dead time of the column s p pressure Pa Pe Péclet number - PR productivity mol/(m3
· h) PU purity - q concentration in solid phase mol/L R retention - Re Reynolds number - u linear velocity m/s V volume m3
VRF volume reduction factor - Y yield - α separation factor - ε porosity - η dynamic viscosity Pa · s π osmotic pressure Pa ρ density kg/m3 τ time from the feed injection s Superscripts
A first fraction B second fraction F feed FF fresh feed m membrane P permeate R recycle fraction
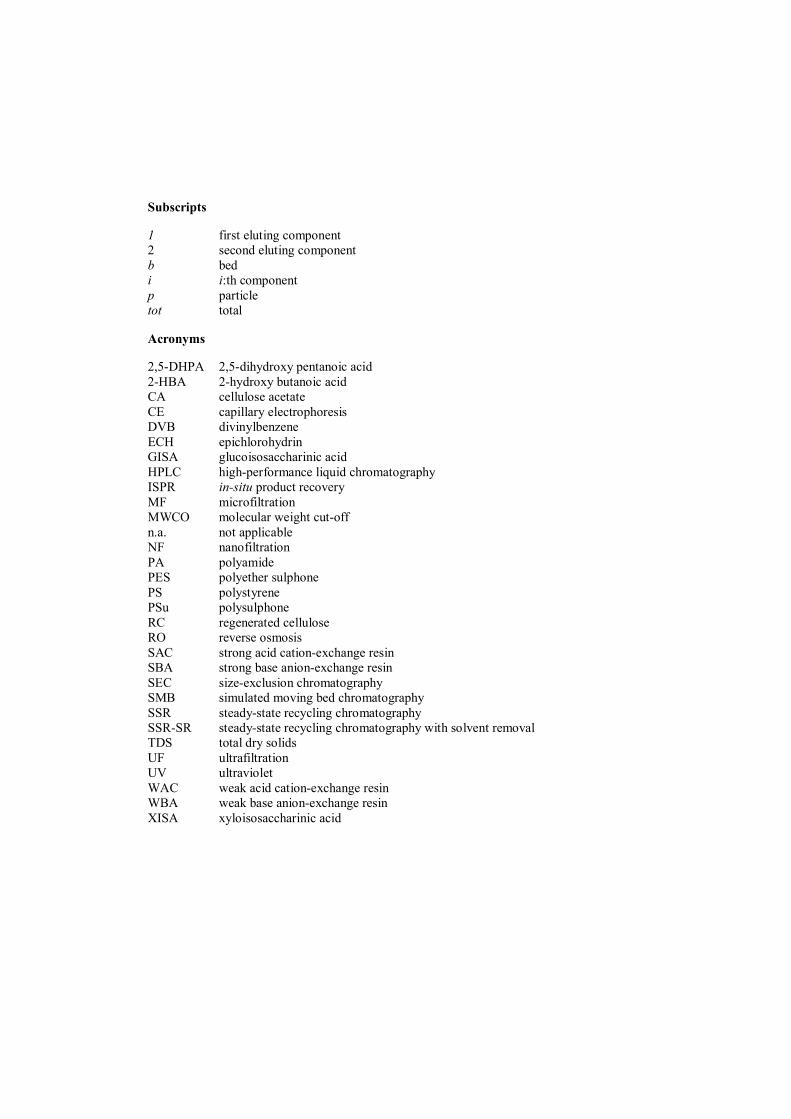
Subscripts
1 first eluting component 2 second eluting component b bed i i:th component p particle tot total
Acronyms
2,5-DHPA 2,5-dihydroxy pentanoic acid 2-HBA 2-hydroxy butanoic acid CA cellulose acetate CE capillary electrophoresis DVB divinylbenzene ECH epichlorohydrin GISA glucoisosaccharinic acid HPLC high-performance liquid chromatography ISPR in-situ product recovery MF microfiltration MWCO molecular weight cut-off n.a. not applicable NF nanofiltration PA polyamide PES polyether sulphone PS polystyrene PSu polysulphone RC regenerated cellulose RO reverse osmosis SAC strong acid cation-exchange resin SBA strong base anion-exchange resin SEC size-exclusion chromatography SMB simulated moving bed chromatography SSR steady-state recycling chromatography SSR-SR steady-state recycling chromatography with solvent removal TDS total dry solids UF ultrafiltration UV ultraviolet WAC weak acid cation-exchange resin WBA weak base anion-exchange resin XISA xyloisosaccharinic acid

15
1 INTRODUCTION
Biomass is defined as bio-degradable material originated from plants, animals and micro-
organisms. Today, biomass is widely utilized as a renewable energy source: it accounts for
approximately 75% of the world’s renewable energy production [1]. Considering that up to
97% of this bioenergy is produced by direct combustion [2], it can be concluded that the
degree of refining in biomass utilization is low. Biomass is, however, a versatile resource with
various potential applications. Biomass could be converted to value-added products such as
liquid fuels, polymeric materials, or fine chemicals. While fossil resources are diminishing,
major efforts are made to intensify the utilization of the inexhaustible biomass feedstocks,
aiming to replace petroleum-based products by biomass-based alternatives. Motivation to
promote the use of biomass may arise from the unstable oil price, from the willingness to
improve national energy security, from the need to reduce greenhouse gas emissions in order
to mitigate climate change, or from the possible job creation effect related to the
implementation of a new technology [1, 3, 4]. Biomass refining has also been seen as a way to
improve the competence of forest industry [3]. Intensification of biomass usage has, thus,
environmental, economic, social and political impacts.
A biorefinery is a facility for converting biomass to various products. The so-called first
generation biorefineries exploit dedicated energy crops such as corn, oil palm, or sugar cane.
However, the utilization of fertile land for the production of bioenergy may threaten food
security and biodiversity. To avoid the competition for arable land between biomass
production and food cultivation and to prevent other adverse effects of energy crop
plantations, special interest should be paid to the refining of secondary biomass, i.e., the waste
produced in the processing of biomass, e.g. forestry and agricultural residues, side streams of
pulp and paper or food industry, and municipal biowaste [5]. In future biorefineries, this low-
value biomass could be converted to fuels, materials and fine chemicals in a sustainable
manner.
Biorefineries can be established in different sizes. Sometimes it may be favourable to treat the
biomass on-site in small units to minimize storage and transportation costs [6-8]. In that case,
the process should be simple to keep the investment costs low. Since the composition and
availability of biomass may have large seasonal variations, biorefining processes should be
16
somewhat flexible. On the other hand, a major challenge may be the integration of
biorefinery operations to an existing process. For example, integrated pulp mill biorefineries
should be developed so that the biorefinery operations will not affect the quality of the pulp
and no drastic changes in the pulping process are required.
As the current technology allows transformation of biomass to numerous different
biochemicals [9], selection of the product portfolio may be a major challenge in the
implementation of biorefineries. Low-price products such as fuel bioethanol might not be
sufficiently profitable. On the other hand, the market for high-value specialty products, such
as pharmaceuticals, is small. One promising strategy is to mimic petroleum refineries which
produce intermediate products that can be further converted to various value-added products
[10].
U.S. Department of Energy has established a list of 12 building block chemicals that can be
produced from biomass and used as a raw material for various chemicals [11]. The building
block chemicals possess multiple functional groups that make their use in chemical syntheses
versatile. However, simpler compounds such as bioethanol and other biofuels can also be
converted to value-added bioproducts to improve their profitability [12]. These bioproducts
may include common chemicals and materials which are currently produced by petrochemical
industry as well as completely new, biodegradable products [10]. Manufacturing of polymeric
materials is currently considered among the most promising uses for the building block
chemicals. To avoid problems in the polymerization processes, high purity of the intermediate
products is necessary.
An ideal biorefinery produces multiple products in order to fully exploit the biomass raw
material. The versatility of biomass arises from the fact that it is inherently a complex matrix.
For example, lignocellulosic biomass consists of lignin, cellulose, hemicelluloses and various
minor components (non-structural components such as extractives). All these compounds may
go through depolymerisation and participate in different types of other reactions during the
processing of biomass, resulting in an even more complex multicomponent mixture.
Consequently, the solutions treated in biorefineries, e.g. lignocellulosic hydrolysates, waste
waters or fermentation broths, are very complex mixtures. Therefore, separation technology
plays a key role in biorefining processes.

17
Biomass-derived solutions often contain many components which have similar physical
properties and molecular structures, and are therefore difficult to separate from each other.
For example, purification of acids produced by fermentation is challenging due to side-
products with related structures [13]. Therefore, highly selective separation methods are
required for recovering the compounds of interest in a satisfactory purity. Moreover, the raw
material may contain numerous components with unknown properties, as well as components
which cause problems such as fouling [14] or pitch deposits [15]. Furthermore, the processing
conditions may be harsh, e.g. when treating acid hydrolysates [16] or highly alkaline black
liquor from pulping [15].
The above mentioned issues relating to the feedstock composition together with the objective
of recovering multiple products simultaneously make the design and optimization of a
biomass fractionation process challenging. Though aiming to keep the process simple,
multiple fractionation and purification steps are often required. As a major concern in the
development of biorefinery processes is their economic viability [17], it is essential to reduce
the separation costs by process optimization. Cost-effectiveness of a separation process can be
improved, for example, by combining different unit operations to a hybrid process, which is a
well-known process intensification method. However, better knowledge is needed in order to
find the most advantageous process concept for different biorefinery separations and how to
optimize the process to provide the best performance.
18
2 OBJECTIVES AND STRUCTURE OF THE WORK
2.1 Aims and scope of the study
The aim of this work is to introduce and investigate new separation process concepts for
recovering valuable compounds in biorefineries based on chromatographic and membrane
separations. The main research question is whether it is possible to gain advantage in
challenging biomass fractionation tasks by combining these two separation techniques.
The separation methods applied in this work, chromatography and membrane filtration, were
chosen because they are selective, well-suitable for continuous processes, and less energy-
consuming than the conventional separation techniques. Furthermore, both of these separation
methods have been found very useful in manufacturing of biomass-based products such as
xylitol [18] and high-fructose corn syrup [19]. Several potential applications of membrane
technology in biorefineries have also been proposed, as recently reviewed by He et al. [20]
and Abels et al. [21].
Chromatographic and membrane separations are traditionally studied separately. However,
these two separation unit operations can be readily coupled together. In this work, different
ways to combine the separation unit operations in the field of biorefining are investigated.
The holistic approach may improve the process performance in terms of productivity and
chemical consumption, facilitate the treatment of complex mixtures (e.g. by removing
problematic compounds in a separate process step) and increase the product purity.
A special attention has also been paid to steady-state recycling chromatography (SSR).
Currently it is not a routinely employed technique. Based on theoretical studies [22, 23] it can,
however, improve separation performance. It has also been suggested that a further
improvement in the process performance could be achieved using a hybrid separation process
in which internal process streams are concentrated by removing solvent in a membrane
filtration unit coupled with SSR [24]. The performance of SSR and the new hybrid process in
the recovery of monosaccharides from biomass hydrolysates is investigated in this work. In
addition, a systematic study on the effects of column efficiency and separation factor on the
performance of SSR and a comparison with batch chromatography is presented, because the
results of earlier studies on the topic have been contradictory.
19
This work is limited to the recovery of small molecules (such as sugars and carboxylic acids)
from biomass hydrolysates and spent pulping liquors. Three case studies are included:
recovery of fermentable monosaccharides from concentrated-acid hydrolysate of wood (Paper
I), separation of glucose and galactose of lactose hydrolysate (Paper II), and recovery,
purification and fractionation of hydroxy acids of black liquor (Papers III and IV). The aim is
to select the most suitable separation process alternative for each of these separation tasks
based on understanding of the separation mechanisms.
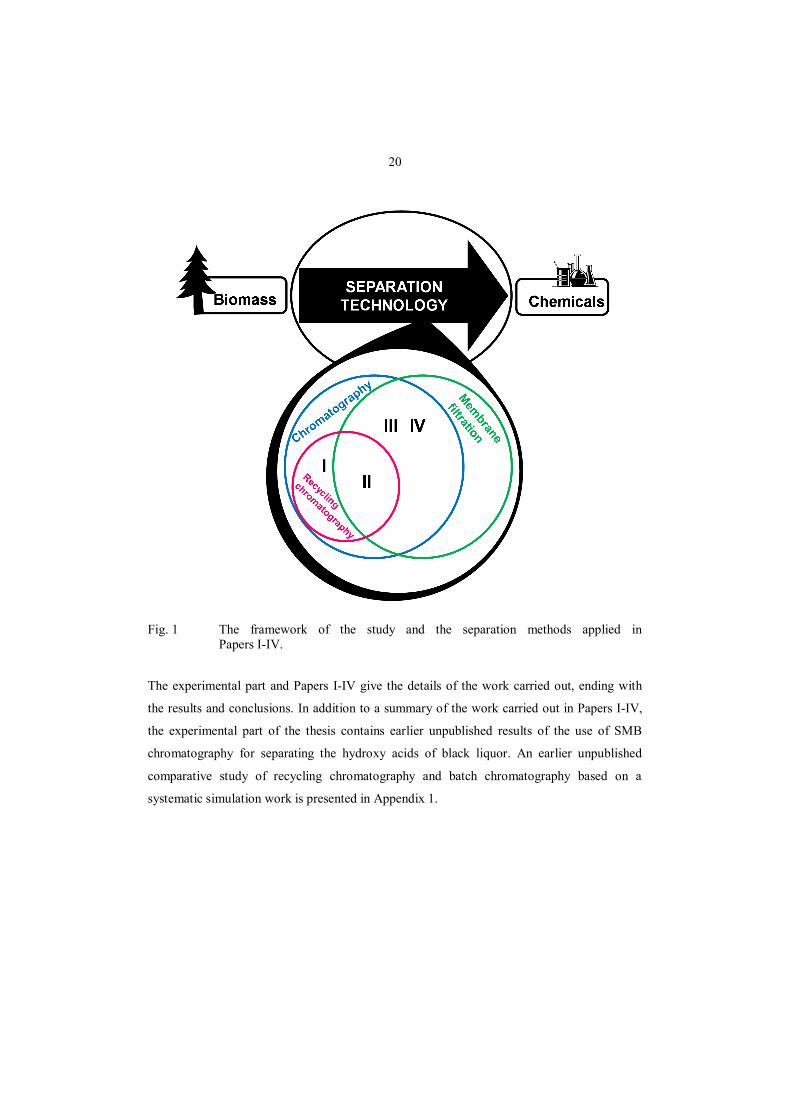
The framework of this thesis and the separation methods used in Papers I–IV are illustrated in
Fig. 1. The focus in papers I and II is on recycling chromatography. Combining of pressure-
driven membrane filtration processes with chromatographic separation is discussed in Papers
II–IV. Separation processes based on using membrane filtration only are excluded from the
work. Evaluation of the economic feasibility of the separation process concepts is also left
beyond the scope of the work.
2.2 Outline
A deep understanding of the individual separation techniques applied is of major importance
when designing combined separation processes. Therefore, this thesis begins with an
introduction to the principles of chromatographic and membrane separations, including a
review of the separation mechanisms and the most common separation materials and process
modes. Chromatographic separation and membrane filtration are discussed separately in
Chapters 3 and 4, respectively. Each of these chapters ends with a brief literature review of
the potential biorefinery applications of the separation method under discussion.
In Chapter 5, different approaches to combining separation techniques are presented. The
focus is on the combinations of chromatographic and membrane separations.
In Chapter 6, the special challenges related to the stability of separation materials during long-
term use are discussed. The stability issue is addressed because fouling and degradation of
separation materials under extreme conditions typical for biorefinery environment can be
major obstacles for implementation of chromatographic and membrane separations in
biorefineries.
20
Fig. 1 The framework of the study and the separation methods applied in Papers I-IV.
The experimental part and Papers I-IV give the details of the work carried out, ending with
the results and conclusions. In addition to a summary of the work carried out in Papers I-IV,
the experimental part of the thesis contains earlier unpublished results of the use of SMB
chromatography for separating the hydroxy acids of black liquor. An earlier unpublished
comparative study of recycling chromatography and batch chromatography based on a
systematic simulation work is presented in Appendix 1.

21
3 PREPARATIVE CHROMATOGRAPHY
Chromatographic separation phenomenon was first investigated by Tswett in 1906. Today,
chromatography is widely utilized both as an analysis technique and in industrial separation
processes, e.g. in the purification of active pharmaceutical ingredients and in the production
of sugars. This thesis is focused on the application of chromatography at production scale, i.e.
preparative liquid chromatography.
The principles of chromatographic separation are discussed in this chapter, starting with the
different separation mechanisms and materials employed in chromatography (Section 3.1). In
addition, the different operation modes of preparative chromatography are described. The
most common process modes of chromatographic separation are batch chromatography and
continuous simulated moving bed chromatography. These modes are briefly described in
Sections 3.2 and 3.4. Section 3.3 discusses different recycling schemes that can be applied to
improve the performance of batch chromatography.
As chromatography was originally designed for isolation of natural products from complex
mixtures of vegetal origin [25], its application in biorefineries is a natural choice. The
potential biorefinery applications of preparative chromatography are reviewed in Section 3.5.
3.1 Separation materials and mechanisms
Chromatographic separation is based on differences in the migration velocities of components
(molecules or ions) of a mixture passing through a stationary material that typically consists
of solid particles packed as a bed in a chromatography column. The velocity differences
among the components are due to their different partitioning behaviour between the mobile
and stationary phases. The partitioning may be affected by attraction forces between the
solutes the solid phase (adsorption or complex formation), ion-exchange or ligand-exchange,
electrostatic effects (ion-exclusion), steric effects (size-exclusion), or interaction between the
solutes (salting-out). The most important of these retention mechanisms (i.e. the separation
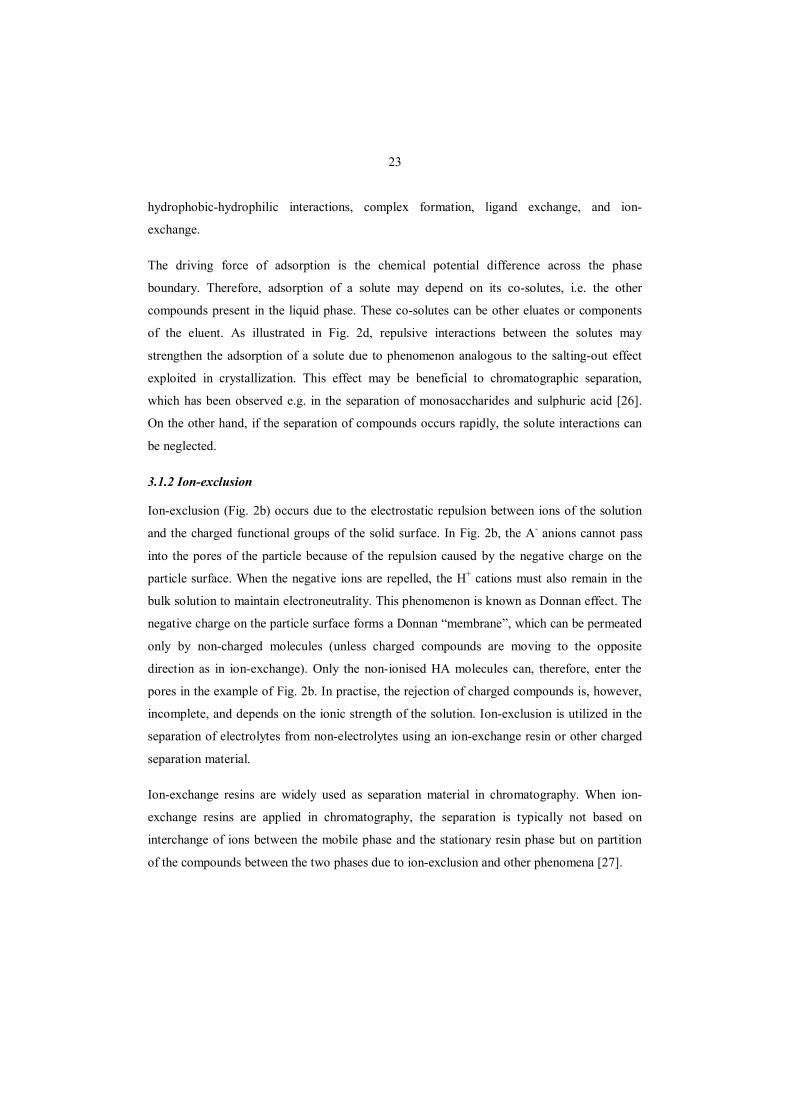
mechanisms of chromatography) are illustrated in Fig. 2. Often several different mechanisms
account for the retention of a component.

22
Figure 2 Examples of separation mechanisms in chromatography: a) adsorption, b) ion-exclusion, c) size-exclusion, d) salting out.
3.1.1 Adsorption
Adsorption is adhesion of molecules on a solid surface. Adsorption can be reversible or
irreversible. Chromatographic separation exploits reversible adsorption. It is favourable that
the interactions between the solute and the solid phase are weak; otherwise large volumes of
eluent are required to elute the adsorbed component. Adsorption typically occurs due to weak
van der Waals interactions. Other adsorption mechanisms are also known: hydrogen bonding,
23
hydrophobic-hydrophilic interactions, complex formation, ligand exchange, and ion-
exchange.
The driving force of adsorption is the chemical potential difference across the phase
boundary. Therefore, adsorption of a solute may depend on its co-solutes, i.e. the other
compounds present in the liquid phase. These co-solutes can be other eluates or components
of the eluent. As illustrated in Fig. 2d, repulsive interactions between the solutes may
strengthen the adsorption of a solute due to phenomenon analogous to the salting-out effect
exploited in crystallization. This effect may be beneficial to chromatographic separation,
which has been observed e.g. in the separation of monosaccharides and sulphuric acid [26].
On the other hand, if the separation of compounds occurs rapidly, the solute interactions can
be neglected.
3.1.2 Ion-exclusion
Ion-exclusion (Fig. 2b) occurs due to the electrostatic repulsion between ions of the solution
and the charged functional groups of the solid surface. In Fig. 2b, the A- anions cannot pass
into the pores of the particle because of the repulsion caused by the negative charge on the
particle surface. When the negative ions are repelled, the H+ cations must also remain in the
bulk solution to maintain electroneutrality. This phenomenon is known as Donnan effect. The
negative charge on the particle surface forms a Donnan “membrane”, which can be permeated
only by non-charged molecules (unless charged compounds are moving to the opposite
direction as in ion-exchange). Only the non-ionised HA molecules can, therefore, enter the
pores in the example of Fig. 2b. In practise, the rejection of charged compounds is, however,
incomplete, and depends on the ionic strength of the solution. Ion-exclusion is utilized in the
separation of electrolytes from non-electrolytes using an ion-exchange resin or other charged
separation material.
Ion-exchange resins are widely used as separation material in chromatography. When ion-
exchange resins are applied in chromatography, the separation is typically not based on
interchange of ions between the mobile phase and the stationary resin phase but on partition
of the compounds between the two phases due to ion-exclusion and other phenomena [27].
24
Ion-exchange resins are typically polymeric beads, which can be either non-porous or
macroporous. The non-porous, gel-type resins have a higher capacity and a lower price than
the macroporous resins [28]. On the other hand, macroporous resins are less sensitive towards
fouling [28]. Inorganic materials, e.g. zeolites and silicates, may also have ion-exchange
properties [29].
Ion-exchange resins are typically classified into four groups based on their functional groups:
strong-acid cation (SAC), weak-acid cation (WAC), strong-base anion (SBA), and weak-base
anion (WBA) exchange resins.
The functional group in SAC resins is sulphonic acid, and the most common polymer
backbone structure is polystyrene (PS) cross-linked with divinyl benzene (DVB) [30]. The
DVB content varies among resins from 2 up to 20 % and even higher [28]. The amount of
cross-linking affects the capacity and the shrinking and swelling behaviour of the resin. It
should be noted that the separation using a SAC resin occurs not solely by ion-exclusion but it
is also affected by size-exclusion. Therefore, the degree of cross-linking, which affects the
resin structure, can have a substantial impact on the separation selectivity.
SAC resins are the most common type of ion-exchange resins because they are relatively
inexpensive and suitable for many purposes. For example, SAC resins in calcium form are
typically applied in sugar separations, because calcium forms complexes of different strength
with sugars [31]. One drawback of PS-DVB resins, especially the ones with a low degree of
cross-linking, is that they are susceptible to degradation by oxidizing compounds [28].
WAC resins contain a carboxylic functional group. The polymer skeleton of the resin is
commonly acrylic or methacrylic cross-linked with DVB. Like styrene resins, acrylic resins
are also sensitive towards oxidation [28].
Anion-exchange resins have a basic functional group instead of an acid group. SBA resins
typically possess quaternary ammonium functionality [28]. For WBA resins, a polyamine
group is typical. The skeletal structure may be either styrene-based or acrylic.
25
3.1.3 Size-exclusion
Size-exclusion (Fig. 2 c) is based on the differences in the hydrodynamic radii of molecules.
Small molecules enter the pores of the separation material while the large molecules are
excluded due to steric effects. Consequently, large molecules have a shorter pathway through
the bed and thus they elute faster. Size-exclusion chromatography (SEC) is widely applied in
desalting of proteins [32]. SEC is also known as gel permeation chromatography or gel-
filtration chromatography, because the stationary phase is often a gel.
One of the most common size-exclusion gels is a dextran polymer cross-linked with
epichlorohydrin (ECH), which has been commercially available with the trademark Sephadex
since 1950s. Dextran forms a three-dimensional swollen polymer network, in which the
degree of swelling, and thus the pore size, depends on the cross-linking [33]. Sephadex is
thermally stable up to 120 °C and has relatively good chemical resistance [34]. However,
exposure to very alkaline or acidic conditions may cause hydrolysis of the polymer [34].
Dextran gel materials are not completely neutral due to a small number of carboxylic acid
groups in their structure, and ion-exclusion may, therefore, take place in addition to size-
exclusion [35, 36]. The effect of ion-exclusion can be supressed using an eluent with a
moderate ionic strength [35].
Another well-established polysaccharide-based size-exclusion gel material is agarose, which
is commercially available e.g. with trademark Sepharose. Whereas dextran polymer is
branched, agarose is a linear polymer which forms a double-helical structure. To improve
their thermal and pH stability, agarose gels are often cross-linked [34]. Composites containing
both dextran and agarose are also available [34].
Cross-linked polyacrylamide is also a common material for size-exclusion gels [34]. The
operating pH range of the polyacrylamide-based gels is limited, because the amine side
groups are susceptible to hydrolysis under extreme pH conditions. On the other hand,
polyacrylamide is less sensitive to microbial growth than polysaccharide-based size-exclusion
gels.
Other neutral chromatographic stationary phase materials which mainly exploit the size-
exclusion mechanism include neutral PS-DVB resins and silica. PS-DVB resins are widely
26
applied and can be functionalized to improve selectivity [37]. Recently a lot of interest has
been paid especially to hypercrosslinked PS-DVB resins [38]. Considering inorganic
alternatives, silica is a versatile material often used in analytical chromatography. However, it
has a limited pH range and the residual silanol groups in the structure may show strong
interactions with some compounds [38].
3.2 Principles of batch chromatography
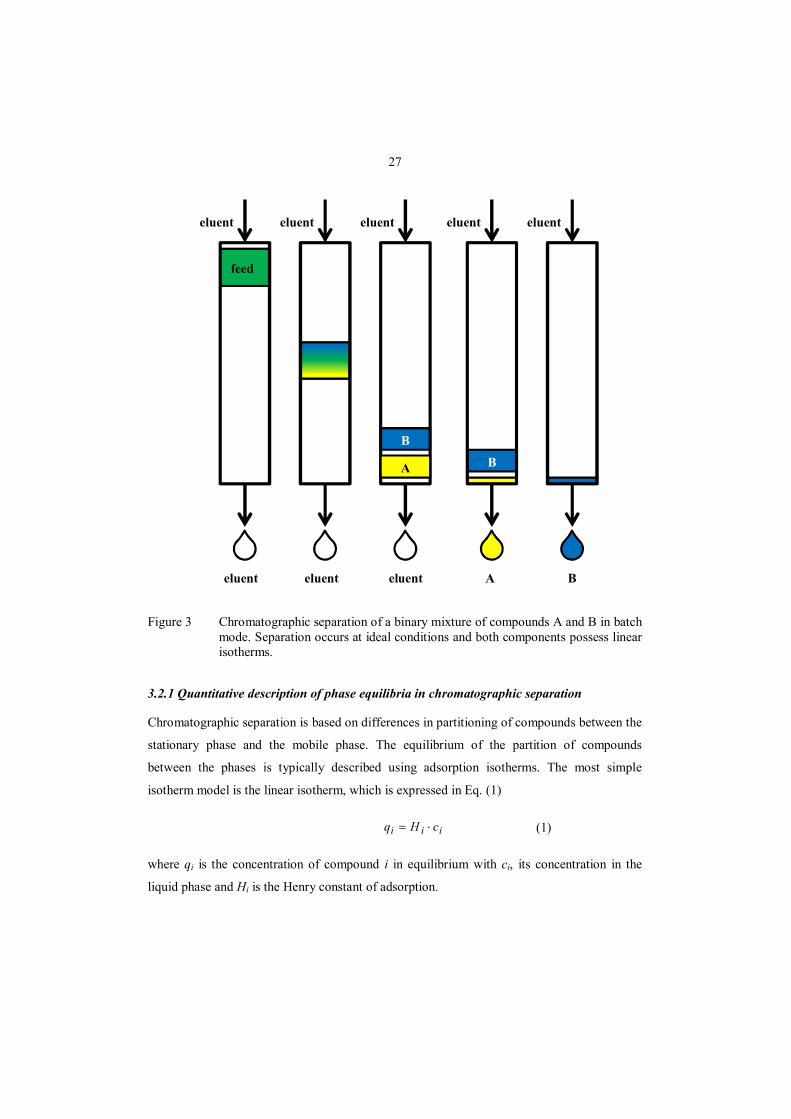
In batch elution chromatography, a pulse injection of the solution to be treated is introduced
into the chromatography column, which is continuously flushed with eluent. The separation
procedure for a mixture of two components is illustrated in Fig. 3. The processing of large
amounts of feed solution is possible using successive pulse injections. Time interval between
two pulses has to be long enough to avoid overlapping of the peaks with the ones from the
previous pulse. The main advantages of batch chromatography are that it is simple to operate
and relatively easy to scale-up.
Separation efficiency depends on the column loading, i.e. on the size of the feed pulse. In Fig.
3, the feed injection is small enough for achieving a complete resolution of A and B, which is
typical for analytical chromatography. In preparative chromatography, larger injection
volumes are applied. In the so-called operation with touching bands, the injection volume is
increased so that B elutes immediately after A, but both compounds can be recovered with a
purity of 100%. If the injection volume is further increased, A and B will not be fully
resolved. This operation is known as column overloading, and it is commonly used to
improve production rate and reduces eluent consumption and the dilution of the products.
Water is a favourable and commonly used eluent, since it is an environmentally benign, non-
hazardous, inexpensive and relatively easy to separate from most products. However, in some
applications it is necessary to use eluent other than pure water, e.g. a pH buffer or organic
solvent. If some of the components have significantly longer retention times than the others, it
is possible to use a solvent gradient to accelerate the elution of the last components. The
disadvantage is that the solvent recycling procedure becomes difficult.
27
Figure 3 Chromatographic separation of a binary mixture of compounds A and B in batch mode. Separation occurs at ideal conditions and both components possess linear isotherms.
3.2.1 Quantitative description of phase equilibria in chromatographic separation
Chromatographic separation is based on differences in partitioning of compounds between the
stationary phase and the mobile phase. The equilibrium of the partition of compounds
between the phases is typically described using adsorption isotherms. The most simple
isotherm model is the linear isotherm, which is expressed in Eq. (1)
(1)
where qi is the concentration of compound i in equilibrium with ci, its concentration in the
liquid phase and Hi is the Henry constant of adsorption.
eluent
eluent eluent
A
eluent eluent eluent eluent
feed
eluent
B
A B
B
iii cHq ×=

28
In linear chromatography, the retention of a compound is independent on its concentration.
The linear isotherm model is applicable when the separation is solely based on size-exclusion,
since in that case the number of adsorption sites does not set limitations on the partitioning of
solutes [39]. It is also valid in analytical liquid chromatography, where concentrations are
low. On the other hand, the linear isotherm model often fails to describe the behaviour of
compounds in preparative chromatography, because the effect of isotherm curvature is more
pronounced at high concentrations. There are, however, exceptions in which a linear isotherm
model gives a good estimate on the sorption behaviour; for example, the sorption isotherms of
sugars on ion-exchange resins are quite linear up to relatively high concentrations [27].
Non-linear adsorption isotherms are typical in preparative chromatography. Langmuir
isotherm is a classic example of a non-linear isotherm. It is written as follows:
(2)
where ai and bi are the isotherm parameters for compound i. In a multicomponent mixture, the
solutes compete for the adsorption sites. For compounds with Langmuir-type isotherms this
competition leads to the following isotherm equation:
(3)
where N is the number of compounds in the mixture. The Langmuir isotherm is an example of
a convex upward isotherm. Convex downward known as anti-Langmuir isotherms isotherms
also exist. They are observed when electrolyte exclusion takes place, e.g. for electrolytes on
SAC resins [40]. The Donnan phenomenon that causes anti-Langmuir isotherms was already
discussed in Section 3.1.2.
Because the adsorption behaviour of compounds differs a lot, numerous isotherm models
have been developed, and they will not be reviewed herein. Especially if the interactions
between solutes affect the sorption equilibrium, rather complex isotherm equations are
needed.
ii
iii cb
caq
+=
1
å =+
= N
j jj
iii
cbcaq
11
29
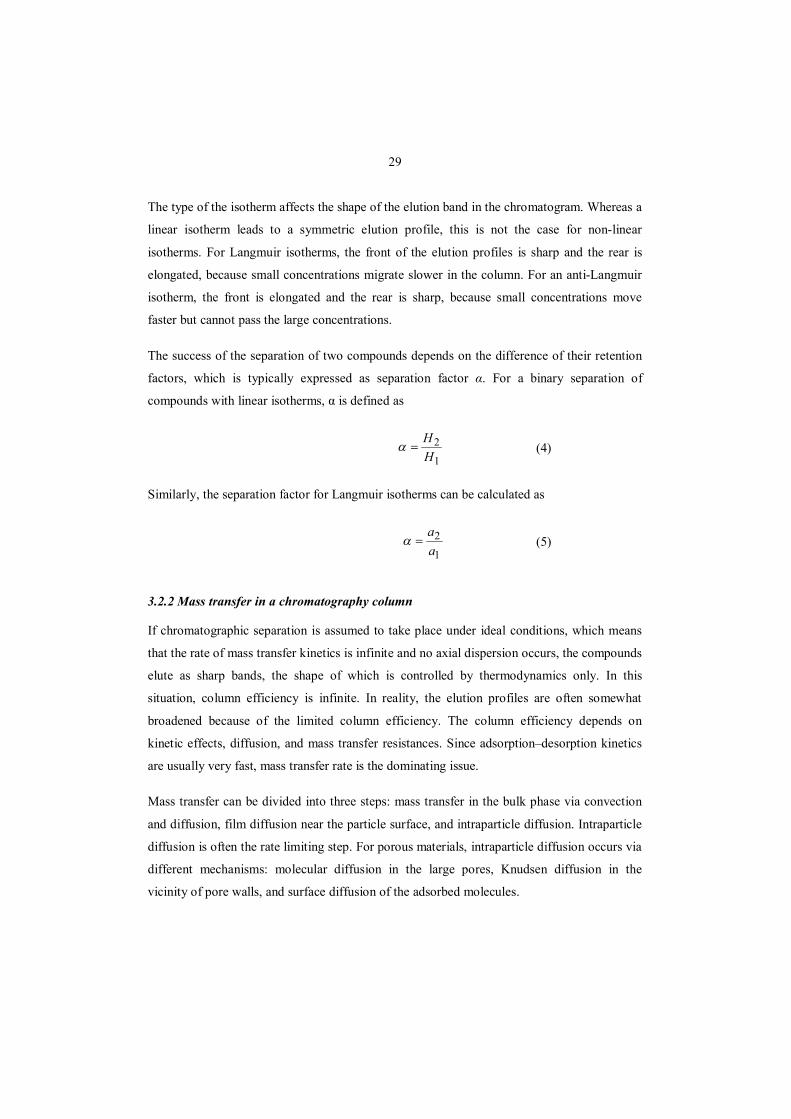
The type of the isotherm affects the shape of the elution band in the chromatogram. Whereas a
linear isotherm leads to a symmetric elution profile, this is not the case for non-linear
isotherms. For Langmuir isotherms, the front of the elution profiles is sharp and the rear is
elongated, because small concentrations migrate slower in the column. For an anti-Langmuir
isotherm, the front is elongated and the rear is sharp, because small concentrations move
faster but cannot pass the large concentrations.
The success of the separation of two compounds depends on the difference of their retention
factors, which is typically expressed as separation factor α. For a binary separation of
compounds with linear isotherms, α is defined as
(4)
Similarly, the separation factor for Langmuir isotherms can be calculated as
(5)
3.2.2 Mass transfer in a chromatography column
If chromatographic separation is assumed to take place under ideal conditions, which means
that the rate of mass transfer kinetics is infinite and no axial dispersion occurs, the compounds
elute as sharp bands, the shape of which is controlled by thermodynamics only. In this
situation, column efficiency is infinite. In reality, the elution profiles are often somewhat
broadened because of the limited column efficiency. The column efficiency depends on
kinetic effects, diffusion, and mass transfer resistances. Since adsorption–desorption kinetics
are usually very fast, mass transfer rate is the dominating issue.
Mass transfer can be divided into three steps: mass transfer in the bulk phase via convection
and diffusion, film diffusion near the particle surface, and intraparticle diffusion. Intraparticle
diffusion is often the rate limiting step. For porous materials, intraparticle diffusion occurs via
different mechanisms: molecular diffusion in the large pores, Knudsen diffusion in the
vicinity of pore walls, and surface diffusion of the adsorbed molecules.
1
2HH
=a
1
2aa
=a
30
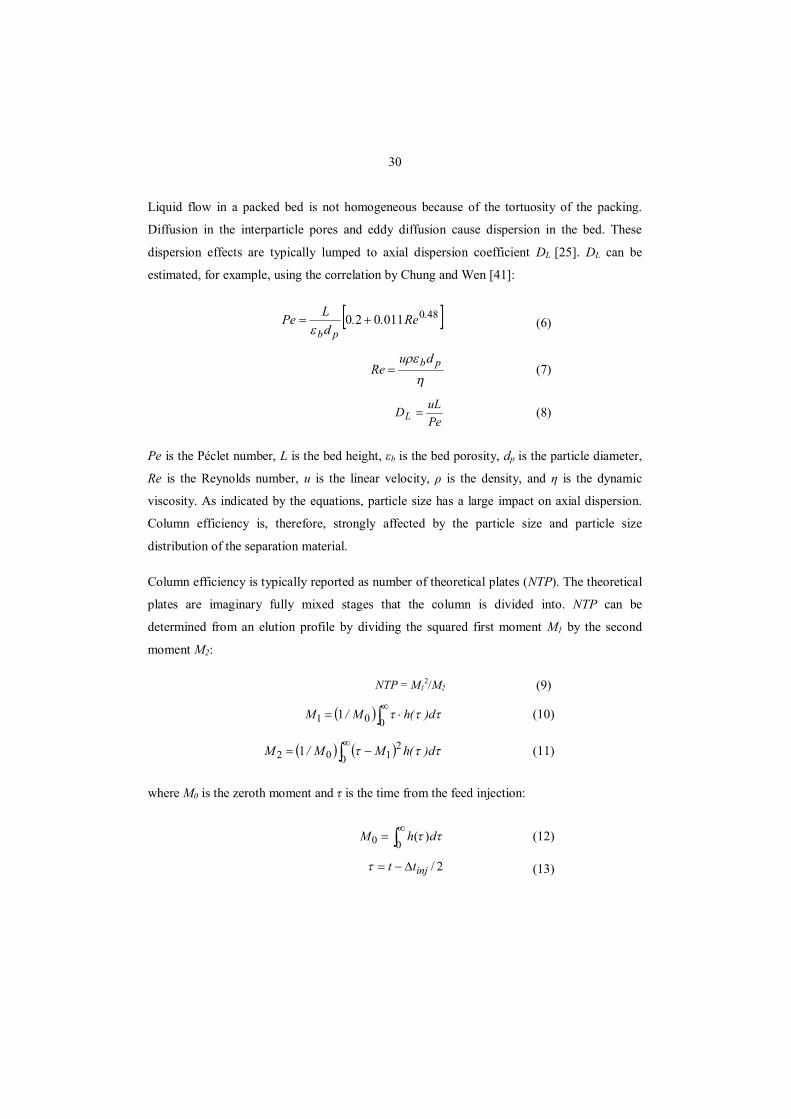
Liquid flow in a packed bed is not homogeneous because of the tortuosity of the packing.
Diffusion in the interparticle pores and eddy diffusion cause dispersion in the bed. These
dispersion effects are typically lumped to axial dispersion coefficient DL [25]. DL can be
estimated, for example, using the correlation by Chung and Wen [41]:
(6)
(7)
(8)
Pe is the Péclet number, L is the bed height, εb is the bed porosity, dp is the particle diameter,
Re is the Reynolds number, u is the linear velocity, ρ is the density, and η is the dynamic
viscosity. As indicated by the equations, particle size has a large impact on axial dispersion.
Column efficiency is, therefore, strongly affected by the particle size and particle size
distribution of the separation material.
Column efficiency is typically reported as number of theoretical plates (NTP). The theoretical
plates are imaginary fully mixed stages that the column is divided into. NTP can be
determined from an elution profile by dividing the squared first moment M1 by the second
moment M2:
NTP = M12/M2 (9)
(10)
(11)
where M0 is the zeroth moment and τ is the time from the feed injection:
(12)
(13)
[ ]480011020 .
pbRe..
dLPe +=
e
h
re pbduRe =
PeuLDL =
( )ò¥
×=001 1 ttt d)(hM/M
( ) ( )ò¥
-=0
2102 1 ttt d)(hMM/M
ò¥
=00 )( tt dhM
2/injtt D-=t
31
where h(t) is the height of the peak at time t after the start of the injection. Δtinj is the duration
of the feed injection. The height of the theoretical plates (HETP) can be calculated based on
the bed height L.
HETP = L / NTP (14)
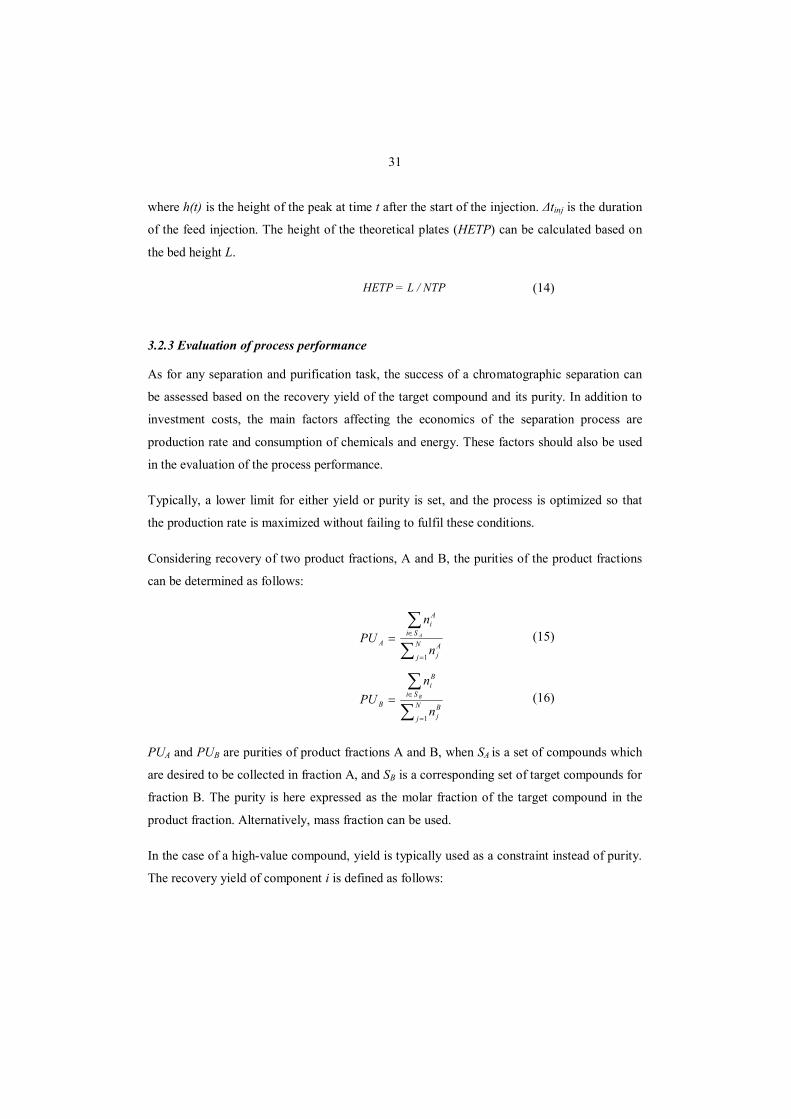
3.2.3 Evaluation of process performance
As for any separation and purification task, the success of a chromatographic separation can
be assessed based on the recovery yield of the target compound and its purity. In addition to
investment costs, the main factors affecting the economics of the separation process are
production rate and consumption of chemicals and energy. These factors should also be used
in the evaluation of the process performance.
Typically, a lower limit for either yield or purity is set, and the process is optimized so that
the production rate is maximized without failing to fulfil these conditions.
Considering recovery of two product fractions, A and B, the purities of the product fractions
can be determined as follows:
(15)
(16)
PUA and PUB are purities of product fractions A and B, when SA is a set of compounds which
are desired to be collected in fraction A, and SB is a corresponding set of target compounds for
fraction B. The purity is here expressed as the molar fraction of the target compound in the
product fraction. Alternatively, mass fraction can be used.
In the case of a high-value compound, yield is typically used as a constraint instead of purity.
The recovery yield of component i is defined as follows:
å
å
=
Î= N
jAj
Si
Ai
An
nPU A
1
å
å
=
Î= N
jBj
Si
Bi
Bn
nPU B
1

32
(17)
where niF is the amount of component i in the feed.
Process performance can be assessed based on productivity and eluent consumption.
Productivity (PR) is the production rate divided by the volume of stationary phase (Vb). The
productivity with respect to target compound i can be calculated using equation
(18)
VF is the volume of the feed injection and tcycle is the cycle time and is the feed flow rate
in the case of a continuous process. If multiple products are recovered, the total productivity
PRtot is calculated using the equation
(19)
Eluent consumption (EC) is here defined as the volume of eluent required per one mol of
product.
(20)
If multiple products are collected, the total eluent consumption ECtot can be calculated as
follows:
(21)
ïï
î
ïï
í
ì
Î
Î
=
BFi
Bi
AFi
Ai
iSi
nn
Sinn
Y
b
FFii
bcycle
FFii
i VVcY
VtVcY
PR&
==
FV&
b
Si
Fii
F
cycleb
Si
Fii
F
tot V
cYV
tV
cYV
PR÷÷ø
öççè
æ
=÷÷ø
öççè
æ
=ååÎÎ
&
FFii
Fcycle
iVcY
VVtEC
-=
&
å = ÷÷
ø
ö
çç
è
æ×+
=ni F
Fii
tot
cc
YY
ECEC
211
1
1
33
Productivity can be increased by increasing the column load or by shortening the cycle time
by applying a higher flow rate. However, the product purity may decrease if the yield is fixed.
In addition to the purity constraints, the applicable flow rate may also be limited by a
maximum pressure drop through the column. Furthermore, eluent consumption increases
when flow rate is increased, resulting in a more diluted product.
3.3 Recycling chromatography
In preparative chromatography, limited column efficiency and large sample volumes applied
often lead to poor resolution of compounds. Consequently, either the product purity or
recovery yield must be compromised. Different recycling procedures have been introduced to
increase the yield and to improve the product purity in an overloaded chromatography column
without increasing the pressure drop. The idea of recycling chromatography is to re-process
the partially resolved intermediate in the same chromatography column.
3.3.1 Closed-loop recycling and peak-shaving
The simplest recycling procedure is closed-loop recycling, in which the whole separation
profile is re-injected back to the column [42, 43]. In other words, the outlet of the column is
pumped back to the inlet, and several loops are operated as a closed system. Recycling results
in the same improvement in the recovery yield as elongating of the column but without the
requirement to increase the column inlet pressure [43]. The resolution of compounds is
improved from cycle to cycle, and the product fractions are collected after the desired product
purity is achieved. In the so-called peak-shaving mode, a product fraction is (or fractions are)
recovered in every cycle, and only the mixed, off-specification zone is recycled back to the
column [44]. The injections are smaller than in the closed-loop recycling mode, which
improves the efficiency of the separation.
The drawbacks of the closed-loop recycling concepts are that the production rate decreases,
and the product becomes very dilute. Furthermore, the achievable product purity may be
limited, since there is a limitation for the recycling, which can be no longer continued once
the sample has spread over the whole column [44]. Also, it should be noted that extra-column
dispersion, e.g. back-mixing due to pumping, partially destroys the obtained resolution as it
causes band broadening [43, 45]. A proposed approach to reduce this remixing is the so-called
34
alternate pumping recycling, where the sample stream is conducted through two columns
without passing through a pump in between [46].
3.3.2 Steady-state recycling (SSR) chromatography
Both closed-loop and peak-shaving are batch processes, and since several cycles are required,
the productivity of the process is low. To increase the productivity, the batch operation can be
substituted with a cyclic process in which fresh feed is injected together with the recycle
stream. Since the system reaches a steady state after a few cycles, the method is called steady-
state recycling (SSR) chromatography. SSR chromatography was first systematically
investigated by Bailly and Tondeur [47]. Since SSR is not a continuous process, the term
steady-state in SSR refers always to a periodic steady-state, in which the column outlet profile
and the feed composition remain unchanged from cycle to cycle.
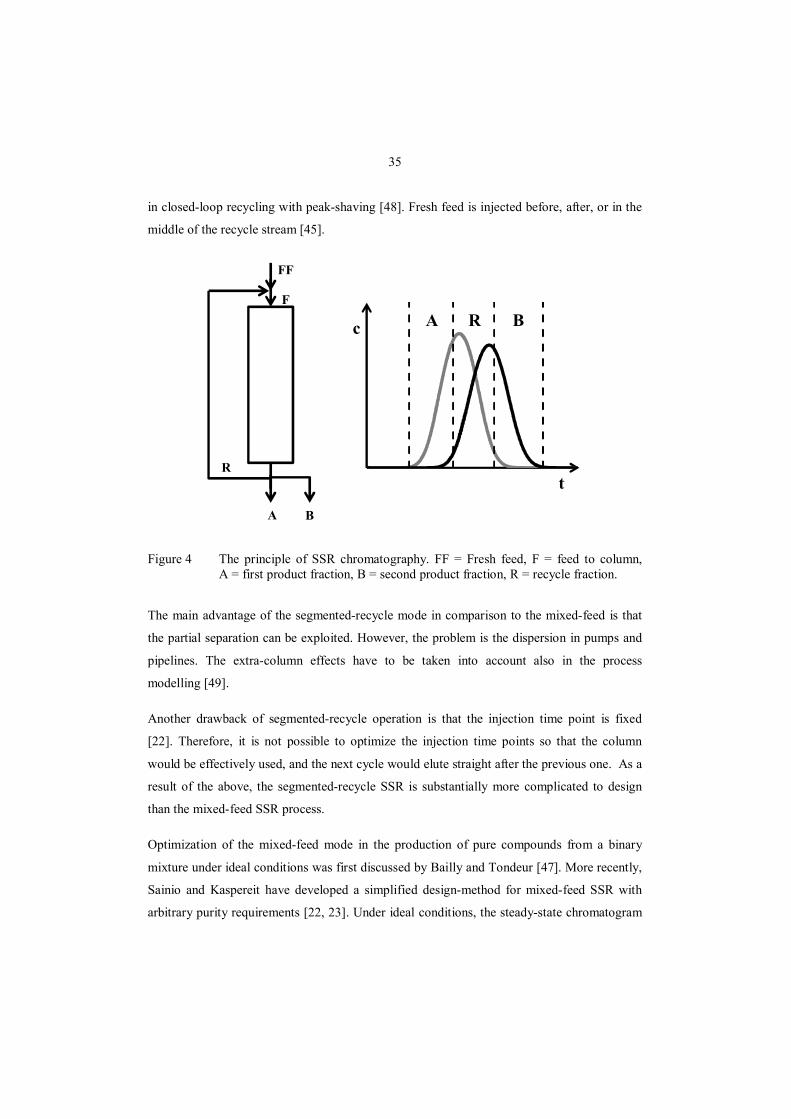
A simplified process scheme of SSR is presented in Fig. 4. The unresolved part between the
product fractions A and B is the recycle fraction R, which is re-injected to the column
together with fresh feed. The fraction cut-times (dashed lines in the figure) are chosen based
on the desired purity or yield. The amount of fresh feed that can be treated each cycle depends
on the volume of the recycle fraction. As seen in the figure, no waste fraction is collected.
Two different types SSR operation modes have been suggested: mixed-feed SSR and
segmented-recycle SSR.
In the mixed-feed mode (also known as mixed-recycle) of SSR, the recycle fraction collected
from the column outlet is mixed with a suitable amount fresh feed, and the mixture is then
injected into the column. At steady-state, the fraction cut-times and the composition of the
feed are the same in every cycle.
The drawback of the mixing is that the advantage of the partial separation obtained during the
previous cycle is lost. However, the mixed feed mode is more flexible than the modes where
the outlet profile is injected to column as such [23]. Since the recycle fraction can be easily
collected into a reservoir, the mixed feed mode makes it possible to apply stacked-injections
and thus utilize the capacity of the column more effectively [23]. An alternative operation
mode of SSR is the segmented-recycle mode (also known as closed-loop SSR), in which the
recycle stream is not mixed with the fresh feed but injected as its original profile similarly as
35
in closed-loop recycling with peak-shaving [48]. Fresh feed is injected before, after, or in the
middle of the recycle stream [45].
Figure 4 The principle of SSR chromatography. FF = Fresh feed, F = feed to column, A = first product fraction, B = second product fraction, R = recycle fraction.
The main advantage of the segmented-recycle mode in comparison to the mixed-feed is that
the partial separation can be exploited. However, the problem is the dispersion in pumps and
pipelines. The extra-column effects have to be taken into account also in the process
modelling [49].
Another drawback of segmented-recycle operation is that the injection time point is fixed
[22]. Therefore, it is not possible to optimize the injection time points so that the column
would be effectively used, and the next cycle would elute straight after the previous one. As a
result of the above, the segmented-recycle SSR is substantially more complicated to design
than the mixed-feed SSR process.
Optimization of the mixed-feed mode in the production of pure compounds from a binary
mixture under ideal conditions was first discussed by Bailly and Tondeur [47]. More recently,
Sainio and Kaspereit have developed a simplified design-method for mixed-feed SSR with
arbitrary purity requirements [22, 23]. Under ideal conditions, the steady-state chromatogram
A B
R
F
FF
c
t
R BA
36
and the appropriate fraction cut-times of mixed-feed SSR can be predicted based on the
isotherm parameters without any dynamic simulations [22, 23]. Using the predicted values for
initial injections in the start-up of the SSR process, steady-state can be obtained faster [22].
It is worth mentioning that recycling of the unresolved part in the binary separation as shown
in Fig. 4 is not the only way to realize recycling. For example, if strong tailing at the rear or
the front of the peak occurs, the dilute part can be recycled. The dilute recycle fraction is
injected before the fresh feed [48]. It is also possible to inject dilute fractions of the separation
profile as eluent, similarly as has been presented for continuous chromatography [50].
Furthermore, it is possible to recover several recycle fractions in a multicomponent
separation. However, optimization of such a recycling process is very complicated, and the
literature on the alternative recycling strategies is scarce.
3.4 Continuous chromatography
Continuous separation processes are attractive for large-scale industrial applications.
Chromatographic separation can be operated continuously if the solid phase moves to
opposite direction than the fluid. Typically, the solid phase flow is counter-current to the
direction of liquid flow, but it can be cross-current as well (e.g. in continuous annular
chromatography).
A process in which solid phase moves counter-current to the liquid flow is known as true
moving bed (TMB) chromatography. A feed stream is introduced into the centre of the
column. The more retained compound moves in the same direction as the solid phase whereas
the less retained component moves in the direction of the liquid phase, and two product
streams are continuously recovered from the ends of the unit. A TMB process is difficult to
realize due to several practical problems, including back-mixing and particle attrition and
breakage [25]. Therefore, TMB chromatography is in practice substituted with simulated
moving bed (SMB) chromatography.
In SMB chromatography, the adsorbent bed is not truly moving but the same effect is
achieved by changing the locations of inlet and outlet ports. SMB consists of several sections
(typically four) of single or more columns. If the switching time intervals and the columns
would be infinitely short, the operation would be identical to a TMB process. A simplified
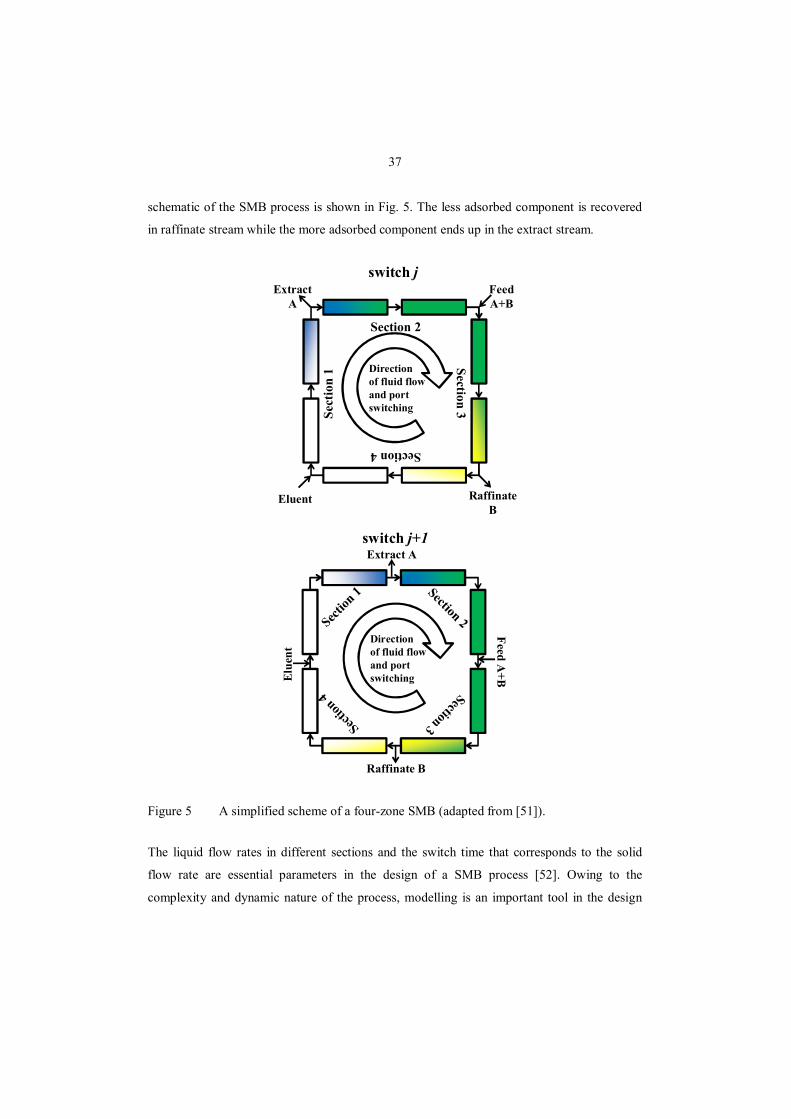
37
schematic of the SMB process is shown in Fig. 5. The less adsorbed component is recovered
in raffinate stream while the more adsorbed component ends up in the extract stream.
Figure 5 A simplified scheme of a four-zone SMB (adapted from [51]).
The liquid flow rates in different sections and the switch time that corresponds to the solid
flow rate are essential parameters in the design of a SMB process [52]. Owing to the
complexity and dynamic nature of the process, modelling is an important tool in the design
Section 2Section 3Se
ctio
n 1
Section 4
Direction of fluid flow and port switching
FeedA+B
RaffinateB
ExtractA
Eluent
switch jFeed A
+B
Raffinate B
Extract A
Elue
nt
switch j+1
Direction of fluid flow and port switching

38
and control of SMB chromatography. The modelling of SMB has been reviewed e.g. by
Guiochon et al. [25] and Rajendran et al. [51]. In addition to the model-based design, short-
cut design methods such as triangle theory [52, 53] are widely used. The optimization
parameters of the triangle theory, mj, are calculated as a ratio between the fluid and solid flow
rates in section j (for a four-zone SMB j = 1...4) using Eq. (22). In the case of a linear
isotherm, a triangle-shaped region in the (m2, m3) plane provides pure product streams as
presented in Fig. 6. In the areas marked with “No separation”, the feed ends up in either
extract or raffinate while the other outlet stream contains merely the solvent. The grey area
presents the parameter region that is not feasible because at positive feed flow rates m3 > m2.
(22)
Figure 6 The purities of product streams at different operation region on the (m2, m3) plane for a system with linear isotherms with HA = 3 and HB = 1 (adapted from [52]).
In comparison to batch chromatography, SMB chromatography typically provides higher
productivity but is less flexible in operation and more complicated to design. The long time
rate flow solid volumetricrate flow fluid volumetric
=jm
0
1
2
3
4
0 1 2 3 4
m3
m2
Pure extract
Pure raffinate
Pure extract & raffinate
No pure outlet

39
required to achieve steady-state is one of the drawbacks of SMB [25]. An important
advantage of SMB is the less diluted product stream in comparison to the product obtained in
batch chromatography. The concentrated product makes the product recovery and
downstream processing more efficient [54].
Conventional SMB is inherently a binary separation process [45] and it is thus principally
used for binary separations. However, with certain process modifications SMB can also be
utilized for ternary and multicomponent separations. A common approach is to apply SMB
cascades, in which two or more SMB units are coupled together [55, 56]. Multicomponent
separations have been also done in a single device using a nine-zone SMB [57] and a five-
zone SMB [58]. As an alternative, a pseudo-SMB process based on the Japan Organo (JO)
process of Japan Organo Co. [59] has been found useful for multicomponent separations [60,
61].
3.5 Biorefinery applications of chromatography
Important applications of chromatography in the field of biorefining include various sugar
separations (e.g. glucose–fructose separation [62], desugarisation of molasses [62], and xylose
recovery from spent sulphite liquor for production of xylitol [63]). Therefore,
chromatographic separation would most probably be a useful technique also in a future
biorefinery that is based on the sugar platform. Some of the potential applications are
reviewed in this section.
3.5.1 Processing of biomass hydrolysates
Biomass is mainly composed of polymers, e.g. cellulose, hemicelluloses, and starch. A
common strategy is to carry out a chemical (typically acidic [16]) or enzymatic [64]
hydrolysis to decompose these polymers to smaller units such as monosaccharides which are
then further refined by fermentation or by other means. After the hydrolysis, the solution
typically contains unreacted compounds such as hydrolysis acid and undesired by-products,
which may deteriorate the following process step, e.g. by acting as fermentation inhibitors.
Common examples of these inhibitory by-products are acetic acid and furfural [65]. Removal
of these compounds is called detoxification of the hydrolysate, and chromatographic
separation is a suitable purification method for this purpose.
40
Considering acid hydrolysis, the major impurity in the hydrolysate is the acid applied in the
hydrolysis. The hydrolysis acid is traditionally removed by over-liming, i.e. adding an
excessive amount of alkali such as Ca(OH)2. If sulphuric acid was used in the hydrolysis, the
over-liming results in formation of CaSO4, which precipitates due to its low solubility and can
be removed by filtration. The formation of large amounts of sulphates and the fact that the
hydrolysis acid cannot be directly re-used are the disadvantages of over-liming. In particular,
considering a strong-acid hydrolysis in which a high concentration of acid is applied, the
recycling of the hydrolysis acid would be a necessity for the techno-economic feasibility of
the process [66]. Chromatographic separation using a SAC resin has been found applicable
for the recovery of the products and the acid [26, 66]. The fermentation inhibitors are
simultaneously removed, and, therefore, better fermentation yield can be obtained for
chromatographically purified than for over-limed hydrolysates [67]. Alternatively, the
detoxification of hydrolysates can be performed as a separate process step using adsorption
[68].
As an alternative to conventional acid and enzymatic hydrolysis processes, utilization of ionic
liquids has been found a promising new technology for biomass conversion processes [69].
However, one of the major challenges is the recycling of the ionic liquid, since its separation
may be difficult due to its polarity and non-volatility. Ion-exclusion chromatography is
applicable also for fractionation of ionic liquid solutions. For example, Zhou et al. used ionic
liquids to aid the hydrolysis of algal biomass, and used Dowex 50WX 4 resin in [Emim]+
form for recovering the solvent and the product, fermentable monosaccharides [70].
In addition to fermentable monosaccharides, rare sugars can also be obtained from biomass
hydrolysates. Using chromatographic separation, these high-value products can be recovered
in high purity. Saari and Hurme have presented general heuristics for the process synthesis of
chromatographic recovery of sugars from biomass hydrolysates [71]. According to them,
SAC resins are recommended for these sugar separations. However, because the starting
purity is often low, a multistep process using various resin types may be needed.
3.5.2 Product recovery from fermentation broths
The monosaccharides obtained from hydrolysis can be fermented using a suitable micro-
organism to obtain products such as bioethanol or carboxylic acids. The micro-organisms
41
used in fermentation are usually not 100% selective, and by-products may thus be formed. For
example, in production of succinic acid, other organic acids such as acetic acid and lactic acid
are also typically produced [72]. Chromatographic separation is one option for separating the
target compound from the by-products. For example, Nam et al. [73] separated succinic acid
from lactic acid in an SMB process using a neutral polymer adsorbent (Amberchrom
CG300C).
3.5.3 Fractionation and purification of oligomers and polymers
In some cases it may be preferable to recover the polymeric compounds of biomass as
polymers or as oligomers rather than to decompose them into monomers to obtain products
with more added value. For example, oligosaccharides obtained from biomass by water or
steam treatment have potential applications in food industry as additives and nutraceuticals
[74].
Size-exclusion chromatography is a suitable method for fractionation of the recovered
polymers and oligomers based on their sizes. It has been applied for purification of
oligosaccharides from autohydrolysis of corn cobs [75] and olive tree pruning [76], for
fractionation of lignosulphonates [77], and for purification of cellodextrins prepared from
microcrystalline cellulose by acid hydrolysis [78].
3.5.4 Desalting
Silage is fermented agricultural biomass, which is rich in lactic acid and amino acids [79].
Recovery of these target compounds in a silage-based biorefinery is challenging, since silage
contains high amount of inorganic salts and other impurities. Thang and Novalin [80] found a
chromatographic separation using a neutral polymeric resin (Amberlite XAD 1600) suitable
for the desalting of silage juice. This chromatographic method was found preferable over
electrodialysis with respect to energy consumption when the salt concentration is high [80].
3.5.3 Fractionation of black liquor
Black liquor is the spent pulping liquor, obtained as a side-product from alkaline pulping of
wood. It is an important energy source for a pulp mill but also a potential source of different
biomass-based chemicals. Special interest has been paid to the recovery of hydroxy
carboxylic acids, which are formed during alkaline degradation of the carbohydrates of wood
42
and have potential applications, e.g. as chelating agents [81] or as precursors for different
polymeric materials [82].
Chromatographic separation may be a useful technique for the fractionation of black liquor.
For example, Alén et al. [83] used ion-exclusion chromatography for the separation of the
inorganic chemicals from the hydroxy acids of black liquor. The application of SEC for
fractionation of black liquor is discussed in Papers III and IV. However, chromatographic
processing of black liquor is challenging because black liquor is highly alkaline (pH about
13.5) and contains large amounts of lignin and other compounds which may cause fouling and
precipitation problems. Therefore, different pre-treatment methods are needed.

43
4 MEMBRANE FILTRATION
Membrane filtration utilizes a semi-permeable membrane for separation: some components of
the treated mixture are able pass through the membrane to the permeate side, while the others
are retained. Unlike conventional filtration, membrane filtration is not primarily a solid–liquid
separation process but all the compounds are typically in the fluid phase. During the filtration,
the feed is divided into two fluid streams: retentate and permeate. Depending on the process,
the product may be the permeate (e.g. purified water), the retentate (e.g. juice concentrate), or
both.
Different membrane separation processes and operation modes as well as the most important
phenomena related to membrane separation are reviewed in this chapter. In the end,
applications of membrane technology in biorefineries are discussed. The focus is on pressure-
driven membrane filtration, which is the most common type of membrane separation process
in industry.
4.1 Classification of membrane separation processes
Membrane separation processes are typically classified based on the driving force. The
driving force is a difference in either electrical or chemical potential [84]. The difference in
the chemical potential may be induced by concentration, temperature, or pressure.
Electrically driven membrane processes such as electrodialysis can be employed for
separating electrically charged components from uncharged ones. Pervaporation and dialysis
are examples of concentration driven membrane processes, in which mass transfer occurs via
diffusion. In thermally driven membrane processes, temperatures on each side of the
membrane are different, and mass flow through the membrane occur because of this
temperature difference. The mass transfer may be related to the heat flow (phenomenon
known as thermo-diffusion), or it can be caused by the differences in the vapour pressures as
in membrane distillation [84]. In the pressure-driven membrane processes, pressure is applied
to overcome the osmotic pressure and to induce flux through the membrane.
Pressure-driven membrane separation processes are divided into microfiltration (MF),
ultrafiltration (UF), nanofiltration (NF), and reverse osmosis (RO) based on the membrane
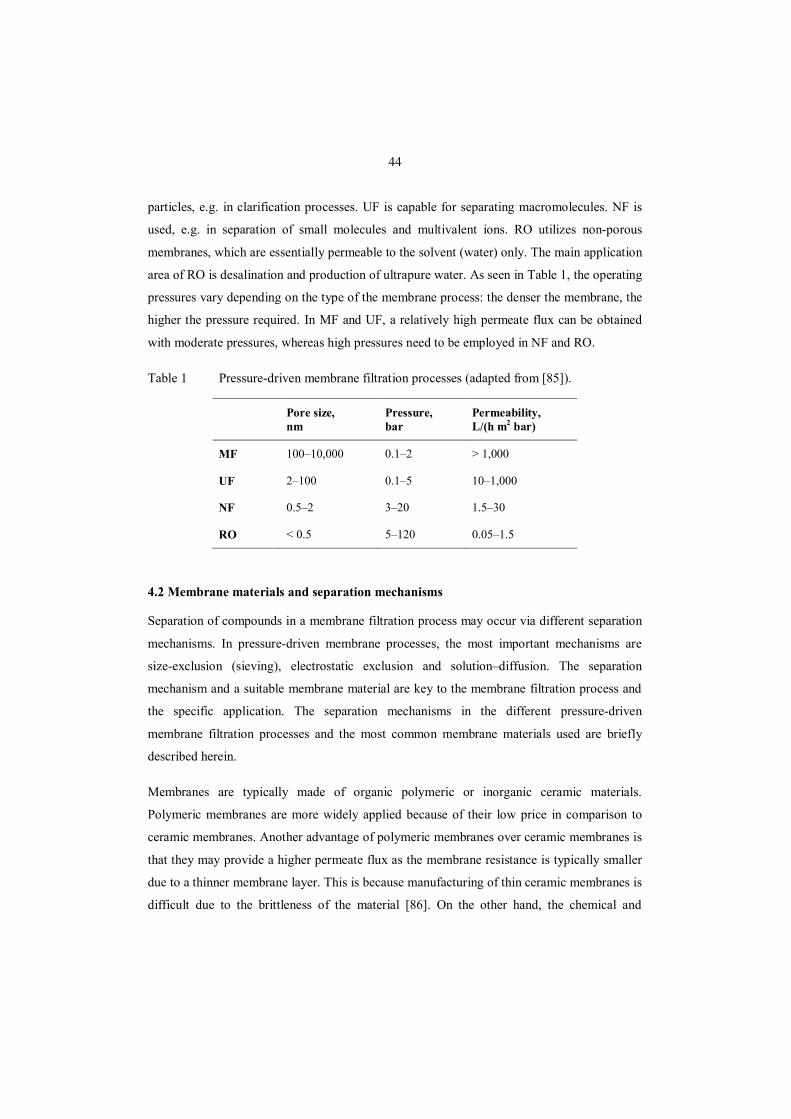
pore sizes as presented in Table 1. MF is typically applied for separation of bacteria or small
44
particles, e.g. in clarification processes. UF is capable for separating macromolecules. NF is
used, e.g. in separation of small molecules and multivalent ions. RO utilizes non-porous
membranes, which are essentially permeable to the solvent (water) only. The main application
area of RO is desalination and production of ultrapure water. As seen in Table 1, the operating
pressures vary depending on the type of the membrane process: the denser the membrane, the
higher the pressure required. In MF and UF, a relatively high permeate flux can be obtained
with moderate pressures, whereas high pressures need to be employed in NF and RO.
Table 1 Pressure-driven membrane filtration processes (adapted from [85]).
Pore size, nm
Pressure, bar
Permeability, L/(h m2 bar)
MF 100–10,000 0.1–2 > 1,000
UF 2–100 0.1–5 10–1,000
NF 0.5–2 3–20 1.5–30
RO < 0.5 5–120 0.05–1.5
4.2 Membrane materials and separation mechanisms
Separation of compounds in a membrane filtration process may occur via different separation
mechanisms. In pressure-driven membrane processes, the most important mechanisms are
size-exclusion (sieving), electrostatic exclusion and solution–diffusion. The separation
mechanism and a suitable membrane material are key to the membrane filtration process and
the specific application. The separation mechanisms in the different pressure-driven
membrane filtration processes and the most common membrane materials used are briefly
described herein.
Membranes are typically made of organic polymeric or inorganic ceramic materials.
Polymeric membranes are more widely applied because of their low price in comparison to
ceramic membranes. Another advantage of polymeric membranes over ceramic membranes is
that they may provide a higher permeate flux as the membrane resistance is typically smaller
due to a thinner membrane layer. This is because manufacturing of thin ceramic membranes is
difficult due to the brittleness of the material [86]. On the other hand, the chemical and
45
thermal stability of polymeric materials is often relatively poor. Therefore, there is a growing
interest towards ceramic membranes. In addition, organic–inorganic hybrid membranes with
unique properties have been developed [87].
Chemical and thermal stability is an important factor in the selection of a membrane material.
However, other properties, especially fouling tendency (see Chapter 6.1), have to be also
taken into account. For example, despite their excellent stability, hydrophobic materials such
as polytetrafluoroethylene (PTFE) or polypropylene (PP) are often not favoured as membrane
materials due to their high fouling tendency and wetting problems in the treatment of aqueous
solutions [84].
4.2.1 MF and UF membranes: Sieving effect
In MF and UF, the separation is often solely based on the sieving effect. The mechanism is
simple: molecules larger than the membrane pore size cannot permeate the membrane due to
steric hindrance. Since the size of a molecule is related to its molecular weight, the membrane
pore size is often expressed as molecular weight cut-off (MWCO), which can be useful for
estimating whether a certain compound is retained by the membrane. MWCO is determined
by measuring the retention of uncharged molecules with similar structure but different
molecular weight. Because membranes may possess relatively wide pore size distributions,
the MWCO of the membrane is defined as the molecular weight of the compound with a
retention of 90% [88].
Polysulphone (PSu) and polyethersulphone (PES) are currently among the most common
materials used for manufacturing MF and UF membranes. PSu and PES membranes possess
good thermal stability and tolerate a wide range of pH. The drawback of these materials is
that they are susceptible to fouling due to their hydrophobic nature, which can, however, be
controlled by different surface modifications [89].
Ceramic membranes are also widely used in MF and UF [85]. The most common materials
for ceramic membranes are alumina, titania and zirconia [86, 90]. Ceramic membranes are
typically composite membranes consisting of membrane layers with different pore sizes [86].
The macroporous support layer can be made of either ceramic or metallic material, e.g.
alumina or stainless steel [86]. The thermal stability of ceramic materials is outstanding.

46
Therefore, they can be utilized in gas separations [84]. In addition, ceramic membranes have
high resistance towards organic solvents [90]. On the other hand, the pH stability of ceramic
membranes varies depending on the material and crystallinity [90]. The fouling behaviour of
ceramic membranes is less studied than that of polymeric membranes. The results of a recent
study suggest that for ceramic membranes fouling problems are less severe than for polymeric
membranes [91]. Being both more stable and less prone to fouling, ceramic membranes may
have a substantially longer service life time than polymeric membranes. However, it should
be noted that the fouling behaviour of a membrane is case-dependent and needs to be tested to
find the most advantageous membrane for a specific application.
4.2.2 NF membranes: Electrostatic exclusion
The sieving effect discussed above is also the major mechanism in NF [92]. Similarly as in
MF and UF, the membrane rejects molecules larger than its MWCO. However, the rejection
may also be based on other mechanisms such as electrostatic exclusion.
NF membranes often have charged surface groups similarly to ion-exchange resins. For
example, poly(piperazine amide)-based NF membranes have carboxylic acid groups on their
surface [93]. Therefore, electrostatic exclusion and Donnan effect (see Section 3.1.2) often
occur in NF and sometimes also in UF [94]. In a typical case, the membrane is negatively
charged, and an electrostatic repulsion increases the retention of negatively charged solutes.
To maintain the electrostatic equilibrium, the solutes with a positive charge cannot permeate
either, and thus only the uncharged molecules can permeate. On the other hand, the negatively
charged membrane surface attracts the positively charged cations, which are accumulated near
the membrane surface, accompanied with negative anions. While the permeation of large,
multivalent anions is restricted by the membrane charge and pore size, the permeation of ions
of smaller size and charge may be strong due to the high local concentration. Even negative
retentions may sometimes be observed. This is how the Donnan effect makes the separation
of monovalent and divalent ions using NF possible.
The separation mechanism of NF may vary depending on pH and salt concentration, because
these factors may affect, for example, on the swelling or the surface charge of the membrane
[95]. The properties of the solutes may also depend on the conditions. For example, the
47
charge of ionisable compounds such as weak acids changes with pH, and the hydratation radii
of saccharides are affected by the presence of other compounds such as salts [96].
Thin film composite membranes represent the highest share of the world market for RO and
NF membranes [97]. One of the most important materials for manufacturing the active barrier
layer of thin film composite membranes for NF is aromatic polyamide (PA) [98]. The surface
layer of a composite membrane is often supported by a microporous sublayer, e.g. of PSu, and
a support web, e.g. of polyester.
Aromatic polyamides are applied for NF membranes due to their good chemical stability in
comparison to aliphatic polyamides [84]. PA membranes can be used at pH range of 3 to 11.
Since NF is an attractive method also for fractionating of highly alkaline and acidic mixtures,
and acidic or alkaline membrane cleaning solutions are often required, a lot of effort has
recently been put on developing chemically resistant NF membranes. For example,
sulphonated poly(ether ether ketone) membranes on a PES support has been found to provide
an excellent pH stability [99]. In addition, ceramic membranes for NF are available.
4.2.3 RO membranes: Solution–diffusion
In non-porous RO membranes, permeability is mainly determined by the diffusivity and
solubility of the components in the membrane. The same solution–diffusion mechanism is
typical in membrane separation of gases, and is sometimes also important in NF [88].
The development of RO membranes has been reviewed by Lee et al. [98]. As already
mentioned, thin-film composite membranes of PA are most common in RO. Cellulose acetate
(CA) membranes are also widely used in RO processes. CA membranes are manufactured
from renewable raw material, cellulose, and they typically have better salt retention than PA
membranes. The major drawbacks of CA are its limited temperature resistance (maximum
temperature of 30 °C) and a narrow pH range of 2-8, preferably 3-6 [100]. In addition, the
biodegradability of CA combined with a poor chemical resistance may reduce the membrane
lifetime. CA membranes may possess a fixed charge due to the presence of carboxyl groups
[101]. Therefore, electrostatic exclusion may occur also in RO processes [102].

48
4.3 Concentration polarisation
During membrane filtration, the retained solutes are typically accumulated near the membrane
surface in a pseudo-stagnant boundary layer; this is known as concentration polarisation.
Concentration polarisation affects both retention and flux, and may lead to fouling of the
membrane (see Chapter 6.1 for more discussion on fouling).
The concentration polarisation phenomenon is illustrated in Fig. 7. The solutes move from the
bulk feed towards the membrane surface by convection (the flux J · c in the figure). The
retained solutes flow back towards the bulk solution by diffusion. However, the diffusion is
slower than the convective flow, especially in the case of macromolecules. Therefore, the
solute accumulates at the boundary layer near the membrane surface.
Figure 7 Concentration polarisation in membrane filtration (adapted from [84]).
Concentration polarisation depends on the flux J through membrane and on turbulence, and
thus it can be reduced by increasing the cross-flow velocity. Turbulence can also be increased
using turbulence promoters (e.g. spacers) or with a special module design (e.g. a vibrating
membrane module).
4.4 Design of membrane processes
Membrane processes are typically modular in design, which makes the process flexible so that
the production capacity can be adjusted depending on the market demand [103]. Membrane
module types include spiral wound, plate and frame, tubular and hollow fibre. The module
δ 0x
cbcP
bulk feed boundarylayer
membrane
dxdcD ×
PcJ ×
cJ ×cm
49
configuration depends on the application; for example, the cleaning requirements have to be
taken into account.
The membrane modules can be arranged in various different ways. Membrane filtration can
be performed as a batch or as a continuous process, and different recycling strategies can be
applied to improve the yield. Some of the common system design alternatives are discussed
here.
Unlike conventional filtration, membrane filtration is carried out at cross-flow mode rather
than as a dead-end filtration. To maintain the cross-flow in batch filtration, the retentate is
typically recycled back to the feed tank while the permeate is continuously collected. In this
way of operation, the concentration of the solution increases continuously, and the filtration is
continued until the desired concentration is reached. If the filtration is performed using a
constant pressure, the permeate flux typically decreases with time due to increased osmotic
pressure, concentration polarisation and fouling.
Industrial membrane filtration processes are usually continuous. The simplest configuration is
a single-pass filtration, in which feed stream is constant and permeate and retentate are
continuously collected. Alternatively, part of the retentate can be recycled similarly as in
batch operation but diluting it with fresh feed. This recirculation mode is known as feed-and-
bleed. It may be used to obtain more concentrated retentate or to improve the yield of a target
compound that is recovered in the permeate. The main reason for using recirculation is that it
allows using higher flow velocity on the feed channels, which increases turbulence and
consequently reduces concentration polarisation.
If high yield of a certain solute that is recovered in the permeate or a high purity of the
retentate is required, diafiltration is recommended. In diafiltration, the retentate is diluted by
adding solvent (typically water). The addition of the solvent helps to wash the small
permeable solute molecules into the permeate.
The desired product purity is seldomly achieved in a single separation step. Therefore,
multistep filtration processes known as membrane cascades are commonly used. The
separation stages in a membrane cascade can be arranged in numerous different ways.
Therefore, the optimization of membrane cascades can be challenging. A common, relatively
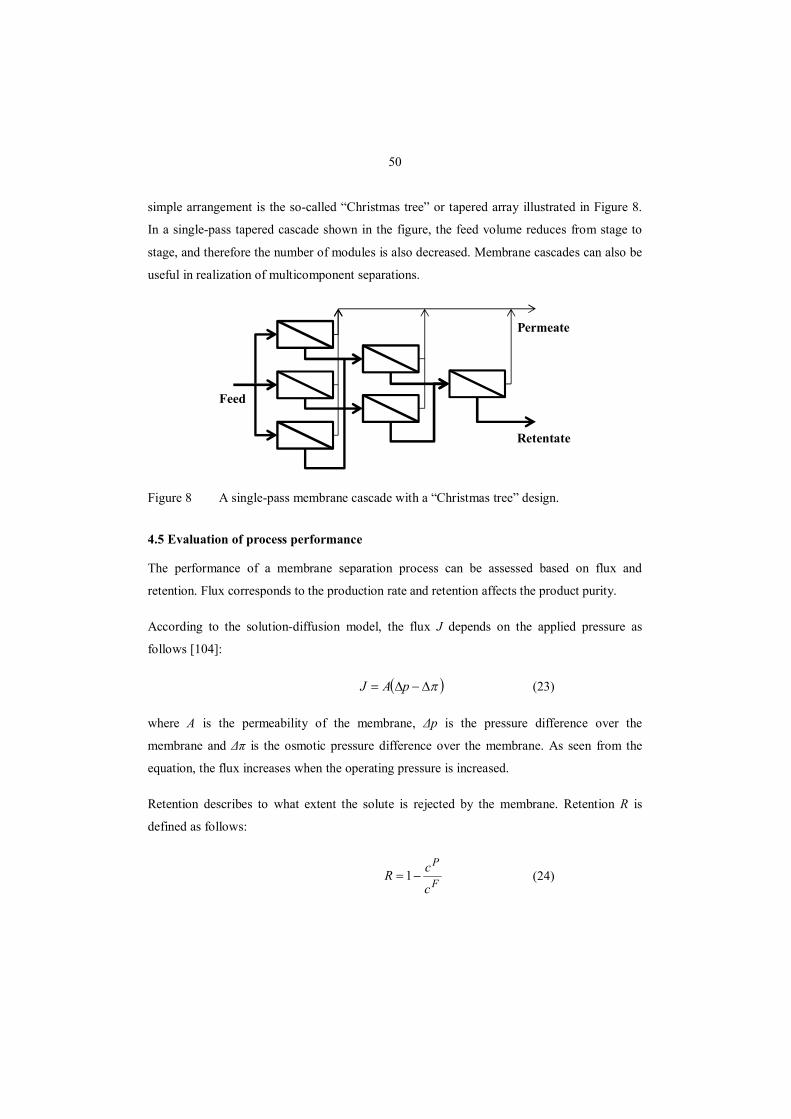
50
simple arrangement is the so-called “Christmas tree” or tapered array illustrated in Figure 8.
In a single-pass tapered cascade shown in the figure, the feed volume reduces from stage to
stage, and therefore the number of modules is also decreased. Membrane cascades can also be
useful in realization of multicomponent separations.
Figure 8 A single-pass membrane cascade with a “Christmas tree” design.
4.5 Evaluation of process performance
The performance of a membrane separation process can be assessed based on flux and
retention. Flux corresponds to the production rate and retention affects the product purity.
According to the solution-diffusion model, the flux J depends on the applied pressure as
follows [104]:
(23)
where A is the permeability of the membrane, Δp is the pressure difference over the
membrane and Δπ is the osmotic pressure difference over the membrane. As seen from the
equation, the flux increases when the operating pressure is increased.
Retention describes to what extent the solute is rejected by the membrane. Retention R is
defined as follows:
(24)
Retentate
Permeate
Feed
( )pD-D= pAJ
F
P
ccR -=1

51
cP is the concentration in the permeate and cF is the concentration in the feed. A retention of
100% means that the solute does not permeate at all. Retention may get a negative value due
to Donnan effect as described in Section 4.2.2. Retention depends on the process conditions.
For example, in NF and RO the retention is often enhanced when the operating pressure is
increased.
In processes such as desalination of water, flux and retention are enough for the performance
assessment. In fractionation and recovery of components from mixtures, the selectivity of a
membrane may be a useful parameter. Considering the separation of two components i and j,
the selectivity, α, can be defined as follows:
(25)
When membrane filtration is applied for concentration processes, a suitable process
performance parameter is the volume reduction factor (VRF):
(26)
4.6 Membrane technology in biorefineries
Membrane filtration is an energy-efficient separation method applicable for recovering
compounds of different sizes and structures from complex process streams. Membrane
processes are flexible in design and also suitable for processing of large volumetric streams
such as process waters. Therefore, there is currently a strong interest in the potential
applications of membrane technology in biorefineries as recently reviewed by He et al. [20]
and Abels et al. [21]. The application range is wide, from water removal from bioethanol
using pervaporation to isolation and purification of hemicelluloses using UF.
Here, utilization of membrane technology for processing of biomass hydrolysates, for
fractionating spent pulping liquors, and for recovering products from fermentation broths is
reviewed. The focus is on recovery and purification of small compounds such as
monosaccharides and acids using NF and other membrane processes.
j
iFj
Fi
Pj
Pi
RR
cc
cc--
==11
a
PF
F
VVVVRF-
=
52
4.6.1 Recovery of sugars from biomass hydrolysates
Membrane filtration is a well-suited method for fractionation and purification of biomass
hydrolysates of different origin. Combination of multiple membrane filtration techniques is
usually favourable: large molecules such as hemicellulose can be separated by UF, and
smaller ones such as monosaccharides by NF. Various examples of utilizing membrane
technology in processing of biomass hydrolysates can be found in the literature.
The processing of biomass hydrolysates often involves fermentation. Therefore, an important
part in the purification of biomass hydrolysates is detoxification, i.e. the removal of
fermentation inhibitors such as acids or furfural. Application of chromatographic separation
for this separation task was discussed in Section 3.5.1. Being a simple process capable of
separating small molecules such as monosaccharides and acids, NF can be a good alternative
to chromatographic separation. For example, Zhou et al. [105] tested NF and RO membranes
for separating acetic acid from monosaccharides, and Qi et al. [106] separated furfural from
monosaccharides using NF. In addition, a hybrid membrane extraction process has been found
efficient for detoxification of dilute acid hydrolysates [107].
NF is also applicable for recovery of individual monosaccharides. For example, the separation
of xylose has been investigated intensively. Xylose is a pentose sugar obtained by hydrolysis
of xylan, a hemicellulose found in hardwood and various other plants. A typical source of
xylose is spent liquor from sulphite pulping [108] which is one type of a biomass hydrolysate.
Xylose is used, for example, as a raw material in production of xylitol, a sweetener with
various health benefits. Recovery of xylose is conventionally carried out using
chromatographic separation. NF has been found a simple yet competitive process alternative
for chromatographic separation of xylose from hemicellulose hydrolysates [108, 109].
Membrane technology is also useful in purification of oligosaccharides [74]. Utilizing UF and
NF subsequently, both polysaccharide and monosaccharide impurities can be removed. The
polysaccharides can be recycled to the hydrolysis stage to improve the yield of
oligosaccharides.
Different separation mechanisms including sieving and charge effect play role in the NF of
biomass hydrolysates. In addition, intermolecular interactions have been observed e.g.
53
between xylose and acetic acid [110]. Pursuing for high product purity may be challenging
due to the close properties of the components. For example, the separation of
lignosulphonates from carbohydrates may be difficult because of the partially overlapping
molecular weight ranges of these two types of components [111]. Therefore, other separation
methods may be required.
4.6.2 Separation of lignin and hydroxy carboxylic acids of black liquor
Black liquor is the spent pulping liquor of alkaline pulping. Of the pulping processes used in
pulp and paper industry, kraft pulping is currently the dominant one. Kraft pulp mills produce
tons of black liquor annually. The black liquor is burned in a recovery boiler to produce steam
and to recover pulping chemicals, but it is also a potential source of valuable organic
compounds such as lignin and hydroxy carboxylic acids. Recovery and refining of these
components might improve the materials efficiency and yield new products for the pulp and
paper industry.
Recovery of lignin from black liquor has been intensively studied during recent years. Lignin
has potential applications in materials engineering. It is also a solid fuel with a high energy
value. Recovery of lignin can be profitable, in particular if the recovery boiler is the bottle-
neck of the pulping process. Separation of lignin is also an important pre-treatment step for
recovering other compounds, e.g. hydroxy acids, because lignin causes fouling and other
problems during subtle purification processes [112]. In addition, lignin-derived phenolic
compounds may impede the polymerization of hydroxy acids and are, thus, undesired
impurities in the final product.
A common approach is to precipitate lignin by decreasing the pH of black liquor by
carbonation or using a mineral acid [113, 114]. Carbonation is preferred over acidification as
it is a more economic process. In contrast to sulphuric acid precipitation, carbonation does not
affect the sulphur-balance of the pulp mill. In addition, the chemical costs are relatively low
since flue gases could be possibly applied instead of pure carbon dioxide [115]. A commercial
process for recovering lignin from black liquor based on carbonation technique, LignoBoost,
is already in use [116].
54
As an alternative to precipitation, UF can be used for separation of lignin [117, 118].
Providing that a membrane with sufficient pH stability is used, no pH adjustment is required.
Lignin separation using UF has several advantages. If membrane cleaning is not taken into
account, no chemicals are required in the process. Therefore, the process causes no
disturbance on the chemical balances of the pulp mill, which facilitates its integration to an
existing pulping process. Furthermore, the lignin product has fewer impurities than
precipitated lignin [119]. An economic analysis of the lignin recovery process has been made
by Jönsson et al. [120].
Combination of UF and carbonation can be also applied for fractionation of lignin. UF may be
useful pre-treatment for carbonation, since it helps to remove hemicellulose, which may
hinder filtration of the precipitated lignin and reduce the product quality [121]. Alternatively,
carbonation can be used as a pre-treatment for UF [122].
Niemi et al. found UF and NF efficient pre-treatment methods for the purification of hydroxy
acids by crystallization [123]. NF may also be applied for the fractionation and purification of
hydroxy acids [124]. Another potential technique for downstream processing of hydroxy acids
is electrodialysis, which could be applied to remove residual sodium [125]. One of the main
drawbacks of electrodialysis is, however, its sensitivity towards fouling [125].
Process conditions in the processing of black liquor are harsh, since black liquor is highly
alkaline. Therefore, ceramic membranes are often applied [120]. Polymeric membranes of
PES or other material with good chemical resistance can also be used.
4.6.3 Recovery of acids from fermentation broths
As already mentioned, biobased chemicals or their intermediates are often produced by
fermentation using sugars obtained from hydrolysis of biomass as substrates. The products of
such fermentation processes include alcohols and carboxylic acids, e.g. lactic acid and
succinic acid. The applications of membrane technology in the recovery and purification of
acids from fermentation broths is discussed in this section.
The micro-organisms exploited in fermentation are typically sensitive to the process
conditions such as pH and to the composition of the fermentation broth. For example, in the
production of acids, the acid produced and accumulated in the fermentation broth typically
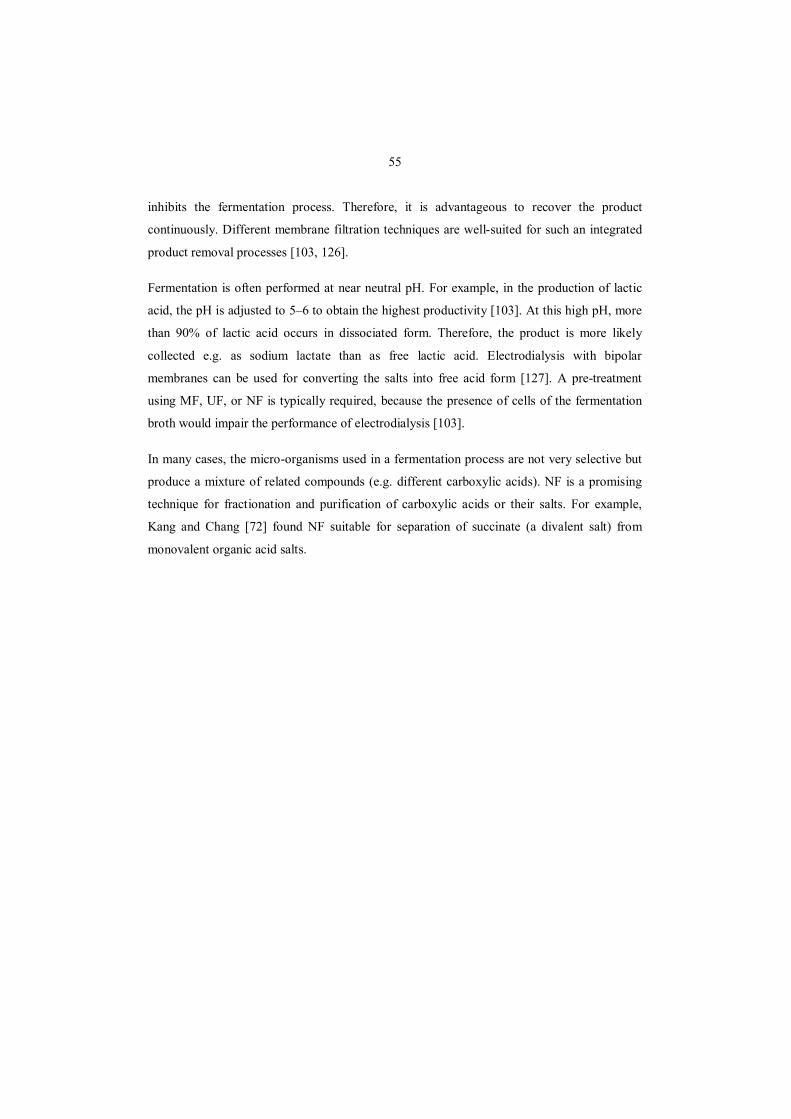
55
inhibits the fermentation process. Therefore, it is advantageous to recover the product
continuously. Different membrane filtration techniques are well-suited for such an integrated
product removal processes [103, 126].
Fermentation is often performed at near neutral pH. For example, in the production of lactic
acid, the pH is adjusted to 5–6 to obtain the highest productivity [103]. At this high pH, more
than 90% of lactic acid occurs in dissociated form. Therefore, the product is more likely
collected e.g. as sodium lactate than as free lactic acid. Electrodialysis with bipolar
membranes can be used for converting the salts into free acid form [127]. A pre-treatment
using MF, UF, or NF is typically required, because the presence of cells of the fermentation
broth would impair the performance of electrodialysis [103].
In many cases, the micro-organisms used in a fermentation process are not very selective but
produce a mixture of related compounds (e.g. different carboxylic acids). NF is a promising
technique for fractionation and purification of carboxylic acids or their salts. For example,
Kang and Chang [72] found NF suitable for separation of succinate (a divalent salt) from
monovalent organic acid salts.

56
5 COMBINATIONS OF CHROMATOGRAPHIC AND MEMBRANE SEPARATIONS
Single-step separation processes are commonly preferred due to their simplicity. However,
recovery of compounds from complex solutions often requires utilization of several
separation techniques. Though it would be possible to perform a multicomponent separation
in a single chromatographic separation step using an adequate long column, a multistep
separation process may be preferable because it often improves the productivity. For example,
combining chromatography with crystallization has been found advantageous for isolating
bioactive compounds of natural origin [128]. Furthermore, a multistep separation process can
be more robust than a single-step process. For example, a suitable adsorbent can be used for
the removal of a foulant component from the solution prior to membrane filtration [129],
which not only improves the flux but may also significantly lengthen the membrane lifetime
and reduce the downtime due to membrane cleaning.
Membrane filtration can be readily coupled with preparative chromatography, since both
methods are typically operated in liquid phase. Different approaches of combining these two
separation techniques are discussed in this chapter.
The conventional way of combining different separation methods is the sequential coupling of
separate unit operations. The multistep separation processes utilizing this type of coupling are
here referred as tandem separation processes, and they are reviewed in Section 5.1.
Considering the design of a tandem separation process, it is common that each of the unit
operations is designed and optimized individually. To obtain true synergetic effects, it may be
necessary to integrate the different separation techniques more intensively and to optimize the
overall process rather than the single process steps. Such integrated processes are known as
hybrid separation processes.
The integration of separation processes to a hybrid process can be carried out in different
ways. Lipnizki et al. classified hybrid separation processes into separation-type processes
which combine only different separation techniques and to reactor-type processes, which
combine separation with chemical reaction and can be thus considered as hybrid processes in
the meaning of “the offspring of two different processes” [130]. Both of these groups can be
further divided into two groups: 1) processes in which the unit operations (and unit processes)
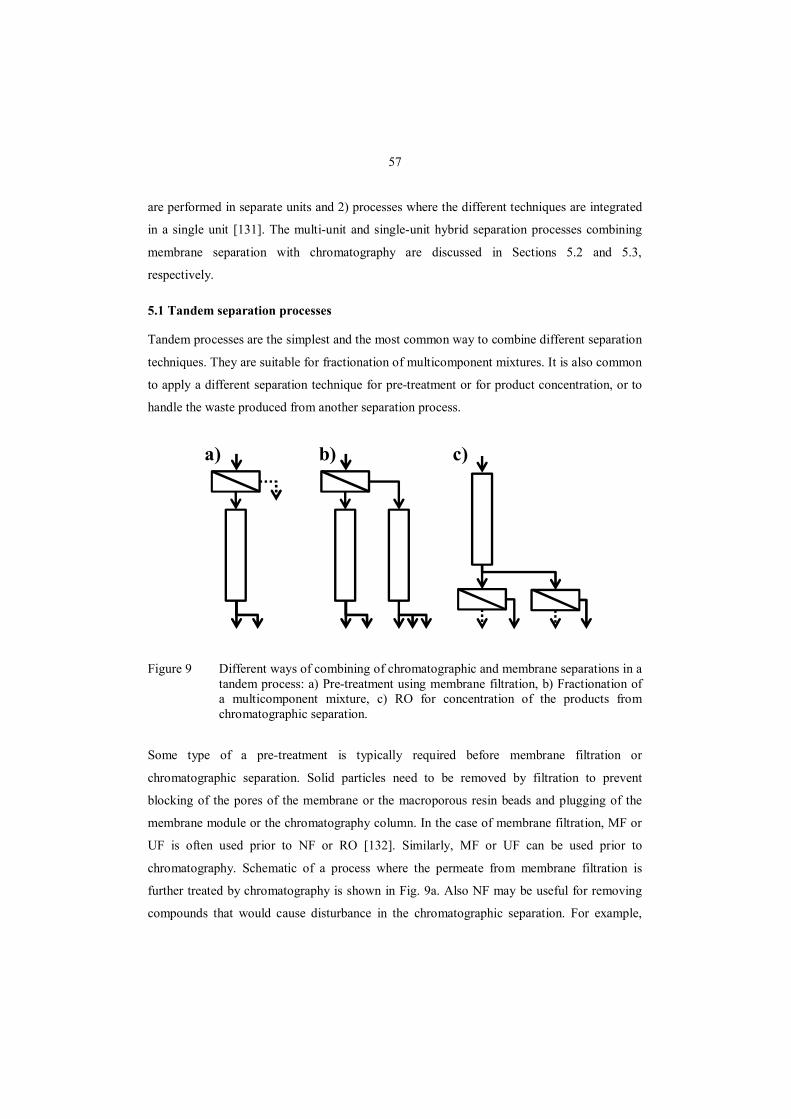
57
are performed in separate units and 2) processes where the different techniques are integrated
in a single unit [131]. The multi-unit and single-unit hybrid separation processes combining
membrane separation with chromatography are discussed in Sections 5.2 and 5.3,
respectively.
5.1 Tandem separation processes
Tandem processes are the simplest and the most common way to combine different separation
techniques. They are suitable for fractionation of multicomponent mixtures. It is also common
to apply a different separation technique for pre-treatment or for product concentration, or to
handle the waste produced from another separation process.
Figure 9 Different ways of combining of chromatographic and membrane separations in a tandem process: a) Pre-treatment using membrane filtration, b) Fractionation of a multicomponent mixture, c) RO for concentration of the products from chromatographic separation.
Some type of a pre-treatment is typically required before membrane filtration or
chromatographic separation. Solid particles need to be removed by filtration to prevent
blocking of the pores of the membrane or the macroporous resin beads and plugging of the
membrane module or the chromatography column. In the case of membrane filtration, MF or
UF is often used prior to NF or RO [132]. Similarly, MF or UF can be used prior to
chromatography. Schematic of a process where the permeate from membrane filtration is
further treated by chromatography is shown in Fig. 9a. Also NF may be useful for removing
compounds that would cause disturbance in the chromatographic separation. For example,
a) b) c)

58
Zweckmair et al. [133] applied NF and RO membranes for separating the interfering residual
formaldehyde from C3-carbohydrates.
In Fig. 9a, the retentate from membrane filtration is not processed further. Nevertheless, it is
also possible to treat both the retentate and the permeate as shown in Fig. 9b. Such process
scheme can be applied in fractionation of complex mixtures. A multicomponent separation
using only membrane techniques would require several steps since membrane filtration is
inherently a binary separation with limited separation selectivity. Coupling of
chromatographic separation with membrane filtration may be an attractive alternative to
complex membrane cascade systems. On the other hand, pre-fractionation of the feed using
membrane filtration may facilitate the chromatographic separation step. Therefore, the
combination of membrane separation with chromatography is also applied in the analysis of
complex samples [134].
It is also possible to use chromatography as a pre-treatment for membrane filtration, though it
is not common. For example, it may be favourable to reduce the osmotic pressure by
separating salt prior to NF, and chromatographic separation is a suitable method for that
desalting [80].
The product obtained from chromatographic separation is often too dilute for its end-use,
storage, transportation or further processing, and therefore it has to be concentrated.
Concentration is conventionally done using evaporation, which is a very energy-intensive
process. For example, Thang et al. calculated that 78% of the energy consumed in
chromatographic desalting of silage juice is due to concentration by evaporation [80]. RO and
NF are less energy-consuming alternatives to evaporation, and they are also applicable for
solutions that contain compounds of a limited thermal stability.
Chromatographic separation using an ion-exchange resin may require that the resin is
regularly regenerated. Often the regeneration can be avoided by choosing a resin in an ionic
form which the ions of feed solution do not convert. If regeneration is needed, the salt
solution formed as regeneration waste, has to be taken care of. For example, if sodium-
containing solution is treated using a resin that is in H+ form, the resin has to be regenerated
using a mineral acid, e.g. H2SO4, and a waste solution containing the corresponding salt, e.g.
Na2SO4, is produced. Electrodialysis using a bipolar membrane can be applied to convert the

59
salt to its parent acid and base [135]. For example, it is possible to convert Na2SO4 to NaOH
and H2SO4, and the formed acid can then be re-used in the resin regeneration. Membrane
filtration processes can also be applied for recycling of eluent or for concentrating the waste
fractions recovered from chromatographic separation prior to their disposal.
5.2 Multi-unit hybrid separation processes
Multi-unit hybrid separation processes utilize a combination of different separation principles
by coupling of two or more unit operations so that the internal process streams, e.g. a recycle
stream, from one process unit are treated using another separation technique. It is also
possible to combine such separation process with a chemical reaction.
One example of a separation-type hybrid process is steady-state recycling chromatography
with solvent removal (SSR-SR), where an internal recycle stream of chromatographic
separation is treated with another separation method, e.g. RO [24]. SSR-SR process is
discussed in Section 5.2.1. Examples of reactor-type processes that utilize both
chromatography and membrane filtration are presented in Section 5.2.2.
5.2.1 Steady-state recycling chromatography with solvent removal
Steady-state recycling (SSR) chromatography discussed in Section 3.4 has several advantages
over batch chromatography. It allows using a higher column loading and may reduce the
overall eluent consumption and provide higher productivity. Nevertheless, the productivity of
SSR is limited because the volume of the recycle fraction restrains the amount of fresh feed to
be treated per cycle. Since the recycle fraction is more diluted than the fresh feed, the
concentration of the feed to the column is lower in SSR chromatography than in batch
chromatography.
To overcome the limitation described above, Siitonen et al. suggested that the productivity of
SSR can be improved by concentrating the feed in an integrated solvent removal unit [24].
This hybrid separation process is called steady-state recycling chromatography with solvent
removal (SSR-SR). The removed solvent can be re-used as eluent. Application of solvent
removal is limited to the mixed-feed mode of SSR only, since mixing of the solution can
hardly be avoided during the solvent removal.
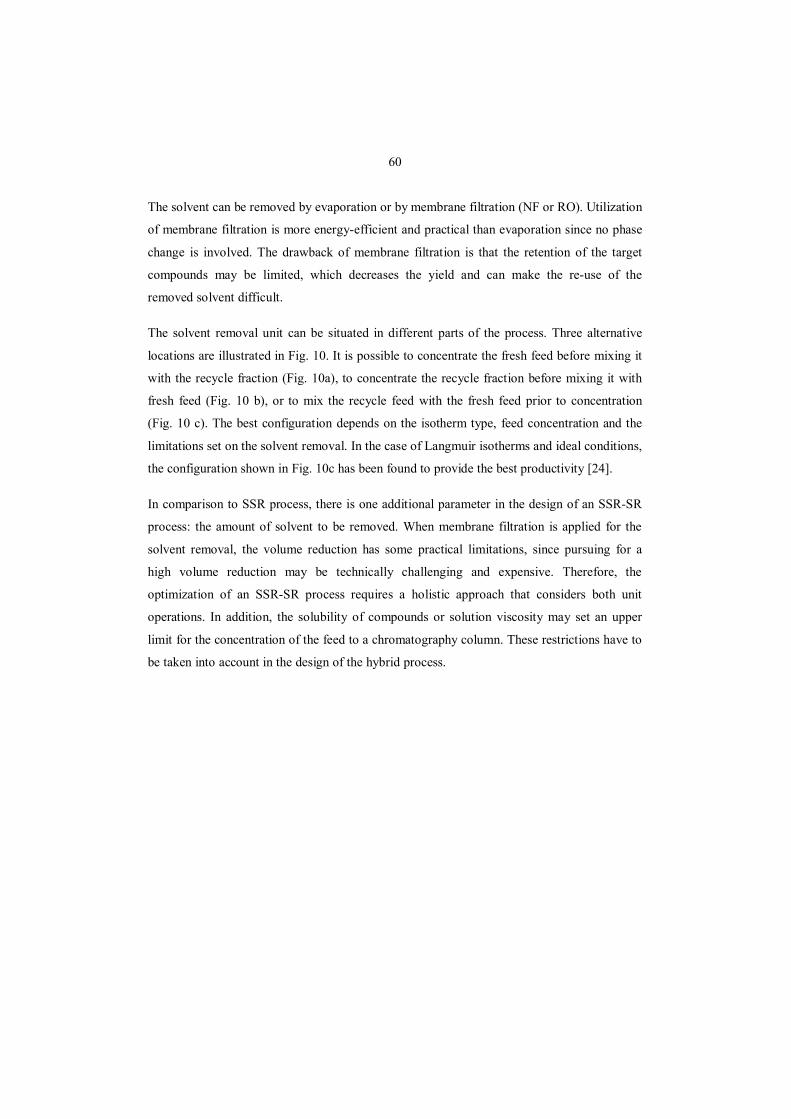
60
The solvent can be removed by evaporation or by membrane filtration (NF or RO). Utilization
of membrane filtration is more energy-efficient and practical than evaporation since no phase
change is involved. The drawback of membrane filtration is that the retention of the target
compounds may be limited, which decreases the yield and can make the re-use of the
removed solvent difficult.
The solvent removal unit can be situated in different parts of the process. Three alternative
locations are illustrated in Fig. 10. It is possible to concentrate the fresh feed before mixing it
with the recycle fraction (Fig. 10a), to concentrate the recycle fraction before mixing it with
fresh feed (Fig. 10 b), or to mix the recycle feed with the fresh feed prior to concentration
(Fig. 10 c). The best configuration depends on the isotherm type, feed concentration and the
limitations set on the solvent removal. In the case of Langmuir isotherms and ideal conditions,
the configuration shown in Fig. 10c has been found to provide the best productivity [24].
In comparison to SSR process, there is one additional parameter in the design of an SSR-SR
process: the amount of solvent to be removed. When membrane filtration is applied for the
solvent removal, the volume reduction has some practical limitations, since pursuing for a
high volume reduction may be technically challenging and expensive. Therefore, the
optimization of an SSR-SR process requires a holistic approach that considers both unit
operations. In addition, the solubility of compounds or solution viscosity may set an upper
limit for the concentration of the feed to a chromatography column. These restrictions have to
be taken into account in the design of the hybrid process.
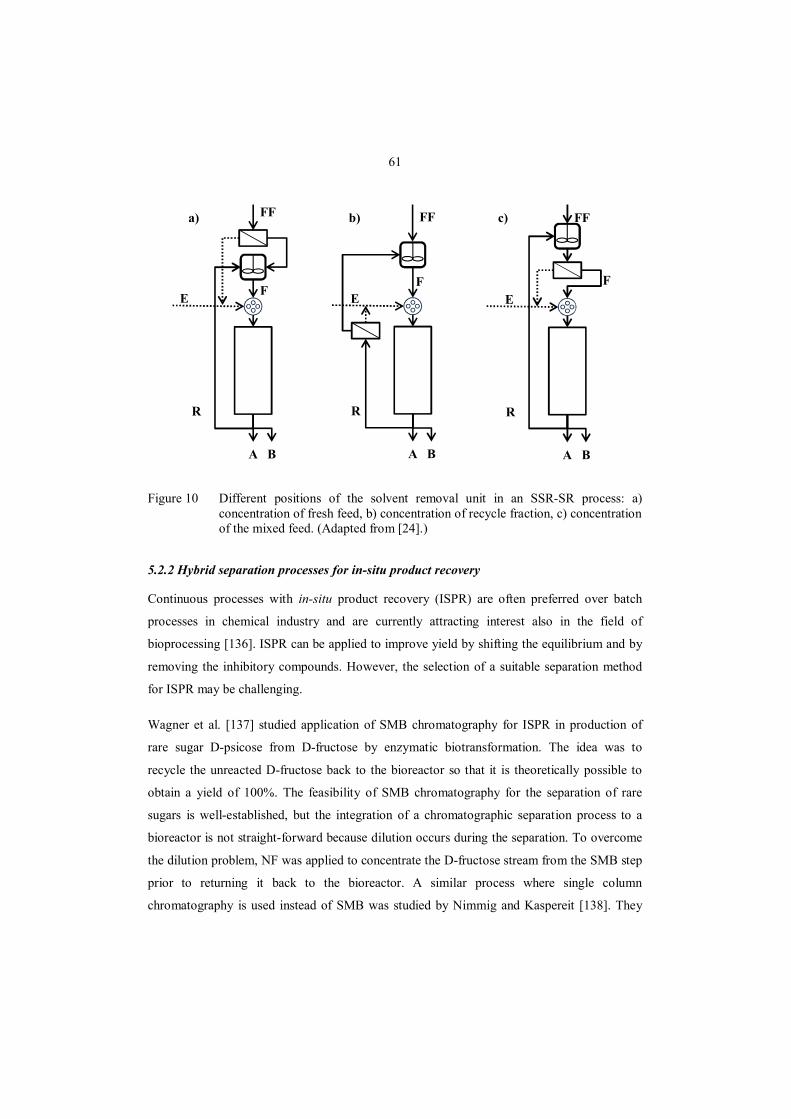
61
Figure 10 Different positions of the solvent removal unit in an SSR-SR process: a) concentration of fresh feed, b) concentration of recycle fraction, c) concentration of the mixed feed. (Adapted from [24].)
5.2.2 Hybrid separation processes for in-situ product recovery
Continuous processes with in-situ product recovery (ISPR) are often preferred over batch
processes in chemical industry and are currently attracting interest also in the field of
bioprocessing [136]. ISPR can be applied to improve yield by shifting the equilibrium and by
removing the inhibitory compounds. However, the selection of a suitable separation method
for ISPR may be challenging.
Wagner et al. [137] studied application of SMB chromatography for ISPR in production of
rare sugar D-psicose from D-fructose by enzymatic biotransformation. The idea was to
recycle the unreacted D-fructose back to the bioreactor so that it is theoretically possible to
obtain a yield of 100%. The feasibility of SMB chromatography for the separation of rare
sugars is well-established, but the integration of a chromatographic separation process to a
bioreactor is not straight-forward because dilution occurs during the separation. To overcome
the dilution problem, NF was applied to concentrate the D-fructose stream from the SMB step
prior to returning it back to the bioreactor. A similar process where single column
chromatography is used instead of SMB was studied by Nimmig and Kaspereit [138]. They
b)
F
A B
R
E
FF
F
A B
R
E
FF
F
A B
R
E
FFa) c)
62
observed that an integrated process can provide higher overall yield even despite the limited
retention of the membrane in the solvent removal step.
5.3 Single-unit hybrid separation processes
Membrane chromatography and membrane filtration-cum-chromatography devices are
examples of processes where the membrane filtration and chromatography are integrated into
a single unit. The idea is either to apply membranes in a chromatography column or resin in a
membrane filtration unit.
5.3.1 Membrane chromatography
Membrane chromatography employs stacked membranes instead of adsorbent beads in a
chromatography column. The membranes applied are typically MF or UF membranes [139].
Membrane chromatography is used especially in bioseparations, e.g. in protein purification
[139].
The main advantage of membrane chromatography over conventional packed-bed operation is
the increased mass transfer rate [140]. The mass transfer in the membrane pores occurs
mainly by convection, whereas intraparticle mass transfer in adsorbent beads occurs by
diffusion. In addition, the cost of membranes is low in comparison to the chromatographic
beads, which reduces the separation costs and makes it even possible to omit time-consuming
cleaning procedures by disposing the membranes after a single use [140].
The main drawbacks of membrane chromatography are the heterogeneity and low binding-
capacities of membranes in comparison to chromatographic resins. These properties may lead
to poor resolution. To take the advantage of both the good mass transfer properties of
membranes and the high resolution of resin beds, the so-called mixed-matrix membrane
chromatography employs resins embedded in a membrane support [140].
5.3.2 Membrane filtration-cum-chromatography device
Hybrid processes combining sorption with membrane filtration have been studied for water
purification, e.g. for boron removal [141]. If the adsorbent particles are packed as a bed inside
the membrane module, it is possible that chromatographic separation takes place. This kind of
63
a hybrid process may allow recovery and purification of multiple target compounds, e.g. from
a fermentation broth, in a single unit.
Xu et al. [142] developed an integrated separation apparatus that combines membrane and
chromatographic separations, a so-called membrane filtration-cum-chromatography device.
The device itself is a partially-coated hollow fibre MF module whose shell-side is filled with
chromatographic resin beads. The separation process is operated in a cyclic manner so that in
each cycle the resin bed is loaded with the MF permeate and then eluted with a buffer
solution. The new device was found applicable for recovery and purification of proteins
straight from a synthetic fermentation broth. The hollow fibre membrane separates the
cellular material that would disturb the chromatographic separation of proteins. In comparison
to traditional MF, a membrane filtration-cum-chromatography process was found less prone
to fouling because of the self-cleaning of the membrane during elution. The drawbacks of the
hybrid process may include the complicity of design and limited productivity.
64
6 CHALLENGES TO SEPARATION MATERIALS IN BIOREFINERY
ENVIRONMENT
Biorefinery environment presents challenges to the selection of separation materials for
chromatographic and membrane separation processes. The extreme pH of hydrolysates or
spent pulping liquors, especially when combined with an elevated temperature, sets high
requirements for the stability of the separation materials applied. Furthermore, the treated
solutions contain compounds, e.g. lignin derivatives, which are known to cause fouling [112].
The combined effects of fouling and degradation are often referred as ageing.
The ageing of separation materials is an important topic since it may be a major obstacle for
application of membrane technology and chromatography in biorefineries. Therefore, the
effects, detection and prevention of fouling and chemical deterioration of membranes and
stationary phase of chromatographic separation in long-term use are discussed in this chapter.
The focus is on polymeric materials, since they are more susceptible to chemical deterioration
than their ceramic alternatives but also very commonly used because of their inexpensive
price.
6.1 Fouling
Fouling is defined as the accumulation of undesired material on solid surfaces. The materials
and compounds that cause fouling are known as foulants, and they may be organic, inorganic
or biological. Fouling may increase mass transfer resistance, block pores, or cause
deactivation of the functional groups of the surface. Fouling may occur via various
mechanisms, including adsorption, precipitation, and trapping of particles inside the pores of
a membrane or an adsorbent bead.
6.1.1 Effects of fouling
In membrane filtration, fouling is typically observed as a flux decline which cannot be
eliminated by rinsing with the solvent (in contrast to concentration polarisation discussed in
Section 4.3). However, fouling may be reversible so that the flux may be increased partially
or up to the initial level after backflushing or cleaning with a suitable chemical. In addition to
the flux decline, fouling may also cause changes in the retention of components, as it may
change the chemical nature and morphology of the membrane.
65
Fouling of resins used in chromatography is much less studied than fouling of membranes. It
is, however, known that fouling may increase the pressure drop through the bed and reduce
the capacity of the resin and thus affect the retention time and resolution of components.
6.1.2 Prevention of fouling
There are four different approaches to reduce fouling: pre-treatment of the feed solution,
modification of the separation medium, optimisation of the process conditions, and cleaning
[84].
Various pre-treatment methods for the feed solution can be applied to reduce fouling. The
fouling components can be eliminated by chemical or physical means. As an example,
chemical decomposition by oxidation and physical removal using activated carbon adsorption
have been found suitable methods for removing foulants from wood hydrolysates [14]. The
challenge in this kind of a feed pre-treatment is how to avoid loss of yield. For example,
activated carbon adsorption is usually not selective towards the foulants and thus it may
adsorb also valuable target compounds.
Modification of the surface chemistry of the separation material may help to reduce fouling.
Several examples can be found on the field of membrane science. Regarding the surface
chemistry, usually hydrophilic surfaces are less prone to fouling than hydrophobic ones [84].
However, modification of the membrane to make it more hydrophilic does not always
improve the fouling tendency: its success depends on the nature and sometimes even the
concentration of the foulant [143]. A favourable membrane pre-treatment might not only
reduce the flux decline, but it may also facilitate the cleaning of membranes [144].
The resin beads applied in chromatography can be modified in the same way as membranes.
However, the modification also affects the retention of compounds. Therefore, the challenge
is to find a modification method that is efficient for reducing fouling without compromising
separation selectivity and process performance.
In addition to surface chemistry, the structure of the material also affects the fouling tendency.
Non-porous materials, e.g. RO membranes, are typically fouled less than porous ones as the
latter allow more mechanisms of fouling. In the case of a porous membrane, a uniform
structure with a narrow pore size distribution is somewhat less prone to fouling than a non-
66
uniform structure [84]. In the case of MF membranes, particle blocking of the membrane
pores is a major cause of flux decline, and it may be prevented by choosing a membrane with
a smaller pore size.
In membrane filtration, fouling is strongly dependent on concentration polarization (see
Chapter 4.3). Fouling can be reduced by increasing turbulence and working at subcritical flux
[145]. Other process conditions such as temperature, pH, and salt concentration may also
affect the fouling tendency, since they affect the properties of membranes and solutes [95].
Particularly, in the treatment of protein solutions, these factors have a major importance
[100].
Severe fouling can be prevented with a regular cleaning procedure. Typically, the cleaning is
done using chemicals such as acids, alkalis, organic solvents, or detergents, or sequential
combinations of these. Enzymes may also be utilized. The chemical resistance of the
separation material has to be taken into account when selecting the cleaning agent. Cleaning
with an unsuitable chemical may change the membrane properties and even lead to more
severe fouling [146]. Moreover, too harsh cleaning conditions may lead to degradation of the
membrane.
6.2 Durability of separation materials under extreme conditions
Separation materials may be exposed to extreme process conditions, e.g. a high temperature
or the presence of organic solvents or oxidizing chemicals either during the separation
operation or during cleaning. Here extreme conditions are regarded as high and low pH and
high temperature. These conditions are typical for biorefineries. For example, the treatment of
acidic hydrolysates or black liquor requires separation materials with good chemical
durability. Especially the combination of a high temperature with an extreme pH is disastrous
for many materials. For example, Zagorodni et al. have found that strong alkali causes
degradation of the functional groups of an anion-exchange resin at an elevated temperature
[147]. A new challenge to the selection of separation materials is raised by the increasing use
of ionic liquids.
Mechanisms of chemical deterioration of membranes and chromatographic beads include
dissolution of the material and changes in the chemical nature of functional groups. The
67
functional groups may also get detached, e.g. due to breaking of covalent bonds between the
functional groups and the polymer matrix. Chemical reactions may also result in extra cross-
linking of the polymer structure, which can change the mechanical stability and other
properties of the material.
6.3 Analysis of fouling and chemical deterioration
The fouling and chemical deterioration of membranes and chromatographic separation
materials, e.g. ion-exchange resins, can be examined in various ways. Combination of
different techniques is typically required to obtain understanding of the mechanisms of
fouling and degradation.
Various imaging techniques including scanning electron microscope and atomic force
microscopy [148, 149] have been applied for studying of the morphology of separation
materials. These techniques provide information on the swelling, changes in the pore structure
and aggregation of precipitates on the surface. Spectroscopic methods, e.g. infrared
spectroscopy [147] or surface-enhanced Raman spectroscopy [150], can be useful in the
identification of foulants or the mechanisms of chemical deterioration.
Changes in a separation material can also be observed by investigating its properties, e.g. the
streaming potential of membrane [151]. For resins, the measurement of properties such as
water content or ion-exchange capacity (if applicable) may reveal the possible undesired
changes that have occurred during their use.
The characterization of separation materials is typically done using off-line analyses, but
recently also real-time analysis techniques have been developed. For example, ultrasonic
time-domain reflectometry has been found promising method for investigation of membrane
fouling [152], and confocal scanning laser microscope for in situ monitoring of fouling in
packed beds [153].
Another common approach to determine fouling or degradation is to study the performance of
the separation material under different process conditions. In the case of membrane filtration,
membrane performance can be assessed by examining flux and retention of model
compounds. The model compounds used in comparing the performance of a membrane at
different pHs have to be uncharged and stable under the whole pH range studied, e.g.

68
polyethylene glycol [154]. In chromatography, the retention times of model compounds are
indicators of the separation selectivity. Long-term performance of the separation material can
be studied with successive injections. A faster method may be to compare the separation
before and after exposing the bed to the studied solution by running a break-through curve.
69
7 MATERIALS AND METHODS
The experimental methods applied in this work are summarized here. A more detailed
description is given in Papers I-IV.
7.1 Raw materials
The solutions treated in this work were soda-cooked black liquor and different types of
synthetic model solutions representing biomass hydrolysates or black liquor.
Fractionation of black liquor was studied using soda black liquor from a laboratory-scale
cooking of wood. Softwood (SW) and hardwood (HW) soda black liquors were prepared at
VTT (Espoo, Finland) using pine or birch chips as raw material. The cooking temperatures for
SW and HW chips were 170 °C or 165 °C, respectively. The liquor to wood ratio (W/D) was
4:1 and the amount of effective alkali was 5.5 mol/kg. The cooking was continued until H-
factor [155] of 1936 for SW or 1324 for HW was reached. The total dry solids (TDS) content
of the black liquor was approximately 14 wt%.
A synthetic model solution containing sulphuric acid and glucose was used in the wood
hydrolysate fractionation study in Paper I. The concentrations of H2SO4 and glucose in the
solution were chosen to correspond to the composition of a typical lignocellulosic hydrolysate
from concentrated acid hydrolysis [26].
Another set of model solutions containing NaOH and sodium L-tartrate dibasic di-hydrate
was used in the investigation of the separation mechanism in the chromatographic
fractionation of black liquor (see Paper III for details).
7.2 Chromatographic separations
7.2.1 Resins
Different types of resin beads were applied in the chromatographic separation, adsorption and
ion-exchange experiments. The resins are listed in Table 2.
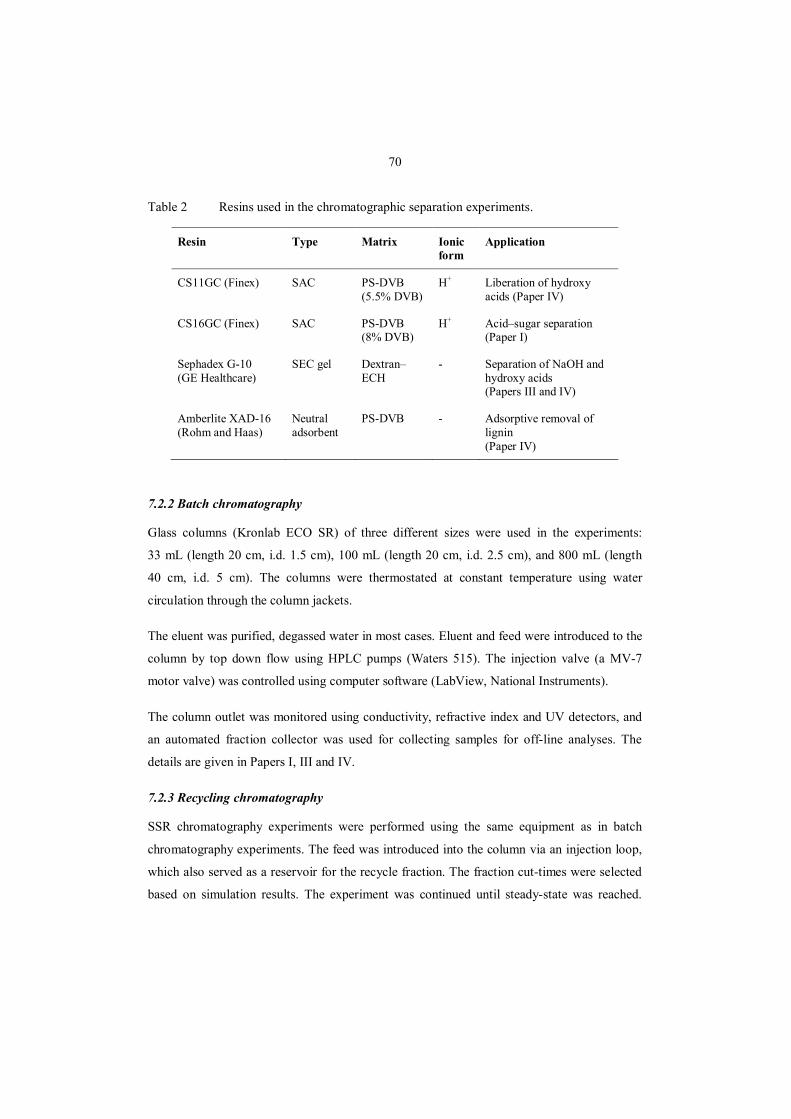
70
Table 2 Resins used in the chromatographic separation experiments.
Resin Type Matrix Ionic form
Application
CS11GC (Finex) SAC PS-DVB (5.5% DVB)
H+ Liberation of hydroxy acids (Paper IV)
CS16GC (Finex) SAC PS-DVB (8% DVB)
H+ Acid–sugar separation (Paper I)
Sephadex G-10 (GE Healthcare)
SEC gel Dextran–ECH
- Separation of NaOH and hydroxy acids (Papers III and IV)
Amberlite XAD-16 (Rohm and Haas)
Neutral adsorbent
PS-DVB - Adsorptive removal of lignin (Paper IV)
7.2.2 Batch chromatography
Glass columns (Kronlab ECO SR) of three different sizes were used in the experiments:
33 mL (length 20 cm, i.d. 1.5 cm), 100 mL (length 20 cm, i.d. 2.5 cm), and 800 mL (length
40 cm, i.d. 5 cm). The columns were thermostated at constant temperature using water
circulation through the column jackets.
The eluent was purified, degassed water in most cases. Eluent and feed were introduced to the
column by top down flow using HPLC pumps (Waters 515). The injection valve (a MV-7
motor valve) was controlled using computer software (LabView, National Instruments).
The column outlet was monitored using conductivity, refractive index and UV detectors, and
an automated fraction collector was used for collecting samples for off-line analyses. The
details are given in Papers I, III and IV.
7.2.3 Recycling chromatography
SSR chromatography experiments were performed using the same equipment as in batch
chromatography experiments. The feed was introduced into the column via an injection loop,
which also served as a reservoir for the recycle fraction. The fraction cut-times were selected
based on simulation results. The experiment was continued until steady-state was reached.
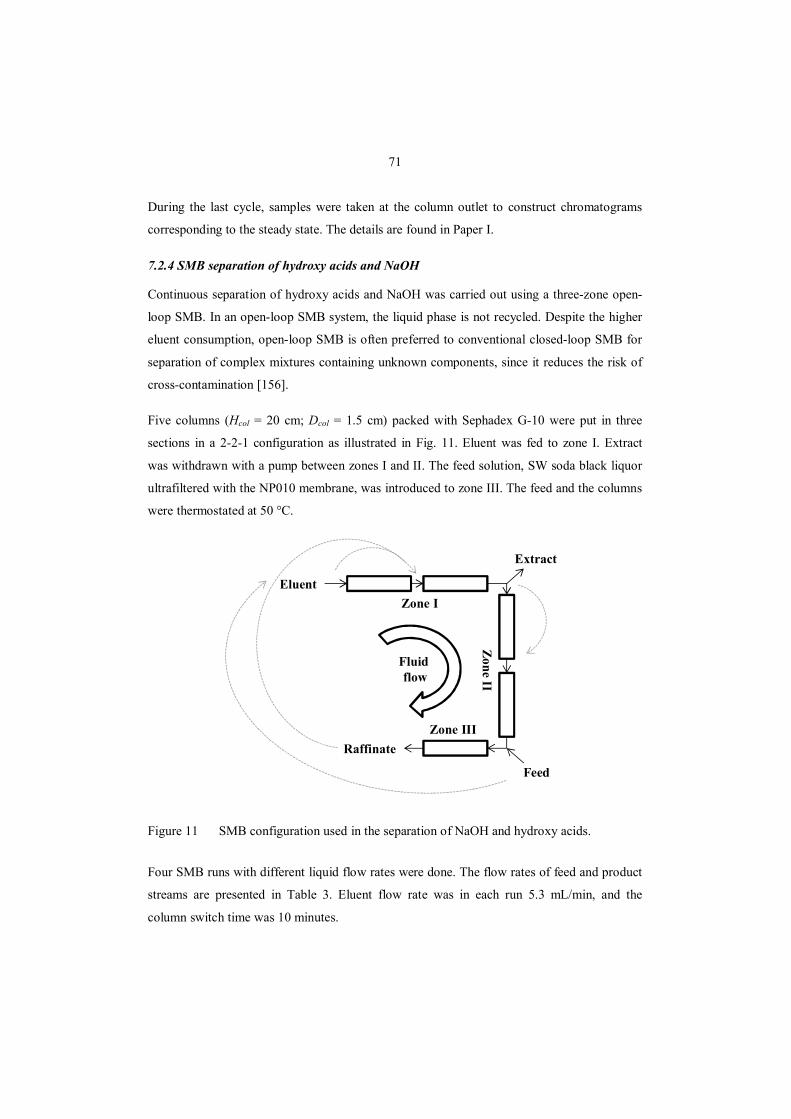
71
During the last cycle, samples were taken at the column outlet to construct chromatograms
corresponding to the steady state. The details are found in Paper I.
7.2.4 SMB separation of hydroxy acids and NaOH
Continuous separation of hydroxy acids and NaOH was carried out using a three-zone open-
loop SMB. In an open-loop SMB system, the liquid phase is not recycled. Despite the higher
eluent consumption, open-loop SMB is often preferred to conventional closed-loop SMB for
separation of complex mixtures containing unknown components, since it reduces the risk of
cross-contamination [156].
Five columns (Hcol = 20 cm; Dcol = 1.5 cm) packed with Sephadex G-10 were put in three
sections in a 2-2-1 configuration as illustrated in Fig. 11. Eluent was fed to zone I. Extract
was withdrawn with a pump between zones I and II. The feed solution, SW soda black liquor
ultrafiltered with the NP010 membrane, was introduced to zone III. The feed and the columns
were thermostated at 50 °C.
Figure 11 SMB configuration used in the separation of NaOH and hydroxy acids.
Four SMB runs with different liquid flow rates were done. The flow rates of feed and product
streams are presented in Table 3. Eluent flow rate was in each run 5.3 mL/min, and the
column switch time was 10 minutes.
Eluent
Extract
Feed
Raffinate
Zone I
Zone II
Zone III
Fluid flow
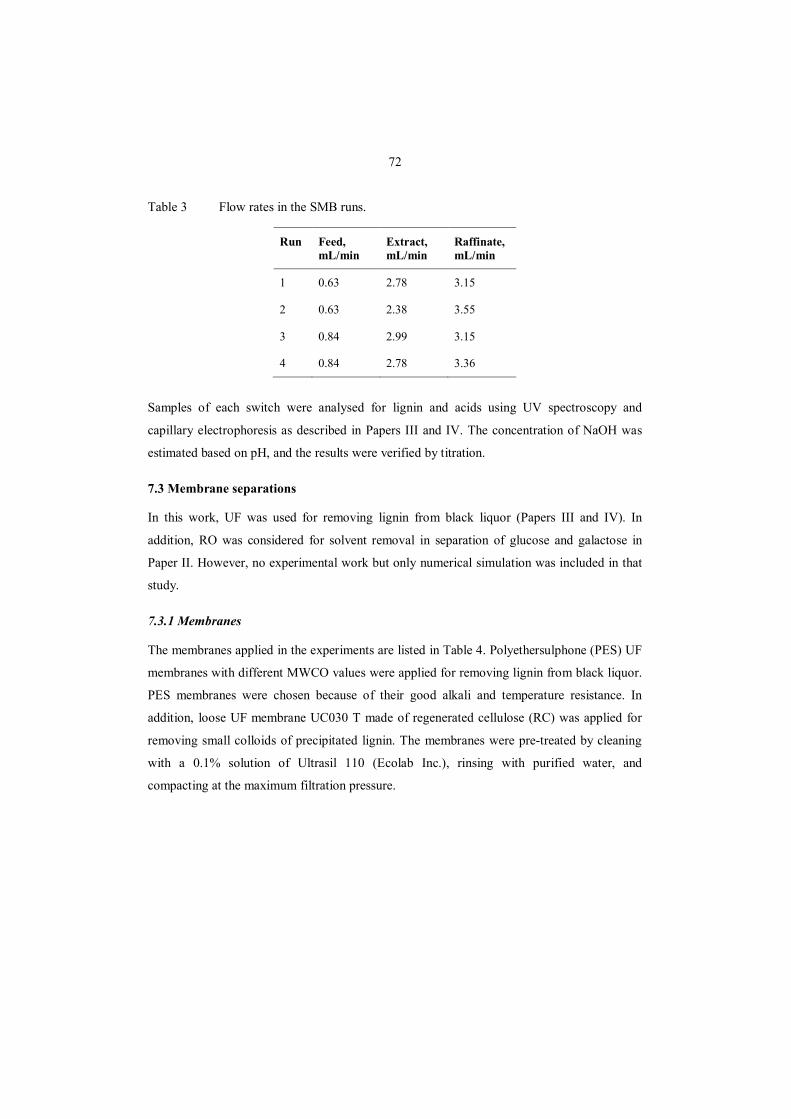
72
Table 3 Flow rates in the SMB runs.
Run Feed, mL/min
Extract, mL/min
Raffinate, mL/min
1 0.63 2.78 3.15
2 0.63 2.38 3.55
3 0.84 2.99 3.15
4 0.84 2.78 3.36
Samples of each switch were analysed for lignin and acids using UV spectroscopy and
capillary electrophoresis as described in Papers III and IV. The concentration of NaOH was
estimated based on pH, and the results were verified by titration.
7.3 Membrane separations
In this work, UF was used for removing lignin from black liquor (Papers III and IV). In
addition, RO was considered for solvent removal in separation of glucose and galactose in
Paper II. However, no experimental work but only numerical simulation was included in that
study.
7.3.1 Membranes
The membranes applied in the experiments are listed in Table 4. Polyethersulphone (PES) UF
membranes with different MWCO values were applied for removing lignin from black liquor.
PES membranes were chosen because of their good alkali and temperature resistance. In
addition, loose UF membrane UC030 T made of regenerated cellulose (RC) was applied for
removing small colloids of precipitated lignin. The membranes were pre-treated by cleaning
with a 0.1% solution of Ultrasil 110 (Ecolab Inc.), rinsing with purified water, and
compacting at the maximum filtration pressure.
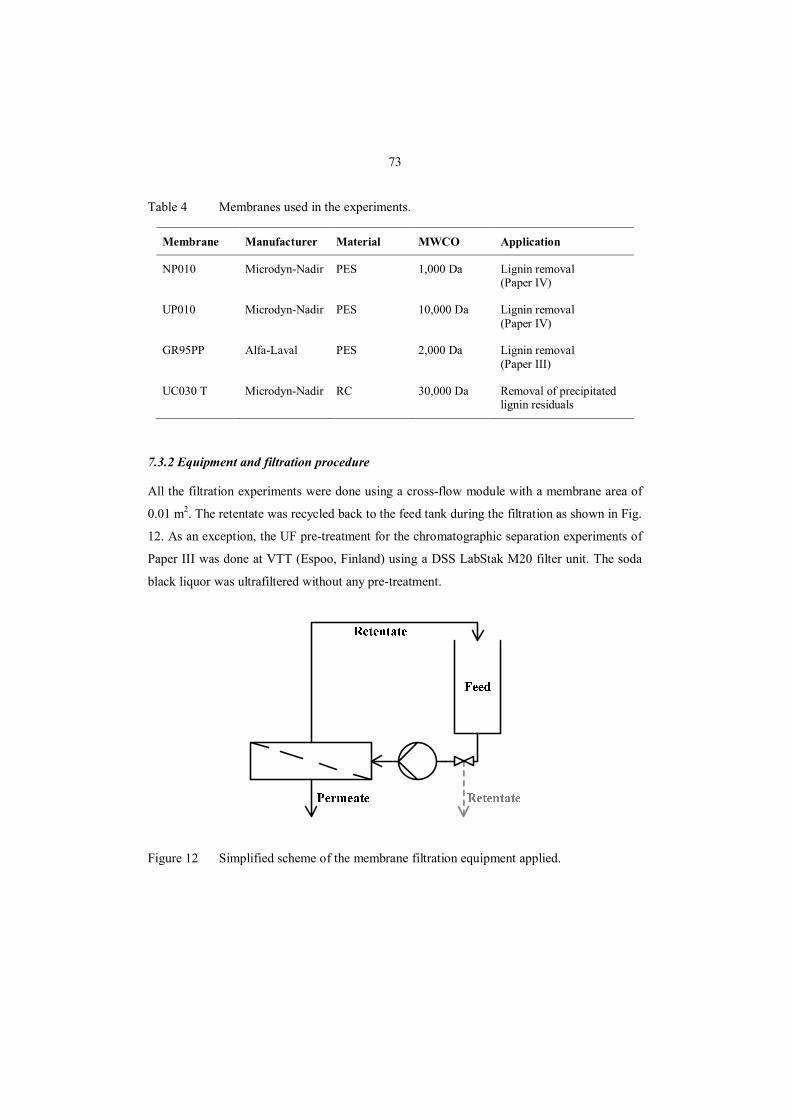
73
Table 4 Membranes used in the experiments.
Membrane Manufacturer Material MWCO Application
NP010 Microdyn-Nadir PES 1,000 Da Lignin removal (Paper IV)
UP010 Microdyn-Nadir PES 10,000 Da Lignin removal (Paper IV)
GR95PP Alfa-Laval PES 2,000 Da Lignin removal (Paper III)
UC030 T Microdyn-Nadir RC 30,000 Da Removal of precipitated lignin residuals
7.3.2 Equipment and filtration procedure
All the filtration experiments were done using a cross-flow module with a membrane area of
0.01 m2. The retentate was recycled back to the feed tank during the filtration as shown in Fig.
12. As an exception, the UF pre-treatment for the chromatographic separation experiments of
Paper III was done at VTT (Espoo, Finland) using a DSS LabStak M20 filter unit. The soda
black liquor was ultrafiltered without any pre-treatment.
Figure 12 Simplified scheme of the membrane filtration equipment applied.
74
7.4 Other separation techniques for purification of hydroxy acids
The hydroxy acids fractions recovered using UF and chromatographic separation were
purified using ion-exchange, adsorption and evaporation. The details of the purification
procedure can be found in Paper III.
The lignin content of black liquor can also be reduced by precipitation. In this work, the
residual lignin in the UF permeate was removed by precipitation using carbon dioxide.
Carbonation is a commonly used method for recovering lignin from black liquor (process
known as LignoBoost).
The precipitation was carried out in a stirred tank reactor (V = 10 L) equipped with four
baffles at atmospheric pressure and temperature of 45 °C. This temperature was found
suitable for membrane-treated kraft black liquors by Wallmo et al. [21]. Carbon dioxide
(purity 95%) was fed to the vessel from a nozzle located below the impeller with a flow rate
of 2 L/min. The precipitation was continued for 2 hours to reach the final pH of
approximately 9. The suspension was then kept agitated for 30 minutes prior to filtration at
temperature of 45 °C to allow completion of the precipitation. The precipitated lignin was
separated by vacuum filtration in a Buchner funnel through a filter paper.
More lignin was precipitated by adding concentrated sulphuric acid (95-97 wt%) until a pH of
2.5 was reached. Simultaneously, the carboxylic acids, which still occur in their sodium salt
form after the carbonation, were converted into their protonated form. The same equipment
was used as in the carbonation. The acid precipitation was performed at 25 °C.
The precipitated lignin was separated by vacuum filtration using a Buchner funnel. The small
lignin precipitates remaining after the vacuum filtration were removed by UF using UC030 T
membrane (Microdyn-Nadir). The filtration was carried out at the temperature of
45 °C using a constant pressure of 1 bar and the equipment described in Section 7.3.2. The
cross-flow velocity was approximately 2.0 m/s. Prior to the filtration, the membrane was
compacted using a pressure of 1.5 bar for 15 minutes at 45 °C, cleaned with a 0.1% solution
of Ultrasil 110 (Ecolab Inc.) at 40 °C and rinsed with clean water. Pure water flux was
measured at 1 bar both before and after the filtration.
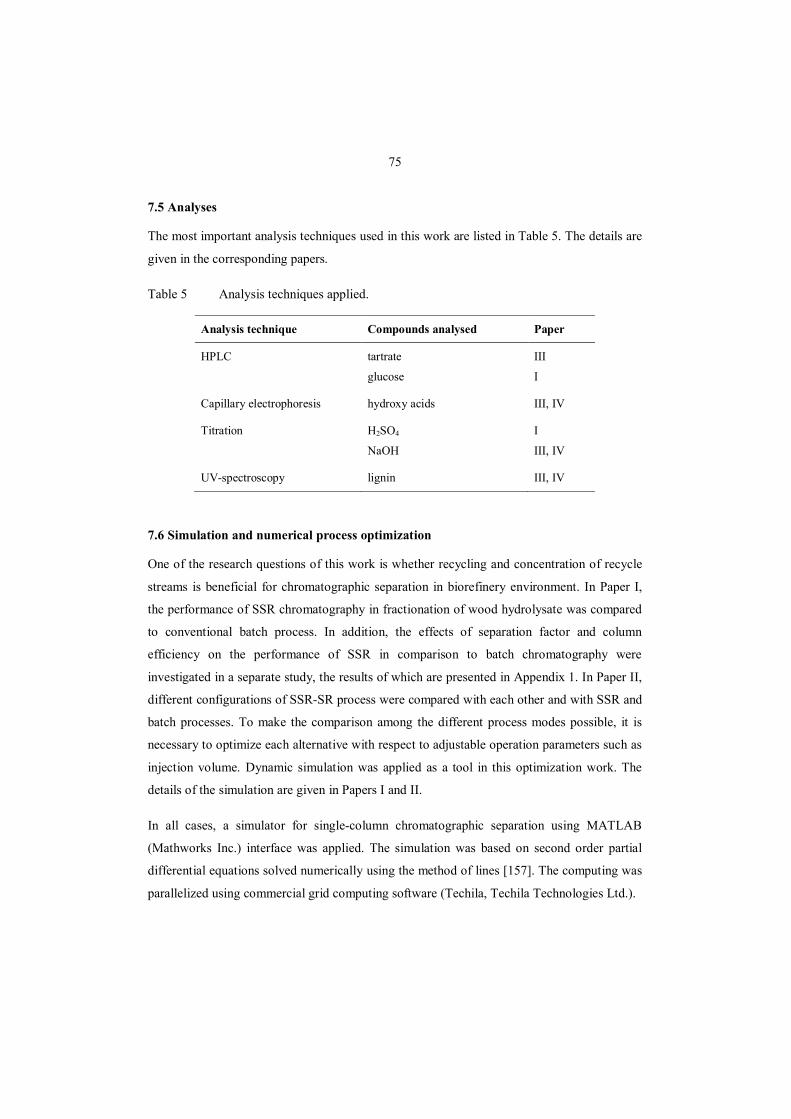
75
7.5 Analyses
The most important analysis techniques used in this work are listed in Table 5. The details are
given in the corresponding papers.
Table 5 Analysis techniques applied.
Analysis technique Compounds analysed Paper
HPLC tartrate
glucose
III
I
Capillary electrophoresis hydroxy acids III, IV
Titration H2SO4
NaOH
I
III, IV
UV-spectroscopy lignin III, IV
7.6 Simulation and numerical process optimization
One of the research questions of this work is whether recycling and concentration of recycle
streams is beneficial for chromatographic separation in biorefinery environment. In Paper I,
the performance of SSR chromatography in fractionation of wood hydrolysate was compared
to conventional batch process. In addition, the effects of separation factor and column
efficiency on the performance of SSR in comparison to batch chromatography were
investigated in a separate study, the results of which are presented in Appendix 1. In Paper II,
different configurations of SSR-SR process were compared with each other and with SSR and
batch processes. To make the comparison among the different process modes possible, it is
necessary to optimize each alternative with respect to adjustable operation parameters such as
injection volume. Dynamic simulation was applied as a tool in this optimization work. The
details of the simulation are given in Papers I and II.
In all cases, a simulator for single-column chromatographic separation using MATLAB
(Mathworks Inc.) interface was applied. The simulation was based on second order partial
differential equations solved numerically using the method of lines [157]. The computing was
parallelized using commercial grid computing software (Techila, Techila Technologies Ltd.).
76
The basic assumption in the simulation was that the profiles of subsequent injection pulses
will not overlap. The model parameters such as isotherm constants and diffusion coefficient
were determined experimentally or taken from the literature. Radial concentration gradients
were assumed negligible. Specific purity constraints were set for each case, and the cut-times
were optimized to fulfil these constraints. The analytical shortcut method for determination of
cut-times in SSR is valid only in ideal conditions [22]. In all cases studied in this work,
dispersion was present. The short-cut method was used to obtain an initial value, and the cut-
times that provide the target purity were determined from a series of simulation runs using the
least-squares method. For optimization of the injection volume and eluent flow rate, the
simulation was repeated varying these parameters. The performance was evaluated based on
productivity and eluent consumption which were calculated using the equations presented in
Chapter 3.2.3.
77
8 RESULTS AND DISCUSSION
In this work, the feasibility of new separation processes based on chromatographic and
membrane separations for fractionation of biomass hydrolysates and black liquor was studied.
Three types of separation process concepts were included in this study: recycling
chromatography; hybrid SSR-SR process that combines recycling chromatography with
membrane filtration; and tandem separation processes based on chromatographic and
membrane separations. The results of the work are summarized in this Chapter, and the details
can be found in Papers I-IV and in Appendix 1.
8.1 Recycling chromatography for recovering sugars from biomass hydrolysates
Several studies on the performance of recycling chromatography in comparison to
conventional batch chromatography [23, 158-160] or SMB processes have been previously
published [158, 159]. However, the results are often valid only for the specific separation case
studied, and the reported results are in part contradictory. In this work, SSR chromatography
was compared with conventional batch chromatography for fractionation of biomass
hydrolysates. The results are presented in Papers I and II.
Guiochon has stated that the major advantage of recycling chromatography over batch
operation is that wasting the intermediate is avoided without compromising the productivity
[161]. In this work, it was, however, assumed that no waste fraction is collected in either
process concepts. Consequently, the injection volume used in the batch process was fixed by
the purity constraints given and the other process parameters such as eluent flow rate. By
contrast, two variables, injection volume and eluent flow rate, were adjusted during the
optimization of SSR chromatography.
In Paper I, the use of recycling was found to improve the productivity of chromatographic
fractionation of strong-acid hydrolysate of wood by 43%. Similarly, an improvement in
productivity due to recycling was also observed in the case of chromatographic separation of
the monosaccharides of lactose hydrolysate in Paper II. However, such increase (about 20%)
was not as substantial as in the case of strong-acid hydrolysate fractionation. This result is
probably due to the different isotherm models and better column efficiency in the lactose
hydrolysate fractionation study.
78
In both cases studied, the maximization of productivity using the recycling mode slightly
increased the eluent consumption in comparison to the batch process operated with the
parameters that provided the highest possible productivity. The increase in eluent
consumption was due to the use of a higher eluent flow rate in the SSR mode compared to
that of the batch mode. However, the operating parameters of SSR can also be chosen so that
eluent consumption is the same as in the optimized batch process or even lower and a higher
productivity can still be obtained than using a batch process.
As a conclusion of both two case studies, SSR was found to outperform batch
chromatography in recovery of monosaccharides from biomass hydrolysates. The freedom to
choose not only one but two operating parameters (injection volume and eluent flow rate) is a
great advantage of SSR chromatography over batch chromatography and makes it possible to
obtain higher productivity without compromising the eluent consumption.
Examples in which an SSR process provides higher productivities with lower eluent
consumption in comparison to batch chromatography are also found in the literature. For
example, in the production of pharmaceutical intermediates it has been shown to increase the
productivity up to 10-fold and to reduce the eluent consumption significantly at the same time
[160]. The low eluent consumption is one of the main advantages of SSR, since the eluent has
often the highest impact on the total costs of chromatographic separation [43]. In addition, the
product obtained from an SSR process is typically less diluted than in batch chromatography
[47], which may have the advantage of reducing the cost of downstream processing.
As discussed above, two chromatographic separation cases with different isotherm types
(anti-Langmuir and linear isotherms) were studied in Papers I and II. In both of these cases,
SSR was found preferable over a batch process. However, this ranking of the
chromatographic process concepts cannot be generalized and assumed to be valid also for
systems with different mass transfer and isotherm models, which may be specific to other
separation tasks also in the field of biomass refining.
To obtain further proof of the advantages of SSR, an additional simulation study was
performed using isotherm parameter data taken from Schlinge et al. [158], who also made a
comparison between different process concepts (batch, SMB, closed-loop recycling and
mixed-feed SSR) using dynamic simulation. In their study, binary separations with
79
competitive Langmuir isotherms were investigated and the effects of isotherm parameters and
feed composition on the separation performance were studied. Both closed-loop recycling and
mixed-feed SSR were found to improve the productivity in comparison to batch
chromatography in most cases, but not always. In particular, when the separation factor was
high, a batch process was found to outperform the recycling mode. However, the yields
obtained using recycling chromatography were often higher than the target yield set for batch
chromatography, and a direct comparison of the productivities may thus be misleading.
In this work, the purity constraints were equal for the different process concepts included in
the comparison, which was not the case in the study of Schlinge et al. [158]. The detailed
results of the simulation study are presented in Appendix 1. In brief, SSR process always
outperformed batch process, and its superiority was even better when the column efficiency or
the separation factor was low. These results contradict the findings of Schlinge et al. [158]
because the yield constraints were treated in a different manner (here the yield of SSR was
always equal to that of batch, not higher). On the other hand, the results are in agreement with
the results of a simulation study made by Kaspereit and Sainio [23], which demonstrated that
in the presence of dispersion, mixed-feed SSR outperforms batch chromatography with
respect to productivity and eluent consumption. Another study shows that at ideal conditions
recycling does not cause any improvement in comparison to batch chromatography [22].
The comparison of SSR chromatography with continuous SMB chromatography was
excluded from this study. Similar improvements as those that were here achieved by recycling
could also be obtained using an SMB process. Indeed, SMB may even be superior to SSR
process. For example, in the work of Schlinge et al. [158], SMB was found to outperform all
the other process options with respect to productivity. However, it should be noted that the
investment costs of SSR are only slightly higher than those of a batch chromatography unit,
which is not the case for SMB, which utilizes several columns. According to a study of Grill
et al. [159], SMB is superior to SSR in large-scale enantioseparation, but SSR is competitive
at moderate production scale. SSR has lower investment costs than SMB chromatography
since only single column is required, and still SSR is often capable for similar or better
separation efficiency than SMB. One-column recycle chromatography has been shown to be
more efficient, regarding both the eluent consumption and the pressure drop, than a four-
column SMB for a binary separation [162], for a pseudo-binary separation [163], and for
80
separating a single component from a ternary mixture [164]. Therefore, SSR chromatography
can be considered as a serious alternative to SMB chromatography.
8.2 Hybrid SSR-SR process for sugar separation
Intensification of chromatographic separation by concentrating the processed solutions using
membrane separation was the topic of investigation in Paper II. The case study concerned the
separation of galactose and glucose from lactose hydrolysate using a SAC resin. As already
discussed, the use of SSR instead of batch chromatography was found to increase the
productivity and to decrease the specific eluent consumption in this difficult separation task.
The next research question was whether substituting the SSR process with of a hybrid SSR-
SR process would provide a further improvement in the process performance.
The simulation study of Paper II showed that a major increase in productivity can be obtained
using SSR-SR instead of a conventional batch or SSR processes. When the feed solution was
dilute, the productivity improved up to 500% in comparison to an SSR process without
solvent removal. Simultaneously, the eluent consumption was reduced by 64%. Furthermore,
assuming that the removed solvent is utilized as eluent, the eluent consumption would be 85%
lower than in the corresponding SSR process. When the concentration of the feed solution
was higher, only modest improvements in the process performance were observed. The
benefits of solvent removal were found to depend strongly on the concentration limitations set
for the solvent removal unit.
Three configurations of SSR-SR process (see Fig. 10) were compared. In each configuration,
the solvent removal unit is located in a different place: 1) concentration of fresh feed, 2)
concentration of recycle fraction, 3) concentration of the mixed feed. According to an earlier
study of Siitonen et al. [24], the third configuration in which the recycle fraction is mixed
with fresh feed prior to solvent removal provides best productivity in the absence of
concentration constraints. The same configuration was found the most favourable in most
cases also in the present study. However, it was observed that when the maximum
concentration achievable in the solvent removal unit is lower than the concentration of feed
solution, it is favourable to remove the solvent from the recycle fraction before the mixing.
81
The main limitation of the present study was that the solvent removal unit was assumed to
cause no losses in the yield. If membrane filtration is applied for solvent removal, these losses
cannot be completely avoided. In practise, the retention of monosaccharides by RO or
especially NF membranes is often below 100%, which means that a small fraction of the
product ends up in the permeate stream. This leakage of the target molecules not only reduces
the yield but also may hamper the re-use of the solvent, since the impurities in the removed
solvent would unavoidably reduce the purity of the end products. In the case of treating a
multicomponent mixture, the possible effects caused by the presence of other compounds
such as inorganic salts on the separation also needs to be studied. For example, the salts of a
lactose hydrolysate would probably concentrate in the removed solvent. If the solvent is re-
used as eluent, the presence of salts might change the partition of monosaccharides in the
chromatographic separation.
It is thus necessary to take into account the retention of the membrane in the design of an
SSR-SR process, especially if the re-use of the solvent is considered. Nevertheless, it should
be borne in mind that the SSR-SR process could be more profitable than SSR and batch
processes even if the removed solvent was disposed. It is also worth noticing that a significant
improvement in the productivity was also achieved when the feed to conventional batch
chromatography was simply concentrated, especially when the feed solution was dilute.
Therefore, a simpler tandem separation process can be used instead of a more complex hybrid
process.
8.3 Tandem separation process for fractionation of black liquor
Black liquor is rich in potentially valuable organic compounds such as hydroxy carboxylic
acids. However, the recovery of these compounds is challenging due to high lignin content
and alkalinity of black liquor, and multiple separation unit operations are, therefore, required.
In this work, a tandem separation process based on UF and SEC was found promising for the
fractionation of black liquor. The results of each process step are briefly discussed in this
chapter. The details can be found in Papers III and IV.
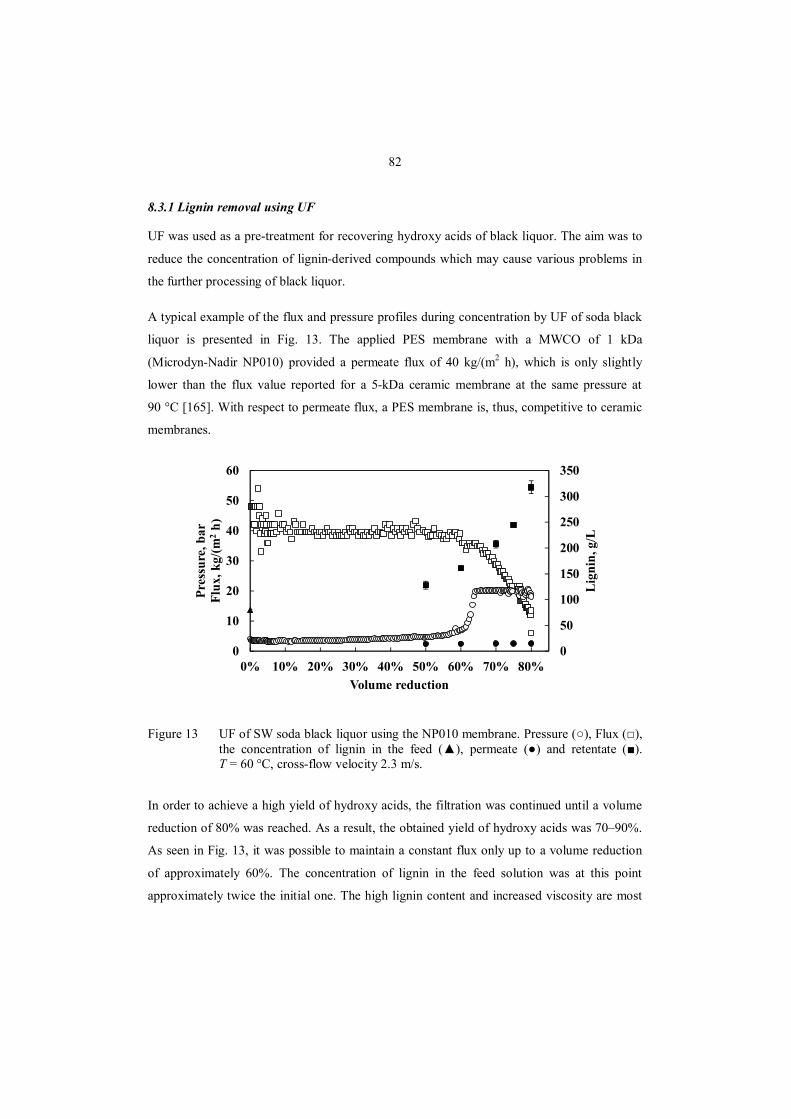
82
8.3.1 Lignin removal using UF
UF was used as a pre-treatment for recovering hydroxy acids of black liquor. The aim was to
reduce the concentration of lignin-derived compounds which may cause various problems in
the further processing of black liquor.
A typical example of the flux and pressure profiles during concentration by UF of soda black
liquor is presented in Fig. 13. The applied PES membrane with a MWCO of 1 kDa
(Microdyn-Nadir NP010) provided a permeate flux of 40 kg/(m2 h), which is only slightly
lower than the flux value reported for a 5-kDa ceramic membrane at the same pressure at
90 °C [165]. With respect to permeate flux, a PES membrane is, thus, competitive to ceramic
membranes.
Figure 13 UF of SW soda black liquor using the NP010 membrane. Pressure (○), Flux (□), the concentration of lignin in the feed (▲), permeate (●) and retentate (■). T = 60 °C, cross-flow velocity 2.3 m/s.
In order to achieve a high yield of hydroxy acids, the filtration was continued until a volume
reduction of 80% was reached. As a result, the obtained yield of hydroxy acids was 70–90%.
As seen in Fig. 13, it was possible to maintain a constant flux only up to a volume reduction
of approximately 60%. The concentration of lignin in the feed solution was at this point
approximately twice the initial one. The high lignin content and increased viscosity are most
0
50
100
150
200
250
300
350
0
10
20
30
40
50
60
0% 10% 20% 30% 40% 50% 60% 70% 80%
Lig
nin,
g/L
Pres
sure
, bar
Flux
, kg/
(m2
h)
Volume reduction
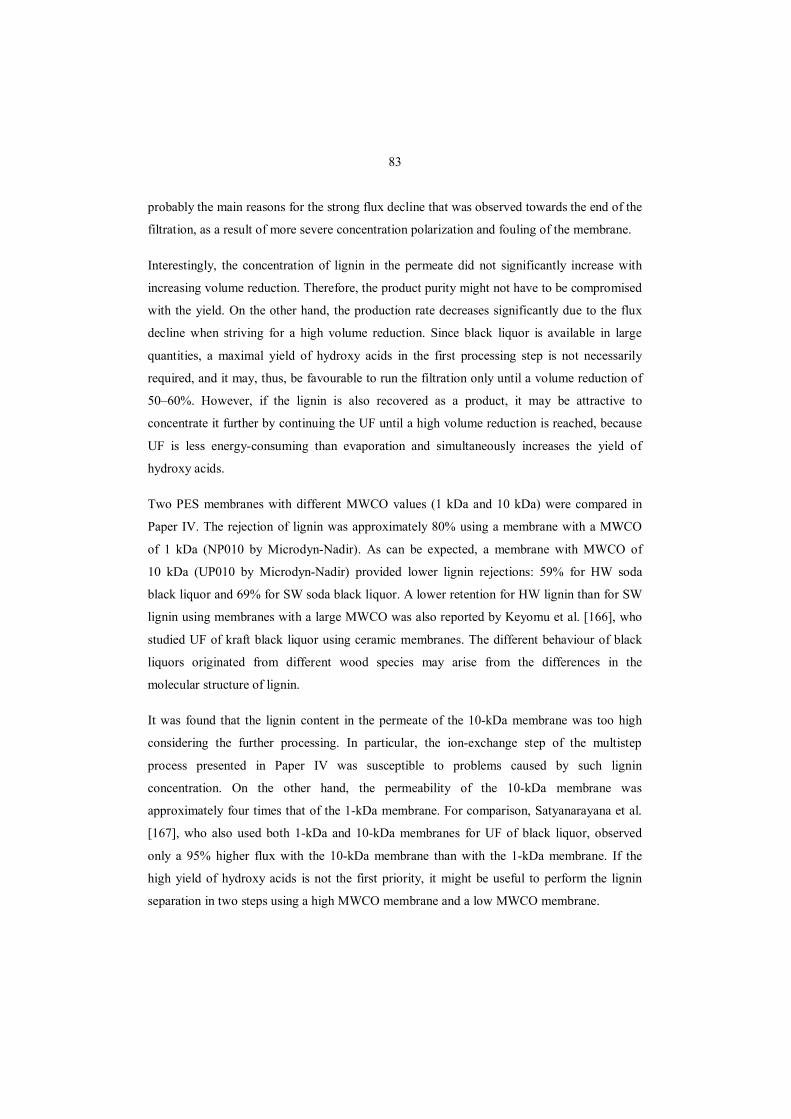
83
probably the main reasons for the strong flux decline that was observed towards the end of the
filtration, as a result of more severe concentration polarization and fouling of the membrane.
Interestingly, the concentration of lignin in the permeate did not significantly increase with
increasing volume reduction. Therefore, the product purity might not have to be compromised
with the yield. On the other hand, the production rate decreases significantly due to the flux
decline when striving for a high volume reduction. Since black liquor is available in large
quantities, a maximal yield of hydroxy acids in the first processing step is not necessarily
required, and it may, thus, be favourable to run the filtration only until a volume reduction of
50–60%. However, if the lignin is also recovered as a product, it may be attractive to
concentrate it further by continuing the UF until a high volume reduction is reached, because
UF is less energy-consuming than evaporation and simultaneously increases the yield of
hydroxy acids.
Two PES membranes with different MWCO values (1 kDa and 10 kDa) were compared in
Paper IV. The rejection of lignin was approximately 80% using a membrane with a MWCO
of 1 kDa (NP010 by Microdyn-Nadir). As can be expected, a membrane with MWCO of
10 kDa (UP010 by Microdyn-Nadir) provided lower lignin rejections: 59% for HW soda
black liquor and 69% for SW soda black liquor. A lower retention for HW lignin than for SW
lignin using membranes with a large MWCO was also reported by Keyomu et al. [166], who
studied UF of kraft black liquor using ceramic membranes. The different behaviour of black
liquors originated from different wood species may arise from the differences in the
molecular structure of lignin.
It was found that the lignin content in the permeate of the 10-kDa membrane was too high
considering the further processing. In particular, the ion-exchange step of the multistep
process presented in Paper IV was susceptible to problems caused by such lignin
concentration. On the other hand, the permeability of the 10-kDa membrane was
approximately four times that of the 1-kDa membrane. For comparison, Satyanarayana et al.
[167], who also used both 1-kDa and 10-kDa membranes for UF of black liquor, observed
only a 95% higher flux with the 10-kDa membrane than with the 1-kDa membrane. If the
high yield of hydroxy acids is not the first priority, it might be useful to perform the lignin
separation in two steps using a high MWCO membrane and a low MWCO membrane.

84
As a conclusion, UF using a 1-kDa membrane was found a very effective method for
removing lignin from soda black liquor. However, if a further reduction in the lignin
concentration is needed, precipitation can be considered. An example of the reduction of
lignin concentrations after subsequent membrane filtration and precipitation steps is shown in
Fig. 14. Precipitation using carbon dioxide and H2SO4 reduced the concentration of lignin in
ultrafiltered black liquor by 53%, when the final pH after the acid precipitation was 2.5. By
optimizing the precipitation process, the amount of precipitated lignin could be increased. The
residual lignin after UF consists of fragments with very small molecular sizes, and it is,
therefore, challenging to remove them without causing losses in the yield of hydroxy acids.
Figure 14 Concentration of lignin in SW soda black liquor after different process steps: UF using the NP010 membrane, carbonation (final pH 9), and sulphuric acid precipitation (final pH 2.5). The error bars show the deviation in the results of parallel samples.
8.3.2 Separation of NaOH and carboxylic acids using batch chromatography
In addition to the lignin removal, the separation of inorganic cooking chemicals is of major
importance in the recovery of hydroxy carboxylic acids from black liquor. Regarding the
chemical balance of the pulp mill, the cooking chemicals ought to be fully recovered from the
hydroxy acid side product stream. Furthermore, inorganics such as NaOH might be
problematic impurities in the final products.
In this work, SEC was found suitable for separating NaOH and sodium salts of hydroxy acids.
A SEC gel with a small exclusion limit (Sephadex G-10) was used. NaOH was more retained
than the salts of hydroxy acids because of its small molecular size. A complete separation
81.1
14.8 10.6 6.9
0
20
40
60
80
100
Feed UF Carbonation Acidification
Lig
nin,
g/L
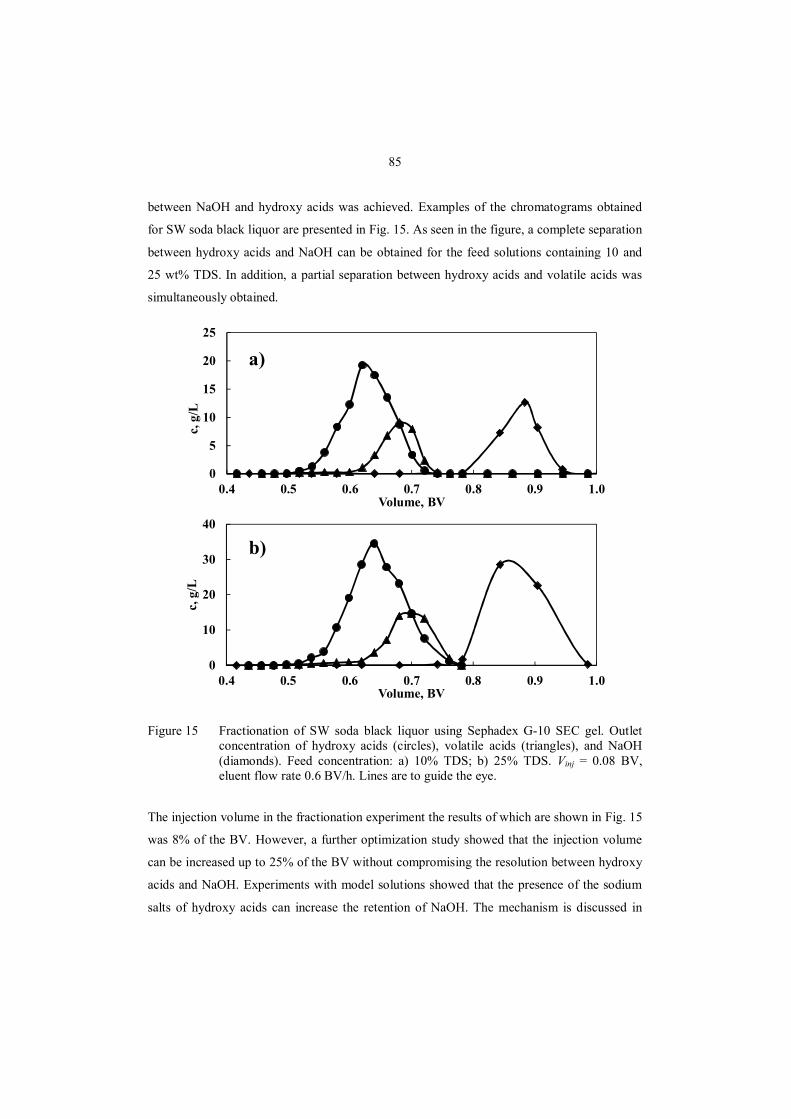
85
between NaOH and hydroxy acids was achieved. Examples of the chromatograms obtained
for SW soda black liquor are presented in Fig. 15. As seen in the figure, a complete separation
between hydroxy acids and NaOH can be obtained for the feed solutions containing 10 and
25 wt% TDS. In addition, a partial separation between hydroxy acids and volatile acids was
simultaneously obtained.
Figure 15 Fractionation of SW soda black liquor using Sephadex G-10 SEC gel. Outlet concentration of hydroxy acids (circles), volatile acids (triangles), and NaOH (diamonds). Feed concentration: a) 10% TDS; b) 25% TDS. Vinj = 0.08 BV, eluent flow rate 0.6 BV/h. Lines are to guide the eye.
The injection volume in the fractionation experiment the results of which are shown in Fig. 15
was 8% of the BV. However, a further optimization study showed that the injection volume
can be increased up to 25% of the BV without compromising the resolution between hydroxy
acids and NaOH. Experiments with model solutions showed that the presence of the sodium
salts of hydroxy acids can increase the retention of NaOH. The mechanism is discussed in
0
10
20
30
40
0.4 0.5 0.6 0.7 0.8 0.9 1.0
c, g
/L
Volume, BV
0
5
10
15
20
25
0.4 0.5 0.6 0.7 0.8 0.9 1.0
c, g
/L
Volume, BV
a)
b)
86
detail in Paper III. The same phenomenon in the separation of strong electrolytes using SEC
has been intensively studied by Davankov and co-workers [39, 168-171]. This interesting
separation mechanism makes it possible to use very large injection volumes and, thus, high
productivity can be achieved.
Different methods which have been earlier suggested for separating the inorganics from black
liquor include ion-exchange chromatography [83], cooling crystallization [123], and
electrodialysis [125]. SEC, which was used in this work, has advantages over all these
methods. When recovering hydroxy acids using ion-exchange chromatography, it is necessary
to first liberate the acids and convert NaOH to Na2SO4 using sulphuric acid, and sodium
sulphate can then be separated using chromatography [83]. In the work of Alén et al. [83],
two chromatographic separation steps are required because of incomplete separation. Cooling
crystallization also requires an acidification pre-treatment, since the method is sensitive
towards lignin [123]. Furthermore, about 30% of the inorganics remained in the black liquor
after crystallization in the work of Niemi et al. [123]. Electrodialysis suffers from fouling due
to lignin [125]. In contrast, SEC chromatography required no acidification of black liquor and
complete separation between hydroxy acid salts and NaOH was obtained in a single
separation step. Moreover, fouling did not appear to deteriorate the separation in a series of
more than 40 successive injections (see Paper III).
8.3.3 Separation of NaOH and carboxylic acids using a continuous SMB process
Separation of NaOH and hydroxy acids of soda black liquor was tested also using a
continuous SMB process. Four test runs were performed using the flow parameters presented
in Table 3. The corresponding operation parameters m2 and m3 (see Eq. 22) for each run are
illustrated in Fig. 16.
The average concentrations of NaOH, acids and lignin in the outlet streams during each
switch are illustrated in Fig. 17. As seen in the figure, steady-state was reached in each run.
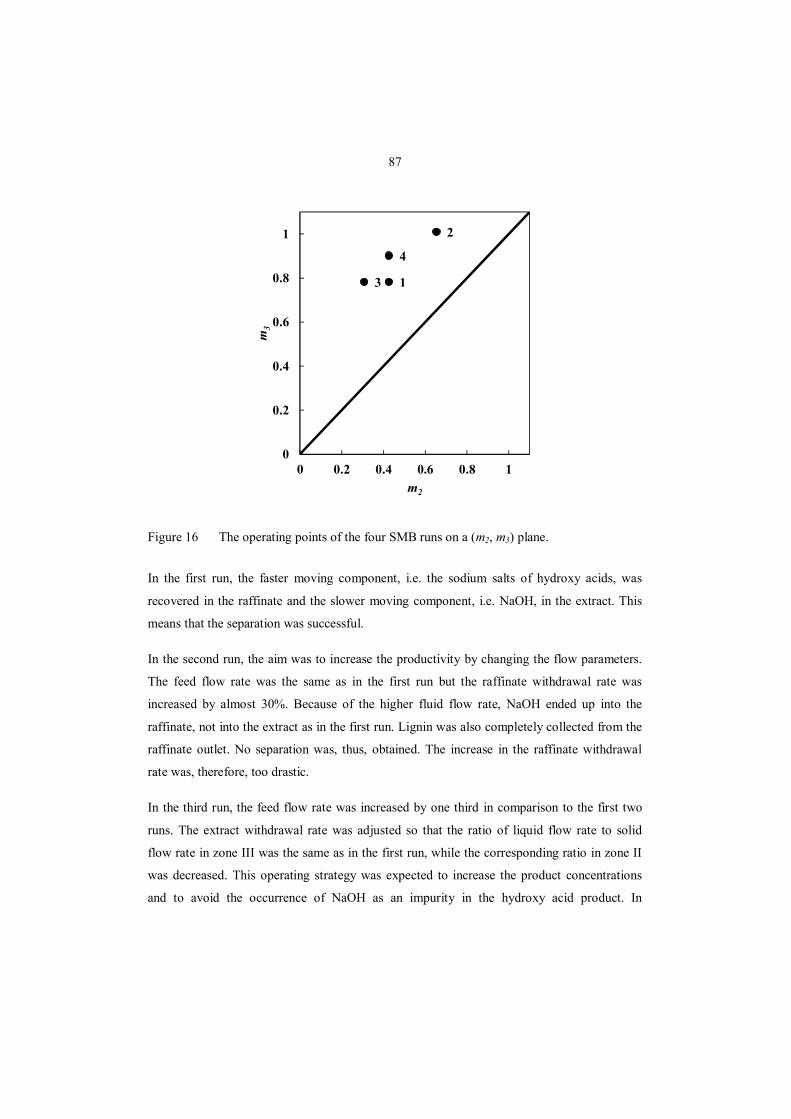
87
Figure 16 The operating points of the four SMB runs on a (m2, m3) plane.
In the first run, the faster moving component, i.e. the sodium salts of hydroxy acids, was
recovered in the raffinate and the slower moving component, i.e. NaOH, in the extract. This
means that the separation was successful.
In the second run, the aim was to increase the productivity by changing the flow parameters.
The feed flow rate was the same as in the first run but the raffinate withdrawal rate was
increased by almost 30%. Because of the higher fluid flow rate, NaOH ended up into the
raffinate, not into the extract as in the first run. Lignin was also completely collected from the
raffinate outlet. No separation was, thus, obtained. The increase in the raffinate withdrawal
rate was, therefore, too drastic.
In the third run, the feed flow rate was increased by one third in comparison to the first two
runs. The extract withdrawal rate was adjusted so that the ratio of liquid flow rate to solid
flow rate in zone III was the same as in the first run, while the corresponding ratio in zone II
was decreased. This operating strategy was expected to increase the product concentrations
and to avoid the occurrence of NaOH as an impurity in the hydroxy acid product. In
1
2
3
4
0
0.2
0.4
0.6
0.8
1
0 0.2 0.4 0.6 0.8 1
m3
m2
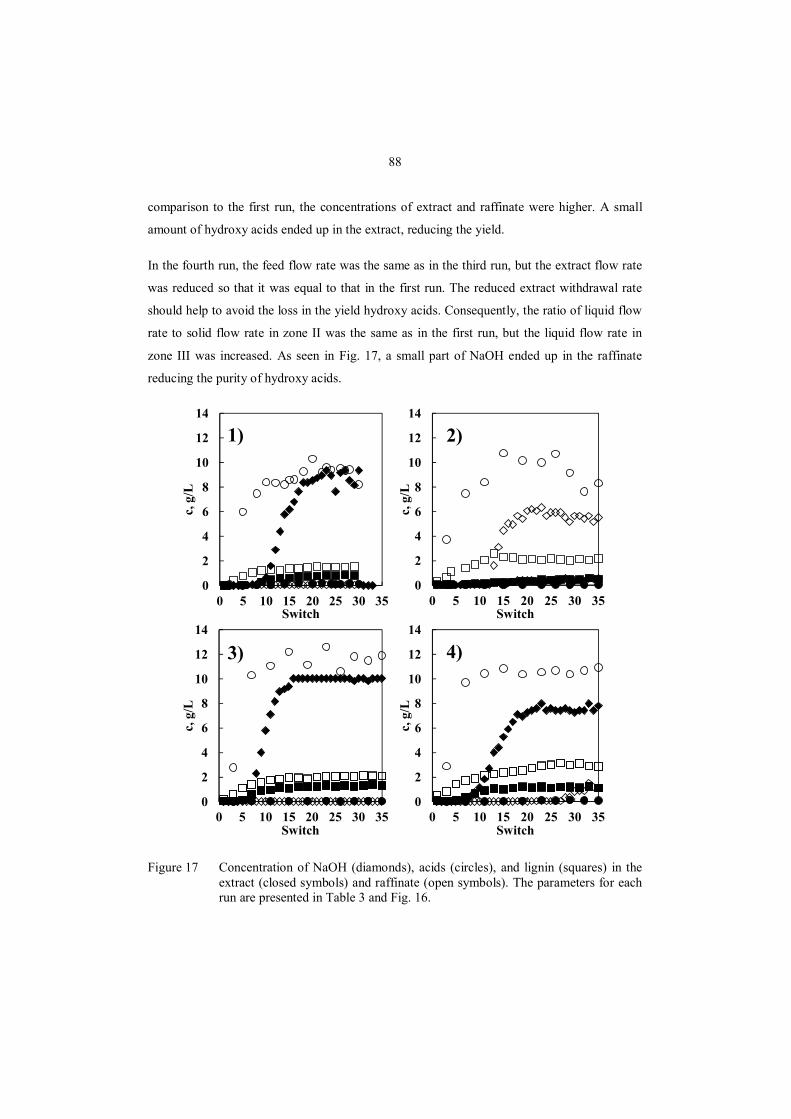
88
comparison to the first run, the concentrations of extract and raffinate were higher. A small
amount of hydroxy acids ended up in the extract, reducing the yield.
In the fourth run, the feed flow rate was the same as in the third run, but the extract flow rate
was reduced so that it was equal to that in the first run. The reduced extract withdrawal rate
should help to avoid the loss in the yield hydroxy acids. Consequently, the ratio of liquid flow
rate to solid flow rate in zone II was the same as in the first run, but the liquid flow rate in
zone III was increased. As seen in Fig. 17, a small part of NaOH ended up in the raffinate
reducing the purity of hydroxy acids.
Figure 17 Concentration of NaOH (diamonds), acids (circles), and lignin (squares) in the extract (closed symbols) and raffinate (open symbols). The parameters for each run are presented in Table 3 and Fig. 16.
0
2
4
6
8
10
12
14
0 5 10 15 20 25 30 35
c, g
/L
Switch
0
2
4
6
8
10
12
14
0 5 10 15 20 25 30 35
c, g
/L
Switch
0
2
4
6
8
10
12
14
0 5 10 15 20 25 30 35
c, g
/L
Switch
0
2
4
6
8
10
12
14
0 5 10 15 20 25 30 35
c, g
/L
Switch
1) 2)
3) 4)
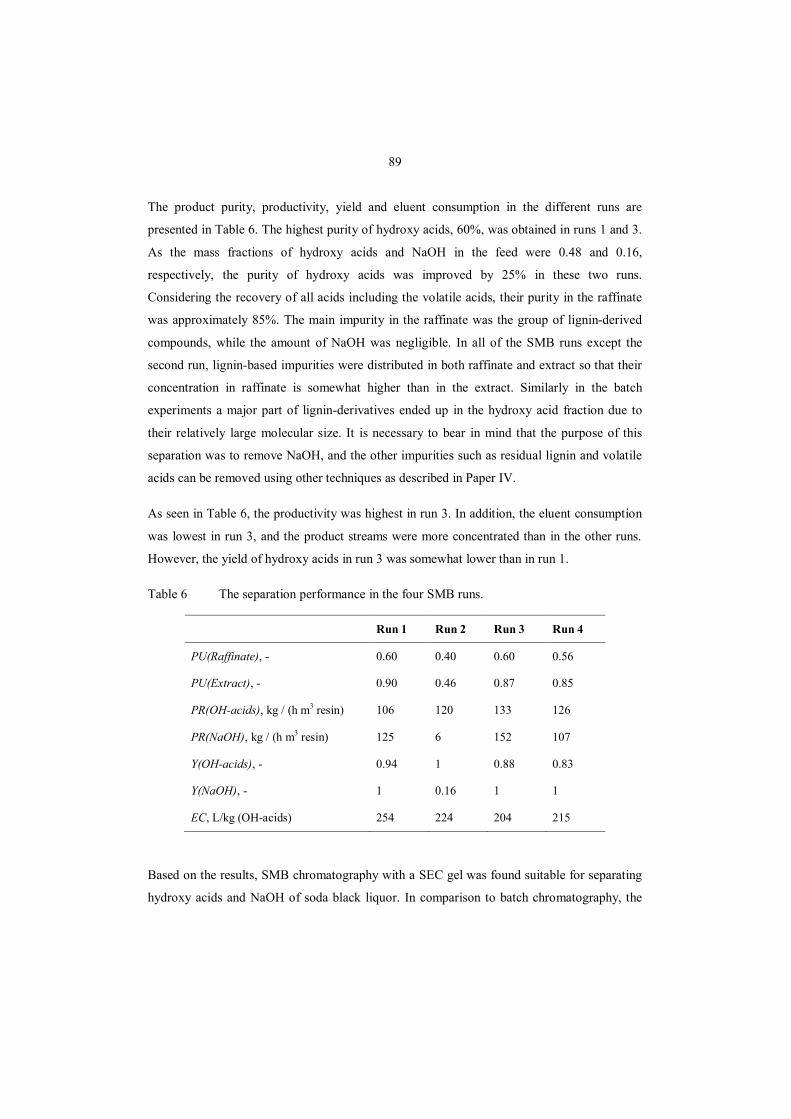
89
The product purity, productivity, yield and eluent consumption in the different runs are
presented in Table 6. The highest purity of hydroxy acids, 60%, was obtained in runs 1 and 3.
As the mass fractions of hydroxy acids and NaOH in the feed were 0.48 and 0.16,
respectively, the purity of hydroxy acids was improved by 25% in these two runs.
Considering the recovery of all acids including the volatile acids, their purity in the raffinate
was approximately 85%. The main impurity in the raffinate was the group of lignin-derived
compounds, while the amount of NaOH was negligible. In all of the SMB runs except the
second run, lignin-based impurities were distributed in both raffinate and extract so that their
concentration in raffinate is somewhat higher than in the extract. Similarly in the batch
experiments a major part of lignin-derivatives ended up in the hydroxy acid fraction due to
their relatively large molecular size. It is necessary to bear in mind that the purpose of this
separation was to remove NaOH, and the other impurities such as residual lignin and volatile
acids can be removed using other techniques as described in Paper IV.
As seen in Table 6, the productivity was highest in run 3. In addition, the eluent consumption
was lowest in run 3, and the product streams were more concentrated than in the other runs.
However, the yield of hydroxy acids in run 3 was somewhat lower than in run 1.
Table 6 The separation performance in the four SMB runs.
Run 1 Run 2 Run 3 Run 4
PU(Raffinate), - 0.60 0.40 0.60 0.56
PU(Extract), - 0.90 0.46 0.87 0.85
PR(OH-acids), kg / (h m3 resin) 106 120 133 126
PR(NaOH), kg / (h m3 resin) 125 6 152 107
Y(OH-acids), - 0.94 1 0.88 0.83
Y(NaOH), - 1 0.16 1 1
EC, L/kg (OH-acids) 254 224 204 215
Based on the results, SMB chromatography with a SEC gel was found suitable for separating
hydroxy acids and NaOH of soda black liquor. In comparison to batch chromatography, the
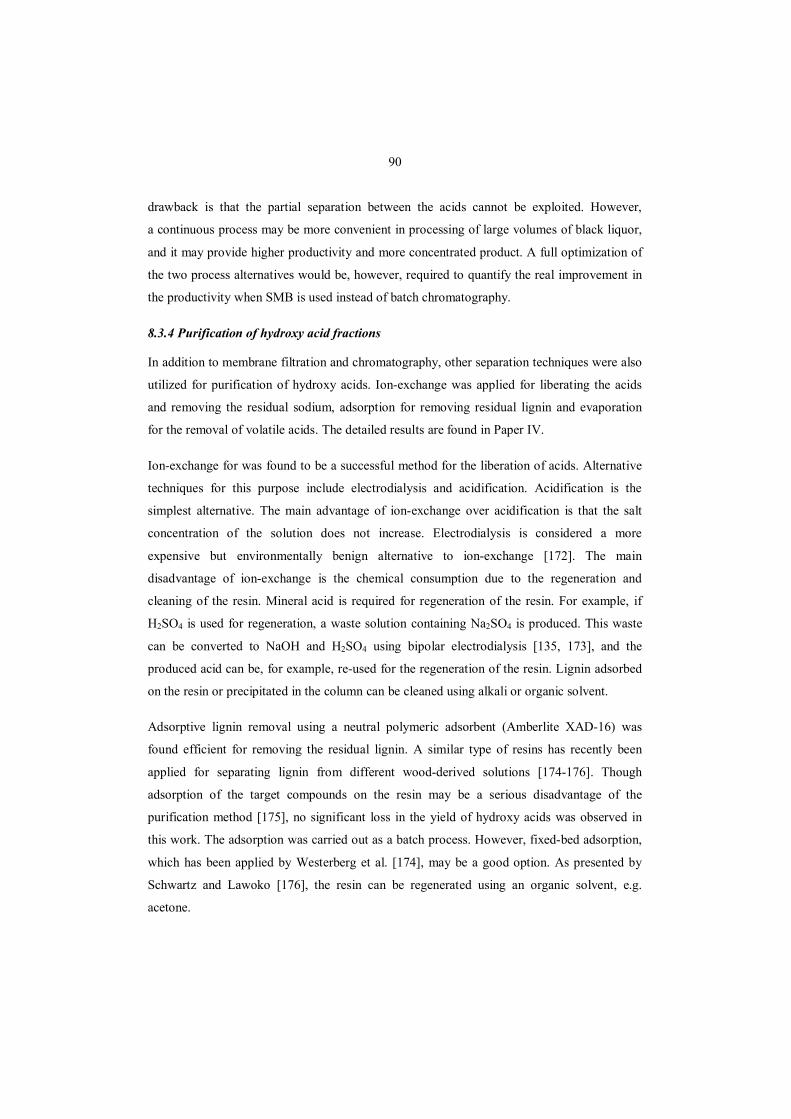
90
drawback is that the partial separation between the acids cannot be exploited. However,
a continuous process may be more convenient in processing of large volumes of black liquor,
and it may provide higher productivity and more concentrated product. A full optimization of
the two process alternatives would be, however, required to quantify the real improvement in
the productivity when SMB is used instead of batch chromatography.
8.3.4 Purification of hydroxy acid fractions
In addition to membrane filtration and chromatography, other separation techniques were also
utilized for purification of hydroxy acids. Ion-exchange was applied for liberating the acids
and removing the residual sodium, adsorption for removing residual lignin and evaporation
for the removal of volatile acids. The detailed results are found in Paper IV.
Ion-exchange for was found to be a successful method for the liberation of acids. Alternative
techniques for this purpose include electrodialysis and acidification. Acidification is the
simplest alternative. The main advantage of ion-exchange over acidification is that the salt
concentration of the solution does not increase. Electrodialysis is considered a more
expensive but environmentally benign alternative to ion-exchange [172]. The main
disadvantage of ion-exchange is the chemical consumption due to the regeneration and
cleaning of the resin. Mineral acid is required for regeneration of the resin. For example, if
H2SO4 is used for regeneration, a waste solution containing Na2SO4 is produced. This waste
can be converted to NaOH and H2SO4 using bipolar electrodialysis [135, 173], and the
produced acid can be, for example, re-used for the regeneration of the resin. Lignin adsorbed
on the resin or precipitated in the column can be cleaned using alkali or organic solvent.
Adsorptive lignin removal using a neutral polymeric adsorbent (Amberlite XAD-16) was
found efficient for removing the residual lignin. A similar type of resins has recently been
applied for separating lignin from different wood-derived solutions [174-176]. Though
adsorption of the target compounds on the resin may be a serious disadvantage of the
purification method [175], no significant loss in the yield of hydroxy acids was observed in
this work. The adsorption was carried out as a batch process. However, fixed-bed adsorption,
which has been applied by Westerberg et al. [174], may be a good option. As presented by
Schwartz and Lawoko [176], the resin can be regenerated using an organic solvent, e.g.
acetone.

91
The concentration of volatile acids in the hydroxy acid fractions was reduced by evaporation.
Volatile acids can be removed without losing hydroxy acids, since the difference in the
vapour pressures is relatively large (see Table 7). As proposed by Alén and Sjöström [177,
178], distillation is a suitable method for partial fractionation of the acids of black liquor.
However, evaporation and distillation are energy-intensive methods, and therefore other
methods for removing the volatile acids and fractionating the hydroxy acids may be more
attractive. These methods are discussed in the following chapter.
8.4 Prospective advanced separation processes
The separation tasks discussed above are basically pseudo-binary separations, in which one
compound was removed or a group of compounds was recovered as a mixture. Combination
of membrane filtration with chromatographic separation is, however, an attractive technique
also for multicomponent separation. As an example, the possibilities for utilizing these
techniques for fractionation of hydroxy acids are discussed in this chapter.
The main carboxylic acids of black liquor from soda or kraft cooking are listed in Table 7.
The separation of lignin and inorganics from black liquor using UF and SEC resulted in a
mixture of these acids. Hydroxy acid mixtures may be used as such for co-polymerization
[82]. Nevertheless, more added value may be gained by isolating single hydroxy acids in high
purity. The acids present in black liquor are, however, challenging to fractionate because their
properties are very similar with each other (see Table 7). Different separation techniques can
be considered.
Alén and Sjöström [177, 178] used distillation to fractionate the hydroxy acids recovered
from black liquor. The purities obtained were 73% for xyloisosaccharinic acid (XISA) and
about 50% for glucoisosaccharinic acid (GISA). In addition, a mixture of glycolic, lactic and
2-hydroxybutanoic (HBA) acids was obtained. These small hydroxy acids were found
difficult to separate by distillation due to their close boiling points and instability during
heating. The low purity of the products makes distillation an unfavourable separation
technique for the fractionation of hydroxy acids. Furthermore, distillation is an energy-
intensive unit operation.
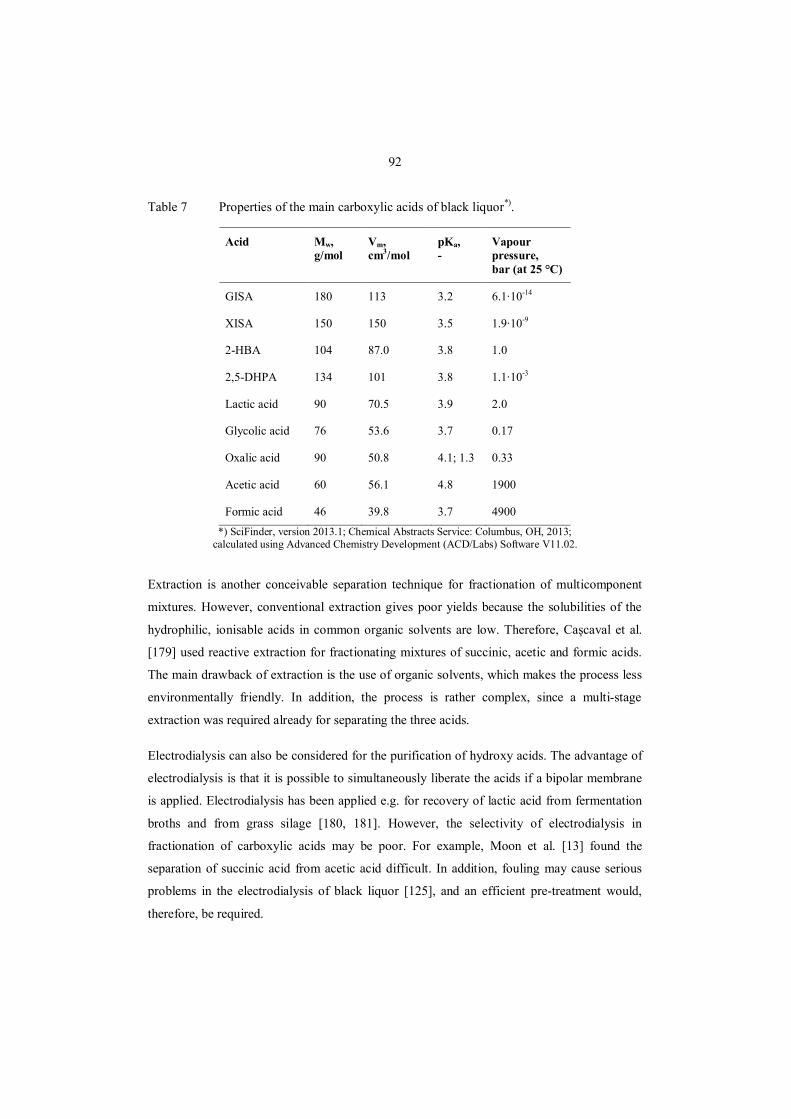
92
Table 7 Properties of the main carboxylic acids of black liquor*).
Acid Mw, g/mol
Vm, cm3/mol
pKa, -
Vapour pressure, bar (at 25 °C)
GISA 180 113 3.2 6.1·10-14
XISA 150 150 3.5 1.9·10-9
2-HBA 104 87.0 3.8 1.0
2,5-DHPA 134 101 3.8 1.1·10-3
Lactic acid 90 70.5 3.9 2.0
Glycolic acid 76 53.6 3.7 0.17
Oxalic acid 90 50.8 4.1; 1.3 0.33
Acetic acid 60 56.1 4.8 1900
Formic acid 46 39.8 3.7 4900 *) SciFinder, version 2013.1; Chemical Abstracts Service: Columbus, OH, 2013;
calculated using Advanced Chemistry Development (ACD/Labs) Software V11.02.
Extraction is another conceivable separation technique for fractionation of multicomponent
mixtures. However, conventional extraction gives poor yields because the solubilities of the
hydrophilic, ionisable acids in common organic solvents are low. Therefore, Caşcaval et al.
[179] used reactive extraction for fractionating mixtures of succinic, acetic and formic acids.
The main drawback of extraction is the use of organic solvents, which makes the process less
environmentally friendly. In addition, the process is rather complex, since a multi-stage
extraction was required already for separating the three acids.
Electrodialysis can also be considered for the purification of hydroxy acids. The advantage of
electrodialysis is that it is possible to simultaneously liberate the acids if a bipolar membrane
is applied. Electrodialysis has been applied e.g. for recovery of lactic acid from fermentation
broths and from grass silage [180, 181]. However, the selectivity of electrodialysis in
fractionation of carboxylic acids may be poor. For example, Moon et al. [13] found the
separation of succinic acid from acetic acid difficult. In addition, fouling may cause serious
problems in the electrodialysis of black liquor [125], and an efficient pre-treatment would,
therefore, be required.
93
Chromatographic separation and NF are potential separation methods also for purification of
individual hydroxy acids. Prospective fractionation and purification processes are discussed in
this section.
8.4.1 NF for fractionation of hydroxy acids
NF has been found an applicable separation method for fractionation of organic acids
including hydroxy acids. For example, Kang and Chang [72] used NF for separating sodium
succinate from a mixture containing formate, acetate and lactate. Therefore, it is a promising
technique also for the production of pure acids from black liquor.
The separation of acids by NF is based on the differences in molecular sizes and charges. As
an assumption, acids with a large molecular size or multiple carboxylic groups are more
retained by an NF membrane than small monocarboxylic acids. The selectivity of the
separation depends, however, on pH and on the composition of the solution.
Effect of pH on NF is rather complicated. The topic was recently reviewed by Luo and Wan
[95]. In summary, the main factors that affect are the charge of membrane, the charge of
compounds in the solution, membrane swelling, fouling, and concentration polarisation. In the
case of ionisable compounds such as carboxylic acids, the charge effects are of major
importance.
Carboxylic acids dissociate as pH increases above their pKa. Consequently, the osmotic
pressure of the solution is higher at high pH and thus a higher pressure is required to obtain
the target flux. A change in pH does not affect only the flux but also the rejection of solutes.
NF membranes are typically negatively charged in neutral and alkaline conditions. When the
pH is above the isoelectric point of the membrane, negative anions will be repelled by the
negatively charged membrane. To maintain electroneutrality, cations cannot permeate either if
the permeation of anions is restricted. Due to this Donnan effect, the retention of acids is
likely to increase with increasing pH. Examples of that can be found in literature. For
example, Han and Cheryan [182] showed that the retention of acetate on different NF
membranes depends strongly on pH. However, they observed that pH did not affect above
pH 5, e.g. when the acid was completely dissociated. More recently, Zhou et al. [105] studied
the separation of acetic acid from monosaccharides as a function of pH using Desal 5 DK (GE
94
Osmonics) membrane. They observed an increase from 2.8% to 95% in the retention of acetic
acid when pH increased from 2.9 to 9.9. The increase was linear below pH 7. Freger et al.
[183] studied the effect of pH and salt concentration on the retention of lactic acid. They
observed the highest rejection of lactic acid at neutral pH.
On the other hand, the Donnan effect may improve the separation selectivity, especially in the
separation between monovalent and multivalent ions but also in the separation of ions with
different molecular sizes. Therefore, it might be advantageous to carry out the NF of hydroxy
acids mixtures at neutral pH rather than under acidic conditions. For example, the selectivity
of the Desal 5 DK membrane in the fractionation of hydroxy acids has been found to improve
when pH increased from 2 to 6: the retention of XISA increased while the negative retention
of formic acid was strengthened [124].
In addition to pH, interactions between different carboxylic acids may affect their retention
[184, 185]. Laufenberg et al. [185] found that multicomponent effects may play a major role
in the separation of carboxylic acids. Consequently, the feed composition, which is
determined by the wood species, pulping process and pre-treatment, may have a substantial
influence on fractionation of hydroxy acids by NF.
The NF of hydroxy acids from black liquor most probably requires a pre-treatment to reduce
the lignin concentration and to adjust the pH, because most NF membranes are somewhat
susceptible to fouling and their pH range may be limited. Removal of inorganic salts may also
be necessary, especially if the lignin removal and pH adjustment is done using a mineral acid.
This is because the presence of salts increases the osmotic pressure of the solution.
Furthermore, a highly concentrated salt may reduce the retention of compounds such as acids
and sugars by increasing the membrane pore size and simultaneously decreasing the size of
solutes due to their dehydration [96, 183, 186].
When the operating conditions are properly chosen, NF can be a feasible method for the
fractionation of hydroxy acids. However, insufficient separation selectivity may be
encountered when using NF for separation of compounds with such a small difference in their
molecular sizes because the membranes often possess a wide pore-size distribution [124].
Application of NF cascades has been proposed for improving the separation [187]. Since
membrane filtration is inherently a binary separation process, the fractionation of

95
a multicomponent acid mixture using NF might, however, require numerous process steps and
complicated cascade arrangements. Therefore, considering the production of hydroxy acids in
high purity, a combination of NF and chromatographic purification could be a more attractive
alternative than use of NF only.
8.4.2 Chromatographic fractionation of hydroxy acids
Fractionation of hydroxy acids could also be made using chromatography. If SEC is applied
for separating NaOH, partial fractionation of hydroxy acids is obtained, as discussed in Papers
III–IV. However, the resolution was poor even when a relatively low column loading of
0.08 BV was applied. Therefore, some other chromatographic separation technique might be
preferable for the fractionation of hydroxy acids.
Chromatographic separation of hydroxy carboxylic acids using anion-exchange resins has
been studied already in the 1960s [188]. Anion-exchange chromatography has also been
found applicable for the determination of carboxylic acids in black liquors [189]. The problem
with anion-exchange resins is that they are easily fouled by organic matter [190], and thus
an effective lignin removal pre-treatment is necessary. In addition, to obtain sufficient
separation selectivity, it may be necessary to use a buffer solution with organic modifiers as
eluent.
Cation-exchange resins could also be applicable for fractionation of hydroxy acids. In
comparison to anion-exchange resins, cation-exchange resins are typically less expensive and
more resistant to fouling. Resins with different ionic forms may be considered. For example,
Ca2+ ions may form weak complexes of different strength with hydroxy acids and thus make
their separation possible. However, high sodium content of black liquor makes the use of Ca2+
form resins unfavourable. Therefore, it might be necessary to remove the sodium using ion-
exchange or electrodialysis prior to the chromatographic separation with a Ca2+ form resin.
Alternatively, a resin in Na+ or H+ form could be selected. Alén et al. [83, 191] applied a SAC
resin in Na+ form for separating hydroxy acids from black liquor. The purpose of their work
was, however, to separate hydroxy acids from sodium sulphate rather than to fractionate the
acids. Nevertheless, partial separation between hydroxy acids and volatile acids was also
obtained.

96
Neutral polymeric resins can also be applied in chromatographic separation. Recently, Nam et
al. [192, 193] studied the adsorption of acids (succinic, lactic, formic and acetic acid) on
a neutral PS-DVB resin and found it suitable for the separation of succinic acid from lactic
acid using SMB chromatography [73]. Lee et al. [194] separated lactic acid from acetic acid
using SMB chromatography with a poly(4-vinylpyridine) resin.
In the preliminary tests done in this work, SAC resins were found promising for fractionating
the hydroxy acids of ultrafiltered soda black liquor, whereas the use of WAC resins turned out
less successful (see Fig. 18). In particular, when a WAC resin in a monovalent ion form (Na+)
was used, no fractionation occurred. Also neutral Amberlite XAD polymeric resins showed
insufficient selectivity (data not shown). It should be noted, however, that the ultrafiltered
soda black liquor that was used in the experiments contains lignin and sodium hydroxide as
main impurities. Pre-treatment of black liquor to reduce the concentrations of lignin and
inorganic salts could possibly improve the separation.
Based on the literature review and the results of the preliminary tests, it is thus concluded that
chromatographic separation is a promising technique for fractionation of multicomponent acid
mixtures. However, multiple separation steps may be required to obtain a sufficient purity.
The drawback of chromatographic separation is dilution of the product, and possibly the need
for using eluents other than water. Membrane filtration, RO in particular, may be a useful
technique for removing the solvent to obtain a more concentrated end-product.

97
Figure 18 Fractionation of SW soda black liquor (pre-treated by UF, 10% TDS) using a) SAC resin (Finex CS16GC) in Ca2+ form, b) SAC resin (Finex CS16GC) in Ba2+ form, c) WAC resin (Finex CA16GC) in Ca2+ form, d) WAC resin (Finex CA16GC) in Na+ form. Vinj = 0.08 BV, eluent flow rate 0.6 BV/h. The acids are in their Na salt form.
0
1
2
3
0.0 0.5 1.0 1.5
c, g
/L
V, BV
0
1
2
3
0.0 0.5 1.0 1.5
c, g
/L
V, BV
a)
b)
0
1
2
3
0.0 0.5 1.0 1.5
c, g
/L
V, BV
0
2
4
6
0.0 0.5 1.0 1.5
c, g
/L
V, BV
Formic acid Acetic acidGISA XISA2,5-DHPA 2-HBALactic acid Glycolic acid
c)
d)
98
9 CONCLUSIONS
Combining various separation techniques may be essential in the fractionation of complex
multicomponent solutions such as biomass hydrolysates. It is sometimes a requisite for
recovering the target compounds in the desired purity, but also in many cases it may improve
the production rate and reduce the chemical consumption.
In this work, the potential benefits of combining preparative chromatography with membrane
filtration in biorefinery applications were investigated. Based on the results, it can be
concluded that the abovementioned combination is beneficial in recovering compounds from
biomass hydrolysates or black liquor. Different ways of combining these two separation
methods were considered. Firstly, a hybrid separation process, SSR-SR, was found to
simultaneously improve the productivity and reduce the eluent consumption in comparison to
conventional chromatographic separation processes. Secondly, a tandem separation process
based on UF and SEC was found successful for fractionating black liquor without using
additional chemicals, which has not been reported before. However, other separation and
purification techniques such as adsorption and ion-exchange were also needed to obtain a
high-purity product.
Another research question was whether the use of recycling chromatography, mixed-feed SSR
chromatography in particular, would be advantageous in comparison to the conventional,
widely-applied batch chromatography. Based on the example cases studied, SSR
chromatography should be considered as an alternative for a batch process when designing
chromatographic separation processes for difficult separation tasks. The benefit brought by
recycling depends, however, on the isotherms and column efficiency. When the separation
selectivity is good, which was the case in separation of NaOH and hydroxy acids from black
liquor, recycling is not necessarily required, since large column loadings can be used and high
productivity is obtained also using the simple batch mode. Since the feed volumes treated in
the separation of valuable compounds from black liquor can be high, continuous SMB process
may be the method of choice. On the other hand, in the recovery of high-value products such
as rare sugars at high purity, recycling chromatography can be highly advantageous. One of
the main benefits of SSR is that since a high purity can be obtained even when the column
efficiency and separation selectivity is low, it is possible to use low-cost separation materials.
99
As a conclusion, the combining of different separation techniques has been proven to be
a highly useful strategy for the development of techno-economically feasible processes for
recovering valuable compounds in biorefineries. Membrane filtration and preparative
chromatography are promising methods for various biorefinery applications because they
offer good separation selectivity with relatively low consumption of energy and chemicals.
The selection of the most advantageous process concept, however, requires understanding of
the separation mechanisms. In addition, phenomena such as fouling and ageing of separation
materials are important topics of research, since new, fouling-resistant and highly stable
separation materials may be required in the harsh process conditions which are typical in
biorefinery environment.
100
REFERENCES
1 Carneiro, P. and Ferreira, P., The economic, environmental and strategic value of biomass. Renew. Energ. 44(2012), 17-22.
2 Schlosser, Š. and Blahušiak, M., Biorefinery for production of chemicals, energy and fuels. Elektroenergetika 4(2011), 8-16.
3 Hämäläinen, S., Näyhä, A. and Pesonen, H., Forest biorefineries – A business opportunity for the Finnish forest cluster. J. Clean. Prod. 19(2011), 1884-1891.
4 Erb, K., Haberl, H. and Plutzar, C., Dependency of global primary bioenergy crop potentials in 2050 on food systems, yields, biodiversity conservation and political stability. Energ. Policy 47(2012), 260-269.
5 Tilman, D., Socolow, R., Foley, J.A., Hill, J., Larson, E., Lynd, L., Pacala, S., Reilly, J., Searchinger, T., Somerville, C. and Williams, R., Beneficial biofuels – The food, energy, and environment trilemma Science 325(2009), 270-271.
6 Huang, H., Ramaswamy, S., Al-Dajani, W., Tschirner, U. and Cairncross, R.A., Effect of biomass species and plant size on cellulosic ethanol: A comparative process and economic analysis. Biomass Bioenergy 33(2009), 234-246.
7 Wright, M. and Brown, R.C., Establishing the optimal sizes of different kinds of biorefineries. Biofuels, Bioprod. Biorefin. 1(2007), 191-200.
8 Sanders, J.P.M., Clark, J.H., Harmsen, G.J., Heeres, H.J., Heijnen, J.J., Kersten, S.R.A., van Swaaij, W.P.M. and Moulijn, J.A., Process intensification in the future production of base chemicals from biomass. Chem. Eng. Process. 51(2012), 117-136.
9 Corma, A., Iborra, S. and Velty, A., Chemical routes for the transformation of biomass into chemicals. Chem. Rev. 107(2007), 2411-2502.
10 Kamm, B., Gruber, P.R. and Kamm, M., Biorefineries – Industrial Processes and Products, in: Ullmann's Encyclopedia of Industrial Chemistry, Wiley-VCH, Weinheim, Germany, 2012.
11 Top value added chemicals from Biomass Volume I – Results of screening for potential candidates from sugars and synthesis gas. Werpy, T. and Petersen, G. (Eds.), U.S Department of Energy, Oak Ridge, TN, USA, 2004.
12 Hytönen, E. and Stuart, P.R., Integrating bioethanol production into an integrated pulp and paper mill: techno-economic assessment. Pulp Pap. Canada 4(2009), 25-32.
13 Moon, P.J., Parulekar, S.J. and Tsai, S., Competitive anion transport in desalting of mixtures of organic acids by batch electrodialysis. J. Membr. Sci. 141(1998), 75-89.
101
14 Koivula, E., Kallioinen, M., Preis, S., Testova, L., Sixta, H. and Mänttäri, M., Evaluation of various pretreatment methods to manage fouling in ultrafiltration of wood hydrolysates. Sep. Purif. Technol. 83(2011), 50-56.
15 Alén, R., Principles of biorefining, in: Papermaking Science and Technology, Book 20: Biorefining of Forest Resources, Alén, R. (Ed.), Paper Engineers’ Association/Paperi ja Puu Oy, Helsinki, Finland, 2011.
16 Taherzadeh, M.J. and Karimi, K., Acid-based hydrolysis processes for ethanol from lignocellulosic materials: A review. BioResources 2(2007), 472-499.
17 Menon, V. and Rao, M., Trends in bioconversion of lignocellulose: Biofuels, platform chemicals & biorefinery concept. Prog. Energ. Combust. 38(2012), 522-550.
18 Murthy, G.S., Sridhar, S., Shyam Sunder, M., Shankaraiah, B. and Ramakrishna, M., Concentration of xylose reaction liquor by nanofiltration for the production of xylitol sugar alcohol. Sep. Purif. Technol. 44(2005), 221-228.
19 Kochergin, V. and Kearney, M., Existing biorefinery operations that benefit from fractal-based process intensification. Appl. Biochem. Biotechnol. 130(2006), 349-360.
20 He, Y., Bagley, D.M., Leung, K.T., Liss, S.N. and Liao, B., Recent advances in membrane technologies for biorefining and bioenergy production. Biotechnol. Adv. 30(2012), 817-858.
21 Abels, C., Carstensen, F. and Wessling, M., Membrane processes in biorefinery applications. J. Membr. Sci. 444(2013), 285-317.
22 Sainio, T. and Kaspereit, M., Analysis of steady state recycling chromatography using equilibrium theory. Sep. Purif. Technol. 66(2009), 9-18.
23 Kaspereit, M. and Sainio, T., Simplified design of steady-state recycling chromatography under ideal and nonideal conditions. Chem. Eng. Sci. 66(2011), 5428-5438.
24 Siitonen, J., Sainio, T. and Kaspereit, M., Theoretical analysis of steady state recycling chromatography with solvent removal. Sep. Purif. Technol. 78(2011), 21-32.
25 Guiochon, G., Felinger, A., Shirazi, D.G. and Katti, A.M., Fundamentals of Preparative and Nonlinear Chromatography. Elsevier Inc., San Diego, CA, 2006.
26 Heinonen, J. and Sainio, T., Chromatographic recovery of monosaccharides for the production of bioethanol from wood. Ind. Eng. Chem. Res. 49(2010), 2907-2915.
27 Saari, P., Heikkilä, H. and Hurme, M., Adsorption equilibria of arabinose, fructose, galactose, glucose, mannose, rhamnose, sucrose, and xylose on ion-exchange resins. J. Chem. Eng. Data 55(2010), 3462-3467.
102
28 DeSilva, F.J., Essentials of ion exchange. 25th Annual WQA Conference, Resin Tech, New West Berlin, NJ, USA, March 17, 1999.
29 Schmidt, W., Synthetic Inorganic Ion Exchange Materials, in: Ion Exchange Technology I, Dr., I. and Luqman, M. (Eds.), Springer, Netherlands, 2012.
30 Park, J., Structure, Synthesis, and General Properties of Ion Exchangers, in: Ion Exchange Technology I, Dr., I. and Luqman, M. (Eds.), Springer, Netherlands, 2012.
31 Angyal, S.J., Complex formation between sugars and metal ions. Pure Appl. Chem. 35(1973), 131-146.
32 Hagel, L. and Haneskog, L., Size-exclusion Chromatography, in: eLS, John Wiley & Sons, Ltd, 2001.
33 Mori, S. and Barth, H.G., Size Exclusion Chromatography. Springer, Berlin, Germany, 1999.
34 Williams, A. and Hagel, L., Size Exclusion for Analysis and Purification of Aqueous Macromolecules, in: Column Handbook for Size Exclusion Chromatography, Wu, C. (Ed.), Academic Press, San Diego, CA, USA, 1999.
35 Neddermeyer, P.A. and Rogers, L.B., Gel filtration behavior of inorganic salts. Anal. Chem. 40(1968), 755-762.
36 Saunders, D.L. and Pecsok, R.L., Calculation of distribution coefficients in inorganic gel chromatography. Anal. Chem. 40(1968), 44-48.
37 Huck, C.W. and Bonn, G.K., Poly(styrene-divinylbenzene) based media for liquid chromatography. Chem. Eng. Technol. 28(2005), 1457-1472.
38 Penner, N.A., Nesterenko, P.N., Ilyin, M.M., Tsyurupa, M.P. and Davankov, V.A., Investigation of the properties of hypercrosslinked polystyrene as a stationary phase for high-performance liquid chromatography. Chromatographia 50(1999), 611-620.
39 Davankov, V. and Tsyurupa, M., Chromatographic resolution of a salt into its parent acid and base constituents. J. Chromatogr. A 1136(2006), 118-122.
40 Kaczmarski, K., Zapała, W., Wanat, W., Mori, M., Głód, B.K. and Kowalska, T., Modeling of ion-exclusion and vacancy ion-exclusion chromatography in analytical and concentration overload conditions. J. Chromatogr. Sci. 45(2007), 6-15.
41 Chung, S.F. and Wen, C.Y., Longitudinal dispersion of liquid flowing through fixed and fluidized beds. AICHE J. 14(1968), 857-866.
42 Heuer, C., Seidel-Morgenstern, A. and Hugo, P., Experimental investigation and modelling of closed-loop recycling in preparative chromatography. Chem. Eng. Sci. 50(1995), 1115-1127.
103
43 Seidel-Morgenstern, A. and Guiochon, G., Theoretical study of recycling in preparative chromatography. AICHE J. 39(1993), 809-819.
44 Khim Teoh, H., Sorensen, E. and Titchener-Hooker, N., Optimal operating policies for closed-loop recycling HPLC processes. Chem. Eng. Sci. 58(2003), 4145-4158.
45 Grill, C.M., Closed-loop recycling with periodic intra-profile injection: A new binary preparative chromatographic technique. J. Chromatogr. A 796(1998), 101-113.
46 Biesenberger, J.A., Tan, M., Duvdevani, I. and Maurer, T., Recycle gel permeation chromatography. I. Recycle principle and design. J. Polym. Sci. Pol. Lett. 9(1971), 353-357.
47 Bailly, M. and Tondeur, D., Recycle optimization in non-linear productive chromatography—I Mixing recycle with fresh feed. Chem. Eng. Sci. 37(1982), 1199-1212.
48 Charton, F., Bailly, M. and Guiochon, G., Recycling in preparative liquid chromatography. J. Chromatogr. A 687(1994), 13-31.
49 Quiñones, I., Grill, C.M., Miller, L. and Guiochon, G., Modeling of separations by closed-loop steady-state recycling chromatography of a racemic pharmaceutical intermediate. J. Chromatogr. A 867(2000), 1-21.
50 Airaksinen, J., Heikkilä, H., Lewandowski, J., Laiho, K. and Sarmala, P. Separation process. US 2010/0213130 A1, 2010.
51 Rajendran, A., Paredes, G. and Mazzotti, M., Simulated moving bed chromatography for the separation of enantiomers. J. Chromatogr. A 1216(2009), 709-738.
52 Mazzotti, M., Storti, G. and Morbidelli, M., Optimal operation of simulated moving bed units for nonlinear chromatographic separations. J. Chromatogr. A 769(1997), 3-24.
53 Migliorini, C., Mazzotti, M. and Morbidelli, M., Continuous chromatographic separation through simulated moving beds under linear and nonlinear conditions. J. Chromatogr. A 827(1998), 161-173.
54 Strube, J., Gärtner, R. and Schulte, M., Process development of product recovery and solvent recycling steps of chromatographic separation processes. Chem. Eng. J. 85(2002), 273-288.
55 Wankat, P.C., Simulated moving bed cascades for ternary separations. Ind. Eng. Chem. Res. 40(2001), 6185-6193.
56 Kim, J.K. and Wankat, P.C., Designs of simulated-moving-bed cascades for quaternary separations. Ind. Eng. Chem. Res. 43(2004), 1071-1080.
104
57 Wooley, R., Ma, Z. and Wang, N.-.L., A nine-zone simulating moving bed for the recovery of glucose and xylose from biomass hydrolyzate. Ind. Eng. Chem. Res. 37(1998), 3699-3709.
58 Xie, Y., Chin, C.Y., Phelps, D.S.C., Lee, C., Lee, K.B., Mun, S. and Wang, N.L., A five-zone simulated moving bed for the isolation of six sugars from biomass hydrolyzate. Ind. Eng. Chem. Res. 44(2005), 9904-9920.
59 Masuda, T., Sonobe, T., Matsuda, F. and Horie, M. Process for fractional separation of multi-component fluid mixture. US5198120, 1993.
60 Mata, V.G. and Rodrigues, A.E., Separation of ternary mixtures by pseudo-simulated moving bed chromatography. J. Chromatogr. A 939(2001), 23-40.
61 Kurup, A.S., Hidajat, K. and Ray, A.K., Optimal operation of a pseudo-SMB process for ternary separation under non-ideal conditions. Sep. Purif. Technol. 51(2006), 387-403.
62 Silva, V.M.T.M., Gomes, P.S. and Rodrigues, A.E., Use of Ion Exchange Resins in Continuous Chromatography for Sugar Processing, in: Ion Exchange Technology II, Inamuddin, D. and Luqman, M. (Eds.), Springer, Netherlands, 2012.
63 Heikkilä, H. Production of pure sugars and lignosulfonates from sulfite spent liquor. US4631129 A, 1986.
64 Jørgensen, H., Kristensen, J.B. and Felby, C., Enzymatic conversion of lignocellulose into fermentable sugars: challenges and opportunities. Biofuels, Bioprod. Biorefin. 1(2007), 119-134.
65 Larsson, S., Palmqvist, E., Hahn-Hägerdal, B., Tengborg, C., Stenberg, K., Zacchi, G. and Nilvebrant, N., The generation of fermentation inhibitors during dilute acid hydrolysis of softwood. Enzyme Microb. Technol. 24(1999), 151-159.
66 Nanguneri, S.R. and Hester, R.D., Acid/sugar separation using ion exclusion resins: A process analysis and design. Sep. Sci. Technol. 25(1990), 1829-1842.
67 Heinonen, J., Tamminen, A., Uusitalo, J. and Sainio, T., Ethanol production from wood via concentrated acid hydrolysis, chromatographic separation, and fermentation. J. Chem. Tech. Biotechnol. 87(2012), 689-696.
68 Sainio, T., Turku, I. and Heinonen, J., Adsorptive removal of fermentation inhibitors from concentrated acid hydrolyzates of lignocellulosic biomass. Bioresour. Technol. 102(2011), 6048-6057.
69 Tan, S. and MacFarlane, D., Ionic Liquids in Biomass Processing, in: Ionic Liquids, Kirchner, B. (Ed.), Springer, Berlin / Heidelberg, Germany, 2010.
70 Zhou, N., Zhang, Y., Gong, X., Wang, Q. and Ma, Y., Ionic liquids-based hydrolysis of Chlorella biomass for fermentable sugars. Bioresour. Technol. 118(2012), 512-517.
105
71 Saari, P. and Hurme, M., Process synthesis principles in the chromatographic separation of sugars from biomass hydrolysates. Chem. Eng. Technol. 34(2011), 282-288.
72 Kang, S.H. and Chang, Y.K., Removal of organic acid salts from simulated fermentation broth containing succinate by nanofiltration. J. Membr. Sci. 246(2005), 49-57.
73 Nam, H., Park, C., Jo, S., Suh, Y. and Mun, S., Continuous separation of succinic acid and lactic acid by using a three-zone simulated moving bed process packed with Amberchrom-CG300C. Process Biochem. 47(2012), 2418-2426.
74 Moure, A., Gullón, P., Domínguez, H. and Parajó, J.C., Advances in the manufacture, purification and applications of xylo-oligosaccharides as food additives and nutraceuticals. Process Biochem. 41(2006), 1913-1923.
75 Moura, P., Barata, R., Carvalheiro, F., Gírio, F., Loureiro-Dias, M.C. and Esteves, M.P., In vitro fermentation of xylo-oligosaccharides from corn cobs autohydrolysis by Bifidobacterium and Lactobacillus strains. LWT - Food Sci. Technol. 40(2007), 963-972.
76 Cara, C., Ruiz, E., Carvalheiro, F., Moura, P., Ballesteros, I., Castro, E. and Gírio, F., Production, purification and characterisation of oligosaccharides from olive tree pruning autohydrolysis. Ind. Crop. Prod. 40(2012), 225-231.
77 Ouyang, X., Zhang, P., Qiu, X., Deng, Y. and Chen, P., Lignosulfonate separation using preparative column chromatography. Ind. Eng. Chem. Res. 50(2011), 10792-10799.
78 Zhang, Y.P. and Lynd, L.R., Cellodextrin preparation by mixed-acid hydrolysis and chromatographic separation. Anal. Biochem. 322(2003), 225-232.
79 Kromus, S., Wachter, B., Koschuh, W., Mandl, M., Krotscheck, C. and Narodowsky, M., The green biorefinery Austria - Development of an integrated system for green biomass utilization. Chem. Biochem. Eng. Q. 18(2004), 7-12.
80 Thang, V.H., Koschuh, W. and Novalin, S., Electrodialysis versus chromatography for desalting silage juice: Comparison of both processes with regard to energy consumption. J. Membr. Sci. 256(2005), 78-88.
81 Shaw, P.B., Robinson, G.F., Rice, C.R., Humphreys, P.N. and Laws, A.P., A robust method for the synthesis and isolation of β-gluco-isosaccharinic acid ((2R,4S)-2,4,5-trihydroxy-2-(hydroxymethyl)pentanoic acid) from cellulose and measurement of its aqueous pKa. Carbohydr. Res. 349(2012), 6-11.
82 Mehtiö, T., Nurmi, L., Rämö, V., Harlin, A. and Ropponen, J., Copolymerization of glycolic, D,L-lactic and D,L-2-hydroxybutyric acid mixtures present in kraft black liquors. Eur. Polym. J. 48(2012), 774-778.
83 Alén, R., Sjöström, E. and Suominen, S., Application of ion-exclusion chromatography to alkaline pulping liquors; Separation of hydroxy carboxylic acids from inorganic solids. J. Chem. Tech. Biotechnol. 51(1990), 225-233.
106
84 Mulder, M., Basic principles of membrane technology. Kluwer Academic Publishers, Dordrecht, Netherlands, 1992.
85 Van Der Bruggen, B., Vandecasteele, C., Van Gestel, T., Doyen, W. and Leysen, R., A review of pressure-driven membrane processes in wastewater treatment and drinking water production. Environ. Prog. 22(2003), 46-56.
86 Komolikov, Y.I. and Blaginina, L.A., Technology of ceramic micro and ultrafiltration membranes (review). Refract. Ind. Ceram. 43(2002), 181-187.
87 Peng, F., Lu, L., Sun, H., Pan, F. and Jiang, Z., Organic–inorganic hybrid membranes with simultaneously enhanced flux and selectivity. Ind. Eng. Chem. Res. 46(2007), 2544-2549.
88 Van der Bruggen, B., Schaep, J., Wilms, D. and Vandecasteele, C., Influence of molecular size, polarity and charge on the retention of organic molecules by nanofiltration. J. Membr. Sci. 156(1999), 29-41.
89 Ahmad, A.L., Abdulkarim, A.A., Ooi, B.S. and Ismail, S., Recent development in additives modifications of polyethersulfone membrane for flux enhancement. Chem. Eng. J. 223(2013), 246-267.
90 Van Gestel, T., Vandecasteele, C., Buekenhoudt, A., Dotremont, C., Luyten, J., Van der Bruggen, B. and Maes, G., Corrosion properties of alumina and titania NF membranes. J. Membr. Sci. 214(2003), 21-29.
91 Lee, S., Dilaver, M., Park, P. and Kim, J., Comparative analysis of fouling characteristics of ceramic and polymeric microfiltration membranes using filtration models. J. Membr. Sci. 432(2013), 97-105.
92 Bellona, C., Drewes, J.E., Xu, P. and Amy, G., Factors affecting the rejection of organic solutes during NF/RO treatment—a literature review. Water Res. 38(2004), 2795-2809.
93 Bessarabov, D. and Twardowski, Z., Industrial application of nanofiltration – new perspectives. Membrane Technology (2002), 6-9.
94 Chaufer, B. and Rabiller-Baudry, M., Role of electrophoretic mobility of protein on its retention by an ultrafiltration membrane: Comparison to chromatography mechanisms. J. Chromatogr. B 753(2001), 3-16.
95 Luo, J. and Wan, Y., Effects of pH and salt on nanofiltration – a critical review. J. Membr. Sci. 438(2013), 18-28.
96 Boy, V., Roux-de Balmann, H. and Galier, S., Relationship between volumetric properties and mass transfer through NF membrane for saccharide/electrolyte systems. J. Membr. Sci. 390–391(2012), 254-262.

107
97 Truby, R., Market outlook for RO/NF and UF/MF membranes used for large-volume applications. Water Executive (2004), 9-11.
98 Lee, K.P., Arnot, T.C. and Mattia, D., A review of reverse osmosis membrane materials for desalination—Development to date and future potential. J. Membr. Sci. 370(2011), 1-22.
99 Dalwani, M., Bargeman, G., Hosseiny, S.S., Boerrigter, M., Wessling, M. and Benes, N.E., Sulfonated poly(ether ether ketone) based composite membranes for nanofiltration of acidic and alkaline media. J. Membr. Sci. 381(2011), 81-89.
100 Cheryan, M., Ultrafiltration Handbook. Technomic Publishing Company, Lancaster, PA, USA, 1986.
101 Demisch, H.U. and Pusch, W., Ion exchange capacity of cellulose acetate membranes. J. Electrochem. Soc. 123(1976), 370-374.
102 Childress, A.E. and Elimelech, M., Effect of solution chemistry on the surface charge of polymeric reverse osmosis and nanofiltration membranes. J. Membr. Sci. 119(1996), 253-268.
103 Pal, P., Sikder, J., Roy, S. and Giorno, L., Process intensification in lactic acid production: A review of membrane based processes. Chem. Eng. Process. 48(2009), 1549-1559.
104 Wijmans, J.G. and Baker, R.W., The solution-diffusion model: a review. J. Membr. Sci. 107(1995), 1-21.
105 Zhou, F., Wang, C. and Wei, J., Separation of acetic acid from monosaccharides by NF and RO membranes: Performance comparison. J. Membr. Sci. 429(2013), 243-251.
106 Qi, B., Luo, J., Chen, X., Hang, X. and Wan, Y., Separation of furfural from monosaccharides by nanofiltration. Bioresour. Technol. 102(2011), 7111-7118.
107 Grzenia, D.L., Schell, D.J. and Ranil Wickramasinghe, S., Membrane extraction for detoxification of biomass hydrolysates. Bioresour. Technol. 111(2012), 248-254.
108 Heikkilä, H., Mänttäri, M., Lindroos, M. and Nyström, M. Recovery of xylose. US 6,872,316 B2, 2005.
109 Sjöman, E., Mänttäri, M., Nyström, M., Koivikko, H. and Heikkilä, H., Xylose recovery by nanofiltration from different hemicellulose hydrolyzate feeds. J. Membr. Sci. 310(2008), 268-277.
110 Weng, Y., Wei, H., Tsai, T., Chen, W., Wei, T., Hwang, W., Wang, C. and Huang, C., Separation of acetic acid from xylose by nanofiltration. Sep. Purif. Technol. 67(2009), 95-102.
108
111 Restolho, J.A., Prates, A., de Pinho, M.N. and Afonso, M.D., Sugars and lignosulphonates recovery from eucalyptus spent sulphite liquor by membrane processes. Biomass Bioenergy 33(2009), 1558-1566.
112 Woerner, D.L. and McCarthy, J.L., Ultrafiltration of kraft black liquor. AIChE Symp. Ser. 80(1984), 25-33.
113 Uloth, V.C. and Wearing, J.T., Kraft lignin recovery: Acid precipitation versus ultrafiltration. Part I: Laboratory test results. Pulp Pap. Canada 90(1989), 67-71.
114 Öhman, F., Wallmo, H. and Theliander, H., Precipitation and filtration of lignin from black liquor of different origin. Nord. Pulp Paper Res. J. 22(2007), 188-192.
115 Loutfi, H., Blackwell, B. and Uloth, V., Lignin recovery from kraft black liquor: preliminary process design. Tappi J. 74(1991), 203-210.
116 Tomani, P., The LignoBoost process. Cellul. Chem. Technol. 44(2010), 53-58.
117 Jönsson, A.-S., Nordin, A. and Wallberg, O., Concentration and purification of lignin in hardwood kraft pulping liquor by ultrafiltration and nanofiltration. Chem. Eng. Res. Design 86(2008), 1271-1280.
118 Toledano, A., García, A., Mondragon, I. and Labidi, J., Lignin separation and fractionation by ultrafiltration. Sep. Purif. Technol. 71(2010), 38-43.
119 Toledano, A., Serrano, L., Garcia, A., Mondragon, I. and Labidi, J., Comparative study of lignin fractionation by ultrafiltration and selective precipitation. Chem. Eng. J. 157(2010), 93-99.
120 Jönsson, A.-S. and Wallberg, O., Cost estimates of kraft lignin recovery by ultrafiltration. Desalination 237(2009), 254-267.
121 Wallmo, H., Theliander, H., Jönsson, A.-S., Wallberg, O. and Lindgren, K., The influence of hemicelluloses during the precipitation of lignin in kraft black liquor. Nord. Pulp Paper Res. J. 24(2009), 165-171.
122 De, S. and Bhattacharya, P.K., Recovery of water and inorganic chemicals from black liquor using membrane separation processes. Tappi J. 79(1996), 103-111.
123 Niemi, H., Lahti, J., Hatakka, H., Kärki, S., Rovio, S., Kallioinen, M., Mänttäri, M. and Louhi-Kultanen, M., Fractionation of organic and inorganic compounds from black liquor by combining membrane separation and crystallization. Chem. Eng. Technol. 34(2011), 593-598.
124 Mänttäri, M., Van Bruggen, B. and Nyström, M., Nanofiltration, in: Separation and Purification Technologies in Biorefineries, Ramaswamy, S., Huang, H. and Ramarao, B. (Eds.), Wiley, 2013.

109
125 Mishra, A.K. and Bhattacharya, P.K., Alkaline black liquor treatment by continuous electrodialysis. J. Membr. Sci. 33(1987), 83-95.
126 Cho, Y.H., Lee, H.D. and Park, H.B., Integrated membrane processes for separation and purification of organic acid from a biomass fermentation process. Ind. Eng. Chem. Res. 51(2012), 10207-10219.
127 Bailly, M., Production of organic acids by bipolar electrodialysis: realizations and perspectives. Desalination 144(2002), 157-162.
128 Qu, H., Christensen, K.B., Fretté, X.C., Tian, F., Rantanen, J. and Christensen, L.P., A novel hybrid chromatography–crystallization process for the isolation and purification of a natural pharmaceutical ingredient from a medicinal herb. Org. Process Res. Dev. 14(2010), 585-591.
129 Kim, J., Cai, Z. and Benjamin, M.M., Effects of adsorbents on membrane fouling by natural organic matter. J. Membr. Sci. 310(2008), 356-364.
130 Lipnizki, F., Field, R.W. and Ten, P., Pervaporation-based hybrid process: a review of process design, applications and economics. J. Membr. Sci. 153(1999), 183-210.
131 Koltuniewicz, A., Integrated Membrane Operations in Various Industrial Sectors, in: Comprehensive Membrane Science and Engineering, Drioli, E. and Giorno, L. (Eds.), Elsevier, Oxford, UK, 2010.
132 Tanninen, J., Kamppinen, L. and Nyström, M., Pretreatment and Hybrid Processes, in: Nanofiltration - Principles and Applications, Schäfer, A. I., Fane, A. G. and Waite, T. D. (Eds.), Elsevier, Oxford, UK, 2005.
133 Zweckmair, T., Imendörffer, M. and Novalin, S., Separation of small organic compounds derived from aldol-condensation by membrane processes. Sep. Sci. Technol. 46(2011), 2191-2198.
134 Qi, W., Yu, Y. and He, Z., Quantitative analysis of complex casein hydrolysates based on chromatography and membrane. Frontiers of Chemistry in China 1(2006), 199-202.
135 Thompson, R., Paleologou, M. and Berry, R.M., Caustic soda and sulfuric acid production from sodium sulfate by-product of chlorine dioxide generation: Economics. Tappi J. 78(1995), 127-134.
136 Woodley, J.M., Bisschops, M., Straathof, A.J.J. and Ottens, M., Future directions for in-situ product removal (ISPR). J. Chem. Tech. Biotechnol. 83(2008), 121-123.
137 Wagner, N., Fuereder, M., Bosshart, A., Panke, S. and Bechtold, M., Practical aspects of integrated operation of biotransformation and SMB separation for fine chemical synthesis. Org. Process Res. Dev. 16(2012), 323-330.

110
138 Nimmig, S. and Kaspereit, M., Continuous production of single enantiomers at high yields by coupling single column chromatography, racemization, and nanofiltration. Chem. Eng. Process. 67(2013), 89-98.
139 Thömmes, J. and Kula, M.-R., Membrane chromatography - An integrated concept in the downstream processing of proteins. Biotechnol. Prog. 11(1995), 357-366.
140 Orr, V., Zhong, L., Moo-Young, M. and Chou, C.P., Recent advances in bioprocessing application of membrane chromatography. Biotechnol. Adv. 31(2013), 450-465.
141 Güler, E., Kabay, N., Yüksel, M., Yiğit, N.Ö., Kitiş, M. and Bryjak, M., Integrated solution for boron removal from seawater using RO process and sorption-membrane filtration hybrid method. J. Membr. Sci. 375(2011), 249-257.
142 Xu, Y., Sirkar, K.K., Dai, X. and Luo, R.G., A new integrated membrane filtration and chromatographic device. Biotechnol. Prog. 21(2005), 590-597.
143 Lindau, J. and Jönsson, A., Adsorptive fouling of modified and unmodified commercial polymeric ultrafiltration membranes. J. Membr. Sci. 160(1999), 65-76.
144 Maartens, A., Jacobs, E.P. and Swart, P., UF of pulp and paper effluent: membrane fouling-prevention and cleaning. J. Membr. Sci. 209(2002), 81-92.
145 Field, R.W., Wu, D., Howell, J.A. and Gupta, B.B., Critical flux concept for microfiltration fouling. J. Membr. Sci. 100(1995), 259-272.
146 Arkhangelsky, E., Kuzmenko, D. and Gitis, V., Impact of chemical cleaning on properties and functioning of polyethersulfone membranes. J. Membr. Sci. 305(2007), 176-184.
147 Zagorodni, A.A., Kotova, D.L. and Selemenev, V.F., Infrared spectroscopy of ion exchange resins: chemical deterioration of the resins. React. Funct. Polym. 53(2002), 157-171.
148 Freger, V., Bottino, A., Capannelli, G., Perry, M., Gitis, V. and Belfer, S., Characterization of novel acid-stable NF membranes before and after exposure to acid using ATR-FTIR, TEM and AFM. J. Membr. Sci. 256(2005), 134-142.
149 Lee, N., Amy, G., Croué, J. and Buisson, H., Identification and understanding of fouling in low-pressure membrane (MF/UF) filtration by natural organic matter (NOM). Water Res. 38(2004), 4511-4523.
150 Lamsal, R., Harroun, S.G., Brosseau, C.L. and Gagnon, G.A., Use of surface enhanced Raman spectroscopy for studying fouling on nanofiltration membrane. Sep. Purif. Technol. 96(2012), 7-11.
111
151 Lawrence, N.D., Perera, J.M., Iyer, M., Hickey, M.W. and Stevens, G.W., The use of streaming potential measurements to study the fouling and cleaning of ultrafiltration membranes. Sep. Purif. Technol. 48(2006), 106-112.
152 Mairal, A.P., Greenberg, A.R. and Krantz, W.B., Investigation of membrane fouling and cleaning using ultrasonic time-domain reflectometry. Desalination 130(2000), 45-60.
153 Siu, S.C., Boushaba, R., Liau, J., Hjorth, R. and Titchener-Hooker, N.J., Confocal imaging of chromatographic fouling under flow conditions. J. Chem. Tech. Biotechnol. 82(2007), 871-881.
154 Dalwani, M., Benes, N.E., Bargeman, G., Stamatialis, D. and Wessling, M., A method for characterizing membranes during nanofiltration at extreme pH. J. Membr. Sci. 363(2010), 188-194.
155 Vroom, K.E., The "H" factor: A means of expressing cooking times and temperatures as a single variable. Pulp Pap. Canada 58(1957), 228-231.
156 Seidel-Morgenstern, A., Keßler, L.C. and Kaspereit, M., New developments in simulated moving bed chromatography. Chem. Eng. Technol. 31(2008), 826-837.
157 Brown, P., Byrne, G. and Hindmarsh, A., VODE: A Variable-Coefficient ODE Solver. SIAM J. Sci. and Stat. Comput. 10(1989), 1038-1051.
158 Schlinge, D., Scherpian, P. and Schembecker, G., Comparison of process concepts for preparative chromatography. Chem. Eng. Sci. 65(2010), 5373-5381.
159 Grill, C.M., Miller, L. and Yan, T.Q., Resolution of a racemic pharmaceutical intermediate: A comparison of preparative HPLC, steady state recycling, and simulated moving bed. J. Chromatogr. A 1026(2004), 101-108.
160 Kennedy, J.H., Belvo, M.D., Sharp, V.S. and Williams, J.D., Comparison of separation efficiency of early phase active pharmaceutical intermediates by steady state recycle and batch chromatographic techniques. J. Chromatogr. A 1046(2004), 55-60.
161 Guiochon, G., Preparative liquid chromatography. J. Chromatogr. A 965(2002), 129-161.
162 Abunasser, N., Wankat, P.C., Kim, Y.-S. and Koo, Y.M., One-column chromatograph with recycle analogous to a four-zone simulated moving bed. Ind. Eng. Chem. Res. 42(2003), 5268-5279.
163 Lee, J.W. and Wankat, P.C., Comparison of recycle chromatography and simulated moving bed for pseudobinary separations. Ind. Eng. Chem. Res. 48(2009), 7724-7732.
164 Lee, J.W. and Wankat, P.C., Optimized design of recycle chromatography for separation of a single component from a ternary mixture. Ind. Eng. Chem. Res. 47(2008), 9601-9610.
112
165 Wallberg, O. and Jönsson, A.-S., Influence of the membrane cut-off during ultrafiltration of kraft black liquor with ceramic membranes. Chem. Eng. Res. Design 81(2003), 1379-1384.
166 Keyoumu, A., Sjödahl, R., Henriksson, G., Ek, M., Gellerstedt, G. and Lindström, M.E., Continuous nano- and ultra-filtration of kraft pulping black liquor with ceramic filters: A method for lowering the load on the recovery boiler while generating valuable side-products. Ind.Crop. Prod. 20(2004), 143-150.
167 Satyanarayana, S.V., Bhattacharya, P.K. and De, S., Flux decline during ultrafiltration of kraft black liquor using different flow modules: a comparative study. Sep. Purif. Technol. 20(2000), 155-167.
168 Davankov, V., Tsyurupa, M., Blinnikova, Z. and Pavlova, L., Self-concentration effects in preparative SEC of mineral electrolytes using nanoporous neutral polymeric sorbents. J. Sep. Sci. 32(2009), 64-73.
169 Davankov, V.A., Tsyurupa, M.P. and Alexienko, N.N., Selectivity in preparative separations of inorganic electrolytes by size-exclusion chromatography on hypercrosslinked polystyrene and microporous carbons. J. Chromatogr. A 1100(2005), 32-39.
170 Laatikainen, M., Sainio, T., Davankov, V., Tsyurupa, M., Blinnikova, Z. and Paatero, E., Modeling of size-exclusion chromatography of electrolytes on non-ionic nanoporous adsorbents. J. Chromatogr. A 1149(2007), 245-253.
171 Laatikainen, M., Sainio, T., Davankov, V., Tsyurupa, M., Blinnikova, Z. and Paatero, E., Chromatographic separation of a concentrated HCl–CaCl2 solution on non-ionic hypercrosslinked polystyrene. React. Funct. Polym. 67(2007), 1589-1598.
172 Wang, Y., Huang, C. and Xu, T., Which is more competitive for production of organic acids, ion-exchange or electrodialysis with bipolar membranes? J. Membr. Sci. 374(2011), 150-156.
173 Jörissen, J. and Simmrock, K.H., The behaviour of ion exchange membranes in electrolysis and electrodialysis of sodium sulphate. J. Appl. Electrochem. 21(1991), 869-876.
174 Westerberg, N., Sunner, H., Helander, M., Henriksson, G., Lawoko, M. and Rasmuson, A., Separation of galactoglucomannans, lignin, and lignin-carbohydrate complexes from hot-water-extracted Norway Spruce by cross-flow filtration and adsorption chromatography. BioResources 7(2012), 4501-4516.
175 Koivula, E., Kallioinen, M., Sainio, T., Antón, F.E., Luque, S. and Mänttäri, M., Enhanced membrane filtration of wood hydrolysates for hemicelluloses recovery by pretreatment with polymeric adsorbents. Bioresour. Technol. 143(2013), 275-281.
113
176 Schwartz, T.J. and Lawoko, M., Removal of acid-soluble lignin from biomass extracts using Amberlite XAD-4 resin. BioResources 5(2010), 2337-2347.
177 Alén, R. and Sjöström, E., Isolation of hydroxy acids from pine kraft black liquor. Part 2. Purification by distillation. Pap. Puu 63(1980), 469-471.
178 Alén, R. and Sjöström, E., Isolation of hydroxy acids from alkaline birch black liquors. Pap. Puu 63(1981), 5-7.
179 Caşcaval, D., Kloetzer, L., Galaction, A.-I., Vlysidis, A. and Webb, C., Fractionation of carboxylic acids mixture obtained by succinic fermentation using reactive extraction. Sep. Sci. Technol. 48(2013), 634-643.
180 Kim, Y.H. and Moon, S., Lactic acid recovery from fermentation broth using one-stage electrodialysis. J. Chem. Tech. Biotechnol. 76(2001), 169-178.
181 Thang, V.H., Koschuh, W., Kulbe, K.D. and Novalin, S., Detailed investigation of an electrodialytic process during the separation of lactic acid from a complex mixture. J. Membr. Sci. 249(2005), 173-182.
182 Han, I.S. and Cheryan, M., Nanofiltration of model acetate solutions. J. Membr. Sci. 107(1995), 107-113.
183 Freger, V., Arnot, T.C. and Howell, J.A., Separation of concentrated organic/inorganic salt mixtures by nanofiltration. J. Membr. Sci. 178(2000), 185-193.
184 Hausmanns, S., Laufenberg, G. and Kunz, B., Rejection of acetic acid and its improvement by combination with organic acids in dilute solutions using reverse osmosis. Desalination 104(1996), 95-98.
185 Laufenberg, G., Hausmanns, S. and Kunz, B., The influence of intermolecular interactions on the selectivity of several organic acids in aqueous multicomponent systems during reverse osmosis. J. Membr. Sci. 110(1996), 59-68.
186 Luo, J. and Wan, Y., Effect of highly concentrated salt on retention of organic solutes by nanofiltration polymeric membranes. J. Membr. Sci. 372(2011), 145-153.
187 Van der Bruggen, B., Mänttäri, M. and Nyström, M., Drawbacks of applying nanofiltration and how to avoid them: A review. Sep. Purif. Technol. 63(2008), 251-263.
188 Alfredsson, B., Bergdahl, S. and Samuelson, O., Anion-exchange separation of hydroxy acids in acetate medium. Anal. Chim. Acta 28(1963), 371-377.
189 Käkölä, J.M., Alén, R.J., Isoaho, J.P. and Matilainen, R.B., Determination of low-molecular-mass aliphatic carboxylic acids and inorganic anions from kraft black liquors by ion chromatography. J. Chromatogr. A 1190(2008), 150-156.
114
190 Gustafson, R.L. and Lirio, J.A., Adsorption of organic ions by anion exchange resins. Ind. Eng. Chem. Prod. RD 7(1968), 116-120.
191 Alén, R., Sjöström, E., Suominen, S. and Heikkilä, H. Method for the fractionating of spent liquors form alkaline pulp cooking. FI80734, 1987.
192 Nam, H., Lim, G. and Mun, S., Separation of acetic acid, formic acid, succinic acid, and lactic acid using adsorbent resin. J. Chem. Eng. Data 57(2012), 2102-2108.
193 Nam, H., Park, K., Lim, S.S. and Mun, S., Adsorption equilibria of succinic acid and lactic acid on Amberchrom CG300C resin. J. Chem. Eng. Data 56(2011), 464-471.
194 Lee, H., Xie, Y., Koo, Y. and Wang, N.L., Separation of lactic acid from acetic acid using a four-zone SMB. Biotechnol. Prog. 20(2004), 179-192.
APPENDIX 1 A1
Performance of recycling chromatography vs. batch chromatography
1 INTRODUCTION
Steady-state recycling (SSR) chromatography was introduced by Bailly and Tondeur already
in the 1980s [1]. However, the true benefit of SSR in comparison to conventional batch
process remains still unclear. According to a theoretical work of Kaspereit and Sainio, the
performance of optimised SSR chromatography is always better than or as good as that of
optimised batch chromatography [2]. On the other hand, contrary results have been reported
by Schlinge et al. [3]. In their study, the SSR chromatography provided in some cases lower
productivity than conventional batch process. Binary mixtures of compounds with Langmuir-
type isotherms were studied, and the effects of different feed composition, retention factor
and separation selectivity on the process performance were investigated. Batch
chromatography was found competitive for SSR especially when the separation factor was
high and the feed solution contained higher concentration of the first eluting compound than
the last eluting compound. However, the comparison between the productivities provided by
the different process modes is no straight-forwards because higher purity was obtained using
SSR process than using batch process.
In this work, dynamic simulation is applied for assessing the performance of SSR and batch
processes with fixed product purity constraints. To determine whether or not recycling is
beneficial, the productivities provided by the two process modes are compared.
2 SIMULATION WORK
Three binary systems with multicomponent Langmuir isotherms but different separation
factors were studied. The isotherm parameter values shown in Table A1 were taken from
Schlinge et al. [3]. The effect of column efficiency was studied by varying the bead size
between 60 and 260 μm. The injection volumes in batch and SSR were optimised for each
column efficiency. In order to reduce the calculation load, only one fixed flow rate (4.9 BV/h)
and one column size (Hcol = 25 cm, Dcol = 2.5 cm) was considered.
Different feed compositions (1:1, 1:4, and 4:1) were compared similarly as in the study of
Schlinge et al [3]. Total feed concentration of 50 g/L was assumed similarly as in [3]. The
molar mass of both components was assumed 235 g/mol [4]. Total bed porosity of 0.77 was

APPENDIX 1 A2
used in calculations. Intraparticle diffusion coefficient of 1·10-10 m/s was assumed for both
components. Axial dispersion coefficient was calculated using the equation of Chung and
Wen [5].
Table A1 Parameters of the competitive Langmuir isotherms [3].
α qm,1, mol/L qm,2, mol/L b1, L/mol b2, L/mol
1.29 1.516 2.553 5.993 4.583
1.47 1.516 2.270 5.993 5.875
1.82 1.516 2.752 5.993 8.343
3 RESULTS AND DISCUSSION
The results of the simulation work are presented in Tables A2–A4. It is observed in the tables
that SSR always provides better or equal performance as the batch mode, but the magnitude
of improvement depends strongly on the separation factor and column efficiency.
3.1 Effects of separation factor
The effect of the separation factor can be clearly seen when comparing Tables A2–A4. As can
be expected, the productivities provided by both SSR and batch processes are higher when the
separation factor is larger.
In the case of a difficult separation (α = 1.29, Table A2), the productivity can be doubled or at
least significantly increased using an SSR process instead of a batch process. In addition, the
eluent consumption in SSR chromatography is over 50% lower than in batch chromatography.
Only a moderate improvement of 4 to 8% was achieved using SSR instead of batch when α
was 1.47 (Table A3). The corresponding decrease in eluent consumption was approximately
10%.
In an easy separation case (α = 1.82, Table A4), the productivity was typically not improved
at all when recycling was used. Indeed, the advantage of SSR over batch was noticeable only
at the very low column efficiency (NTP 72, i.e. when the particle size was increased to
260 µm). On the other hand, SSR was not inferior to batch process in any case studied.
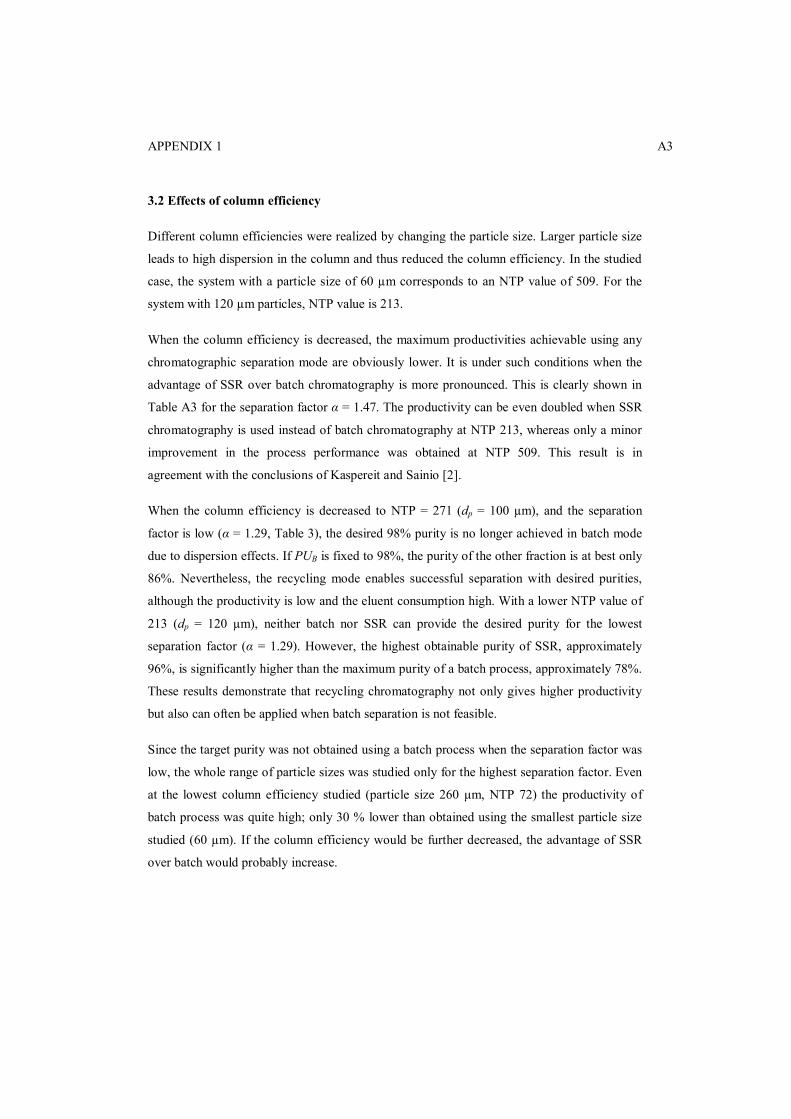
APPENDIX 1 A3
3.2 Effects of column efficiency
Different column efficiencies were realized by changing the particle size. Larger particle size
leads to high dispersion in the column and thus reduced the column efficiency. In the studied
case, the system with a particle size of 60 µm corresponds to an NTP value of 509. For the
system with 120 µm particles, NTP value is 213.
When the column efficiency is decreased, the maximum productivities achievable using any
chromatographic separation mode are obviously lower. It is under such conditions when the
advantage of SSR over batch chromatography is more pronounced. This is clearly shown in
Table A3 for the separation factor α = 1.47. The productivity can be even doubled when SSR
chromatography is used instead of batch chromatography at NTP 213, whereas only a minor
improvement in the process performance was obtained at NTP 509. This result is in
agreement with the conclusions of Kaspereit and Sainio [2].
When the column efficiency is decreased to NTP = 271 (dp = 100 µm), and the separation
factor is low (α = 1.29, Table 3), the desired 98% purity is no longer achieved in batch mode
due to dispersion effects. If PUB is fixed to 98%, the purity of the other fraction is at best only
86%. Nevertheless, the recycling mode enables successful separation with desired purities,
although the productivity is low and the eluent consumption high. With a lower NTP value of
213 (dp = 120 µm), neither batch nor SSR can provide the desired purity for the lowest
separation factor (α = 1.29). However, the highest obtainable purity of SSR, approximately
96%, is significantly higher than the maximum purity of a batch process, approximately 78%.
These results demonstrate that recycling chromatography not only gives higher productivity
but also can often be applied when batch separation is not feasible.
Since the target purity was not obtained using a batch process when the separation factor was
low, the whole range of particle sizes was studied only for the highest separation factor. Even
at the lowest column efficiency studied (particle size 260 μm, NTP 72) the productivity of
batch process was quite high; only 30 % lower than obtained using the smallest particle size
studied (60 µm). If the column efficiency would be further decreased, the advantage of SSR
over batch would probably increase.
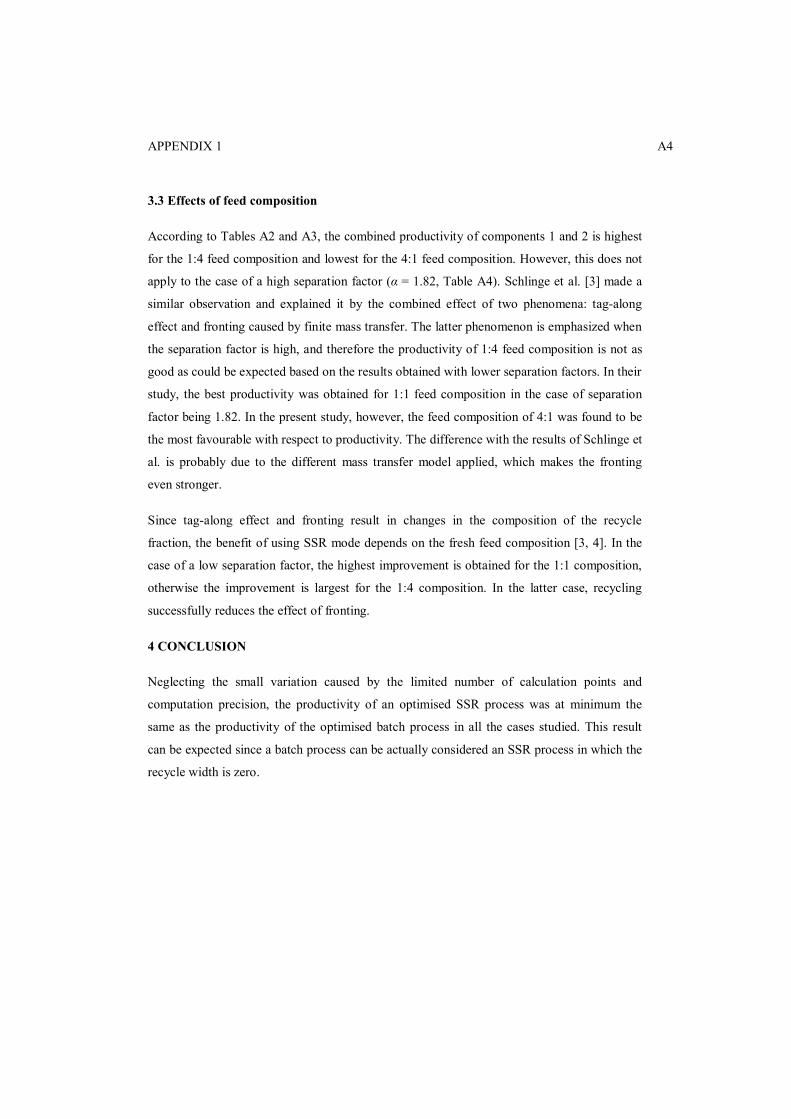
APPENDIX 1 A4
3.3 Effects of feed composition
According to Tables A2 and A3, the combined productivity of components 1 and 2 is highest
for the 1:4 feed composition and lowest for the 4:1 feed composition. However, this does not
apply to the case of a high separation factor (α = 1.82, Table A4). Schlinge et al. [3] made a
similar observation and explained it by the combined effect of two phenomena: tag-along
effect and fronting caused by finite mass transfer. The latter phenomenon is emphasized when
the separation factor is high, and therefore the productivity of 1:4 feed composition is not as
good as could be expected based on the results obtained with lower separation factors. In their
study, the best productivity was obtained for 1:1 feed composition in the case of separation
factor being 1.82. In the present study, however, the feed composition of 4:1 was found to be
the most favourable with respect to productivity. The difference with the results of Schlinge et
al. is probably due to the different mass transfer model applied, which makes the fronting
even stronger.
Since tag-along effect and fronting result in changes in the composition of the recycle
fraction, the benefit of using SSR mode depends on the fresh feed composition [3, 4]. In the
case of a low separation factor, the highest improvement is obtained for the 1:1 composition,
otherwise the improvement is largest for the 1:4 composition. In the latter case, recycling
successfully reduces the effect of fronting.
4 CONCLUSION
Neglecting the small variation caused by the limited number of calculation points and
computation precision, the productivity of an optimised SSR process was at minimum the
same as the productivity of the optimised batch process in all the cases studied. This result
can be expected since a batch process can be actually considered an SSR process in which the
recycle width is zero.
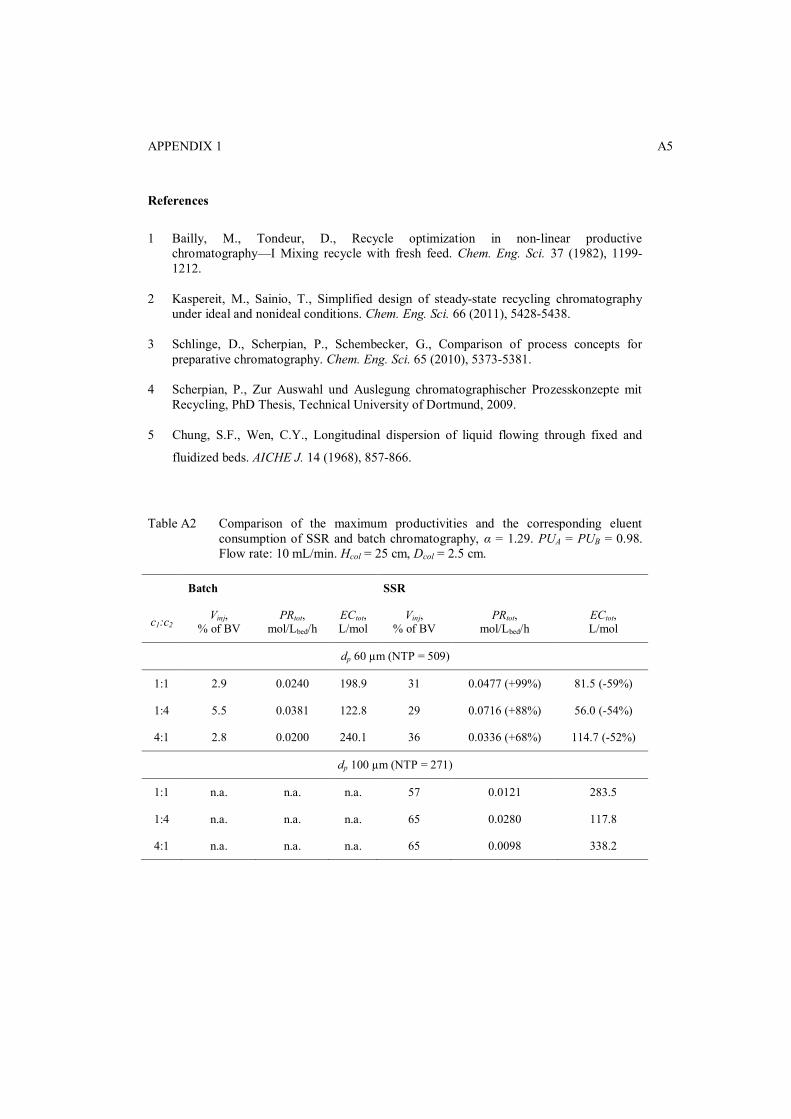
APPENDIX 1 A5
References
1 Bailly, M., Tondeur, D., Recycle optimization in non-linear productive chromatography—I Mixing recycle with fresh feed. Chem. Eng. Sci. 37 (1982), 1199-1212.
2 Kaspereit, M., Sainio, T., Simplified design of steady-state recycling chromatography under ideal and nonideal conditions. Chem. Eng. Sci. 66 (2011), 5428-5438.
3 Schlinge, D., Scherpian, P., Schembecker, G., Comparison of process concepts for preparative chromatography. Chem. Eng. Sci. 65 (2010), 5373-5381.
4 Scherpian, P., Zur Auswahl und Auslegung chromatographischer Prozesskonzepte mit Recycling, PhD Thesis, Technical University of Dortmund, 2009.
5 Chung, S.F., Wen, C.Y., Longitudinal dispersion of liquid flowing through fixed and
fluidized beds. AICHE J. 14 (1968), 857-866.
Table A2 Comparison of the maximum productivities and the corresponding eluent consumption of SSR and batch chromatography, α = 1.29. PUA = PUB = 0.98. Flow rate: 10 mL/min. Hcol = 25 cm, Dcol = 2.5 cm.
Batch SSR
c1:c2 Vinj,
% of BV PRtot,
mol/Lbed/h ECtot, L/mol
Vinj, % of BV
PRtot, mol/Lbed/h
ECtot, L/mol
dp 60 µm (NTP = 509)
1:1 2.9 0.0240 198.9 31 0.0477 (+99%) 81.5 (-59%)
1:4 5.5 0.0381 122.8 29 0.0716 (+88%) 56.0 (-54%)
4:1 2.8 0.0200 240.1 36 0.0336 (+68%) 114.7 (-52%)
dp 100 µm (NTP = 271)
1:1 n.a. n.a. n.a. 57 0.0121 283.5
1:4 n.a. n.a. n.a. 65 0.0280 117.8
4:1 n.a. n.a. n.a. 65 0.0098 338.2

APPENDIX 1 A6
Table A3 Comparison of the maximum productivities and the corresponding eluent consumption of SSR and batch chromatography, α = 1.47. PUA = PUB = 0.98. Flow rate: 10 mL/min. Hcol = 25 cm, Dcol = 2.5 cm.
Batch SSR
c1:c2 Vinj,
% of BV PRtot,
mol/Lbed/h ECtot, L/mol
Vinj, % of BV
PRtot, mol/Lbed/h
ECtot, L/mol
dp 60 µm (NTP = 509)
1:1 21 0.0936 47.4 34 0.0973 (+4%) 42.8 (-10%)
1:4 27 0.1103 38.9 39 0.1190 (+8%) 34.2 (-12%)
4:1 17 0.0818 55.2 46 0.0849 (+4%) 46.0 (-17%)
dp 120 µm (NTP = 213)
1:1 6.3 0.0323 146.4 49 0.0622 (+92%) 62.3 (-57%)
1:4 9.2 0.0410 113.6 43 0.0847 (+106%) 47.4 (-58%)
4:1 6.8 0.0299 159.0 53 0.0456 (+53%) 86.0 (-46%)
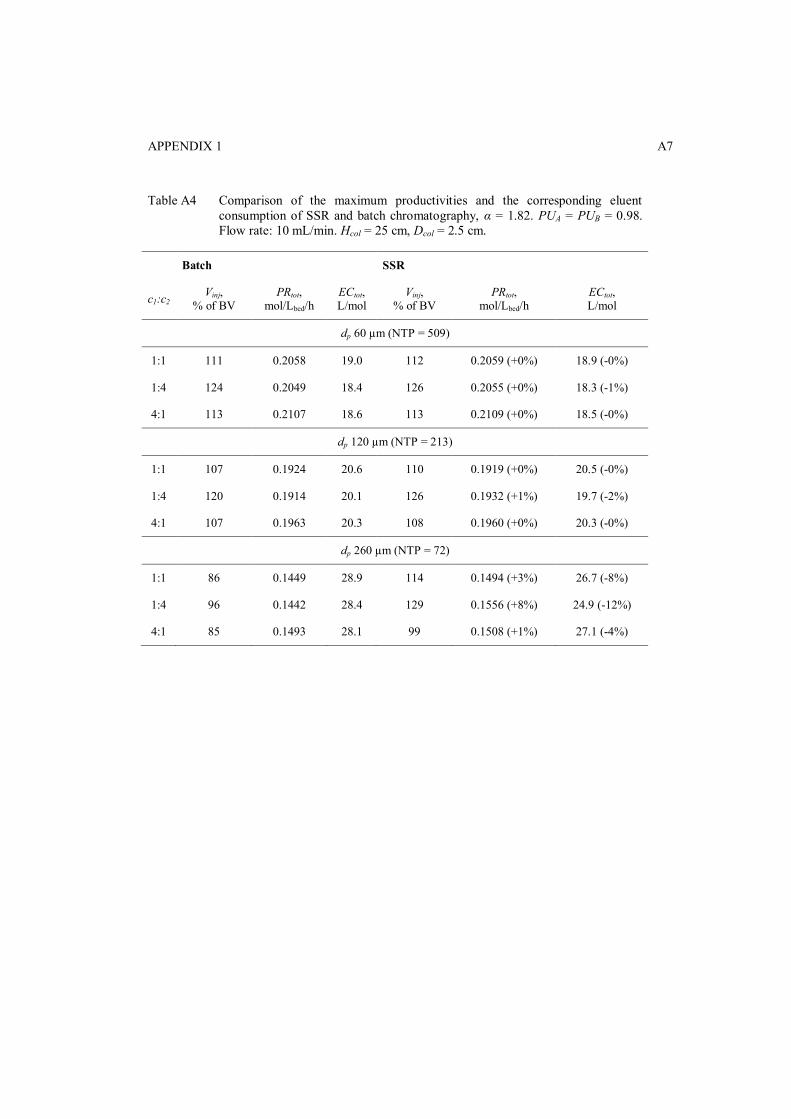
APPENDIX 1 A7
Table A4 Comparison of the maximum productivities and the corresponding eluent consumption of SSR and batch chromatography, α = 1.82. PUA = PUB = 0.98. Flow rate: 10 mL/min. Hcol = 25 cm, Dcol = 2.5 cm.
Batch SSR
c1:c2 Vinj,
% of BV PRtot,
mol/Lbed/h ECtot, L/mol
Vinj, % of BV
PRtot, mol/Lbed/h
ECtot, L/mol
dp 60 µm (NTP = 509)
1:1 111 0.2058 19.0 112 0.2059 (+0%) 18.9 (-0%)
1:4 124 0.2049 18.4 126 0.2055 (+0%) 18.3 (-1%)
4:1 113 0.2107 18.6 113 0.2109 (+0%) 18.5 (-0%)
dp 120 µm (NTP = 213)
1:1 107 0.1924 20.6 110 0.1919 (+0%) 20.5 (-0%)
1:4 120 0.1914 20.1 126 0.1932 (+1%) 19.7 (-2%)
4:1 107 0.1963 20.3 108 0.1960 (+0%) 20.3 (-0%)
dp 260 µm (NTP = 72)
1:1 86 0.1449 28.9 114 0.1494 (+3%) 26.7 (-8%)
1:4 96 0.1442 28.4 129 0.1556 (+8%) 24.9 (-12%)
4:1 85 0.1493 28.1 99 0.1508 (+1%) 27.1 (-4%)

I
Reprinted with permission from Separation Science and
Technology, Vol. 47, Hellstén, S., Sainio, T., Steady state
recycling chromatography in acid–sugar separation on ion-
exchange resin, 2358–2365, Copyright (2012) Taylor & Francis.

II
Reprinted with permission from Journal of Chromatography A,
Vol. 1251, Hellstén, S., Siitonen, J., Mänttäri, M., Sainio, T.,
Steady state recycling chromatography with an integrated solvent
removal unit – Separation of glucose and galactose, 122–133,
Copyright (2012) Elsevier.

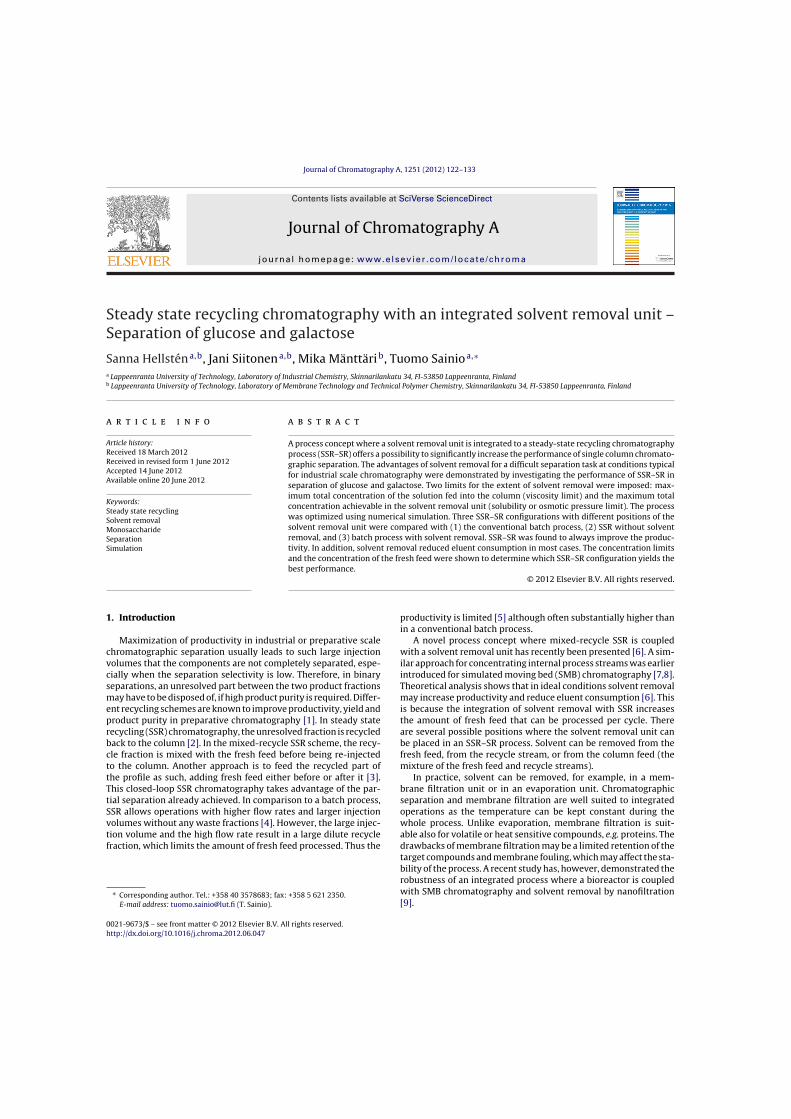
Journal of Chromatography A, 1251 (2012) 122– 133
Contents lists available at SciVerse ScienceDirect
Journal of Chromatography A
j our na l ho me p ag e: www.elsev ier .com/ locate /chroma
Steady state recycling chromatography with an integrated solvent removal unit –Separation of glucose and galactose
Sanna Hellsténa,b, Jani Siitonena,b, Mika Mänttärib, Tuomo Sainioa,∗
a Lappeenranta University of Technology, Laboratory of Industrial Chemistry, Skinnarilankatu 34, FI-53850 Lappeenranta, Finlandb Lappeenranta University of Technology, Laboratory of Membrane Technology and Technical Polymer Chemistry, Skinnarilankatu 34, FI-53850 Lappeenranta, Finland
a r t i c l e i n f o
Article history:Received 18 March 2012Received in revised form 1 June 2012Accepted 14 June 2012Available online 20 June 2012
Keywords:Steady state recyclingSolvent removalMonosaccharideSeparationSimulation
a b s t r a c t
A process concept where a solvent removal unit is integrated to a steady-state recycling chromatographyprocess (SSR–SR) offers a possibility to significantly increase the performance of single column chromato-graphic separation. The advantages of solvent removal for a difficult separation task at conditions typicalfor industrial scale chromatography were demonstrated by investigating the performance of SSR–SR inseparation of glucose and galactose. Two limits for the extent of solvent removal were imposed: max-imum total concentration of the solution fed into the column (viscosity limit) and the maximum totalconcentration achievable in the solvent removal unit (solubility or osmotic pressure limit). The processwas optimized using numerical simulation. Three SSR–SR configurations with different positions of thesolvent removal unit were compared with (1) the conventional batch process, (2) SSR without solventremoval, and (3) batch process with solvent removal. SSR–SR was found to always improve the produc-tivity. In addition, solvent removal reduced eluent consumption in most cases. The concentration limitsand the concentration of the fresh feed were shown to determine which SSR–SR configuration yields thebest performance.
© 2012 Elsevier B.V. All rights reserved.
1. Introduction
Maximization of productivity in industrial or preparative scalechromatographic separation usually leads to such large injectionvolumes that the components are not completely separated, espe-cially when the separation selectivity is low. Therefore, in binaryseparations, an unresolved part between the two product fractionsmay have to be disposed of, if high product purity is required. Differ-ent recycling schemes are known to improve productivity, yield andproduct purity in preparative chromatography [1]. In steady staterecycling (SSR) chromatography, the unresolved fraction is recycledback to the column [2]. In the mixed-recycle SSR scheme, the recy-cle fraction is mixed with the fresh feed before being re-injectedto the column. Another approach is to feed the recycled part ofthe profile as such, adding fresh feed either before or after it [3].This closed-loop SSR chromatography takes advantage of the par-tial separation already achieved. In comparison to a batch process,SSR allows operations with higher flow rates and larger injectionvolumes without any waste fractions [4]. However, the large injec-tion volume and the high flow rate result in a large dilute recyclefraction, which limits the amount of fresh feed processed. Thus the
∗ Corresponding author. Tel.: +358 40 3578683; fax: +358 5 621 2350.E-mail address: [email protected] (T. Sainio).
productivity is limited [5] although often substantially higher thanin a conventional batch process.
A novel process concept where mixed-recycle SSR is coupledwith a solvent removal unit has recently been presented [6]. A sim-ilar approach for concentrating internal process streams was earlierintroduced for simulated moving bed (SMB) chromatography [7,8].Theoretical analysis shows that in ideal conditions solvent removalmay increase productivity and reduce eluent consumption [6]. Thisis because the integration of solvent removal with SSR increasesthe amount of fresh feed that can be processed per cycle. Thereare several possible positions where the solvent removal unit canbe placed in an SSR–SR process. Solvent can be removed from thefresh feed, from the recycle stream, or from the column feed (themixture of the fresh feed and recycle streams).
In practice, solvent can be removed, for example, in a mem-brane filtration unit or in an evaporation unit. Chromatographicseparation and membrane filtration are well suited to integratedoperations as the temperature can be kept constant during thewhole process. Unlike evaporation, membrane filtration is suit-able also for volatile or heat sensitive compounds, e.g. proteins. Thedrawbacks of membrane filtration may be a limited retention of thetarget compounds and membrane fouling, which may affect the sta-bility of the process. A recent study has, however, demonstrated therobustness of an integrated process where a bioreactor is coupledwith SMB chromatography and solvent removal by nanofiltration[9].
0021-9673/$ – see front matter © 2012 Elsevier B.V. All rights reserved.http://dx.doi.org/10.1016/j.chroma.2012.06.047

S. Hellstén et al. / J. Chromatogr. A 1251 (2012) 122– 133 123
As the previous theoretical work [6] assumed ideal conditionsonly, the performance of SSR–SR under actual process conditions,i.e. in the presence of dispersion, has not been investigated. Theobjective of the present work is thus to provide an overview of theperformance of SSR–SR under strongly non-ideal process condi-tions characteristic of industrial scale preparative chromatography.
In addition to dispersion, other practical issues have to beconsidered when evaluating the effect of solvent removal on theperformance of SSR. In the SSR–SR process, the more solvent thatis removed, the more fresh feed can be processed per cycle [6].However, the concentration cannot be limitlessly raised becauseoperating with highly concentrated solutions may not be feasiblein practice. Viscous fingering and pressure drop in the column mayset a limit for the concentration of the feed solution. The solu-bility of the compounds may limit the concentration even more,since crystallization in the column or in the solvent removal unit isunacceptable. On the other hand, if the solubility is high, osmoticpressure in membrane separation or vapour pressure in evapora-tion may become a limit of operation at high concentrations. Thiswork studies the effects of the fresh feed concentration and con-centration limits set for the process units on the performance ofSSR–SR, which has not been investigated before. In addition, thefeasible range of operating parameters for different SSR–SR config-urations is discussed.
Previous study has shown that the advantage of SSR over batchchromatography is pronounced in processes with a low separationfactor or low column efficiency [5]. Integration of a solvent removalunit would presumably further improve the process performanceespecially in that kind of difficult separation tasks. Therefore, a dif-ficult separation case, the recovery and purification of galactoseand glucose from lactose hydrolysate, was chosen for investiga-tion. An industrial scale chromatographic separation process forthis purpose was recently investigated by Saari et al. [10]. In theirstudy, conventional batch chromatography was used. Due to thelow separation factor between the two monosaccharides ( = 1.15),the product purities remain low (approximately 70%). A higherpurity would be preferable, since it would facilitate downstreamprocessing (crystallization of the products). In this paper, the per-formance of different SSR–SR process configurations in the caseof high purity requirements (90%) is investigated using numericalsimulation.
2. Principle of SSR–SR
The principle of the SSR–SR process, introduced in [6], is shownin Fig. 1. Solvent can be removed from the fresh feed (I), the recyclestream (II), or the column feed (III), i.e. the mixture of the fresh feedand recycle streams. In all three options, the system approaches acyclic steady state if the amount of solvent removed and the amountof fresh feed introduced remain constant on every cycle. As withthe conventional SSR, a method for predicting the steady state ofLangmuir isotherm systems under ideal conditions is also availablefor SSR–SR [6].
All the SSR–SR process configurations are based on mixed-recycle SSR, i.e. the recycle fraction is mixed with fresh feed priorto injection to the column. Closed-loop mode of SSR may not befeasible for SSR–SR processes as mixing is difficult to avoid dur-ing solvent removal. In addition, mixed-recycle mode is useful intheoretical studies because methods are available for predictionof the steady state and the cut times for recovering the recyclefraction and product fractions that meet the set purity targets[5,11]. In addition, numerical studies of mixed-recycle SSR are morestraightforward than of closed-loop SSR because optimization ofthe extra-column volume and distribution of the recycle fractionduring the feed step is not needed.
3. Calculations
The separation of glucose and galactose from lactosehydrolysate was investigated using dynamic simulation. Inaddition to glucose and galactose, a lactose hydrolysate mayalso contain salts, some residual lactose, and minor amounts ofoligosaccharides. Salts, in particular, can affect solvent removal byincreasing the osmotic pressure and changing the permeabilityof compounds in membrane filtration [12]. However, salt canbe separated using ion exclusion chromatography prior to thefractionation of the monosaccharides, which also decreases thecycle time of the chromatographic separation significantly. Abinary separation of glucose and galactose is thus investigated inthis work.
Sorption of monosaccharides on elastic ion exchange resins isoften reported to be weakly nonlinear (anti-Langmuir) [13,14].However, Saari et al. [15] reported linear isotherms up to concen-tration 350 g/L for the particular system used here. As reportedin [15], the parameters of the linear isotherms on a SAC resin(Finex CS11GC Na+ form, 5.5% DVB cross-linking) are: for galactose,K = 1.027 L/kgdryresin and for glucose, K = 0.893 L/kgdryresin. Thesevalues lead to the following linear isotherm equations:
q∗glu = 0.4279 · cglu (1)
q∗gal = 0.4921 · cgal (2)
where q∗glu
and q∗gal
are the solid phase equilibrium concentrations(mol/L) of glucose and galactose, respectively, and cglu and cgal arethe corresponding liquid phase concentrations (mol/L). As seenfrom the isotherm parameter values, the separation factor for thispair of monosaccharides is very low, ˛ = 1.15. For that reason, thepurity achieved experimentally in batch operation was as low as71% for glucose and 65% for galactose [10].
The operation of a pilot scale column described in [10] (columni.d. Dcol = 23 cm, bed height H = 5.3 m, resin bead size dp = 0.33 mm,bed porosity ε = 0.31) was simulated. Three different total con-centration levels of the fresh feed were investigated: 1.35 mol/L,0.68 mol/L, and 0.34 mol/L. The ratio of glucose and galactose inthe fresh feed was assumed to be 1:0.92 as reported in [10]. Theconcentration of galactose in lactose hydrolysate is typically lowerthan that of glucose due to transgalactolytic activity [16]. Diffusioncoefficients of 1.50 × 10⁻¹⁰ m2/s and 1.48 × 10⁻¹⁰ m2/s were usedfor glucose and galactose, respectively.
In the simulations performed here, the purity constraints werefixed to 0.90 (±0.001) for both glucose and galactose. A thresh-old concentration of 0.001 mol/L was applied for determining thebeginning of the first product fraction (t1A) and the end of the sec-ond product fraction (t2B). Together these cut times determine theduration of a cycle. Besides these, only one cut time between theproduct fractions is used in the conventional batch operation whenno waste fraction is allowed. There is only a single injection vol-ume for a specific flow rate that provides the desired purities forboth product fractions. This injection volume was found by usingdynamic simulations and a least-squares optimization algorithm.In SSR and SSR–SR operation, two additional cut times (t2A and t1B)are applied to collect the recycle fraction. These cut times were firstestimated using a short-cut method [5], which uses numerical inte-gration of a simulated chromatogram for the determination of t2Aand volume and mass balances for calculating t1B, and then refinedby an iteration scheme to meet the purity constraints within therequired accuracy.
The retention of solutes in the solvent removal unit was assumedto be complete. Accordingly, the solvent removal causes no loss ofmonosaccharides. This assumption is probably valid in practice ifthe solvent is removed using a reverse osmosis membrane, a verydense nanofiltration membrane, or evaporation.
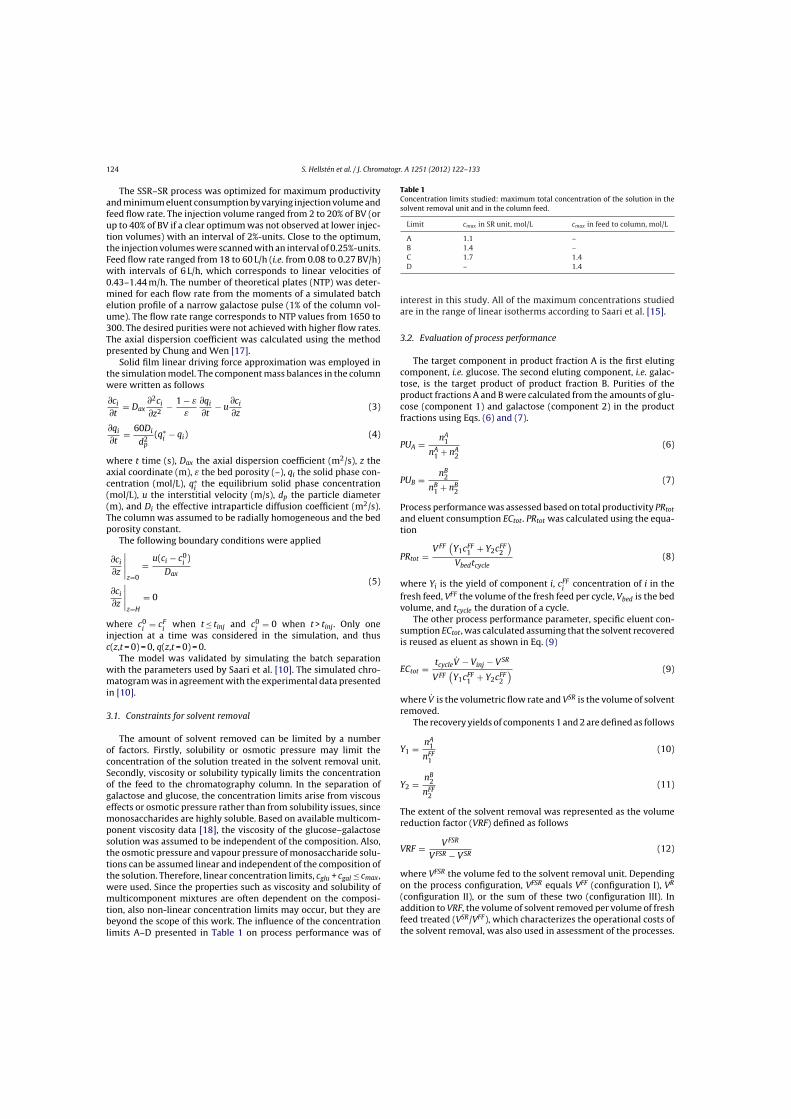
124 S. Hellstén et al. / J. Chromatogr. A 1251 (2012) 122– 133
The SSR–SR process was optimized for maximum productivityand minimum eluent consumption by varying injection volume andfeed flow rate. The injection volume ranged from 2 to 20% of BV (orup to 40% of BV if a clear optimum was not observed at lower injec-tion volumes) with an interval of 2%-units. Close to the optimum,the injection volumes were scanned with an interval of 0.25%-units.Feed flow rate ranged from 18 to 60 L/h (i.e. from 0.08 to 0.27 BV/h)with intervals of 6 L/h, which corresponds to linear velocities of0.43–1.44 m/h. The number of theoretical plates (NTP) was deter-mined for each flow rate from the moments of a simulated batchelution profile of a narrow galactose pulse (1% of the column vol-ume). The flow rate range corresponds to NTP values from 1650 to300. The desired purities were not achieved with higher flow rates.The axial dispersion coefficient was calculated using the methodpresented by Chung and Wen [17].
Solid film linear driving force approximation was employed inthe simulation model. The component mass balances in the columnwere written as follows
∂ci
∂t= Dax
∂2ci
∂z2− 1 − ε
ε
∂qi
∂t− u
∂ci
∂z(3)
∂qi
∂t= 60Di
d2p
(q∗i − qi) (4)
where t time (s), Dax the axial dispersion coefficient (m2/s), z theaxial coordinate (m), ε the bed porosity (–), qi the solid phase con-centration (mol/L), q∗
ithe equilibrium solid phase concentration
(mol/L), u the interstitial velocity (m/s), dp the particle diameter(m), and Di the effective intraparticle diffusion coefficient (m2/s).The column was assumed to be radially homogeneous and the bedporosity constant.
The following boundary conditions were applied
∂ci
∂z
∣∣∣∣z=0
= u(ci − c0i)
Dax
∂ci
∂z
∣∣∣∣z=H
= 0
(5)
where c0i
= cFi
when t ≤ tinj and c0i
= 0 when t > tinj. Only oneinjection at a time was considered in the simulation, and thusc(z,t = 0) = 0, q(z,t = 0) = 0.
The model was validated by simulating the batch separationwith the parameters used by Saari et al. [10]. The simulated chro-matogram was in agreement with the experimental data presentedin [10].
3.1. Constraints for solvent removal
The amount of solvent removed can be limited by a numberof factors. Firstly, solubility or osmotic pressure may limit theconcentration of the solution treated in the solvent removal unit.Secondly, viscosity or solubility typically limits the concentrationof the feed to the chromatography column. In the separation ofgalactose and glucose, the concentration limits arise from viscouseffects or osmotic pressure rather than from solubility issues, sincemonosaccharides are highly soluble. Based on available multicom-ponent viscosity data [18], the viscosity of the glucose–galactosesolution was assumed to be independent of the composition. Also,the osmotic pressure and vapour pressure of monosaccharide solu-tions can be assumed linear and independent of the composition ofthe solution. Therefore, linear concentration limits, cglu + cgal ≤ cmax,were used. Since the properties such as viscosity and solubility ofmulticomponent mixtures are often dependent on the composi-tion, also non-linear concentration limits may occur, but they arebeyond the scope of this work. The influence of the concentrationlimits A–D presented in Table 1 on process performance was of
Table 1Concentration limits studied: maximum total concentration of the solution in thesolvent removal unit and in the column feed.
Limit cmax in SR unit, mol/L cmax in feed to column, mol/L
A 1.1 –B 1.4 –C 1.7 1.4D – 1.4
interest in this study. All of the maximum concentrations studiedare in the range of linear isotherms according to Saari et al. [15].
3.2. Evaluation of process performance
The target component in product fraction A is the first elutingcomponent, i.e. glucose. The second eluting component, i.e. galac-tose, is the target product of product fraction B. Purities of theproduct fractions A and B were calculated from the amounts of glu-cose (component 1) and galactose (component 2) in the productfractions using Eqs. (6) and (7).
PUA = nA1
nA1 + nA
2
(6)
PUB = nB2
nB1 + nB
2
(7)
Process performance was assessed based on total productivity PRtot
and eluent consumption ECtot. PRtot was calculated using the equa-tion
PRtot =VFF
(Y1cFF
1 + Y2cFF2
)
Vbedtcycle(8)
where Yi is the yield of component i, cFFi
concentration of i in thefresh feed, VFF the volume of the fresh feed per cycle, Vbed is the bedvolume, and tcycle the duration of a cycle.
The other process performance parameter, specific eluent con-sumption ECtot, was calculated assuming that the solvent recoveredis reused as eluent as shown in Eq. (9)
ECtot = tcycleV − Vinj − VSR
VFF(
Y1cFF1 + Y2cFF
2
) (9)
where V is the volumetric flow rate and VSR is the volume of solventremoved.
The recovery yields of components 1 and 2 are defined as follows
Y1 = nA1
nFF1
(10)
Y2 = nB2
nFF2
(11)
The extent of the solvent removal was represented as the volumereduction factor (VRF) defined as follows
VRF = VFSR
VFSR − VSR(12)
where VFSR the volume fed to the solvent removal unit. Dependingon the process configuration, VFSR equals VFF (configuration I), VR
(configuration II), or the sum of these two (configuration III). Inaddition to VRF, the volume of solvent removed per volume of freshfeed treated (VSR/VFF), which characterizes the operational costs ofthe solvent removal, was also used in assessment of the processes.
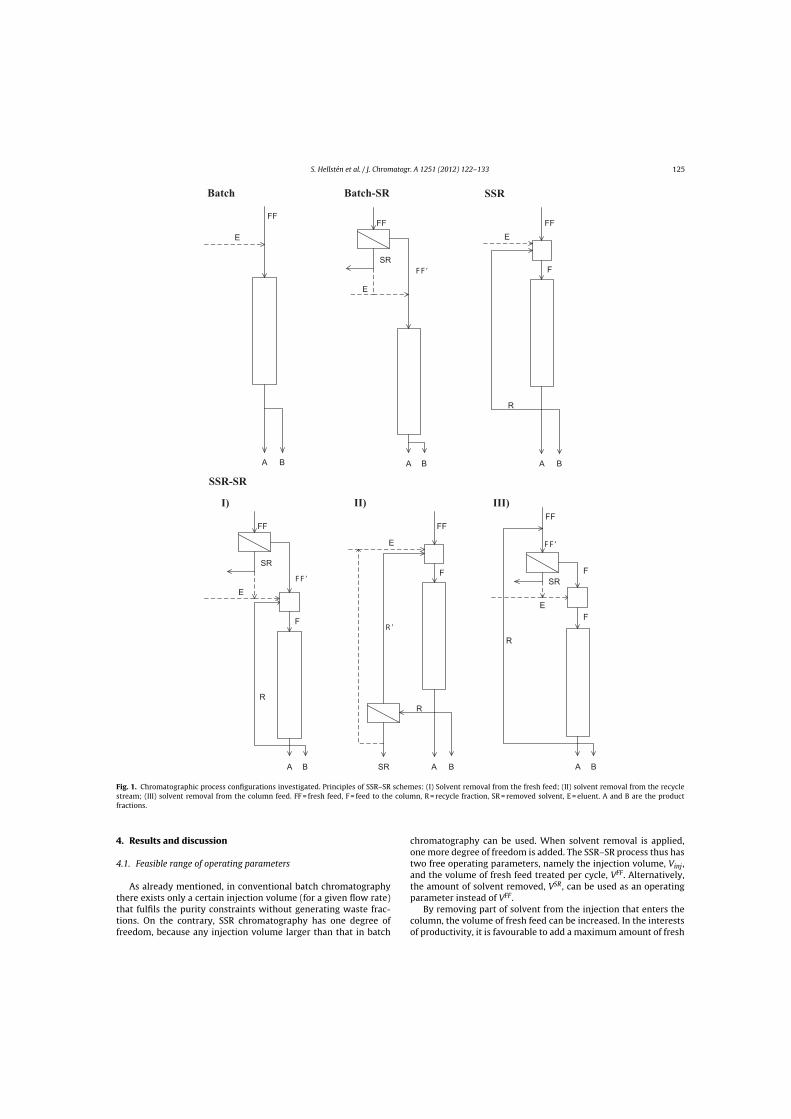
S. Hellstén et al. / J. Chromatogr. A 1251 (2012) 122– 133 125
I) II) III)
SSR-SR
SSRBatch-SRBatch
FF
A B
E
FF
B
SR
E
A
FF ’
FF
F
A
R
B
E
FF
F
R
B
FF ’
SR
E
A
R ’
FF
F
A
R
BSR
E
F
A
R
B
F
SR
FF ’
FF
E
Fig. 1. Chromatographic process configurations investigated. Principles of SSR–SR schemes: (I) Solvent removal from the fresh feed; (II) solvent removal from the recyclestream; (III) solvent removal from the column feed. FF = fresh feed, F = feed to the column, R = recycle fraction, SR = removed solvent, E = eluent. A and B are the productfractions.
4. Results and discussion
4.1. Feasible range of operating parameters
As already mentioned, in conventional batch chromatographythere exists only a certain injection volume (for a given flow rate)that fulfils the purity constraints without generating waste frac-tions. On the contrary, SSR chromatography has one degree offreedom, because any injection volume larger than that in batch
chromatography can be used. When solvent removal is applied,one more degree of freedom is added. The SSR–SR process thus hastwo free operating parameters, namely the injection volume, Vinj,and the volume of fresh feed treated per cycle, VFF. Alternatively,the amount of solvent removed, VSR, can be used as an operatingparameter instead of VFF.
By removing part of solvent from the injection that enters thecolumn, the volume of fresh feed can be increased. In the interestsof productivity, it is favourable to add a maximum amount of fresh

126 S. Hellstén et al. / J. Chromatogr. A 1251 (2012) 122– 133
feed to the process on each cycle. On the other hand, an increase inthe injection volume leads to prolonged cycle time and thus reducesthe production rate.
It has been shown theoretically [6] that the feasible rangeof applicable operating parameters is not identical for all of theSSR–SR configurations shown in Fig. 1, even when no concentrationlimits are considered. In this work, the influence of the concentra-tion constraints A–D listed in Table 1 on the feasible range of VFF andVinj is investigated. Fig. 2 illustrates the results for a case where thefresh feed concentration is 0.68 mol/L and the column efficiency isconstant (NTP = 1150), i.e. the eluent flow rate is constant (24 L/h).
Batch chromatography: The classical batch chromatography pro-cess is presented as a filled circle in Fig. 2. In the batch process thevolume of fresh feed is equal to the injection volume because norecycling is applied. It can thus be operated only at a single pointin the operating parameter space. The amount of fresh feed can beincreased by removing solvent from the feed but the injection vol-ume remains constant for linear isotherms. The constant injectionvolume is contrary to the case of Langmuir isotherms [6] and non-linear isotherms in general. The feasible operating parameter spaceof batch chromatography is thus a straight horizontal line limitedby the fresh feed concentration and the maximum concentration.This line is shown in orange colour in Fig. 2. The points represent-ing the total concentrations of 1.1 mol/L (limit A in Table 1) and1.4 mol/L (limits B–D in Table 1) are shown in the figure as opencircles.
SSR without solvent removal: The steady state recycling modeallows the use of any injection volume higher than or equal to thatof batch mode. The feasible operating parameters for SSR are givenby the orange dashed curve in Fig. 2. When the injection volumeis increased from that used in batch chromatography, the amountof fresh feed has to be increased in order to prevent the purities ofthe product fractions becoming higher than required [5]. The curvethus moves up and to the right. However, when the injection vol-ume is increased above a certain level, the amount of fresh feedrequired to reach the purity constraints becomes constant due torecycling of injection plateau. This phenomenon is clearly seen inFig. 2: the dashed curve becomes a vertical line after Vinj = 6% ofBV. This injection volume corresponds to the maximum productiv-ity. With larger Vinj, productivity decreases because the cycle timeincreases while the amount of fresh feed that can be processed percycle stays constant.
SSR with solvent removal: Applying solvent removal expands thefeasible range of operating parameters of SSR chromatography andthere is a functional dependency between VFF and VSR [6]. For allthree configurations, the curves shown in Fig. 2 correspond to thesituation when the maximum amount of solvent is removed, i.e.maximum VFF is treated per cycle. It should be noted, however,that SSR–SR can be operated anywhere between these curves andthe curve of SSR. For configurations I and III, the lower boundaryfor Vinj is the operating line of batch chromatography with solventremoval.
The dotted lines in Fig. 2 correspond to the SSR–SR configura-tion where solvent is removed from the fresh feed (SSR–SR I). Themaximum VFF is determined by the maximum concentration in thesolvent removal unit or, if no such limit exists (constraints of typeD), the maximum concentration of the feed to the column. As seenin Fig. 2, the curves of SSR–SR I become vertical after a certain injec-tion volume, in the same way as the curve of SSR. After this point,the amount of fresh feed becomes independent of the injection vol-ume because an injection plateau is being recycled. The maximumproductivity is typically obtained with an injection volume corre-sponding to the inflection point of the curve. The maximum volumeof fresh feed that can be treated on each cycle depends on the con-centration limits. When the maximum concentration is 1.1 mol/L(limits of type A), maximum VFF is 5.5% of BV. For the limits of
1.4 mol/L (constraints of type B) and of 1.7 mol/L (constraints oftype C) the maximum values of VFF are 7.1% of BV and 8.7% of BV,respectively. When no limitation for the solvent removal unit is set,the volume of fresh feed can be increased to 9.1% of BV. A furtherincrease in VFF is not possible due to the constraint of column feedconcentration.
The operation range of SSR–SR configuration II, where solvent isremoved from the recycle stream, is illustrated as dash-dotted linesin Fig. 2. If no concentration limits are set for the solvent removalunit (limit D, black dash-dotted line), VFF equals Vinj at the upperboundary. This is because the injection volume is the sum of freshfeed and recycle volumes, and the latter becomes zero (and con-centration infinite) in the solvent removal unit. This behaviour isindependent of isotherm type and amount of dispersion, and thesame result was obtained earlier for Langmuir systems [6]. Whenthe maximum concentration in the solvent removal unit is limited(limits A–C), the upper boundary of VFF in SSR–SR II is curved. Forexample, for limit C (green curve in Fig. 2), the column feed con-centration limit is met only with Vinj > 30% of BV. The correspondingmaximum VFF is 9.1% of the bed volume.
The third option is to remove solvent from the column feed (con-figuration SSR–SR III). The boundaries of this configuration withdifferent constraints are shown as solid lines in Fig. 2. The curvescorresponding to limits B–D are overlaid in Fig. 2 because the lim-iting concentration is 1.4 mol/L in all these cases. In case B the limitis imposed by the solvent removal unit whereas in cases C and Dit is the maximum feed concentration to the column. In case A theconcentration limit for the solvent removal unit is lower (1.1 mol/L)and the range of operating parameters thus narrower.
It is further observed in Fig. 2, that the boundary of SSR–SR Iwith limit D coincides with the boundaries of SSR–SR III with limitsB–D. This is because the column feed concentration at steady-stateis equal in all of these cases. In SSR–SR I, the feed concentrationof 1.4 mol/L is obtained by diluting the concentrated fresh feedwith the recycle fraction to match the maximum concentrationof the column feed. In configuration III, mixing of streams is per-formed first, and the solution is concentrated to the same level. AlsoSSR–SR II with limits C and D becomes equal to these configura-tions at large injection volumes. In those cases, the recycle fractionis concentrated and then diluted with the fresh feed to obtain theconcentration of 1.4 mol/L. With small injection volumes, however,this concentration cannot be reached due to the small size of therecycle fraction.
4.1.1. Influence of feed concentration on the feasible range ofoperating parameters
When the fresh feed concentration is halved from the value inthe above discussion, the feasible operating parameters change, asseen in Fig. 3. Since a larger amount of solvent can be removedfrom more dilute streams before reaching concentration limits, alarger volume of fresh feed can be added in all SSR–SR configura-tions. In configurations I and III the maximum VFF is doubled whenthe fresh feed concentration is halved. In configuration II the differ-ence is not as large. The injection volume required to process thelargest possible VFF per cycle is substantially increased when the cFF
is decreased. For example, the maximum VFF for limit D is reachedwith Vinj = 16% of BV, while Vinj = 9% of BV was sufficient for themore concentrated fresh feed in Fig. 2. Nevertheless, it can be con-cluded by comparing Figs. 2 and 3 that no substantial differencesin the shape of any of the concentration limitations is observed ifthe fresh feed concentration is decreased by 50%.
When cFF is increased to 1.35 mol/L, some interesting phenom-ena in the feasible operating parameters of SSR–SR are observed(see Fig. 4). Let us first focus on the case of concentration limits A(cmax = 1.1 mol/L in the SR unit). Configuration SSR–SR I is not appli-cable because cFF > cmax. The same holds for small injection widths
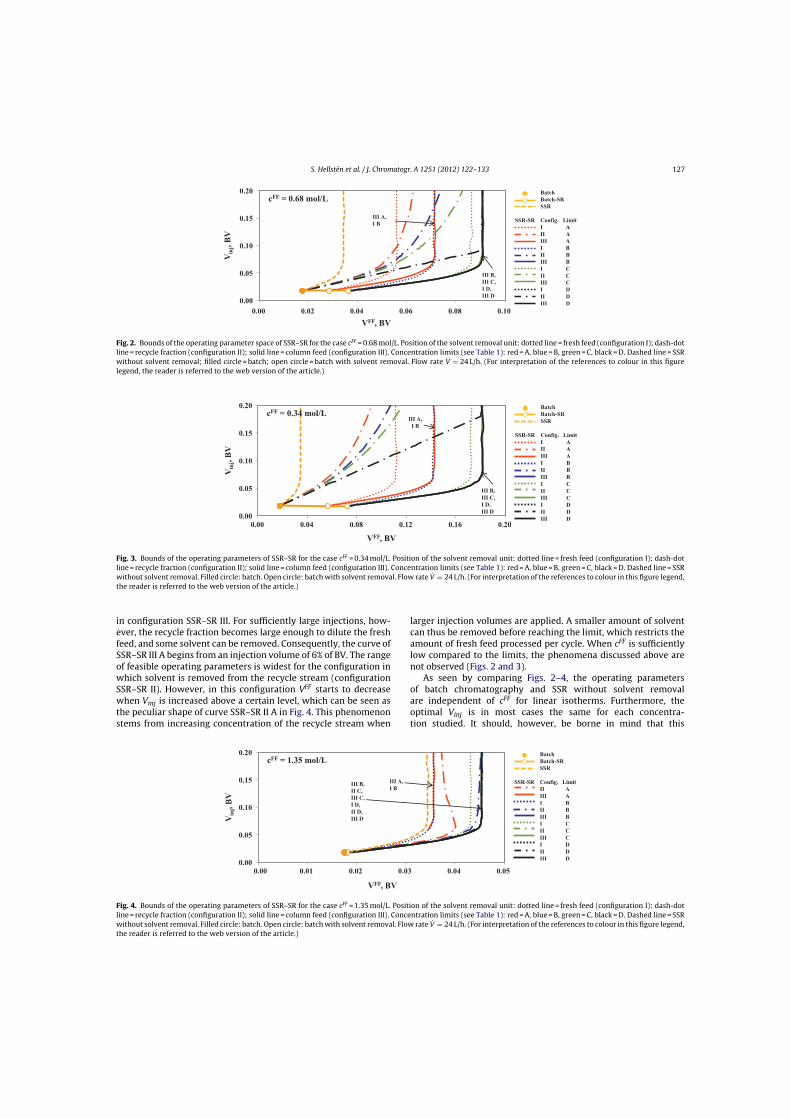
S. Hellstén et al. / J. Chromatogr. A 1251 (2012) 122– 133 127
0.00
0.05
0.10
0.15
0.20
0.00 0.02 0.04 0.06 0.08 0.10
Vin
j, B
V
VFF , BV
cFF = 0.68 mol/L
III A,
I B
III B,
III C,
I D,
III D
Batch
Batch-SR
SSR
SSR-SR Config. Limit
I A
II A
III A
I B
II B
III B
I C
II C
III C
I D
II D
III D
Fig. 2. Bounds of the operating parameter space of SSR–SR for the case cFF = 0.68 mol/L. Position of the solvent removal unit: dotted line = fresh feed (configuration I); dash-dotline = recycle fraction (configuration II); solid line = column feed (configuration III). Concentration limits (see Table 1): red = A, blue = B, green = C, black = D. Dashed line = SSRwithout solvent removal; filled circle = batch; open circle = batch with solvent removal. Flow rate V = 24 L/h. (For interpretation of the references to colour in this figurelegend, the reader is referred to the web version of the article.)
0.00
0.05
0.10
0.15
0.20
0.00 0.04 0.08 0.12 0.16 0.20
Vin
j, B
V
VFF, BV
cFF = 0.34 mol /LIII A,
I B
III B,
III C,
I D,
III D
Batch
Batch-SR
SSR
SSR-SR Config. Limit
I A
II A
III A
I B
II B
III B
I C
II C
III C
I D
II D
III D
Fig. 3. Bounds of the operating parameters of SSR–SR for the case cFF = 0.34 mol/L. Position of the solvent removal unit: dotted line = fresh feed (configuration I); dash-dotline = recycle fraction (configuration II); solid line = column feed (configuration III). Concentration limits (see Table 1): red = A, blue = B, green = C, black = D. Dashed line = SSRwithout solvent removal. Filled circle: batch. Open circle: batch with solvent removal. Flow rate V = 24 L/h. (For interpretation of the references to colour in this figure legend,the reader is referred to the web version of the article.)
in configuration SSR–SR III. For sufficiently large injections, how-ever, the recycle fraction becomes large enough to dilute the freshfeed, and some solvent can be removed. Consequently, the curve ofSSR–SR III A begins from an injection volume of 6% of BV. The rangeof feasible operating parameters is widest for the configuration inwhich solvent is removed from the recycle stream (configurationSSR–SR II). However, in this configuration VFF starts to decreasewhen Vinj is increased above a certain level, which can be seen asthe peculiar shape of curve SSR–SR II A in Fig. 4. This phenomenonstems from increasing concentration of the recycle stream when
larger injection volumes are applied. A smaller amount of solventcan thus be removed before reaching the limit, which restricts theamount of fresh feed processed per cycle. When cFF is sufficientlylow compared to the limits, the phenomena discussed above arenot observed (Figs. 2 and 3).
As seen by comparing Figs. 2–4, the operating parametersof batch chromatography and SSR without solvent removalare independent of cFF for linear isotherms. Furthermore, theoptimal Vinj is in most cases the same for each concentra-tion studied. It should, however, be borne in mind that this
0.00
0.05
0.10
0.15
0.20
0.00 0.01 0.02 0.03 0.04 0.05
Vin
j, B
V
VFF, BV
cFF = 1.35 mol /L
III B,
II C,
III C,
I D,
II D,
III D
III A,
I B
Batch
Batch-SR
SSR
SSR-SR Config. Limit
II A
III A
I B
II B
III B
I C
II C
III C
I D
II D
III D
Fig. 4. Bounds of the operating parameters of SSR–SR for the case cFF = 1.35 mol/L. Position of the solvent removal unit: dotted line = fresh feed (configuration I); dash-dotline = recycle fraction (configuration II); solid line = column feed (configuration III). Concentration limits (see Table 1): red = A, blue = B, green = C, black = D. Dashed line = SSRwithout solvent removal. Filled circle: batch. Open circle: batch with solvent removal. Flow rate V = 24 L/h. (For interpretation of the references to colour in this figure legend,the reader is referred to the web version of the article.)
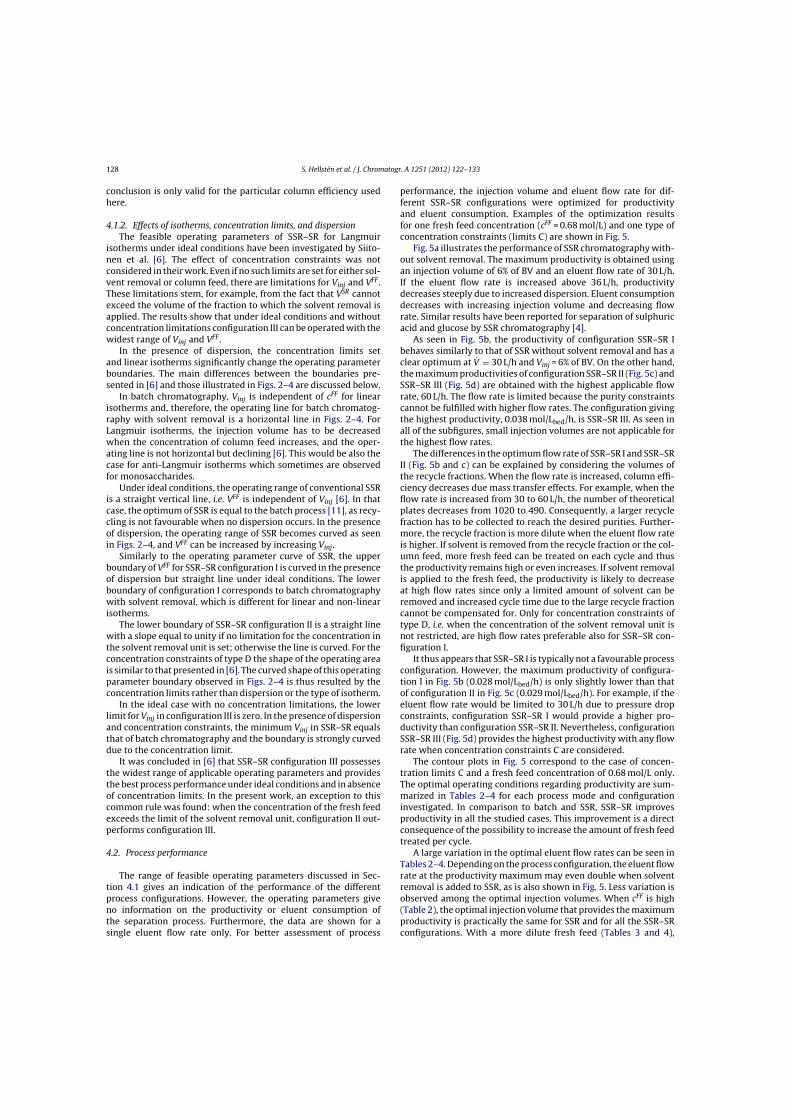
128 S. Hellstén et al. / J. Chromatogr. A 1251 (2012) 122– 133
conclusion is only valid for the particular column efficiency usedhere.
4.1.2. Effects of isotherms, concentration limits, and dispersionThe feasible operating parameters of SSR–SR for Langmuir
isotherms under ideal conditions have been investigated by Siito-nen et al. [6]. The effect of concentration constraints was notconsidered in their work. Even if no such limits are set for either sol-vent removal or column feed, there are limitations for Vinj and VFF.These limitations stem, for example, from the fact that VSR cannotexceed the volume of the fraction to which the solvent removal isapplied. The results show that under ideal conditions and withoutconcentration limitations configuration III can be operated with thewidest range of Vinj and VFF.
In the presence of dispersion, the concentration limits setand linear isotherms significantly change the operating parameterboundaries. The main differences between the boundaries pre-sented in [6] and those illustrated in Figs. 2–4 are discussed below.
In batch chromatography, Vinj is independent of cFF for linearisotherms and, therefore, the operating line for batch chromatog-raphy with solvent removal is a horizontal line in Figs. 2–4. ForLangmuir isotherms, the injection volume has to be decreasedwhen the concentration of column feed increases, and the oper-ating line is not horizontal but declining [6]. This would be also thecase for anti-Langmuir isotherms which sometimes are observedfor monosaccharides.
Under ideal conditions, the operating range of conventional SSRis a straight vertical line, i.e. VFF is independent of Vinj [6]. In thatcase, the optimum of SSR is equal to the batch process [11], as recy-cling is not favourable when no dispersion occurs. In the presenceof dispersion, the operating range of SSR becomes curved as seenin Figs. 2–4, and VFF can be increased by increasing Vinj.
Similarly to the operating parameter curve of SSR, the upperboundary of VFF for SSR–SR configuration I is curved in the presenceof dispersion but straight line under ideal conditions. The lowerboundary of configuration I corresponds to batch chromatographywith solvent removal, which is different for linear and non-linearisotherms.
The lower boundary of SSR–SR configuration II is a straight linewith a slope equal to unity if no limitation for the concentration inthe solvent removal unit is set; otherwise the line is curved. For theconcentration constraints of type D the shape of the operating areais similar to that presented in [6]. The curved shape of this operatingparameter boundary observed in Figs. 2–4 is thus resulted by theconcentration limits rather than dispersion or the type of isotherm.
In the ideal case with no concentration limitations, the lowerlimit for Vinj in configuration III is zero. In the presence of dispersionand concentration constraints, the minimum Vinj in SSR–SR equalsthat of batch chromatography and the boundary is strongly curveddue to the concentration limit.
It was concluded in [6] that SSR–SR configuration III possessesthe widest range of applicable operating parameters and providesthe best process performance under ideal conditions and in absenceof concentration limits. In the present work, an exception to thiscommon rule was found: when the concentration of the fresh feedexceeds the limit of the solvent removal unit, configuration II out-performs configuration III.
4.2. Process performance
The range of feasible operating parameters discussed in Sec-tion 4.1 gives an indication of the performance of the differentprocess configurations. However, the operating parameters giveno information on the productivity or eluent consumption ofthe separation process. Furthermore, the data are shown for asingle eluent flow rate only. For better assessment of process
performance, the injection volume and eluent flow rate for dif-ferent SSR–SR configurations were optimized for productivityand eluent consumption. Examples of the optimization resultsfor one fresh feed concentration (cFF = 0.68 mol/L) and one type ofconcentration constraints (limits C) are shown in Fig. 5.
Fig. 5a illustrates the performance of SSR chromatography with-out solvent removal. The maximum productivity is obtained usingan injection volume of 6% of BV and an eluent flow rate of 30 L/h.If the eluent flow rate is increased above 36 L/h, productivitydecreases steeply due to increased dispersion. Eluent consumptiondecreases with increasing injection volume and decreasing flowrate. Similar results have been reported for separation of sulphuricacid and glucose by SSR chromatography [4].
As seen in Fig. 5b, the productivity of configuration SSR–SR Ibehaves similarly to that of SSR without solvent removal and has aclear optimum at V = 30 L/h and Vinj = 6% of BV. On the other hand,the maximum productivities of configuration SSR–SR II (Fig. 5c) andSSR–SR III (Fig. 5d) are obtained with the highest applicable flowrate, 60 L/h. The flow rate is limited because the purity constraintscannot be fulfilled with higher flow rates. The configuration givingthe highest productivity, 0.038 mol/Lbed/h, is SSR–SR III. As seen inall of the subfigures, small injection volumes are not applicable forthe highest flow rates.
The differences in the optimum flow rate of SSR–SR I and SSR–SRII (Fig. 5b and c) can be explained by considering the volumes ofthe recycle fractions. When the flow rate is increased, column effi-ciency decreases due mass transfer effects. For example, when theflow rate is increased from 30 to 60 L/h, the number of theoreticalplates decreases from 1020 to 490. Consequently, a larger recyclefraction has to be collected to reach the desired purities. Further-more, the recycle fraction is more dilute when the eluent flow rateis higher. If solvent is removed from the recycle fraction or the col-umn feed, more fresh feed can be treated on each cycle and thusthe productivity remains high or even increases. If solvent removalis applied to the fresh feed, the productivity is likely to decreaseat high flow rates since only a limited amount of solvent can beremoved and increased cycle time due to the large recycle fractioncannot be compensated for. Only for concentration constraints oftype D, i.e. when the concentration of the solvent removal unit isnot restricted, are high flow rates preferable also for SSR–SR con-figuration I.
It thus appears that SSR–SR I is typically not a favourable processconfiguration. However, the maximum productivity of configura-tion I in Fig. 5b (0.028 mol/Lbed/h) is only slightly lower than thatof configuration II in Fig. 5c (0.029 mol/Lbed/h). For example, if theeluent flow rate would be limited to 30 L/h due to pressure dropconstraints, configuration SSR–SR I would provide a higher pro-ductivity than configuration SSR–SR II. Nevertheless, configurationSSR–SR III (Fig. 5d) provides the highest productivity with any flowrate when concentration constraints C are considered.
The contour plots in Fig. 5 correspond to the case of concen-tration limits C and a fresh feed concentration of 0.68 mol/L only.The optimal operating conditions regarding productivity are sum-marized in Tables 2–4 for each process mode and configurationinvestigated. In comparison to batch and SSR, SSR–SR improvesproductivity in all the studied cases. This improvement is a directconsequence of the possibility to increase the amount of fresh feedtreated per cycle.
A large variation in the optimal eluent flow rates can be seen inTables 2–4. Depending on the process configuration, the eluent flowrate at the productivity maximum may even double when solventremoval is added to SSR, as is also shown in Fig. 5. Less variation isobserved among the optimal injection volumes. When cFF is high(Table 2), the optimal injection volume that provides the maximumproductivity is practically the same for SSR and for all the SSR–SRconfigurations. With a more dilute fresh feed (Tables 3 and 4),
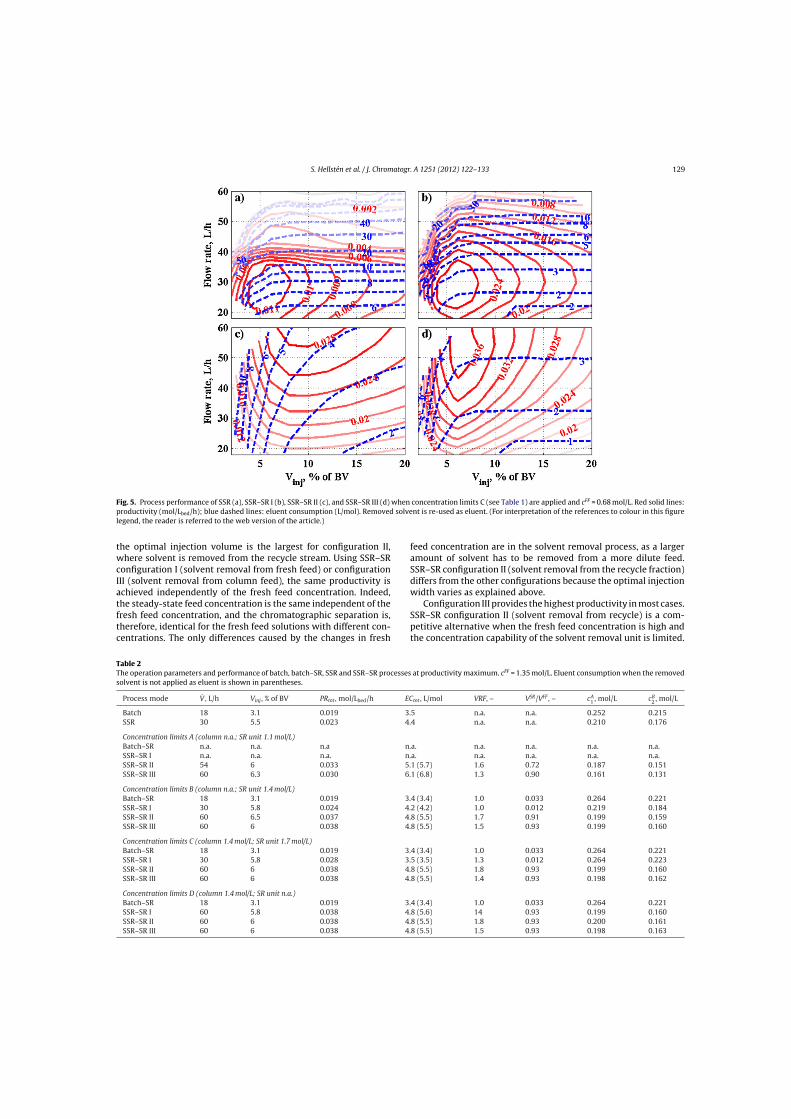
S. Hellstén et al. / J. Chromatogr. A 1251 (2012) 122– 133 129
Fig. 5. Process performance of SSR (a), SSR–SR I (b), SSR–SR II (c), and SSR–SR III (d) when concentration limits C (see Table 1) are applied and cFF = 0.68 mol/L. Red solid lines:productivity (mol/Lbed/h); blue dashed lines: eluent consumption (L/mol). Removed solvent is re-used as eluent. (For interpretation of the references to colour in this figurelegend, the reader is referred to the web version of the article.)
the optimal injection volume is the largest for configuration II,where solvent is removed from the recycle stream. Using SSR–SRconfiguration I (solvent removal from fresh feed) or configurationIII (solvent removal from column feed), the same productivity isachieved independently of the fresh feed concentration. Indeed,the steady-state feed concentration is the same independent of thefresh feed concentration, and the chromatographic separation is,therefore, identical for the fresh feed solutions with different con-centrations. The only differences caused by the changes in fresh
feed concentration are in the solvent removal process, as a largeramount of solvent has to be removed from a more dilute feed.SSR–SR configuration II (solvent removal from the recycle fraction)differs from the other configurations because the optimal injectionwidth varies as explained above.
Configuration III provides the highest productivity in most cases.SSR–SR configuration II (solvent removal from recycle) is a com-petitive alternative when the fresh feed concentration is high andthe concentration capability of the solvent removal unit is limited.
Table 2The operation parameters and performance of batch, batch–SR, SSR and SSR–SR processes at productivity maximum. cFF = 1.35 mol/L. Eluent consumption when the removedsolvent is not applied as eluent is shown in parentheses.
Process mode V , L/h Vinj , % of BV PRtot , mol/Lbed/h ECtot , L/mol VRF, – VSR/VFF , – cA1 , mol/L cB
2 , mol/L
Batch 18 3.1 0.019 3.5 n.a. n.a. 0.252 0.215SSR 30 5.5 0.023 4.4 n.a. n.a. 0.210 0.176
Concentration limits A (column n.a.; SR unit 1.1 mol/L)Batch–SR n.a. n.a. n.a n.a. n.a. n.a. n.a. n.a.SSR–SR I n.a. n.a. n.a. n.a. n.a. n.a. n.a. n.a.SSR–SR II 54 6 0.033 5.1 (5.7) 1.6 0.72 0.187 0.151SSR–SR III 60 6.3 0.030 6.1 (6.8) 1.3 0.90 0.161 0.131
Concentration limits B (column n.a.; SR unit 1.4 mol/L)Batch–SR 18 3.1 0.019 3.4 (3.4) 1.0 0.033 0.264 0.221SSR–SR I 30 5.8 0.024 4.2 (4.2) 1.0 0.012 0.219 0.184SSR–SR II 60 6.5 0.037 4.8 (5.5) 1.7 0.91 0.199 0.159SSR–SR III 60 6 0.038 4.8 (5.5) 1.5 0.93 0.199 0.160
Concentration limits C (column 1.4 mol/L; SR unit 1.7 mol/L)Batch–SR 18 3.1 0.019 3.4 (3.4) 1.0 0.033 0.264 0.221SSR–SR I 30 5.8 0.028 3.5 (3.5) 1.3 0.012 0.264 0.223SSR–SR II 60 6 0.038 4.8 (5.5) 1.8 0.93 0.199 0.160SSR–SR III 60 6 0.038 4.8 (5.5) 1.4 0.93 0.198 0.162
Concentration limits D (column 1.4 mol/L; SR unit n.a.)Batch–SR 18 3.1 0.019 3.4 (3.4) 1.0 0.033 0.264 0.221SSR–SR I 60 5.8 0.038 4.8 (5.6) 14 0.93 0.199 0.160SSR–SR II 60 6 0.038 4.8 (5.5) 1.8 0.93 0.200 0.161SSR–SR III 60 6 0.038 4.8 (5.5) 1.5 0.93 0.198 0.163
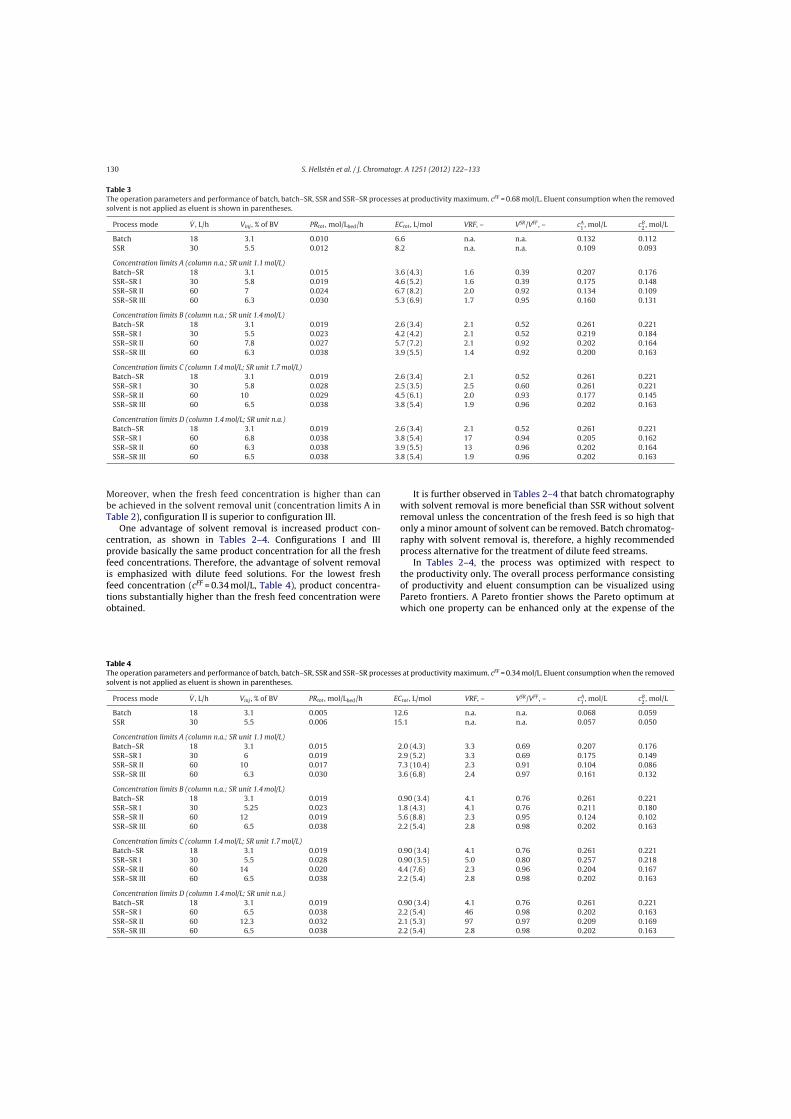
130 S. Hellstén et al. / J. Chromatogr. A 1251 (2012) 122– 133
Table 3The operation parameters and performance of batch, batch–SR, SSR and SSR–SR processes at productivity maximum. cFF = 0.68 mol/L. Eluent consumption when the removedsolvent is not applied as eluent is shown in parentheses.
Process mode V , L/h Vinj , % of BV PRtot , mol/Lbed/h ECtot , L/mol VRF, – VSR/VFF , – cA1 , mol/L cB
2 , mol/L
Batch 18 3.1 0.010 6.6 n.a. n.a. 0.132 0.112SSR 30 5.5 0.012 8.2 n.a. n.a. 0.109 0.093
Concentration limits A (column n.a.; SR unit 1.1 mol/L)Batch–SR 18 3.1 0.015 3.6 (4.3) 1.6 0.39 0.207 0.176SSR–SR I 30 5.8 0.019 4.6 (5.2) 1.6 0.39 0.175 0.148SSR–SR II 60 7 0.024 6.7 (8.2) 2.0 0.92 0.134 0.109SSR–SR III 60 6.3 0.030 5.3 (6.9) 1.7 0.95 0.160 0.131
Concentration limits B (column n.a.; SR unit 1.4 mol/L)Batch–SR 18 3.1 0.019 2.6 (3.4) 2.1 0.52 0.261 0.221SSR–SR I 30 5.5 0.023 4.2 (4.2) 2.1 0.52 0.219 0.184SSR–SR II 60 7.8 0.027 5.7 (7.2) 2.1 0.92 0.202 0.164SSR–SR III 60 6.3 0.038 3.9 (5.5) 1.4 0.92 0.200 0.163
Concentration limits C (column 1.4 mol/L; SR unit 1.7 mol/L)Batch–SR 18 3.1 0.019 2.6 (3.4) 2.1 0.52 0.261 0.221SSR–SR I 30 5.8 0.028 2.5 (3.5) 2.5 0.60 0.261 0.221SSR–SR II 60 10 0.029 4.5 (6.1) 2.0 0.93 0.177 0.145SSR–SR III 60 6.5 0.038 3.8 (5.4) 1.9 0.96 0.202 0.163
Concentration limits D (column 1.4 mol/L; SR unit n.a.)Batch–SR 18 3.1 0.019 2.6 (3.4) 2.1 0.52 0.261 0.221SSR–SR I 60 6.8 0.038 3.8 (5.4) 17 0.94 0.205 0.162SSR–SR II 60 6.3 0.038 3.9 (5.5) 13 0.96 0.202 0.164SSR–SR III 60 6.5 0.038 3.8 (5.4) 1.9 0.96 0.202 0.163
Moreover, when the fresh feed concentration is higher than canbe achieved in the solvent removal unit (concentration limits A inTable 2), configuration II is superior to configuration III.
One advantage of solvent removal is increased product con-centration, as shown in Tables 2–4. Configurations I and IIIprovide basically the same product concentration for all the freshfeed concentrations. Therefore, the advantage of solvent removalis emphasized with dilute feed solutions. For the lowest freshfeed concentration (cFF = 0.34 mol/L, Table 4), product concentra-tions substantially higher than the fresh feed concentration wereobtained.
It is further observed in Tables 2–4 that batch chromatographywith solvent removal is more beneficial than SSR without solventremoval unless the concentration of the fresh feed is so high thatonly a minor amount of solvent can be removed. Batch chromatog-raphy with solvent removal is, therefore, a highly recommendedprocess alternative for the treatment of dilute feed streams.
In Tables 2–4, the process was optimized with respect tothe productivity only. The overall process performance consistingof productivity and eluent consumption can be visualized usingPareto frontiers. A Pareto frontier shows the Pareto optimum atwhich one property can be enhanced only at the expense of the
Table 4The operation parameters and performance of batch, batch–SR, SSR and SSR–SR processes at productivity maximum. cFF = 0.34 mol/L. Eluent consumption when the removedsolvent is not applied as eluent is shown in parentheses.
Process mode V , L/h Vinj , % of BV PRtot , mol/Lbed/h ECtot , L/mol VRF, – VSR/VFF , – cA1 , mol/L cB
2 , mol/L
Batch 18 3.1 0.005 12.6 n.a. n.a. 0.068 0.059SSR 30 5.5 0.006 15.1 n.a. n.a. 0.057 0.050
Concentration limits A (column n.a.; SR unit 1.1 mol/L)Batch–SR 18 3.1 0.015 2.0 (4.3) 3.3 0.69 0.207 0.176SSR–SR I 30 6 0.019 2.9 (5.2) 3.3 0.69 0.175 0.149SSR–SR II 60 10 0.017 7.3 (10.4) 2.3 0.91 0.104 0.086SSR–SR III 60 6.3 0.030 3.6 (6.8) 2.4 0.97 0.161 0.132
Concentration limits B (column n.a.; SR unit 1.4 mol/L)Batch–SR 18 3.1 0.019 0.90 (3.4) 4.1 0.76 0.261 0.221SSR–SR I 30 5.25 0.023 1.8 (4.3) 4.1 0.76 0.211 0.180SSR–SR II 60 12 0.019 5.6 (8.8) 2.3 0.95 0.124 0.102SSR–SR III 60 6.5 0.038 2.2 (5.4) 2.8 0.98 0.202 0.163
Concentration limits C (column 1.4 mol/L; SR unit 1.7 mol/L)Batch–SR 18 3.1 0.019 0.90 (3.4) 4.1 0.76 0.261 0.221SSR–SR I 30 5.5 0.028 0.90 (3.5) 5.0 0.80 0.257 0.218SSR–SR II 60 14 0.020 4.4 (7.6) 2.3 0.96 0.204 0.167SSR–SR III 60 6.5 0.038 2.2 (5.4) 2.8 0.98 0.202 0.163
Concentration limits D (column 1.4 mol/L; SR unit n.a.)Batch–SR 18 3.1 0.019 0.90 (3.4) 4.1 0.76 0.261 0.221SSR–SR I 60 6.5 0.038 2.2 (5.4) 46 0.98 0.202 0.163SSR–SR II 60 12.3 0.032 2.1 (5.3) 97 0.97 0.209 0.169SSR–SR III 60 6.5 0.038 2.2 (5.4) 2.8 0.98 0.202 0.163
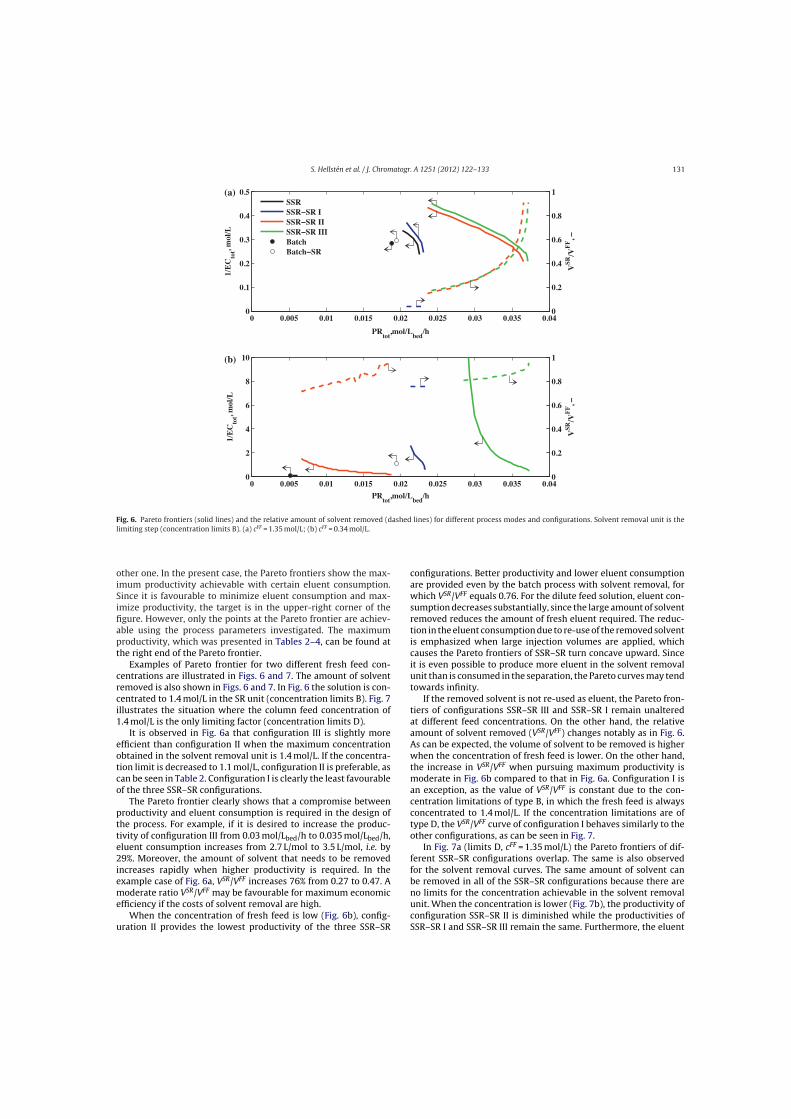
S. Hellstén et al. / J. Chromatogr. A 1251 (2012) 122– 133 131
0 0.005 0.01 0.015 0.02 0.025 0.03 0.035 0.040
0.1
0.2
0.3
0.4
0.5
PRtot
,mol/L bed/h
1/E
Cto
t, mol
/L
SSRSSR−SR ISSR−SR IISSR−SR IIIBatchBatch−SR
0
0.2
0.4
0.6
0.8
1
VSR
/VF
F, −
0 0.005 0.01 0.015 0.02 0.025 0.03 0.035 0.040
2
4
6
8
10
PRtot
,mol/L bed/h
1/E
Cto
t, mol
/L
(b)
(a)
0
0.2
0.4
0.6
0.8
1
VSR
/VF
F, −
Fig. 6. Pareto frontiers (solid lines) and the relative amount of solvent removed (dashed lines) for different process modes and configurations. Solvent removal unit is thelimiting step (concentration limits B). (a) cFF = 1.35 mol/L; (b) cFF = 0.34 mol/L.
other one. In the present case, the Pareto frontiers show the max-imum productivity achievable with certain eluent consumption.Since it is favourable to minimize eluent consumption and max-imize productivity, the target is in the upper-right corner of thefigure. However, only the points at the Pareto frontier are achiev-able using the process parameters investigated. The maximumproductivity, which was presented in Tables 2–4, can be found atthe right end of the Pareto frontier.
Examples of Pareto frontier for two different fresh feed con-centrations are illustrated in Figs. 6 and 7. The amount of solventremoved is also shown in Figs. 6 and 7. In Fig. 6 the solution is con-centrated to 1.4 mol/L in the SR unit (concentration limits B). Fig. 7illustrates the situation where the column feed concentration of1.4 mol/L is the only limiting factor (concentration limits D).
It is observed in Fig. 6a that configuration III is slightly moreefficient than configuration II when the maximum concentrationobtained in the solvent removal unit is 1.4 mol/L. If the concentra-tion limit is decreased to 1.1 mol/L, configuration II is preferable, ascan be seen in Table 2. Configuration I is clearly the least favourableof the three SSR–SR configurations.
The Pareto frontier clearly shows that a compromise betweenproductivity and eluent consumption is required in the design ofthe process. For example, if it is desired to increase the produc-tivity of configuration III from 0.03 mol/Lbed/h to 0.035 mol/Lbed/h,eluent consumption increases from 2.7 L/mol to 3.5 L/mol, i.e. by29%. Moreover, the amount of solvent that needs to be removedincreases rapidly when higher productivity is required. In theexample case of Fig. 6a, VSR/VFF increases 76% from 0.27 to 0.47. Amoderate ratio VSR/VFF may be favourable for maximum economicefficiency if the costs of solvent removal are high.
When the concentration of fresh feed is low (Fig. 6b), config-uration II provides the lowest productivity of the three SSR–SR
configurations. Better productivity and lower eluent consumptionare provided even by the batch process with solvent removal, forwhich VSR/VFF equals 0.76. For the dilute feed solution, eluent con-sumption decreases substantially, since the large amount of solventremoved reduces the amount of fresh eluent required. The reduc-tion in the eluent consumption due to re-use of the removed solventis emphasized when large injection volumes are applied, whichcauses the Pareto frontiers of SSR–SR turn concave upward. Sinceit is even possible to produce more eluent in the solvent removalunit than is consumed in the separation, the Pareto curves may tendtowards infinity.
If the removed solvent is not re-used as eluent, the Pareto fron-tiers of configurations SSR–SR III and SSR–SR I remain unalteredat different feed concentrations. On the other hand, the relativeamount of solvent removed (VSR/VFF) changes notably as in Fig. 6.As can be expected, the volume of solvent to be removed is higherwhen the concentration of fresh feed is lower. On the other hand,the increase in VSR/VFF when pursuing maximum productivity ismoderate in Fig. 6b compared to that in Fig. 6a. Configuration I isan exception, as the value of VSR/VFF is constant due to the con-centration limitations of type B, in which the fresh feed is alwaysconcentrated to 1.4 mol/L. If the concentration limitations are oftype D, the VSR/VFF curve of configuration I behaves similarly to theother configurations, as can be seen in Fig. 7.
In Fig. 7a (limits D, cFF = 1.35 mol/L) the Pareto frontiers of dif-ferent SSR–SR configurations overlap. The same is also observedfor the solvent removal curves. The same amount of solvent canbe removed in all of the SSR–SR configurations because there areno limits for the concentration achievable in the solvent removalunit. When the concentration is lower (Fig. 7b), the productivity ofconfiguration SSR–SR II is diminished while the productivities ofSSR–SR I and SSR–SR III remain the same. Furthermore, the eluent
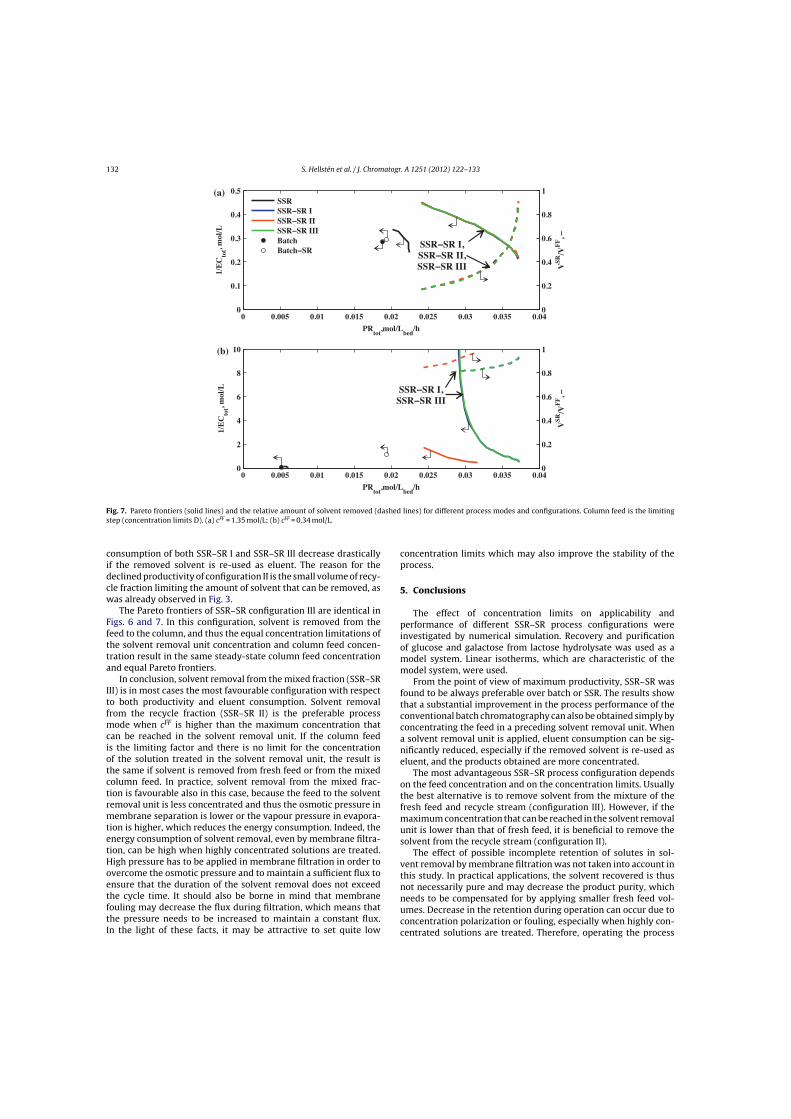
132 S. Hellstén et al. / J. Chromatogr. A 1251 (2012) 122– 133
0 0.005 0.01 0.015 0.02 0.025 0.03 0.035 0.040
0.1
0.2
0.3
0.4
0.5
PRtot
,mol/L bed/h
1/E
Cto
t, mol
/L
(a)SSRSSR−SR ISSR−SR IISSR−SR IIIBatchBatch−SR
0
0.2
0.4
0.6
0.8
1
VSR
/VF
F, −
0 0.005 0.01 0.015 0.02 0.025 0.03 0.035 0.040
2
4
6
8
10
PRtot
,mol/L bed/h
1/E
Cto
t, mol
/L
(b)
0
0.2
0.4
0.6
0.8
1
VSR
/VF
F, −
SSR−SR I,SSR−SR II,SSR−SR III
SSR−SR I,SSR−SR III
Fig. 7. Pareto frontiers (solid lines) and the relative amount of solvent removed (dashed lines) for different process modes and configurations. Column feed is the limitingstep (concentration limits D). (a) cFF = 1.35 mol/L; (b) cFF = 0.34 mol/L.
consumption of both SSR–SR I and SSR–SR III decrease drasticallyif the removed solvent is re-used as eluent. The reason for thedeclined productivity of configuration II is the small volume of recy-cle fraction limiting the amount of solvent that can be removed, aswas already observed in Fig. 3.
The Pareto frontiers of SSR–SR configuration III are identical inFigs. 6 and 7. In this configuration, solvent is removed from thefeed to the column, and thus the equal concentration limitations ofthe solvent removal unit concentration and column feed concen-tration result in the same steady-state column feed concentrationand equal Pareto frontiers.
In conclusion, solvent removal from the mixed fraction (SSR–SRIII) is in most cases the most favourable configuration with respectto both productivity and eluent consumption. Solvent removalfrom the recycle fraction (SSR–SR II) is the preferable processmode when cFF is higher than the maximum concentration thatcan be reached in the solvent removal unit. If the column feedis the limiting factor and there is no limit for the concentrationof the solution treated in the solvent removal unit, the result isthe same if solvent is removed from fresh feed or from the mixedcolumn feed. In practice, solvent removal from the mixed frac-tion is favourable also in this case, because the feed to the solventremoval unit is less concentrated and thus the osmotic pressure inmembrane separation is lower or the vapour pressure in evapora-tion is higher, which reduces the energy consumption. Indeed, theenergy consumption of solvent removal, even by membrane filtra-tion, can be high when highly concentrated solutions are treated.High pressure has to be applied in membrane filtration in order toovercome the osmotic pressure and to maintain a sufficient flux toensure that the duration of the solvent removal does not exceedthe cycle time. It should also be borne in mind that membranefouling may decrease the flux during filtration, which means thatthe pressure needs to be increased to maintain a constant flux.In the light of these facts, it may be attractive to set quite low
concentration limits which may also improve the stability of theprocess.
5. Conclusions
The effect of concentration limits on applicability andperformance of different SSR–SR process configurations wereinvestigated by numerical simulation. Recovery and purificationof glucose and galactose from lactose hydrolysate was used as amodel system. Linear isotherms, which are characteristic of themodel system, were used.
From the point of view of maximum productivity, SSR–SR wasfound to be always preferable over batch or SSR. The results showthat a substantial improvement in the process performance of theconventional batch chromatography can also be obtained simply byconcentrating the feed in a preceding solvent removal unit. Whena solvent removal unit is applied, eluent consumption can be sig-nificantly reduced, especially if the removed solvent is re-used aseluent, and the products obtained are more concentrated.
The most advantageous SSR–SR process configuration dependson the feed concentration and on the concentration limits. Usuallythe best alternative is to remove solvent from the mixture of thefresh feed and recycle stream (configuration III). However, if themaximum concentration that can be reached in the solvent removalunit is lower than that of fresh feed, it is beneficial to remove thesolvent from the recycle stream (configuration II).
The effect of possible incomplete retention of solutes in sol-vent removal by membrane filtration was not taken into account inthis study. In practical applications, the solvent recovered is thusnot necessarily pure and may decrease the product purity, whichneeds to be compensated for by applying smaller fresh feed vol-umes. Decrease in the retention during operation can occur due toconcentration polarization or fouling, especially when highly con-centrated solutions are treated. Therefore, operating the process
S. Hellstén et al. / J. Chromatogr. A 1251 (2012) 122– 133 133
at parameters yielding lower productivities than the theoreticalmaximum may be favourable to maintain the robustness of theprocess.
Acknowledgement
The Graduate School in Chemical Engineering is gratefullyacknowledged for funding.
References
[1] A. Seidel-Morgenstern, G. Guiochon, AIChE J. 39 (1993) 809.[2] M. Bailly, D. Tondeur, Chem. Eng. Sci. 37 (1982) 1199.[3] C.M. Grill, J. Chromatogr. A 796 (1998) 101.[4] S. Hellstén, T. Sainio, Sep. Sci. Technol., http://dx.doi.org/10.1080/
01496395.2012.666610, in press.[5] M. Kaspereit, T. Sainio, Chem. Eng. Sci. 66 (2011) 5428.
[6] J. Siitonen, T. Sainio, M. Kaspereit, Sep. Purif. Technol. 78 (2011) 21.[7] S. Abdelmoumen, L. Muhr, M. Bailly, O. Ludemann-Hombourger, Sep. Sci. Tech-
nol. 41 (2006) 2639.[8] G. Paredes, H. Rhee, M. Mazzotti, Ind. Eng. Chem. Res. 45 (2006) 6289.[9] N. Wagner, M. Fuereder, A. Bosshart, S. Panke, M. Bechtold, Org. Process Res.
Dev. 16 (2012) 323.[10] P. Saari, K. Häkkä, J. Jumppanen, H. Heikkilä, M. Hurme, Chem. Eng. Technol. 33
(2010) 137.[11] T. Sainio, M. Kaspereit, Sep. Purif. Technol. 66 (2009) 9.[12] J. Luo, Y. Wan, J. Membr. Sci. 372 (2011) 145.[13] J. Nowak, K. Gedicke, D. Antos, W. Piatkowski, A. Seidel-Morgenstern, J. Chro-
matogr. A 1164 (2007) 224.[14] J.A. Vente, H. Bosch, A.B. de Haan, P.J.T. Bussmann, J. Chromatogr. A 1066 (2005)
71.[15] P. Saari, H. Heikkilä, M. Hurme, J. Chem. Eng. Data 55 (2010) 3462.[16] H.E. Indyk, M.J. Edwards, D.C. Woollard, Food Chem. 57 (1996) 575.[17] S.F. Chung, C.Y. Wen, AIChE J. 14 (1968) 857.[18] M. Migliori, D. Gabriele, R. Di Sanzo, B. de Cindio, S. Correra, J. Chem. Eng. Data
52 (2007) 1347.

III
Reprinted with permission from Separation and Purification
Technology, Vol. 118, Hellstén, S., Heinonen, J., Sainio, T., Size-
exclusion chromatographic separation of hydroxy acids and
sodium hydroxide in spent pulping liquor, 234–241, Copyright
(2013) Elsevier.

Size-exclusion chromatographic separation of hydroxy acids and sodiumhydroxide in spent pulping liquor
Sanna Hellstén, Jari Heinonen, Tuomo Sainio ⇑Lappeenranta University of Technology, Laboratory of Separation Technology, Skinnarilankatu 34, FI-53850 Lappeenranta, Finland
a r t i c l e i n f o
Article history:Received 18 March 2013Received in revised form 15 June 2013Accepted 18 June 2013Available online 5 July 2013
Keywords:Hydroxy carboxylic acidsBlack liquorSize-exclusion chromatographySeparation mechanism
a b s t r a c t
In this work, chromatographic recovery of hydroxy acids and cooking alkali (NaOH) from spent pulpingliquor using size-exclusion chromatography (SEC) is investigated. Ultrafiltered black liquors from sodacooking of hardwood and softwood were used as feed and Sephadex G-10 as the stationary phase.Hydroxy acids were successfully separated from sodium hydroxide and the lignin content of the productfraction was reduced significantly. Fouling did not reduce the separation capability of the separationmedium in extended runs with more than 40 consecutive injections. High column loadings, up to 25%of the bed volume, were found applicable for separation of authentic solutions without compromisingthe resolution. This was attributed to size-exclusion of individual ions which leads to co-operative sorp-tion of NaOH in the presence of the sodium salts of hydroxy acids. The proposed mechanism was verifiedusing data from experiments with model solutions.
� 2013 Elsevier B.V. All rights reserved.
1. Introduction
Black liquor is the spent cooking liquor of pulping. It contains theinorganic cooking chemicals used in pulping but also alkaline degra-dation products of lignin and wood carbohydrates. These degrada-tion products include salts of hydroxy carboxylic acids [1–3],which could be widely utilised in the synthesis of various chemicalsand polymeric materials [4–6]. However, separation of these hydro-xy acids from the inorganics and lignin of black liquor is challenging.Various separation methods for recovering hydroxy acids and othervaluable compounds from black liquor have been proposed, includ-ing precipitation [7,8], ultrafiltration [9–11], electrodialysis [12],distillation [13], cooling crystallization [9], and chromatography[14]. In this paper, the focus is on chromatographic separation.
Alén et al. utilised ion-exclusion chromatography for separatinghydroxy acids from the inorganic compounds of black liquor [14].This separation technique requires that black liquor is first neutral-ized [14]. If the feed contains NaOH, several problems are encoun-tered. For example, use of a strong-acid cation exchange resin inCa2+ form under alkaline conditions may lead to precipitation ofcalcium hydroxide inside the resin which is consequently con-verted to Na+ form. The same precipitation reaction may also occurfor resins in other salt forms, as the solubility product of many me-tal hydroxides is low. As a consequence of hydroxide precipitation,pH of the liquid phase decreases leading to precipitation of lignin,which may cause blockage of the column.
In a recent paper, sodium salts of hydroxy acids were success-fully separated from sodium hydroxide (NaOH) of soda black liquorusing size-exclusion chromatography (SEC) as a part of a multistepseparation process for recovering hydroxy acids from black liquor[15]. A well-established size-exclusion gel, Sephadex G-10 withan exclusion limit of 700 g/mol, was used as the separation med-ium. The acids were recovered as their sodium salts under alkalineconditions, which enables a straightforward recovery of the cook-ing chemicals and thus facilitates integration of the process to apulp mill. However, the separation process based on SEC was notoptimised. The target of the present work is to achieve betterunderstanding on the separation mechanisms and on the long-term performance of the separation medium to facilitate the opti-misation the process.
The main application area of SEC is protein purification [20].The separation task in the recovery of hydroxy acids is similar todesalting of proteins, but the difference in molecular sizes of thecomponents to be separated is smaller.
Davankov and coworkers [21–23] have shown that SEC is alsoapplicable for separation of electrolytes with a minor differencein size. They found out that the separation selectivity is determinednot only by the size but also by the concentration of ionic species,and observed self-concentration of the separated electrolytes. It ispossible that similar phenomena are also present in the case ofseparating NaOH and sodium salts of hydroxy acids. A betterunderstanding of the separation mechanism is needed for selectionof optimal separation material and process parameters. Therefore,the separation mechanism in the separation of sodium salts ofhydroxy acids from NaOH on a size-exclusion gel is investigated
1383-5866/$ - see front matter � 2013 Elsevier B.V. All rights reserved.http://dx.doi.org/10.1016/j.seppur.2013.06.027
⇑ Corresponding author. Tel.: +358 40 3578683.E-mail address: [email protected] (T. Sainio).
Separation and Purification Technology 118 (2013) 234–241
Contents lists available at SciVerse ScienceDirect
Separation and Purification Technology
journal homepage: www.elsevier .com/locate /seppur
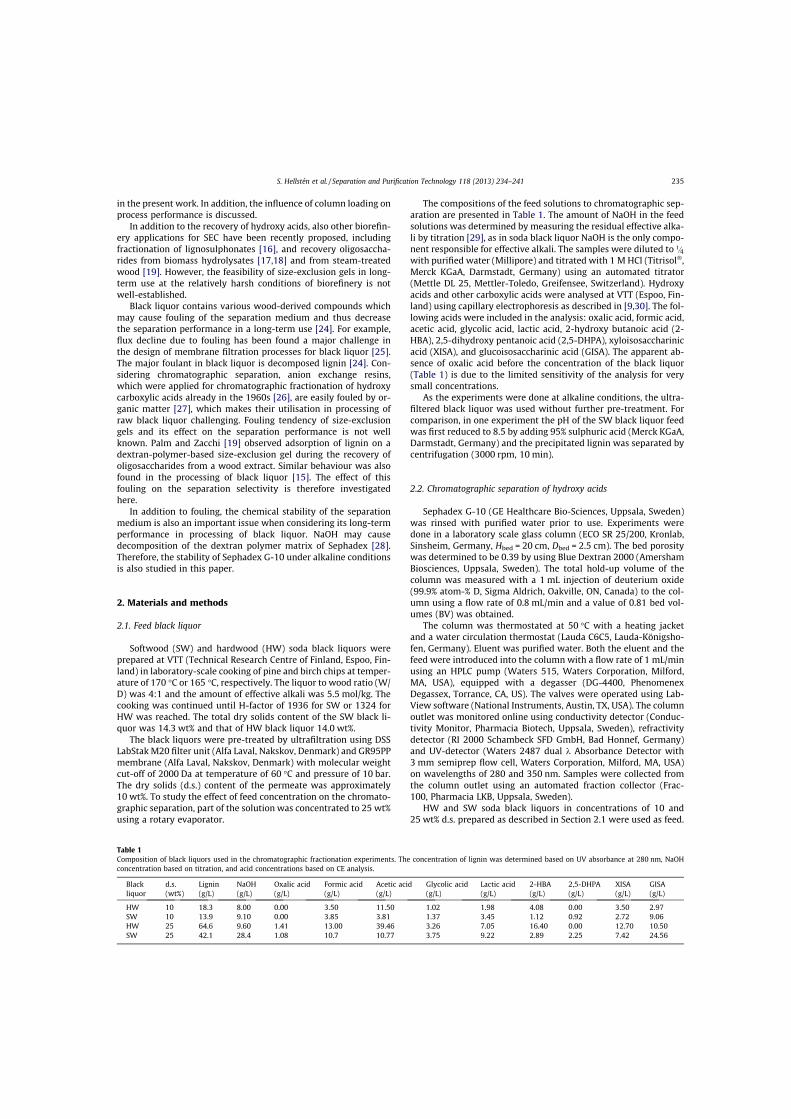
in the present work. In addition, the influence of column loading onprocess performance is discussed.
In addition to the recovery of hydroxy acids, also other biorefin-ery applications for SEC have been recently proposed, includingfractionation of lignosulphonates [16], and recovery oligosaccha-rides from biomass hydrolysates [17,18] and from steam-treatedwood [19]. However, the feasibility of size-exclusion gels in long-term use at the relatively harsh conditions of biorefinery is notwell-established.
Black liquor contains various wood-derived compounds whichmay cause fouling of the separation medium and thus decreasethe separation performance in a long-term use [24]. For example,flux decline due to fouling has been found a major challenge inthe design of membrane filtration processes for black liquor [25].The major foulant in black liquor is decomposed lignin [24]. Con-sidering chromatographic separation, anion exchange resins,which were applied for chromatographic fractionation of hydroxycarboxylic acids already in the 1960s [26], are easily fouled by or-ganic matter [27], which makes their utilisation in processing ofraw black liquor challenging. Fouling tendency of size-exclusiongels and its effect on the separation performance is not wellknown. Palm and Zacchi [19] observed adsorption of lignin on adextran-polymer-based size-exclusion gel during the recovery ofoligosaccharides from a wood extract. Similar behaviour was alsofound in the processing of black liquor [15]. The effect of thisfouling on the separation selectivity is therefore investigatedhere.
In addition to fouling, the chemical stability of the separationmedium is also an important issue when considering its long-termperformance in processing of black liquor. NaOH may causedecomposition of the dextran polymer matrix of Sephadex [28].Therefore, the stability of Sephadex G-10 under alkaline conditionsis also studied in this paper.
2. Materials and methods
2.1. Feed black liquor
Softwood (SW) and hardwood (HW) soda black liquors wereprepared at VTT (Technical Research Centre of Finland, Espoo, Fin-land) in laboratory-scale cooking of pine and birch chips at temper-ature of 170 �C or 165 �C, respectively. The liquor to wood ratio (W/D) was 4:1 and the amount of effective alkali was 5.5 mol/kg. Thecooking was continued until H-factor of 1936 for SW or 1324 forHW was reached. The total dry solids content of the SW black li-quor was 14.3 wt% and that of HW black liquor 14.0 wt%.
The black liquors were pre-treated by ultrafiltration using DSSLabStak M20 filter unit (Alfa Laval, Nakskov, Denmark) and GR95PPmembrane (Alfa Laval, Nakskov, Denmark) with molecular weightcut-off of 2000 Da at temperature of 60 �C and pressure of 10 bar.The dry solids (d.s.) content of the permeate was approximately10 wt%. To study the effect of feed concentration on the chromato-graphic separation, part of the solution was concentrated to 25 wt%using a rotary evaporator.
The compositions of the feed solutions to chromatographic sep-aration are presented in Table 1. The amount of NaOH in the feedsolutions was determined by measuring the residual effective alka-li by titration [29], as in soda black liquor NaOH is the only compo-nent responsible for effective alkali. The samples were diluted to 1=4
with purified water (Millipore) and titrated with 1 M HCl (Titrisol�,Merck KGaA, Darmstadt, Germany) using an automated titrator(Mettle DL 25, Mettler-Toledo, Greifensee, Switzerland). Hydroxyacids and other carboxylic acids were analysed at VTT (Espoo, Fin-land) using capillary electrophoresis as described in [9,30]. The fol-lowing acids were included in the analysis: oxalic acid, formic acid,acetic acid, glycolic acid, lactic acid, 2-hydroxy butanoic acid (2-HBA), 2,5-dihydroxy pentanoic acid (2,5-DHPA), xyloisosaccharinicacid (XISA), and glucoisosaccharinic acid (GISA). The apparent ab-sence of oxalic acid before the concentration of the black liquor(Table 1) is due to the limited sensitivity of the analysis for verysmall concentrations.
As the experiments were done at alkaline conditions, the ultra-filtered black liquor was used without further pre-treatment. Forcomparison, in one experiment the pH of the SW black liquor feedwas first reduced to 8.5 by adding 95% sulphuric acid (Merck KGaA,Darmstadt, Germany) and the precipitated lignin was separated bycentrifugation (3000 rpm, 10 min).
2.2. Chromatographic separation of hydroxy acids
Sephadex G-10 (GE Healthcare Bio-Sciences, Uppsala, Sweden)was rinsed with purified water prior to use. Experiments weredone in a laboratory scale glass column (ECO SR 25/200, Kronlab,Sinsheim, Germany, Hbed = 20 cm, Dbed = 2.5 cm). The bed porositywas determined to be 0.39 by using Blue Dextran 2000 (AmershamBiosciences, Uppsala, Sweden). The total hold-up volume of thecolumn was measured with a 1 mL injection of deuterium oxide(99.9% atom-% D, Sigma Aldrich, Oakville, ON, Canada) to the col-umn using a flow rate of 0.8 mL/min and a value of 0.81 bed vol-umes (BV) was obtained.
The column was thermostated at 50 �C with a heating jacketand a water circulation thermostat (Lauda C6C5, Lauda-Königsho-fen, Germany). Eluent was purified water. Both the eluent and thefeed were introduced into the column with a flow rate of 1 mL/minusing an HPLC pump (Waters 515, Waters Corporation, Milford,MA, USA), equipped with a degasser (DG-4400, PhenomenexDegassex, Torrance, CA, US). The valves were operated using Lab-View software (National Instruments, Austin, TX, USA). The columnoutlet was monitored online using conductivity detector (Conduc-tivity Monitor, Pharmacia Biotech, Uppsala, Sweden), refractivitydetector (RI 2000 Schambeck SFD GmbH, Bad Honnef, Germany)and UV-detector (Waters 2487 dual k Absorbance Detector with3 mm semiprep flow cell, Waters Corporation, Milford, MA, USA)on wavelengths of 280 and 350 nm. Samples were collected fromthe column outlet using an automated fraction collector (Frac-100, Pharmacia LKB, Uppsala, Sweden).
HW and SW soda black liquors in concentrations of 10 and25 wt% d.s. prepared as described in Section 2.1 were used as feed.
Table 1Composition of black liquors used in the chromatographic fractionation experiments. The concentration of lignin was determined based on UV absorbance at 280 nm, NaOHconcentration based on titration, and acid concentrations based on CE analysis.
Blackliquor
d.s.(wt%)
Lignin(g/L)
NaOH(g/L)
Oxalic acid(g/L)
Formic acid(g/L)
Acetic acid(g/L)
Glycolic acid(g/L)
Lactic acid(g/L)
2-HBA(g/L)
2,5-DHPA(g/L)
XISA(g/L)
GISA(g/L)
HW 10 18.3 8.00 0.00 3.50 11.50 1.02 1.98 4.08 0.00 3.50 2.97SW 10 13.9 9.10 0.00 3.85 3.81 1.37 3.45 1.12 0.92 2.72 9.06HW 25 64.6 9.60 1.41 13.00 39.46 3.26 7.05 16.40 0.00 12.70 10.50SW 25 42.1 28.4 1.08 10.7 10.77 3.75 9.22 2.89 2.25 7.42 24.56
S. Hellstén et al. / Separation and Purification Technology 118 (2013) 234–241 235
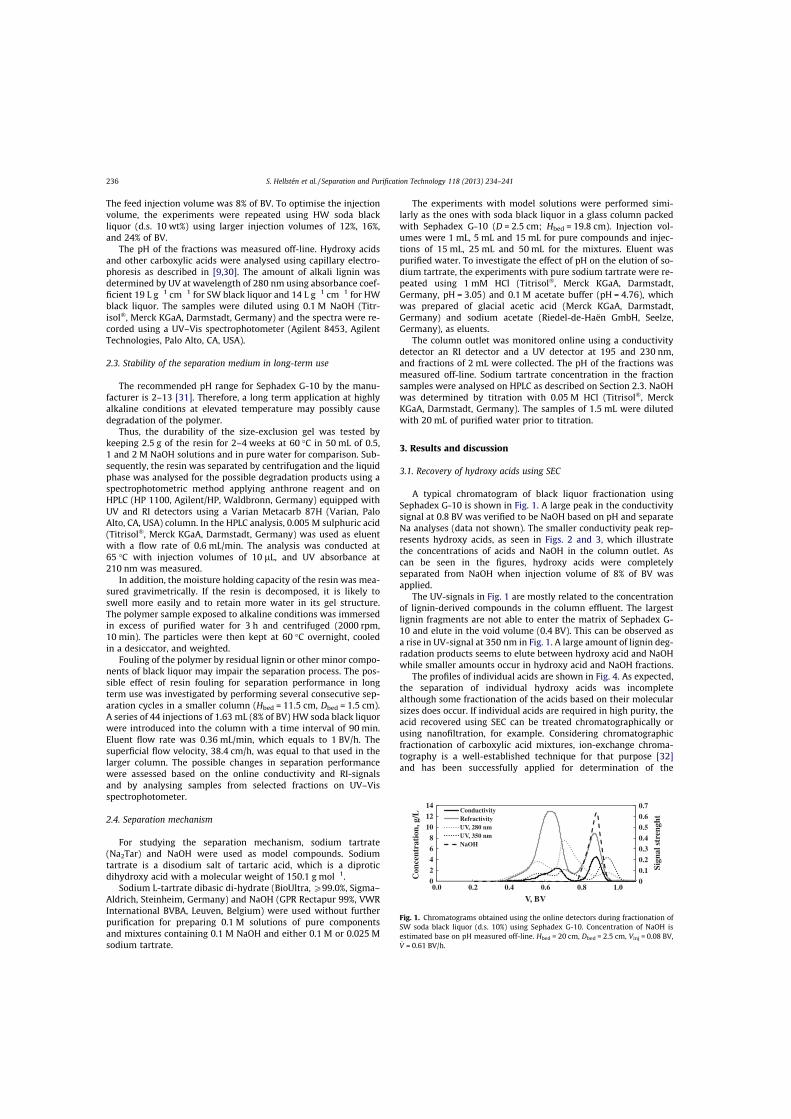
The feed injection volume was 8% of BV. To optimise the injectionvolume, the experiments were repeated using HW soda blackliquor (d.s. 10 wt%) using larger injection volumes of 12%, 16%,and 24% of BV.
The pH of the fractions was measured off-line. Hydroxy acidsand other carboxylic acids were analysed using capillary electro-phoresis as described in [9,30]. The amount of alkali lignin wasdetermined by UV at wavelength of 280 nm using absorbance coef-ficient 19 L g�1 cm�1 for SW black liquor and 14 L g�1 cm�1 for HWblack liquor. The samples were diluted using 0.1 M NaOH (Titr-isol�, Merck KGaA, Darmstadt, Germany) and the spectra were re-corded using a UV–Vis spectrophotometer (Agilent 8453, AgilentTechnologies, Palo Alto, CA, USA).
2.3. Stability of the separation medium in long-term use
The recommended pH range for Sephadex G-10 by the manu-facturer is 2–13 [31]. Therefore, a long term application at highlyalkaline conditions at elevated temperature may possibly causedegradation of the polymer.
Thus, the durability of the size-exclusion gel was tested bykeeping 2.5 g of the resin for 2–4 weeks at 60 �C in 50 mL of 0.5,1 and 2 M NaOH solutions and in pure water for comparison. Sub-sequently, the resin was separated by centrifugation and the liquidphase was analysed for the possible degradation products using aspectrophotometric method applying anthrone reagent and onHPLC (HP 1100, Agilent/HP, Waldbronn, Germany) equipped withUV and RI detectors using a Varian Metacarb 87H (Varian, PaloAlto, CA, USA) column. In the HPLC analysis, 0.005 M sulphuric acid(Titrisol�, Merck KGaA, Darmstadt, Germany) was used as eluentwith a flow rate of 0.6 mL/min. The analysis was conducted at65 �C with injection volumes of 10 lL, and UV absorbance at210 nm was measured.
In addition, the moisture holding capacity of the resin was mea-sured gravimetrically. If the resin is decomposed, it is likely toswell more easily and to retain more water in its gel structure.The polymer sample exposed to alkaline conditions was immersedin excess of purified water for 3 h and centrifuged (2000 rpm,10 min). The particles were then kept at 60 �C overnight, cooledin a desiccator, and weighted.
Fouling of the polymer by residual lignin or other minor compo-nents of black liquor may impair the separation process. The pos-sible effect of resin fouling for separation performance in longterm use was investigated by performing several consecutive sep-aration cycles in a smaller column (Hbed = 11.5 cm, Dbed = 1.5 cm).A series of 44 injections of 1.63 mL (8% of BV) HW soda black liquorwere introduced into the column with a time interval of 90 min.Eluent flow rate was 0.36 mL/min, which equals to 1 BV/h. Thesuperficial flow velocity, 38.4 cm/h, was equal to that used in thelarger column. The possible changes in separation performancewere assessed based on the online conductivity and RI-signalsand by analysing samples from selected fractions on UV–Visspectrophotometer.
2.4. Separation mechanism
For studying the separation mechanism, sodium tartrate(Na2Tar) and NaOH were used as model compounds. Sodiumtartrate is a disodium salt of tartaric acid, which is a diproticdihydroxy acid with a molecular weight of 150.1 g mol�1.
Sodium L-tartrate dibasic di-hydrate (BioUltra, P99.0%, Sigma–Aldrich, Steinheim, Germany) and NaOH (GPR Rectapur 99%, VWRInternational BVBA, Leuven, Belgium) were used without furtherpurification for preparing 0.1 M solutions of pure componentsand mixtures containing 0.1 M NaOH and either 0.1 M or 0.025 Msodium tartrate.
The experiments with model solutions were performed simi-larly as the ones with soda black liquor in a glass column packedwith Sephadex G-10 (D = 2.5 cm; Hbed = 19.8 cm). Injection vol-umes were 1 mL, 5 mL and 15 mL for pure compounds and injec-tions of 15 mL, 25 mL and 50 mL for the mixtures. Eluent waspurified water. To investigate the effect of pH on the elution of so-dium tartrate, the experiments with pure sodium tartrate were re-peated using 1 mM HCl (Titrisol�, Merck KGaA, Darmstadt,Germany, pH = 3.05) and 0.1 M acetate buffer (pH = 4.76), whichwas prepared of glacial acetic acid (Merck KGaA, Darmstadt,Germany) and sodium acetate (Riedel-de-Haën GmbH, Seelze,Germany), as eluents.
The column outlet was monitored online using a conductivitydetector an RI detector and a UV detector at 195 and 230 nm,and fractions of 2 mL were collected. The pH of the fractions wasmeasured off-line. Sodium tartrate concentration in the fractionsamples were analysed on HPLC as described on Section 2.3. NaOHwas determined by titration with 0.05 M HCl (Titrisol�, MerckKGaA, Darmstadt, Germany). The samples of 1.5 mL were dilutedwith 20 mL of purified water prior to titration.
3. Results and discussion
3.1. Recovery of hydroxy acids using SEC
A typical chromatogram of black liquor fractionation usingSephadex G-10 is shown in Fig. 1. A large peak in the conductivitysignal at 0.8 BV was verified to be NaOH based on pH and separateNa analyses (data not shown). The smaller conductivity peak rep-resents hydroxy acids, as seen in Figs. 2 and 3, which illustratethe concentrations of acids and NaOH in the column outlet. Ascan be seen in the figures, hydroxy acids were completelyseparated from NaOH when injection volume of 8% of BV wasapplied.
The UV-signals in Fig. 1 are mostly related to the concentrationof lignin-derived compounds in the column effluent. The largestlignin fragments are not able to enter the matrix of Sephadex G-10 and elute in the void volume (0.4 BV). This can be observed asa rise in UV-signal at 350 nm in Fig. 1. A large amount of lignin deg-radation products seems to elute between hydroxy acid and NaOHwhile smaller amounts occur in hydroxy acid and NaOH fractions.
The profiles of individual acids are shown in Fig. 4. As expected,the separation of individual hydroxy acids was incompletealthough some fractionation of the acids based on their molecularsizes does occur. If individual acids are required in high purity, theacid recovered using SEC can be treated chromatographically orusing nanofiltration, for example. Considering chromatographicfractionation of carboxylic acid mixtures, ion-exchange chroma-tography is a well-established technique for that purpose [32]and has been successfully applied for determination of the
0
2
4
6
8
10
12
14
0.0 0.2 0.4 0.6 0.8 1.00
0.1
0.2
0.3
0.4
0.5
0.6
0.7
Con
cent
rati
on, g
/L
V, BV
Sign
al s
tren
ght
ConductivityRefractivityUV, 280 nmUV, 350 nmNaOH
Fig. 1. Chromatograms obtained using the online detectors during fractionation ofSW soda black liquor (d.s. 10%) using Sephadex G-10. Concentration of NaOH isestimated base on pH measured off-line. Hbed = 20 cm, Dbed = 2.5 cm, Vinj = 0.08 BV,_V = 0.61 BV/h.
236 S. Hellstén et al. / Separation and Purification Technology 118 (2013) 234–241
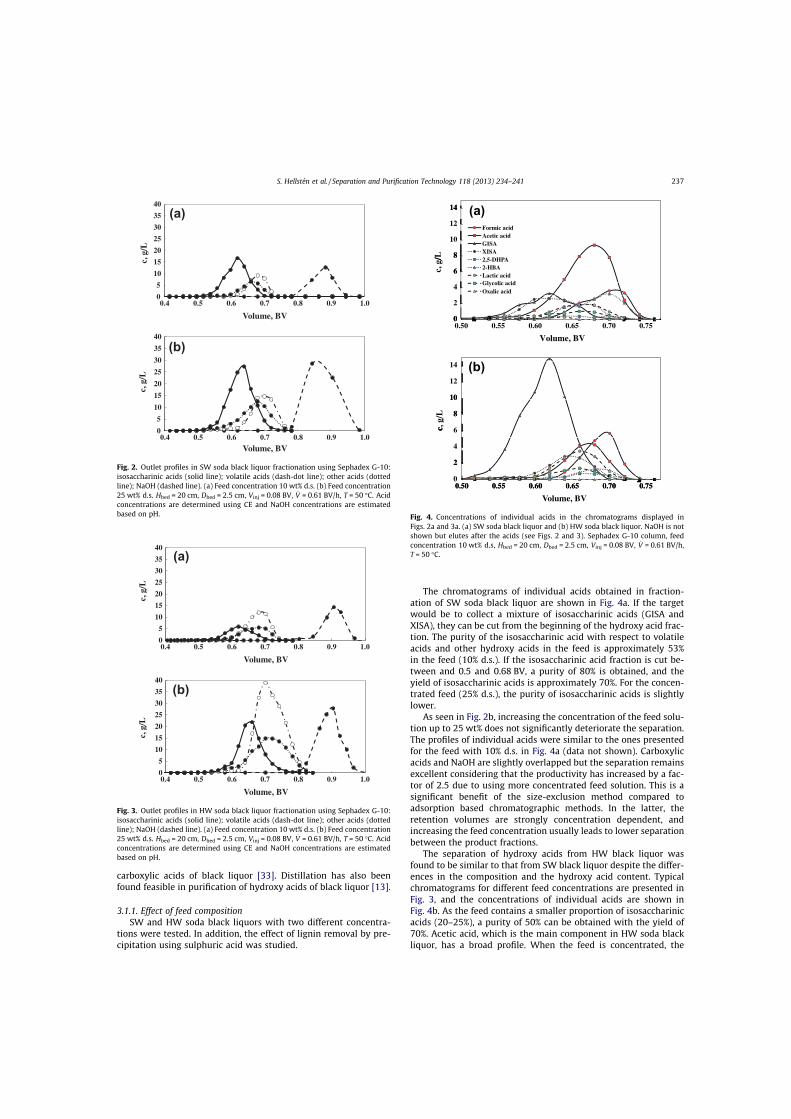
carboxylic acids of black liquor [33]. Distillation has also beenfound feasible in purification of hydroxy acids of black liquor [13].
3.1.1. Effect of feed compositionSW and HW soda black liquors with two different concentra-
tions were tested. In addition, the effect of lignin removal by pre-cipitation using sulphuric acid was studied.
The chromatograms of individual acids obtained in fraction-ation of SW soda black liquor are shown in Fig. 4a. If the targetwould be to collect a mixture of isosaccharinic acids (GISA andXISA), they can be cut from the beginning of the hydroxy acid frac-tion. The purity of the isosaccharinic acid with respect to volatileacids and other hydroxy acids in the feed is approximately 53%in the feed (10% d.s.). If the isosaccharinic acid fraction is cut be-tween and 0.5 and 0.68 BV, a purity of 80% is obtained, and theyield of isosaccharinic acids is approximately 70%. For the concen-trated feed (25% d.s.), the purity of isosaccharinic acids is slightlylower.
As seen in Fig. 2b, increasing the concentration of the feed solu-tion up to 25 wt% does not significantly deteriorate the separation.The profiles of individual acids were similar to the ones presentedfor the feed with 10% d.s. in Fig. 4a (data not shown). Carboxylicacids and NaOH are slightly overlapped but the separation remainsexcellent considering that the productivity has increased by a fac-tor of 2.5 due to using more concentrated feed solution. This is asignificant benefit of the size-exclusion method compared toadsorption based chromatographic methods. In the latter, theretention volumes are strongly concentration dependent, andincreasing the feed concentration usually leads to lower separationbetween the product fractions.
The separation of hydroxy acids from HW black liquor wasfound to be similar to that from SW black liquor despite the differ-ences in the composition and the hydroxy acid content. Typicalchromatograms for different feed concentrations are presented inFig. 3, and the concentrations of individual acids are shown inFig. 4b. As the feed contains a smaller proportion of isosaccharinicacids (20–25%), a purity of 50% can be obtained with the yield of70%. Acetic acid, which is the main component in HW soda blackliquor, has a broad profile. When the feed is concentrated, the
0
5
10
15
20
25
30
35
40
0.4 0.5 0.6 0.7 0.8 0.9 1.0
c, g
/L
Volume, BV
0
5
10
15
20
25
30
35
40
0.4 0.5 0.6 0.7 0.8 0.9 1.0
c, g
/L
Volume, BV
(a)
(b)
Fig. 2. Outlet profiles in SW soda black liquor fractionation using Sephadex G-10:isosaccharinic acids (solid line); volatile acids (dash-dot line); other acids (dottedline); NaOH (dashed line). (a) Feed concentration 10 wt% d.s. (b) Feed concentration25 wt% d.s. Hbed = 20 cm, Dbed = 2.5 cm, Vinj = 0.08 BV, _V = 0.61 BV/h, T = 50 �C. Acidconcentrations are determined using CE and NaOH concentrations are estimatedbased on pH.
0
5
10
15
20
25
30
35
40
0.4 0.5 0.6 0.7 0.8 0.9 1.0
c, g
/L
Volume, BV
0
5
10
15
20
25
30
35
40
0.4 0.5 0.6 0.7 0.8 0.9 1.0
c, g
/L
Volume, BV
(a)
(b)
Fig. 3. Outlet profiles in HW soda black liquor fractionation using Sephadex G-10:isosaccharinic acids (solid line); volatile acids (dash-dot line); other acids (dottedline); NaOH (dashed line). (a) Feed concentration 10 wt% d.s. (b) Feed concentration25 wt% d.s. Hbed = 20 cm, Dbed = 2.5 cm, Vinj = 0.08 BV, _V = 0.61 BV/h, T = 50 �C. Acidconcentrations are determined using CE and NaOH concentrations are estimatedbased on pH.
1414 (a)12
Formic acid
10 Acetic acid
8/L
XISA
6
8
c, g
/ 2,5-DHPA2-HBA6Lactic acid
4 Oxalic acid
2
000.50 0.55 0.60 0.65 0.70 0.75
Volume, BV
14 (b)12
10
8
10
8
c, g
/L6c4
22
00.50 0.55 0.60 0.65 0.70 0.750.50 0.55 0.60 0.65 0.70 0.75
Volume, BV
GISA
Glycolic acid
Fig. 4. Concentrations of individual acids in the chromatograms displayed inFigs. 2a and 3a. (a) SW soda black liquor and (b) HW soda black liquor. NaOH is notshown but elutes after the acids (see Figs. 2 and 3). Sephadex G-10 column, feedconcentration 10 wt% d.s, Hbed = 20 cm, Dbed = 2.5 cm, Vinj = 0.08 BV, _V = 0.61 BV/h,T = 50 �C.
S. Hellstén et al. / Separation and Purification Technology 118 (2013) 234–241 237

overlapping of hydroxy acids and NaOH is slightly more severe forHW black liquor (Fig. 3b) than for SW black liquor (Fig. 2b).
Interestingly, for HW soda black liquor, a pink coloured bandwas observed moving very slowly in the column. The colour wasnot observed in the case of concentrated HW soda black liquor,which indicated that the compound responsible for the colourwas decomposed at the elevated temperature during the concen-tration by evaporation. The coloured compound was identified as2,6-dimethoxy hydroquinone, a degradation product of syringyllignin, in a GC/MS analysis (data not shown). Hydroquinones areundesired impurities in hydroxy acid fractions recovered fromblack liquor since they may act as inhibitors in polymerisation[34]. If several injections are performed sequentially, the purityof the hydroxy acid fraction may decrease as the hydroquinonepasses to the effluent. Therefore, quinone compounds must be re-moved by washing the resin regularly. Ethanol was found a suit-able solvent for washing.
The amount of residual lignin fragments in the feed can be re-duced by precipitation using sulphuric acid. However, the reduc-tion of pH by an addition of sulphuric acid impaired theseparation of hydroxy acids, because sulphates eluted significantlyfaster (elution volume of Na2SO4 0.52 BV) than hydroxides (elutionvolume of NaOH 0.80 BV) through the bed of Sephadex G-10. Con-sequently, sulphate would remain as an impurity in the hydroxyacid fraction.
3.1.2. Effect of injection volumeThe injection volume is an important factor for the performance
of chromatographic batch separation. In the experiments discussedin previous section, a constant injection volume of 0.08 BV wasused. If a larger injection volume can be applied, higher productionrate and product concentration may be obtained. Therefore, frac-tionation of HW soda black liquor was tested using different injec-tion volumes. The outlet profiles obtained are shown in Fig. 5. Theestimated purity of a product fraction that provides 100% yield foracids for each injection volume is presented in Table 2.
The optimisation study showed that the injection volume canbe increased to 12% of BV and more without largely compromising
the yield or product purity (see Table 2). In particular, the first-eluting hydroxy acids of large molecular sizes, GISA and XISA,can be still recovered in high purity while a small amount of NaOHoccurs among the smaller hydroxy acids. As seen in Fig. 5, the con-centration of lignin is the highest at the rear of the hydroxy acidprofile, which further decreases the purity of acids with smallmolecular size. When the injection volume was raised, the concen-tration of lignin in the whole hydroxy acid fraction obviously in-creased. However, the purity of acids with respect to lignin is notsubstantially changed since the concentration of acids is also in-creased as seen in Table 2.
With the large injection volumes of 16% and 24% of BV, the tail-ing front of NaOH peak clearly overlaps with the end part of the hy-droxy acid profile. However, the separation of hydroxy acids andNaOH does not deteriorate much as the retention time of NaOH be-comes prolonged with the larger injection volumes. The cycle timeincreases from 0.95 BV to 1.15 when the injection volume is tri-pled. This unusual phenomenon was investigated in more detailand is discussed in Section 3.3. As the use of large injection vol-umes is possible, the dilution of the recovered hydroxy acid canbe minimised. The dilution factor reduces approximately by 53%(from 3.5 to 1.6) when the injection volume is increased from 8%to 24%.
The total purity of hydroxy acids was increased by 30–40% dur-ing the SEC treatment. As seen in Table 2, the main impurity left inthe hydroxy acid fraction is volatile acids, which are present inlarge amounts in HW black liquor. They can be readily separatedby distillation [13]. Residual lignin and sodium can be removedusing adsorption and ion-exchange as described in [15].
3.2. Stability of the separation medium
The fouling tendency and chemical resistance of the size-exclu-sion gel in long term use was studied by performing a series of con-secutive injections and by exposing the material to NaOH solutionsof different concentration at an elevated temperature.
Example profiles of selected injections during the series of 44injections of HW black liquor to the column are shown in Fig. 6.No changes in the separation were observed in the conductivityand RI-signals, which indicates that fouling of the stationary phaseparticles does not affect the separation of hydroxy acids and NaOH.The small differences in the peak heights may be related to minorvariations of the feed flow rate.
On the other hand, the purity of hydroxy acid fraction decreasedto some extent during the consecutive injections due to accumula-tion of lignin. Based on UV absorption at 280 nm, the amount oflignin in the hydroxy acid fraction was doubled during the 44 cy-cles. Therefore, a regular washing of the stationary phase is re-quired to maintain the product purity at a reasonable level. Thesame observation was made by Palm and Zacchi [19] who applieda similar size-exclusion gel for processing the liquid fraction fromsteam treatment of spruce wood.
0
5
10
0
0.2
0.4
0.6
0.4 0.5 0.6 0.7 0.8 0.9 1.0 1.1
Lig
nin,
g/L
Con
duct
ivit
y [O
H- ],
mol
/L
V, BV
Vinj = 12% of BV
0
5
10
0
0.2
0.4
0.6
0.4 0.5 0.6 0.7 0.8 0.9 1.0 1.1
Lig
nin,
g/L
Con
duct
ivit
y [O
H- ],
mol
/L
V, BV
Vinj = 16% of BV
0
5
10
0
0.2
0.4
0.6
0.4 0.5 0.6 0.7 0.8 0.9 1.0 1.1
Lig
nin,
g/L
Con
duct
ivit
y [ O
H- ],
mol
/L
V, BV
Vinj = 24% of BV
Conductivity Hydroxide ion Lignin (UV 280 nm)
Fig. 5. Chromatograms obtained using different injection volumes of HW sodablack liquor (10% d.s.). Hbed = 20 cm, Dbed = 2.5 cm, _V = 0.61 BV/h, T = 50 �C.
Table 2Composition of the feed and acid fractions collected from HW soda black liquor usingSEC with different injection volumes. The fraction cut times are chosen so that 100%yield for acids is obtained. Concentrations of lignin and NaOH are determined basedon UV absorbance at 280 nm and pH, both measured from samples collected from thecolumn outlet.
Vinj, % ofBV
OH-acids(g/L)
Other acids(g/L)
Lignin(g/L)
NaOH(g/L)
OH-acids(w-%)
FEED 13.55 15.00 18.30 8.00 0.258 3.90 4.32 2.95 0.07 0.3512 5.43 6.01 4.23 0.10 0.3416 6.76 7.48 5.80 0.07 0.3424 8.22 9.10 7.94 0.02 0.33
238 S. Hellstén et al. / Separation and Purification Technology 118 (2013) 234–241
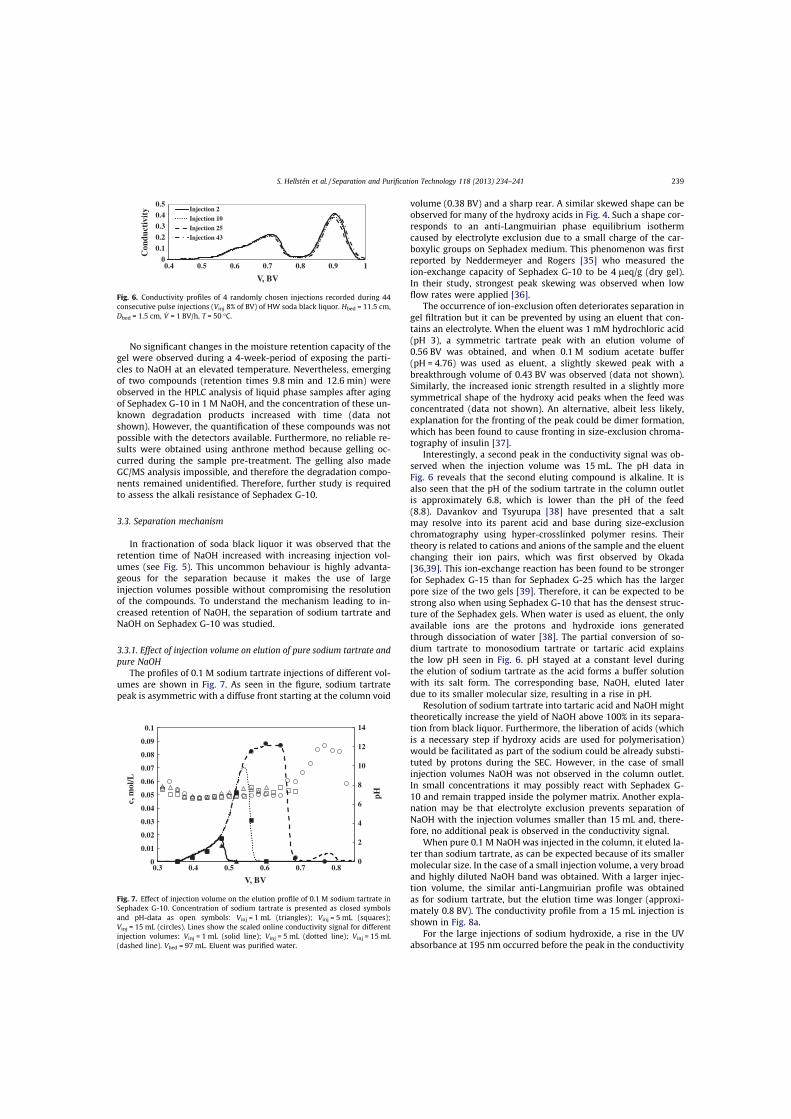
No significant changes in the moisture retention capacity of thegel were observed during a 4-week-period of exposing the parti-cles to NaOH at an elevated temperature. Nevertheless, emergingof two compounds (retention times 9.8 min and 12.6 min) wereobserved in the HPLC analysis of liquid phase samples after agingof Sephadex G-10 in 1 M NaOH, and the concentration of these un-known degradation products increased with time (data notshown). However, the quantification of these compounds was notpossible with the detectors available. Furthermore, no reliable re-sults were obtained using anthrone method because gelling oc-curred during the sample pre-treatment. The gelling also madeGC/MS analysis impossible, and therefore the degradation compo-nents remained unidentified. Therefore, further study is requiredto assess the alkali resistance of Sephadex G-10.
3.3. Separation mechanism
In fractionation of soda black liquor it was observed that theretention time of NaOH increased with increasing injection vol-umes (see Fig. 5). This uncommon behaviour is highly advanta-geous for the separation because it makes the use of largeinjection volumes possible without compromising the resolutionof the compounds. To understand the mechanism leading to in-creased retention of NaOH, the separation of sodium tartrate andNaOH on Sephadex G-10 was studied.
3.3.1. Effect of injection volume on elution of pure sodium tartrate andpure NaOH
The profiles of 0.1 M sodium tartrate injections of different vol-umes are shown in Fig. 7. As seen in the figure, sodium tartratepeak is asymmetric with a diffuse front starting at the column void
volume (0.38 BV) and a sharp rear. A similar skewed shape can beobserved for many of the hydroxy acids in Fig. 4. Such a shape cor-responds to an anti-Langmuirian phase equilibrium isothermcaused by electrolyte exclusion due to a small charge of the car-boxylic groups on Sephadex medium. This phenomenon was firstreported by Neddermeyer and Rogers [35] who measured theion-exchange capacity of Sephadex G-10 to be 4 leq/g (dry gel).In their study, strongest peak skewing was observed when lowflow rates were applied [36].
The occurrence of ion-exclusion often deteriorates separation ingel filtration but it can be prevented by using an eluent that con-tains an electrolyte. When the eluent was 1 mM hydrochloric acid(pH 3), a symmetric tartrate peak with an elution volume of0.56 BV was obtained, and when 0.1 M sodium acetate buffer(pH = 4.76) was used as eluent, a slightly skewed peak with abreakthrough volume of 0.43 BV was observed (data not shown).Similarly, the increased ionic strength resulted in a slightly moresymmetrical shape of the hydroxy acid peaks when the feed wasconcentrated (data not shown). An alternative, albeit less likely,explanation for the fronting of the peak could be dimer formation,which has been found to cause fronting in size-exclusion chroma-tography of insulin [37].
Interestingly, a second peak in the conductivity signal was ob-served when the injection volume was 15 mL. The pH data inFig. 6 reveals that the second eluting compound is alkaline. It isalso seen that the pH of the sodium tartrate in the column outletis approximately 6.8, which is lower than the pH of the feed(8.8). Davankov and Tsyurupa [38] have presented that a saltmay resolve into its parent acid and base during size-exclusionchromatography using hyper-crosslinked polymer resins. Theirtheory is related to cations and anions of the sample and the eluentchanging their ion pairs, which was first observed by Okada[36,39]. This ion-exchange reaction has been found to be strongerfor Sephadex G-15 than for Sephadex G-25 which has the largerpore size of the two gels [39]. Therefore, it can be expected to bestrong also when using Sephadex G-10 that has the densest struc-ture of the Sephadex gels. When water is used as eluent, the onlyavailable ions are the protons and hydroxide ions generatedthrough dissociation of water [38]. The partial conversion of so-dium tartrate to monosodium tartrate or tartaric acid explainsthe low pH seen in Fig. 6. pH stayed at a constant level duringthe elution of sodium tartrate as the acid forms a buffer solutionwith its salt form. The corresponding base, NaOH, eluted laterdue to its smaller molecular size, resulting in a rise in pH.
Resolution of sodium tartrate into tartaric acid and NaOH mighttheoretically increase the yield of NaOH above 100% in its separa-tion from black liquor. Furthermore, the liberation of acids (whichis a necessary step if hydroxy acids are used for polymerisation)would be facilitated as part of the sodium could be already substi-tuted by protons during the SEC. However, in the case of smallinjection volumes NaOH was not observed in the column outlet.In small concentrations it may possibly react with Sephadex G-10 and remain trapped inside the polymer matrix. Another expla-nation may be that electrolyte exclusion prevents separation ofNaOH with the injection volumes smaller than 15 mL and, there-fore, no additional peak is observed in the conductivity signal.
When pure 0.1 M NaOH was injected in the column, it eluted la-ter than sodium tartrate, as can be expected because of its smallermolecular size. In the case of a small injection volume, a very broadand highly diluted NaOH band was obtained. With a larger injec-tion volume, the similar anti-Langmuirian profile was obtainedas for sodium tartrate, but the elution time was longer (approxi-mately 0.8 BV). The conductivity profile from a 15 mL injection isshown in Fig. 8a.
For the large injections of sodium hydroxide, a rise in the UVabsorbance at 195 nm occurred before the peak in the conductivity
0
0.1
0.2
0.3
0.4
0.5
0.4 0.5 0.6 0.7 0.8 0.9 1
Con
duct
ivit
y
V, BV
Injection 2
Injection 10
Injection 25
Injection 43
Fig. 6. Conductivity profiles of 4 randomly chosen injections recorded during 44consecutive pulse injections (Vinj 8% of BV) of HW soda black liquor. Hbed = 11.5 cm,Dbed = 1.5 cm, _V = 1 BV/h, T = 50 �C.
0
2
4
6
8
10
12
14
0
0.01
0.02
0.03
0.04
0.05
0.06
0.07
0.08
0.09
0.1
0.3 0.4 0.5 0.6 0.7 0.8
pHc,m
ol/L
V, BV
Fig. 7. Effect of injection volume on the elution profile of 0.1 M sodium tartrate inSephadex G-10. Concentration of sodium tartrate is presented as closed symbolsand pH-data as open symbols: Vinj = 1 mL (triangles); Vinj = 5 mL (squares);Vinj = 15 mL (circles). Lines show the scaled online conductivity signal for differentinjection volumes: Vinj = 1 mL (solid line); Vinj = 5 mL (dotted line); Vinj = 15 mL(dashed line). Vbed = 97 mL. Eluent was purified water.
S. Hellstén et al. / Separation and Purification Technology 118 (2013) 234–241 239
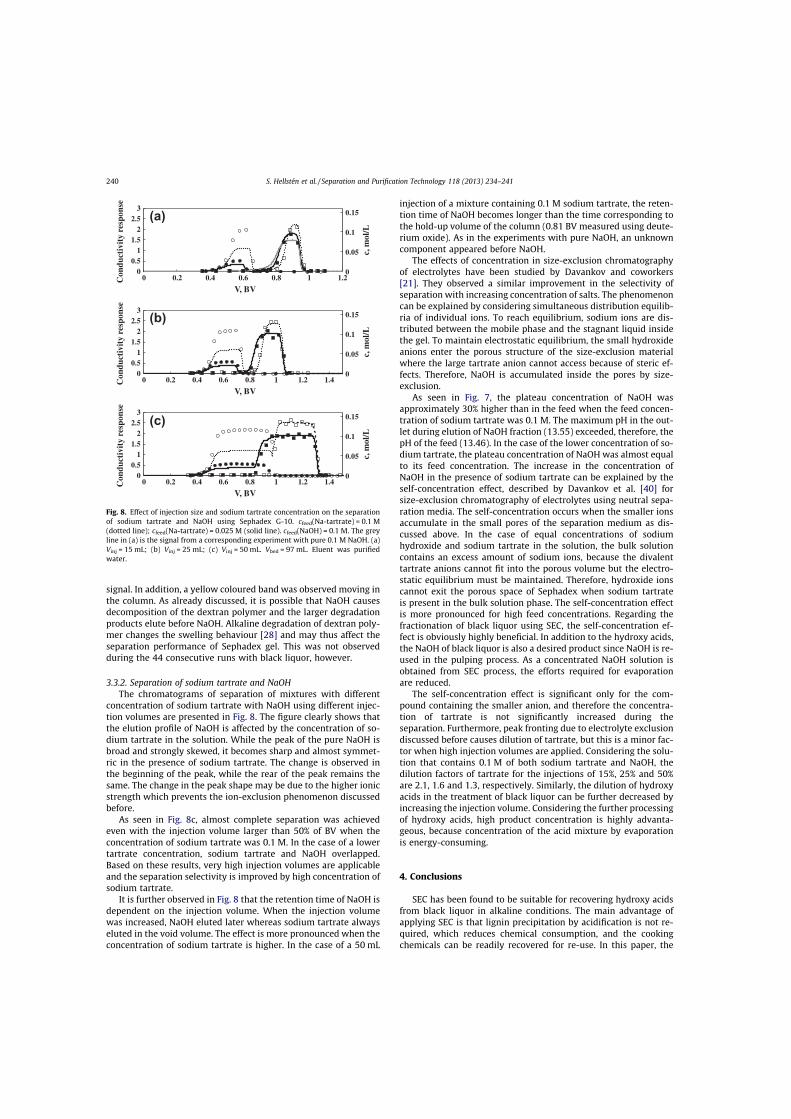
signal. In addition, a yellow coloured band was observed moving inthe column. As already discussed, it is possible that NaOH causesdecomposition of the dextran polymer and the larger degradationproducts elute before NaOH. Alkaline degradation of dextran poly-mer changes the swelling behaviour [28] and may thus affect theseparation performance of Sephadex gel. This was not observedduring the 44 consecutive runs with black liquor, however.
3.3.2. Separation of sodium tartrate and NaOHThe chromatograms of separation of mixtures with different
concentration of sodium tartrate with NaOH using different injec-tion volumes are presented in Fig. 8. The figure clearly shows thatthe elution profile of NaOH is affected by the concentration of so-dium tartrate in the solution. While the peak of the pure NaOH isbroad and strongly skewed, it becomes sharp and almost symmet-ric in the presence of sodium tartrate. The change is observed inthe beginning of the peak, while the rear of the peak remains thesame. The change in the peak shape may be due to the higher ionicstrength which prevents the ion-exclusion phenomenon discussedbefore.
As seen in Fig. 8c, almost complete separation was achievedeven with the injection volume larger than 50% of BV when theconcentration of sodium tartrate was 0.1 M. In the case of a lowertartrate concentration, sodium tartrate and NaOH overlapped.Based on these results, very high injection volumes are applicableand the separation selectivity is improved by high concentration ofsodium tartrate.
It is further observed in Fig. 8 that the retention time of NaOH isdependent on the injection volume. When the injection volumewas increased, NaOH eluted later whereas sodium tartrate alwayseluted in the void volume. The effect is more pronounced when theconcentration of sodium tartrate is higher. In the case of a 50 mL
injection of a mixture containing 0.1 M sodium tartrate, the reten-tion time of NaOH becomes longer than the time corresponding tothe hold-up volume of the column (0.81 BV measured using deute-rium oxide). As in the experiments with pure NaOH, an unknowncomponent appeared before NaOH.
The effects of concentration in size-exclusion chromatographyof electrolytes have been studied by Davankov and coworkers[21]. They observed a similar improvement in the selectivity ofseparation with increasing concentration of salts. The phenomenoncan be explained by considering simultaneous distribution equilib-ria of individual ions. To reach equilibrium, sodium ions are dis-tributed between the mobile phase and the stagnant liquid insidethe gel. To maintain electrostatic equilibrium, the small hydroxideanions enter the porous structure of the size-exclusion materialwhere the large tartrate anion cannot access because of steric ef-fects. Therefore, NaOH is accumulated inside the pores by size-exclusion.
As seen in Fig. 7, the plateau concentration of NaOH wasapproximately 30% higher than in the feed when the feed concen-tration of sodium tartrate was 0.1 M. The maximum pH in the out-let during elution of NaOH fraction (13.55) exceeded, therefore, thepH of the feed (13.46). In the case of the lower concentration of so-dium tartrate, the plateau concentration of NaOH was almost equalto its feed concentration. The increase in the concentration ofNaOH in the presence of sodium tartrate can be explained by theself-concentration effect, described by Davankov et al. [40] forsize-exclusion chromatography of electrolytes using neutral sepa-ration media. The self-concentration occurs when the smaller ionsaccumulate in the small pores of the separation medium as dis-cussed above. In the case of equal concentrations of sodiumhydroxide and sodium tartrate in the solution, the bulk solutioncontains an excess amount of sodium ions, because the divalenttartrate anions cannot fit into the porous volume but the electro-static equilibrium must be maintained. Therefore, hydroxide ionscannot exit the porous space of Sephadex when sodium tartrateis present in the bulk solution phase. The self-concentration effectis more pronounced for high feed concentrations. Regarding thefractionation of black liquor using SEC, the self-concentration ef-fect is obviously highly beneficial. In addition to the hydroxy acids,the NaOH of black liquor is also a desired product since NaOH is re-used in the pulping process. As a concentrated NaOH solution isobtained from SEC process, the efforts required for evaporationare reduced.
The self-concentration effect is significant only for the com-pound containing the smaller anion, and therefore the concentra-tion of tartrate is not significantly increased during theseparation. Furthermore, peak fronting due to electrolyte exclusiondiscussed before causes dilution of tartrate, but this is a minor fac-tor when high injection volumes are applied. Considering the solu-tion that contains 0.1 M of both sodium tartrate and NaOH, thedilution factors of tartrate for the injections of 15%, 25% and 50%are 2.1, 1.6 and 1.3, respectively. Similarly, the dilution of hydroxyacids in the treatment of black liquor can be further decreased byincreasing the injection volume. Considering the further processingof hydroxy acids, high product concentration is highly advanta-geous, because concentration of the acid mixture by evaporationis energy-consuming.
4. Conclusions
SEC has been found to be suitable for recovering hydroxy acidsfrom black liquor in alkaline conditions. The main advantage ofapplying SEC is that lignin precipitation by acidification is not re-quired, which reduces chemical consumption, and the cookingchemicals can be readily recovered for re-use. In this paper, the
0
0.05
0.1
0.15
00.5
11.5
22.5
3
0 0.2 0.4 0.6 0.8 1 1.2
c, m
ol/L
Con
duct
ivit
y re
spon
se
V, BV
0
0.05
0.1
0.15
00.5
11.5
22.5
3
0 0.2 0.4 0.6 0.8 1 1.2 1.4
c, m
ol/L
Con
duct
ivit
y re
spon
se
V, BV
0
0.05
0.1
0.15
00.5
11.5
22.5
3
0 0.2 0.4 0.6 0.8 1 1.2 1.4
c, m
ol/L
Con
duct
ivit
y re
spon
se
V, BV
(a)
(b)
(c)
Fig. 8. Effect of injection size and sodium tartrate concentration on the separationof sodium tartrate and NaOH using Sephadex G-10. cfeed(Na-tartrate) = 0.1 M(dotted line); cfeed(Na-tartrate) = 0.025 M (solid line). cfeed(NaOH) = 0.1 M. The greyline in (a) is the signal from a corresponding experiment with pure 0.1 M NaOH. (a)Vinj = 15 mL; (b) Vinj = 25 mL; (c) Vinj = 50 mL. Vbed = 97 mL. Eluent was purifiedwater.
240 S. Hellstén et al. / Separation and Purification Technology 118 (2013) 234–241
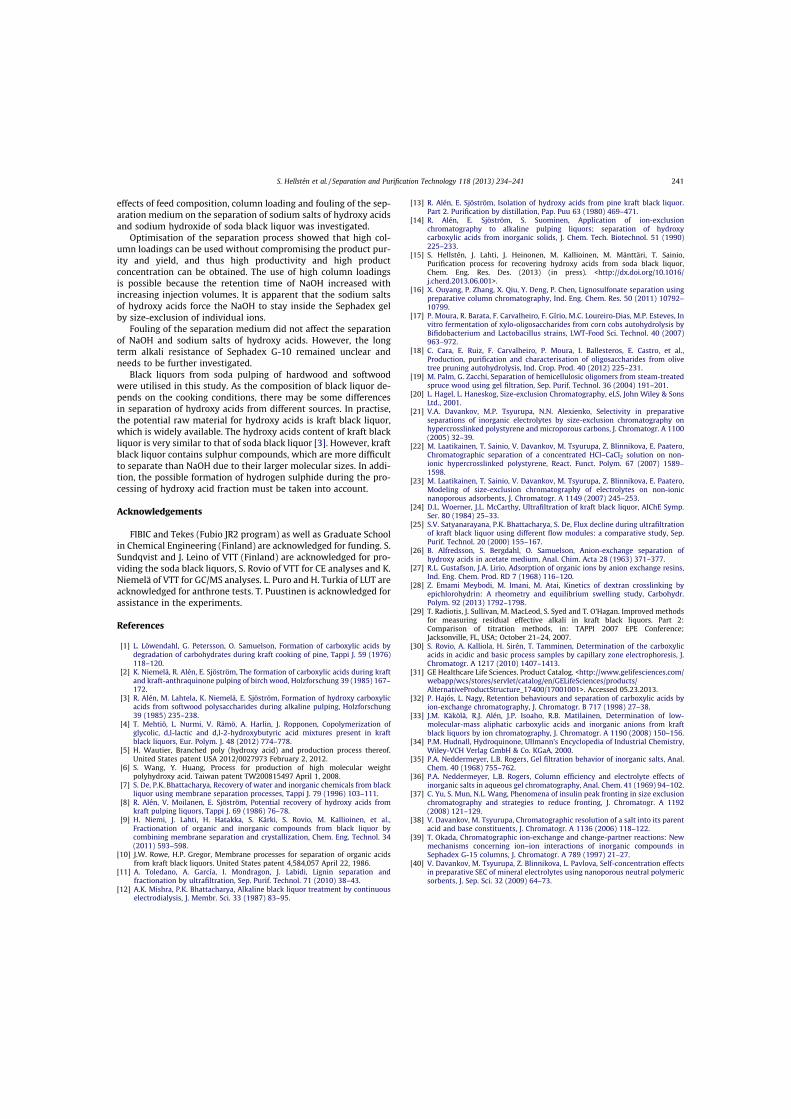
effects of feed composition, column loading and fouling of the sep-aration medium on the separation of sodium salts of hydroxy acidsand sodium hydroxide of soda black liquor was investigated.
Optimisation of the separation process showed that high col-umn loadings can be used without compromising the product pur-ity and yield, and thus high productivity and high productconcentration can be obtained. The use of high column loadingsis possible because the retention time of NaOH increased withincreasing injection volumes. It is apparent that the sodium saltsof hydroxy acids force the NaOH to stay inside the Sephadex gelby size-exclusion of individual ions.
Fouling of the separation medium did not affect the separationof NaOH and sodium salts of hydroxy acids. However, the longterm alkali resistance of Sephadex G-10 remained unclear andneeds to be further investigated.
Black liquors from soda pulping of hardwood and softwoodwere utilised in this study. As the composition of black liquor de-pends on the cooking conditions, there may be some differencesin separation of hydroxy acids from different sources. In practise,the potential raw material for hydroxy acids is kraft black liquor,which is widely available. The hydroxy acids content of kraft blackliquor is very similar to that of soda black liquor [3]. However, kraftblack liquor contains sulphur compounds, which are more difficultto separate than NaOH due to their larger molecular sizes. In addi-tion, the possible formation of hydrogen sulphide during the pro-cessing of hydroxy acid fraction must be taken into account.
Acknowledgements
FIBIC and Tekes (Fubio JR2 program) as well as Graduate Schoolin Chemical Engineering (Finland) are acknowledged for funding. S.Sundqvist and J. Leino of VTT (Finland) are acknowledged for pro-viding the soda black liquors, S. Rovio of VTT for CE analyses and K.Niemelä of VTT for GC/MS analyses. L. Puro and H. Turkia of LUT areacknowledged for anthrone tests. T. Puustinen is acknowledged forassistance in the experiments.
References
[1] L. Löwendahl, G. Petersson, O. Samuelson, Formation of carboxylic acids bydegradation of carbohydrates during kraft cooking of pine, Tappi J. 59 (1976)118–120.
[2] K. Niemelä, R. Alén, E. Sjöström, The formation of carboxylic acids during kraftand kraft-anthraquinone pulping of birch wood, Holzforschung 39 (1985) 167–172.
[3] R. Alén, M. Lahtela, K. Niemelä, E. Sjöström, Formation of hydroxy carboxylicacids from softwood polysaccharides during alkaline pulping, Holzforschung39 (1985) 235–238.
[4] T. Mehtiö, L. Nurmi, V. Rämö, A. Harlin, J. Ropponen, Copolymerization ofglycolic, d,l-lactic and d,l-2-hydroxybutyric acid mixtures present in kraftblack liquors, Eur. Polym. J. 48 (2012) 774–778.
[5] H. Wautier, Branched poly (hydroxy acid) and production process thereof.United States patent USA 2012/0027973 February 2, 2012.
[6] S. Wang, Y. Huang, Process for production of high molecular weightpolyhydroxy acid. Taiwan patent TW200815497 April 1, 2008.
[7] S. De, P.K. Bhattacharya, Recovery of water and inorganic chemicals from blackliquor using membrane separation processes, Tappi J. 79 (1996) 103–111.
[8] R. Alén, V. Moilanen, E. Sjöström, Potential recovery of hydroxy acids fromkraft pulping liquors, Tappi J. 69 (1986) 76–78.
[9] H. Niemi, J. Lahti, H. Hatakka, S. Kärki, S. Rovio, M. Kallioinen, et al.,Fractionation of organic and inorganic compounds from black liquor bycombining membrane separation and crystallization, Chem. Eng. Technol. 34(2011) 593–598.
[10] J.W. Rowe, H.P. Gregor, Membrane processes for separation of organic acidsfrom kraft black liquors. United States patent 4,584,057 April 22, 1986.
[11] A. Toledano, A. García, I. Mondragon, J. Labidi, Lignin separation andfractionation by ultrafiltration, Sep. Purif. Technol. 71 (2010) 38–43.
[12] A.K. Mishra, P.K. Bhattacharya, Alkaline black liquor treatment by continuouselectrodialysis, J. Membr. Sci. 33 (1987) 83–95.
[13] R. Alén, E. Sjöström, Isolation of hydroxy acids from pine kraft black liquor.Part 2. Purification by distillation, Pap. Puu 63 (1980) 469–471.
[14] R. Alén, E. Sjöström, S. Suominen, Application of ion-exclusionchromatography to alkaline pulping liquors; separation of hydroxycarboxylic acids from inorganic solids, J. Chem. Tech. Biotechnol. 51 (1990)225–233.
[15] S. Hellstén, J. Lahti, J. Heinonen, M. Kallioinen, M. Mänttäri, T. Sainio,Purification process for recovering hydroxy acids from soda black liquor,Chem. Eng. Res. Des. (2013) (in press). <http://dx.doi.org/10.1016/j.cherd.2013.06.001>.
[16] X. Ouyang, P. Zhang, X. Qiu, Y. Deng, P. Chen, Lignosulfonate separation usingpreparative column chromatography, Ind. Eng. Chem. Res. 50 (2011) 10792–10799.
[17] P. Moura, R. Barata, F. Carvalheiro, F. Gírio, M.C. Loureiro-Dias, M.P. Esteves, Invitro fermentation of xylo-oligosaccharides from corn cobs autohydrolysis byBifidobacterium and Lactobacillus strains, LWT-Food Sci. Technol. 40 (2007)963–972.
[18] C. Cara, E. Ruiz, F. Carvalheiro, P. Moura, I. Ballesteros, E. Castro, et al.,Production, purification and characterisation of oligosaccharides from olivetree pruning autohydrolysis, Ind. Crop. Prod. 40 (2012) 225–231.
[19] M. Palm, G. Zacchi, Separation of hemicellulosic oligomers from steam-treatedspruce wood using gel filtration, Sep. Purif. Technol. 36 (2004) 191–201.
[20] L. Hagel, L. Haneskog, Size-exclusion Chromatography, eLS, John Wiley & SonsLtd., 2001.
[21] V.A. Davankov, M.P. Tsyurupa, N.N. Alexienko, Selectivity in preparativeseparations of inorganic electrolytes by size-exclusion chromatography onhypercrosslinked polystyrene and microporous carbons, J. Chromatogr. A 1100(2005) 32–39.
[22] M. Laatikainen, T. Sainio, V. Davankov, M. Tsyurupa, Z. Blinnikova, E. Paatero,Chromatographic separation of a concentrated HCl–CaCl2 solution on non-ionic hypercrosslinked polystyrene, React. Funct. Polym. 67 (2007) 1589–1598.
[23] M. Laatikainen, T. Sainio, V. Davankov, M. Tsyurupa, Z. Blinnikova, E. Paatero,Modeling of size-exclusion chromatography of electrolytes on non-ionicnanoporous adsorbents, J. Chromatogr. A 1149 (2007) 245–253.
[24] D.L. Woerner, J.L. McCarthy, Ultrafiltration of kraft black liquor, AIChE Symp.Ser. 80 (1984) 25–33.
[25] S.V. Satyanarayana, P.K. Bhattacharya, S. De, Flux decline during ultrafiltrationof kraft black liquor using different flow modules: a comparative study, Sep.Purif. Technol. 20 (2000) 155–167.
[26] B. Alfredsson, S. Bergdahl, O. Samuelson, Anion-exchange separation ofhydroxy acids in acetate medium, Anal. Chim. Acta 28 (1963) 371–377.
[27] R.L. Gustafson, J.A. Lirio, Adsorption of organic ions by anion exchange resins,Ind. Eng. Chem. Prod. RD 7 (1968) 116–120.
[28] Z. Emami Meybodi, M. Imani, M. Atai, Kinetics of dextran crosslinking byepichlorohydrin: A rheometry and equilibrium swelling study, Carbohydr.Polym. 92 (2013) 1792–1798.
[29] T. Radiotis, J. Sullivan, M. MacLeod, S. Syed and T. O’Hagan. Improved methodsfor measuring residual effective alkali in kraft black liquors. Part 2:Comparison of titration methods, in: TAPPI 2007 EPE Conference;Jacksonville, FL, USA; October 21–24, 2007.
[30] S. Rovio, A. Kalliola, H. Sirén, T. Tamminen, Determination of the carboxylicacids in acidic and basic process samples by capillary zone electrophoresis, J.Chromatogr. A 1217 (2010) 1407–1413.
[31] GE Healthcare Life Sciences. Product Catalog. <http://www.gelifesciences.com/webapp/wcs/stores/servlet/catalog/en/GELifeSciences/products/AlternativeProductStructure_17400/17001001>. Accessed 05.23.2013.
[32] P. Hajós, L. Nagy, Retention behaviours and separation of carboxylic acids byion-exchange chromatography, J. Chromatogr. B 717 (1998) 27–38.
[33] J.M. Käkölä, R.J. Alén, J.P. Isoaho, R.B. Matilainen, Determination of low-molecular-mass aliphatic carboxylic acids and inorganic anions from kraftblack liquors by ion chromatography, J. Chromatogr. A 1190 (2008) 150–156.
[34] P.M. Hudnall, Hydroquinone, Ullmann’s Encyclopedia of Industrial Chemistry,Wiley-VCH Verlag GmbH & Co. KGaA, 2000.
[35] P.A. Neddermeyer, L.B. Rogers, Gel filtration behavior of inorganic salts, Anal.Chem. 40 (1968) 755–762.
[36] P.A. Neddermeyer, L.B. Rogers, Column efficiency and electrolyte effects ofinorganic salts in aqueous gel chromatography, Anal. Chem. 41 (1969) 94–102.
[37] C. Yu, S. Mun, N.L. Wang, Phenomena of insulin peak fronting in size exclusionchromatography and strategies to reduce fronting, J. Chromatogr. A 1192(2008) 121–129.
[38] V. Davankov, M. Tsyurupa, Chromatographic resolution of a salt into its parentacid and base constituents, J. Chromatogr. A 1136 (2006) 118–122.
[39] T. Okada, Chromatographic ion-exchange and change-partner reactions: Newmechanisms concerning ion–ion interactions of inorganic compounds inSephadex G-15 columns, J. Chromatogr. A 789 (1997) 21–27.
[40] V. Davankov, M. Tsyurupa, Z. Blinnikova, L. Pavlova, Self-concentration effectsin preparative SEC of mineral electrolytes using nanoporous neutral polymericsorbents, J. Sep. Sci. 32 (2009) 64–73.
S. Hellstén et al. / Separation and Purification Technology 118 (2013) 234–241 241
IV
Reprinted with permission from Chemical Engineering Research
& Design, Hellstén, S., Lahti, J., Heinonen, J., Kallioinen, M.,
Mänttäri, M., Sainio, T., Purification process for recovering
hydroxy acids from soda black liquor,
http://dx.doi.org/10.1016/j.cherd.2013.06.001, Copyright (2013)
Elsevier.

Please cite this article in press as: Hellstén, S., et al., Purification process for recovering hydroxy acids from soda black liquor. Chem. Eng. Res.Des. (2013), http://dx.doi.org/10.1016/j.cherd.2013.06.001
ARTICLE IN PRESSCHERD-1258; No. of Pages 10
chemical engineering research and design x x x ( 2 0 1 3 ) xxx–xxx
Contents lists available at SciVerse ScienceDirect
Chemical Engineering Research and Design
j ourna l h omepage: www.elsev ier .com/ locate /cherd
Purification process for recovering hydroxy acids from sodablack liquor
Sanna Hellstén, Jussi Lahti, Jari Heinonen, Mari Kallioinen, Mika Mänttäri,Tuomo Sainio ∗
Lappeenranta University of Technology, Laboratory of Separation Technology, Skinnarilankatu 34, FI-53850 Lappeenranta, Finland
a b s t r a c t
Black liquor, a side product of chemical pulping, contains hydroxy acids that have many potential applications, e.g., as
polymer precursors. Currently there are no feasible separation processes available for recovery of hydroxy acids from
such solutions. Neutralization is usually though to be a necessary pre-treatment, but it adds into chemical consump-
tion and may impede the integration of the recovery process to a pulp mill. In this work, an experimental investigation
of a new process concept for the recovery and purification of hydroxy acids from soda black liquor without neutraliza-
tion is presented. The process consists of ultrafiltration, size-exclusion chromatography, ion-exchange, adsorption,
and evaporation. Mixtures of hydroxy acids in high purity were produced from black liquor of soda pulping using
the process. A reduction of 99% in lignin content of the organic acid fraction was achieved. In the chromatographic
separation step, the recovery of sodium hydroxide was almost 100%. The average purities of hydroxy acids isolated
from softwood and hardwood black liquors were 81% and 63% on mass basis, respectively.
© 2013 Published by Elsevier B.V. on behalf of The Institution of Chemical Engineers.
Keywords: Hydroxy acids; Black liquor; Membrane filtration; Chromatography
1. Introduction
Spent pulping liquors represent an untapped source of vari-ous valuable chemical compounds. For example, kraft blackliquor is traditionally combusted in a recovery furnace. Whilethe inorganic pulping chemicals are recovered for re-use, theorganic residue is utilized solely for energy production. Due toan increasing demand for biomass-based substitutes for fos-sil fuel-derived chemicals, fractionation of black liquor hasgained a lot of research interest recently. In particular, therecovery and fractionation of lignin using precipitation, ultra-filtration and extraction has been studied rather intensively(e.g., Toledano et al., 2010b; Gouveia et al., 2012). However,black liquor contains also a major amount of carbohydratedegradation products, mainly carboxylic acids, which possessa low calorific value in comparison to lignin (van Heiningen,2006). The recovery of these compounds prior to combustioncould make the use of the lignocellulosic biomass resourcemore efficient (FitzPatrick et al., 2010).
∗ Corresponding author. Tel.: +358 40 3578683.E-mail address: [email protected] (T. Sainio).Received 22 February 2013; Received in revised form 27 May 2013; Accepted 3 June 2013
The carboxylic acids of black liquor can be divided intovolatile acids and non-volatile hydroxy acids, which areformed during the alkaline degradation of polysaccharidesaccording to peeling-off reaction. Hydroxy acids are build-ing block chemicals that can be refined for various purposes.Potential applications of hydroxy acids include biodegradableplastics (e.g., Wang and Huang, 2008), packaging films (Loomisand Ostapchenko, 1991), tissue-engineering (Barralet et al.,2005), and cosmetics (Draelos, 2000). High purity is requiredespecially if the acids are polymerized, since impurities maycause undesired side reactions, catalyst deactivation, or ter-mination of chain length increase. Considering the recoveryof hydroxy acids in high purity, black liquor is a very chal-lenging raw material due to its complex matrix that consistsof numerous components with unknown properties. Fromthe separation technology point of view, the most challeng-ing impurities are the lignin type compounds. Lignin causesvarious problems in the processing of black liquor, sinceits solubility is strongly dependent on pH, and the lignin
0263-8762/$ – see front matter © 2013 Published by Elsevier B.V. on behalf of The Institution of Chemical Engineers.http://dx.doi.org/10.1016/j.cherd.2013.06.001
Please cite this article in press as: Hellstén, S., et al., Purification process for recovering hydroxy acids from soda black liquor. Chem. Eng. Res.Des. (2013), http://dx.doi.org/10.1016/j.cherd.2013.06.001
ARTICLE IN PRESSCHERD-1258; No. of Pages 10
2 chemical engineering research and design x x x ( 2 0 1 3 ) xxx–xxx
Ultra fil tration SEC Ion-exchange Adsorption Evaporation
lignin NaOH Na lign in volatil e ac ids
water
Blac k
liquor
Hydroxy
acids
Fig. 1 – Process for fractionation of black liquor.
precipitate formed is difficult to separate due to its colloidalstructure (Öhman and Theliander, 2007).
Several separation methods for the recovery of hydroxyacids from black liquor have been studied in the literature. Typ-ically, the processes are relatively complicated because ligninand inorganic compounds are separated from hydroxy acidsin separate steps.
Lignin can be removed by precipitation using carbondioxide or mineral acid (e.g., Merewether, 1961; De andBhattacharya, 1996; Alén et al., 1986), and precipitated ligninis being commercially produced at several kraft pulp mills(Öhman et al., 2007). The problem with the precipitation oflignin is the colloid formation which impedes the followingfiltration step (Toledano et al., 2010a). Furthermore, precipi-tated lignin is readily contaminated with other compoundsof black liquor (Toledano et al., 2010b), and thus precipitationmay also decrease the yield of hydroxy acids. These issues maycause major problems when aiming to remove a large amountof lignin, which is the case in recovery of hydroxy acids. Inaddition, lowering the pH increases chemicals consumptionsignificantly and may alter the sulfur-to-sodium ratio of thepulp mill if sulfuric acid is used for neutralization. Therefore,a fractionation process that includes precipitation of lignin bydirect neutralization of the alkaline black liquor with mineralacids would be rather expensive to integrate to a pulp mill. Onthe other hand, the more preferable carbon dioxide precipita-tion might not be efficient enough for removing lignin.
As an alternative to precipitation, membrane filtration canbe applied for reducing the lignin concentration of black liquor(Niemi et al., 2011; Rowe and Gregor, 1986). However, either thelignin concentration or the pH of the ultrafiltration permeateis too high for the next process step, which is the separa-tion of inorganic material by crystallization (Niemi et al., 2011;Alén and Sjöström, 1980), chromatography (Alén et al., 1990),or electrodialysis (Mishra and Bhattacharya, 1987). Therefore,neutralization of black liquor is, nevertheless, required.
In this paper, a new separation process concept for frac-tionation of black liquor is introduced and used for recoveringhydroxy acids from black liquor of soda-cooking of wood.The process scheme is shown in Fig. 1. Membrane filtra-tion is applied as a pre-treatment to separate the most oflignin. Subsequently, the separation of hydroxy acids andsodium hydroxide is carried out with size-exclusion chro-matography (SEC) using Sephadex G-10 size-exclusion gel.The reported biorefinery applications of SEC include fraction-ation of lignosulfonates (Ouyang et al., 2011), and recoveryof oligosaccharides from biomass hydrolysates (Moura et al.,2007; Cara et al., 2012) and from steam-treated wood (Palmand Zacchi, 2004), but it has not been applied previously forisolating hydroxy acids from pulp mill black liquor. Chro-matographic recovery of hydroxy acids reported by Alénet al. (1990) was based on ion-exclusion using a strong acidcation exchange resin as a separation medium, which requiresthat the black liquor is acidified. As the neutralization ofblack liquor is not required using SEC, the chemical con-sumption of the proposed process is low and the process
offers a facile, straight-forward recovery of cooking chemi-cals. The hydroxy acids, which exist as their sodium saltsafter being recovered under alkaline conditions, can be liber-ated using ion-exchange. The residual lignin is then removedby adsorption. Finally, the product fractions are concentratedby evaporation to compensate the dilution that occurs duringprocessing. The advantage of evaporation as a concentrationmethod is that the volatile acids are simultaneously removed.The aim is that the purity of the concentrated product is suffi-cient for polymerization. Separation and purification of singlehydroxy acids is not necessary, because mixtures of hydroxyacids can be copolymerized (Mehtiö et al., 2012).
Since the separation process presented in Fig. 1 is does notinvolve neutralization of black liquor, chemicals are requiredonly for washing of the separation materials and for theregeneration of the ion-exchange resin. As the chemicalconsumption is thus determined by the required washingfrequency, prevention of fouling is a key issue for process eco-nomics.
When treating black liquor, fouling of the separation mediais mainly caused by adsorption of lignin. Fouling may occurin the membrane filtration step, but also during chromato-graphic separation and ion-exchange steps. Considering theresin fouling in the latter process steps, the selection of themembrane for the membrane filtration step is a key issue as itdetermines the lignin content in the solution used for furtherprocessing. The smaller the membrane cut-off, the purer thepermeate with respect to lignin. However, a higher pressure isrequired while using a membrane with low cut-off, and mem-brane fouling may also be more severe. As the main operatingcosts in membrane filtration of black liquor are due to pres-surization and pumping (Jönsson and Wallberg, 2009), a loosemembrane may be preferred to reduce energy consumption.The lignin removal pre-treatment by membrane filtration isthus of major importance when optimizing the overall pro-cess. The effect of membrane cut-off on the later process stepsis therefore also investigated.
2. Materials and methods
Hardwood (HW) and softwood (SW) soda black liquors wereprepared by cooking of birch and pine wood chips, respectively,with sodium hydroxide. SW cooking was carried out at a tem-perature of 170 ◦C until an H-factor1 of 1936 was reached, andHW wood chips were cooked at 165 ◦C until an H-factor of 1324.The liquor to wood ratio was 4:1 and the amount of effectivealkali was 5.5 mol/kg.
2.1. Lignin removal by membrane filtration
Black liquor was filtered using a cross-flow flat sheetmembrane module and Microdyn-Nadir NP010 ultrafiltration
1 H-factor indicates the delignification rate. It is calculated as
a function of cooking temperature and time: H =∫ t
0exp(43.2 −
16113/T)dT. 1 h at 100 ◦C is equivalent with H-factor 1.
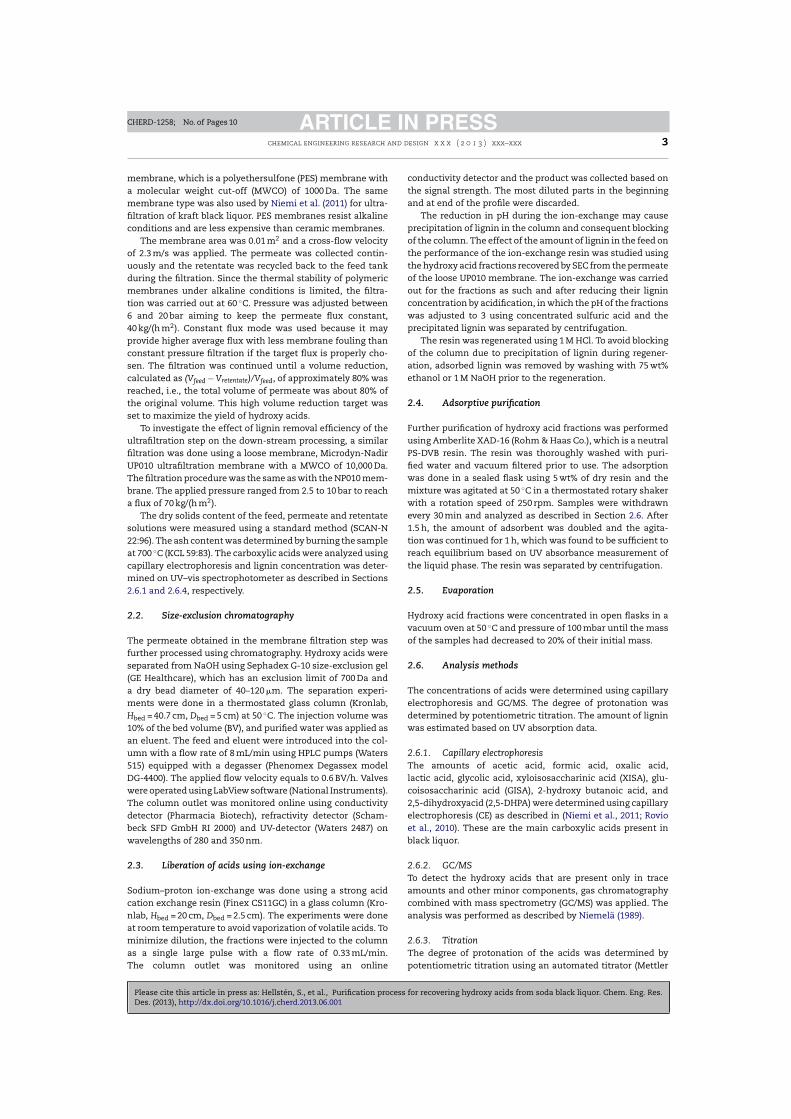
Please cite this article in press as: Hellstén, S., et al., Purification process for recovering hydroxy acids from soda black liquor. Chem. Eng. Res.Des. (2013), http://dx.doi.org/10.1016/j.cherd.2013.06.001
ARTICLE IN PRESSCHERD-1258; No. of Pages 10
chemical engineering research and design x x x ( 2 0 1 3 ) xxx–xxx 3
membrane, which is a polyethersulfone (PES) membrane witha molecular weight cut-off (MWCO) of 1000 Da. The samemembrane type was also used by Niemi et al. (2011) for ultra-filtration of kraft black liquor. PES membranes resist alkalineconditions and are less expensive than ceramic membranes.
The membrane area was 0.01 m2 and a cross-flow velocityof 2.3 m/s was applied. The permeate was collected contin-uously and the retentate was recycled back to the feed tankduring the filtration. Since the thermal stability of polymericmembranes under alkaline conditions is limited, the filtra-tion was carried out at 60 ◦C. Pressure was adjusted between6 and 20 bar aiming to keep the permeate flux constant,40 kg/(h m2). Constant flux mode was used because it mayprovide higher average flux with less membrane fouling thanconstant pressure filtration if the target flux is properly cho-sen. The filtration was continued until a volume reduction,calculated as (Vfeed − Vretentate)/Vfeed, of approximately 80% wasreached, i.e., the total volume of permeate was about 80% ofthe original volume. This high volume reduction target wasset to maximize the yield of hydroxy acids.
To investigate the effect of lignin removal efficiency of theultrafiltration step on the down-stream processing, a similarfiltration was done using a loose membrane, Microdyn-NadirUP010 ultrafiltration membrane with a MWCO of 10,000 Da.The filtration procedure was the same as with the NP010 mem-brane. The applied pressure ranged from 2.5 to 10 bar to reacha flux of 70 kg/(h m2).
The dry solids content of the feed, permeate and retentatesolutions were measured using a standard method (SCAN-N22:96). The ash content was determined by burning the sampleat 700 ◦C (KCL 59:83). The carboxylic acids were analyzed usingcapillary electrophoresis and lignin concentration was deter-mined on UV–vis spectrophotometer as described in Sections2.6.1 and 2.6.4, respectively.
2.2. Size-exclusion chromatography
The permeate obtained in the membrane filtration step wasfurther processed using chromatography. Hydroxy acids wereseparated from NaOH using Sephadex G-10 size-exclusion gel(GE Healthcare), which has an exclusion limit of 700 Da anda dry bead diameter of 40–120 �m. The separation experi-ments were done in a thermostated glass column (Kronlab,Hbed = 40.7 cm, Dbed = 5 cm) at 50 ◦C. The injection volume was10% of the bed volume (BV), and purified water was applied asan eluent. The feed and eluent were introduced into the col-umn with a flow rate of 8 mL/min using HPLC pumps (Waters515) equipped with a degasser (Phenomex Degassex modelDG-4400). The applied flow velocity equals to 0.6 BV/h. Valveswere operated using LabView software (National Instruments).The column outlet was monitored online using conductivitydetector (Pharmacia Biotech), refractivity detector (Scham-beck SFD GmbH RI 2000) and UV-detector (Waters 2487) onwavelengths of 280 and 350 nm.
2.3. Liberation of acids using ion-exchange
Sodium–proton ion-exchange was done using a strong acidcation exchange resin (Finex CS11GC) in a glass column (Kro-nlab, Hbed = 20 cm, Dbed = 2.5 cm). The experiments were doneat room temperature to avoid vaporization of volatile acids. Tominimize dilution, the fractions were injected to the columnas a single large pulse with a flow rate of 0.33 mL/min.The column outlet was monitored using an online
conductivity detector and the product was collected based onthe signal strength. The most diluted parts in the beginningand at end of the profile were discarded.
The reduction in pH during the ion-exchange may causeprecipitation of lignin in the column and consequent blockingof the column. The effect of the amount of lignin in the feed onthe performance of the ion-exchange resin was studied usingthe hydroxy acid fractions recovered by SEC from the permeateof the loose UP010 membrane. The ion-exchange was carriedout for the fractions as such and after reducing their ligninconcentration by acidification, in which the pH of the fractionswas adjusted to 3 using concentrated sulfuric acid and theprecipitated lignin was separated by centrifugation.
The resin was regenerated using 1 M HCl. To avoid blockingof the column due to precipitation of lignin during regener-ation, adsorbed lignin was removed by washing with 75 wt%ethanol or 1 M NaOH prior to the regeneration.
2.4. Adsorptive purification
Further purification of hydroxy acid fractions was performedusing Amberlite XAD-16 (Rohm & Haas Co.), which is a neutralPS-DVB resin. The resin was thoroughly washed with puri-fied water and vacuum filtered prior to use. The adsorptionwas done in a sealed flask using 5 wt% of dry resin and themixture was agitated at 50 ◦C in a thermostated rotary shakerwith a rotation speed of 250 rpm. Samples were withdrawnevery 30 min and analyzed as described in Section 2.6. After1.5 h, the amount of adsorbent was doubled and the agita-tion was continued for 1 h, which was found to be sufficient toreach equilibrium based on UV absorbance measurement ofthe liquid phase. The resin was separated by centrifugation.
2.5. Evaporation
Hydroxy acid fractions were concentrated in open flasks in avacuum oven at 50 ◦C and pressure of 100 mbar until the massof the samples had decreased to 20% of their initial mass.
2.6. Analysis methods
The concentrations of acids were determined using capillaryelectrophoresis and GC/MS. The degree of protonation wasdetermined by potentiometric titration. The amount of ligninwas estimated based on UV absorption data.
2.6.1. Capillary electrophoresisThe amounts of acetic acid, formic acid, oxalic acid,lactic acid, glycolic acid, xyloisosaccharinic acid (XISA), glu-coisosaccharinic acid (GISA), 2-hydroxy butanoic acid, and2,5-dihydroxyacid (2,5-DHPA) were determined using capillaryelectrophoresis (CE) as described in (Niemi et al., 2011; Rovioet al., 2010). These are the main carboxylic acids present inblack liquor.
2.6.2. GC/MSTo detect the hydroxy acids that are present only in traceamounts and other minor components, gas chromatographycombined with mass spectrometry (GC/MS) was applied. Theanalysis was performed as described by Niemelä (1989).
2.6.3. TitrationThe degree of protonation of the acids was determined bypotentiometric titration using an automated titrator (Mettler
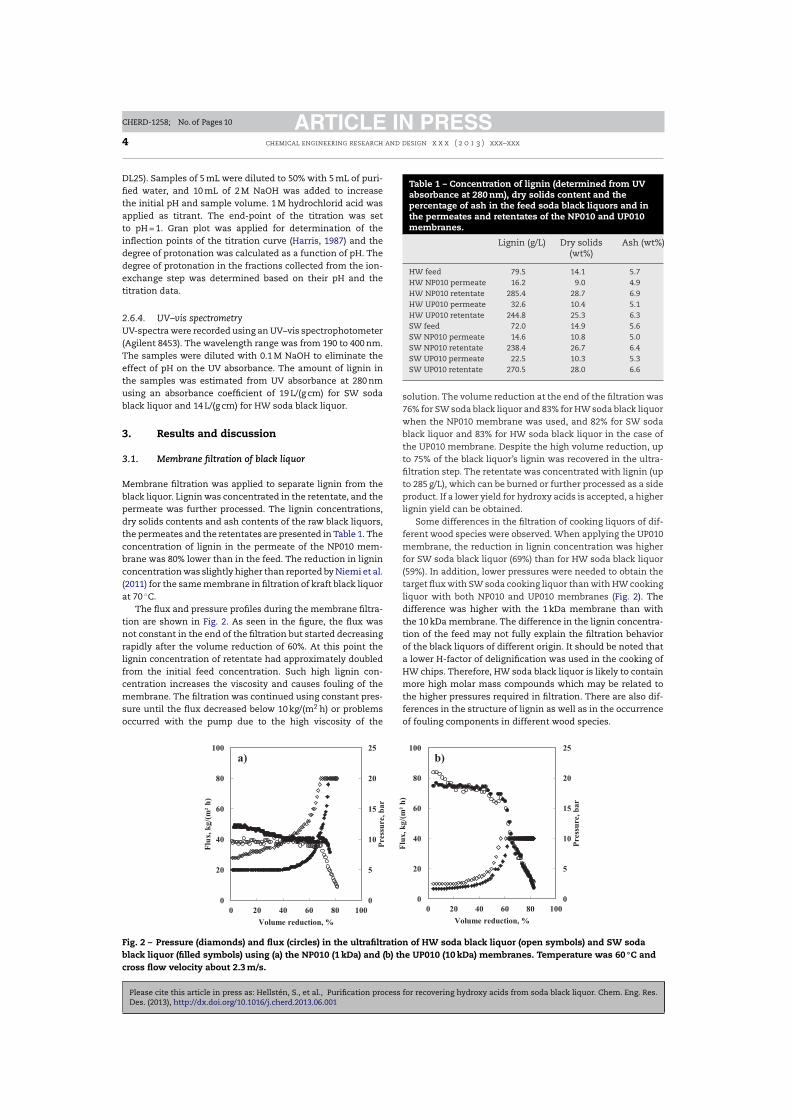
Please cite this article in press as: Hellstén, S., et al., Purification process for recovering hydroxy acids from soda black liquor. Chem. Eng. Res.Des. (2013), http://dx.doi.org/10.1016/j.cherd.2013.06.001
ARTICLE IN PRESSCHERD-1258; No. of Pages 10
4 chemical engineering research and design x x x ( 2 0 1 3 ) xxx–xxx
DL25). Samples of 5 mL were diluted to 50% with 5 mL of puri-fied water, and 10 mL of 2 M NaOH was added to increasethe initial pH and sample volume. 1 M hydrochlorid acid wasapplied as titrant. The end-point of the titration was setto pH = 1. Gran plot was applied for determination of theinflection points of the titration curve (Harris, 1987) and thedegree of protonation was calculated as a function of pH. Thedegree of protonation in the fractions collected from the ion-exchange step was determined based on their pH and thetitration data.
2.6.4. UV–vis spectrometryUV-spectra were recorded using an UV–vis spectrophotometer(Agilent 8453). The wavelength range was from 190 to 400 nm.The samples were diluted with 0.1 M NaOH to eliminate theeffect of pH on the UV absorbance. The amount of lignin inthe samples was estimated from UV absorbance at 280 nmusing an absorbance coefficient of 19 L/(g cm) for SW sodablack liquor and 14 L/(g cm) for HW soda black liquor.
3. Results and discussion
3.1. Membrane filtration of black liquor
Membrane filtration was applied to separate lignin from theblack liquor. Lignin was concentrated in the retentate, and thepermeate was further processed. The lignin concentrations,dry solids contents and ash contents of the raw black liquors,the permeates and the retentates are presented in Table 1. Theconcentration of lignin in the permeate of the NP010 mem-brane was 80% lower than in the feed. The reduction in ligninconcentration was slightly higher than reported by Niemi et al.(2011) for the same membrane in filtration of kraft black liquorat 70 ◦C.
The flux and pressure profiles during the membrane filtra-tion are shown in Fig. 2. As seen in the figure, the flux wasnot constant in the end of the filtration but started decreasingrapidly after the volume reduction of 60%. At this point thelignin concentration of retentate had approximately doubledfrom the initial feed concentration. Such high lignin con-centration increases the viscosity and causes fouling of themembrane. The filtration was continued using constant pres-sure until the flux decreased below 10 kg/(m2 h) or problemsoccurred with the pump due to the high viscosity of the
Table 1 – Concentration of lignin (determined from UVabsorbance at 280 nm), dry solids content and thepercentage of ash in the feed soda black liquors and inthe permeates and retentates of the NP010 and UP010membranes.
Lignin (g/L) Dry solids(wt%)
Ash (wt%)
HW feed 79.5 14.1 5.7HW NP010 permeate 16.2 9.0 4.9HW NP010 retentate 285.4 28.7 6.9HW UP010 permeate 32.6 10.4 5.1HW UP010 retentate 244.8 25.3 6.3SW feed 72.0 14.9 5.6SW NP010 permeate 14.6 10.8 5.0SW NP010 retentate 238.4 26.7 6.4SW UP010 permeate 22.5 10.3 5.3SW UP010 retentate 270.5 28.0 6.6
solution. The volume reduction at the end of the filtration was76% for SW soda black liquor and 83% for HW soda black liquorwhen the NP010 membrane was used, and 82% for SW sodablack liquor and 83% for HW soda black liquor in the case ofthe UP010 membrane. Despite the high volume reduction, upto 75% of the black liquor’s lignin was recovered in the ultra-filtration step. The retentate was concentrated with lignin (upto 285 g/L), which can be burned or further processed as a sideproduct. If a lower yield for hydroxy acids is accepted, a higherlignin yield can be obtained.
Some differences in the filtration of cooking liquors of dif-ferent wood species were observed. When applying the UP010membrane, the reduction in lignin concentration was higherfor SW soda black liquor (69%) than for HW soda black liquor(59%). In addition, lower pressures were needed to obtain thetarget flux with SW soda cooking liquor than with HW cookingliquor with both NP010 and UP010 membranes (Fig. 2). Thedifference was higher with the 1 kDa membrane than withthe 10 kDa membrane. The difference in the lignin concentra-tion of the feed may not fully explain the filtration behaviorof the black liquors of different origin. It should be noted thata lower H-factor of delignification was used in the cooking ofHW chips. Therefore, HW soda black liquor is likely to containmore high molar mass compounds which may be related tothe higher pressures required in filtration. There are also dif-ferences in the structure of lignin as well as in the occurrenceof fouling components in different wood species.
0
5
10
15
20
25
0
20
40
60
80
100
0 20 40 60 80 10 0
Pre
ssu
re,
ba
r
Flu
x,
kg
/(m
² h
)
Volu me reduction, %
0
5
10
15
20
25
0
20
40
60
80
100
0 20 40 60 80 10 0
Pre
ssu
re,
ba
r
Flu
x,
kg
/(m
² h
)
Volu me reduction, %
a) b)
Fig. 2 – Pressure (diamonds) and flux (circles) in the ultrafiltration of HW soda black liquor (open symbols) and SW sodablack liquor (filled symbols) using (a) the NP010 (1 kDa) and (b) the UP010 (10 kDa) membranes. Temperature was 60 ◦C andcross flow velocity about 2.3 m/s.
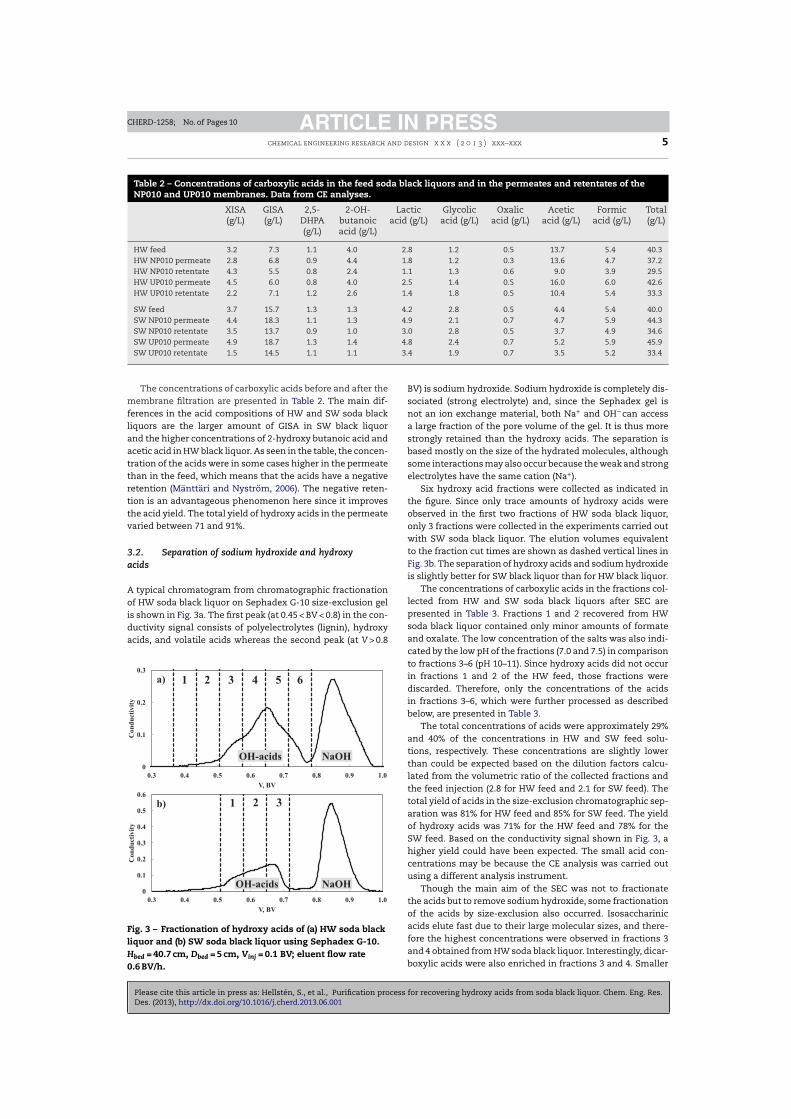
Please cite this article in press as: Hellstén, S., et al., Purification process for recovering hydroxy acids from soda black liquor. Chem. Eng. Res.Des. (2013), http://dx.doi.org/10.1016/j.cherd.2013.06.001
ARTICLE IN PRESSCHERD-1258; No. of Pages 10
chemical engineering research and design x x x ( 2 0 1 3 ) xxx–xxx 5
Table 2 – Concentrations of carboxylic acids in the feed soda black liquors and in the permeates and retentates of theNP010 and UP010 membranes. Data from CE analyses.
XISA(g/L)
GISA(g/L)
2,5-DHPA(g/L)
2-OH-butanoicacid (g/L)
Lacticacid (g/L)
Glycolicacid (g/L)
Oxalicacid (g/L)
Aceticacid (g/L)
Formicacid (g/L)
Total(g/L)
HW feed 3.2 7.3 1.1 4.0 2.8 1.2 0.5 13.7 5.4 40.3HW NP010 permeate 2.8 6.8 0.9 4.4 1.8 1.2 0.3 13.6 4.7 37.2HW NP010 retentate 4.3 5.5 0.8 2.4 1.1 1.3 0.6 9.0 3.9 29.5HW UP010 permeate 4.5 6.0 0.8 4.0 2.5 1.4 0.5 16.0 6.0 42.6HW UP010 retentate 2.2 7.1 1.2 2.6 1.4 1.8 0.5 10.4 5.4 33.3
SW feed 3.7 15.7 1.3 1.3 4.2 2.8 0.5 4.4 5.4 40.0SW NP010 permeate 4.4 18.3 1.1 1.3 4.9 2.1 0.7 4.7 5.9 44.3SW NP010 retentate 3.5 13.7 0.9 1.0 3.0 2.8 0.5 3.7 4.9 34.6SW UP010 permeate 4.9 18.7 1.3 1.4 4.8 2.4 0.7 5.2 5.9 45.9SW UP010 retentate 1.5 14.5 1.1 1.1 3.4 1.9 0.7 3.5 5.2 33.4
The concentrations of carboxylic acids before and after themembrane filtration are presented in Table 2. The main dif-ferences in the acid compositions of HW and SW soda blackliquors are the larger amount of GISA in SW black liquorand the higher concentrations of 2-hydroxy butanoic acid andacetic acid in HW black liquor. As seen in the table, the concen-tration of the acids were in some cases higher in the permeatethan in the feed, which means that the acids have a negativeretention (Mänttäri and Nyström, 2006). The negative reten-tion is an advantageous phenomenon here since it improvesthe acid yield. The total yield of hydroxy acids in the permeatevaried between 71 and 91%.
3.2. Separation of sodium hydroxide and hydroxyacids
A typical chromatogram from chromatographic fractionationof HW soda black liquor on Sephadex G-10 size-exclusion gelis shown in Fig. 3a. The first peak (at 0.45 < BV < 0.8) in the con-ductivity signal consists of polyelectrolytes (lignin), hydroxyacids, and volatile acids whereas the second peak (at V > 0.8
0
0.1
0.2
0.3
0.3 0.4 0.5 0.6 0.7 0.8 0.9 1.0
Co
nd
uct
ivit
y
V, BV
NaOHOH-ac ids
1 65432
0
0.1
0.2
0.3
0.4
0.5
0.6
0.3 0.4 0.5 0.6 0.7 0.8 0.9 1.0
Co
nd
uct
ivit
y
V, BV
1 2 3
OH-ac ids NaOH
a)
b)
Fig. 3 – Fractionation of hydroxy acids of (a) HW soda blackliquor and (b) SW soda black liquor using Sephadex G-10.Hbed = 40.7 cm, Dbed = 5 cm, Vinj = 0.1 BV; eluent flow rate0.6 BV/h.
BV) is sodium hydroxide. Sodium hydroxide is completely dis-sociated (strong electrolyte) and, since the Sephadex gel isnot an ion exchange material, both Na+ and OH−can accessa large fraction of the pore volume of the gel. It is thus morestrongly retained than the hydroxy acids. The separation isbased mostly on the size of the hydrated molecules, althoughsome interactions may also occur because the weak and strongelectrolytes have the same cation (Na+).
Six hydroxy acid fractions were collected as indicated inthe figure. Since only trace amounts of hydroxy acids wereobserved in the first two fractions of HW soda black liquor,only 3 fractions were collected in the experiments carried outwith SW soda black liquor. The elution volumes equivalentto the fraction cut times are shown as dashed vertical lines inFig. 3b. The separation of hydroxy acids and sodium hydroxideis slightly better for SW black liquor than for HW black liquor.
The concentrations of carboxylic acids in the fractions col-lected from HW and SW soda black liquors after SEC arepresented in Table 3. Fractions 1 and 2 recovered from HWsoda black liquor contained only minor amounts of formateand oxalate. The low concentration of the salts was also indi-cated by the low pH of the fractions (7.0 and 7.5) in comparisonto fractions 3–6 (pH 10–11). Since hydroxy acids did not occurin fractions 1 and 2 of the HW feed, those fractions werediscarded. Therefore, only the concentrations of the acidsin fractions 3–6, which were further processed as describedbelow, are presented in Table 3.
The total concentrations of acids were approximately 29%and 40% of the concentrations in HW and SW feed solu-tions, respectively. These concentrations are slightly lowerthan could be expected based on the dilution factors calcu-lated from the volumetric ratio of the collected fractions andthe feed injection (2.8 for HW feed and 2.1 for SW feed). Thetotal yield of acids in the size-exclusion chromatographic sep-aration was 81% for HW feed and 85% for SW feed. The yieldof hydroxy acids was 71% for the HW feed and 78% for theSW feed. Based on the conductivity signal shown in Fig. 3, ahigher yield could have been expected. The small acid con-centrations may be because the CE analysis was carried outusing a different analysis instrument.
Though the main aim of the SEC was not to fractionatethe acids but to remove sodium hydroxide, some fractionationof the acids by size-exclusion also occurred. Isosaccharinicacids elute fast due to their large molecular sizes, and there-fore the highest concentrations were observed in fractions 3and 4 obtained from HW soda black liquor. Interestingly, dicar-boxylic acids were also enriched in fractions 3 and 4. Smaller

Please cite this article in press as: Hellstén, S., et al., Purification process for recovering hydroxy acids from soda black liquor. Chem. Eng. Res.Des. (2013), http://dx.doi.org/10.1016/j.cherd.2013.06.001
ARTICLE IN PRESSCHERD-1258; No. of Pages 10
6 chemical engineering research and design x x x ( 2 0 1 3 ) xxx–xxx
Table 3 – Concentration of carboxylic acids in the fractions recovered from HW and SW black liquors using SephadexG-10. Ultrafiltration using the NP010 membrane was applied as pre-treatment.
Fraction XISA(g/L)
GISA(g/L)
2,5-DHPA(g/L)
2-OH-butanoicacid (g/L)
Lacticacid (g/L)
Glycolicacid (g/L)
Oxalicacid (g/L)
Aceticacid (g/L)
Formicacid (g/L)
Total(g/L)
HW soda black liquor3 1.1 1.4 0 0.30 0.34 0.25 0.29 1.80 0.18 5.64 2.1 2.3 0 2.0 1.2 0.66 0.23 7.40 1.71 17.65 0.98 0.61 0 3.1 1.0 0.57 0 8.36 3.31 17.96 0 0 0 0.48 0 0 0 0.65 0.71 1.8
SW soda black liquor1 0.63 5.8 0 0 0.44 0.50 0.33 0.75 0 8.52 3.1 11.4 0.68 0.93 3.7 1.6 0 4.02 2.07 27.63 1.3 0.52 0.54 1.6 2.5 0.82 0 4.21 6.06 17.5
2-hydroxy butanoic acid was accumulated in fractions 5 and6. However, all the fractions collected were acid mixtures withvolatile acids as main components. As seen in Table 3, high-est acid concentrations occur in fractions 4 and 5, while theconcentration of acids in fraction 6 is very low. GC/MS analy-sis also revealed the presence of polar aromatic acids, whichcan be detrimental to polymerization reactions, in fraction 6.Therefore, the sixth fraction might not be applicable for poly-merization.
For SW soda black liquor, only three fractions were col-lected. As seen in Table 3, GISA is the main component infractions 1 and 2 while smaller hydroxy acids occur in frac-tion 3. Volatile acids are also enriched in fraction 3. The purityof GISA in the first fraction was as high as 69%. If the aim is topurify single hydroxy acids, the partial fractionation obtainedis very useful.
The concentration of lignin in the recovered hydroxy acidfractions was 1.4–4.3 g/L (see Fig. 4). Removal of the resid-ual lignin in discussed in Section 3.4. A minor fraction oflignin also ends up to the NaOH fraction, which would not beexpected based on the molecular size. Therefore, adsorption oflignin on the size-exclusion gel seems to affect the separation.
Chromatographic separation experiments were carried outalso with black liquors filtrated with the UP010 membrane tosee the effect of membrane cut-off on the chromatographicseparation. It was observed that the hydroxy acid compo-sition of the fractions collected from size-exclusion columnwas nearly independent of the membrane used in the pre-ceding step. It can be thus concluded that the fouling of theresin due to a higher lignin concentration in the feed doesnot affect the separation of hydroxy acids and NaOH. On theother hand, the amount of lignin in the fractions collectedfrom SEC was clearly higher when the feed was permeateof the UP010 membrane than when treating the permeate ofthe NP010 membrane. However, the ratio of lignin concen-trations of the fractions recovered to the feed concentrationwas approximately the same. Palm and Zacchi (2004) haveobserved that lignin can be adsorbed on the size-exclusion gel,which becomes saturated at some point and, consequently,lignin start passing to the product fractions in increasingamount. When the concentration of lignin in the feed solu-tion is higher, this saturation is likely to be reached earlier.Therefore, more frequent washing is probably required if thepre-treatment is done using a loose ultrafiltration membrane.
3.3. Liberation of the acids
The pH of the fractions recovered using SEC was about 10.At this high pH, carboxylic acids occur as sodium salts. To
Fig. 4 – Concentration of lignin in the fractions after thedifferent process steps: (a) HW soda black liquor and (b) SWsoda black liquor. The NP010 membrane was applied forpre-treatment.
liberate the acids and to remove the residual sodium, a cationexchange resin in H+ form was used. The pH of the fractionsafter the ion-exchange ranged from 1.6 to 2.9. Based on thedegree of protonation determined by titration of the feed, theconversion of sodium salts to acid form was 90–100% in theion exchange step. The ion-exchange was thus successful inliberation of the acids.
The solutions were slightly diluted during the ion-exchange. Consequently, the average total concentration ofhydroxy acids and volatile acids in the fractions after ion-exchange was 72% of the feed concentration. Such dilution canbe minimized by collecting only the concentration plateau asthe product, which slightly reduces the yield. The yield of ion-exchange was 68% when the most dilute parts of the front andtail were left out of the product fraction. It should be noted,however, that no loss of acids due to adsorption onto the
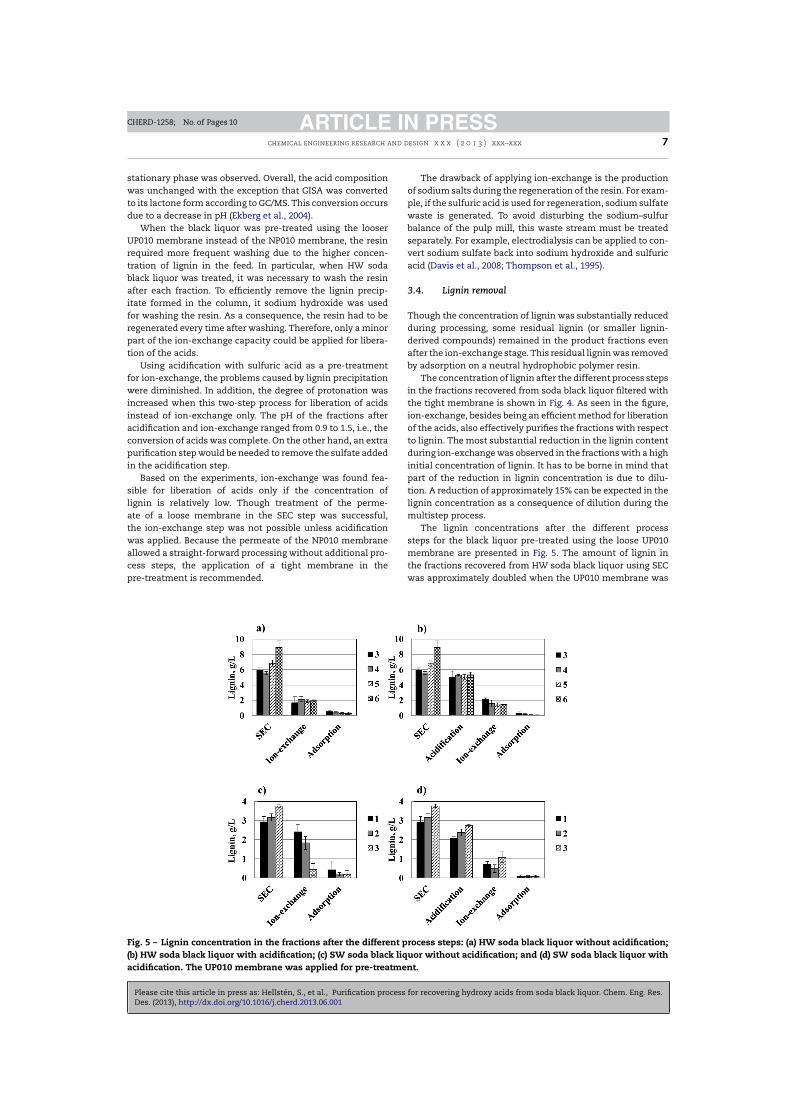
Please cite this article in press as: Hellstén, S., et al., Purification process for recovering hydroxy acids from soda black liquor. Chem. Eng. Res.Des. (2013), http://dx.doi.org/10.1016/j.cherd.2013.06.001
ARTICLE IN PRESSCHERD-1258; No. of Pages 10
chemical engineering research and design x x x ( 2 0 1 3 ) xxx–xxx 7
stationary phase was observed. Overall, the acid compositionwas unchanged with the exception that GISA was convertedto its lactone form according to GC/MS. This conversion occursdue to a decrease in pH (Ekberg et al., 2004).
When the black liquor was pre-treated using the looserUP010 membrane instead of the NP010 membrane, the resinrequired more frequent washing due to the higher concen-tration of lignin in the feed. In particular, when HW sodablack liquor was treated, it was necessary to wash the resinafter each fraction. To efficiently remove the lignin precip-itate formed in the column, it sodium hydroxide was usedfor washing the resin. As a consequence, the resin had to beregenerated every time after washing. Therefore, only a minorpart of the ion-exchange capacity could be applied for libera-tion of the acids.
Using acidification with sulfuric acid as a pre-treatmentfor ion-exchange, the problems caused by lignin precipitationwere diminished. In addition, the degree of protonation wasincreased when this two-step process for liberation of acidsinstead of ion-exchange only. The pH of the fractions afteracidification and ion-exchange ranged from 0.9 to 1.5, i.e., theconversion of acids was complete. On the other hand, an extrapurification step would be needed to remove the sulfate addedin the acidification step.
Based on the experiments, ion-exchange was found fea-sible for liberation of acids only if the concentration oflignin is relatively low. Though treatment of the perme-ate of a loose membrane in the SEC step was successful,the ion-exchange step was not possible unless acidificationwas applied. Because the permeate of the NP010 membraneallowed a straight-forward processing without additional pro-cess steps, the application of a tight membrane in thepre-treatment is recommended.
The drawback of applying ion-exchange is the productionof sodium salts during the regeneration of the resin. For exam-ple, if the sulfuric acid is used for regeneration, sodium sulfatewaste is generated. To avoid disturbing the sodium–sulfurbalance of the pulp mill, this waste stream must be treatedseparately. For example, electrodialysis can be applied to con-vert sodium sulfate back into sodium hydroxide and sulfuricacid (Davis et al., 2008; Thompson et al., 1995).
3.4. Lignin removal
Though the concentration of lignin was substantially reducedduring processing, some residual lignin (or smaller lignin-derived compounds) remained in the product fractions evenafter the ion-exchange stage. This residual lignin was removedby adsorption on a neutral hydrophobic polymer resin.
The concentration of lignin after the different process stepsin the fractions recovered from soda black liquor filtered withthe tight membrane is shown in Fig. 4. As seen in the figure,ion-exchange, besides being an efficient method for liberationof the acids, also effectively purifies the fractions with respectto lignin. The most substantial reduction in the lignin contentduring ion-exchange was observed in the fractions with a highinitial concentration of lignin. It has to be borne in mind thatpart of the reduction in lignin concentration is due to dilu-tion. A reduction of approximately 15% can be expected in thelignin concentration as a consequence of dilution during themultistep process.
The lignin concentrations after the different processsteps for the black liquor pre-treated using the loose UP010membrane are presented in Fig. 5. The amount of lignin inthe fractions recovered from HW soda black liquor using SECwas approximately doubled when the UP010 membrane was
Fig. 5 – Lignin concentration in the fractions after the different process steps: (a) HW soda black liquor without acidification;(b) HW soda black liquor with acidification; (c) SW soda black liquor without acidification; and (d) SW soda black liquor withacidification. The UP010 membrane was applied for pre-treatment.
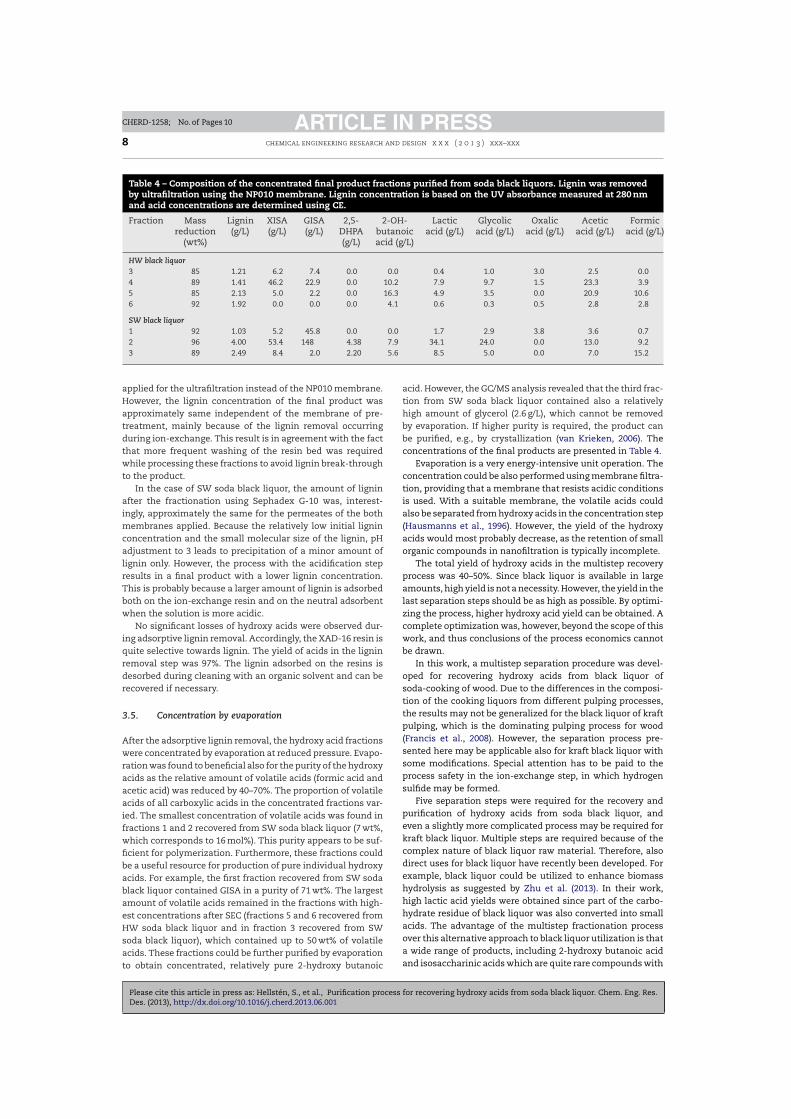
Please cite this article in press as: Hellstén, S., et al., Purification process for recovering hydroxy acids from soda black liquor. Chem. Eng. Res.Des. (2013), http://dx.doi.org/10.1016/j.cherd.2013.06.001
ARTICLE IN PRESSCHERD-1258; No. of Pages 10
8 chemical engineering research and design x x x ( 2 0 1 3 ) xxx–xxx
Table 4 – Composition of the concentrated final product fractions purified from soda black liquors. Lignin was removedby ultrafiltration using the NP010 membrane. Lignin concentration is based on the UV absorbance measured at 280 nmand acid concentrations are determined using CE.
Fraction Massreduction
(wt%)
Lignin(g/L)
XISA(g/L)
GISA(g/L)
2,5-DHPA(g/L)
2-OH-butanoicacid (g/L)
Lacticacid (g/L)
Glycolicacid (g/L)
Oxalicacid (g/L)
Aceticacid (g/L)
Formicacid (g/L)
HW black liquor3 85 1.21 6.2 7.4 0.0 0.0 0.4 1.0 3.0 2.5 0.04 89 1.41 46.2 22.9 0.0 10.2 7.9 9.7 1.5 23.3 3.95 85 2.13 5.0 2.2 0.0 16.3 4.9 3.5 0.0 20.9 10.66 92 1.92 0.0 0.0 0.0 4.1 0.6 0.3 0.5 2.8 2.8
SW black liquor1 92 1.03 5.2 45.8 0.0 0.0 1.7 2.9 3.8 3.6 0.72 96 4.00 53.4 148 4.38 7.9 34.1 24.0 0.0 13.0 9.23 89 2.49 8.4 2.0 2.20 5.6 8.5 5.0 0.0 7.0 15.2
applied for the ultrafiltration instead of the NP010 membrane.However, the lignin concentration of the final product wasapproximately same independent of the membrane of pre-treatment, mainly because of the lignin removal occurringduring ion-exchange. This result is in agreement with the factthat more frequent washing of the resin bed was requiredwhile processing these fractions to avoid lignin break-throughto the product.
In the case of SW soda black liquor, the amount of ligninafter the fractionation using Sephadex G-10 was, interest-ingly, approximately the same for the permeates of the bothmembranes applied. Because the relatively low initial ligninconcentration and the small molecular size of the lignin, pHadjustment to 3 leads to precipitation of a minor amount oflignin only. However, the process with the acidification stepresults in a final product with a lower lignin concentration.This is probably because a larger amount of lignin is adsorbedboth on the ion-exchange resin and on the neutral adsorbentwhen the solution is more acidic.
No significant losses of hydroxy acids were observed dur-ing adsorptive lignin removal. Accordingly, the XAD-16 resin isquite selective towards lignin. The yield of acids in the ligninremoval step was 97%. The lignin adsorbed on the resins isdesorbed during cleaning with an organic solvent and can berecovered if necessary.
3.5. Concentration by evaporation
After the adsorptive lignin removal, the hydroxy acid fractionswere concentrated by evaporation at reduced pressure. Evapo-ration was found to beneficial also for the purity of the hydroxyacids as the relative amount of volatile acids (formic acid andacetic acid) was reduced by 40–70%. The proportion of volatileacids of all carboxylic acids in the concentrated fractions var-ied. The smallest concentration of volatile acids was found infractions 1 and 2 recovered from SW soda black liquor (7 wt%,which corresponds to 16 mol%). This purity appears to be suf-ficient for polymerization. Furthermore, these fractions couldbe a useful resource for production of pure individual hydroxyacids. For example, the first fraction recovered from SW sodablack liquor contained GISA in a purity of 71 wt%. The largestamount of volatile acids remained in the fractions with high-est concentrations after SEC (fractions 5 and 6 recovered fromHW soda black liquor and in fraction 3 recovered from SWsoda black liquor), which contained up to 50 wt% of volatileacids. These fractions could be further purified by evaporationto obtain concentrated, relatively pure 2-hydroxy butanoic
acid. However, the GC/MS analysis revealed that the third frac-tion from SW soda black liquor contained also a relativelyhigh amount of glycerol (2.6 g/L), which cannot be removedby evaporation. If higher purity is required, the product canbe purified, e.g., by crystallization (van Krieken, 2006). Theconcentrations of the final products are presented in Table 4.
Evaporation is a very energy-intensive unit operation. Theconcentration could be also performed using membrane filtra-tion, providing that a membrane that resists acidic conditionsis used. With a suitable membrane, the volatile acids couldalso be separated from hydroxy acids in the concentration step(Hausmanns et al., 1996). However, the yield of the hydroxyacids would most probably decrease, as the retention of smallorganic compounds in nanofiltration is typically incomplete.
The total yield of hydroxy acids in the multistep recoveryprocess was 40–50%. Since black liquor is available in largeamounts, high yield is not a necessity. However, the yield in thelast separation steps should be as high as possible. By optimi-zing the process, higher hydroxy acid yield can be obtained. Acomplete optimization was, however, beyond the scope of thiswork, and thus conclusions of the process economics cannotbe drawn.
In this work, a multistep separation procedure was devel-oped for recovering hydroxy acids from black liquor ofsoda-cooking of wood. Due to the differences in the composi-tion of the cooking liquors from different pulping processes,the results may not be generalized for the black liquor of kraftpulping, which is the dominating pulping process for wood(Francis et al., 2008). However, the separation process pre-sented here may be applicable also for kraft black liquor withsome modifications. Special attention has to be paid to theprocess safety in the ion-exchange step, in which hydrogensulfide may be formed.
Five separation steps were required for the recovery andpurification of hydroxy acids from soda black liquor, andeven a slightly more complicated process may be required forkraft black liquor. Multiple steps are required because of thecomplex nature of black liquor raw material. Therefore, alsodirect uses for black liquor have recently been developed. Forexample, black liquor could be utilized to enhance biomasshydrolysis as suggested by Zhu et al. (2013). In their work,high lactic acid yields were obtained since part of the carbo-hydrate residue of black liquor was also converted into smallacids. The advantage of the multistep fractionation processover this alternative approach to black liquor utilization is thata wide range of products, including 2-hydroxy butanoic acidand isosaccharinic acids which are quite rare compounds with

Please cite this article in press as: Hellstén, S., et al., Purification process for recovering hydroxy acids from soda black liquor. Chem. Eng. Res.Des. (2013), http://dx.doi.org/10.1016/j.cherd.2013.06.001
ARTICLE IN PRESSCHERD-1258; No. of Pages 10
chemical engineering research and design x x x ( 2 0 1 3 ) xxx–xxx 9
a limited availability, can be obtained. In addition, the fraction-ation process allows easy recovery of cooking chemicals forre-use and lignin for energy production, which may be crucialfor the pulp mill.
4. Conclusions
A novel separation and purification process for the recoveryof hydroxy acids from black liquor was developed and ver-ified experimentally. The process consists of ultrafiltrationto remove most of lignin, size-exclusion chromatography toseparate hydroxy acids and NaOH, ion-exchange to convertthe sodium salts of acids to protonated form, adsorption toremove residual lignin, and evaporation to concentrate theproduct fractions and to remove volatile acids. The mainadvantage of the process is that neutralization of black liquoris not required, and the chemical consumption is thus low.
The total purity of hydroxy acids increased from 19 wt% to81 wt% for SW soda black liquor and from 13 to 63 wt% for HWsoda black liquor. Such hydroxy acids fractions are most prob-ably sufficiently pure for polymerization. The concentrationof lignin, which is the most critical impurity, was reduced byapproximately 99% during the processing black liquor.
The produced hydroxy acid mixtures can be further frac-tionated to obtain single hydroxy acids. However, a relativelyhigh purity for some single hydroxy acids can be achievedalready with the process described here. For example, GISAin purity >70 wt% was recovered.
Acknowledgements
Future Biorefinery (FuBio) Joint Research 2 Programme (FibicLtd. and Tekes) is acknowledged for funding. S. Sundqvist ofVTT (Technical Research Centre of Finland) is acknowledgedfor providing the soda black liquor. S. Rovio of VTT and L. Puroof LUT are acknowledged for CE analyses and K. Niemelä ofVTT for GC/MS analyses. H. Turkia is acknowledged for deter-mination of ash content. T. Puustinen of LUT is gratefullyacknowledged for assisting with the experiments. GraduateSchool in Chemical Engineering (Finland) is acknowledged forfunding (S.H. and J.H.).
References
Alén, R., Moilanen, V., Sjöström, E., 1986. Potential recovery ofhydroxy acids from kraft pulping liquors. Tappi J. 69, 76–78.
Alén, R., Sjöström, E., Suominen, S., 1990. Application ofion-exclusion chromatography to alkaline pulping liquors:separation of hydroxy carboxylic acids from inorganic solids.J. Chem. Technol. Biotechnol. 51, 225–233.
Alén, R., Sjöström, E., 1980. Isolation of hydroxy acids from pinekraft black liquor. Part 1. Preparation of crude fraction. Pap.Puu 62, 328–329.
Barralet, J.E., Tremayne, M., Lilley, K.J., Gbureck, U., 2005.Modification of calcium phosphate cement with �-hydroxyacids and their salts. Chem. Mater. 17, 1313–1319.
Cara, C., Ruiz, E., Carvalheiro, F., Moura, P., Ballesteros, I., Castro,E., Gírio, F., 2012. Production, purification and characterisationof oligosaccharides from olive tree pruning autohydrolysis.Ind. Crop. Prod. 40, 225–231.
Davis, S.M., Gray, G.E., Kohl, P.A., 2008. Candidate membranes forthe electrochemical salt-splitting of sodium sulfate. J. Appl.Electrochem. 38, 777–783.
De, S., Bhattacharya, P.K., 1996. Recovery of water and inorganicchemicals from black liquor using membrane separationprocesses. Tappi J. 79, 103–111.
Draelos, Z.D., 2000. Alpha-hydroxy acids, beta-hydroxy acid, andother topical agents. Dermatol. Ther. 13, 154–158.
Ekberg, S., Ekberg, C., Albinsson, Y., 2004. Characterization ofalfa-isosaccharinic acid: lactone and carboxylicconformations. J. Solut. Chem. 33, 465–477.
FitzPatrick, M., Champagne, P., Cunningham, M.F., Whitney, R.A.,2010. A biorefinery processing perspective: treatment oflignocellulosic materials for the production of value-addedproducts. Bioresour. Technol. 101, 8915–8922.
Francis, R.C., Bolton, T.S., Abdoulmoumine, N., Lavrykova, N.,Bose, S.K., 2008. Positive and negative aspects ofsoda/anthraquinone pulping of hardwoods. Bioresour.Technol. 99, 8453–8457.
Gouveia, S., Fernández-Costas, C., Sanromán, M.A., Moldes, D.,2012. Enzymatic polymerisation and effect of fractionation ofdissolved lignin from Eucalyptus globulus Kraft liquor.Bioresour. Technol. 121, 131–138.
Harris, D.C., 1987. Quantitative Chemical Analysis, 2nd ed. W.H.Freeman and Company, New York, US.
Hausmanns, S., Laufenberg, G., Kunz, B., 1996. Rejection of aceticacid and its improvement by combination with organic acidsin dilute solutions using reverse osmosis. Desalination 104,95–98.
Jönsson, A.S., Wallberg, O., 2009. Cost estimates of kraft ligninrecovery by ultrafiltration. Desalination 237, 254–267.
Loomis, G.L., Ostapchenko, G.J. 1991. Polyhydroxy acid films.5,076,983.
Mehtiö, T., Nurmi, L., Rämö, V., Harlin, A., Ropponen, J., 2012.Copolymerization of glycolic, d,l-lactic andd,l-2-hydroxybutyric acid mixtures present in kraft blackliquors. Eur. Polym. J. 48, 774–778.
Mänttäri, M., Nyström, M., 2006. Negative retention of organiccompounds in nanofiltration. Desalination 199, 41–42.
Merewether, J.W.T., 1961. Lignin XIV: the precipitation of ligninfrom kraft black liquor. Holzforschung 15, 168–177.
Mishra, A.K., Bhattacharya, P.K., 1987. Alkaline black liquortreatment by continuous electrodialysis. J. Membr. Sci. 33,83–95.
Moura, P., Barata, R., Carvalheiro, F., Gírio, F., Loureiro-Dias, M.C.,Esteves, M.P., 2007. In vitro fermentation ofxylo-oligosaccharides from corn cobs autohydrolysis byBifidobacterium and Lactobacillus strains. LWT: Food Sci.Technol. 40, 963–972.
Niemelä, K., 1989. Identification ofO-�-d-galactopyranosylsaccharinic acids as theirtrimethylsilyl derivatives by mass spectrometry. Carbohydr.Res. 194, 37–47.
Niemi, H., Lahti, J., Hatakka, H., Kärki, S., Rovio, S., Kallioinen, M.,Mänttäri, M., Louhi-Kultanen, M., 2011. Fractionation oforganic and inorganic compounds from black liquor bycombining membrane separation and crystallization. Chem.Eng. Technol. 34, 593–598.
Öhman, F., Theliander, H., 2007. Filtration properties of ligninprecipitated from black liquor. Tappi J. 6, 3–9.
Öhman, F., Wallmo, H., Theliander, H., 2007. Precipitation andfiltration of lignin from black liquor of different origin. Nord.Pulp Pap. Res. J. 22, 188–193.
Ouyang, X., Zhang, P., Qiu, X., Deng, Y., Chen, P., 2011.Lignosulfonate separation using preparative columnchromatography. Ind. Eng. Chem. Res. 50, 10792–10799.
Palm, M., Zacchi, G., 2004. Separation of hemicellulosic oligomersfrom steam-treated spruce wood using gel filtration. Sep.Purif. Technol. 36, 191–201.
Rovio, S., Kalliola, A., Sirén, H., Tamminen, T., 2010.Determination of the carboxylic acids in acidic and basicprocess samples by capillary zone electrophoresis. J.Chromatogr. A 1217, 1407–1413.
Rowe, J.W., Gregor, H.P., 1986. Membrane processes for separationof organic acids from kraft black liquors. 4,584,057.
Thompson, R., Paleologou, M., Berry, R.M., 1995. Caustic sodaand sulfuric acid production from sodium sulfate by-productof chlorine dioxide generation: economics. Tappi J. 78,127–134.

Please cite this article in press as: Hellstén, S., et al., Purification process for recovering hydroxy acids from soda black liquor. Chem. Eng. Res.Des. (2013), http://dx.doi.org/10.1016/j.cherd.2013.06.001
ARTICLE IN PRESSCHERD-1258; No. of Pages 10
10 chemical engineering research and design x x x ( 2 0 1 3 ) xxx–xxx
Toledano, A., García, A., Mondragon, I., Labidi, J., 2010a. Ligninseparation and fractionation by ultrafiltration. Sep. Purif.Technol. 71, 38–43.
Toledano, A., Serrano, L., Garcia, A., Mondragon, I., Labidi, J.,2010b. Comparative study of lignin fractionation byultrafiltration and selective precipitation. Chem. Eng. J. 157,93–99.
van Heiningen, A., 2006. Converting a kraft pulp mill into anintegrated forest biorefinery. Pulp Pap. Can. 107, 38–43.
van Krieken, J., 2006. Method for the purification of analpha-hydroxy acid on an industrial scale. US 7,002,039B2.
Wang, S., Huang, Y., 2008. Process for production of highmolecular weight polyhydroxy acid. TW200815497.
Zhu, Z., Sun, M.M., Su, C., Zhao, H., Ma, X., Zhu, Z., Shi, X., Gu, K.,2013. One-pot quantitative hydrolysis of lignocellulosesmediated by black liquor. Bioresour. Technol. 128,229–234.
ACTA UNIVERSITATIS LAPPEENRANTAENSIS 515. SARKKINEN, MINNA. Strategic innovation management based on three dimensions diagnosing
innovation development needs in a peripheral region. 2013. Diss. 516. MAGLYAS, ANDREY. Overcoming the complexity of software product management. 2013. Diss. 517. MOISIO, SAMI. A soft contact collision method for real-time simulation of triangularized geometries in
multibody dynamics. 2013. Diss.
518. IMMONEN, PAULA. Energy efficiency of a diesel-electric mobile working machine. 2013. Diss. 519. ELORANTA, LEENA. Innovation in a non-formal adult education organisation – multi-case study in
four education centres. 2013. Diss. 520. ZAKHARCHUK, IVAN. Manifestation of the pairing symmetry in the vortex core structure in iron-
based superconductors. 2013. Diss. 521. KÄÄRIÄINEN, MARJA-LEENA. Atomic layer deposited titanium and zinc oxides; structure and
doping effects on their photoactivity, photocatalytic activity and bioactivity. 2013. Diss. 522. KURONEN, JUHANI. Jatkuvan äänitehojakautuman algoritmi pitkien käytävien äänikenttien
mallintamiseen. 2013. Diss. 523. HÄMÄLÄINEN, HENRY. Identification of some additional loss components in high-power low-
voltage permanent magnet generators. 2013. Diss. 524. SÄRKKÄ, HEIKKI. Electro-oxidation treatment of pulp and paper mill circulating waters and
wastewaters. 2013. Diss. 525. HEIKKINEN, JANI. Virtual technology and haptic interface solutions for design and control of mobile
working machines. 2013. Diss. 526. SOININEN, JUHA. Entrepreneurial orientation in small and medium-sized enterprises during
economic crisis. 2013. Diss. 527. JÄPPINEN, EERO. The effects of location, feedstock availability, and supply-chain logistics on the
greenhouse gas emissions of forest-biomass energy utilization in Finland. 2013. Diss. 528. SÖDERHOLM, KRISTIINA. Licensing model development for small modular reactors (SMRs) –
focusing on the Finnish regulatory framework. 2013. Diss. 529. LAISI, MILLA. Deregulation’s impact on the railway freight transport sector’s future in the Baltic Sea
region. 2013. Diss. 530. VORONIN, SERGEY. Price spike forecasting in a competitive day-ahead energy market. 2013. Diss. 531. PONOMAREV, PAVEL. Tooth-coil permanent magnet synchronous machine design for special
applications. 2013. Diss. 532. HIETANEN, TOMI. Magnesium hydroxide-based peroxide bleaching of high-brightness mechanical
pulps. 2013. Diss. 533. TYKKÄLÄ, TOMMI M. Real-time image-based RGB-D camera motion tracking and environment
mapping. 2013. Diss. 534. PEKKOLA, SANNA. Performance measurement and management in a collaborative network. 2013.
Diss.
535. PANOREL, IRIS CHERRY. Pulsed corona discharge as an advanced oxidation process for the degradation of organic compounds in water. 2013. Diss.
536. TORKKELI, LASSE. The influence of network competence of internationalization of SMEs. 2013.
Diss. 537. MOLANDER, SOLE. Productivity and services – safety telephone services for the elderly. 2013.
Diss. 538. SITARZ, ROBERT. Identification of research trends in the field of separation processes.
Application of epidemiological model, citation analysis, text mining, and technical analysis of the financial markets. 2013. Diss.
539. KATTEDEN, KAMIEV. Design and testing of an armature-reaction-compensated permanent magnet synchronous generator for island operation. 2013. Diss.
540. HÄMÄLÄINEN, HARRI. Integration of learning supportive applications to development of e-portfolio
construction process. 2013. Diss. 541. RATCHANANUSORN, WARIN. Development of a process for the direct synthesis of hydrogen
peroxide in a novel microstructured reactor. 2013. Diss. 542. PERFILEV, DANIIL. Methodology for wind turbine blade geometry optimization. 2013. Diss. 543. STROKINA, NATALIYA. Machine vision methods for process measurements in pulping. 2013. Diss. 544. MARTTONEN, SALLA. Modelling flexible asset management in industrial maintenance companies
and networks. 2013. Diss. 545. HAKKARAINEN, JANNE. On state and parameter estimation in chaotic systems. 2013. Diss. 546. HYYPIÄ, MIRVA. Roles of leadership in complex environments
Enhancing knowledge flows in organisational constellations through practice-based innovation processes. 2013. Diss.
547. HAAKANA, JUHA. Impact of reliability of supply on long-term development approaches to electricity
distribution networks. 2013. Diss. 548. TUOMINEN, TERHI. Accumulation of financial and social capital as means to achieve a sustained
competitive advantage of consumer co-operatives. 2013. Diss. 549. VOLCHEK, DARIA. Internationalization of small and medium-sized enterprises and impact of
institutions on international entrepreneurship in emerging economies: the case of Russia. 2013. Diss. 550. PEKKARINEN, OLLI. Industrial solution business – transition from product to solution offering. 2013.
Diss. 551. KINNUNEN, JYRI. Risk-return trade-off and autocorrelation. 2013. Diss. 552. YLÄTALO, JAAKKO. Model based analysis of the post-combustion calcium looping process for
carbon dioxide capture. 2013. Diss. 553. LEHTOVAARA, MATTI. Commercialization of modern renewable energy. 2013. Diss. 554. VIROLAINEN, SAMI. Hydrometallurgical recovery of valuable metals from secondary raw materials.
2013. Diss. 555. HEINONEN, JARI. Chromatographic recovery of chemicals from acidic biomass hydrolysates. 2013.
Diss.
