application of biomass derived materials in nanocomposites
TRANSCRIPT
Louisiana State UniversityLSU Digital Commons
LSU Doctoral Dissertations Graduate School
2016
Application of Biomass Derived Materials inNanocomposites and Drilling FluidsKunlin SongLouisiana State University and Agricultural and Mechanical College kunlinsonggmailcom
Follow this and additional works at httpsdigitalcommonslsuedugradschool_dissertations
Part of the Environmental Sciences Commons
This Dissertation is brought to you for free and open access by the Graduate School at LSU Digital Commons It has been accepted for inclusion inLSU Doctoral Dissertations by an authorized graduate school editor of LSU Digital Commons For more information please contactgradetdlsuedu
Recommended CitationSong Kunlin Application of Biomass Derived Materials in Nanocomposites and Drilling Fluids (2016) LSU Doctoral Dissertations3950httpsdigitalcommonslsuedugradschool_dissertations3950
APPLICATION OF BIOMASS DERIVED MATERIALS IN
NANOCOMPOSITES AND DRILLING FLUIDS
A Dissertation
Submitted to the Graduate Faculty of the
Louisiana State University and
Agricultural and Mechanical College
in partial fulfillment of the
requirements for the degree of
Doctor of Philosophy
in
The School of Renewable Natural Resources
by
Kunlin Song
BS Beijing Forestry University 2009
MS Chinese Academy of Forestry 2012
August 2016
ii
ACKNOWLEDGEMENTS
I would like to gratefully acknowledge the financial support from the Economic
Development Assistantship Program of Louisiana State University
Special thanks go to my advisor Dr Qinglin Wu It would be impossible for me to
overcome the difficulties in my research work without his kindness understanding advice and
patience I also greatly appreciate my committee members Dr Ioan I Negulescu Dr John A
Pojman Dr Sun Joseph Chang and Dr Steven L Namikas for their inspiring and enlightening
advice on my research
My colleagues in our lab supported and encouraged me a lot in the past years The time we
worked together will be definitely beautiful memories in my future life Here I would like to
express my gratitude to all of my lab mates Dr Chengjun Zhou Dr Runzhou Huang Dr Birm J
Kim Dr Jingquan Han Dr Yiying Yue Dr Meichun Li Dr Tian Liu Dr Min Yu Dr Huiyuan
Li Dr Zhiping Zhang Mr Kai Chi Miss Huan Zhang Mr Lichao Sun Mr Zhen Zhang Mr
Xiuxuan Sun Mr Jinlong Zhang Mr Ling Zhou Mr Cheng Yong and Miss Siwei Huang
My deepest thanks go to my friends and family for their support throughout my life In
particular I would like to thank my host family Mr and Mrs Williams for their invaluable and
expeditious suggestions and support whenever and whatever my wife and I need throughout our
American life Additionally I am deeply grateful to my family for their love and support all
through my PhD studies
iii
TABLE OF CONTENTS
ACKNOWLEDGEMENTS ii
LIST OF TABLES vi
LIST OF FIGURES vii
ABSTRACT x
CHAPTER 1 INTRODUCTION 1 11 BACKGROUND 1
111 Biomass Tar in Carbon Materials 1 112 Cellulose Nanoparticles in Drilling Fluids 4
12 OBJECTIVES 6 13 ORGANIZATION OF DISSERTATION 7
14 REFERENCES 7
CHAPTER 2 STRUCTURE AND THERMAL PROPERTIES OF TAR FROM
GASIFICATION OF AGRICULTURAL CROP RESIDUE 10
21 INTRODUCTION 10 22 MATERIALS AND METHODS 12
221 Materials 12 222 Characterization 12
23 RESULTS AND DISCUSSION 17 231 Chemical Composition 17
231 Thermal Decomposition 21 24 CONCLUSIONS 24 25 REFERENCES 25
CHAPTER 3 FABRICATING ELECTROSPUN NANOFIBER WITH ANTIMICROBIAL
CAPABILITY A FACILE ROUTE TO RECYCLE BIOMASS TAR 29
31 INTRODUCTION 29 32 MATERIALS AND METHODS 31
321 Materials 31 322 Electrospinning SolutionsSuspensions 32
323 Fabrication of Electrospun TarPAN Nanofibers 32 324 Characterizations 33
33 RESULTS AND DISCUSSION 35 331 Characteristics of Electrospinning Solutions 35 332 Microstructure of Electrospun Fibers 37
333 ATR-FTIR Spectra of Electrospun fibers 39 334 Thermal Properties 41 335 Surface Area and Porosity 44 336 Antimicrobial Activity 46
34 CONCLUSIONS 47
iv
35 REFERENCES 48
CHAPTER 4 POROUS CARBON NANOFIBERS FROM ELECTROSPUN BIOMASS
TARPOLYACRYLONITRILESILVER HYBRIDS AS ANTIMICROBIAL MATERIALS 52 41 INTRODUCTION 52
42 MATERIALS AND METHODS 54 421 Materials 54 422 Fabrication of Carbon Fiber Precursors 55 423 Stabilization and Carbonization 56 424 Characterizations 56
425 Antimicrobial Test 58 43 RESULTS AND DISCUSSION 58
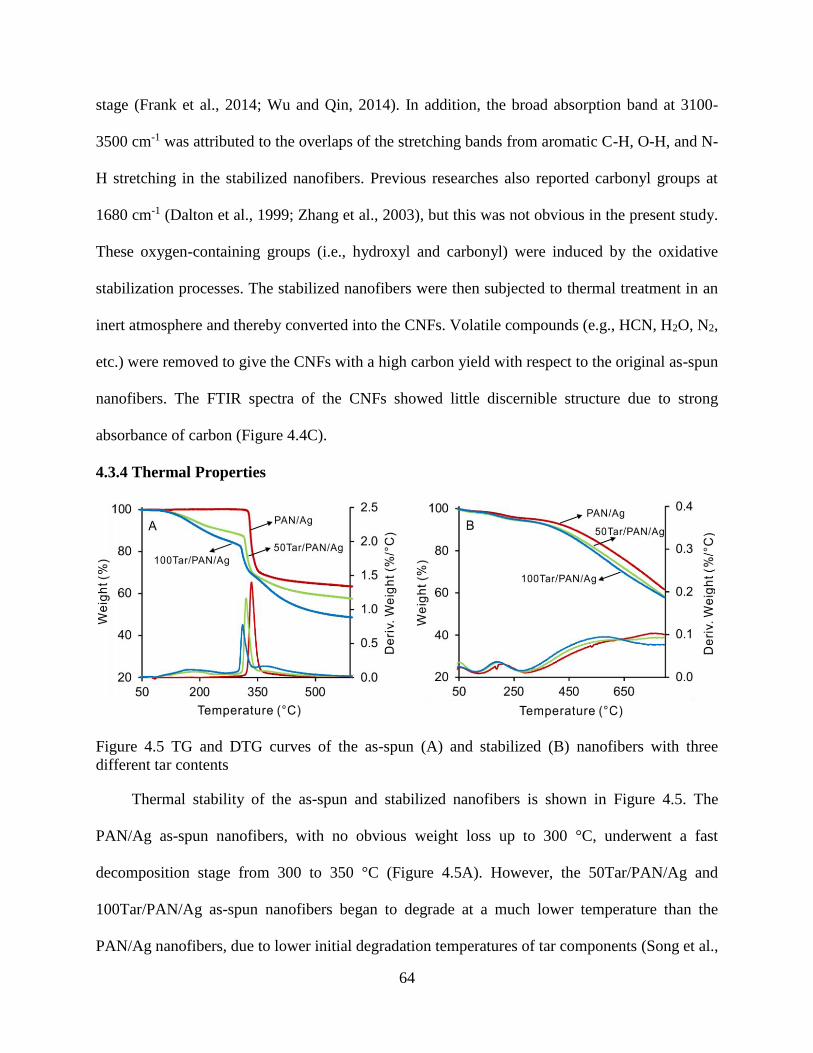
431 Properties of electrospinning suspensions 58 432 Surface Morphology 60 433 Chemical Structure 62 434 Thermal Properties 64
435 Pore Structure 66 436 Antimicrobial Performance 70
44 CONCLUSIONS 71 45 REFERENCES 72
CHAPTER 5 RHEOLOGICAL AND FLUID FILTRATION PROPERTIES OF LOW SOLID
DRILLING FLUIDS ADDED WITH CELLULOSE NANOPARTICLES 76 51 INTRODUCTION 76
52 MATERIALS AND METHODS 78
521 Materials 78
522 Formulations of Drilling Fluids 79 523 Rheological Testing 80
524 Fluid Filtration Testing 81 53 RESULTS AND DISCUSSION 81
531 Fluid Rheological Properties 81
532 Fluid Filtration Properties 87 54 CONCLUSIONS 92
55 REFERENCES 93
CHAPTER 6 NOVEL BIOPOLYMER WATER-BASED DRILLING FLUIDS FOR
ENHANCING DRILLING PERFORMANCE 96
61 INTRODUCTION 96
62 MATERIALS AND METHODS 99 621 Materials 99 622 Formations of Drilling Fluids 99 623 Rheological Measurements 100 624 Fluid Filtration Testing 101
63 RESULTS AND DISCUSSION 102 631 Structure of Nanocellulose 102 632 Rheological Properties 103
633 Fluid Filtration Under LTLP 107
v
634 Fluid Filtration Under HTHP 111 64 CONCLUSIONS 113 65 REFERENCES 114
CHAPTER 7 OVERALL CONCLUSIONS 116
71 MAIN CONCLUSIONS 116 72 FUTURE WORK 119
APPENDIX PERMISSION LETTER 122
VITA 133
vi
LIST OF TABLES
Table 21 Chemical components of the biomass tar by GC-MS 18
Table 22 The IR absorption bands for functional groups of the biomass tar 20
Table 23 Elemental analysis of biomass tar 20
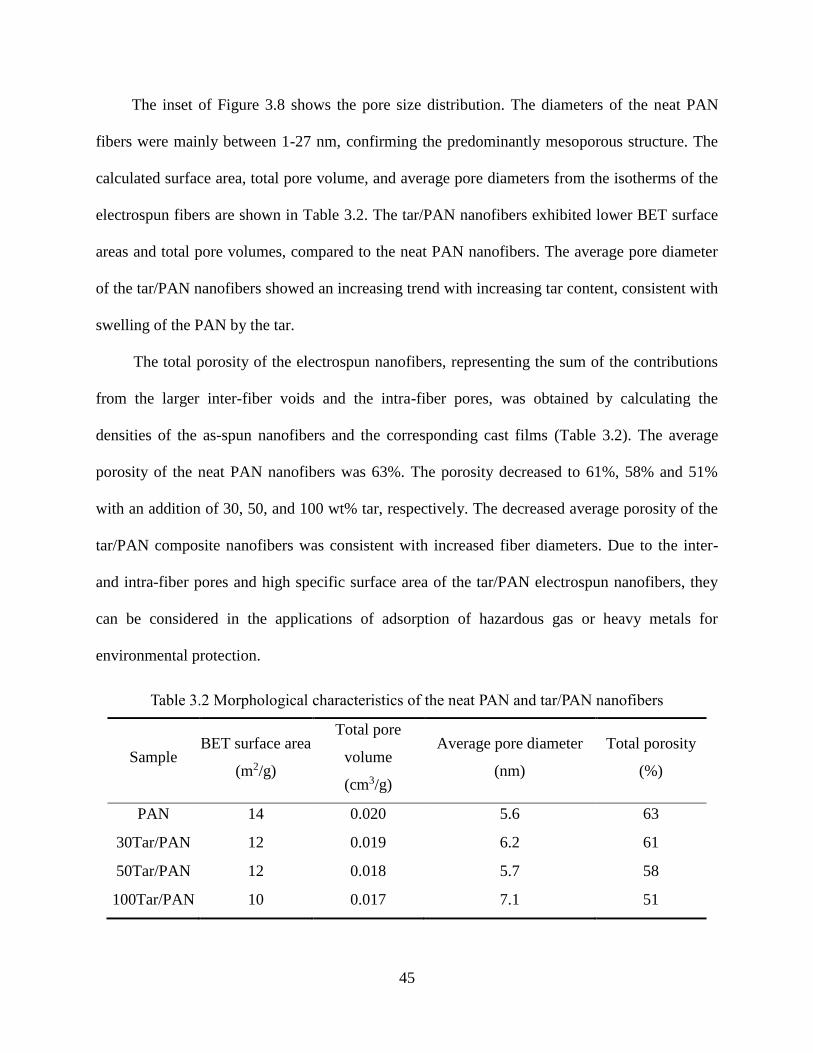
Table 31 Thermal properties of the electrospun neat PAN and tarPAN fibers 42
Table 32 Morphological characteristics of the neat PAN and tarPAN nanofibers 45
Table 41 Compositions and carbon yields of PANAg and tarPANAg electrospun nanofibers 55
Table 42 Specific surface area and pore volumes of the as-spun nanofibers and CNFs 69
Table 51 Formulations of the bentonite drilling fluids added with CNPs 79
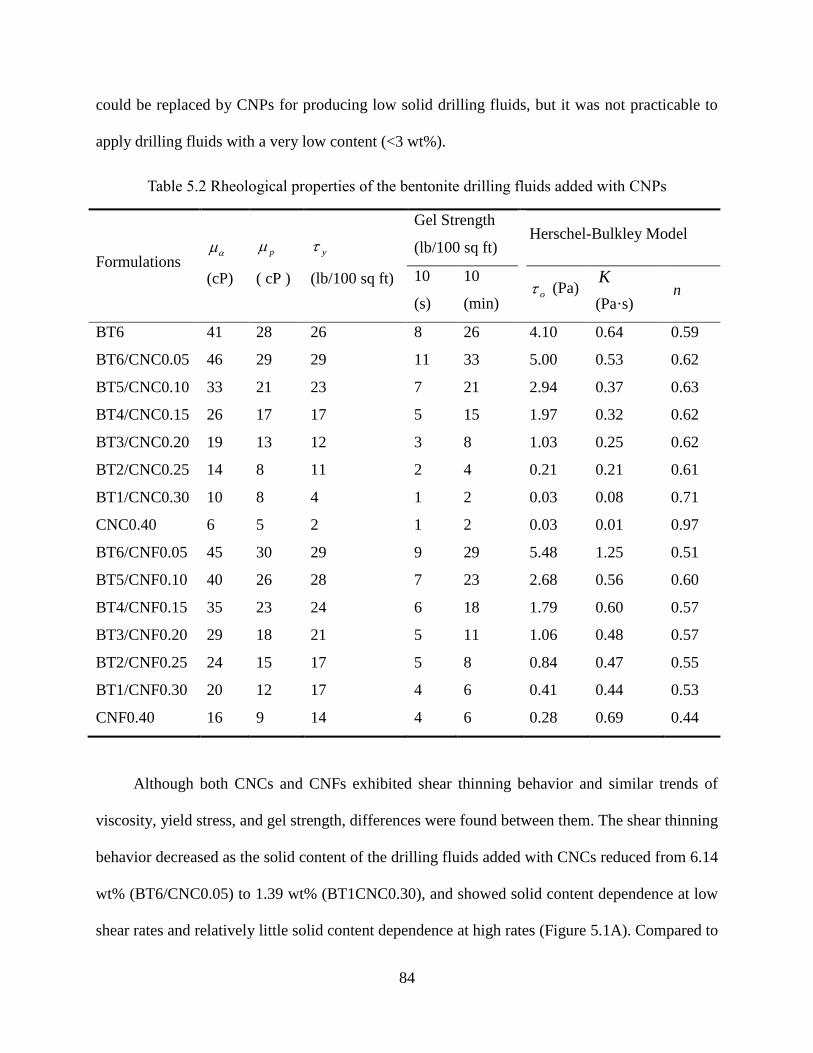
Table 52 Rheological properties of the bentonite drilling fluids added with CNPs 84
Table 61 Formulations of the drilling fluids 100
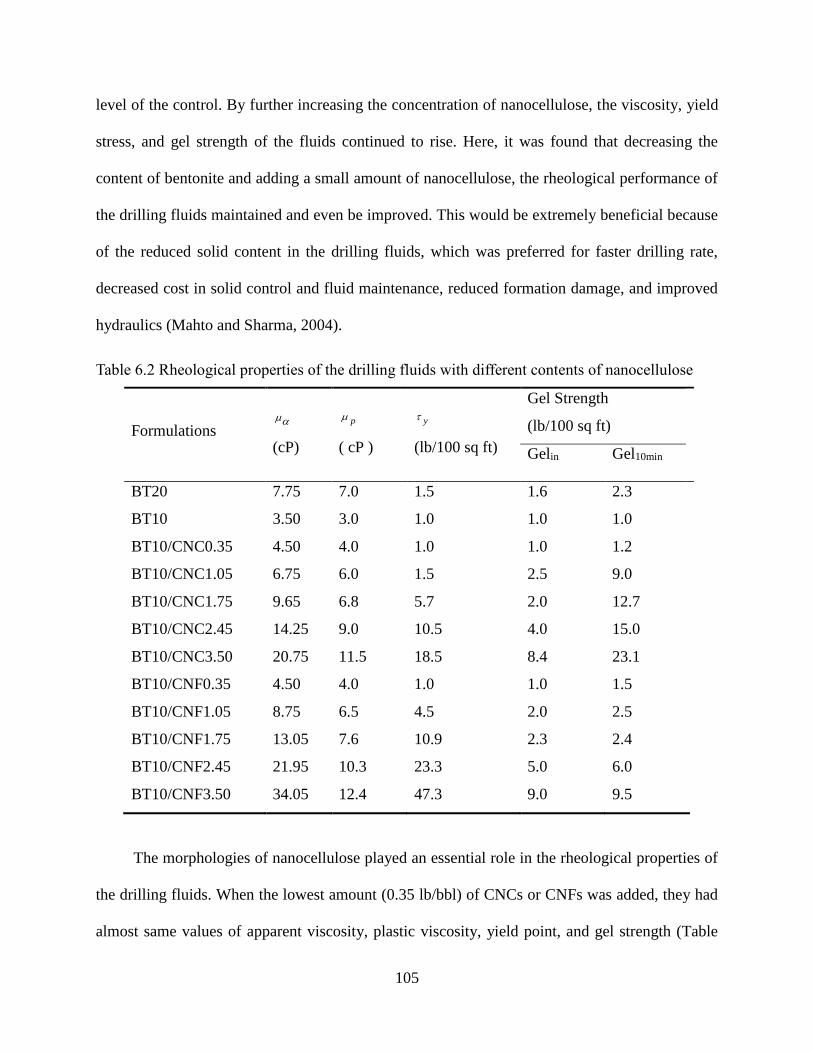
Table 62 Rheological properties of the drilling fluids with different contents of nanocellulose 105
Table 63 The API fluid loss thickness and permeability of filter cakes for the drilling fluids
under LTLP conditions 109
vii
LIST OF FIGURES
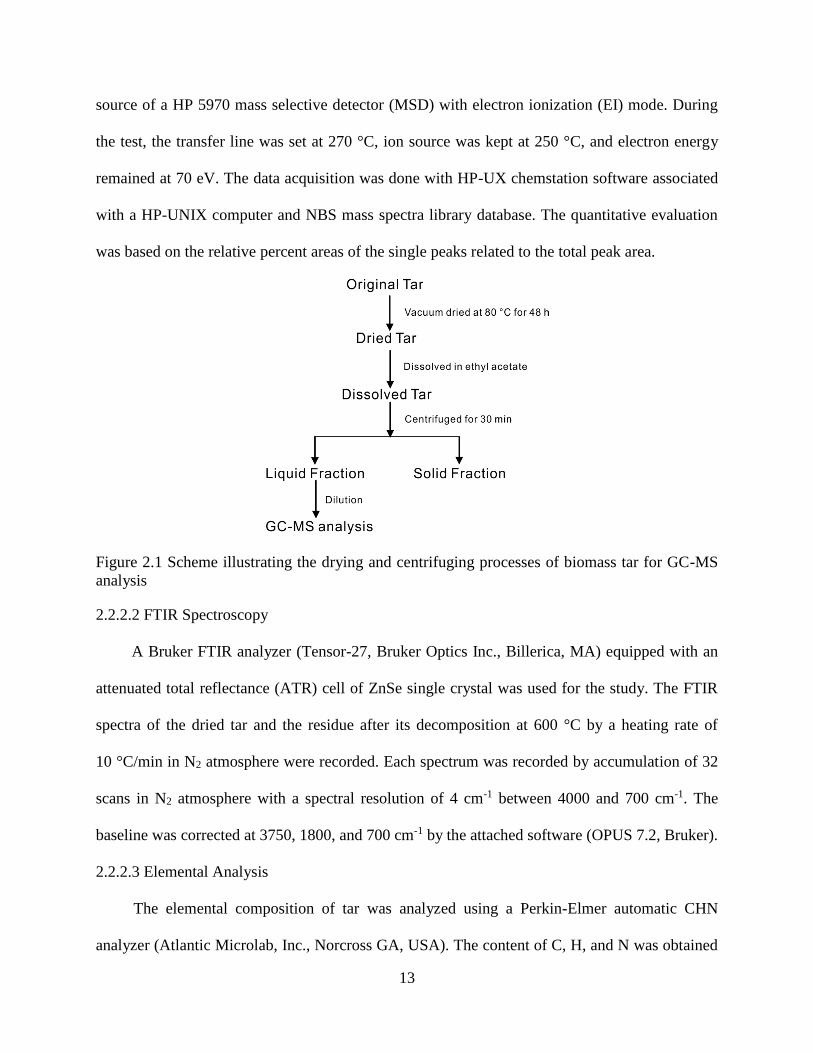
Figure 21 Scheme illustrating the drying and centrifuging processes of biomass tar for GC-MS
analysis 13
Figure 22 FTIR spectra of the original tar and the tar after thermal treatment at 600 ˚C under N2
atmosphere 19
Figure 23 Thermal gravimetric curves of biomass tar at different heating rates under nitrogen
atmosphere (a) the temperature dependence of the extent of conversion (α) for different
heating rates (b) 21
Figure 24 Arrhenius plots at selected conversion rates by Friedman (a) and DAEM (b) method22
Figure 25 The activation energy (E) plotted against the extent of conversion rate (α) 23
Figure 31 Schematic illustrating the process for fabricating biomass tarPAN nanofibers by
electrospinning 33
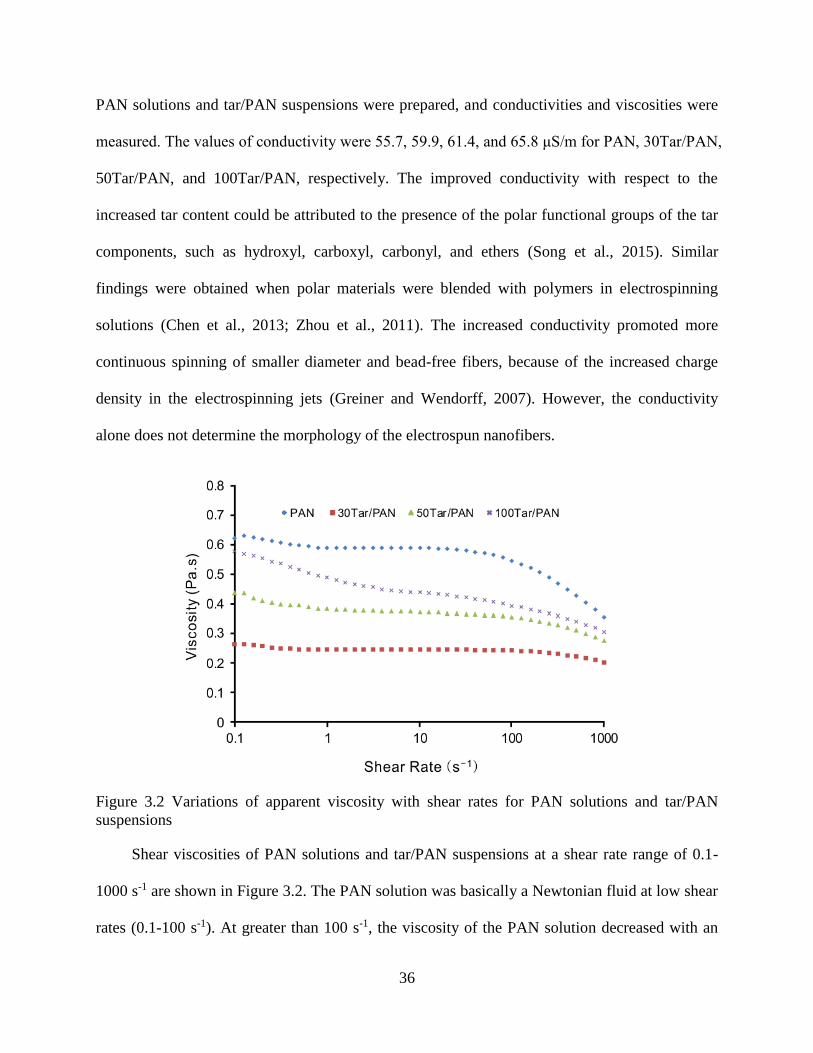
Figure 32 Variations of apparent viscosity with shear rates for PAN solutions and tarPAN
suspensions 36
Figure 33 FE-SEM micrographs of the electrospun nanofibers (inserted photos are at higher
magnification) A PAN B 30TarPAN C 50TarPAN D 100TarPAN 38
Figure 34 Average diameters of the neat PAN and tarPAN electrospun nanofibers 39
Figure 35 The ATR-FTIR spectra of the PAN 30TarPAN 50TarPAN and 100TarPAN
electrospun nanofibers 40
Figure 36 TG (solid curves) and DTG (dotted curves) of the PAN fibers tarPAN fibers and
original tar 41
Figure 37 DSC of the PAN (solid curves) and tarPAN fibers (dotted curves) The inset shows a
schematic of a tar-initiated PAN cyclization reaction (Ar-OH indicates a phenolic
component of the tar) 43
Figure 38 Nitrogen adsorptiondesorption isotherm at 77 K and BJH pore size distribution
(inset) of the PAN nanofibers Dv(d) is the derivative of pore volume with respect to pore
diameter 44
Figure 39 Antibacterial activity of the neat PAN and tarPAN nanofibers against S aureus (A B
and C) and E coli (D E and F) (A) and (D) PAN (B) and (E) 50TarPAN (C) and (F)
100TarPAN 46
Figure 41 Basic properties of the electrospinning suspensions (A) The shear viscosity-shear rate
relationships for PANAg 50 TarPANAg and 100TarPANAg (B) UV absorbance of
PAN and PANAg 59
viii
Figure 42 FE-SEM micrographs of the as-spun nanofibers (A PANAg C 50TarPANAg E
100TarPANAg) and CNFs (B PANAg-CNF D 50TarPANAg-CNF F 100TarPANAg-
CNF) (The inset at the bottom-right of each micrograph shows a higher magnification
image) 61
Figure 43 A compasrison of average diameters of the as-spun nanofibers and CNFs from three
different formulations 62
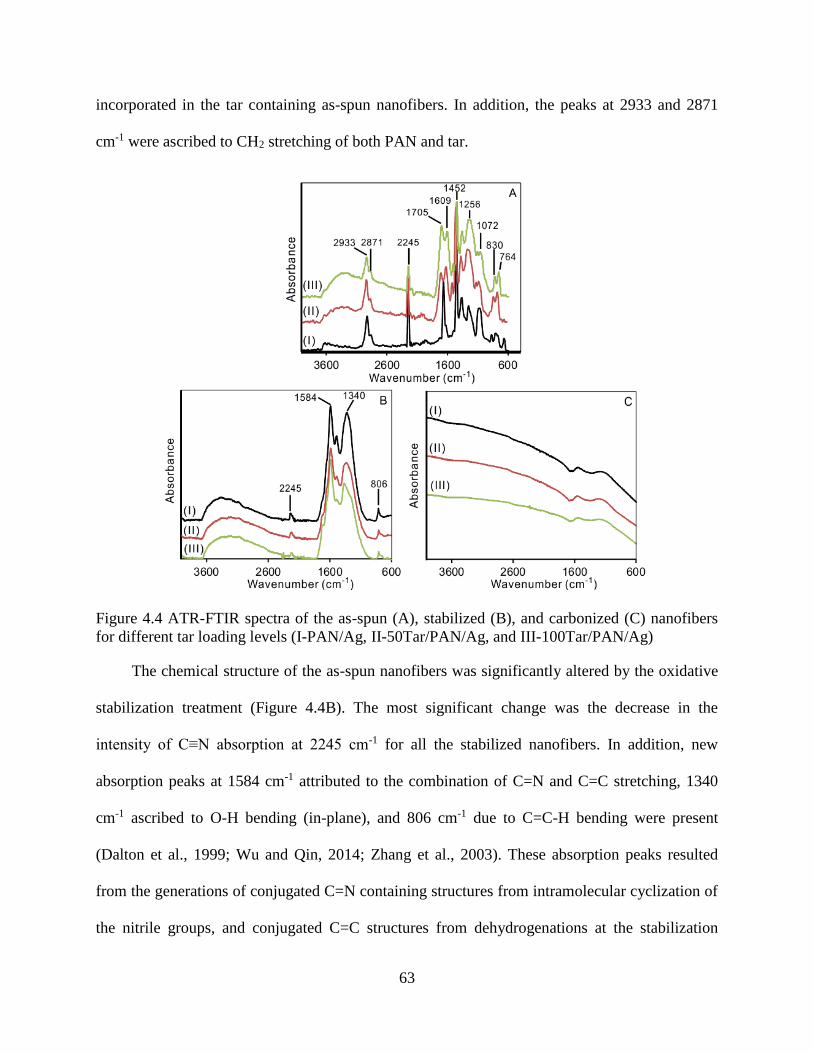
Figure 44 ATR-FTIR spectra of the as-spun (A) stabilized (B) and carbonized (C) nanofibers
for different tar loading levels (I-PANAg II-50TarPANAg and III-100TarPANAg) 63
Figure 45 TG and DTG curves of the as-spun (A) and stabilized (B) nanofibers with three
different tar contents 64
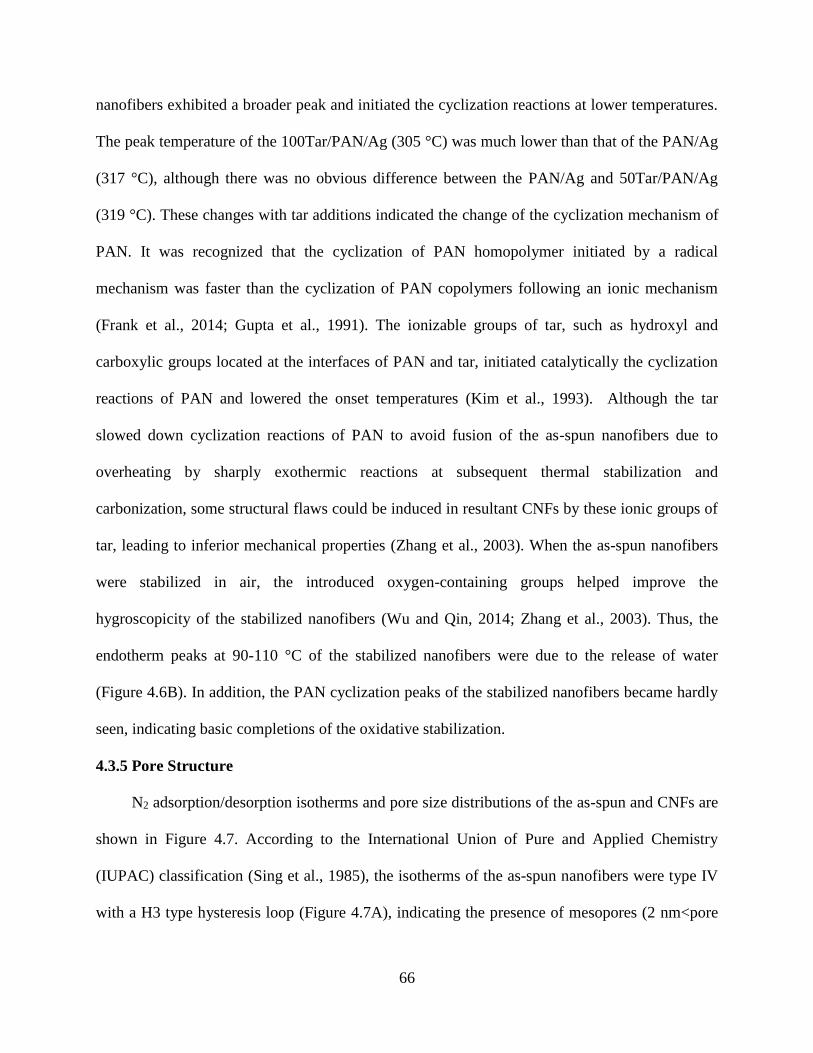
Figure 46 DSC curves of the as-spun (A) and stabilized (B) nanofibers with different tar
contents 65
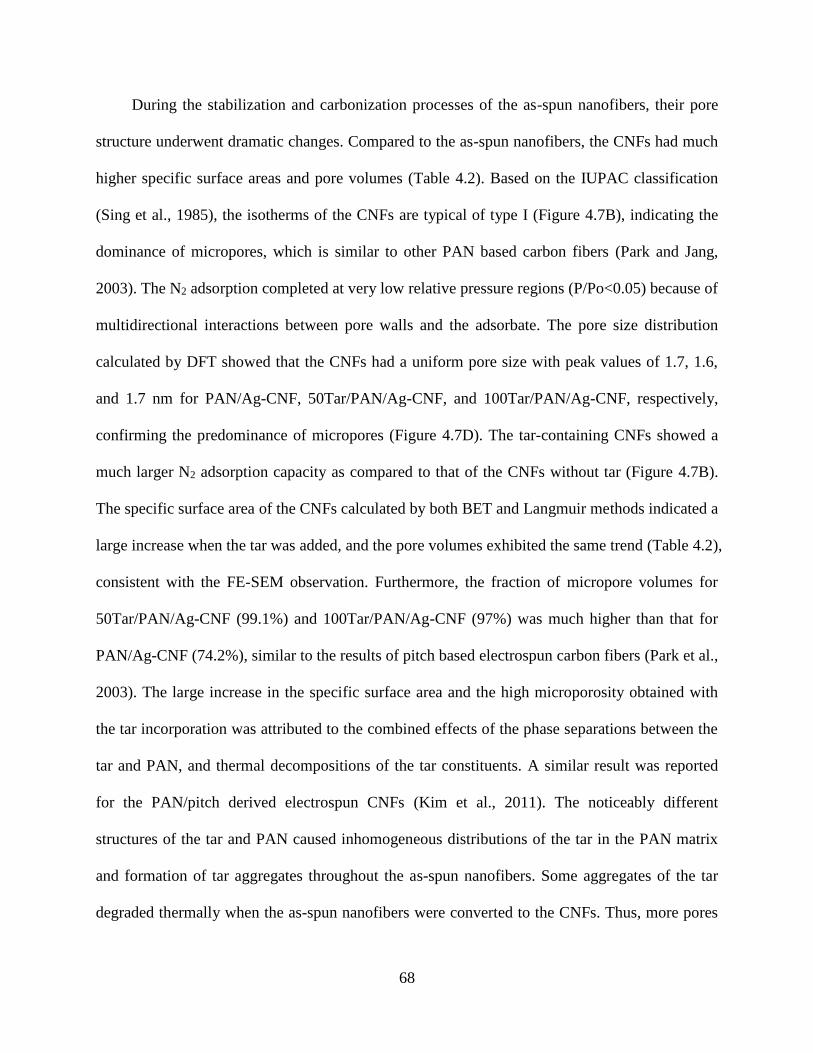
Figure 47 N2 adsorptiondesorption isotherms and pore size distribution of the as-spun
nanofibers (A and C) and CNFs (B and D) with different tar contents 67
Figure 48 A schematic illustrating the fabrication of the porous tar-derived CNFs through
electrospinning followed by stabilization and carbonization processes 69
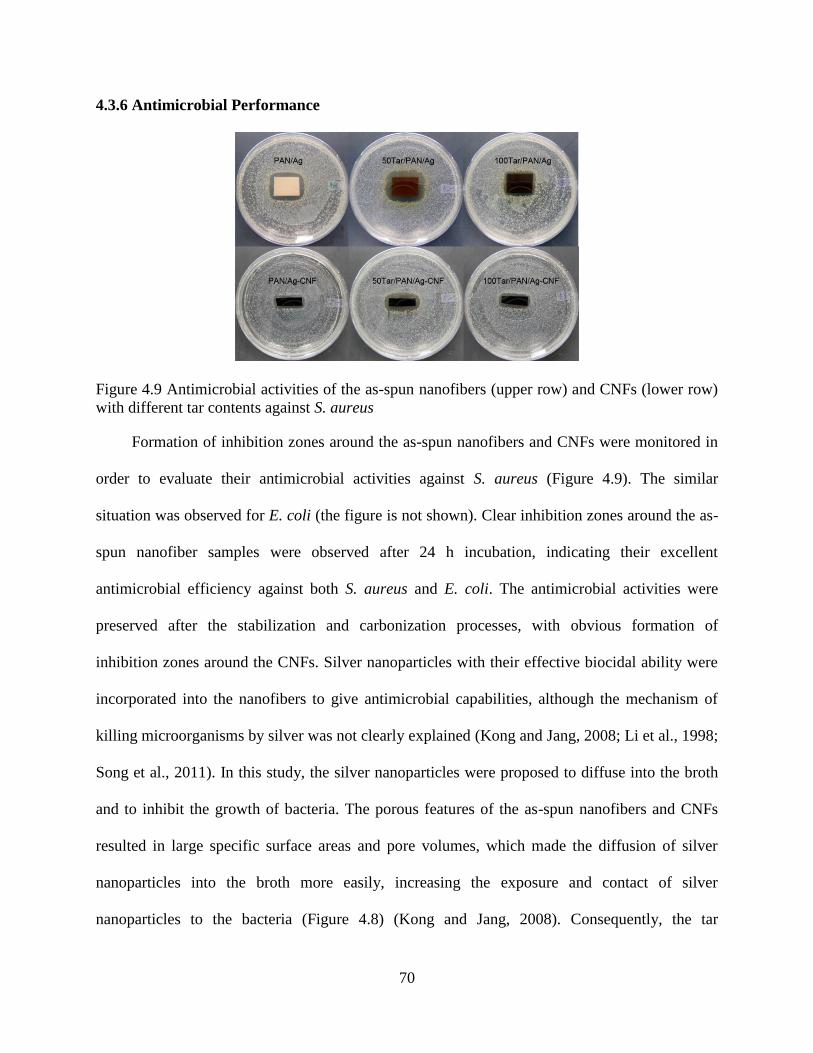
Figure 49 Antimicrobial activities of the as-spun nanofibers (upper row) and CNFs (lower row)
with different tar contents against S aureus 70
Figure 51 Apparent viscosity and shear stress versus shear rates of the drilling fluids 82
Figure 52 TEM images and diameter distributions of the CNCs (A) and CNFs (B) 85
Figure 53 Filtration volume versus square root of time for CNC-DF (A) and CNF-DF (B) 87
Figure 54 Standard fluid loss and filter cake characteristics of the drilling fluids 88
Figure 55 FE-SEM images of filter cakes formed by the drilling fluids of BT6 (A)
BT1CNC030 (B) BT1CNF030 (C) and CNF040 (D) 89
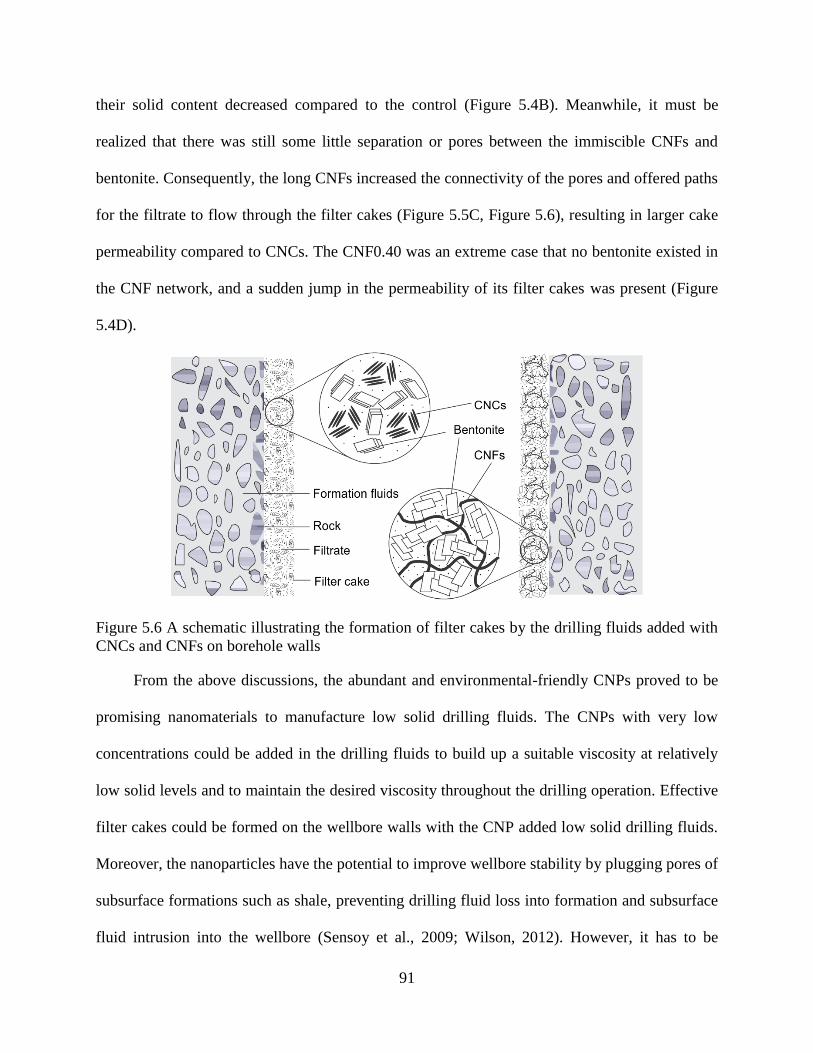
Figure 56 A schematic illustrating the formation of filter cakes by the drilling fluids added with
CNCs and CNFs on borehole walls 91
Figure 61 TEM photographs and diameter distributions (inserted plots) of the CNCs (A) and
CNFs (B) 102
Figure 62 Viscosity and shear stress as functions of shear rates for the drilling fluids with
different concentrations of nanocellulose 103
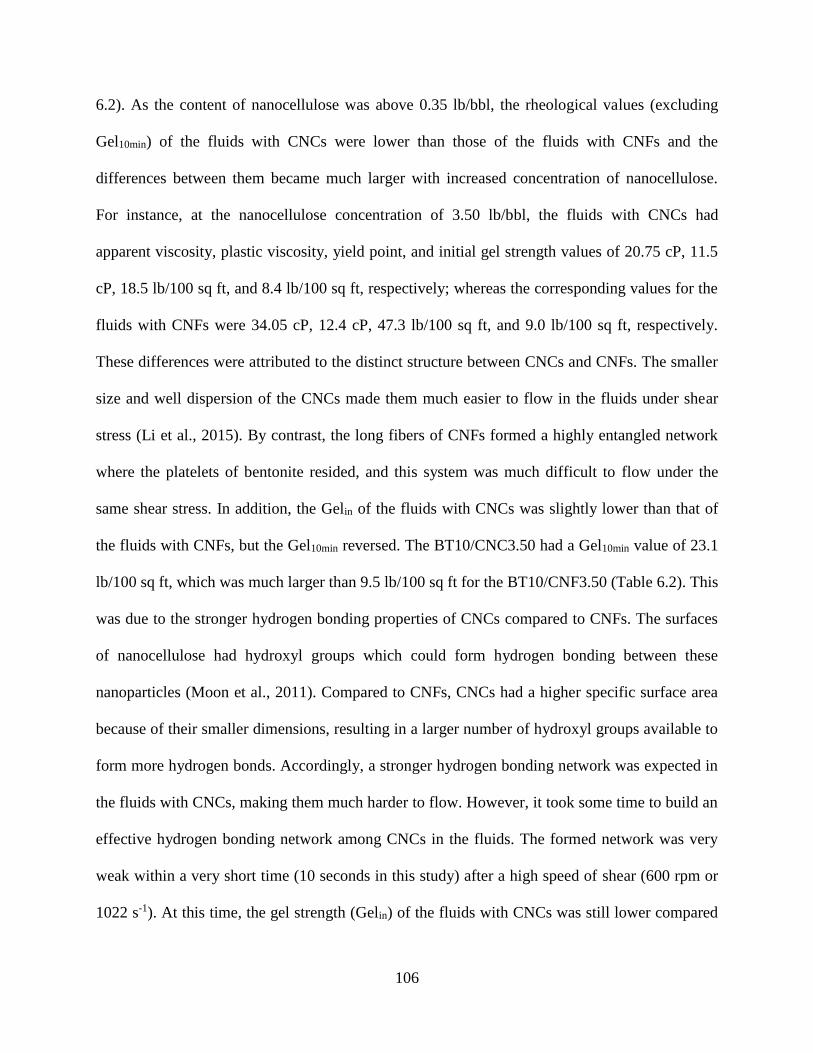
Figure 63 Schematic illustrating the formations of hydrogen bonding among CNCs and CNFs in
the fluids 107
ix
Figure 64 Filtration volume versus square root of time for the drilling fluids under LTLP
conditions 108
Figure 65 Surface and cross sectional FE-SEM images of the filter cakes for BT20 (A and D)
BT10CNC350 (B and E) and BT10CNF350 (C and F) under LTLP conditions (A B and
C Cross section morphology D E and F Surface morphology) 110
Figure 66 The API fluid loss and cake thickness of the drilling fluids under HTHP conditions 111
Figure 67 Surface and cross sectional FE-SEM images of the ceramic disks for BT20 (A and D)
BT10CNC350 (B and E) and BT10CNF350 (C and F) under HTHP conditions (A B
and C Cross section morphology D E and F Surface morphology) 112
x
ABSTRACT
Tar is inevitably produced from biomass thermochemical processes and is often disposed
as an industrial waste leading to environmental pollution As a result of its high carbon content
tar was expected to be a promising precursor for manufacturing carbon materials Consequently
low-cost porous carbon nanofibers (CNFs) using tar polyacrylonitrile (PAN) and silver
nanoparticles was fabricated through electrospinning and subsequent stabilization and
carbonization processes The continuous electrospun nanofibers were obtained with diameters
ranging from 392 to 903 nm The addition of biomass tar resulted in increased fiber diameters
reduced thermal stabilities and slowed cyclization reactions of PAN in the as-spun nanofibers
After stabilization and carbonization the produced CNFs showed more uniformly sized and
reduced average diameters The CNFs exhibited high specific surface areas (gt400 m2g) and
microporosity These porous features increased the exposures and contacts of silver nanoparticles
to the bacteria leading to excellent antimicrobial performances of as-spun nanofibers and CNFs
A new strategy is thus provided for utilizing tar as low-cost precursor to prepare functional CNFs
and reduce environmental damage by direct disposal of tar
Additionally nanocellulose was used as an environmental friendly and high performance
additive in drilling fluids for improving rheological and fluid filtration properties Two types of
nanocellulose including cellulose nanocrystals (CNCs) and cellulose nanofibers (CNFs) were
applied in the drilling fluids The effects of nanocellulose dimensions and concentrations on the
rheological and filtration properties of drilling fluids were investigated With half of the
bentonite (10 lbbbl) replaced by a small fraction of nanocellulose (035-350 lbbbl) the
resultant low-solid drilling fluids showed excellent shear thinning behavior and the fluidsrsquo
viscosity yield point and gel strength increased with the concentrations of nanocellulose On the
xi
other hand the addition of nanocellulose reduced the fluid loss of the fluids under high
temperature and high pressure (HTHP) conditions demonstrating potential for HTHP well
applications Additionally the CNCs and CNFs behaved differently in the rheological and fluid
filtration properties attributed to their distinct morphologies This study promoted the use of
novel renewable biopolymer additives in drilling fluids with enhanced performance and
advantages of low cost and ecologically friendly
1
CHAPTER 1 INTRODUCTION
11 BACKGROUND
Energy shortage environmental pollution and global warming have been becoming crucial
issues that drive us to utilize renewable natural resources with less environmental harm in a
sustainable way Biomass is one of the promising alternatives to petroleum-based energy and
materials with attractive characteristics including abundance renewability and carbon neutrality
However biomass has not been fully utilized and emerged issues accompanying its applications
have not been efficiently addressed On one hand biomass can be converted to products for
substituting petrochemical-derived energy and materials through pyrolysis or gasification
During these processes tar is inevitably produced and often disposed as an industrial waste
causing environmental pollution Meanwhile tar contains many valuable components that may
be utilized for manufacturing of chemicals and carbonaceous materials Accordingly an efficient
way to manufacture tar derived composite materials is required urgently On the other hand
biomass is composed of cellulose hemicellulose lignin small amounts of lipids proteins and
inorganic constituents as well as a fraction of water Nanocellulose isolated from biomass is
widely used for reinforcing polymeric composites as a result of its high strength and
nanodimensions In addition cellulose is a thermally stable biodegradable nontoxic and readily
available biopolymer that can be used as a lost circulation rheological and filtration control
material in oil and gas well applications
111 Biomass Tar in Carbon Materials
Through thermochemical transformation including gasification and pyrolysis biomass
generates gases liquids and solid fuels which can partially be the substitutes for fossil fuels
(Milne et al 1998) However tar is an inevitable by-product during these processes and the
2
most cumbersome and problematic parameter in any biomass gasification commercialization
activities A lot of effort has been taken on physical removal and chemical conversion of the tar
from biomass conversion (Milne et al 1998) However these processes need a lot of energy
input and may induce other problems such as the treatment of the more refractory secondary
products from physical removal and chemical conversion of tar Therefore further fundamental
knowledge about the chemical composition and properties of tar is needed to better control its
conversion and separation during biomass conversion Meanwhile it is crucial to find good ways
of utilizing biomass tar and turn the unavoidable ldquowasterdquo into wealth which can serve as the
alternative method to control the accumulation of tar and reduces dramatically its harm to
environment
Chemical composition of biomass tar is highly complex and dependent on the feedstock of
biomass and thermochemical conversion conditions such as oxygen level steam-to-biomass ratio
pressure time and temperature (Aigner et al 2009 Ku and Mun 2006 Yanik et al 2007)
Biomass tar is defined as a complex mixture of condensable hydrocarbons including single ring
to five-ring aromatic compounds along with other oxygen-containing hydrocarbons and complex
polycyclic aromatic hydrocarbon (PAH) (Li and Suzuki 2009b) However no further details
about the composition and structure of tar components were investigated As a result it is
desirable to obtain a comprehensive knowledge of the chemical composition of biomass tar at a
higher level of detail Besides the chemical composition of tar its thermal decomposition
properties also play a crucial role in its successful control conversion and further application
Biomass tar decomposition mainly occurs due to cracking steam reforming dry reforming and
carbon formation reactions (Li and Suzuki 2009a) It is difficult to study the thermal degradation
of tar because of its complex composition Most of previous researches simplify the tar
3
decomposition analysis by selecting a model compound of tar such as naphthalene (Anis et al
2013 Devi et al 2005) toluene (Kong et al 2011 Swierczynski et al 2008) benzene (Simell
et al 1999) and 1-methylnaphthalene (Dou et al 2003) However only one model component
canrsquot reflect the decomposition reaction mechanism of real tar and the interactions of its
components Therefore the thermal decomposition of biomass tar has not been fully
characterized and understood until now and further systemic study on tar is required to reveal its
complex thermal degradation mechanism
Although tar is an undesirable product for biomass gasification and pyrolysis it can be a
valuable carbon precursor of carbonaceous materials including carbon fibers porous carbon and
carbon foam considering its high carbon content (Song et al 2015) Different carbon materials
have been fabricated and characterized using coal or petroleum derived pitch which has a similar
composition to tar Using isotropic pitch activated carbon fibers have been prepared which
exhibit a high surface area (gt2000 m2g) high electrical conductivity (gt50 scm) high carbon
yield (60 ) at 1000 degC and high adsorption ability (Bui et al 2009 Park et al 2003) A
modification of pitch-based carbon fibers using low-cost carbon black was reported to improve
the electrical and thermal conductivity making them more favorable for industrial application
(Alway-Cooper et al 2013) In addition porous carbon has been prepared using pitch as a
carbon precursor Using soft-templating-based methodology meso- and macroporous carbon
have been synthesized taking advantage of the phase separation (spinodal decomposition) of
mesophase pitch which acts as the carbon precursor and an organic polymer (polystyrene)
which acts as the template (Adelhelm et al 2007) The main idea behind this approach is to
induce continuously increasing incompatibility between mesophase pitch and the polymer during
the evaporation of the solvent and the subsequent carbonization step Besides carbon fibers and
4
porous carbon pitch can be used to produce carbon foam materials (Chen et al 2006) This
material is a sponge-like carbon material with the features of low density (02-08 gcm3) good
thermal stability high mechanical strength (up to 20 MPa compression) large external surface
area with open cell structure and adjustable thermal and electrical conductivity which has
potential applications in high temperature thermal insulation materials high thermally
conductive heat sinks electrodes for energy storage catalyst supports and filters (Chen et al
2006 Wu et al 2011) However carbon materials produced by tar from biomass conversions
have not been reported Consequently it is expected to manufacture biomass tar-based carbon
materials using this abundant and low-cost carbon precursor
112 Cellulose Nanoparticles in Drilling Fluids
Drilling fluids commonly referred to as drilling muds are an integral part of drilling oil
and natural gas wells A drilling fluid is typically pumped through the drill string and is
subsequently introduced to the bottom of the bore hole as it squirts out of nozzles on the drill bit
The drilling fluids have various functions including controlling formation pressures minimizing
formation damage maintaining wellbore stability suspending and carrying out cuttings and
cooling and lubricating drilling bit (Bourgoyne et al 1991) The successful drilling operations
are highly dependent on the selection of drilling fluids with desirable performance
Facing increasing drilling challenges in complex deeper wells deviated wells and
horizontal wells the oil and gas industry is always looking for physically small chemically and
thermally stable biologically degradable environmentally benign materials for designing smart
drilling fluids with desirable performance (Abdo and Haneef 2013) Recently the nano-based
drilling fluids loaded with nanoparticles are attracting more attention due to their unique
characteristics such as a high surface area to volume ratio Such nanoparticles play an essential
5
role in decreasing the permeability of shale formation maintaining borehole stability
intensifying mud cake quality reducing fluid loss improving cutting removal ability lowering
the friction eliminating differential pipe sticking protecting reservoir and enhancing oil and gas
recovery (Abdo and Haneef 2013 Farbod et al 2015 Sun et al 2015) Due to these advantages
addition of nanoparticles into drilling fluids can improve drilling efficiency save drilling cost
and protect the environment
A variety of nanoparticles have been studied for preparing nano-based drilling fluids
including nano-silica (Sensoy et al 2009 Sharma et al 2012) nano metallic oxide (Cheraghian
et al 2013 Sayyadnejad et al 2008) carbon black nano-graphite (Nasser et al 2013)
polymer-based nanoparticles (Jiang et al 2009 Qu et al 2007) and combinations of these
However the use of these nanoparticles is limited by their cost and environmental impact
Furthermore with an increasing pressure from energy shortages and ecological deterioration
renewable natural resources such as cellulose starch and protein are intensively studied to
substitute for non-renewable petroleum-based products
Cellulose is the most abundant natural resource in nature which widely exists in various
natural fibers such as wood cotton hemp and linen Cellulose derivatives such as polyanionic
cellulose (PAC) and carboxymethyl cellulose (CMC) have been the popular additives to optimize
the rheological properties of drilling fluids (Li et al 2016 Menezes et al 2010) However they
have been added as particles with a large size ranging from several micrometers to millimeters
Much smaller particles named as nanocellulose can currently obtained through several physical
and chemical methods such as acid hydrolysis enzyme hydrolysis 2266-Tetramethyl-1-
piperidinyloxy (TEMPO) mediated oxidation methods and a high pressure homogenization
(Moon et al 2011) Nanocellulose has high surface to volume ratio much lower density of 16
6
gcm3 than silica (22 gcm3) and high values of tensile strength (75-77 GPa) and axial elastic
modulus (110-220 GPa) (Moon et al 2011) Because of these excellent characteristics
nanocellulose can be used for preparing technically reliable economically attractive
environmentally friendly drilling fluids to meet the technical needs and challenges of the oil and
gas industry
12 OBJECTIVES
The objectives of the research described in this work are
1) To investigate the chemical composition and thermal degradation of biomass tar
obtained from corn stover gasification aiming at facilitating the further processing and
utilization of biomass tar
2) To fabricate functional nanofibers prepared by electrospinning biomass tarPAN
suspensions The electrospinnability of the tarPAN suspensions as well as the structure and
properties of the resultant nanofibers with varying tar contents were investigated
3) To manufacture low-cost porous carbon nanofibers (CNFs) using biomass tar
polyacrylonitrile (PAN) and silver nanoparticles through electrospinning and subsequent
stabilization and carbonization processes The effects of tar loading levels on electrospinning
ability of the suspensions morphologies chemical structures thermal properties pore features
and antimicrobial performance of resultant CNFs were investigated
4) To develop drilling fluids with low solid content by substituting nanocellulose including
cellulose nanofibers (CNFs) and cellulose nanocrystals (CNCs) for a part of bentonite in the
fluid system The effects of cellulose nanoparticle content on the rheology and fluid filtration
properties of the resultant drilling fluids were studied
7
13 ORGANIZATION OF DISSERTATION
Chapter 1 provides an overall introduction of the research and the structure of this
dissertation
Chapter 2 introduces the chemical composition and thermal properties of tar from biomass
gasification
Chapter 3 describes the fabrication and characterization of electrospun nanofibers from
PAN and biomass tar
Chapter 4 presents the fabrication and characterization of porous carbon nanofibers from
PANbiomass tarsilver by electrospinning thermal oxidation and carbonization processes
Chapter 5 describes the preparation of low solid drilling fluids added with nanocellulose
and investigates the effects of nanocellulose content on the rheology and fluid loss properties of
the drilling fluids
Chapter 6 presents the formulation of drilling fluids having compositions very similar to
the field fluids under use including bentonite nanocellulose and other additives The
rheological and filtration properties of the formulated fluids were tested and special emphasis
was put on the performance of the fluids under high temperature and high pressure conditions
14 REFERENCES
Abdo J Haneef MD 2013 Clay nanoparticles modified drilling fluids for drilling of deep
hydrocarbon wells Appl Clay Sci 86 76-82
Adelhelm P Hu YS Chuenchom L Antonietti M Smarsly BM Maier J 2007
Generation of hierarchical meso- and macroporous carbon from mesophase pitch by
spinodal decomposition using polymer templates Adv Mater 19 4012-4017
Aigner I Wolfesberger U Hofbauer H 2009 Tar content and composition in producer gas of
fluidized bed gasification and low temperature pyrolysis of straw and wood - influence of
temperature International Conference on Polygeneration Strategies Vienna
Alway-Cooper RM Anderson DP Ogale AA 2013 Carbon black modification of
mesophase pitch-based carbon fibers Carbon 59 40-48
8
Anis S Zainal ZA Bakar MZA 2013 Thermocatalytic treatment of biomass tar model
compounds via radio frequency Bioresour Technol 136 117-125
Bourgoyne AT Millheim KK Chenevert ME Young FS (Eds) 1991 Applied Drilling
Engineering first ed Society of Petroleum Engineers Richardson
Bui NN Kim BH Yang KS Dela Cruz ME Ferraris JP 2009 Activated carbon fibers
from electrospinning of polyacrylonitrilepitch blends Carbon 47 2538-2539
Chen C Kennel EB Stiller AH Stansberry PG Zondlo JW 2006 Carbon foam derived
from various precursors Carbon 44 1535-1543
Cheraghian G Hemmati M Masihi M Bazgir S 2013 An experimental investigation of the
enhanced oil recovery and improved performance of drilling fluids using titanium dioxide
and fumed silica nanoparticles J Nanostruct Chem 3 78
Devi L Ptasinski KJ Janssen FJJG 2005 Pretreated olivine as tar removal catalyst for
biomass gasifiers investigation using naphthalene as model biomass tar Fuel Process
Technol 86 707-730
Dou B Gao J Sha X Baek SW 2003 Catalytic cracking of tar component from high-
temperature fuel gas Appl Therm Eng 23 2229-2239
Farbod M Kouhpeymani asl R Noghreh abadi AR 2015 Morphology dependence of
thermal and rheological properties of oil-based nanofluids of CuO nanostructures
Colloids Surf A 474 71-75
Kong M Fei J Wang S Lu W Zheng X 2011 Influence of supports on catalytic behavior
of nickel catalysts in carbon dioxide reforming of toluene as a model compound of tar
from biomass gasification Bioresour Technol 102 2004-2008
Ku CS Mun SP 2006 Characterization of pyrolysis tar derived from lignocellulosic biomass
J Ind Eng Chem 12 853-861
Li C Suzuki K 2009a Kinetic analyses of biomass tar pyrolysis using the distributed
activation energy model by TGDTA technique J Therm Anal Calorim 98 261-266
Li C Suzuki K 2009b Tar property analysis reforming mechanism and model for biomass
gasification-An overview Renew Sus Energ Rev 13 594-604
Li M Wu Q Song K De Hoop CF Lee S-Y Qing Y Wu Y 2016 Cellulose
nanocrystals and polyanionic cellulose as additives in bentonite water-based drilling
fluids rheological modelling and filtration mechanisms Ind Eng Chem Res 55 133-
143
Menezes R Marques L Campos L Ferreira H Santana L Neves G 2010 Use of
statistical design to study the influence of CMC on the rheological properties of bentonite
dispersions for water-based drilling fluids Appl Clay Sci 49 13-20
9
Milne TA Evans RJ Abatzoglou N 1998 Biomass gasifier tars their nature formation
and conversion Naional Renewable Energy Laboratory Colorado p 68
Moon RJ Martini A Nairn J Simonsen J Youngblood J 2011 Cellulose nanomaterials
review structure properties and nanocomposites Chem Soc Rev 40 3941-3994
Nasser J Jesil A Mohiuddin T Al Ruqeshi M Devi G Mohataram S 2013
Experimental investigation of drilling fluid performance as nanoparticles World J Nano
Sci Eng 3 57-61
Park SH Kim C Choi YO Yang KS 2003 Preparations of pitch-based CFACF webs by
electrospinning Carbon 41 2655-2657
Sayyadnejad M Ghaffarian H Saeidi M 2008 Removal of hydrogen sulfide by zinc oxide
nanoparticles in drilling fluid Int J Environ Sci Tech 5 565-569
Sensoy T Chenevert ME Sharma MM 2009 Minimizing water invasion in shales using
nanoparticles SPE Annual Technical Conference and Exhibition New Orleans
Sharma MM Chenevert ME Guo Q Ji L Friedheim J Zhang R 2012 A new family of
nanoparticle based drilling fluids SPE Annual Technical Conference and Exhibition San
Antonio
Simell PA Hirvensalo EK Smolander VT 1999 Steam reforming of gasification gas tar
over dolomite with benzene as a model compound Ind Eng Chem Res 38 1250-1257
Song K Zhang H Wu Q Zhang Z Zhou C Zhang Q Lei T 2015 Structure and
thermal properties of tar from gasification of agricultural crop residue J Therm Anal
Calorim 119 27-35
Sun F Lin M Dong Z Zhang J Wang C Wang S Song F 2015 Nanosilica-induced
high mechanical strength of nanocomposite hydrogel for killing fluids J Colloid
Interface Sci 458 45-52
Swierczynski D Courson C Kiennemann A 2008 Study of steam reforming of toluene used
as model compound of tar produced by biomass gasification Chem Eng Process 47
508-513
Wu X Liu Y Fang M Mei L Luo B 2011 Preparation and characterization of carbon
foams derived from aluminosilicate and phenolic resin Carbon 49 1782-1786
Yanik J Kommayer C Saglam M Yueksel M 2007 Fast pyrolysis of agricultural wastes
Characterization of pyrolysis products Fuel Process Technol 88 942-947
10
CHAPTER 2 STRUCTURE AND THERMAL PROPERTIES OF TAR FROM
GASIFICATION OF AGRICULTURAL CROP RESIDUE1
21 INTRODUCTION
Energy shortage environmental pollution and global warming have been becoming crucial
issues in the past few decades Biomass from industrial crops such as straw and corn stover is
one of the promising alternatives to petroleum-based resources for meeting societyrsquos increasing
demand for material and energy (Ghani et al 2013) Through thermochemical transformation
including pyrolysis and gasification biomass generates gases liquids and solid fuels Tar is an
inevitable by-product in the thermal conversion processes of biomass The disposal of tar is very
cumbersome and costly The usual methods such as landfilling can lead to environment
contamination due to tarrsquos high resistance to degradation (Li and Suzuki 2010) On the other
hand tar is a valuable resource for chemicals and carbonaceous materials For example tar has
been used for the substitution of phenol in phenol-formaldehyde (PF) resins (Lu and Wu 2013)
wood preservatives (Suzuki et al 1997) and utilized for the preparation of activated carbon
fibers (Bui et al 2009) Understanding of the chemical structure and thermal properties of tar is
essential for enhancing the performance of the resultant materials
Tar represents a complex mixture of condensable hydrocarbons including single ring to
five-ring aromatic compounds along with other oxygen-containing hydrocarbons and complex
polycyclic aromatic hydrocarbons (PAHs) (Li and Suzuki 2009b) Its chemical composition
depends on the sources of biomass and thermochemical conversion conditions (Aigner et al
2009 Ku and Mun 2006 Yanik et al 2007) The structure of pitch from coal or petroleum has
This chapter previously appeared as Song K Zhang H Wu Q Zhang Z Zhou C
Zhang Q Lei T Structure and Thermal Properties of Tar from Gasification of Agricultural
Crop Residue J Therm Anal Calorim 2015 119 27-35 It is reprinted by permission of
Springer
11
been well investigated (Alcantildeiz-Monge et al 2001 Jiang et al 2007 Sun et al 2011)
However little attention has been paid to the chemical composition of tar from biomass
gasification or pyrolysis Therefore it is necessary to quantitatively characterize the constituents
of tar to facilitate its further processing and utilization
Aside from the chemical composition of tar its thermal degradation behavior also plays an
essential role in understanding the thermal stability properties of tar derived chemicals and
materials Decomposition of tar mainly occurs through cracking steam reforming dry reforming
and carbon formation reactions (Li and Suzuki 2009b) Previous research has focused on
combustion properties of tar from different biomass sources in the presence of oxygen or
catalysts (Li and Suzuki 2009b Li et al 2009) However few studies have considered the
thermal behavior of tar under controlled inert atmosphere In addition tar decomposition analysis
has been frequently simplified by selecting a model compound of tar such as naphthalene (Devi
et al 2005) toluene (Swierczynski et al 2008) benzene (Simell et al 1999) and 1-
methylnaphthalene (Dou et al 2003) However a single model component cannot reflect the
complex decomposition reaction mechanism of real tar and the interactions of its components
Thus thermal analysis performed on the entire tar material is required
The objective of this study was to investigate the chemical composition and thermal
degradation of biomass tar obtained from corn stover gasification aiming at facilitating the
further processing and utilization of this promising biomaterial The tar composition was
characterized by gas chromatography-mass spectroscopy (GC-MS) Fourier transform infrared
(FTIR) spectroscopy and elemental analysis Thermogravimetry with multiple-heating rates
under non-isothermal conditions was used to provide data for thermal kinetic analysis of this
material
12
22 MATERIALS AND METHODS
221 Materials
Tar was produced by gasification of corn stover feedstock at 500-600 degC in Xigou Biomass
Fuel Gas Plant (Xihe Shanxi China) The plant used fixed bed downdraft gasifiers producing
about 200 m3 of fuel gas per hour mainly for cooking uses The gasification efficiency was about
75 and total energy output was about 11times10-9 Jh The plant consumed about 180 tons of
agricultural residues per year The collected tar material was vacuum dried to remove the water
at 80 degC and then placed in a sealed container for further analysis
222 Characterization
2221 GC-MS Analysis
The dried tar (5 g) was added into ethyl acetate (50 mL) with a ratio (tarsolvent = 1 g10
mL) The obtained mixture was kept under vigorous magnetic stirring at room temperature for 24
h The resulting suspension was centrifuged for 30 min and the upper liquid fraction was
collected and diluted to a mass concentration of 05 for GC-MS analysis (Figure 21) The
solid fraction was dried in vacuum at 80 degC and weighed (141 g) prior to elemental analysis
The liquid fraction had a mass of 360 g tar in ethyl acetate taking up 7180 wt of the original
dried tar A HP-3800 gas chromatograph (GC) equipped with splitsplitless injector and a HP-
8410 automatic sampler with splitless injection were used to analyze the composition of tar The
injector was maintained at 250 degC with helium as the carrier gas at a flow rate of approximately
10 mLmin The GC was equipped with a 30 m (length) times 025 mm (inner diameter) Hewlett
Packard HP-5MS capillary column The oven temperature was kept at 40 degC for 3 min and then
heated to 200 degC at 15 degCmin followed with further heating to 280 degC at 1 degCmin This
temperature was held for 5 min The end of the column was directly introduced into the ion
13
source of a HP 5970 mass selective detector (MSD) with electron ionization (EI) mode During
the test the transfer line was set at 270 degC ion source was kept at 250 degC and electron energy
remained at 70 eV The data acquisition was done with HP-UX chemstation software associated
with a HP-UNIX computer and NBS mass spectra library database The quantitative evaluation
was based on the relative percent areas of the single peaks related to the total peak area
Figure 21 Scheme illustrating the drying and centrifuging processes of biomass tar for GC-MS
analysis
2222 FTIR Spectroscopy
A Bruker FTIR analyzer (Tensor-27 Bruker Optics Inc Billerica MA) equipped with an
attenuated total reflectance (ATR) cell of ZnSe single crystal was used for the study The FTIR
spectra of the dried tar and the residue after its decomposition at 600 degC by a heating rate of
10 degCmin in N2 atmosphere were recorded Each spectrum was recorded by accumulation of 32
scans in N2 atmosphere with a spectral resolution of 4 cm-1 between 4000 and 700 cm-1 The
baseline was corrected at 3750 1800 and 700 cm-1 by the attached software (OPUS 72 Bruker)
2223 Elemental Analysis
The elemental composition of tar was analyzed using a Perkin-Elmer automatic CHN
analyzer (Atlantic Microlab Inc Norcross GA USA) The content of C H and N was obtained
14
directly while the oxygen content was determined by the difference in mass between the initial
tar and the total mass of C H and O In this study the dried whole tar and thermally treated tar
with different temperatures (180 250 350 and 600 degC for 1 h) and N2 atmosphere were
analyzed and compared
2224 Thermogravimetry (TG) Analysis
A TA Q50 analyzer (TA Instruments Inc New Castle DE United States) with a resolution
of 01 μg was used to study the thermal decomposition of the tar Non-isothermal conditions
from 30 to 800 degC were applied at various heating rates of 5 10 15 20 25 and 30 degCmin in the
N2 atmosphere (60 mLmin) The material was ground into powder and dried in vacuum at 80 degC
for 48 h prior to analysis A sample of 5-10 mg was used for each measurement At least three
replicated samples were run at each heating rate to guarantee the repeatability and reliability of
data The mass loss curves (TG) and differential TG curves (DTG) were recorded as a function
of temperature
2225 Thermal Kinetic Analysis
The thermal analysis kinetics of solid state reaction is commonly based on a single-step
kinetic equation (Brown et al 1980)
d120572d119905 = 119870(119879)119891(120572) (21)
where K is the temperature-dependent reaction rate constant T is the temperature f(α) is a
reaction function depending on actual reaction mechanism and dαdt is the rate of biomass
conversion The extent of conversion α is defined as
120572 = (1198820 minus119882t)(1198820 minus119882f) (22)
15
where W0 Wt and Wf are the mass of the sample during the decomposition process at the initial
given time and final moment respectively The reaction rate constant (K) is commonly
described by the Arrhenius equation
119870(119879) = 119860exp(minus119864119877119879) (23)
where A is the pre-exponential factor (s-1) R is the universal gas constant (8314 J(Kmiddotmol)) E is
the apparent activation energy (kJmol) and T is the absolute temperature (K) Combination of
Eq 21 and Eq 23 gives the following kinetic function
d120572d119905 = 119860exp(minus119864119877119879)119891(120572) (24)
Thermal analysis kinetic study is usually carried out in an isothermal or a non-isothermal
experiment The former process is completed in narrower temperature ranges and truly
isothermal conditions cannot be gained for the very low and high reaction extent (α) resulting
partially from self-heating or self-cooling (Maciejewski 2000) The non-isothermal method is
suitable for a broader temperature range to detect the complex nature of multi-step solid state
reaction processes (Maciejewski 2000) For dynamic non-isothermal analysis the heating rate is
defined as = dTdt Thus the basic expression to obtain the kinetic triplet [E A and f(α)] based
on experimental data can be described as
d120572d119879 = (119860120573)exp(minus119864119877119879)119891(120572) (25)
The analytical methods used to obtain the kinetic parameters under non-isothermal
conditions generally include model-fitting and model-free methods The former approach is
considered as insufficient in non-isothermal kinetic studies considering the limited applicability
of single heating rate data (Burnham 2000 Khawam and Flanagan 2005) On the other hand
the model-free methods based on multi-heating rates and iso-conversional data are more helpful
in the kinetic analysis (Vyazovkin et al 2011) The method has been effective to obtain the
16
thermal kinetic parameters of biomass (Li and Suzuki 2009a Loacutepez et al 2013) The Friedman
method and the distributed activation energy model (DAEM) are two common model-free
methods
The Friedman method is a differential iso-conversional method assuming a single nth-order
reaction occurs which is based on the below function by taking the natural logarithm of Eq 25
ln(120573d120572d119879) = ln119860 + ln[119891(120572)] minus 119864119877119879 (26)
For a particular reaction order model replacing f(α) by (1-α)n gives the following function
ln(120573d120572d119879) = ln119860 + 119899ln(1 minus 120572) minus 119864119877119879 (27)
By plotting ln(βdαdT) against 1T the apparent activation energy (E) and the pre-exponential
factor (A) at a given conversion rate (α) can be obtained from the slope and intercept of the linear
portion of the plot
The DAEM method was originally proposed by Vand (Vand 1943) and further developed
(Miura and Maki 1998) to describe complex reactions by assuming that a set of parallel
irreversible 1st order reactions occur simultaneously (Miura 1995 Miura and Maki 1998) The
model has the following form
1 minus 120572 = int exp (minus119896 int eminus119864 119877119879frasl d119905119905
0) 119891(119864)
infin
0d119864 (28)
where f(E) is the distribution of activation energies representing different reactions and k is the
frequency factor corresponding to the E value Through theoretical derivation and approximation
[26] a simplified equation is obtained as
ln(1205731198792) = ln(119896119877119864) + 06075 minus 119864119877119879 (29)
At a selected extent of conversion E and A can be determined by plotting ln(βT2) against
1T Thus the relationship between activation energy and extent of conversion can be also
17
obtained At least three sets of data are needed in the DAEM method Six heating rates (5 10 15
20 25 and 30 degCmin) were selected in this study
23 RESULTS AND DISCUSSION
231 Chemical Composition
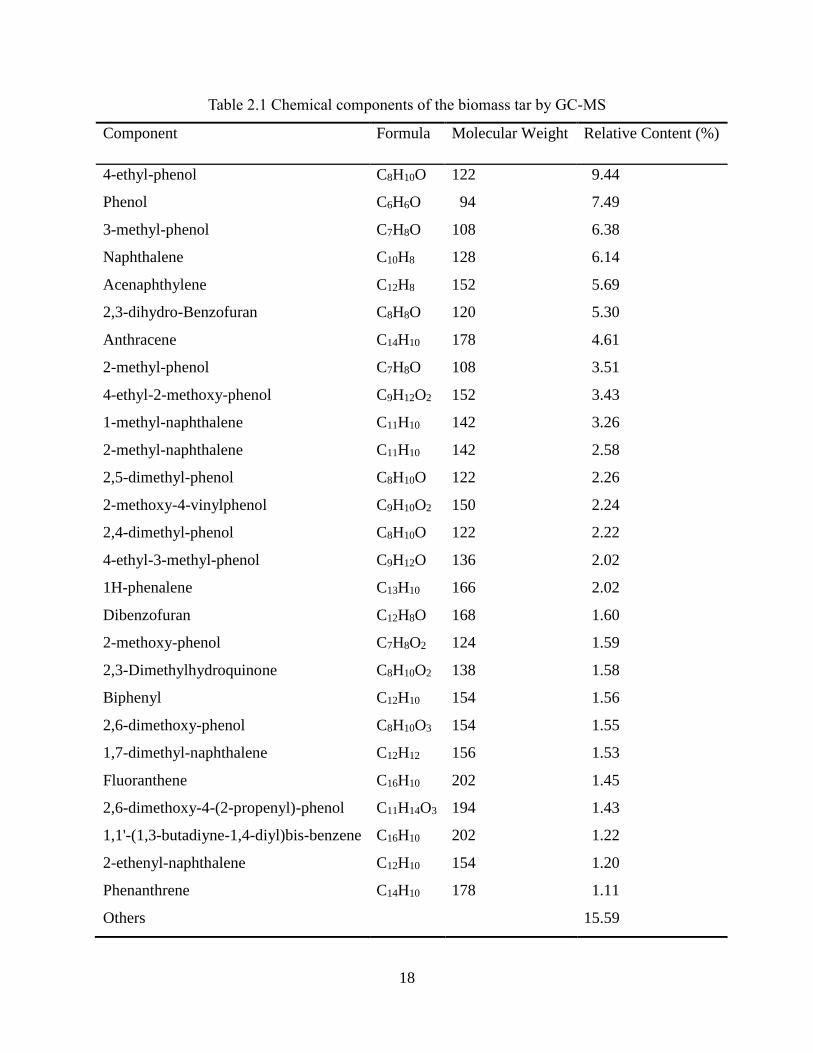
The chemical composition of the tar from the GC-MS analysis is presented in Table 21
The tar was composed mainly of phenols and PAHs representing approximately 80 of the
dissolved tar in ethyl acetate in the molecular mass range from 94 to 202 (Table 21) Phenols
accounted for 45 of the tar including phenol ethylphenol methylphenol dimethylphenol and
methoxyphenol The PAHs mainly consisted of naphthalene methylnaphthalene acenaphthylene
anthracene biphenyl fluoranthene and phenanthrene which accounted for 31 of the soluble
tar in ethyl acetate Besides the tar contained 7 of furans and 17 of other materials such as
aliphatics esters acids etc Thus the main components of the tar were phenols and PAHs
similar to the results found in the investigation on tars from wood and bamboo (Ku and Mun
2006 Mun and Ku 2010) It was found that at higher temperatures more phenolics and
hydrocarbons were formed in biomass tars (Elliott 1988) The tar in this study was produced
from biomass gasification at around 500-600 degC and had 45 phenols and 31 PAHs which
was in an agreement with the results from previous studies
The typical IR detectable functional groups in the tar (Figure 22) are listed in Table 22
These data were similar to those of other tars reported in the literature (Pakdel and Roy 1991
Prauchner et al 2001) The IR spectra showed that the tar contained methylene groups (2923
2854 cm-1) rather than methyl groups The aromatic structure was indicated by the IR bands at
3060 1597 1512 830 and 750 cm-1 The absorption at 1265 and 1036 cm-1 were asymmetrical
and symmetrical stretching of aryl-alkyl ethers associated with aromatic rings In addition the IR
18
Table 21 Chemical components of the biomass tar by GC-MS
Component Formula Molecular Weight Relative Content ()
4-ethyl-phenol C8H10O 122 944
Phenol C6H6O 94 749
3-methyl-phenol C7H8O 108 638
Naphthalene C10H8 128 614
Acenaphthylene C12H8 152 569
23-dihydro-Benzofuran C8H8O 120 530
Anthracene C14H10 178 461
2-methyl-phenol C7H8O 108 351
4-ethyl-2-methoxy-phenol C9H12O2 152 343
1-methyl-naphthalene C11H10 142 326
2-methyl-naphthalene C11H10 142 258
25-dimethyl-phenol C8H10O 122 226
2-methoxy-4-vinylphenol C9H10O2 150 224
24-dimethyl-phenol C8H10O 122 222
4-ethyl-3-methyl-phenol C9H12O 136 202
1H-phenalene C13H10 166 202
Dibenzofuran C12H8O 168 160
2-methoxy-phenol C7H8O2 124 159
23-Dimethylhydroquinone C8H10O2 138 158
Biphenyl C12H10 154 156
26-dimethoxy-phenol C8H10O3 154 155
17-dimethyl-naphthalene C12H12 156 153
Fluoranthene C16H10 202 145
26-dimethoxy-4-(2-propenyl)-phenol C11H14O3 194 143
11-(13-butadiyne-14-diyl)bis-benzene C16H10 202 122
2-ethenyl-naphthalene C12H10 154 120
Phenanthrene C14H10 178 111
Others 1559
19
stretching of carbonyl groups at 1686 cm-1 was lower than the typical stretching of carbonyl at
1715 cm-1 in ketone which was probably caused by the conjugation of carbonyl groups with
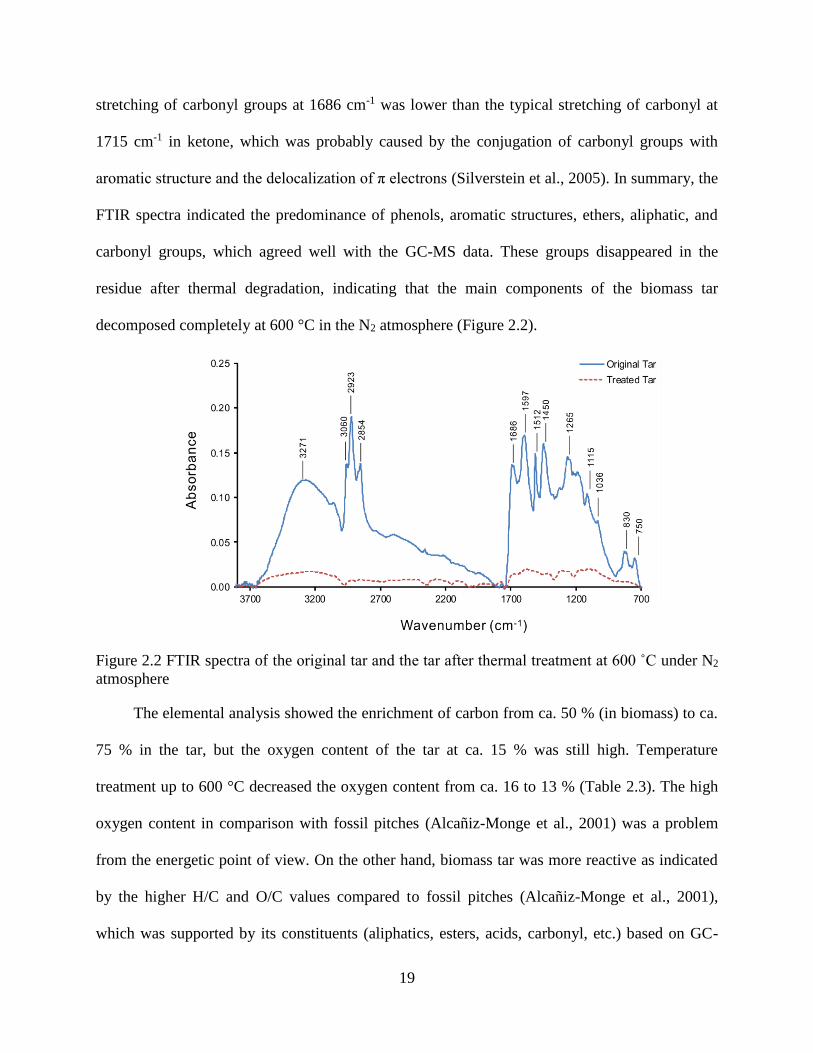
aromatic structure and the delocalization of π electrons (Silverstein et al 2005) In summary the
FTIR spectra indicated the predominance of phenols aromatic structures ethers aliphatic and
carbonyl groups which agreed well with the GC-MS data These groups disappeared in the
residue after thermal degradation indicating that the main components of the biomass tar
decomposed completely at 600 degC in the N2 atmosphere (Figure 22)
Figure 22 FTIR spectra of the original tar and the tar after thermal treatment at 600 ˚C under N2
atmosphere
The elemental analysis showed the enrichment of carbon from ca 50 (in biomass) to ca
75 in the tar but the oxygen content of the tar at ca 15 was still high Temperature
treatment up to 600 degC decreased the oxygen content from ca 16 to 13 (Table 23) The high
oxygen content in comparison with fossil pitches (Alcantildeiz-Monge et al 2001) was a problem
from the energetic point of view On the other hand biomass tar was more reactive as indicated
by the higher HC and OC values compared to fossil pitches (Alcantildeiz-Monge et al 2001)
which was supported by its constituents (aliphatics esters acids carbonyl etc) based on GC-
20
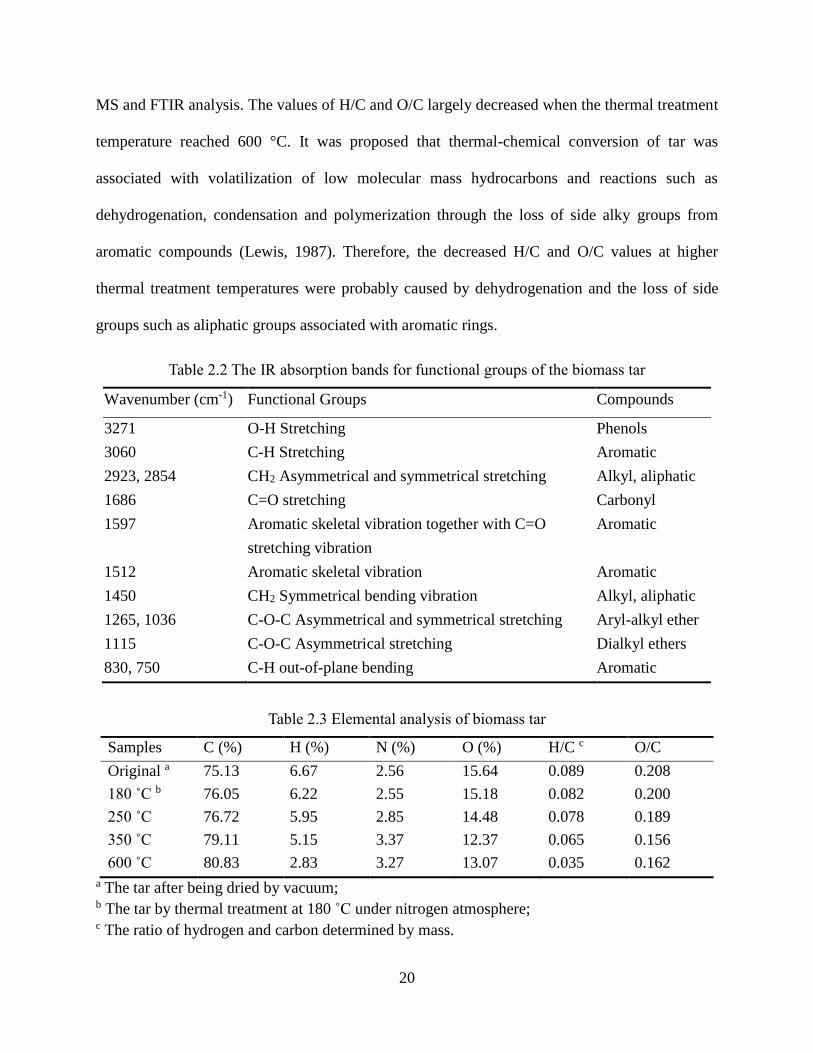
MS and FTIR analysis The values of HC and OC largely decreased when the thermal treatment
temperature reached 600 degC It was proposed that thermal-chemical conversion of tar was
associated with volatilization of low molecular mass hydrocarbons and reactions such as
dehydrogenation condensation and polymerization through the loss of side alky groups from
aromatic compounds (Lewis 1987) Therefore the decreased HC and OC values at higher
thermal treatment temperatures were probably caused by dehydrogenation and the loss of side
groups such as aliphatic groups associated with aromatic rings
Table 22 The IR absorption bands for functional groups of the biomass tar
Wavenumber (cm-1) Functional Groups Compounds
3271 O-H Stretching Phenols
3060 C-H Stretching Aromatic
2923 2854 CH2 Asymmetrical and symmetrical stretching Alkyl aliphatic
1686 C=O stretching Carbonyl
1597 Aromatic skeletal vibration together with C=O Aromatic
stretching vibration
1512 Aromatic skeletal vibration Aromatic
1450 CH2 Symmetrical bending vibration Alkyl aliphatic
1265 1036 C-O-C Asymmetrical and symmetrical stretching Aryl-alkyl ether
1115 C-O-C Asymmetrical stretching Dialkyl ethers
830 750 C-H out-of-plane bending Aromatic
Table 23 Elemental analysis of biomass tar
Samples C () H () N () O () HC c OC
Original a 7513 667 256 1564 0089 0208
180 ˚C b 7605 622 255 1518 0082 0200
250 ˚C 7672 595 285 1448 0078 0189
350 ˚C 7911 515 337 1237 0065 0156
600 ˚C 8083 283 327 1307 0035 0162
a The tar after being dried by vacuum b The tar by thermal treatment at 180 ˚C under nitrogen atmosphere c The ratio of hydrogen and carbon determined by mass
21
231 Thermal Decomposition
Figure 23 Thermal gravimetric curves of biomass tar at different heating rates under nitrogen
atmosphere (a) the temperature dependence of the extent of conversion (α) for different heating
rates (b)
Typical TG profiles of the tar at different heating rates are presented in Figure 23a The
onset decomposition temperature (defined as the temperature at the mass loss of 5 ) was within
the range of 133-162 degC depending on the heating rates The DTG curves showed one distinct
peak between 183 degC (5 degCmin) and 252 degC (30 degCmin) under each heating rate indicating the
highest decomposition rate of the tar Under all heating conditions the final solid residue was in
the range of 28-30 at 600 degC The onset and main thermal degradation temperatures of the tar
were slightly lower compared with previously studied biomass feedstock such as wood (Shen et
al 2011) corn stover (Ma et al 2013) and other agricultural residue (Yao et al 2008 Yi et al
2013) This could be attributed to relatively low molecular mass components in the tar formed by
the breakdown of high molecular mass lignocellulosic materials during biomass gasification The
thermal decomposition process of the tar occurred in a wide temperature range at each heating
rate indicating the complex chemical composition of the tar (confirmed by the GC-MS and
FTIR analysis) The peak of mass loss rate in the DTG curves shifted toward higher temperatures
with the increasing heating rates (Figure 23b) This was due to the heat transfer lag at higher
heating rates However the final mass loss of tar was not affected by the heating rates
22
Figure 24 Arrhenius plots at selected conversion rates by Friedman (a) and DAEM (b) method
The kinetic parameters from the Friedman and DAEM models are determined by the iso-
conversional method and the data is presented in Figure 24 with the extent of conversion (α)
plotted as a function of temperature The Friedman method simplified the decomposition of tar
as a single reaction and the extent of conversion behaved as a global degradation rate to which
all tar components contributed as a uniform group The DAEM method assumed a set of parallel
irreversible 1st order reactions occurring simultaneously This approach was widely applied for
the thermal kinetic analysis of biomass including agricultural residues (Ma et al 2013 Sonobe
and Worasuwannarak 2008) wood (Shen et al 2011) and pyrolysis products from fowl
dropping (Li and Suzuki 2009b) The Arrhenius plots of ln(ddT) as a function of 1T by
Friedman method and ln(T2) against 1T by the DAEM method are shown in Figure 24 Linear
and parallel relationships were observed from the conversion range of 01-06 indicating
unchanged activation energies at this stage Accordingly the thermal decomposition of the tar
could be described as a set of parallel single reactions or a uniform multiple reaction mechanism
within the conversion rates of 01-06 The unsatisfactory parallelity of the plots at higher
conversion rates (αgt06) indicated the change of reaction mechanism which was interpreted as a
sign of a multiple-step reaction mechanism (Ozawa 1965) The change of reaction mechanism at
23
higher conversion rates could be due to the complex reactions in the thermal decomposition
process of the main components in the tar (Yao et al 2008)
Figure 25 The activation energy (E) plotted against the extent of conversion rate (α)
The average apparent activation energy data calculated from the slopes of the Arrhenius
plots by the two models is shown as a function of conversion (Figure 25) The activation energy
values from the Friedman and DAEM methods showed the same trends and increased essentially
only above the conversion rate of 06 The similar results were reported in the study of natural
fibers (Yao et al 2008) The differential Friedman method gave an average activation energy
value of 107 kJmol in the conversion range of 01-06 while the DAEM method led to an
average value of 85 kJmol within the same conversion range The value by the Friedman
method was higher than the one by the DAEM method It was suggested that different kinetics
analysis methods were complementary rather than competitive (Brown et al 2000) Thus an
appropriate activation energy range should be acquired by applying different methods
Consequently the general activation energy range of 80-110 kJmol was obtained for the thermal
decomposition of the tar in the N2 atmosphere This was within activation energy range (60-170
kJmol) from a variety of biomass (Di Blasi 2002 Groslashnli et al 2002 Kumar et al 2008) As
mentioned above the reaction mechanism changed when the conversion rate was larger than 06
24
which resulted in the complexity of modeling the entire thermal decomposition process of the tar
Therefore this study focused on the conversion range of 01-06 within which the
decomposition of main components completed during the aforementioned temperature range
from 183 to 252 degC By this way the degradation process of the tar was simplified which was
quite meaningful for understanding the thermal properties of tar derived materials
24 CONCLUSIONS
In this study a comprehensive analysis of chemical composition and thermal degradation
of the tar from corn stover gasification was carried out The tar was a complex mixture mainly
composed of highly branched PAHs furans aliphatics and esters as indicated by the GC-MS
and FTIR spectroscopy The elemental analysis showed that biomass tar with higher HC and
OC was more oxygenated and less aromatic than fossil pitches implying that the tar was more
reactive The complex composition of the tar led to a broad thermal decomposition temperature
range The tar decomposed at a low temperature (183-252 degC depending on the heating rates)
compared with biomass feedstock due to the low molecular mass components in the tar
produced by gasification The thermal decomposition kinetics of the tar indicated that single
reaction mechanism can be applied at low conversion and the reaction mechanism changed at
higher conversions caused by the complex reactions in decomposition process of biomass tar
The tar decomposition was simplified by focusing on the conversion range of 01-06 and a
general activation energy range of 80-110 kJmol by the two models The simplified approach is
helpful for better understanding the thermal properties of tar derived materials and facilitating its
further processing and utilization
25
25 REFERENCES
Aigner I Wolfesberger U Hofbauer H 2009 Tar content and composition in producer gas of
fluidized bed gasification and low temperature pyrolysis of straw and wood - influence of
temperature International Conference on Polygeneration Strategies Vienna
Alcantildeiz-Monge J Cazorla-Amoroacutes D Linares-Solano A 2001 Characterisation of coal tar
pitches by thermal analysis infrared spectroscopy and solvent fractionation Fuel 80 41-
48
Brown ME Dollimore D Galwey AK (Eds) 1980 Reactions in the Solid State Elsevier
Science
Brown ME Maciejewski M Vyazovkin S Nomen R Sempere J Burnham A
Opfermann J Strey R Anderson HL Kemmler A Keuleers R Janssens J
Desseyn HO Li C-R Tang TB Roduit B Malek J Mitsuhashi T 2000
Computational aspects of kinetic analysis Part A The ICTAC kinetics project-data
methods and results Thermochim Acta 355 125-143
Bui NN Kim BH Yang KS Dela Cruz ME Ferraris JP 2009 Activated carbon fibers
from electrospinning of polyacrylonitrilepitch blends Carbon 47 2538-2539
Burnham AK 2000 Computational aspects of kinetic analysis Part D The ICTAC kinetics
project- multi-thermal-history model-fitting methods and their relation to isoconversional
methods Thermochim Acta 355 165-170
Devi L Ptasinski KJ Janssen FJJG 2005 Pretreated olivine as tar removal catalyst for
biomass gasifiers investigation using naphthalene as model biomass tar Fuel Process
Technol 86 707-730
Di Blasi C 2002 Modeling intra- and extra-particle processes of wood fast pyrolysis AlChE J
48 2386-2397
Dou B Gao J Sha X Baek SW 2003 Catalytic cracking of tar component from high-
temperature fuel gas Appl Therm Eng 23 2229-2239
Elliott DC 1988 Relation of reaction time and temperature to chemical composition of
pyrolysis oils in Soltes EJ Milne TA (Eds) Pyrolysis Oils from Biomass American
Chemical Society Washington DC pp 55-65
Ghani WAWAK Mohd A da Silva G Bachmann RT Taufiq-Yap YH Rashid U
Al-Muhtaseb AaH 2013 Biochar production from waste rubber-wood-sawdust and its
potential use in C sequestration Chemical and physical characterization Ind Crops Prod
44 18-24
Groslashnli MG Vaacuterhegyi G Di Blasi C 2002 Thermogravimetric analysis and devolatilization
kinetics of wood Ind Eng Chem Res 41 4201-4208
26
Jiang J Wang Q Wang Y Tong W Xiao B 2007 GCMS analysis of coal tar
composition produced from coal pyrolysis Bull Chem Soc Ethiop 21 229-240
Khawam A Flanagan DR 2005 Role of isoconversional methods in varying activation
energies of solid-state kinetics - II Nonisothermal kinetic studies Thermochim Acta 436
101-112
Ku CS Mun SP 2006 Characterization of pyrolysis tar derived from lignocellulosic biomass
J Ind Eng Chem 12 853-861
Kumar A Wang L Dzenis YA Jones DD Hanna MA 2008 Thermogravimetric
characterization of corn stover as gasification and pyrolysis feedstock Biomass
Bioenergy 32 460-467
Lewis IC 1987 Chemistry of pitch carbonization Fuel 66 1527-1531
Li C Suzuki K 2009a Kinetic analyses of biomass tar pyrolysis using the distributed
activation energy model by TGDTA technique J Therm Anal Calorim 98 261-266
Li C Suzuki K 2009b Tar property analysis reforming mechanism and model for biomass
gasification-An overview Renew Sus Energ Rev 13 594-604
Li C Yamamoto Y Suzuki M Hirabayashi D Suzuki K 2009 Study on the combustion
kinetic characteristics of biomass tar catalysts J Therm Anal Calorim 95 991-997
Li CS Suzuki K 2010 Resources properties and utilization of tar Resour Conserv Recy
54 905-915
Loacutepez R Fernaacutendez C Goacutemez X Martiacutenez O Saacutenchez M 2013 Thermogravimetric
analysis of lignocellulosic and microalgae biomasses and their blends during combustion
J Therm Anal Calorim 114 295-305
Lu KT Wu LY 2013 Substitution of phenol in phenol-formaldehyde (PF) resins by wood
tar for plywood adhesives Holzforschung 67 413-419
Ma F Zeng Y Wang J Yang Y Yang X Zhang X 2013 Thermogravimetric study and
kinetic analysis of fungal pretreated corn stover using the distributed activation energy
model Bioresour Technol 128 417-422
Maciejewski M 2000 Computational aspects of kinetic analysis Part B The ICTAC Kinetics
Project-the decomposition kinetics of calcium carbonate revisited or some tips on
survival in the kinetic minefield Thermochim Acta 355 145-154
Miura K 1995 A new and simple method to estimate f(E) and k0(E) in the distributed
activation energy model from three Sets of experimental data Energy Fuels 9 302-307
Miura K Maki T 1998 A simple method for estimating f(E) and k0(E) in the distributed
activation energy model Energy Fuels 12 864-869
27
Mun S Ku C 2010 Pyrolysis GC-MS analysis of tars formed during the aging of wood and
bamboo crude vinegars J Wood Sci 56 47-52
Ozawa T 1965 A new method of analyzing thermogravimetric data Bull Chem Soc Jpn 38
1881-1886
Pakdel H Roy C 1991 Hydrocarbon content of liquid products and tar from pyrolysis and
gasification of wood Energy Fuels 5 427-436
Prauchner MJ Pasa VMD Otani C Otani S 2001 Characterization and thermal
polymerization of Eucalyptus tar pitches Energy Fuels 15 449-454
Shen DK Gu S Jin B Fang MX 2011 Thermal degradation mechanisms of wood under
inert and oxidative environments using DAEM methods Bioresour Technol 102 2047-
2052
Silverstein RRM Webster FX Kiemle DJ (Eds) 2005 The spectrometric identification of
organic compounds John Wiley amp Sons Australia Limited Hoboken
Simell PA Hirvensalo EK Smolander VT 1999 Steam reforming of gasification gas tar
over dolomite with benzene as a model compound Ind Eng Chem Res 38 1250-1257
Sonobe T Worasuwannarak N 2008 Kinetic analyses of biomass pyrolysis using the
distributed activation energy model Fuel 87 414-421
Sun M Ma XX Yao QX Wang RC Ma YX Feng G Shang JX Xu L Yang YH
2011 GC-MS and TG-FTIR study of petroleum ether extract and residue from low
temperature coal tar Energy Fuels 25 1140-1145
Suzuki T Yamakawa M Yamamoto K Watanabe T Funaki M 1997 Recovery of wood
preservatives from wood pyrolysis tar by solvent extraction Holzforschung 51 214-218
Swierczynski D Courson C Kiennemann A 2008 Study of steam reforming of toluene used
as model compound of tar produced by biomass gasification Chem Eng Process 47
508-513
Vand V 1943 A theory of the irreversible electrical resistance changes of metallic films
evaporated in vacuum Proc Phys Soc 55 0222-0246
Vyazovkin S Burnham AK Criado JM Peacuterez-Maqueda LA Popescu C Sbirrazzuoli
N 2011 ICTAC kinetics committee recommendations for performing kinetic
computations on thermal analysis data Thermochim Acta 520 1-19
Yanik J Kommayer C Saglam M Yueksel M 2007 Fast pyrolysis of agricultural wastes
Characterization of pyrolysis products Fuel Process Technol 88 942-947
28
Yao F Wu Q Lei Y Guo W Xu Y 2008 Thermal decomposition kinetics of natural
fibers activation energy with dynamic thermogravimetric analysis Polym Degrad Stab
93 90-98
Yi Q Qi F Cheng G Zhang Y Xiao B Hu Z Liu S Cai H Xu S 2013
Thermogravimetric analysis of co-combustion of biomass and biochar J Therm Anal
Calorim 112 1475-1479
29
CHAPTER 3 FABRICATING ELECTROSPUN NANOFIBER WITH ANTIMICROBIAL
CAPABILITY A FACILE ROUTE TO RECYCLE BIOMASS TAR2
31 INTRODUCTION
Energy shortage environmental pollution and global warming are crucial issues that drive
us to utilize renewable natural resources in a more sustainable way Biomass and biofuels are
promising alternatives to petroleum-derived materials and energy due to their unique
characteristics including abundance renewability and carbon neutrality Thermochemical
transformations such as pyrolysis and gasification can convert biomass into biofuels (Vassilev et
al 2010) However tar (heavy hydrocarbons) is always produced as a by-product from biomass
thermochemical conversion processes (Di Marcello et al 2014) The tar needs to be removed
from the producer gas to avoid operational problems associated with clogging in downstream
units and the poisoning of catalysts in end-use applications (Tuomi et al 2015) The disposal of
tar can cause environmental pollution due to its high resistance to degradation (Li and Suzuki
2010) and the current treatments focus on tar reforming processes using steam and catalysts
(Wang et al 2013 Widayatno et al 2014) However these processes are quite complex and
costly Therefore comprehensive separation and utilization technologies for biomass tar are
needed for sustainable application of biomass biofuels and valued-added chemicals and to
expand the scope of biomass utilization
Considering its high carbon content it should be possible to utilize biomass tar as a carbon-
based feedstock Tar is a complex mixture of hydrocarbons including single ring to five-ring
polycyclic aromatic hydrocarbons (PAHs) along with other oxygen-containing hydrocarbons
This chapter previously appeared as Song K Wu Q Zhang Z Ren S Lei T Dooley
KM Liu D Janes ME Fabricating Electrospun Nanofibers with Antimicrobial Capability A
Facile Route to Recycle Biomass Tar Fuel 2015 150 123-130 It is reprinted by permission of
Elsevier
30
such as polyphenols (Li and Suzuki 2009 Rice et al 2011) Tar from biomass gasification is
mainly composed of phenols aromatics furans aliphatics and esters (Song et al 2015 Yu et al
2014) Elemental analysis showed that the tar with higher HC and OC was more oxygenated
and less aromatic than fossil pitches implying that the tar was more reactive (Song et al 2015)
The components of the tar can be extracted to use as valuable substitutes for petroleum derived
chemicals In the past a larger number of chemicals such as anthracene acenaphthene pyrene
phenol and most of heterocyclic aromatic compounds were extracted from coal tar but the
procedures for separation and purification were quite complex (Amen-Chen et al 1997 Li and
Suzuki 2010) Accordingly it is much more practical and cost-effective to utilize tar as a whole
Using the entire tar or pitch carbon fibers and carbon foams were fabricated and utilized as
adsorption or filtration medium due to their large surface areas and high porosities (Bui et al
2009 Li et al 2011) However most previous research focused on using tar or pitch from coal
and petroleum and little attention was paid to the utilization of tar from biomass Limited
attempts were made to use wood tar as preservatives for wood and as a component in phenol-
formaldehyde resin formulation in plywood adhesives (Lu and Wu 2013 Suzuki et al 1997)
However no study has been carried out so far to manufacture fibrous materials using tar from
biomass thermochemical conversions
Among the fiber fabricating techniques electrospinning has emerged as a simple and
highly versatile method to prepare multifunctional fibers from a remarkable range of organic and
inorganic materials (Reneker and Yarin 2008) For typical electrospinning the spinning
solutions or suspensions are ejected from the needle tip under the driving force of high voltage
During the travel of the electrospun jet from a needle tip to a grounded collector the solvent
evaporates and ultrafine fibers form and are deposited on the collector Owing to their desirable
31
characteristics including small width large specific surface area multi-scale porosity and high
flexibility for surface functionalization these electrospun nanofibers have wide applications in
adsorption filtration optoelectronics sensors tissue engineering and antimicrobial materials
(Greiner and Wendorff 2007) Some industrial products such as filtration and purification films
are produced by electrospinning and continuous efforts have been made to optimize the
electrospinning process (Persano et al 2013) Electrospun fibers have been produced from
petroleum-based isotropic pitch dispersed in tetrahydrofuran (THF) (Park et al 2003 Park et al
2004) However these fibers were beaded due to a low solution viscosity resulted from the low
molecular weight and solubility of the tar in solvents This problem can be resolved by blending
tar or pitch with a polymer such as polyacrylonitrile (PAN) (Bui et al 2009) Combining the
outstanding electrospinnability of PAN and the variety of surface functional groups found in tar
enables fabrication of continuous electrospun nanofibers with varying functionalities
In this study functional nanofibers were prepared by electrospinning tarPAN suspensions
The electrospinnability of the tarPAN suspensions and the properties of the resultant nanofibers
with varying tar contents were investigated The electrospun nanofibers were characterized by
field emission scanning electron microscopy (FE-SEM) attenuated total reflection Fourier
transform infrared (ATR-FTIR) spectroscopy thermal gravimetric analysis (TGA) and N2
adsorptiondesorption measurements Additionally antimicrobial activities of the electrospun
nanofibers were tested against Gram-positive S aureus and Gram-negative E coli bacteria
32 MATERIALS AND METHODS
321 Materials
Tar was produced from the gasification of corn stover at 500-600 degC in the Xigou Biomass
Fuel Gas Plant Shanxi China The collected tar material was dried in a vacuum oven at 80 degC
32
for at least 48 h to remove water The dried tar was placed in a sealed container for further
treatment Polyacrylonitrile (PAN Mw = 150000 gmol) and N N-dimethylformamide (DMF)
were supplied by Sigma-Aldrich (St Louis MO USA)
322 Electrospinning SolutionsSuspensions
PAN powder (1 g) was mixed with DMF (9 g) and vigorously stirred overnight at room
temperature to obtain a homogenous solution Meanwhile the dried tar powder was dispersed in
DMF under vigorous magnetic stirring for at least 24 h The as-prepared PAN solution and tar
suspensions were mixed and transferred to an ultrasonic bath further dispersing the tar for 30
min to create the final electrospinning tarPAN suspensions The suspensions with the addition
of 30 50 and 100 wt tar based on PAN by weight were designated as 30TarPAN 50TarPAN
and 100TarPAN respectively (numbers representing relative weight percentage of tar to PAN in
the suspensions)
Conductivities of the prepared solutions and suspensions were determined using an Oakton
PC700 pHmVConductivitydegC bench meter (Oakton Instruments Vernon Hills IL USA)
Shear viscosities were measured by a rheometer (AR2000ex TA Instruments New Castle DE
USA) A 40 mm cone-plate geometry with a cone angle of 1 deg59ʹ42ʹʹ and a truncation of 56 μm
was used for the viscosity measurements The viscosities were measured at shear rates ranging
from 01 to 1000 s-1 at 25 degC To avoid evaporation of solvent during testing a solvent trap cover
was used to seal the 56 μm gap between cone and parallel plate and the moat on the top of the
cover was filled with low-viscosity silicon oil
323 Fabrication of Electrospun TarPAN Nanofibers
The prepared precursor solution or suspension was transferred into a 5 mL glass syringe
with a 0413 mm inner diameter stainless steel needle (Figure 31) The needle was connected to
33
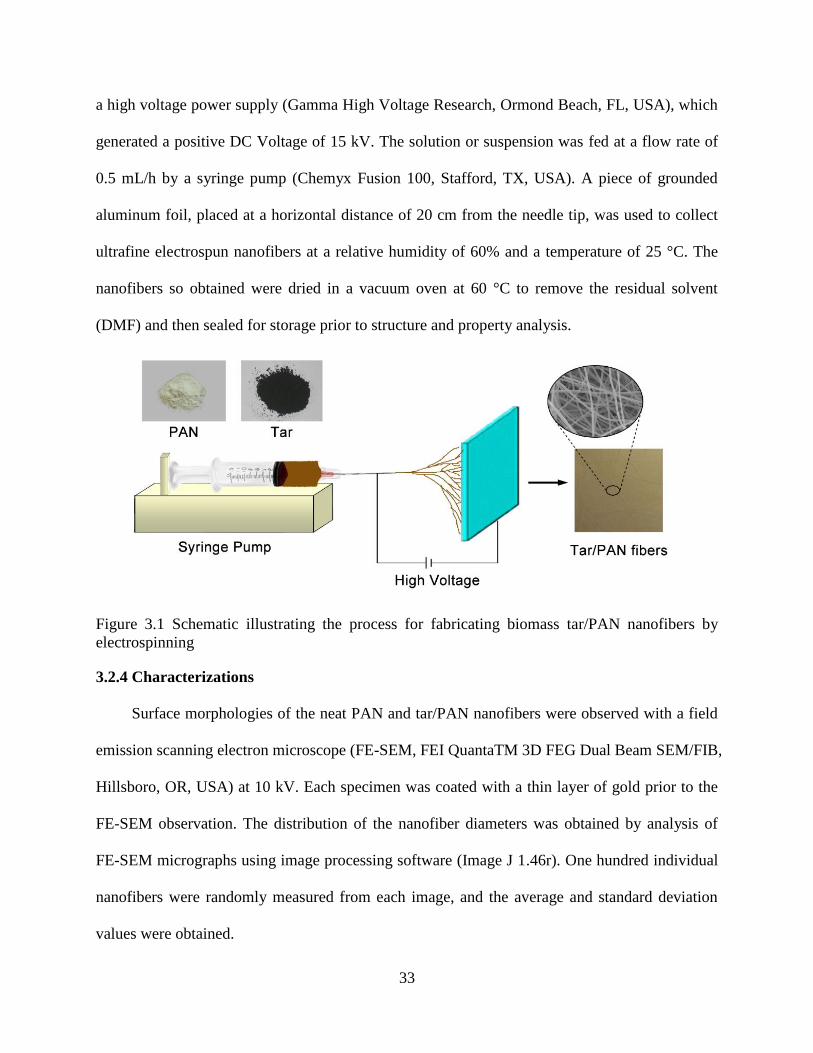
a high voltage power supply (Gamma High Voltage Research Ormond Beach FL USA) which
generated a positive DC Voltage of 15 kV The solution or suspension was fed at a flow rate of
05 mLh by a syringe pump (Chemyx Fusion 100 Stafford TX USA) A piece of grounded
aluminum foil placed at a horizontal distance of 20 cm from the needle tip was used to collect
ultrafine electrospun nanofibers at a relative humidity of 60 and a temperature of 25 degC The
nanofibers so obtained were dried in a vacuum oven at 60 degC to remove the residual solvent
(DMF) and then sealed for storage prior to structure and property analysis
Figure 31 Schematic illustrating the process for fabricating biomass tarPAN nanofibers by
electrospinning
324 Characterizations
Surface morphologies of the neat PAN and tarPAN nanofibers were observed with a field
emission scanning electron microscope (FE-SEM FEI QuantaTM 3D FEG Dual Beam SEMFIB
Hillsboro OR USA) at 10 kV Each specimen was coated with a thin layer of gold prior to the
FE-SEM observation The distribution of the nanofiber diameters was obtained by analysis of
FE-SEM micrographs using image processing software (Image J 146r) One hundred individual
nanofibers were randomly measured from each image and the average and standard deviation
values were obtained
34
Fourier transform infrared (FTIR) spectra of the nanofibers were collected using a Bruker
FTIR spectrometer (Alpha Bruker Optics Inc Billerica MA USA) in attenuated total
reflectance (ATR) mode Each spectrum between 4000 and 600 cm-1 was recorded by
accumulation of 64 scans with a spectral resolution of 4 cm-1 The absorption band at 2243 cm-1
due to the CN stretching vibration was used for spectrum normalization This absorption band
was assumed to be essentially unaltered in the eletrospun PAN and tarPAN nanofibers
The thermal decomposition of the nanofibers was investigated by thermogravimetric
analysis (TGA TA Q50 analyzer TA Instruments New Castle DE USA) with a resolution of
01 μg Samples of 5-10 mg were heated from 30 to 600 degC at a rate of 10 degCmin The
measurements were carried out under a N2 atmosphere at a flow rate of 60 mLmin Differential
scanning calorimetry (DSC) measurements were performed with a TA Q200 system under a
nitrogen atmosphere at a flow rate of 60 mLmin Each sample with an approximate weight of 5
mg was scanned from 40 to 350 degC at a heating rate of 10 degCmin
The porosity of the electrospun neat PAN and tarPAN nanofibers was calculated through
the following equation (Xu et al 2007)
Porosity = (ρ0ndashρ)ρ0times100 (31)
where ρ0 and ρ (gmL) are the densities of cast film and electrospun nanofiber respectively The
film samples were cast from a PAN solution and tarPAN suspensions in Petri dishes followed
by evaporation and further vacuum drying at 80 degC overnight
The nitrogen adsorption and desorption isotherms were determined using a Quantachrome
Autosorb-1 porosimeter (Boynton Beach FL United States) at 77 K in order to determine the
intra-fiber porosity and pore size distribution of the electrospun nanofibers Prior to the
adsorption measurements each sample of 1 g was outgassed at 353 K under vacuum until a
35
stable pressure (lt004 mmHg) was obtained The specific surface area was determined from the
nitrogen adsorption branch of the isotherm by the Brunauer-Emmett-Teller (BET) method
(Brunauer et al 1938) The intra-fiber pore size distribution was determined from the nitrogen
desorption branch according to the Barrett-Joyner-Halenda (BJH) method (Barrett et al 1951)
Antimicrobial activity of the as-spun neat PAN and tarPAN nanofibers was tested against
both Gram-positive S aureus and Gram-negative E coli by viable cell counting methods S
aureus and E coli were cultivated in sterilized Tryptic Soy Broth and then incubated overnight at
37 degC with a shaking incubator Culture medium (1 mL) was diluted with 9 mL of sterilized
broth solution The as-spun nanofibers (25 mg) were immersed into the diluted culture
suspension (5 mL) After 24 h incubation and shaking at 37 degC different dilutions (10-1 to 10-5)
were made by successively adding 1 mL culture into 9 mL of broth solution Then 02 mL of the
diluted culture was spread on an agar plate and incubated at 37 degC for 24 h The number of
colonies was counted and three repeats were performed for each sample The antimicrobial
capability of the tarPAN fibers was defined as follows
Antimicrobial () = (A-B)Atimes100 (32)
where A and B are the number of colonies (colony forming unit CFUmL) before and after the
electrospun nanofibers were added respectively
33 RESULTS AND DISCUSSION
331 Characteristics of Electrospinning Solutions
The properties of precursor solution or suspensions including conductivity viscosity and
concentration are important parameters in determining microstructure of the electrospun
nanofibers DMF was selected for preparing the precursor solutionssuspensions because it was
an excellent solvent for PAN and also a good dispersing agent for biomass tar Homogeneous
36
PAN solutions and tarPAN suspensions were prepared and conductivities and viscosities were
measured The values of conductivity were 557 599 614 and 658 μSm for PAN 30TarPAN
50TarPAN and 100TarPAN respectively The improved conductivity with respect to the
increased tar content could be attributed to the presence of the polar functional groups of the tar
components such as hydroxyl carboxyl carbonyl and ethers (Song et al 2015) Similar
findings were obtained when polar materials were blended with polymers in electrospinning
solutions (Chen et al 2013 Zhou et al 2011) The increased conductivity promoted more
continuous spinning of smaller diameter and bead-free fibers because of the increased charge
density in the electrospinning jets (Greiner and Wendorff 2007) However the conductivity
alone does not determine the morphology of the electrospun nanofibers
Figure 32 Variations of apparent viscosity with shear rates for PAN solutions and tarPAN
suspensions
Shear viscosities of PAN solutions and tarPAN suspensions at a shear rate range of 01-
1000 s-1 are shown in Figure 32 The PAN solution was basically a Newtonian fluid at low shear
rates (01-100 s-1) At greater than 100 s-1 the viscosity of the PAN solution decreased with an
37
increase of shear rates exhibiting a typical pseudoplastic behavior resulting from a gradual
removal of chain entanglements with increased shear stress (Zhou et al 2011) Compared to the
PAN solution the viscosities of the tarPAN suspensions were greatly decreased at all shear rates
although the near Newtonian behavior at the lower shear rates persisted except for 100TarPAN
For this sample with equal weights of tar and PAN the viscosity at the lower shear rates was
only slightly lower but the shear-thinning behavior began almost immediately The viscosity
decrease can be attributed to further disruption of PAN chain-chain interactions (entanglements)
by the tar making the PAN molecules much easier to align The low molecular weight tar
essentially acted as a swelling agent (plasticizer) On the other hand the increased viscosities
obtained upon increasing the tar content can be attributed to contributions from the non-swelling
tar components of higher viscosity than DMF It was well known that electrospinning solutions
or suspensions are subjected to very high shear rates when flowing through a steel needle Thus
the PAN solutions and tarPAN suspensions were even less viscous during the electrospinning
process
332 Microstructure of Electrospun Fibers
Surface morphologies of the electrospun PAN and tarPAN nanofibers are shown in Figure
33 The tar suspension without PAN in DMF was not electrospinnable forming discrete droplets
rather than continuous fibers This was due to the low molecular weights of the tar components
which resulted in non-viscous and non-elastic fluid behavior At such a low viscosity the
viscoelastic stress in the electrospun jet was not strong enough to counter the high Coulombic
forces and high surface tension The blending of the biomass tar with PAN allowed
electrospinning of continuous nanofibers to take place due to the excellent electrospinnability of
PAN Nearly homogenous fibers without any beads were randomly deposited on the grounded
38
collector (Figure 33) However it was noted that some bulges appeared on the surface of the
electrospun nanofibers as the tar content increased (Figure 33D) due to aggregation of the tar A
further increase in the tar content of the blends made continuous fiber spinning quite difficult
Consequently one hundred percent of the tar based on PAN by weight represented the largest tar
fraction that could be used to make continuous electrospun nanofibers In addition some surface
pits or dents were present on the rough surfaces of the electrospun nanofibers observed from the
inset photos at a higher magnification (Figure 33) This was due to the rapid evaporative cooling
of the solvent that occurred when the electrospinning jet was being propelled toward the
collector (Park et al 2004) Furthermore the surfaces of the tarPAN nanofibers became much
rougher than the PAN nanofibers especially for the 100TarPAN This could be caused by some
phase separation between the tar and PAN when the solvent evaporated
Figure 33 FE-SEM micrographs of the electrospun nanofibers (inserted photos are at higher
magnification) A PAN B 30TarPAN C 50TarPAN D 100TarPAN
39
Figure 34 Average diameters of the neat PAN and tarPAN electrospun nanofibers
Although the addition of tar had little effect on the surface morphology of the PAN
nanofibers it influenced the average diameter of the nanofibers (Figure 34) The average
diameter of nanofibers from solutions of PAN in DMF was 422 nm The diameters of tarPAN
composite nanofibers increased continuously with respect to tar content up to 948 nm at 100 wt
tar loading level The increased concentrations of the electrospinning suspensions with additional
tar content contributed to these larger nanofiber diameters and the effect was probably larger
than those from the increased conductivity and decreased viscosity Additionally the size
uniformity of tarPAN fibers at 30 and 50 wt tar loading levels was better than that of fibers
with the largest tar content (Figure 34) This can be mainly attributed to the aggregation of tar
and the phase separation mentioned above which became more obvious for 100TarPAN
333 ATR-FTIR Spectra of Electrospun fibers
ATR-FTIR spectra of the PAN and tarPAN nanofibers were collected (Figure 35)
Characteristic absorbance peaks for the PAN nanofibers were observed including the CH2
asymmetrical and symmetrical stretching vibrations at 2929 and 2869 cm-1 the intense CN
stretch at 2243 cm-1 CH2 bending at 1450 cm-1 CH2 wagging at 1364 cm-1 CH wagging at 1248
cm-1 and the skeletal vibration of the PAN backbone at 1070 cm-1 (Arshad et al 2011 Coleman
40
and Petcavich 1978 Liang and Krimm 1958) The bands at 1664 cm-1 appeared as a result of
impurities in the polymer (Liang and Krimm 1958) For the tarPAN nanofibers aside from the
absorption peaks of PAN additional absorption bands characteristic of the tar compounds
appeared namely OH stretching (3359 cm-1) carbonyl stretching (1701 cm-1) aromatic skeletal
vibrations (1609 and 1507 cm-1) asymmetrical stretching of ethers (1113 cm-1) and C-H out-of-
plane bending of aromatics (828 and 760 cm-1) These peaks are typical of IR absorption in
phenols acids ketones aromatics and ethers in the tar (Song et al 2015) and they were not
present in the PAN nanofibers In addition the absorption peaks of the tar components showed
increased intensities with increased tar content in the nanofibers The bands at 2929 2869 and
1450 cm-1 which were ascribed to CH2 absorption from both PAN and tar also showed increased
intensity with increased addition of tar All of these findings confirmed that the tar was
successfully incorporated into the tarPAN electrospun nanofibers
Figure 35 The ATR-FTIR spectra of the PAN 30TarPAN 50TarPAN and 100TarPAN
electrospun nanofibers
41
334 Thermal Properties
Figure 36 TG (solid curves) and DTG (dotted curves) of the PAN fibers tarPAN fibers and
original tar
Figure 36 shows comparisons of measured TG and DTG curves of the PAN nanofibers
tarPAN composite nanofibers and the original tar The as-spun PAN nanofibers showed three
main weight loss stages In the first stage (up to 285 degC) there was only a slight weight loss In
the second stage rapid PAN decomposition with a 30 weight loss occurred in a temperature
range from 285 to 315 degC This weight loss was due to the side chain degradation of the PAN
polymer with release of volatile gases (Chatterjee et al 1995 Xue et al 1997) A further
decrease of weight (from 70 to 42 ) over a broad temperature range of 315-460 degC in the third
stage was mainly caused by decomposition of the carbon-carbon main chain (Chen et al 2013)
Further heating up to the 600 degC did not lead to any significant additional weight loss
The tarPAN composite nanofibers showed an overlap of the mass losses of tar and PAN
Compared with the neat PAN fibers it was clearly seen that the tarPAN nanofibers began to
lose weight at a lower temperature because of the lower decomposition temperature of some tar
components (Table 31 and Figure 36) The pure tar started to degrade rapidly at a temperature
42
of about 150 degC at which point the mass loss was 5 wt Therefore the weight loss of the
tarPAN nanofibers in the first stage (up to 280 ordmC) can be ascribed completely to the degradation
of tar components Further weight loss of the tarPAN nanofibers was mainly due to the
decomposition of the PAN polymer Additionally the thermal stability of the tarPAN nanofibers
decreased slightly with an increased addition of tar components At 600 degC a 35 wt residue
was observed for the tarPAN composite nanofibers Considering the comparable residual
weights of the tarPAN and the PAN nanofibers it was suggested that biomass tar be used as
precursor materials to manufacture carbon nanofibers The future demand for carbon nanofibers
will increase significant and alternative raw materials must be identified and implemented to
reduce their price (Frank et al 2014) Therefore biomass tar can be a cheaper precursor for
producing low-cost carbon nanofibers Further investigations need to be done in this area with
regard to the complicated composition and low thermal stability of the tar
Table 31 Thermal properties of the electrospun neat PAN and tarPAN fibers
Sample T10
a
(degC)
T50
(degC)
Residue
()
Tcyc b
(degC)
∆Hcyc c
(Jg)
PAN 285 420 38 308 376
30TarPAN 223 411 36 292 394
50TarPAN 219 410 36 290 399
100TarPAN 195 408 35 286 439
a T10 T50 the temperature corresponding to 10 50 wt of weight loss b Tcyc cyclization temperature c ∆Hcyc heat of cyclization
The DSC for the PAN nanofibers showed a strong exothermic peak at 308 degC (Table 31
Figure 37) which is attributed to the cyclization of the nitrile groups of PAN (Sui et al 2013
Wu et al 2012) However the cyclization of PAN in the tarPAN nanofibers differed from that
in the neat PAN nanofibers With an increased content of tar in the electrospun fibers the
43
cyclization temperature (Tcyc) shifted toward lower temperatures and the heat of cyclization
(∆Hcyc) increased This altered reaction behavior upon addition of tar resulted from the catalytic
action and reactions of the hydroxyl groups of phenolic compounds and the acid groups of
carboxylic acids that were constituents of the biomass tar The cyclization of PAN during heating
could be initiated or catalyzed by these ionizable groups (Kim et al 1993) The hydroxyl or acid
groups of the tars located at the PAN interfaces acted catalytically lowering the reactionrsquos
activation energy and thus decreasing Tcyc (Figure 37) The increasing ∆Hcyc indicated a higher
conversion of CN groups in the cyclization reaction also consistent with the presence of
catalytically active functional groups Alternatively it was reported that a lower cyclization
temperature of PAN might be due to the better chain orientation on the molecular level (Gu et al
2005 Zhang et al 2010) Thus the lower Tcyc and higher ∆Hcyc of the tarPAN nanofibers were
also resulted from the plasticizing effects of the tars facilitating the orientation of PAN
molecular chains during the electrospinning processes
Figure 37 DSC of the PAN (solid curves) and tarPAN fibers (dotted curves) The inset shows a
schematic of a tar-initiated PAN cyclization reaction (Ar-OH indicates a phenolic component of
the tar)
44
335 Surface Area and Porosity
Both intra- and inter-fiber pores existed in the electrospun nanofibers The intra-fiber pores
of the neat PAN and tarPAN nanofibers were investigated by nitrogen adsorptiondesorption
measurements at 77 K The isotherms of the electrospun fibers are somewhat similar to a type IV
adsorption process with a hysteresis loop at high PP0 (Figure 38) indicating that a mesopore
structure exists (Sing et al 1985) Similar mesopore characteristics were found in electrospun
nanofibers from cellulose reinforced polyacrylamide (Zhou et al 2013) The isotherms of the
neat PAN and tarPAN nanofibers showed similar hysteresis loops The difference between the
adsorption and desorption branches at low PP0 indicated that the swelling of the polymer opened
up new micropores during the course of the measurement Such swelling was a common
phenomenon in certain polymeric adsorbents but its occurrence here demonstrated that for
adsorbates with greater attraction to certain functional groups of the tar and additional surface
area could be created above the characteristic value of pure PAN (which was resistant to most
organic solvents with a Tg of 85 ordmC)
Figure 38 Nitrogen adsorptiondesorption isotherm at 77 K and BJH pore size distribution (inset)
of the PAN nanofibers Dv(d) is the derivative of pore volume with respect to pore diameter
45
The inset of Figure 38 shows the pore size distribution The diameters of the neat PAN
fibers were mainly between 1-27 nm confirming the predominantly mesoporous structure The
calculated surface area total pore volume and average pore diameters from the isotherms of the
electrospun fibers are shown in Table 32 The tarPAN nanofibers exhibited lower BET surface
areas and total pore volumes compared to the neat PAN nanofibers The average pore diameter
of the tarPAN nanofibers showed an increasing trend with increasing tar content consistent with
swelling of the PAN by the tar
The total porosity of the electrospun nanofibers representing the sum of the contributions
from the larger inter-fiber voids and the intra-fiber pores was obtained by calculating the
densities of the as-spun nanofibers and the corresponding cast films (Table 32) The average
porosity of the neat PAN nanofibers was 63 The porosity decreased to 61 58 and 51
with an addition of 30 50 and 100 wt tar respectively The decreased average porosity of the
tarPAN composite nanofibers was consistent with increased fiber diameters Due to the inter-
and intra-fiber pores and high specific surface area of the tarPAN electrospun nanofibers they
can be considered in the applications of adsorption of hazardous gas or heavy metals for
environmental protection
Table 32 Morphological characteristics of the neat PAN and tarPAN nanofibers
Sample BET surface area
(m2g)
Total pore
volume
(cm3g)
Average pore diameter
(nm)
Total porosity
()
PAN 14 0020 56 63
30TarPAN 12 0019 62 61
50TarPAN 12 0018 57 58
100TarPAN 10 0017 71 51
46
336 Antimicrobial Activity
Figure 39 Antibacterial activity of the neat PAN and tarPAN nanofibers against S aureus (A B
and C) and E coli (D E and F) (A) and (D) PAN (B) and (E) 50TarPAN (C) and (F)
100TarPAN
The effects of the tarPAN electrospun nanofibers on the growth of the bacteria S aureus
and E coli are shown in Figure 39 The counted numbers of bacterial colonies in the diluted
bacteria suspensions decreased after the tarPAN nanofibers were used while the neat PAN
nanofibers showed no effect on the growth of the bacteria An increase in the tar content of the
electrospun nanofibers helped improve the broad-spectrum antimicrobial activities against S
aureus and E coli The calculated antimicrobial capability values of 30TarPAN 50TarPAN
and 100TarPAN nanofibers against S aureus were (8plusmn2) (19plusmn3) and (36plusmn7) respectively
while the values of corresponding nanofibers against E coli were (9plusmn3) (17plusmn4) and
(39plusmn6) respectively The antimicrobial capability of the tarPAN nanofibers was attributed to
the action of the phenolic components in the biomass tar It was reported that phenolic
compounds affected the growth and metabolism of bacteria by adsorbing on cell membranes
interacting with enzymes and disturbing cell membrane permeability (Medina et al 2006
47
Pereira et al 2007 Vaquero et al 2007) The phenolic compounds diffused slowly into the
broth and inhibited the growth of the bacteria Thus the larger content of tar in the electrospun
nanofibers offered more phenolic compounds diffusing into the broth leading to improved
antimicrobial capability with lower colony forming units of the bacteria In addition the porous
characteristics of electrospun fibers resulted in an increased surface area which was helpful for
antimicrobial efficacy through increased exposure of phenolic compounds to the surrounding
bacteria Electrospun polymer nanofibers loaded with silver nanoparticles were used in numerous
applications such as wound dressing (Rujitanaroj et al 2008) and tissue scaffolds (Xing et al
2010) Compared with silver nanoparticles biomass tar showed lower antimicrobial efficacy
mainly due to the lower quantities of phenolic compounds that could diffuse into the broth
solution However biomass tar is a much cheaper additive than silver nanoparticles and can
largely reduce the cost of antimicrobial materials The antimicrobial efficacy of biomass tar can
be improved by further manipulating the composition and concentration of phenolic compounds
in the tar-derived electrospun nanofibers
34 CONCLUSIONS
With the goal of utilizing biomass tar to the greatest extent variable tar amounts were
blended with PAN prior to electrospinning The contents of tar significantly affected the
morphology thermal properties pore characteristics and antimicrobial activity of the resulting
electrospun nanofibers Continuous nanofibers were produced at the tar content levels up to 100
wt based on the weight of PAN The tarPAN nanofibers exhibited increased average diameters
and surface roughness with increasing content of tar ATR-FTIR spectroscopy revealed that the
tar was successfully incorporated into the tarPAN nanofibers The tarPAN nanofibers were less
thermally stable than the neat PAN nanofibers due to the relatively low onset temperature of
48
degradation of biomass tar and their thermal stability decreased with increasing amount of tar
However the tarPAN nanofibers had a comparable amount of residual weight (35) compared
to PAN (38) at 600 degC suggesting that tars can be an attracting precursor for manufacturing
carbon nanofibers Furthermore the addition of tar facilitated catalytically the cyclization of
PAN which is helpful for stabilization processes in the manufacture of PAN-based carbon fibers
The tarPAN nanofibers exhibited increased antimicrobial capacity against S aureus and E coli
with increased tar content This study provides a sustainable and economical way to recycle
biomass tar and can help improve the economics of biofuel production and reduce associated
environmental contamination
35 REFERENCES
Amen-Chen C Pakdel H Roy C 1997 Separation of phenols from Eucalyptus wood tar
Biomass Bioenergy 13 25-37
Arshad SN Naraghi M Chasiotis I 2011 Strong carbon nanofibers from electrospun
polyacrylonitrile Carbon 49 1710-1719
Barrett EP Joyner LG Halenda PP 1951 The determination of pore volume and area
distributions in porous substances I Computations from nitrogen isotherms J Am
Chem Soc 73 373-380
Brunauer S Emmett PH Teller E 1938 Adsorption of gases in multimolecular layers J
Am Chem Soc 60 309-319
Bui NN Kim BH Yang KS Dela Cruz ME Ferraris JP 2009 Activated carbon fibers
from electrospinning of polyacrylonitrilepitch blends Carbon 47 2538-2539
Chatterjee N Basu S Palit SK Maiti MM 1995 An XRD characterization of the thermal
degradation of polyacrylonitrile J Polym Sci Part B Polym Phys 33 1705-1712
Chen M Wang C Fang W Wang J Zhang W Jin G Diao G 2013 Electrospinning of
calixarene-functionalized polyacrylonitrile nanofiber membranes and application as an
adsorbent and catalyst support Langmuir 29 11858-11867
Coleman MM Petcavich RJ 1978 Fourier transform infrared studies on the thermal
degradation of polyacrylonitrile J Polym Sci Polym Phys Ed 16 821-832
49
Di Marcello M Gallucci K Rapagnagrave S Gruber R Matt M 2014 HPTLC and UV
spectroscopy as innovative methods for biomass gasification tars analysis Fuel 116 94-
102
Frank E Steudle LM Ingildeev D Spoumlrl JM Buchmeiser MR 2014 Carbon fibers
precursor systems processing structure and properties Angew Chem Int Ed 53 5262-
5298
Greiner A Wendorff JH 2007 Electrospinning A fascinating method for the preparation of
ultrathin fibres Angew Chem Int Ed 46 5670-5703
Gu S Ren J Wu Q 2005 Preparation and structures of electrospun PAN nanofibers as a
precursor of carbon nanofibers Synth Met 155 157-161
Kim J Kim YC Ahn W Kim CY 1993 Reaction mechanisms of polyacrylonitrile on
thermal treatment Polym Eng Sci 33 1452-1457
Li C Suzuki K 2009 Tar property analysis reforming mechanism and model for biomass
gasification-An overview Renew Sus Energ Rev 13 594-604
Li CS Suzuki K 2010 Resources properties and utilization of tar Resour Conserv Recy
54 905-915
Li S Tian Y Zhong Y Yan X Song Y Guo Q Shi J Liu L 2011 Formation
mechanism of carbon foams derived from mesophase pitch Carbon 49 618-624
Liang CY Krimm S 1958 Infrared spectra of high polymers VII Polyacrylonitrile J Polym
Sci 31 513-522
Lu KT Wu LY 2013 Substitution of phenol in phenol-formaldehyde (PF) resins by wood
tar for plywood adhesives Holzforschung 67 413-419
Medina E de Castro A Romero C Brenes M 2006 Comparison of the concentrations of
phenolic compounds in olive oils and other plant oilsthinsp correlation with antimicrobial
activity J Agric Food Chem 54 4954-4961
Park SH Kim C Choi YO Yang KS 2003 Preparations of pitch-based CFACF webs by
electrospinning Carbon 41 2655-2657
Park SH Kim C Yang KS 2004 Preparation of carbonized fiber web from electrospinning
of isotropic pitch Synth Met 143 175-179
Pereira JA Oliveira I Sousa A Valentatildeo P Andrade PB Ferreira ICFR Ferreres F
Bento A Seabra R Estevinho L 2007 Walnut (Juglans regia L) leaves Phenolic
compounds antibacterial activity and antioxidant potential of different cultivars Food
Chem Toxicol 45 2287-2295
50
Persano L Camposeo A Tekmen C Pisignano D 2013 Industrial upscaling of
electrospinning and applications of polymer nanofibers a review Macromolecular
Materials and Engineering 298 504-520
Reneker DH Yarin AL 2008 Electrospinning jets and polymer nanofibers Polymer 49
2387-2425
Rice JW Fu J Suuberg EM 2011 Thermodynamics of multicomponent PAH mixtures and
development of tarlike behavior Ind Eng Chem Res 50 3613-3620
Rujitanaroj P Pimpha N Supaphol P 2008 Wound-dressing materials with antibacterial
activity from electrospun gelatin fiber mats containing silver nanoparticles Polymer 49
4723-4732
Sing K Everett D Haul R Moscou L Pierotti R Rouqueacuterol J Siemieniewska T 1985
Reporting physisorption data for gassolid systems with special reference to the
determination of surface area and porosity Pure Appl Chem 57 603-619
Song K Zhang H Wu Q Zhang Z Zhou C Zhang Q Lei T 2015 Structure and
thermal properties of tar from gasification of agricultural crop residue J Therm Anal
Calorim 119 27-35
Sui G Sun F Yang X Ji J Zhong W 2013 Highly aligned polyacrylonitrile-based nano-
scale carbon fibres with homogeneous structure and desirable properties Compos Sci
Technol 87 77-85
Suzuki T Yamakawa M Yamamoto K Watanabe T Funaki M 1997 Recovery of wood
preservatives from wood pyrolysis tar by solvent extraction Holzforschung 51 214-218
Tuomi S Kurkela E Simell P Reinikainen M 2015 Behaviour of tars on the filter in high
temperature filtration of biomass-based gasification gas Fuel 139 220-231
Vaquero MJR Alberto MR de Nadra MCM 2007 Antibacterial effect of phenolic
compounds from different wines Food Control 18 93-101
Vassilev SV Baxter D Andersen LK Vassileva CG 2010 An overview of the chemical
composition of biomass Fuel 89 913-933
Wang L Li D Koike M Watanabe H Xu Y Nakagawa Y Tomishige K 2013
Catalytic performance and characterization of NindashCo catalysts for the steam reforming of
biomass tar to synthesis gas Fuel 112 654-661
Widayatno WB Guan G Rizkiana J Hao X Wang Z Samart C Abudula A 2014
Steam reforming of tar derived from Fallopia Japonica stem over its own chars prepared
at different conditions Fuel 132 204-210
Wu M Wang Q Li K Wu Y Liu H 2012 Optimization of stabilization conditions for
electrospun polyacrylonitrile nanofibers Polym Degrad Stab 97 1511-1519
51
Xing Z-C Chae W-P Baek J-Y Choi M-J Jung Y Kang I-K 2010 In vitro
assessment of antibacterial activity and cytocompatibility of silver-containing PHBV
nanofibrous scaffolds for tissue engineering Biomacromolecules 11 1248-1253
Xu X Chen X Liu A Hong Z Jing X 2007 Electrospun poly(L-lactide)-grafted
hydroxyapatitepoly(L-lactide) nanocomposite fibers Eur Polym J 43 3187-3196
Xue TJ McKinney MA Wilkie CA 1997 The thermal degradation of polyacrylonitrile
Polym Degrad Stab 58 193-202
Yu H Zhang Z Li Z Chen D 2014 Characteristics of tar formation during cellulose
hemicellulose and lignin gasification Fuel 118 250-256
Zhang H Nie H Yu D Wu C Zhang Y White CJB Zhu L 2010 Surface
modification of electrospun polyacrylonitrile nanofiber towards developing an affinity
membrane for bromelain adsorption Desalination 256 141-147
Zhou C Chu R Wu R Wu Q 2011 Electrospun polyethylene oxidecellulose nanocrystal
composite nanofibrous mats with homogeneous and heterogeneous microstructures
Biomacromolecules 12 2617-2625
Zhou C Lee S Dooley K Wu Q 2013 A facile approach to fabricate porous
nanocomposite gels based on partially hydrolyzed polyacrylamide and cellulose
nanocrystals for adsorbing methylene blue at low concentrations J Hazard Mater 263
334-341
52
CHAPTER 4 POROUS CARBON NANOFIBERS FROM ELECTROSPUN BIOMASS
TARPOLYACRYLONITRILESILVER HYBRIDS AS ANTIMICROBIAL
MATERIALS3
41 INTRODUCTION
Carbon nanofibers (CNFs) with diameters in the submicron and nanometer range have
attracted an increasing attention due to their superior chemical electrical and mechanical
properties (Gardea et al 2013 Morgan 2005 Zhang et al 2014) Among various CNFs porous
CNFs exhibit promising applications in energy conversion and storage gas adsorption and
biomedical fields attributed to their ultrahigh specific surface area and porosity (Aykut 2012
Wang et al 2013 Xu et al 2013) The future demand for porous CNFs with diverse
functionalities is expected to increase significantly and alternative raw materials have to be
identified and implemented to reduce their production cost Renewable raw materials from
biomass sources are attractive for producing low-cost CNFs with minimal environmental impact
due to their unique characteristics including abundance and renewability (Wu et al 2013 Xu et
al 2014)
Tar an industrial by-product from biomass pyrolysis or gasification is a potential source
for producing such low-cost CNFs (Song et al 2015b) Currently tar is treated as an industrial
waste and its disposal is extremely difficult and costly due to its complex chemical composition
and high resistance to biodegradation Current efforts focus on tar reforming processes using
steam or catalysts (Guan et al 2013 Li et al 2014) but these treatments are quite complicated
costly and time-consuming Our previous study indicated that biomass tar mainly contained
phenols and aromatics originated from lignin decomposition during pyrolysis or gasification
This chapter previously appeared as Song K Wu Q Zhang Z Ren S Lei T
Negulescu II Zhang Q Porous Carbon Nanofibers from Electrospun Biomass
TarPolyacrylonitrileSilver Hybrids as Antimicrobial Materials ACS Appl Mater Interfaces
2015 7 15108-15116 It is reprinted by permission of American Chemical Society
53
processes and presented a high carbon content (ie over 75) (Song et al 2015b) Thus the
biomass tar can be a promising low-cost precursor for manufacturing CNFs Tar or pitch derived
from coal and petroleum was successfully processed into carbon fibers with a high specific
surface area and porosity (Derbyshire et al 2001 Kim et al 2013) However no reports of
CNFs based on tar from biomass conversions have been found It is thus of significant practical
interest to utilize biomass tar as a low-cost precursor for carbon materials instead of disposing it
as a waste causing environmental pollutions
CNFs are commonly produced through preparations of precursor fibers followed by
thermo-oxidative stabilization and carbonization processes (Frank et al 2014) Although
traditional spinning methods such as wet spinning and melt spinning have been used to
manufacture precursor fibers electrospinning emerges as a simple and highly versatile approach
to fabricate multifunctional nanofibers with diameters down to a few nanometers (Matsumoto et
al 2013 Reneker and Yarin 2008) Various polymeric materials including polyacrylonitrile
(PAN) cellulose and pitch are electrospun into precursor nanofibers and diversified CNFs are
obtained with subsequent stabilization activation and carbonization treatments (Joshi et al
2010 Zhang et al 2014) The small dimension of electrospun CNFs creates a larger specific
surface area compared to CNFs from traditional spinning methods (Inagaki et al 2012)
Nevertheless technical difficulties emerge from complex compositions of tar when it is used for
electrospinning Tar is composed of a number of mixed substances which cannot be dissolved
by solvents completely Furthermore most components of tar have relatively low molecular
weights Thus precursor suspensions prepared by tar exhibit inadequate homogeneity and low
viscosity which is detrimental for producing smooth and continuous electrospun fibers
Consequently it is hard to obtain tar-based electrospun nanofibers with uniform diameters and
54
beaded or dumb-bell shaped fibers were usually produced (Park et al 2004 Park and Jang
2003) However the electrospinning ability of tar can be improved by blending it with a polymer
such as PAN with excellent electrospinning ability The mixture of petroleum derived pitch and
PAN was successfully electrospun into continuous fibers and activated carbon fibers with a high
specific surface area ranging from 732 to 1877 m2g were prepared through subsequent
stabilization carbonization and steam activation processes (Bui et al 2009) It is noteworthy
that tar derived CNFs may not be able to perform well in high strength applications due to
structural heterogeneity of tar and efforts have been made to enhance their mechanical
properties by modifying compositions and molecular structures of tar (Kim et al 2014)
Nevertheless tar can be used to fabricate electrospun CNFs with various functionalities such as
antimicrobial capacity by incorporating silver nanoparticles (Li et al 1998)
The aim of this study was to fabricate porous CNFs with antimicrobial capabilities from
recycled biomass tar as low-cost precursor by electrospinning and subsequent stabilization and
carbonization processes Suspensions of biomass tar PAN and silver nanoparticles were
prepared and electrospun into precursor nanofibers that were further converted to porous CNFs
by oxidative stabilization and carbonization in an inert atmosphere The effects of tar loading
levels on electrospinning ability of suspensions morphologies chemical structures thermal
properties pore features and antimicrobial performance of resultant CNFs were investigated
42 MATERIALS AND METHODS
421 Materials
Tar was collected from the gasification of corn stover at 500-600 degC in Xigou Biomass
Fuel Gas Plant Shanxi China Water in the tar was removed by drying in a vacuum oven at
80 degC for at least 48 h The dried tar was then stored in a sealed container for further processing
55
PAN (Mw = 150000 gmol) N N-dimethylformamide (DMF) and silver nitrate (AgNO3) were
purchased from Sigma-Aldrich (St Louis MO USA)
422 Fabrication of Carbon Fiber Precursors
PAN was added in DMF and mixed using a magnetic stirrer for 24 h at room temperature
A certain amount of dried tar powder was dispersed in DMF under vigorous magnetic stirring for
at least 24 h at room temperature The PAN solution and tar suspension in DMF were blended
and the mixture was transferred to an ultrasonic bath to further disperse the tar in the blend for 30
min The concentration of PAN in the mixture was fixed at 10 wt The loading levels of tar
were 0 50 and 100 wt with respect to weight of PAN (Table 41) Silver nitrate powder was
then added into the prepared tarPAN suspensions (molar ratio of AgNO3 and repeating unit of
PAN was 110) The resultant suspensions were shielded from light and stirred for 2 h in an ice
bath to ensure complete dissolution of silver nitrate Afterwards silver ions were reduced to
silver nanoparticles by heating the suspensions to 90 degC in a water bath and holding at this
temperature for 15 min Finally the suspensions containing tar PAN and silver nanoparticles
were cooled down to room temperature prior to electrospinning
Table 41 Compositions and carbon yields of PANAg and tarPANAg electrospun nanofibers
Sample CPAN (wt) CTar (wt ) RSP Carbon Yield
PANAg 10 0 110 45
50TarPANAg 10 50 110 44
100TarPANAg 10 100 110 42
CPAN is the concentration of PAN in the suspensions CTar is the content of tar based on the
weight of PAN RSP is the molar ratio of silver nitrate to the repeating unit of PAN Carbon
yield is based by the weight ratio of carbonized nanofibers and as-spun nanofibers
Subsequently each precursor suspension was loaded into a 5 mL BD plastic syringe
attached with a stainless steel needle tip (internal diameter 0584 mm) The needle was connected
56
to a high-voltage power supply (Gamma High Voltage Research Ormond Beach FL USA)
which generated a positive DC voltage of 15 kV The flow rate of the suspensions was controlled
at 05 mLh by an electric syringe pump (Chemyx Fusion 100 Stafford TX USA) A grounded
metal plate covered with aluminum foil served as the collector which was horizontally placed
and perpendicular to the needle tip with a 20 cm separation The collected nanofibers were dried
in a vacuum oven to remove the residual solvent and stored in a desiccator prior to further
treatments The as-spun nanofibers were designated as PANAg 50TarPANAg and
100TarPANAg with tar contents of 0 50 and 100 wt based on PAN by weight respectively
423 Stabilization and Carbonization
The following stabilization and carbonization were performed in a high temperature tubular
furnace (GSL-1100 MTI Corporation Richmond CA USA) The as-spun nanofibers were
stabilized in air by heating up to 300 degC at a heating rate of 1 degCmin and holding at this
temperature for 1 h The stabilized nanofibers were subsequently carbonized in N2 atmosphere
by heating up to 900 degC at a heating rate of 5 degCmin and holding at this temperature for 1 h The
resultant CNFs are designated as PANAg-CNF 50TarPANAg-CNF and 100TarPANAg-
CNF respectively
424 Characterizations
Shear viscosities of the precursor suspensions were measured using a rheometer with a 40
mm cone-plate geometry (AR2000ex TA Instruments New Castle DE USA) The apparent
viscosities were recorded at shear rates ranging from 01 to 1000 s-1 for each suspension at a
controlled temperature of 25 degC using a Peltier device A solvent trap cover was used to avoid
solvent evaporation during the measurements UV-vis measurements were performed to confirm
Ag nanoparticle formation with a Varian UV-vis spectrophotometer (Evolution 600 Thermo
57
Electron Corp USA) The UV absorbance was collected at a wavelength range of 300-600 cm-1
for the electrospun suspensions diluted with the solvent (DMF)
Surface morphologies of the as-spun nanofibers and CNFs were examined by a field
emission scanning electron microscope (FE-SEM FEI QuantaTM 3D FEG Dual Beam SEMFIB
Hillsboro OR USA) operated at 10 kV The as-spun nanofibers were coated with a thin layer of
gold prior to FE-SEM observation and the CNFs were observed without coating The diameters
of the as-spun nanofibers and CNFs were obtained by measuring the randomly selected
nanofibers on the FE-SEM images using an image processing software (Image J 148) Fifty
individual nanofibers were measured for each sample to determine the average diameter The
chemical structure information of the as-spun stabilized and carbonized nanofibers was
obtained from a Bruker FTIR spectrometer (Alpha Bruker Optics Inc Billerica MA USA)
with an attenuated total reflectance (ATR) mode The spectra were recorded between 4000 and
600 cm-1 with a spectral resolution of 4 cm-1
Thermal degradation of the as-spun and stabilized nanofibers was studied with a TA Q50
analyzer (New Castle DE USA) at a resolution of 01 μg The thermogravimetric (TG) and
differential thermogravimetric (DTG) curves were collected from 30 to 600 degC for the as-spun
nanofibers and from 30 to 800 degC for the stabilized nanofibers at a heating rate of 10 degCmin
Sample weight was about 50 mg and the test was conducted in a N2 atmosphere with a N2 flow
rate of 60 mLmin Differential scanning calorimetry (DSC) measurements were performed with
a TA Q200 system in a nitrogen atmosphere Each sample with an approximate weight of 5 mg
was scanned from 40 to 350 degC at a heating rate of 10 degCmin
N2 adsorption and desorption isotherms of the as-spun and CNFs were measured at 77 K
on a Micromeritics TriStar II 3020 analyzer (Norcross GA United States) The samples were
58
outgassed at 110 degC for 24 h prior to data collection The specific surface area and pore size
distribution of the as-spun nanofibers were calculated using the Braunauer-Emmett-Teller (BET)
method and the Barrett-Joyner-Halenda (BJH) method The specific surface area of the CNFs
was calculated both by BET and Langmuir methods The density function theory (DFT)
assuming slit-shaped pores was used to determine the pore size distribution of the CNFs The
total pore volumes of the as-spun nanofibers and CNFs were obtained from the nitrogen
adsorbed at a relative pressure of 099
425 Antimicrobial Test
Antimicrobial activities of the as-spun nanofibers and CNFs against both Gram-positive
Staphylococcus aureus (S aureus) and Gram-negative Escherichia coli (E coli) bacteria were
tested according to the modified Kirby-Bauer method (Kong and Jang 2008 Rujitanaroj et al
2010) S aureus and E coli were cultivated in sterilized tryptic soy broth and incubated
overnight at 37 degC in a shaking incubator After 24 h different dilutions were made by
successively adding 1 mL aliquot of culture into 9 mL broth solution In the same manner five
serial dilutions were made The diluted culture of 02 mL was then uniformly spread on an agar
plate The as-spun nanofiber and CNF membranes were cut into rectangles of 10 times 5 mm2
sterilized by UV irradiation for 30 min and placed on the agar plates containing bacteria for
cultivation in an incubator at 37 degC for 24 h Finally the inhibition zones were observed after 24
h to assess the antimicrobial capability of the as-spun nanofibers and CNFs
43 RESULTS AND DISCUSSION
431 Properties of electrospinning suspensions
A homogeneous precursor suspension is a key prerequisite for successfully producing
smooth and continuous electrospun nanofiber In this study homogeneous suspensions
59
consisting of biomass tar PAN and silver nanoparticles were obtained using DMF as solvent
due to its outstanding solubilization power for PAN and good dispersing ability for biomass tar
The shear viscosities of the precursor suspensions at a shear rate range of 01-1000 s-1 are shown
in Figure 41A The suspension without tar (PANAg) exhibited Newtonian fluid behavior
without obvious viscosity variations at low shear rates Then the viscosity decreased at high
shear rates and a pseudoplastic behavior was observed due to gradual disentanglements of PAN
chains by an increased shear stress The suspension of 50TarPANAg showed a similar behavior
but its viscosity value decreased nearly by half compared to the suspension of PANAg as a
result of the disruption of PAN molecular chain-chain interactions by the tar The
100TarPANAg showed almost the same viscosities as the 50TarPANAg at middle and high
shear rates but exhibited higher viscosities at low shear rates The initial shear thinning behavior
at low shear rates was caused by the higher concentration of tar in the 100TarPANAg The
disruption of chain entanglements by an increasing tar content made PAN molecules much easier
to align leading to the immediate pseudoplastic fluid behavior at low shear rates
Figure 41 Basic properties of the electrospinning suspensions (A) The shear viscosity-shear rate
relationships for PANAg 50 TarPANAg and 100TarPANAg (B) UV absorbance of PAN
and PANAg
AgNO3 was dissolved at a low temperature and then reduced to silver nanoparticles by
direct heating DMF and the polyphenols in the tar probably served as reducing agents
60
(Pastoriza-Santos and Liz-Marzaacuten 2009 Wang et al 2012 Zou et al 2013) This green method
was applied to avoid the use of environmentally hazardous chemical reducing agents such as
NaBH4 and dimethylhydrazine To confirm the formation of silver nanoparticles UV absorbance
of the suspensions was measured (Figure 41B) The PANAg suspension showed an intensive
absorbance peak at about 420 nm while no peak around this wavelength was observed for pure
PAN solution This peak was the characteristic surface plasmon resonance (SPR) band of silver
nanoparticles (Abdelgawad et al 2014 Li et al 2015) and its presence indicated the formation
of silver nanoparticles by reducing AgNO3 in the suspensions
432 Surface Morphology
Continuous electrospun nanofibers without beads were produced from the precursor
suspensions with different tarPAN ratios (Figure 42) However some bulges appeared and
became more obvious with increased tar content in the as-spun nanofibers especially for the
100TarPANAg composition The rough surface resulted from aggregations of tar at a higher
concentration and phase separations between the tar and PAN when the solvent rapidly
evaporated during the travelling of electrospinning jets toward the collector (Park et al 2004)
Further increase in the tar loading levels made the electrospinning much more difficulty and
impractical due to undesirable tar aggregations and formations of inhomogeneous
electrospinning suspensions The average diameter of the as-spun nanofibers increased with an
increase of tar content with the values of (392plusmn48) nm (613plusmn50) nm and (903plusmn137) nm for
PANAg 50TarPANAg and 100TarPANAg respectively (Figure 43) The increasing trend
of the average diameters of the as-spun nanofibers with increased tar contents was due to
increased concentrations of solutes (tar and PAN) in the precursor suspensions and lower
contents of the solvent (DMF) In addition the diameter variations of the as-spun nanofibers
61
became much larger (Figure 43) resulting from rougher surfaces and more non-uniformly sized
nanofibers with increased tar addition
Figure 42 FE-SEM micrographs of the as-spun nanofibers (A PANAg C 50TarPANAg E
100TarPANAg) and CNFs (B PANAg-CNF D 50TarPANAg-CNF F 100TarPANAg-
CNF) (The inset at the bottom-right of each micrograph shows a higher magnification image)
After the as-spun nanofibers were converted to CNFs by the stabilization and carbonization
the continuous fibrous morphology was preserved (Figure 42) Compared with as-spun
nanofibers the average diameters of the CNFs decreased to (226plusmn21) nm (359plusmn34) nm and
(507plusmn71) nm for PANAg-CNF 50TarPANAg-CNF and 100TarPANAg-CNF respectively
(Figure 43) The resultant CNFs became more uniformly sized with smaller diameter variations
62
compared to the as-spun nanofibers This was caused by thermal decompositions and shrinkages
of the as-spun nanofibers in the stabilization and carbonization processes The thermal
decompositions (mainly of tar components) also created more pores on surfaces of the CNFs
especially for the 100TarPANAg-CNF (inset of Figure 42F)
Figure 43 A compasrison of average diameters of the as-spun nanofibers and CNFs from three
different formulations
433 Chemical Structure
ATR-FTIR spectra of the as-spun nanofibers are shown in Figure 44A The distinctive
absorbance features for PAN were present in all the as-spun nanofibers including CequivN
stretching at 2245 cm-1 CH2 bending at 1452 cm-1 CH wagging at 1256 cm-1 and skeletal
vibration of PAN molecular chain at 1072 cm-1 (Arshad et al 2011 Kampalanonwat and
Supaphol 2010 Liang and Krimm 1958) Compared with PANAg the 50TarPANAg and
100TarPANAg compositions exhibited additional absorption peaks attributed to the main tar
components (ie phenols aromatics acids etc) including 3300-3400 cm-1 (OH stretching)
1705 cm-1 (carbonyl stretching) 1609 cm-1 (aromatic skeletal vibration) 830 cm-1 and 764 cm-1
(C-H out-of-plane bending of aromatics) (Park et al 2004 Song et al 2015a) These absorption
peaks were not found in the PANAg without tar indicating that the tar was successfully
63
incorporated in the tar containing as-spun nanofibers In addition the peaks at 2933 and 2871
cm-1 were ascribed to CH2 stretching of both PAN and tar
Figure 44 ATR-FTIR spectra of the as-spun (A) stabilized (B) and carbonized (C) nanofibers
for different tar loading levels (I-PANAg II-50TarPANAg and III-100TarPANAg)
The chemical structure of the as-spun nanofibers was significantly altered by the oxidative
stabilization treatment (Figure 44B) The most significant change was the decrease in the
intensity of CequivN absorption at 2245 cm-1 for all the stabilized nanofibers In addition new
absorption peaks at 1584 cm-1 attributed to the combination of C=N and C=C stretching 1340
cm-1 ascribed to O-H bending (in-plane) and 806 cm-1 due to C=C-H bending were present
(Dalton et al 1999 Wu and Qin 2014 Zhang et al 2003) These absorption peaks resulted
from the generations of conjugated C=N containing structures from intramolecular cyclization of
the nitrile groups and conjugated C=C structures from dehydrogenations at the stabilization
64
stage (Frank et al 2014 Wu and Qin 2014) In addition the broad absorption band at 3100-
3500 cm-1 was attributed to the overlaps of the stretching bands from aromatic C-H O-H and N-
H stretching in the stabilized nanofibers Previous researches also reported carbonyl groups at
1680 cm-1 (Dalton et al 1999 Zhang et al 2003) but this was not obvious in the present study
These oxygen-containing groups (ie hydroxyl and carbonyl) were induced by the oxidative
stabilization processes The stabilized nanofibers were then subjected to thermal treatment in an
inert atmosphere and thereby converted into the CNFs Volatile compounds (eg HCN H2O N2
etc) were removed to give the CNFs with a high carbon yield with respect to the original as-spun
nanofibers The FTIR spectra of the CNFs showed little discernible structure due to strong
absorbance of carbon (Figure 44C)
434 Thermal Properties
Figure 45 TG and DTG curves of the as-spun (A) and stabilized (B) nanofibers with three
different tar contents
Thermal stability of the as-spun and stabilized nanofibers is shown in Figure 45 The
PANAg as-spun nanofibers with no obvious weight loss up to 300 degC underwent a fast
decomposition stage from 300 to 350 degC (Figure 45A) However the 50TarPANAg and
100TarPANAg as-spun nanofibers began to degrade at a much lower temperature than the
PANAg nanofibers due to lower initial degradation temperatures of tar components (Song et al
65
2015a) This was consistent with the DTG peaks of the as-spun nanofibers which moved toward
lower temperatures with increased tar contents The residual weights of the PANAg
50TarPANAg and 100TarPANAg as-spun nanofibers at 600 degC were 63 58 and 49
respectively The main decomposition temperatures of the stabilized nanofibers shifted to higher
temperatures compared to the corresponding as-spun nanofibers indicating the effectiveness of
thermo-oxidative stabilization treatments The main weight loss of stabilized nanofibers was
mainly due to the removing of volatile compounds by crosslinking condensation
dehydrogenation and denitrogenation reactions (Frank et al 2014) In addition the DTG peaks
of the stabilized nanofibers at approximately 180 degC were attributed to decompositions of the
oxygen-containing groups such as C=O and OH in the stabilized nanofibers Because of these
thermal degradations the precursor nanofibers shrunk and the formed CNFs exhibited reduced
and more uniform diameters confirming the morphological observations
Figure 46 DSC curves of the as-spun (A) and stabilized (B) nanofibers with different tar
contents
DSC curves of the as-spun PANAg nanofibers showed a sharp exothermic peak at 317 degC
(Figure 46A) attributed to the cyclization reactions of the nitrile groups in PAN (Frank et al
2014 Kim et al 1993 Zhang et al 2003) Through the cyclization the PAN polymer chains
were converted into a heteroaromatic ladder structure After the tar additions the as-spun
66
nanofibers exhibited a broader peak and initiated the cyclization reactions at lower temperatures
The peak temperature of the 100TarPANAg (305 degC) was much lower than that of the PANAg
(317 degC) although there was no obvious difference between the PANAg and 50TarPANAg
(319 degC) These changes with tar additions indicated the change of the cyclization mechanism of
PAN It was recognized that the cyclization of PAN homopolymer initiated by a radical
mechanism was faster than the cyclization of PAN copolymers following an ionic mechanism
(Frank et al 2014 Gupta et al 1991) The ionizable groups of tar such as hydroxyl and
carboxylic groups located at the interfaces of PAN and tar initiated catalytically the cyclization
reactions of PAN and lowered the onset temperatures (Kim et al 1993) Although the tar
slowed down cyclization reactions of PAN to avoid fusion of the as-spun nanofibers due to
overheating by sharply exothermic reactions at subsequent thermal stabilization and
carbonization some structural flaws could be induced in resultant CNFs by these ionic groups of
tar leading to inferior mechanical properties (Zhang et al 2003) When the as-spun nanofibers
were stabilized in air the introduced oxygen-containing groups helped improve the
hygroscopicity of the stabilized nanofibers (Wu and Qin 2014 Zhang et al 2003) Thus the
endotherm peaks at 90-110 degC of the stabilized nanofibers were due to the release of water
(Figure 46B) In addition the PAN cyclization peaks of the stabilized nanofibers became hardly
seen indicating basic completions of the oxidative stabilization
435 Pore Structure
N2 adsorptiondesorption isotherms and pore size distributions of the as-spun and CNFs are
shown in Figure 47 According to the International Union of Pure and Applied Chemistry
(IUPAC) classification (Sing et al 1985) the isotherms of the as-spun nanofibers were type IV
with a H3 type hysteresis loop (Figure 47A) indicating the presence of mesopores (2 nmltpore
67
sizelt50 nm) in the nanofibers with a non-uniform size This was consistent with the wide pore
size distributions of the electrospun nanofibers determined by the BJH method (Figure 47C)
with peak values of 35 114 and 186 nm for the PANAg 50TarPANAg and
100TarPANAg respectively The BET specific surface area and total pore volume of the as-
spun nanofibers also increased with an increase of tar loading levels (Table 42) The increase in
specific surface area pore volume and pore size with increased tar content in the as-spun
nanofibers was attributed to phase separations of tar and PAN The complex composition of tar
made it extremely difficult to be well blended with PAN Thus phase separations between the tar
and PAN during solvent evaporations contributed to the increase of surface area volume and
size of pores This became more obvious when the tar components aggregated in some domains
of the as-spun nanofibers
Figure 47 N2 adsorptiondesorption isotherms and pore size distribution of the as-spun
nanofibers (A and C) and CNFs (B and D) with different tar contents
68
During the stabilization and carbonization processes of the as-spun nanofibers their pore
structure underwent dramatic changes Compared to the as-spun nanofibers the CNFs had much
higher specific surface areas and pore volumes (Table 42) Based on the IUPAC classification
(Sing et al 1985) the isotherms of the CNFs are typical of type I (Figure 47B) indicating the
dominance of micropores which is similar to other PAN based carbon fibers (Park and Jang
2003) The N2 adsorption completed at very low relative pressure regions (PPolt005) because of
multidirectional interactions between pore walls and the adsorbate The pore size distribution
calculated by DFT showed that the CNFs had a uniform pore size with peak values of 17 16
and 17 nm for PANAg-CNF 50TarPANAg-CNF and 100TarPANAg-CNF respectively
confirming the predominance of micropores (Figure 47D) The tar-containing CNFs showed a
much larger N2 adsorption capacity as compared to that of the CNFs without tar (Figure 47B)
The specific surface area of the CNFs calculated by both BET and Langmuir methods indicated a
large increase when the tar was added and the pore volumes exhibited the same trend (Table 42)
consistent with the FE-SEM observation Furthermore the fraction of micropore volumes for
50TarPANAg-CNF (991) and 100TarPANAg-CNF (97) was much higher than that for
PANAg-CNF (742) similar to the results of pitch based electrospun carbon fibers (Park et al
2003) The large increase in the specific surface area and the high microporosity obtained with
the tar incorporation was attributed to the combined effects of the phase separations between the
tar and PAN and thermal decompositions of the tar constituents A similar result was reported
for the PANpitch derived electrospun CNFs (Kim et al 2011) The noticeably different
structures of the tar and PAN caused inhomogeneous distributions of the tar in the PAN matrix
and formation of tar aggregates throughout the as-spun nanofibers Some aggregates of the tar
degraded thermally when the as-spun nanofibers were converted to the CNFs Thus more pores
69
(mainly micropores) were created with tar addition leading to increased specific surface areas
and larger micropore volumes in the CNFs (Figure 48)
Table 42 Specific surface area and pore volumes of the as-spun nanofibers and CNFs
SBET
(m2g)
SLangmuir
(m2g)
Vp
(cm3g)
Vmp
(cm3g)
VmpVp
()
PANAg 654
0013 00009 69
50TarPANAg 829
0033 00006 18
100TarPANAg 824
0032 00005 16
PANAg-CNF 9479 9778 0043 00319 742
50TarPANAg-CNF 41025 41438 0133 01318 991
100TarPANAg-CNF 43781 43950 0144 01397 970
SBET is BET specific surface area SLangmuir is the specific surface area calculated by Langmuir
model Vp is the total pore volume Vmp is the micropore volume VmpVp is the fraction of
micropore volume
Figure 48 A schematic illustrating the fabrication of the porous tar-derived CNFs through
electrospinning followed by stabilization and carbonization processes
70
436 Antimicrobial Performance
Figure 49 Antimicrobial activities of the as-spun nanofibers (upper row) and CNFs (lower row)
with different tar contents against S aureus
Formation of inhibition zones around the as-spun nanofibers and CNFs were monitored in
order to evaluate their antimicrobial activities against S aureus (Figure 49) The similar
situation was observed for E coli (the figure is not shown) Clear inhibition zones around the as-
spun nanofiber samples were observed after 24 h incubation indicating their excellent
antimicrobial efficiency against both S aureus and E coli The antimicrobial activities were
preserved after the stabilization and carbonization processes with obvious formation of
inhibition zones around the CNFs Silver nanoparticles with their effective biocidal ability were
incorporated into the nanofibers to give antimicrobial capabilities although the mechanism of
killing microorganisms by silver was not clearly explained (Kong and Jang 2008 Li et al 1998
Song et al 2011) In this study the silver nanoparticles were proposed to diffuse into the broth
and to inhibit the growth of bacteria The porous features of the as-spun nanofibers and CNFs
resulted in large specific surface areas and pore volumes which made the diffusion of silver
nanoparticles into the broth more easily increasing the exposure and contact of silver
nanoparticles to the bacteria (Figure 48) (Kong and Jang 2008) Consequently the tar
71
containing as-spun nanofibers and CNFs had higher specific surface areas and pore volumes
which might enhance their antimicrobial efficacy The effect of tar loading levels on the
antimicrobial performance of as-spun nanofibers and CNFs needs to be further studied The
antimicrobial efficacy was affected by the porosity and pore size distribution of the carbon
materials which could be controlled by tuning the composition and concentration of tar
Electrospun polymer nanofibers incorporated with silver nanoparticles were intensively studied
and showed attractive applications in wound dressing tissue scaffolds and package materials
(Rujitanaroj et al 2008 Xing et al 2010) The incorporation of tar could reduce the cost of
silver-based antimicrobial materials
44 CONCLUSIONS
Continuous microporous CNFs from biomass tarPANsilver hybrids with antimicrobial
capabilities were fabricated through electrospinning and subsequent thermal stabilization and
carbonization Silver nitrate was reduced to silver nanoparticles which conferred the
antimicrobial abilities to the as-spun nanofibers and CNFs The as-spun nanofibers showed
larger average diameters with increased tar loading levels due to larger concentrations of tar and
PAN in the suspensions However the increased contents of tar made the fiber surface rougher
and increased fiber diameter variations resulted from tar aggregations and phase separations
between tar and PAN In addition the incorporation of tar reduced the thermal stability of the as-
spun nanofibers due to relatively lower onset degradation temperatures of the tar components
The tar also slowed down the cyclization reactions of PAN by its ionizable groups which was
helpful for subsequent stabilization processes The as-spun nanofibers exhibited mesopore
characteristics while micropores dominated in the CNFs due to the combined effects of thermal
decompositions of some tar constituents and phase separations of tar and PAN The large
72
specific surface areas and the volumes of pores of the as-spun nanofibers and CNFs made the
silver nanoparticles more easily diffuse into the broth endowing their excellent antimicrobial
abilities Therefore biomass tar can be a low-cost precursor for manufacturing antimicrobial
carbon materials extending applications of biomass products and reducing environmental
pollutions associated to tar disposal
45 REFERENCES
Abdelgawad AM Hudson SM Rojas OJ 2014 Antimicrobial wound dressing nanofiber
mats from multicomponent (chitosansilver-NPspolyvinyl alcohol) systems Carbohydr
Polym 100 166-178
Arshad SN Naraghi M Chasiotis I 2011 Strong carbon nanofibers from electrospun
polyacrylonitrile Carbon 49 1710-1719
Aykut Y 2012 Enhanced field electron emission from electrospun Co-loaded activated porous
carbon nanofibers ACS Appl Mater Interfaces 4 3405-3415
Bui NN Kim BH Yang KS Dela Cruz ME Ferraris JP 2009 Activated carbon fibers
from electrospinning of polyacrylonitrilepitch blends Carbon 47 2538-2539
Dalton S Heatley F Budd PM 1999 Thermal stabilization of polyacrylonitrile fibres
Polymer 40 5531-5543
Derbyshire F Andrews R Jacques D Jagtoyen M Kimber G Rantell T 2001 Synthesis
of isotropic carbon fibers and activated carbon fibers from pitch precursors Fuel 80 345-
356
Frank E Steudle LM Ingildeev D Spoumlrl JM Buchmeiser MR 2014 Carbon fibers
precursor systems processing structure and properties Angew Chem Int Ed 53 5262-
5298
Gardea F Naraghi M Lagoudas D 2013 Effect of Thermal Interface on Heat Flow in
Carbon Nanofiber Composites ACS Appl Mater Interfaces 6 1061-1072
Guan G Kaewpanha M Hao X Zhu A Kasai Y Kakuta S Kusakabe K Abudula A
2013 Steam reforming of tar derived from lignin over pompom-like potassium-promoted
iron-based catalysts formed on calcined scallop shell Bioresour Technol 139 280-284
Gupta A Paliwal D Bajaj P 1991 Acrylic precursors for carbon fibers J Macromol Sci C
31 1-89
Inagaki M Yang Y Kang F 2012 Carbon nanofibers prepared via electrospinning Adv
Mater 24 2547-2566
73
Joshi P Zhang L Chen Q Galipeau D Fong H Qiao Q 2010 Electrospun carbon
nanofibers as low-cost counter electrode for dye-sensitized solar cells ACS Appl Mater
Interfaces 2 3572-3577
Kampalanonwat P Supaphol P 2010 Preparation and adsorption behavior of aminated
electrospun polyacrylonitrile nanofiber mats for heavy metal ion removal ACS Appl
Mater Interfaces 2 3619-3627
Kim BH Yang KS Kim YA Kim YJ An B Oshida K 2011 Solvent-induced
porosity control of carbon nanofiber webs for supercapacitor J Power Sources 196
10496-10501
Kim BJ Eom Y Kato O Miyawaki J Kim BC Mochida I Yoon SH 2014
Preparation of carbon fibers with excellent mechanical properties from isotropic pitches
Carbon 77 747-755
Kim BJ Kil H Watanabe N Seo MH Kim BH Yang KS Kato O Miyawaki J
Mochida I Yoon SH 2013 Preparation of novel isotropic pitch with high softening
point and solvent solubility for pitch-based electrospun carbon nanofiber Curr Org
Chem 17 1463-1468
Kim J Kim YC Ahn W Kim CY 1993 Reaction mechanisms of polyacrylonitrile on
thermal treatment Polym Eng Sci 33 1452-1457
Kong H Jang J 2008 Antibacterial properties of novel poly (methyl methacrylate) nanofiber
containing silver nanoparticles Langmuir 24 2051-2056
Li C Wan Y Wang J Wang Y Jiang X Han L 1998 Antibacterial pitch-based
activated carbon fiber supporting silver Carbon 36 61-65
Li R Roy AD Bridges J Dooley KM 2014 Tar reforming in model gasifier effluents
transition metalrare earth oxide catalysts Ind Eng Chem Res 53 7999-8011
Li Z Wang L Chen S Feng C Chen S Yin N Yang J Wang H Xu Y 2015
Facilely green synthesis of silver nanoparticles into bacterial cellulose Cellulose 22 373-
383
Liang CY Krimm S 1958 Infrared spectra of high polymers VII Polyacrylonitrile J Polym
Sci 31 513-522
Matsumoto H Imaizumi S Konosu Y Ashizawa M Minagawa M Tanioka A Lu W
Tour JM 2013 Electrospun composite nanofiber yarns containing oriented graphene
nanoribbons ACS Appl Mater Interfaces 5 6225-6231
Morgan P (Eds) 2005 Carbon fibers and their composites 1st ed Taylor amp Francis Group
Boca Raton
74
Park SH Kim C Choi YO Yang KS 2003 Preparations of pitch-based CFACF webs by
electrospinning Carbon 41 2655-2657
Park SH Kim C Yang KS 2004 Preparation of carbonized fiber web from electrospinning
of isotropic pitch Synth Met 143 175-179
Park SJ Jang YS 2003 Preparation and characterization of activated carbon fibers supported
with silver metal for antibacterial behavior J Colloid Interface Sci 261 238-243
Pastoriza-Santos I Liz-Marzaacuten LM 2009 NN-dimethylformamide as a reaction medium for
metal nanoparticle synthesis Adv Funct Mater 19 679-688
Reneker DH Yarin AL 2008 Electrospinning jets and polymer nanofibers Polymer 49
2387-2425
Rujitanaroj P Pimpha N Supaphol P 2008 Wound-dressing materials with antibacterial
activity from electrospun gelatin fiber mats containing silver nanoparticles Polymer 49
4723-4732
Rujitanaroj Po Pimpha N Supaphol P 2010 Preparation characterization and antibacterial
properties of electrospun polyacrylonitrile fibrous membranes containing silver
nanoparticles J Appl Polym Sci 116 1967-1976
Sing K Everett D Haul R Moscou L Pierotti R Rouqueacuterol J Siemieniewska T 1985
Reporting physisorption data for gassolid systems with special reference to the
determination of surface area and porosity Pure Appl Chem 57 603-619
Song J Kang H Lee C Hwang SH Jang J 2011 Aqueous synthesis of silver
nanoparticle embedded cationic polymer nanofibers and their antibacterial activity ACS
Appl Mater Interfaces 4 460-465
Song K Wu Q Zhang Z Ren S Lei T Dooley KM Liu D Janes ME 2015a
Fabricating electrospun nanofibers with antimicrobial capability A facile route to recycle
biomass tar Fuel 150 123-130
Song K Zhang H Wu Q Zhang Z Zhou C Zhang Q Lei T 2015b Structure and
thermal properties of tar from gasification of agricultural crop residue J Therm Anal
Calorim 119 27-35
Wang M Huang Z Bai Y Kang F Inagaki M 2013 Porous carbon nanofibers
preparation and potential applications Curr Org Chem 17 1434-1447
Wang S Bai J Li C Zhang J 2012 Functionalization of electrospun β-
cyclodextrinpolyacrylonitrile (PAN) with silver nanoparticles Broad-spectrum
antibacterial property Appl Surf Sci 261 499-503
75
Wu S Qin X 2014 Effects of the stabilization temperature on the structure and properties of
polyacrylonitrile-based stabilized electrospun nanofiber microyarns J Therm Anal
Calorim 116 303-308
Wu Z Li C Liang H Chen J Yu S 2013 Ultralight flexible and fire-resistant carbon
nanofiber aerogels from bacterial cellulose Angew Chem Int Ed 125 2997-3001
Xing Z-C Chae W-P Baek J-Y Choi M-J Jung Y Kang I-K 2010 In vitro
assessment of antibacterial activity and cytocompatibility of silver-containing PHBV
nanofibrous scaffolds for tissue engineering Biomacromolecules 11 1248-1253
Xu X Zhou J Jiang L Lubineau G Chen Y Wu XF Piere R 2013 Porous core-shell
carbon fibers derived from lignin and cellulose nanofibrils Mater Lett 109 175-178
Xu X Zhou J Jiang L Lubineau G Payne SA Gutschmidt D 2014 Lignin-based
carbon fibers Carbon nanotube decoration and superior thermal stability Carbon 80 91-
102
Zhang L Aboagye A Kelkar A Lai C Fong H 2014 A review carbon nanofibers from
electrospun polyacrylonitrile and their applications J Mater Sci 49 463-480
Zhang W Liu J Wu G 2003 Evolution of structure and properties of PAN precursors
during their conversion to carbon fibers Carbon 41 2805-2812
Zou M Du M Zhu H Xu C Li N Fu Y 2013 Synthesis of silver nanoparticles in
electrospun polyacrylonitrile nanofibers using tea polyphenols as the reductant Polym
Eng Sci 53 1099-1108
76
CHAPTER 5 RHEOLOGICAL AND FLUID FILTRATION PROPERTIES OF LOW
SOLID DRILLING FLUIDS ADDED WITH CELLULOSE NANOPARTICLES
51 INTRODUCTION
In oil and gas industry bentonite is a montomorillonite clay commonly used in drilling
fluids due to its inherent and well-performing rheological properties (Baruah et al 2013
Bourgoyne et al 1991 Hermoso et al 2015) The bentonite suspensions exhibit excellent shear
thinning behavior that offers a good pumpability of drilling fluids and outstanding carrying
capacity of drilled cuttings (Bourgoyne et al 1991) The viscosity of bentonite-based drilling
fluids is accomplished by arranging bentonite particles into an edge-to-face orientation
(Luckham and Rossi 1999) In conventional drilling fluids a relatively large content of
bentonite is needed to achieve the anticipated rheological and filtration characteristics However
a high concentration of bentonite in drilling fluids can lower drilling efficiency and even result in
a series of problems such as differential sticking inefficient wellbore cleaning and formation
damage Consequently a properly designed low-solid system that has a lower solid content than
conventional bentonite drilling fluids is desired for faster penetration rates thinner filter cakes
highly efficient wellbore cleaning easier fluid maintenance and improved hydraulics Low solid
drilling fluids can be prepared by substituting one or more polymers for bentonite which gives
rheology and fluid loss properties comparable to that of a higher concentration of ordinary
bentonite A wide range of polymeric additives including xantham gum starch sodium
carboxymethyl cellulose polyanionic cellulose polyacrylamide and polyacrylate can be added
into drilling fluids for achieving desired rheological and filtration properties (Fereydouni et al
2012 Hamed and Belhadri 2009 Jang et al 2015 Menezes et al 2010)
Recently micro and nanoparticles are attracting more attention for improving the
performance of drilling fluids to meet increasing challenges in drilling and production of oil and
77
gas from non-conventional reservoirs and under harsh conditions such as high temperature and
high pressure (Abdo and Haneef 2012 Al-Yasiri and Al-Sallami 2015) Such micro and
nanoparticles play an essential role in decreasing the permeability of shale formation
maintaining borehole stability intensifying mud cake quality reducing fluid loss improving
cutting removal ability lowering the friction eliminating differential pipe sticking protecting
reservoir and enhancing oil and gas recovery (Kasiralvalad 2014) To achieve these goals a
variety of micro and nanoparticles have been studied including nano-silica (Sensoy et al 2009
Sharma et al 2012) nano metallic oxide (Barry et al 2015 Cheraghian et al 2013
Sayyadnejad et al 2008) graphite and grapheme oxide (Kosynkin et al 2011 Nasser et al
2013) clay nanoparticles (Abdo and Haneef 2013) polymer-based nanoparticles (Jiang et al
2009 Qu et al 2007) and combinations of these nanoparticles Drilling technologists can
modify rheological and fluid filtration properties of the drilling fluids by changing type
composition size distribution surface characteristics of the nanoparticles to meet requirements
of any particular situation of drilling and production In most cases a very low concentration
(lt1) of nanoparticles is needed in these nano-enhanced drilling fluids (Amanullah et al 2011)
Thus nanoparticles can be good potential candidates for formulating low solid drilling fluids
However most of the above nanoparticles are non-renewable and non-biodegradable and their
use subjects to cost and environmental impact Therefore it is highly desirable to develop
renewable biodegradable and more cost-effective nanoparticle additives in low solid drilling
fluids
Cellulose is the most abundant renewable and biodegradable biopolymer in nature which
widely exists in various natural resources such as wood cotton hemp linen chitin and bacteria
(Moon et al 2011) Cellulose nanoparticles (CNPs) including cellulose nanocrystals (CNCs)
78
and cellulose nanofibers (CNFs) can be obtained from these cellulosic source materials by a
purification pretreatment followed by chemical or mechanical separation approaches including
acid hydrolysis enzyme hydrolysis 2266-Tetramethyl-1-piperidinyloxy (TEMPO) mediated
oxidation ultrasonic grinding and high-pressure homogenization treatments (Chun et al 2011
Moon et al 2011) CNPs have a high specific surface area large aspect ratio and high thermal
stability (Cho and Park 2011 Li et al 2015a) In addition aqueous suspensions of CNPs
exhibit similar fluid flow properties to those of bentonite with low viscosities at high flow rates
and high viscosities at low flow rates (Li et al 2015b) These excellent characteristics attracted
the interest to use CNPs as efficient additives for producing technically reliable economically
attractive environmentally friendly low solid drilling fluids to meet the technical needs and
challenges of the oil and gas industry
The objective of this study was to develop novel and eco-friendly low solid drilling fluids
formulated with bentonite polyanionic cellulose (PAC) and CNPs including CNCs and CNFs
The effects of concentrations and morphology of CNPs on the rheological and fluid filtration
properties of the low solid drilling fluids were investigated The changes of filter cake
characteristics including surface morphologies thickness porosity and permeability in response
to additions of the CNPs in the fluid systems were studied to in-depth understand the interactions
between CNPs and bentonite
52 MATERIALS AND METHODS
521 Materials
Wyoming sodium bentonite was supplied from Baroid Industrial Drilling Products Inc
(Houston TX USA) PAC was used as a filtration control agent and purchased from Hallibuton
Company (Houston TX USA) Sulfuric acid was applied from Sigma-Aldrich (St Louis MO
79
USA) CNFs (Celish KY 100-S Grade) were purchased from Daicel Chemical Industries Ltd
(Tokyo Japan) CNCs were produced through the hydrolysis of CNFs using 64 sulfuric acid at
45ordmC for 1 h and further mechanical separation processes by a high-pressure homogenizer
(Microfluidizer M-110P Microfluidics Corp Newton MA USA) The morphologies of CNFs
and CNCs were examined by a transmission electron microscope (TEM JEOL 100 CX JEOL
USA Inc Peabody MA USA) with an accelerating voltage at 80 kV The width distribution of
CNFs and CNCs was obtained from the analysis of TEM images using an image processing
software (ImageJ 148) Fifty individual fibers were randomly selected to measure the width and
length of each
522 Formulations of Drilling Fluids
Table 51 Formulations of the bentonite drilling fluids added with CNPs
Bentonite
(g)
CNPs
(g)
PAC
(g)
Water
(mL)
Solids
(wt)
BT6 210 0 03 3287 609
BT6CNP005 210 0175 03 3285 614
BT5CNP010 175 0350 03 3319 519
BT4CNP015 140 0525 03 3352 424
BT3CNP020 105 0700 03 3385 329
BT2CNP025 70 0875 03 3418 234
BT1CNP030 35 1050 03 3452 139
CNP040 0 1400 03 3483 049
The bentonite bentoniteCNPs and CNP suspensions were prepared in a standard 350 mL
laboratory barrel (Table 51) Specifically CNFs and CNCs were dispersed in water under
vigorous mechanical stirring for 30 min at room temperature The bentonite powder was then
added and stirred for 10 min Finally PAC was added into the above suspensions and stirred for
80
another 10 min The nomenclature of the drilling fluids samples is designated as BTx
BTxCNPy and CNPy where x (wt) and y (wt) are the concentrations of bentonite and
CNPs (ie CNFs or CNCs) based on the final weight of drilling fluids
523 Rheological Testing
Rheological properties of the drilling fluids were tested by two types of viscometers A
sophisticated TA rheometer equipped with a standard Peltier concentric cylinder geometry
(AR2000ex TA Instruments New Castle DE USA) was used to measure the viscosities of the
drilling fluids under a wide range of shear rates Concentric cylinder geometries are commonly
used for testing low viscosity fluids such as drilling fluids The geometry includes a stainless
steel cup with a radius of 1519 mm configured by a rotator with a radius of 1401 mm The
apparent viscosities were measured at shear rates ranging from 01 to 1000 s-1 with a controlled
temperature of 25degC using the Peltier device A 20 mL sample of drilling fluids was tested for
each measurement
In addition an industrial rotating viscometer (NL Baroid NL Industries Inc Houston
TX) was used to measure viscosities yield point and gel strength of the drilling fluids according
to American Petroleum Institute (API) standard The drilling fluids were stirred before
measuring to ensure that the steady-state conditions were met The rheological parameters
including apparent viscosity ( ) plastic viscosity (p ) and yield point (
y ) were obtained by
the following equations
2600 (51)
300600 p (52)
py 300 (53)
81
where 300 and 600 were the dial readings at 300 and 600 rpm respectively The gel strength of
the drilling fluids including Gelin and Gel10min was recorded by noting the maximum dial
deflection at 3 rpm after the drilling fluid remained static for 10 s and 10 min respectively
524 Fluid Filtration Testing
Fluid filtration properties of the drilling fluids were evaluated by a standard filter press
with a regulated CO2 pressurization system and standard filter papers (Fann Instrument Co
Houston TX) All the filtration tests were conducted at the pressure of (100plusmn5) psi ((690plusmn35)
kPa) and the temperature of 25ordmC according to American Petroleum Institute standard The
volume of filtrate was determined by the mass of the filtrate obtained from a digital balance and
the average density of the filtrate Thus the filtrate volume versus time was obtained for each
drilling fluid system At the end of 30 min the filter paper with filter cake was removed from the
cell and the thickness of the cake was measured When the filter cakes dried their surface
morphologies were examined by a field emission scanning electron microscope (FE-SEM FEI
QuantaTM 3D FEG Dual Beam SEMFIB Hillsboro OR USA) operated at 10 kV The samples
of dried filter cakes were coated with a thin layer of gold prior to the FE-SEM observation
53 RESULTS AND DISCUSSION
531 Fluid Rheological Properties
Drilling fluids are commonly characterized as shear thinning non-Newtonian fluids with
viscosity that decreases with an increasing shear rate (Bourgoyne et al 1991) The drilling fluids
with obvious shear thinning behaviors are more easily pumped downhole and highly desired in
drilling field The shear rate dependence of viscosities of the drilling fluids is shown in Figure
51 The bentonite drilling fluids (BT6) without CNPs exhibited a good shear thinning behavior
With additions of CNPs (CNCs and CNFs) and simultaneous reductions of bentonite the
82
pseudoplastic behavior of the drilling fluids remained This was due to the superior shear
thinning characteristics of CNP suspensions (Li et al 2015a Moon et al 2011) which was
confirmed by the fluids of CNC040 and CNF040 without bentonite (Figure 51A B) Therefore
CNPs could be potential good additives in low solid drilling fluids in which the amount of
bentonite was reduced considering their excellent shear thinning behavior Moreover the
viscosities of the drilling fluids showed a decreased trend with increased additions of CNPs
(Figure 51A B) which was in accord with the changes of apparent viscosities measured by the
industrial rotation viscometer (Table 52) The viscosity drop with increased CNPs and decreased
bentonite contents was caused by the reduced solid content making particles in the drilling fluids
much easier to align under shear stress
Figure 51 Apparent viscosity and shear stress versus shear rates of the drilling fluids
83
The shear rate dependence of shear stress of the drilling fluids is shown in Figure 51C and
51D Different rheological models such as Bingham plastic model power law model and
Herschel-Bulkey model could be used to evaluate the shear stress-shear rate relationships of the
non-Newtonian drilling fluids The Herschel-Bulkey model as a rheological model to describe
non-Newtonian fluid in non-linear way was found to be better for characterizing the non-
Newtonian behavior of drilling fluids (Barry et al 2015) Three parameters including yield
point (o ) consistence coefficient ( K ) and flow behavior index ( n ) were obtained according
to the following equation
n
o K (54)
where and are shear stress and shear rate respectively The yield point the stress that must
be applied to initiate flow was calculated by extrapolating the curve of shear stress against shear
rate to zero-shear condition The consistence coefficient and flow behavior index were obtained
by fitting the shear stress-shear rate curve to the above equation with the 95 confidence bounds
The values of flow index were lower than 1 (Table 52) confirming the shear-thinning behavior
of the drilling fluids The yield point decreased with an increasing CNP content indicating that
lower force was required to start the flow of the drilling fluids but the capacity of cutting
carrying might be compromised The values of yield point measured by the industrial rotation
viscometer showed a similar trend (Table 52) In addition the plastic viscosities and gel strength
of the drilling fluids also showed similar changes to the yield point A decreased plastic
viscosities with increased CNPs were due to the reduced low solid contents in the drilling fluids
which could improve drilling efficiency because of the low viscosity of drilling fluids at the bit
However the lower gel strength could affect the ability of the drilling fluids to suspend drilled
cuttings and weighting material when circulation was ceased As a result a part of bentonite
84
could be replaced by CNPs for producing low solid drilling fluids but it was not practicable to
apply drilling fluids with a very low content (lt3 wt)
Table 52 Rheological properties of the bentonite drilling fluids added with CNPs
Although both CNCs and CNFs exhibited shear thinning behavior and similar trends of
viscosity yield stress and gel strength differences were found between them The shear thinning
behavior decreased as the solid content of the drilling fluids added with CNCs reduced from 614
wt (BT6CNC005) to 139 wt (BT1CNC030) and showed solid content dependence at low
shear rates and relatively little solid content dependence at high rates (Figure 51A) Compared to
Formulations
(cP)
p
( cP )
y
(lb100 sq ft)
Gel Strength
(lb100 sq ft) Herschel-Bulkley Model
10
(s)
10
(min) o (Pa)
K
(Pamiddots) n
BT6 41 28 26 8 26 410 064 059
BT6CNC005 46 29 29 11 33 500 053 062
BT5CNC010 33 21 23 7 21 294 037 063
BT4CNC015 26 17 17 5 15 197 032 062
BT3CNC020 19 13 12 3 8 103 025 062
BT2CNC025 14 8 11 2 4 021 021 061
BT1CNC030 10 8 4 1 2 003 008 071
CNC040 6 5 2 1 2 003 001 097
BT6CNF005 45 30 29 9 29 548 125 051
BT5CNF010 40 26 28 7 23 268 056 060
BT4CNF015 35 23 24 6 18 179 060 057
BT3CNF020 29 18 21 5 11 106 048 057
BT2CNF025 24 15 17 5 8 084 047 055
BT1CNF030 20 12 17 4 6 041 044 053
CNF040 16 9 14 4 6 028 069 044
85
CNC-DF the shear thinning behavior of the fluids incorporated with CNFs presented less solid
content dependence (Figure 51B) Furthermore the values of viscosities of the drilling fluids
with CNCs decreased but not much from BT6CNC005 to BT3CNC020 and a large drop of
viscosity at low shear rates were observed by further adding CNCs and reducing bentonite
contents (BT2CNC025 and BT1CNC030) In contrast viscosities of the drilling fluids with
CNFs still had relatively larger values at very low solid contents compared to CNC-DF In
addition the values of apparent viscosity plastic viscosity yield point and gel strength for the
CNC-DF measured by the industrial rotational viscometer were larger than those for the CNF-
DF especially at very low solid contents (049-234 wt)
Figure 52 TEM images and diameter distributions of the CNCs (A) and CNFs (B)
The differences in rheological properties between CNC and CNF added low solid drilling
fluids can be explained by their distinct structural characteristics CNFs were finer cellulose
fibrils manufactured by mechanical refining of wood or plant fibers and CNCs were produced
by further acid hydrolysis of CNFs CNCs were rod-like or whisker shaped nanoparticles with
an average aspect ratio of 42plusmn13 ((69plusmn23) nm in width and (290plusmn31) nm in length) (Figure
52A) but CNFs were very long and curved fibers with a much higher aspect ratio ((114plusmn49)
nm in width and up to several micrometers in length) (Figure 52B) Since both of them had an
86
average width in nanometer range (1-100 nm) they were defined as nanoparticles CNFs were
considered as reminiscent of elementary fibrils in wood and plant cellulose biosynthesis process
and contained both amorphous and crystalline regions and CNCs were reminiscent of the
crystalline regions within the elementary fibrils (Moon et al 2011) Thus CNCs were more
rigid while CNFs were more flexible Moreover the sulfuric acid treatment introduced sulfate
groups and made surfaces of the resulted CNCs negatively charged It was reported that more
sulfate groups were found on the surface of CNCs compared to CNFs by X-ray photoelectron
spectroscopy (Li et al 2015a) The negatively charged surfaces of CNCs promoted the
formation of stabilized suspensions in which individual CNCs were well dispersed while the
CNFs were highly intertwined This made CNCs in the suspensions much easier to align under
shear than the CNFs Consequently the pure CNC suspension (CNF040) had lower viscosities
compared to CNF040 (Figure 51A B) When CNPs and bentonite were blended in the
suspensions the differences in rheological properties of the CNC-DF and CNF-DF could be
attributed to their different interactions with bentonite and CNPs Bentonite consists of platelet
layers with negatively charged surfaces (Bourgoyne et al 1991 Luckham and Rossi 1999)
Thus the negative charges on the surfaces of CNCs resulted in the generation of repulsive forces
between CNCs and bentonite in the fluid system which could cause their aggregations By
contrast CNFs were produced by mechanical disintegration processes without the involvement
of sulfuric acid and their surfaces were not negatively charged so the strong aggregations were
not expected in the CNFsbentonite fluid system Furthermore the highly entangled CNFs could
hold bentonite particles in the fluids and formed a flexible 3D network This network increased
the resistance to flow of the CNF-DF and larger viscosities shear stress and gel strength than
CNC-DF were observed which became more obvious at higher CNP contents
87
532 Fluid Filtration Properties
Figure 53 Filtration volume versus square root of time for CNC-DF (A) and CNF-DF (B)
The flow of mud filtrate through a filter cake is described by the following Darcyrsquos Law
(Bourgoyne et al 1991)
c
f
h
pA
dt
dV
(55)
where fV t A p ch is the filtrate volume (mL) time (s) permeability (D) cross-
section area (cm2) pressure drop across the filter cake (atm) viscosity (cP) and thickness of
filter cake (cm) respectively The solution to Darcyrsquos Law can be expressed as
tA
f
fpV
sm
scf )1(2 (56)
where scf is the volume fraction of solids in the drilling fluid and smf is the volume fraction of
solids in the filter cake From this equation linear relationships between fluid filtrate loss and
square root of time and linear was expected assuming the remaining parameters were constant
88
This was confirmed by the plots of filtrate volume against the square root of time for the drilling
fluids added with CNPs and the control (Figure 53)
Figure 54 Standard fluid loss and filter cake characteristics of the drilling fluids
The standard water loss (30-min filtrate volume) of the drilling fluids increased slowly
within the CNP concentration range of 0-02 wt but rapidly went up when the CNP
concentration was larger than 02 wt (Figure 54A) This could be explained by further
investigating the characteristics of filter cakes including cake thickness and permeability The
thickness of filter cakes showed a decreased trend with an increasing CNP concentration (Figure
54B) The permeability of the filter cakes was calculated based on Darcyrsquos Law assuming the
constant cross-section area (45 cm2) pressure difference (690 Pa) viscosity of filtrate (1times10-3
Pamiddots) and temperature (25ordmC) No significant changes in the permeability of filter cakes were
observed with varied CNP concentration except for CNF040 (Figure 54D) It should be pointed
89
out that the filtration of CNC040 could not be measured successfully due to combined effects of
the extremely low solid content (040 wt) and small dimensions of CNCs resulting in filtrate
spurting out shortly after the pressure was applied According to the Darcyrsquos Law the fluid loss
was proportional to the permeability but inversely proportional to cake thickness Therefore the
increased fluid loss of the drilling fluids with the increased CNP concentration was mainly due to
the decreased cake thickness especially when the CNP concentration was larger than 02 wt
Figure 55 FE-SEM images of filter cakes formed by the drilling fluids of BT6 (A)
BT1CNC030 (B) BT1CNF030 (C) and CNF040 (D)
Although the filtrate volume of CNC-DF and CNF-DF showed the same trend with
varied concentrations of CNCs or CNFs and there was no obvious difference in the standard
fluid loss between them it was found that their filter cakes had different characteristics The
filter cakes of CNC-DF exhibited lower values of thickness and permeability but higher porosity
compared to CNF-DF (Figure 54) The porosity was calculated by the following equation
90
c
DW
hD
WW2
)(4
(57)
where WW DW D is the porosity of filter cakes weight of wet filter cakes weight of
dried filter cakes density of filtrate and diameter of wet filter cake respectively In addition the
filter cakes of CNC-DF and CNF-DF also showed different surface microstructure observed by
FE-SEM (Figure 55) The filter cake of CNC-DF presented no significantly different surface
morphologies from that of the control and no CNCs were discernible due to their small
dimensions (Figure 55A B) By contrast the CNFs were easily observed on the surfaces of
filter cake from CNF-DF and these fibers bound bentonite particles closely like tree roots in the
soil (Figure 55C) When no bentonite was added the CNF network was more obvious (Figure
55D)
The differences in features of filter cakes between CNC-DF and CNF-DF were attributed
to their different surface morphologies and interactions with bentonite As discussed above the
electrostatic repulsive forces between CNCs and bentonite promoted their aggregation and
CNCs and bentonite dominated regions formed separately (Figure 56) These separations
contributed to the higher porosity of filter cakes formed by CNC-DF compared to CNF-DF
(Figure 54C) The higher porosity of CNC-DF filter cakes did not result in larger permeability
since the pores were confined by the surrounding CNCs and bentonite particles and these pores
were not interconnected sufficiently However the thin and long CNFs bound the dispersed
bentonite particles closely and forming a flexible 3D network resulting in relatively low porosity
of filter cakes (Figure 54C) The 3D network also caused thicker filter cakes as more bentonite
could be retained in the CNFbentonite filter cakes (Figure 54B) This was why the cake
thickness of BT6CNF005 added with only 005 wt CNFs was significantly larger than that of
BT6 and even the cake thickness of BT5CNF010 and BT4CNF015 was also larger although
91
their solid content decreased compared to the control (Figure 54B) Meanwhile it must be
realized that there was still some little separation or pores between the immiscible CNFs and
bentonite Consequently the long CNFs increased the connectivity of the pores and offered paths
for the filtrate to flow through the filter cakes (Figure 55C Figure 56) resulting in larger cake
permeability compared to CNCs The CNF040 was an extreme case that no bentonite existed in
the CNF network and a sudden jump in the permeability of its filter cakes was present (Figure
54D)
Figure 56 A schematic illustrating the formation of filter cakes by the drilling fluids added with
CNCs and CNFs on borehole walls
From the above discussions the abundant and environmental-friendly CNPs proved to be
promising nanomaterials to manufacture low solid drilling fluids The CNPs with very low
concentrations could be added in the drilling fluids to build up a suitable viscosity at relatively
low solid levels and to maintain the desired viscosity throughout the drilling operation Effective
filter cakes could be formed on the wellbore walls with the CNP added low solid drilling fluids
Moreover the nanoparticles have the potential to improve wellbore stability by plugging pores of
subsurface formations such as shale preventing drilling fluid loss into formation and subsurface
fluid intrusion into the wellbore (Sensoy et al 2009 Wilson 2012) However it has to be
92
pointed out that a minimum amount of bentonite is required to maintain an adequate yield point
and form efficient filter cakes with CNPs to prevent large fluid loss The size distributions and
surfaces of CNPs can be tailored to maximize their function as a performance modifier in low
solid drilling fluids Thus the interactions between plate pallets of bentonite and surfaces of
CNPs can be controlled and optimized to improve the rheological properties and filter cakes
characteristics of the low solid drilling fluids made by them This work demonstrates a pathway
for development and applications of renewable and biodegradable nanomaterials in well service
fluids which becomes especially important with increased environmental regulation
54 CONCLUSIONS
The low solid drilling fluids were successfully prepared by substituting CNPs (CNCs and
CNFs) for a part of bentonite in the fluid system Both the CNC-DF and CNF-DF exhibited
similar pseudoplastic behavior due to the excellent shear thinning characteristics of CNP
suspensions Additionally the viscosity yield point and gel strength of the drilling fluids
decreased with additions of CNPs In comparison the CNC-DF fluids had lower values of
viscosity yield point and gel strength than CNF-DF attributed to their distinct structure
characteristics and different interactions with bentonite in the fluid system The small size and
negatively charged surfaces of CNCs caused the generation of repulsive forces with bentonite
promoting the aggregation and separation of CNCs and bentonite In contrast these repulsive
forces were not present in CNFbentonite fluid system and the highly entangled CNFs formed a
flexible 3D network which increased the resistance to flow under shear stress and the larger
viscosity yield point and gel strength were observed On the other hand the filtrate volume of
the drilling fluids increased with an increasing content of CNPs and no significant difference in
standard fluid loss was found between CNC-DF and CNF-DF However the filter cakes of CNC-
93
DF showed lower values of thickness and permeability but higher porosity compared to CNF-
DF The high porosity and low permeability of the filter cakes from CNC-DF were attributed to
isolated pores formed by the aggregation and separation of CNCs and bentonite The flexible 3D
network of CNFs bound more bentonite particles closely resulting thicker filter cakes with lower
porosities Meanwhile the CNFs provided the paths of filtrate flow and increased the pore
connectivity in the filter cakes contributing to its higher permeability The rheological and fluid
filtration properties of CNP added drilling fluids could be further optimized by tailoring the size
distributions and surface functionality of CNPs A new strategy is thus provided to prepare well
service fluids using biopolymer nanoparticles from renewable and biodegradable resources for
oil and gas exploitation
55 REFERENCES
Abdo J Haneef MD 2012 Nano-enhanced drilling fluids pioneering approach to overcome
uncompromising drilling problems J Energ Resour Technol 134 014501
Abdo J Haneef MD 2013 Clay nanoparticles modified drilling fluids for drilling of deep
hydrocarbon wells Appl Clay Sci 86 76-82
Al-Yasiri MS Al-Sallami WT 2015 How the drilling fluids can be made more efficient by
using nanomaterials Am J Nano Res Appl 3 41-45
Amanullah M AlArfaj MK Al-abdullatif ZA 2011 Preliminary test results of nano-based
drilling fluids for oil and gas field application SPEIADC Drilling Conference and
Exhibition Amsterdam
Barry MM Jung Y Lee JK Phuoc TX Chyu MK 2015 Fluid filtration and rheological
properties of nanoparticle additive and intercalated clay hybrid bentonite drilling fluids J
Pet Sci Eng 127 338-346
Baruah B Mishra M Bhattacharjee CR Nihalani MC Mishra SK Baruah SD Phukan
P Goswamee RL 2013 The effect of particle size of clay on the viscosity build up
property of mixed metal hydroxides (MMH) in the low solid-drilling mud compositions
Appl Clay Sci 80-81 169-175
Bourgoyne AT Millheim KK Chenevert ME Young FS (Eds) 1991 Applied Drilling
Engineering first ed Society of Petroleum Engineers Richardson
94
Cheraghian G Hemmati M Masihi M Bazgir S 2013 An experimental investigation of the
enhanced oil recovery and improved performance of drilling fluids using titanium dioxide
and fumed silica nanoparticles J Nanostruct Chem 3 78
Cho MJ Park BD 2011 Tensile and thermal properties of nanocellulose-reinforced poly
(vinyl alcohol) nanocomposites J Ind Eng Chem 17 36-40
Chun SJ Lee SY Doh GH Lee S Kim JH 2011 Preparation of ultrastrength
nanopapers using cellulose nanofibrils J Ind Eng Chem 17 521-526
Fereydouni M Sabbaghi S Saboori R Zeinali S 2012 Effect of polyanionic cellulose
polymer nanoparticles on rheological properties of drilling mud Int J Nanosci
Nanotechnol 8 171-174
Hamed SB Belhadri M 2009 Rheological properties of biopolymers drilling fluids J Pet
Sci Eng 67 84-90
Hermoso J Martinez-Boza F Gallegos C 2015 Influence of aqueous phase volume fraction
organoclay concentration and pressure on invert-emulsion oil muds rheology J Ind Eng
Chem 22 341-349
Jang HY Zhang K Chon BH Choi HJ 2015 Enhanced oil recovery performance and
viscosity characteristics of polysaccharide xanthan gum solution J Ind Eng Chem 21
741-745
Jiang L Yuan L Zheng Q 2009 Research and applications of nanometer bentonite complex
Petrol Drill Tech 37 57-60
Kasiralvalad E 2014 The great potential of nanomaterials in drilling amp drilling fluid
applications Int J Nano Dimens 5 463-471
Kosynkin DV Ceriotti G Wilson KC Lomeda JR Scorsone JT Patel AD Friedheim
JE Tour JM 2011 Graphene oxide as a high-performance fluid-loss-control additive
in water-based drilling fluids ACS Appl Mater Interfaces 4 222-227
Li M Wu Q Song K Lee S Qing Y Wu Y 2015a Cellulose nanoparticles structure-
morphology-rheology relationships ACS Sustain Chem Eng 3 821-832
Li M Wu Q Song K Qing Y Wu Y 2015b Cellulose nanoparticles as modifiers for
rheology and fluid loss in bentonite water-based fluids ACS Appl Mater Interfaces 7
5006-5016
Luckham PF Rossi S 1999 The colloidal and rheological properties of bentonite suspensions
Adv Colloid Interface Sci 82 43-92
Menezes R Marques L Campos L Ferreira H Santana L Neves G 2010 Use of
statistical design to study the influence of CMC on the rheological properties of bentonite
dispersions for water-based drilling fluids Appl Clay Sci 49 13-20
95
Moon RJ Martini A Nairn J Simonsen J Youngblood J 2011 Cellulose nanomaterials
review structure properties and nanocomposites Chem Soc Rev 40 3941-3994
Nasser J Jesil A Mohiuddin T Al Ruqeshi M Devi G Mohataram S 2013
Experimental investigation of drilling fluid performance as nanoparticles World J Nano
Sci Eng 3 57-61
Qu Y Sun J Su Y 2007 Study on properties of nanocomposite poly (styrene-b-acrylamide)
Petrol Drill Tech 35 50-52
Sayyadnejad M Ghaffarian H Saeidi M 2008 Removal of hydrogen sulfide by zinc oxide
nanoparticles in drilling fluid Int J Environ Sci Tech 5 565-569
Sensoy T Chenevert ME Sharma MM 2009 Minimizing water invasion in shales using
nanoparticles SPE Annual Technical Conference and Exhibition New Orleans
Sharma MM Chenevert ME Guo Q Ji L Friedheim J Zhang R 2012 A new family of
nanoparticle based drilling fluids SPE Annual Technical Conference and Exhibition San
Antonio
Wilson A 2012 Nanoparticle use in drilling fluids can effectively reduce permeability in shale
J Pet Technol 64 87-90
96
CHAPTER 6 NOVEL BIOPOLYMER WATER-BASED DRILLING FLUIDS FOR
ENHANCING DRILLING PERFORMANCE
61 INTRODUCTION
Drilling fluids have to perform essential tasks including controlling formation pressures
minimizing formation damage maintaining wellbore stability suspending and carrying out
cuttings and cooling as well as lubricating drilling bit (Bourgoyne et al 1991 Gonzaacutelez et al
2011) Successful drilling operations are highly dependent on the selection of drilling fluids with
desirable properties which are determined by their rheological and fluid filtration properties to a
large extent Lack in required performance of drilling fluids may cause severe drilling problems
such as differential sticking lost circulation wellbore instability and formation damage These
problems become more serious in deep drilling due to deteriorations of drilling fluid properties
resulted from considerable increase in temperature and pressure (Abdo and Haneef 2013) The
flocculation of bentonite at high temperature and high pressure (HTHP) conditions is one of
main factors leading to the malfunctions of drilling fluids (Abdo et al 2014) Therefore it is
highly desirable to find various additives to compensate for bentonite deficiencies
Recently nanotechnology has opened the doorway to the development of a new generation
of fluids defined as smart fluids in which nanoparticles are added for improvedenhanced drilling
and oil recovery (Abdo and Haneef 2013 Farbod et al 2015 Sun et al 2015) Due to the
unique characteristics like small dimensions and high surface area to volume ratio of
nanoparticles they attracted increasing attention as additives in drilling fluids by enhancing
drilling performance including eliminating differential pipe sticking lowering the friction
maintaining borehole stability reducing fluid loss improving cutting removal ability
intensifying mud cake quality decreasing the permeability of shale formation reducing
formation damage and enhancing oil and gas recovery (Kasiralvalad 2014) In order to obtain
97
these performance improvements various nano additives in drilling fluids were studied
Graphene oxide presented good performance as a filtration additive in water-based drilling fluids
at a very low concentration (02 wt) giving an average API fluid loss of 61 mL and a filter
cake of 20 μm thick compared to an fluid loss of 72 mL and a filter cake of 290 μm thick from a
standard fluid in the oil industry (Kosynkin et al 2011) Carbon nanotubes were dispersed in
drilling fluids to enhance the thermal conductivity and filtration properties (Fazelabdolabadi et
al 2015) A core-shell structured nano silica composite was prepared and added into drilling
fluids which showed improved rheology filtration lubricity and pore plugging ability (Mao et
al 2015) In addition a variety of nano metallic oxide like CuO ZnO and TiO2 was also
investigated as an additive to improve performance of drilling fluids especially at HTHT
conditions (Cheraghian et al 2013 Ponmani et al 2015 William et al 2014) Although these
nanoparticles as additives in drilling fluids bring superior properties most of they are expensive
to prepare nonrenewable and nonbiodegradable With more stringent control of pollution safe
risk and cost it is crucial to apply more environmental friendly and cost-effective nanoparticle
as additives in drilling fluids
Nanocellulose as an earth abundant biodegradable and renewable biopolymer
nanomaterial receives great attention due to its excellent characteristics such as nanoscale
dimensions high surface area to volume ratio high mechanical strengthweight performance
and large flexibility (Habibi et al 2010 Hartmann et al 2016) It is extracted from various
cellulosic resources like wood cotton chitin by mechanical treatment acid hydrolysis or
enzymatic hydrolysis Based on the morphology of nanocellulose it can be categorized by
cellulose nanocrystals (CNCs) and cellulose nanofibers (CNFs) CNCs show rod-like shape with
several nanometers in width and 50-500 nm in length while CNFs exhibit highly entangled
98
network and larger aspect ratio with 4-20 nm in width and several micrometers in length (Moon
et al 2011) The differences in the size and shape between them may lead to diverse interface
effects which play an essential role in structure and properties of materials in study The
versatility of nanocellulose makes room for consideration in a wide range of revolutionary
applications It came into view of oilfield researchers and captured great interest judged by the
related patents issued in the past several years CNCs was added in well fluids to increase the
viscosity of water-based well service fluids such as kill pill fracturing fluid and gravel packing
fluid and improve the strength of cement (Rincon-Torres and Hall 2013) CNCs from chitin was
used as additives in cement and wellbore fluids to inhibit corrosion in pipelines and downhole
tools (Hall 2014) Additionally CNCs were added in a variety of well fluids such as fracturing
fluids stimulation fluids completion fluids conformance control fluids and drilling fluids for
treating a subterranean formation by replacing conventional polymers in these fluids (Lafitte et
al 2015) The adding of nanocellulose as environmental friendly materials could reduce
potential harmful effects on both drilling personals and the environment These previous patents
open the door to apply nanocellulose in drilling fluids but further systematic work is required
Specifically the size effects of nanocellulose on rheological and filtration properties of drilling
fluids and characteristics of formed filter cakes especially under HTHP conditions are essential
to fully in-depth understand functions of nanocellulose in the fluids
In this study a novel low-cost and ecologically friendly water-based drilling fluid
containing nanocellulose bentonite and other additives including sodium hydroxide lignite
polyanionic cellulose (PAC) and Rev dust were developed for enhancing drilling performance
The effect of nanocellulose morphology and concentrations on the rheological and fluid filtration
properties of the drilling fluids were investigated The fluid loss of the drilling fluids under low
99
temperature and low pressure (LTLP) and HTHP was measured and compared associated to the
distinct microstructure of nanocellulose and their interactions with bentonite in the fluids
Special emphasis was placed on characteristics of formed filter cakes to demonstrate the
effectiveness and performance of nanocellulose in the drilling fluids
62 MATERIALS AND METHODS
621 Materials
Sulfuric acid and sodium hydroxide (ACS reagent) was purchased from Sigma-Aldrich
Corp (St Louis MO USA) Wyoming sodium bentonite was provided by Baroid Industrial
Drilling Products Inc (Houston TX USA) Lignite was supplied from Halliburton (Houston
TX USA) PAC was purchased from Halliburton Company (Houston TX USA) Rev dust was
provided by Turbo-Chem International Inc (Dr Scott LA USA) Two types of nanocellulose
were used in this study One is CNFs (Celish KY 100-S grade 25 wt solid content) supplied by
Daicel Chemical Industries Ltd (Tokyo Japan) The other one is CNCs produced by breaking
down the CNFs using acid hydrolysis Specifically the sulfuric acid (64 wt) hydrolysis of the
CNFs at 45 ˚C for 1 h followed by further mechanical separation by a high-pressure
homogenizer (Microfluidizer M-110P Microfluidics Corp Newton MA USA) were applied to
produce stable water suspensions of CNCs with an average concentration of 15 wt The
surface morphologies of CNCs and CNFs were observed under a transmission electron
microscope (TEM JEOL 100 CX Peabody MA USA)
622 Formations of Drilling Fluids
Water-based drilling fluids consisting of bentonite nanocellulose and other additives
including sodium hydroxide lignite PAC and rev dust were prepared to be as close as
commercial drilling fluids under use in drilling fields All the drilling fluids were prepared in a
100
standard 350 mL laboratory barrel The concentrations of these components in the water-based
drilling fluids were listed in Table 61 The contents of sodium hydroxide lignite PAC and Rev
Dust were constant for each experiment and they were used as a pH control agent deflocculant
filtration control agent and substance of simulating drilled solids respectively Bentonite and
nanocellulose varied from 10 g to 20 g and from 035 to 350 g in 350 mL water respectively
For unit conversions 1 g substance in 350 mL water is equal to 1 lbbbl in field units
Table 61 Formulations of the drilling fluids
Formulations BT a
(g)
CN b
(g )
NaOH
(g)
Lignite
(g)
PAC
(g)
Rev Dust
(g)
BT20 20 0 025 1 05 5
BT10 10 0 025 1 05 5
BT10CN035 10 035 025 1 05 5
BT10CN105 10 105 025 1 05 5
BT10CN175 10 175 025 1 05 5
BT10CN245 10 245 025 1 05 5
BT10CN350 10 350 025 1 05 5
a Bentonite b Nanocellulose including CNCs and CNFs
623 Rheological Measurements
Rheological properties of the drilling fluids were measured by an industrial rotating
viscometer (NL Baroid NL Industries Inc Houston TX) The apparent viscosity ( ) plastic
viscosity (p ) and yield point (
y ) were calculated using the following formulas according to
American Petroleum Institute (API) recommended standard procedure of testing water-based
drilling fluids
2600 (61)
300600 p (62)
101
py 300 (63)
where 300 and 600 were dial readings from the viscometer at a rotating speed of 300 and 600
rpm respectively To reach steady state conditions the drilling fluids were stirred for 10 min
prior to rheological measurements In addition the gel strength including Gelin and Gel10min of
the drilling fluids was obtained by recording the maximum dial readings at 3 rpm after the fluid
was stirred at 600 rpm for 1 min followed by maintaining static for 10 s and 10 min respectively
624 Fluid Filtration Testing
The LTLP filtration testing was conducted using a standard filter press with a regulated
CO2 pressuring system and standard Fann filter papers (Fann Instrument Co Houston TX
USA) The measurements were completed at the pressure of (100plusmn5) psi ((39plusmn035) bar) and the
temperature of 25 ˚C according to American Petroleum Institute (API) recommended standard
procedure of testing water-based drilling fluids The mass of the filtrate against time was
measured by a digital balance and then the volume of filtrate was calculated by its mass and
density Thus the API fluid loss versus time was determined After the measurements the filter
cakes were removed from the cells and their thickness was recorded Subsequently these filter
cakes were freeze-dried and coated with a thin layer of gold for observing their surface
morphologies by a field emission scanning electron microscope (FE-SEM FEI QuantaTM 3D
FEG Dual Beam SEMFIB Hillsboro OR USA)
The HTHP filtration testing was completed by a permeability plugging apparatus (PPA)
and ceramic discs (Fann Instrument Co Houston TX USA) This equipment was designed to
simulate field well conditions and these discs closely simulated the structure of formation
providing a more authentic representation of downhole filtration A 300 mL sample of the
drilling fluids was loaded into the PPA cell and a ceramic disc with an average pore throat
102
diameter of 20 μm was then inserted The measurements were conducted at the pressure of 1000
psi and the temperature of 200 ˚F The spurt loss (VS) was recorded at the time when the pressure
initially reached 1000 psi The API fluid loss (V) was calculated by the following equation
)2( 30VVV S (64)
where V30 was the fluid loss at 30 min At the end of testing thickness of the filter cakes
deposited on the ceramic disks was recorded Subsequently the filter cakes were removed and
the ceramic disks were dried and coated with a thin layer of gold prior to FE-SEM observation
63 RESULTS AND DISCUSSION
631 Structure of Nanocellulose
Figure 61 TEM photographs and diameter distributions (inserted plots) of the CNCs (A) and
CNFs (B)
The CNCs showed needle-like or whisker shaped morphology (Figure 61A) while the
CNFs exhibited highly entangled network consisting of long nanofibers (Figure 61B) The
CNCs have an average width of (82plusmn23) nm and length of (3216plusmn347) nm giving an aspect
ratio of 39plusmn15 The average diameter of CNFs was measured to be (186plusmn69) nm and the length
was much large in micrometers compared to CNCs Accordingly the CNFs had wider
distribution of diameters and higher aspect ratio than CNCs resulting from the aggregations and
large length of CNFs In addition it was worth mentioning that the sulfuric acid hydrolysis
103
introduced negatively charged sulfate groups onto the surface of CNCs confirmed by the zeta
potential and X-ray photoelectron spectroscopy analysis in our previous work (Li et al 2015)
These sulfate groups would resulted in more stabilized suspensions with individual CNCs well
dispersed in them compared to the CNFs without charged surfaces (Habibi et al 2010) Due to
these structural differences in dimension shape and surface characteristics between the CNCs
and CNFs it was expected that they would produce different effects on rheological and fluid
filtration properties of the drilling fluids
632 Rheological Properties
Figure 62 Viscosity and shear stress as functions of shear rates for the drilling fluids with
different concentrations of nanocellulose
Drilling fluids are commonly considered as non-Newtonian fluids with viscosity decreases
with increased shear rates (Bourgoyne et al 1991) High viscosity of drilling fluids at low rates
104
was required to suspend drilled cuttings and carry them out of the wellbore and low viscosity of
drilling fluids at high rates made it easier for them to flow into downhole Consequently various
additives were used to improve the rheological performance of drilling fluids (Abdo and Haneef
2013 Hamed and Belhadri 2009 Mahto and Sharma 2004) The nanocellulose was thus added
in drilling fluids due to its excellent rheological property besides its abundance and
environmental benefits It was found that the water suspensions of nanocellulose showed obvious
shear thinning behavior with high viscosity at low shear rates and low viscosity at high shear
rates (Moon et al 2011) This phenomenon increased as concentration was raised and showed
concentration dependence at low rates and reduced concentration dependence at high rates (Li et
al 2015 Moon et al 2011) The effects of nanocellulose concentration on the rheological
properties of the drilling fluids were shown in Figure 62 and Table 62 The control sample
without nanocellulose exhibited significant shear thinning behavior and its calculated values of
apparent viscosity and plastic viscosity were 775 cP and 70 cP respectively When the
bentonite content was reduced by half from 20 lbbbl to 10 lbbbl the apparent viscosity and
plastic viscosity of the fluids largely decreased with the values of 350 cP and 30 cP
respectively (Table 62) Maintaining the content of bentonite at 10 lbbbl in the fluids
nanocellulose was added with its concentration varied from 035 to 350 lbbbl It was seen that
the drilling fluids added with CNCs or CNFs still presented a marked shear thinning behavior
similar to the control (Figure 62) confirming the non-Newtonian fluid properties of
nanocellulose suspensions Meanwhile the viscosity went up with increased concentrations of
nanocellulose in the fluids When the content of nanocellulose increased to 105 lbbbl the
apparent viscosity and plastic viscosity of the fluids added with CNCs were 675 cP and 60 cP
and the corresponding values for CNFs were 875 cP and 65 cP which more or less reached the
105
level of the control By further increasing the concentration of nanocellulose the viscosity yield
stress and gel strength of the fluids continued to rise Here it was found that decreasing the
content of bentonite and adding a small amount of nanocellulose the rheological performance of
the drilling fluids maintained and even be improved This would be extremely beneficial because
of the reduced solid content in the drilling fluids which was preferred for faster drilling rate
decreased cost in solid control and fluid maintenance reduced formation damage and improved
hydraulics (Mahto and Sharma 2004)
Table 62 Rheological properties of the drilling fluids with different contents of nanocellulose
Formulations
(cP)
p
( cP )
y
(lb100 sq ft)
Gel Strength
(lb100 sq ft)
Gelin Gel10min
BT20 775 70 15 16 23
BT10 350 30 10 10 10
BT10CNC035 450 40 10 10 12
BT10CNC105 675 60 15 25 90
BT10CNC175 965 68 57 20 127
BT10CNC245 1425 90 105 40 150
BT10CNC350 2075 115 185 84 231
BT10CNF035 450 40 10 10 15
BT10CNF105 875 65 45 20 25
BT10CNF175 1305 76 109 23 24
BT10CNF245 2195 103 233 50 60
BT10CNF350 3405 124 473 90 95
The morphologies of nanocellulose played an essential role in the rheological properties of
the drilling fluids When the lowest amount (035 lbbbl) of CNCs or CNFs was added they had
almost same values of apparent viscosity plastic viscosity yield point and gel strength (Table
106
62) As the content of nanocellulose was above 035 lbbbl the rheological values (excluding
Gel10min) of the fluids with CNCs were lower than those of the fluids with CNFs and the
differences between them became much larger with increased concentration of nanocellulose
For instance at the nanocellulose concentration of 350 lbbbl the fluids with CNCs had
apparent viscosity plastic viscosity yield point and initial gel strength values of 2075 cP 115
cP 185 lb100 sq ft and 84 lb100 sq ft respectively whereas the corresponding values for the
fluids with CNFs were 3405 cP 124 cP 473 lb100 sq ft and 90 lb100 sq ft respectively
These differences were attributed to the distinct structure between CNCs and CNFs The smaller
size and well dispersion of the CNCs made them much easier to flow in the fluids under shear
stress (Li et al 2015) By contrast the long fibers of CNFs formed a highly entangled network
where the platelets of bentonite resided and this system was much difficult to flow under the
same shear stress In addition the Gelin of the fluids with CNCs was slightly lower than that of
the fluids with CNFs but the Gel10min reversed The BT10CNC350 had a Gel10min value of 231
lb100 sq ft which was much larger than 95 lb100 sq ft for the BT10CNF350 (Table 62) This
was due to the stronger hydrogen bonding properties of CNCs compared to CNFs The surfaces
of nanocellulose had hydroxyl groups which could form hydrogen bonding between these
nanoparticles (Moon et al 2011) Compared to CNFs CNCs had a higher specific surface area
because of their smaller dimensions resulting in a larger number of hydroxyl groups available to
form more hydrogen bonds Accordingly a stronger hydrogen bonding network was expected in
the fluids with CNCs making them much harder to flow However it took some time to build an
effective hydrogen bonding network among CNCs in the fluids The formed network was very
weak within a very short time (10 seconds in this study) after a high speed of shear (600 rpm or
1022 s-1) At this time the gel strength (Gelin) of the fluids with CNCs was still lower compared
107
to the fluids with CNFs Giving a longer time (10 min) the stronger network with a larger
number of hydrogen bonds was established so much higher shear stress was required to initiate
the flow of the fluids with CNCs This kind of system was not built due to the limited hydroxyl
groups of CNFs and larger dimensions leading to the lower Gel10min values of the fluids with
CNFs (Figure 63)
Figure 63 Schematic illustrating the formations of hydrogen bonding among CNCs and CNFs in
the fluids
633 Fluid Filtration Under LTLP
A preferred drilling fluid should have desired filtration properties such as a reasonable
range of fluid loss as well as thin and dense filter cakes formed on the walls of wellbores which
could prevent fluid loss circulation differential sticking and even wellbore collapse (Bourgoyne
et al 1991) In Figure 64 the filtration volume of the drilling fluids under LTLP conditions
against the square root of time was shown and linear relationships were observed This could be
explained by Darcyrsquos Law which was commonly used to describe the flow of drilling fluids
filtrate through the filter cakes (Barry et al 2015 Bourgoyne et al 1991) The linear
relationship between filtrate volume and square root of time was expected according to the
solution to Darcyrsquos Law
108
tA
f
fpV
sm
scf )1(2 (65)
where fV t A p scf smf is filtrate volume (mL) time (s) permeability (D) cross-
section area (cm2) of filter cakes pressure drop across filter cakes (atm) viscosity (cP) of filtrate
volume fraction of solids in drilling fluids and volume fraction of solids in filter cakes The
control (BT20) had a fluid loss of 1247 mL and the value increased to 1536 mL when the
bentonite content decreased to 10 lbbbl (Table 63) After the nanocellulose was added the fluid
loss was slightly larger than BT20 but not obviously different from BT10 with varied values in
the small ranges of 1369-1578 mL for the fluids with CNCs and 1632-1752 mL for the fluids
with CNFs respectively This indicated that the concentration of nanocellulose didnrsquot have a
significant effect on the filtrate volume of the drilling fluids under LTLP conditions
Additionally it was noticed that the fluid loss of the fluids with CNFs was a little higher than
that of the fluids with CNCs which would be explained by further investigating the formed filter
cakes
Figure 64 Filtration volume versus square root of time for the drilling fluids under LTLP
conditions
109
Table 63 The API fluid loss thickness and permeability of filter cakes for the drilling fluids
under LTLP conditions
Formulations Vf
(mL)
hc
(cm )
k
(μD)
khc
(μDcm)
BT20 1247 013 232 178
BT10 1536 010 217 217
BT10CNC035 1369 010 194 194
BT10CNC105 1578 010 255 255
BT10CNC175 1473 011 232 211
BT10CNC245 1534 016 346 216
BT10CNC350 1446 027 546 202
BT10CNF035 1632 010 231 231
BT10CNF105 1655 011 263 239
BT10CNF175 1679 016 361 226
BT10CNF245 1752 022 526 239
BT10CNF350 1735 032 745 233
The characteristics of filter cakes were shown in Table 63 and Figure 65 The thickness of
filter cakes for BT20 and BT10 was 013 cm and 010 cm respectively When a small content
(lt175 lbbbl for CNCs and lt105 lbbbl for CNCs) of nanocellulose was added into the fluids
the thickness of filter cakes almost unchanged within the values of 010-011 cm As more
nanocellulose was used the thickness of filter cakes increased quickly and reached to 027 cm
for BT10CNC350 and 032 cm for BT10CNF350 The similar trend was found for the
permeability of the filter cakes calculated by the following equation
c
f
h
pA
dt
dV
(66)
where ch is the thickness of filter cake (cm) To calculated the permeability A p and
were assumed to be constant with the values of 45 cm2 690 Pa and 1times10-3 Pamiddots respectively
110
The increased thickness and permeability of filter cakes with larger amount of nanocellulose
(gt175 lbbbl for CNCs and gt105 lbbbl for CNFs) resulted from more loose structure of cakes
caused by the added nanofibers especially for CNFs (Figure 65) These nanofibers and
bentonite were not miscible and the interfaces between them could offer paths for the filtrate to
flow through the filter cakes and enhanced the connectivity of pores in the filter cakes This
phenomenon became more obvious with increased concentration of nanocellulose and larger
nanofibers resulting in relatively larger permeability of filter cakes with CNFs compared to
CNCs In addition filtrate volume was proportional to permeability but inversely proportional to
thickness of filter cakes according to the above equation Then the ratio of permeability to cake
thickness was calculated and found to fit well with the values of filtrate volume (Table 63)
Consequently the slightly higher fluid loss of the drilling fluids with CNFs compared to the
fluids added by CNCs was contributed by both the increased permeability and thickness of filter
cakes but the former made a bigger one than the later
Figure 65 Surface and cross sectional FE-SEM images of the filter cakes for BT20 (A and D)
BT10CNC350 (B and E) and BT10CNF350 (C and F) under LTLP conditions (A B and C
Cross section morphology D E and F Surface morphology)
111
634 Fluid Filtration Under HTHP
Figure 66 The API fluid loss and cake thickness of the drilling fluids under HTHP conditions
The API fluid loss and cake thickness of the drilling fluids under HTHP conditions were
shown in Figure 66 The control (BT20) had a filtrate volume of 50 mL at the end of 30 min
testing time When the bentonite content decreased by half the filtrate spurted out quickly and
continuously and the applied pressure could not go up to 1000 psi making the measurement of
fluid loss for BT10 unattainable This indicated that 10 lbbbl of bentonite in the fluids was not
enough to plug the pores (diameter 20 μm) of the ceramic disks in this study However this
situation was avoided by adding nanocellulose into the drilling fluids with 10 lbbbl of bentonite
The fluid loss decreased with increased concentrations of nanocellulose As the CNFs were
above 105 lbbbl the filtrate volume of the fluids was even lower than that of the control sample
with values ranging from 36-47 mL depending on the amount of CNFs In addition the fluids
with CNFs performed much better than those with CNCs although the former had a little higher
thickness of filter cakes than the later The differences in filtrate volume between the fluids
added with CNCs and CNFs were related to their different pore plugging ability under HTHP
conditions
112
Figure 67 Surface and cross sectional FE-SEM images of the ceramic disks for BT20 (A and D)
BT10CNC350 (B and E) and BT10CNF350 (C and F) under HTHP conditions (A B and C
Cross section morphology D E and F Surface morphology)
The penetration of the drilling fluids into the porous ceramic disk was shown in Figure 67
It was seen that the solids mainly entered into the surface of the disks with a depth of 100-300
μm Compared to BT20 the fluids added with nanocellulose had a lower penetration depth due
to the reduced solid contents in the drilling fluids The fluids with CNCs could not seal the pores
in the disks completely because of their very small dimensions On the contrary the fluids with
CNFs plugged the pores more efficiently with their long entangled fibers contributing to the
lower fluid loss of the drilling fluids with CNFs Therefore a decreased amount of bentonite
from 20 lbbbl to 10 lbbbl with addition of a small fraction of CNFs (105-350 lbbbl) could
reduce the fluid loss and formation damage with a less penetration depth Additionally it was
worth mentioning that the effect of nanocellulose on pore plugging ability was dependent on the
size of itself and pores of disks Therefore the size of nanocellulose could be tuned by changing
113
the preparation conditions such as concentrations of sulfuric acid and time of acid hydrolysis to
maximize the plugging capability for subsurface formations with different pore diameters
64 CONCLUSIONS
The novel low cost ecologically friendly and high performance water-based drilling fluids
were successfully fabricated by replacing half of bentonite in traditional fluids with earth
abundant nanocellulose The added nanocellulose played an essential role in improving the
rheological and fluid filtration properties of the drilling fluids The fluids with nanocellulose
showed similar non-Newtonian fluid behavior to the control due to the excellent shear thinning
properties of water suspensions of nanocellulose The viscosity yield point and gel strength of
the fluids increased with an increasing concentration of nanocellulose The fluids with CNCs
were easier to flow due to their small dimensions and well dispersions than the fluids added by
CNFs having long and highly entangled nanofibers resulting in lower values in viscosity yield
point and initial gel strength for the former compared to the later The high 10-min gel strength
of the fluids with CNCs was attributed to the strong hydrogen bonding network formed among
CNCs For filtration properties the fluid loss of the drilling fluids added with nanocellulose was
larger than the control under LTLP conditions due to the enhanced connectivity of pores in the
filter cakes by the nanocellulose However the nanocellulose performed much better under
HTHP conditions especially the CNFs The long and highly intertwined CNFs plugged the pores
in the ceramic disks efficiently leading to lower fluid loss even than the control when the
content of CNFs was above 105 lbbbl Furthermore the dimensions of nanocellulse could be
controlled to maximize the plugging effect of subsurface formations with different pore sizes
Therefore a novel pathway was provided to develop novel renewable biopolymer additives in
114
water-based drilling fluids with enhanced performance and advantages of low cost and
ecologically friendly
65 REFERENCES
Abdo J Haneef MD 2013 Clay nanoparticles modified drilling fluids for drilling of deep
hydrocarbon wells Appl Clay Sci 86 76-82
Abdo J Zaier R Hassan E AL‐Sharji H Al‐Shabibi A 2014 ZnOndashclay nanocomposites
for enhance drilling at HTHP conditions Surf Interface Anal 46 970-974
Barry MM Jung Y Lee JK Phuoc TX Chyu MK 2015 Fluid filtration and rheological
properties of nanoparticle additive and intercalated clay hybrid bentonite drilling fluids J
Pet Sci Eng 127 338-346
Bourgoyne AT Millheim KK Chenevert ME Young FS (Eds) 1991 Applied Drilling
Engineering first ed Society of Petroleum Engineers Richardson
Cheraghian G Hemmati M Masihi M Bazgir S 2013 An experimental investigation of the
enhanced oil recovery and improved performance of drilling fluids using titanium dioxide
and fumed silica nanoparticles J Nanostruct Chem 3 78
Farbod M Kouhpeymani asl R Noghreh abadi AR 2015 Morphology dependence of
thermal and rheological properties of oil-based nanofluids of CuO nanostructures
Colloids Surf A 474 71-75
Fazelabdolabadi B Khodadadi AA Sedaghatzadeh M 2015 Thermal and rheological
properties improvement of drilling fluids using functionalized carbon nanotubes Appl
Nanosci 5 651-659
Gonzaacutelez J Quintero F Arellano J Maacuterquez R Saacutenchez C Perniacutea D 2011 Effects of
interactions between solids and surfactants on the tribological properties of water-based
drilling fluids Colloids Surf A 391 216-223
Habibi Y Lucia LA Rojas OJ 2010 Cellulose nanocrystals chemistry self-assembly and
applications Chem Rev 110 3479-3500
Hall LJ 2014 Chitin nanocrystal containing wellbore fluids United States Patent US
20140238677 A1
Hamed SB Belhadri M 2009 Rheological properties of biopolymers drilling fluids J Pet
Sci Eng 67 84-90
Hartmann R Sirviouml JA Sliz R Laitinen O Liimatainen H Aumlmmaumllauml A Fabritius T
Illikainen M 2016 Interactions between aminated cellulose nanocrystals and quartz
Adsorption and wettability studies Colloids Surf A 489 207-215
115
Kasiralvalad E 2014 The great potential of nanomaterials in drilling amp drilling fluid
applications Int J Nano Dimens 5 463-471
Kosynkin DV Ceriotti G Wilson KC Lomeda JR Scorsone JT Patel AD Friedheim
JE Tour JM 2011 Graphene oxide as a high-performance fluid-loss-control additive
in water-based drilling fluids ACS Appl Mater Interfaces 4 222-227
Lafitte V Lee JC James SG Del Valle JF Yakovlev AV Panga MK Szabo GH
2015 Fluids and methods including nanocellulose United States Patent US 20150072902
A1
Li M Wu Q Song K Lee S Qing Y Wu Y 2015 Cellulose nanoparticles structure-
morphology-rheology relationships ACS Sustain Chem Eng 3 821-832
Mahto V Sharma V 2004 Rheological study of a water based oil well drilling fluid J Pet
Sci Eng 45 123-128
Mao H Qiu Z Shen Z Huang W Zhong H Dai W 2015 Novel hydrophobic associated
polymer based nano-silica composite with core-shell structure for intelligent drilling fluid
under ultra-high temperature and ultra-high pressure Prog Nat Sci Mater Int 25 90-93
Moon RJ Martini A Nairn J Simonsen J Youngblood J 2011 Cellulose nanomaterials
review structure properties and nanocomposites Chem Soc Rev 40 3941-3994
Ponmani S Nagarajan R Sangwai JS 2015 Effect of nanofluids of CuO and ZnO in
polyethylene glycol and polyvinylpyrrolidone on the thermal electrical and filtration-
loss properties of water-based drilling fluids SPE J
Rincon-Torres MT Hall LJ 2013 Cellulose nanowhiskers in well services United States
Patent US 20130196883 A1
Sun F Lin M Dong Z Zhang J Wang C Wang S Song F 2015 Nanosilica-induced
high mechanical strength of nanocomposite hydrogel for killing fluids J Colloid
Interface Sci 458 45-52
William JKM Ponmani S Samuel R Nagarajan R Sangwai JS 2014 Effect of CuO
and ZnO nanofluids in xanthan gum on thermal electrical and high pressure rheology of
water-based drilling fluids J Pet Sci Eng 117 15-27
116
CHAPTER 7 OVERALL CONCLUSIONS
71 MAIN CONCLUSIONS
In this study biomass resources (tar and nanocellulose) were utilized to prepare low-cost
nanocomposite and drilling fluids On one hand tar from biomss gasification was recycled for
fabricating low-cost antimicrobial nanofiber by electrospinning On the other hand
nanocellulose was used as a ldquogreenrdquo additive in drilling fluids for improving rheological and
fluid filtration properties The conclusions of this study are as follows
The tar was a complex mixture mainly composed of highly branched PAHs furans
aliphatics and esters as indicated by the GC-MS and FTIR spectroscopy The elemental analysis
showed that biomass tar with higher HC and OC was more oxygenated and less aromatic than
fossil pitches implying that the tar was more reactive The complex composition of the tar led to
a broad thermal decomposition temperature range The tar decomposed at a low temperature
(183-252 degC depending on the heating rates) compared with biomass feedstock due to the low
molecular mass components in the tar produced by gasification The thermal kinetics of the tar
indicated that single reaction mechanism can be applied in low conversion rates and the reaction
mechanism changed in higher conversions caused by the complex reactions in decomposition
process of biomass tar
The tar and PAN was blended and electrospun into nanofibers The contents of tar in the
blends significantly affected the morphology thermal properties pore characteristics and
antimicrobial activity of the resulting electrospun nanofibers Continuous nanofibers were
produced at the tar content levels up to 100 wt based on the weight of PAN The tarPAN
nanofibers exhibited increased average diameters and surface roughness with increasing content
of tar ATR-FTIR spectroscopy revealed that the tar was successfully incorporated into the
117
tarPAN nanofibers The tarPAN nanofibers were less thermally stable than the neat PAN
nanofibers due to the relatively low onset temperature of degradation of biomass tar and their
thermal stability decreased with increasing amount of tar However the tarPAN nanofibers had
a comparable amount of residual weight (35) compared to PAN (38) at 600 degC suggesting
that tars can be an attracting precursor for manufacturing carbon nanofibers Furthermore the
addition of tar facilitated catalytically the cyclization of PAN which is helpful for stabilization
processes in the manufacture of PAN-based carbon fibers The tarPAN nanofibers exhibited
increased antimicrobial capacity against S aureus and E coli with increased tar content
Continuous microporous CNFs from biomass tarPANsilver hybrids with antimicrobial
capabilities were fabricated through electrospinning and subsequent thermal stabilization and
carbonization Silver nitrate was reduced to silver nanoparticles which conferred the
antimicrobial abilities to the as-spun nanofibers and CNFs The as-spun nanofibers showed
larger average diameters with increased tar loading levels due to larger concentrations of tar and
PAN in the suspensions However the increased contents of tar made the fiber surface rougher
and increased fiber diameter variations resulted from tar aggregations and phase separations
between tar and PAN In addition the incorporation of tar reduced the thermal stability of the as-
spun nanofibers due to relatively lower onset degradation temperatures of the tar components
The tar also slowed down the cyclization reactions of PAN by its ionizable groups which was
helpful for subsequent stabilization processes The as-spun nanofibers exhibited mesopore
characteristics while micropores dominated in the CNFs due to the combined effects of thermal
decompositions of some tar constituents and phase separations of tar and PAN The large
specific surface areas and the volumes of pores of the as-spun nanofibers and CNFs made the
118
silver nanoparticles more easily diffuse into the broth endowing their excellent antimicrobial
abilities
In addition the low solid drilling fluids were successfully prepared by substituting
nanocelulose (CNCs and CNFs) for a part of bentonite in the fluid system Both the CNC-DF
and CNF-DF exhibited similar pseudoplastic behavior due to the excellent shear thinning
characteristics of CNP suspensions Additionally the viscosity yield point and gel strength of
the drilling fluids decreased with additions of CNPs In comparison the CNC-DF fluids had
lower values of viscosity yield point and gel strength than CNF-DF attributed to their distinct
structure characteristics and different interactions with bentonite in the fluid system On the other
hand the filtrate volume of the drilling fluids increased with an increasing content of CNPs and
no significant difference in standard fluid loss was found between CNC-DF and CNF-DF
However the filter cakes of CNC-DF showed lower values of thickness and permeability but
higher porosity compared to CNF-DF The high porosity and low permeability of the filter cakes
from CNC-DF were attributed to isolated pores formed by the aggregation and separation of
CNCs and bentonite The flexible 3D network of CNFs bound more bentonite particles closely
resulting thicker filter cakes with lower porosities Meanwhile the CNFs provided the paths of
filtrate flow and increased the pore connectivity in the filter cakes contributing to its higher
permeability The rheological and fluid filtration properties of CNP added drilling fluids could be
further optimized by tailoring the size distributions and surface functionality of CNPs
Finally nanocellulose was added into the water-based drilling fluids composed of reduced
amount of bentonite as well as other additives which simulated the fluids under field use The
added nanocellulose played an essential role in improving the rheological and fluid filtration
properties of the drilling fluids The fluids with nanocellulose showed similar non-Newtonian
119
fluid behavior to the control due to the excellent shear thinning properties of water suspensions
of nanocellulose The viscosity yield point and gel strength of the fluids increased with an
increasing concentration of nanocellulose The fluids with CNCs were easier to flow due to their
small dimensions and well dispersions than the fluids added by CNFs having long and highly
entangled nanofibers resulting in lower values in viscosity yield point and initial gel strength
for the former compared to the later The high 10-min gel strength of the fluids with CNCs was
attributed to the strong hydrogen bonding network formed among CNCs For filtration properties
the fluid loss of the drilling fluids added with nanocellulose was larger than the control under
LTLP conditions due to the enhanced connectivity of pores in the filter cakes by the
nanocellulose However the nanocellulose performed much better under HTHP conditions
especially the CNFs The long and highly intertwined CNFs plugged the pores in the ceramic
disks efficiently leading to lower fluid loss even than the control when the content of CNFs was
above 105 lbbbl Furthermore the dimensions of nanocellulse could be controlled to maximize
the plugging effect of subsurface formations with different pore sizes Therefore a novel
pathway was provided to develop novel renewable biopolymer additives in water-based drilling
fluids with enhanced performance and advantages of low cost and ecologically friendly
72 FUTURE WORK
Due to the relatively high carbon content in biomass tar it is a promising materials for
carbon materials including carbon fibers porous carbon and carbon foam Different carbon
materials have been fabricated and characterized using coal or petroleum derived pitch which has
a similar composition to tar However carbon materials produced by tar from biomass
conversions have not been reported Consequently it is expected to manufacture biomass tar-
based carbon materials using this abundant and low-cost carbon precursor In this study the
120
biomass tar derived carbon fibers were prepared by electrospinning with PAN The obtained
showed porous structure that showed potential in a wide of applications including absorption
separation and filtration Continued work could be done to measure the performance of the
fabricated tar-derived carbon in these applications In addition the biomass tar could be also
used to produce porous carbon and carbon foam materials The synthesis of porous carbon
materials can be achieved by various methods including chemical or physical activation
catalytic activation carbonization of polymer blends containing thermally decomposable
components carbonization of a polymer aerogel and templating method These porous carbons
provide unique benefits such as high specific surface area and large porosity in combination with
good chemical and mechanical stability which can be widely used in applications such as gas
separation water purification catalyst supports and electrodes for electrochemical double layer
capacitors and fuel cells In addition carbon foam can be produced from a carbon precursor
under high pressure or made by introducing gas bubbles into the liquid resin allowing the
bubbles to grow and stabilize solidifying and then carbonizing Through these work the tar-
associated environmental damage can be reduced and the efficiency of biomass utilization can be
also largely improved
For the application of nanocellulose in fluids for oil and gas exploitation future work could
be continued to use nanocellulose as a functional additive in fracturing fluids The traditional
fracturing fluids are mainly formulated by guar gum whose price increases a lot in recent years
A cheaper substitute for guar gum is high desirable to reduce the cost of oil and gas production
Nanocellulose is a promising candidate due to its excellent characteristics such as good
rheological properties and eco-friendliness Little work has been done in application of
nanocellulose in fracturing fluids until now The rheology of nanocellulose crosslinked by borax
121
crosslinking mechanism by different crosslinkers the interactions between guar gum and
nanocellulose the suspending capability of fluids added with nanocellulose will be the
interesting research spots
122
APPENDIX PERMISSION LETTER
For chapter 2
SPRINGER LICENSE
TERMS AND CONDITIONS
Mar 17 2016
This is a License Agreement between Kunlin Song (You) and Springer (Springer) provided
by Copyright Clearance Center (CCC) The license consists of your order details the terms
and conditions provided by Springer and the payment terms and conditions
All payments must be made in full to CCC For payment instructions please see
information listed at the bottom of this form
License Number 3830961068578
License date Mar 16 2016
Licensed content publisher Springer
Licensed content publication Journal of Thermal Analysis and Calorimetry
Licensed content title Structure and thermal properties of tar from gasification of
agricultural crop residue
Licensed content author Kunlin Song
Licensed content date Jan 1 2014
Volume number 119
Issue number 1
Type of Use ThesisDissertation
Portion Full text
Number of copies 1
Author of this Springer article Yes and you are a contributor of the new work
Country of republication other
Order reference number None
Title of your thesis
dissertation
APPLICATION OF BIOMASS IN NANOCOMPOSITES AND
DRILLING FLUIDS
Expected completion date May 2016
Estimated size(pages) 150
Total 000 USD
Terms and Conditions
123
Introduction
The publisher for this copyrighted material is Springer By clicking accept in connection with
completing this licensing transaction you agree that the following terms and conditions apply to
this transaction (along with the Billing and Payment terms and conditions established by
Copyright Clearance Center Inc (CCC) at the time that you opened your Rightslink account
and that are available at any time at httpmyaccountcopyrightcom)
Limited License
With reference to your request to reuse material on which Springer controls the copyright
permission is granted for the use indicated in your enquiry under the following conditions
- Licenses are for one-time use only with a maximum distribution equal to the number stated in
your request
- Springer material represents original material which does not carry references to other sources
If the material in question appears with a credit to another source this permission is not valid
and authorization has to be obtained from the original copyright holder
- This permission
bull is non-exclusive
bull is only valid if no personal rights trademarks or competitive products are infringed
bull explicitly excludes the right for derivatives
- Springer does not supply original artwork or content
- According to the format which you have selected the following conditions apply accordingly
bull Print and Electronic This License include use in electronic form provided it is password
protected on intranet or CD-RomDVD or E-bookE-journal It may not be republished in
electronic open access
bull Print This License excludes use in electronic form
bull Electronic This License only pertains to use in electronic form provided it is password
protected on intranet or CD-RomDVD or E-bookE-journal It may not be republished in
electronic open access
For any electronic use not mentioned please contact Springer at permissionsspringerspi-
globalcom
- Although Springer controls the copyright to the material and is entitled to negotiate on rights
this license is only valid subject to courtesy information to the author (address is given in the
articlechapter)
- If you are an STM Signatory or your work will be published by an STM Signatory and you are
requesting to reuse figurestablesillustrations or single text extracts permission is granted
according to STM Permissions Guidelines httpwwwstm-assocorgpermissions-guidelines
For any electronic use not mentioned in the Guidelines please contact Springer
atpermissionsspringerspi-globalcom If you request to reuse more content than stipulated in
the STM Permissions Guidelines you will be charged a permission fee for the excess content
Permission is valid upon payment of the fee as indicated in the licensing process If permission
is granted free of charge on this occasion that does not prejudice any rights we might have to
charge for reproduction of our copyrighted material in the future
-If your request is for reuse in a Thesis permission is granted free of charge under the following
conditions
This license is valid for one-time use only for the purpose of defending your thesis and with a
maximum of 100 extra copies in paper If the thesis is going to be published permission needs
to be reobtained
124
- includes use in an electronic form provided it is an author-created version of the thesis on
hisher own website and hisher universityrsquos repository including UMI (according to the
definition on the Sherpa website httpwwwsherpaacukromeo)
- is subject to courtesy information to the co-author or corresponding author
Geographic Rights Scope
Licenses may be exercised anywhere in the world
AlteringModifying Material Not Permitted
Figures tables and illustrations may be altered minimally to serve your work You may not
alter or modify text in any manner Abbreviations additions deletions andor any other
alterations shall be made only with prior written authorization of the author(s)
Reservation of Rights
Springer reserves all rights not specifically granted in the combination of (i) the license details
provided by you and accepted in the course of this licensing transaction and (ii) these terms and
conditions and (iii) CCCs Billing and Payment terms and conditions
License Contingent on Payment
While you may exercise the rights licensed immediately upon issuance of the license at the end
of the licensing process for the transaction provided that you have disclosed complete and
accurate details of your proposed use no license is finally effective unless and until full
payment is received from you (either by Springer or by CCC) as provided in CCCs Billing and
Payment terms and conditions If full payment is not received by the date due then any license
preliminarily granted shall be deemed automatically revoked and shall be void as if never
granted Further in the event that you breach any of these terms and conditions or any of CCCs
Billing and Payment terms and conditions the license is automatically revoked and shall be void
as if never granted Use of materials as described in a revoked license as well as any use of the
materials beyond the scope of an unrevoked license may constitute copyright infringement and
Springer reserves the right to take any and all action to protect its copyright in the materials
Copyright Notice Disclaimer
You must include the following copyright and permission notice in connection with any
reproduction of the licensed material
Springer bookjournal title chapterarticle title volume year of publication page name(s) of
author(s) (original copyright notice as given in the publication in which the material was
originally published) With permission of Springer
In case of use of a graph or illustration the caption of the graph or illustration must be included
as it is indicated in the original publication
Warranties None
Springer makes no representations or warranties with respect to the licensed material and adopts
on its own behalf the limitations and disclaimers established by CCC on its behalf in its Billing
and Payment terms and conditions for this licensing transaction
Indemnity
You hereby indemnify and agree to hold harmless Springer and CCC and their respective
officers directors employees and agents from and against any and all claims arising out of your
use of the licensed material other than as specifically authorized pursuant to this license
No Transfer of License
This license is personal to you and may not be sublicensed assigned or transferred by you
without Springers written permission
No Amendment Except in Writing
125
This license may not be amended except in a writing signed by both parties (or in the case of
Springer by CCC on Springers behalf)
Objection to Contrary Terms
Springer hereby objects to any terms contained in any purchase order acknowledgment check
endorsement or other writing prepared by you which terms are inconsistent with these terms
and conditions or CCCs Billing and Payment terms and conditions These terms and conditions
together with CCCs Billing and Payment terms and conditions (which are incorporated herein)
comprise the entire agreement between you and Springer (and CCC) concerning this licensing
transaction In the event of any conflict between your obligations established by these terms and
conditions and those established by CCCs Billing and Payment terms and conditions these
terms and conditions shall control
Jurisdiction
All disputes that may arise in connection with this present License or the breach thereof shall
be settled exclusively by arbitration to be held in the Federal Republic of Germany in
accordance with German law
Other conditions V 12AUG2015
Questions customercarecopyrightcom or +1-855-239-3415 (toll free in the US) or +1-
978-646-2777
126
For chapter 3
ELSEVIER LICENSE
TERMS AND CONDITIONS
Mar 17 2016
This is a License Agreement between Kunlin Song (You) and Elsevier (Elsevier) provided
by Copyright Clearance Center (CCC) The license consists of your order details the terms
and conditions provided by Elsevier and the payment terms and conditions
All payments must be made in full to CCC For payment instructions please see
information listed at the bottom of this form
Supplier Elsevier Limited
The BoulevardLangford Lane
KidlingtonOxfordOX5 1GBUK
Registered Company Number 1982084
Customer name Kunlin Song
Customer address Room 112 RNR Bldg
BATON ROUGE LA 70803
License number 3830961299554
License date Mar 16 2016
Licensed content publisher Elsevier
Licensed content publication Fuel
Licensed content title Fabricating electrospun nanofibers with
antimicrobial capability A facile route to recycle
biomass tar
Licensed content author Kunlin SongQinglin WuZhen ZhangSuxia
RenTingzhou LeiKerry M DooleyDa
LiuMarlene E Janes
Licensed content date 15 June 2015
Licensed content volume number 150
Licensed content issue number na
Number of pages 8
Start Page 123
End Page 130
Type of Use reuse in a thesisdissertation
127
Intended publisher of new work other
Portion full article
Format electronic
Are you the author of this Elsevier article Yes
Will you be translating No
Title of your thesisdissertation APPLICATION OF BIOMASS IN
NANOCOMPOSITES AND DRILLING FLUIDS
Expected completion date May 2016
Estimated size (number of pages) 150
Elsevier VAT number GB 494 6272 12
Permissions price 000 USD
VATLocal Sales Tax 000 USD 000 GBP
Total 000 USD
Terms and Conditions
INTRODUCTION 1 The publisher for this copyrighted material is Elsevier By clicking accept in connection
with completing this licensing transaction you agree that the following terms and conditions
apply to this transaction (along with the Billing and Payment terms and conditions established
by Copyright Clearance Center Inc (CCC) at the time that you opened your Rightslink
account and that are available at any time athttpmyaccountcopyrightcom)
GENERAL TERMS 2 Elsevier hereby grants you permission to reproduce the aforementioned material subject to the
terms and conditions indicated
3 Acknowledgement If any part of the material to be used (for example figures) has appeared
in our publication with credit or acknowledgement to another source permission must also be
sought from that source If such permission is not obtained then that material may not be
included in your publicationcopies Suitable acknowledgement to the source must be made
either as a footnote or in a reference list at the end of your publication as follows
Reprinted from Publication title Vol edition number Author(s) Title of article title of
chapter Pages No Copyright (Year) with permission from Elsevier [OR APPLICABLE
SOCIETY COPYRIGHT OWNER] Also Lancet special credit - Reprinted from The Lancet
Vol number Author(s) Title of article Pages No Copyright (Year) with permission from
Elsevier
4 Reproduction of this material is confined to the purpose andor media for which permission is
hereby given
5 AlteringModifying Material Not Permitted However figures and illustrations may be
alteredadapted minimally to serve your work Any other abbreviations additions deletions
andor any other alterations shall be made only with prior written authorization of Elsevier Ltd
(Please contact Elsevier at permissionselseviercom)
6 If the permission fee for the requested use of our material is waived in this instance please be
128
advised that your future requests for Elsevier materials may attract a fee
7 Reservation of Rights Publisher reserves all rights not specifically granted in the combination
of (i) the license details provided by you and accepted in the course of this licensing transaction
(ii) these terms and conditions and (iii) CCCs Billing and Payment terms and conditions
8 License Contingent Upon Payment While you may exercise the rights licensed immediately
upon issuance of the license at the end of the licensing process for the transaction provided that
you have disclosed complete and accurate details of your proposed use no license is finally
effective unless and until full payment is received from you (either by publisher or by CCC) as
provided in CCCs Billing and Payment terms and conditions If full payment is not received on
a timely basis then any license preliminarily granted shall be deemed automatically revoked and
shall be void as if never granted Further in the event that you breach any of these terms and
conditions or any of CCCs Billing and Payment terms and conditions the license is
automatically revoked and shall be void as if never granted Use of materials as described in a
revoked license as well as any use of the materials beyond the scope of an unrevoked license
may constitute copyright infringement and publisher reserves the right to take any and all action
to protect its copyright in the materials
9 Warranties Publisher makes no representations or warranties with respect to the licensed
material
10 Indemnity You hereby indemnify and agree to hold harmless publisher and CCC and their
respective officers directors employees and agents from and against any and all claims arising
out of your use of the licensed material other than as specifically authorized pursuant to this
license
11 No Transfer of License This license is personal to you and may not be sublicensed
assigned or transferred by you to any other person without publishers written permission
12 No Amendment Except in Writing This license may not be amended except in a writing
signed by both parties (or in the case of publisher by CCC on publishers behalf)
13 Objection to Contrary Terms Publisher hereby objects to any terms contained in any
purchase order acknowledgment check endorsement or other writing prepared by you which
terms are inconsistent with these terms and conditions or CCCs Billing and Payment terms and
conditions These terms and conditions together with CCCs Billing and Payment terms and
conditions (which are incorporated herein) comprise the entire agreement between you and
publisher (and CCC) concerning this licensing transaction In the event of any conflict between
your obligations established by these terms and conditions and those established by CCCs
Billing and Payment terms and conditions these terms and conditions shall control
14 Revocation Elsevier or Copyright Clearance Center may deny the permissions described in
this License at their sole discretion for any reason or no reason with a full refund payable to
you Notice of such denial will be made using the contact information provided by you Failure
to receive such notice will not alter or invalidate the denial In no event will Elsevier or
Copyright Clearance Center be responsible or liable for any costs expenses or damage incurred
by you as a result of a denial of your permission request other than a refund of the amount(s)
paid by you to Elsevier andor Copyright Clearance Center for denied permissions
LIMITED LICENSE The following terms and conditions apply only to specific license types
15 Translation This permission is granted for non-exclusive world English rights only unless
your license was granted for translation rights If you licensed translation rights you may only
translate this content into the languages you requested A professional translator must perform
129
all translations and reproduce the content word for word preserving the integrity of the article
16 Posting licensed content on any Website The following terms and conditions apply as
follows Licensing material from an Elsevier journal All content posted to the web site must
maintain the copyright information line on the bottom of each image A hyper-text must be
included to the Homepage of the journal from which you are licensing
athttpwwwsciencedirectcomsciencejournalxxxxx or the Elsevier homepage for books
athttpwwwelseviercom Central Storage This license does not include permission for a
scanned version of the material to be stored in a central repository such as that provided by
HeronXanEdu
Licensing material from an Elsevier book A hyper-text link must be included to the Elsevier
homepage at httpwwwelseviercom All content posted to the web site must maintain the
copyright information line on the bottom of each image
Posting licensed content on Electronic reserve In addition to the above the following clauses
are applicable The web site must be password-protected and made available only to bona fide
students registered on a relevant course This permission is granted for 1 year only You may
obtain a new license for future website posting
17 For journal authors the following clauses are applicable in addition to the above
Preprints A preprint is an authors own write-up of research results and analysis it has not been peer-
reviewed nor has it had any other value added to it by a publisher (such as formatting
copyright technical enhancement etc)
Authors can share their preprints anywhere at any time Preprints should not be added to or
enhanced in any way in order to appear more like or to substitute for the final versions of
articles however authors can update their preprints on arXiv or RePEc with their Accepted
Author Manuscript (see below)
If accepted for publication we encourage authors to link from the preprint to their formal
publication via its DOI Millions of researchers have access to the formal publications on
ScienceDirect and so links will help users to find access cite and use the best available
version Please note that Cell Press The Lancet and some society-owned have different preprint
policies Information on these policies is available on the journal homepage
Accepted Author Manuscripts An accepted author manuscript is the manuscript of an article
that has been accepted for publication and which typically includes author-incorporated changes
suggested during submission peer review and editor-author communications
Authors can share their accepted author manuscript
immediately
o via their non-commercial person homepage or blog
o by updating a preprint in arXiv or RePEc with the accepted manuscript
o via their research institute or institutional repository for internal
institutional uses or as part of an invitation-only research collaboration
work-group
o directly by providing copies to their students or to research collaborators
for their personal use
o for private scholarly sharing as part of an invitation-only work group on
commercial sites with which Elsevier has an agreement
after the embargo period
o via non-commercial hosting platforms such as their institutional
130
repository
o via commercial sites with which Elsevier has an agreement
In all cases accepted manuscripts should
link to the formal publication via its DOI
bear a CC-BY-NC-ND license - this is easy to do
if aggregated with other manuscripts for example in a repository or other site be
shared in alignment with our hosting policy not be added to or enhanced in any way to
appear more like or to substitute for the published journal article
Published journal article (JPA) A published journal article (PJA) is the definitive final record
of published research that appears or will appear in the journal and embodies all value-adding
publishing activities including peer review co-ordination copy-editing formatting (if relevant)
pagination and online enrichment
Policies for sharing publishing journal articles differ for subscription and gold open access
articles
Subscription Articles If you are an author please share a link to your article rather than the
full-text Millions of researchers have access to the formal publications on ScienceDirect and so
links will help your users to find access cite and use the best available version
Theses and dissertations which contain embedded PJAs as part of the formal submission can be
posted publicly by the awarding institution with DOI links back to the formal publications on
ScienceDirect
If you are affiliated with a library that subscribes to ScienceDirect you have additional private
sharing rights for others research accessed under that agreement This includes use for
classroom teaching and internal training at the institution (including use in course packs and
courseware programs) and inclusion of the article for grant funding purposes
Gold Open Access Articles May be shared according to the author-selected end-user license
and should contain a CrossMark logo the end user license and a DOI link to the formal
publication on ScienceDirect
Please refer to Elseviers posting policy for further information
18 For book authors the following clauses are applicable in addition to the above Authors
are permitted to place a brief summary of their work online only You are not allowed to
download and post the published electronic version of your chapter nor may you scan the
printed edition to create an electronic version Posting to a repository Authors are permitted to
post a summary of their chapter only in their institutions repository
19 ThesisDissertation If your license is for use in a thesisdissertation your thesis may be
submitted to your institution in either print or electronic form Should your thesis be published
commercially please reapply for permission These requirements include permission for the
Library and Archives of Canada to supply single copies on demand of the complete thesis and
include permission for ProquestUMI to supply single copies on demand of the complete
thesis Should your thesis be published commercially please reapply for permission Theses and
dissertations which contain embedded PJAs as part of the formal submission can be posted
publicly by the awarding institution with DOI links back to the formal publications on
ScienceDirect
Elsevier Open Access Terms and Conditions
You can publish open access with Elsevier in hundreds of open access journals or in nearly 2000
established subscription journals that support open access publishing Permitted third party re-
use of these open access articles is defined by the authors choice of Creative Commons user
131
license See our open access license policy for more information
Terms amp Conditions applicable to all Open Access articles published with Elsevier Any reuse of the article must not represent the author as endorsing the adaptation of the article
nor should the article be modified in such a way as to damage the authors honour or reputation
If any changes have been made such changes must be clearly indicated
The author(s) must be appropriately credited and we ask that you include the end user license
and a DOI link to the formal publication on ScienceDirect
If any part of the material to be used (for example figures) has appeared in our publication with
credit or acknowledgement to another source it is the responsibility of the user to ensure their
reuse complies with the terms and conditions determined by the rights holder
Additional Terms amp Conditions applicable to each Creative Commons user license CC BY The CC-BY license allows users to copy to create extracts abstracts and new works
from the Article to alter and revise the Article and to make commercial use of the Article
(including reuse andor resale of the Article by commercial entities) provided the user gives
appropriate credit (with a link to the formal publication through the relevant DOI) provides a
link to the license indicates if changes were made and the licensor is not represented as
endorsing the use made of the work The full details of the license are available
at httpcreativecommonsorglicensesby40
CC BY NC SA The CC BY-NC-SA license allows users to copy to create extracts abstracts
and new works from the Article to alter and revise the Article provided this is not done for
commercial purposes and that the user gives appropriate credit (with a link to the formal
publication through the relevant DOI) provides a link to the license indicates if changes were
made and the licensor is not represented as endorsing the use made of the work Further any
new works must be made available on the same conditions The full details of the license are
available at httpcreativecommonsorglicensesby-nc-sa40
CC BY NC ND The CC BY-NC-ND license allows users to copy and distribute the Article
provided this is not done for commercial purposes and further does not permit distribution of the
Article if it is changed or edited in any way and provided the user gives appropriate credit (with
a link to the formal publication through the relevant DOI) provides a link to the license and
that the licensor is not represented as endorsing the use made of the work The full details of the
license are available at httpcreativecommonsorglicensesby-nc-nd40 Any commercial
reuse of Open Access articles published with a CC BY NC SA or CC BY NC ND license
requires permission from Elsevier and will be subject to a fee
Commercial reuse includes
Associating advertising with the full text of the Article
Charging fees for document delivery or access
Article aggregation
Systematic distribution via e-mail lists or share buttons
Posting or linking by commercial companies for use by customers of those companies
20 Other Conditions
v18
Questions customercarecopyrightcom or +1-855-239-3415 (toll free in the US) or +1-978-
646-2777
132
For chapter 4
Title Porous Carbon Nanofibers from Electrospun Biomass TarPolyacrylonitrileSilver
Hybrids as Antimicrobial Materials
Author Kunlin Song Qinglin Wu Zhen Zhang et al
Publication
Applied Materials
Publisher American Chemical Society
Date Jul 1 2015
Copyright copy 2015 American Chemical Society
PERMISSIONLICENSE IS GRANTED FOR YOUR ORDER AT NO CHARGE
This type of permissionlicense instead of the standard Terms amp Conditions is sent to you
because no fee is being charged for your order Please note the following
Permission is granted for your request in both print and electronic formats and
translations
If figures andor tables were requested they may be adapted or used in part
Please print this page for your records and send a copy of it to your publishergraduate
school
Appropriate credit for the requested material should be given as follows Reprinted
(adapted) with permission from (COMPLETE REFERENCE CITATION) Copyright
(YEAR) American Chemical Society Insert appropriate information in place of the
capitalized words
One-time permission is granted only for the use specified in your request No additional
uses are granted (such as derivative works or other editions) For any other uses please
submit a new request
133
VITA
Kunlin Song was born in Sichuan Province China He obtained the BS in Wood Science
and Engineering from Beijing Forestry University Beijing China in 2009 He got his MS Wood
Science and Technology from Chinese Academy of Forestry Beijing China with Dr Yafang Yin
as advisor in 2012 where he studied wood cell wall polymers (cellulose lignin and
hemicellulose) Since 2012 he has studied in School of Renewable Natural Resources at
Louisiana State University as a PhD candidate with Dr Qinglin Wu as advisor His research
focuses the preparation characterization and application of electrospun nanofibers and
composites He anticipates graduating with his PhD degree in August 2016
- Louisiana State University
- LSU Digital Commons
-
- 2016
-
- Application of Biomass Derived Materials in Nanocomposites and Drilling Fluids
-
- Kunlin Song
-
- Recommended Citation
-
- tmp1483830367pdfWnHMi
-

APPLICATION OF BIOMASS DERIVED MATERIALS IN
NANOCOMPOSITES AND DRILLING FLUIDS
A Dissertation
Submitted to the Graduate Faculty of the
Louisiana State University and
Agricultural and Mechanical College
in partial fulfillment of the
requirements for the degree of
Doctor of Philosophy
in
The School of Renewable Natural Resources
by
Kunlin Song
BS Beijing Forestry University 2009
MS Chinese Academy of Forestry 2012
August 2016
ii
ACKNOWLEDGEMENTS
I would like to gratefully acknowledge the financial support from the Economic
Development Assistantship Program of Louisiana State University
Special thanks go to my advisor Dr Qinglin Wu It would be impossible for me to
overcome the difficulties in my research work without his kindness understanding advice and
patience I also greatly appreciate my committee members Dr Ioan I Negulescu Dr John A
Pojman Dr Sun Joseph Chang and Dr Steven L Namikas for their inspiring and enlightening
advice on my research
My colleagues in our lab supported and encouraged me a lot in the past years The time we
worked together will be definitely beautiful memories in my future life Here I would like to
express my gratitude to all of my lab mates Dr Chengjun Zhou Dr Runzhou Huang Dr Birm J
Kim Dr Jingquan Han Dr Yiying Yue Dr Meichun Li Dr Tian Liu Dr Min Yu Dr Huiyuan
Li Dr Zhiping Zhang Mr Kai Chi Miss Huan Zhang Mr Lichao Sun Mr Zhen Zhang Mr
Xiuxuan Sun Mr Jinlong Zhang Mr Ling Zhou Mr Cheng Yong and Miss Siwei Huang
My deepest thanks go to my friends and family for their support throughout my life In
particular I would like to thank my host family Mr and Mrs Williams for their invaluable and
expeditious suggestions and support whenever and whatever my wife and I need throughout our
American life Additionally I am deeply grateful to my family for their love and support all
through my PhD studies
iii
TABLE OF CONTENTS
ACKNOWLEDGEMENTS ii
LIST OF TABLES vi
LIST OF FIGURES vii
ABSTRACT x
CHAPTER 1 INTRODUCTION 1 11 BACKGROUND 1
111 Biomass Tar in Carbon Materials 1 112 Cellulose Nanoparticles in Drilling Fluids 4
12 OBJECTIVES 6 13 ORGANIZATION OF DISSERTATION 7
14 REFERENCES 7
CHAPTER 2 STRUCTURE AND THERMAL PROPERTIES OF TAR FROM
GASIFICATION OF AGRICULTURAL CROP RESIDUE 10
21 INTRODUCTION 10 22 MATERIALS AND METHODS 12
221 Materials 12 222 Characterization 12
23 RESULTS AND DISCUSSION 17 231 Chemical Composition 17
231 Thermal Decomposition 21 24 CONCLUSIONS 24 25 REFERENCES 25
CHAPTER 3 FABRICATING ELECTROSPUN NANOFIBER WITH ANTIMICROBIAL
CAPABILITY A FACILE ROUTE TO RECYCLE BIOMASS TAR 29
31 INTRODUCTION 29 32 MATERIALS AND METHODS 31
321 Materials 31 322 Electrospinning SolutionsSuspensions 32
323 Fabrication of Electrospun TarPAN Nanofibers 32 324 Characterizations 33
33 RESULTS AND DISCUSSION 35 331 Characteristics of Electrospinning Solutions 35 332 Microstructure of Electrospun Fibers 37
333 ATR-FTIR Spectra of Electrospun fibers 39 334 Thermal Properties 41 335 Surface Area and Porosity 44 336 Antimicrobial Activity 46
34 CONCLUSIONS 47
iv
35 REFERENCES 48
CHAPTER 4 POROUS CARBON NANOFIBERS FROM ELECTROSPUN BIOMASS
TARPOLYACRYLONITRILESILVER HYBRIDS AS ANTIMICROBIAL MATERIALS 52 41 INTRODUCTION 52
42 MATERIALS AND METHODS 54 421 Materials 54 422 Fabrication of Carbon Fiber Precursors 55 423 Stabilization and Carbonization 56 424 Characterizations 56
425 Antimicrobial Test 58 43 RESULTS AND DISCUSSION 58
431 Properties of electrospinning suspensions 58 432 Surface Morphology 60 433 Chemical Structure 62 434 Thermal Properties 64
435 Pore Structure 66 436 Antimicrobial Performance 70
44 CONCLUSIONS 71 45 REFERENCES 72
CHAPTER 5 RHEOLOGICAL AND FLUID FILTRATION PROPERTIES OF LOW SOLID
DRILLING FLUIDS ADDED WITH CELLULOSE NANOPARTICLES 76 51 INTRODUCTION 76
52 MATERIALS AND METHODS 78
521 Materials 78
522 Formulations of Drilling Fluids 79 523 Rheological Testing 80
524 Fluid Filtration Testing 81 53 RESULTS AND DISCUSSION 81
531 Fluid Rheological Properties 81
532 Fluid Filtration Properties 87 54 CONCLUSIONS 92
55 REFERENCES 93
CHAPTER 6 NOVEL BIOPOLYMER WATER-BASED DRILLING FLUIDS FOR
ENHANCING DRILLING PERFORMANCE 96
61 INTRODUCTION 96
62 MATERIALS AND METHODS 99 621 Materials 99 622 Formations of Drilling Fluids 99 623 Rheological Measurements 100 624 Fluid Filtration Testing 101
63 RESULTS AND DISCUSSION 102 631 Structure of Nanocellulose 102 632 Rheological Properties 103
633 Fluid Filtration Under LTLP 107
v
634 Fluid Filtration Under HTHP 111 64 CONCLUSIONS 113 65 REFERENCES 114
CHAPTER 7 OVERALL CONCLUSIONS 116
71 MAIN CONCLUSIONS 116 72 FUTURE WORK 119
APPENDIX PERMISSION LETTER 122
VITA 133
vi
LIST OF TABLES
Table 21 Chemical components of the biomass tar by GC-MS 18
Table 22 The IR absorption bands for functional groups of the biomass tar 20
Table 23 Elemental analysis of biomass tar 20
Table 31 Thermal properties of the electrospun neat PAN and tarPAN fibers 42
Table 32 Morphological characteristics of the neat PAN and tarPAN nanofibers 45
Table 41 Compositions and carbon yields of PANAg and tarPANAg electrospun nanofibers 55
Table 42 Specific surface area and pore volumes of the as-spun nanofibers and CNFs 69
Table 51 Formulations of the bentonite drilling fluids added with CNPs 79
Table 52 Rheological properties of the bentonite drilling fluids added with CNPs 84
Table 61 Formulations of the drilling fluids 100
Table 62 Rheological properties of the drilling fluids with different contents of nanocellulose 105
Table 63 The API fluid loss thickness and permeability of filter cakes for the drilling fluids
under LTLP conditions 109
vii
LIST OF FIGURES
Figure 21 Scheme illustrating the drying and centrifuging processes of biomass tar for GC-MS
analysis 13
Figure 22 FTIR spectra of the original tar and the tar after thermal treatment at 600 ˚C under N2
atmosphere 19
Figure 23 Thermal gravimetric curves of biomass tar at different heating rates under nitrogen
atmosphere (a) the temperature dependence of the extent of conversion (α) for different
heating rates (b) 21
Figure 24 Arrhenius plots at selected conversion rates by Friedman (a) and DAEM (b) method22
Figure 25 The activation energy (E) plotted against the extent of conversion rate (α) 23
Figure 31 Schematic illustrating the process for fabricating biomass tarPAN nanofibers by
electrospinning 33
Figure 32 Variations of apparent viscosity with shear rates for PAN solutions and tarPAN
suspensions 36
Figure 33 FE-SEM micrographs of the electrospun nanofibers (inserted photos are at higher
magnification) A PAN B 30TarPAN C 50TarPAN D 100TarPAN 38
Figure 34 Average diameters of the neat PAN and tarPAN electrospun nanofibers 39
Figure 35 The ATR-FTIR spectra of the PAN 30TarPAN 50TarPAN and 100TarPAN
electrospun nanofibers 40
Figure 36 TG (solid curves) and DTG (dotted curves) of the PAN fibers tarPAN fibers and
original tar 41
Figure 37 DSC of the PAN (solid curves) and tarPAN fibers (dotted curves) The inset shows a
schematic of a tar-initiated PAN cyclization reaction (Ar-OH indicates a phenolic
component of the tar) 43
Figure 38 Nitrogen adsorptiondesorption isotherm at 77 K and BJH pore size distribution
(inset) of the PAN nanofibers Dv(d) is the derivative of pore volume with respect to pore
diameter 44
Figure 39 Antibacterial activity of the neat PAN and tarPAN nanofibers against S aureus (A B
and C) and E coli (D E and F) (A) and (D) PAN (B) and (E) 50TarPAN (C) and (F)
100TarPAN 46
Figure 41 Basic properties of the electrospinning suspensions (A) The shear viscosity-shear rate
relationships for PANAg 50 TarPANAg and 100TarPANAg (B) UV absorbance of
PAN and PANAg 59
viii
Figure 42 FE-SEM micrographs of the as-spun nanofibers (A PANAg C 50TarPANAg E
100TarPANAg) and CNFs (B PANAg-CNF D 50TarPANAg-CNF F 100TarPANAg-
CNF) (The inset at the bottom-right of each micrograph shows a higher magnification
image) 61
Figure 43 A compasrison of average diameters of the as-spun nanofibers and CNFs from three
different formulations 62
Figure 44 ATR-FTIR spectra of the as-spun (A) stabilized (B) and carbonized (C) nanofibers
for different tar loading levels (I-PANAg II-50TarPANAg and III-100TarPANAg) 63
Figure 45 TG and DTG curves of the as-spun (A) and stabilized (B) nanofibers with three
different tar contents 64
Figure 46 DSC curves of the as-spun (A) and stabilized (B) nanofibers with different tar
contents 65
Figure 47 N2 adsorptiondesorption isotherms and pore size distribution of the as-spun
nanofibers (A and C) and CNFs (B and D) with different tar contents 67
Figure 48 A schematic illustrating the fabrication of the porous tar-derived CNFs through
electrospinning followed by stabilization and carbonization processes 69
Figure 49 Antimicrobial activities of the as-spun nanofibers (upper row) and CNFs (lower row)
with different tar contents against S aureus 70
Figure 51 Apparent viscosity and shear stress versus shear rates of the drilling fluids 82
Figure 52 TEM images and diameter distributions of the CNCs (A) and CNFs (B) 85
Figure 53 Filtration volume versus square root of time for CNC-DF (A) and CNF-DF (B) 87
Figure 54 Standard fluid loss and filter cake characteristics of the drilling fluids 88
Figure 55 FE-SEM images of filter cakes formed by the drilling fluids of BT6 (A)
BT1CNC030 (B) BT1CNF030 (C) and CNF040 (D) 89
Figure 56 A schematic illustrating the formation of filter cakes by the drilling fluids added with
CNCs and CNFs on borehole walls 91
Figure 61 TEM photographs and diameter distributions (inserted plots) of the CNCs (A) and
CNFs (B) 102
Figure 62 Viscosity and shear stress as functions of shear rates for the drilling fluids with
different concentrations of nanocellulose 103
Figure 63 Schematic illustrating the formations of hydrogen bonding among CNCs and CNFs in
the fluids 107
ix
Figure 64 Filtration volume versus square root of time for the drilling fluids under LTLP
conditions 108
Figure 65 Surface and cross sectional FE-SEM images of the filter cakes for BT20 (A and D)
BT10CNC350 (B and E) and BT10CNF350 (C and F) under LTLP conditions (A B and
C Cross section morphology D E and F Surface morphology) 110
Figure 66 The API fluid loss and cake thickness of the drilling fluids under HTHP conditions 111
Figure 67 Surface and cross sectional FE-SEM images of the ceramic disks for BT20 (A and D)
BT10CNC350 (B and E) and BT10CNF350 (C and F) under HTHP conditions (A B
and C Cross section morphology D E and F Surface morphology) 112
x
ABSTRACT
Tar is inevitably produced from biomass thermochemical processes and is often disposed
as an industrial waste leading to environmental pollution As a result of its high carbon content
tar was expected to be a promising precursor for manufacturing carbon materials Consequently
low-cost porous carbon nanofibers (CNFs) using tar polyacrylonitrile (PAN) and silver
nanoparticles was fabricated through electrospinning and subsequent stabilization and
carbonization processes The continuous electrospun nanofibers were obtained with diameters
ranging from 392 to 903 nm The addition of biomass tar resulted in increased fiber diameters
reduced thermal stabilities and slowed cyclization reactions of PAN in the as-spun nanofibers
After stabilization and carbonization the produced CNFs showed more uniformly sized and
reduced average diameters The CNFs exhibited high specific surface areas (gt400 m2g) and
microporosity These porous features increased the exposures and contacts of silver nanoparticles
to the bacteria leading to excellent antimicrobial performances of as-spun nanofibers and CNFs
A new strategy is thus provided for utilizing tar as low-cost precursor to prepare functional CNFs
and reduce environmental damage by direct disposal of tar
Additionally nanocellulose was used as an environmental friendly and high performance
additive in drilling fluids for improving rheological and fluid filtration properties Two types of
nanocellulose including cellulose nanocrystals (CNCs) and cellulose nanofibers (CNFs) were
applied in the drilling fluids The effects of nanocellulose dimensions and concentrations on the
rheological and filtration properties of drilling fluids were investigated With half of the
bentonite (10 lbbbl) replaced by a small fraction of nanocellulose (035-350 lbbbl) the
resultant low-solid drilling fluids showed excellent shear thinning behavior and the fluidsrsquo
viscosity yield point and gel strength increased with the concentrations of nanocellulose On the
xi
other hand the addition of nanocellulose reduced the fluid loss of the fluids under high
temperature and high pressure (HTHP) conditions demonstrating potential for HTHP well
applications Additionally the CNCs and CNFs behaved differently in the rheological and fluid
filtration properties attributed to their distinct morphologies This study promoted the use of
novel renewable biopolymer additives in drilling fluids with enhanced performance and
advantages of low cost and ecologically friendly
1
CHAPTER 1 INTRODUCTION
11 BACKGROUND
Energy shortage environmental pollution and global warming have been becoming crucial
issues that drive us to utilize renewable natural resources with less environmental harm in a
sustainable way Biomass is one of the promising alternatives to petroleum-based energy and
materials with attractive characteristics including abundance renewability and carbon neutrality
However biomass has not been fully utilized and emerged issues accompanying its applications
have not been efficiently addressed On one hand biomass can be converted to products for
substituting petrochemical-derived energy and materials through pyrolysis or gasification
During these processes tar is inevitably produced and often disposed as an industrial waste
causing environmental pollution Meanwhile tar contains many valuable components that may
be utilized for manufacturing of chemicals and carbonaceous materials Accordingly an efficient
way to manufacture tar derived composite materials is required urgently On the other hand
biomass is composed of cellulose hemicellulose lignin small amounts of lipids proteins and
inorganic constituents as well as a fraction of water Nanocellulose isolated from biomass is
widely used for reinforcing polymeric composites as a result of its high strength and
nanodimensions In addition cellulose is a thermally stable biodegradable nontoxic and readily
available biopolymer that can be used as a lost circulation rheological and filtration control
material in oil and gas well applications
111 Biomass Tar in Carbon Materials
Through thermochemical transformation including gasification and pyrolysis biomass
generates gases liquids and solid fuels which can partially be the substitutes for fossil fuels
(Milne et al 1998) However tar is an inevitable by-product during these processes and the
2
most cumbersome and problematic parameter in any biomass gasification commercialization
activities A lot of effort has been taken on physical removal and chemical conversion of the tar
from biomass conversion (Milne et al 1998) However these processes need a lot of energy
input and may induce other problems such as the treatment of the more refractory secondary
products from physical removal and chemical conversion of tar Therefore further fundamental
knowledge about the chemical composition and properties of tar is needed to better control its
conversion and separation during biomass conversion Meanwhile it is crucial to find good ways
of utilizing biomass tar and turn the unavoidable ldquowasterdquo into wealth which can serve as the
alternative method to control the accumulation of tar and reduces dramatically its harm to
environment
Chemical composition of biomass tar is highly complex and dependent on the feedstock of
biomass and thermochemical conversion conditions such as oxygen level steam-to-biomass ratio
pressure time and temperature (Aigner et al 2009 Ku and Mun 2006 Yanik et al 2007)
Biomass tar is defined as a complex mixture of condensable hydrocarbons including single ring
to five-ring aromatic compounds along with other oxygen-containing hydrocarbons and complex
polycyclic aromatic hydrocarbon (PAH) (Li and Suzuki 2009b) However no further details
about the composition and structure of tar components were investigated As a result it is
desirable to obtain a comprehensive knowledge of the chemical composition of biomass tar at a
higher level of detail Besides the chemical composition of tar its thermal decomposition
properties also play a crucial role in its successful control conversion and further application
Biomass tar decomposition mainly occurs due to cracking steam reforming dry reforming and
carbon formation reactions (Li and Suzuki 2009a) It is difficult to study the thermal degradation
of tar because of its complex composition Most of previous researches simplify the tar
3
decomposition analysis by selecting a model compound of tar such as naphthalene (Anis et al
2013 Devi et al 2005) toluene (Kong et al 2011 Swierczynski et al 2008) benzene (Simell
et al 1999) and 1-methylnaphthalene (Dou et al 2003) However only one model component
canrsquot reflect the decomposition reaction mechanism of real tar and the interactions of its
components Therefore the thermal decomposition of biomass tar has not been fully
characterized and understood until now and further systemic study on tar is required to reveal its
complex thermal degradation mechanism
Although tar is an undesirable product for biomass gasification and pyrolysis it can be a
valuable carbon precursor of carbonaceous materials including carbon fibers porous carbon and
carbon foam considering its high carbon content (Song et al 2015) Different carbon materials
have been fabricated and characterized using coal or petroleum derived pitch which has a similar
composition to tar Using isotropic pitch activated carbon fibers have been prepared which
exhibit a high surface area (gt2000 m2g) high electrical conductivity (gt50 scm) high carbon
yield (60 ) at 1000 degC and high adsorption ability (Bui et al 2009 Park et al 2003) A
modification of pitch-based carbon fibers using low-cost carbon black was reported to improve
the electrical and thermal conductivity making them more favorable for industrial application
(Alway-Cooper et al 2013) In addition porous carbon has been prepared using pitch as a
carbon precursor Using soft-templating-based methodology meso- and macroporous carbon
have been synthesized taking advantage of the phase separation (spinodal decomposition) of
mesophase pitch which acts as the carbon precursor and an organic polymer (polystyrene)
which acts as the template (Adelhelm et al 2007) The main idea behind this approach is to
induce continuously increasing incompatibility between mesophase pitch and the polymer during
the evaporation of the solvent and the subsequent carbonization step Besides carbon fibers and
4
porous carbon pitch can be used to produce carbon foam materials (Chen et al 2006) This
material is a sponge-like carbon material with the features of low density (02-08 gcm3) good
thermal stability high mechanical strength (up to 20 MPa compression) large external surface
area with open cell structure and adjustable thermal and electrical conductivity which has
potential applications in high temperature thermal insulation materials high thermally
conductive heat sinks electrodes for energy storage catalyst supports and filters (Chen et al
2006 Wu et al 2011) However carbon materials produced by tar from biomass conversions
have not been reported Consequently it is expected to manufacture biomass tar-based carbon
materials using this abundant and low-cost carbon precursor
112 Cellulose Nanoparticles in Drilling Fluids
Drilling fluids commonly referred to as drilling muds are an integral part of drilling oil
and natural gas wells A drilling fluid is typically pumped through the drill string and is
subsequently introduced to the bottom of the bore hole as it squirts out of nozzles on the drill bit
The drilling fluids have various functions including controlling formation pressures minimizing
formation damage maintaining wellbore stability suspending and carrying out cuttings and
cooling and lubricating drilling bit (Bourgoyne et al 1991) The successful drilling operations
are highly dependent on the selection of drilling fluids with desirable performance
Facing increasing drilling challenges in complex deeper wells deviated wells and
horizontal wells the oil and gas industry is always looking for physically small chemically and
thermally stable biologically degradable environmentally benign materials for designing smart
drilling fluids with desirable performance (Abdo and Haneef 2013) Recently the nano-based
drilling fluids loaded with nanoparticles are attracting more attention due to their unique
characteristics such as a high surface area to volume ratio Such nanoparticles play an essential
5
role in decreasing the permeability of shale formation maintaining borehole stability
intensifying mud cake quality reducing fluid loss improving cutting removal ability lowering
the friction eliminating differential pipe sticking protecting reservoir and enhancing oil and gas
recovery (Abdo and Haneef 2013 Farbod et al 2015 Sun et al 2015) Due to these advantages
addition of nanoparticles into drilling fluids can improve drilling efficiency save drilling cost
and protect the environment
A variety of nanoparticles have been studied for preparing nano-based drilling fluids
including nano-silica (Sensoy et al 2009 Sharma et al 2012) nano metallic oxide (Cheraghian
et al 2013 Sayyadnejad et al 2008) carbon black nano-graphite (Nasser et al 2013)
polymer-based nanoparticles (Jiang et al 2009 Qu et al 2007) and combinations of these
However the use of these nanoparticles is limited by their cost and environmental impact
Furthermore with an increasing pressure from energy shortages and ecological deterioration
renewable natural resources such as cellulose starch and protein are intensively studied to
substitute for non-renewable petroleum-based products
Cellulose is the most abundant natural resource in nature which widely exists in various
natural fibers such as wood cotton hemp and linen Cellulose derivatives such as polyanionic
cellulose (PAC) and carboxymethyl cellulose (CMC) have been the popular additives to optimize
the rheological properties of drilling fluids (Li et al 2016 Menezes et al 2010) However they
have been added as particles with a large size ranging from several micrometers to millimeters
Much smaller particles named as nanocellulose can currently obtained through several physical
and chemical methods such as acid hydrolysis enzyme hydrolysis 2266-Tetramethyl-1-
piperidinyloxy (TEMPO) mediated oxidation methods and a high pressure homogenization
(Moon et al 2011) Nanocellulose has high surface to volume ratio much lower density of 16
6
gcm3 than silica (22 gcm3) and high values of tensile strength (75-77 GPa) and axial elastic
modulus (110-220 GPa) (Moon et al 2011) Because of these excellent characteristics
nanocellulose can be used for preparing technically reliable economically attractive
environmentally friendly drilling fluids to meet the technical needs and challenges of the oil and
gas industry
12 OBJECTIVES
The objectives of the research described in this work are
1) To investigate the chemical composition and thermal degradation of biomass tar
obtained from corn stover gasification aiming at facilitating the further processing and
utilization of biomass tar
2) To fabricate functional nanofibers prepared by electrospinning biomass tarPAN
suspensions The electrospinnability of the tarPAN suspensions as well as the structure and
properties of the resultant nanofibers with varying tar contents were investigated
3) To manufacture low-cost porous carbon nanofibers (CNFs) using biomass tar
polyacrylonitrile (PAN) and silver nanoparticles through electrospinning and subsequent
stabilization and carbonization processes The effects of tar loading levels on electrospinning
ability of the suspensions morphologies chemical structures thermal properties pore features
and antimicrobial performance of resultant CNFs were investigated
4) To develop drilling fluids with low solid content by substituting nanocellulose including
cellulose nanofibers (CNFs) and cellulose nanocrystals (CNCs) for a part of bentonite in the
fluid system The effects of cellulose nanoparticle content on the rheology and fluid filtration
properties of the resultant drilling fluids were studied
7
13 ORGANIZATION OF DISSERTATION
Chapter 1 provides an overall introduction of the research and the structure of this
dissertation
Chapter 2 introduces the chemical composition and thermal properties of tar from biomass
gasification
Chapter 3 describes the fabrication and characterization of electrospun nanofibers from
PAN and biomass tar
Chapter 4 presents the fabrication and characterization of porous carbon nanofibers from
PANbiomass tarsilver by electrospinning thermal oxidation and carbonization processes
Chapter 5 describes the preparation of low solid drilling fluids added with nanocellulose
and investigates the effects of nanocellulose content on the rheology and fluid loss properties of
the drilling fluids
Chapter 6 presents the formulation of drilling fluids having compositions very similar to
the field fluids under use including bentonite nanocellulose and other additives The
rheological and filtration properties of the formulated fluids were tested and special emphasis
was put on the performance of the fluids under high temperature and high pressure conditions
14 REFERENCES
Abdo J Haneef MD 2013 Clay nanoparticles modified drilling fluids for drilling of deep
hydrocarbon wells Appl Clay Sci 86 76-82
Adelhelm P Hu YS Chuenchom L Antonietti M Smarsly BM Maier J 2007
Generation of hierarchical meso- and macroporous carbon from mesophase pitch by
spinodal decomposition using polymer templates Adv Mater 19 4012-4017
Aigner I Wolfesberger U Hofbauer H 2009 Tar content and composition in producer gas of
fluidized bed gasification and low temperature pyrolysis of straw and wood - influence of
temperature International Conference on Polygeneration Strategies Vienna
Alway-Cooper RM Anderson DP Ogale AA 2013 Carbon black modification of
mesophase pitch-based carbon fibers Carbon 59 40-48
8
Anis S Zainal ZA Bakar MZA 2013 Thermocatalytic treatment of biomass tar model
compounds via radio frequency Bioresour Technol 136 117-125
Bourgoyne AT Millheim KK Chenevert ME Young FS (Eds) 1991 Applied Drilling
Engineering first ed Society of Petroleum Engineers Richardson
Bui NN Kim BH Yang KS Dela Cruz ME Ferraris JP 2009 Activated carbon fibers
from electrospinning of polyacrylonitrilepitch blends Carbon 47 2538-2539
Chen C Kennel EB Stiller AH Stansberry PG Zondlo JW 2006 Carbon foam derived
from various precursors Carbon 44 1535-1543
Cheraghian G Hemmati M Masihi M Bazgir S 2013 An experimental investigation of the
enhanced oil recovery and improved performance of drilling fluids using titanium dioxide
and fumed silica nanoparticles J Nanostruct Chem 3 78
Devi L Ptasinski KJ Janssen FJJG 2005 Pretreated olivine as tar removal catalyst for
biomass gasifiers investigation using naphthalene as model biomass tar Fuel Process
Technol 86 707-730
Dou B Gao J Sha X Baek SW 2003 Catalytic cracking of tar component from high-
temperature fuel gas Appl Therm Eng 23 2229-2239
Farbod M Kouhpeymani asl R Noghreh abadi AR 2015 Morphology dependence of
thermal and rheological properties of oil-based nanofluids of CuO nanostructures
Colloids Surf A 474 71-75
Kong M Fei J Wang S Lu W Zheng X 2011 Influence of supports on catalytic behavior
of nickel catalysts in carbon dioxide reforming of toluene as a model compound of tar
from biomass gasification Bioresour Technol 102 2004-2008
Ku CS Mun SP 2006 Characterization of pyrolysis tar derived from lignocellulosic biomass
J Ind Eng Chem 12 853-861
Li C Suzuki K 2009a Kinetic analyses of biomass tar pyrolysis using the distributed
activation energy model by TGDTA technique J Therm Anal Calorim 98 261-266
Li C Suzuki K 2009b Tar property analysis reforming mechanism and model for biomass
gasification-An overview Renew Sus Energ Rev 13 594-604
Li M Wu Q Song K De Hoop CF Lee S-Y Qing Y Wu Y 2016 Cellulose
nanocrystals and polyanionic cellulose as additives in bentonite water-based drilling
fluids rheological modelling and filtration mechanisms Ind Eng Chem Res 55 133-
143
Menezes R Marques L Campos L Ferreira H Santana L Neves G 2010 Use of
statistical design to study the influence of CMC on the rheological properties of bentonite
dispersions for water-based drilling fluids Appl Clay Sci 49 13-20
9
Milne TA Evans RJ Abatzoglou N 1998 Biomass gasifier tars their nature formation
and conversion Naional Renewable Energy Laboratory Colorado p 68
Moon RJ Martini A Nairn J Simonsen J Youngblood J 2011 Cellulose nanomaterials
review structure properties and nanocomposites Chem Soc Rev 40 3941-3994
Nasser J Jesil A Mohiuddin T Al Ruqeshi M Devi G Mohataram S 2013
Experimental investigation of drilling fluid performance as nanoparticles World J Nano
Sci Eng 3 57-61
Park SH Kim C Choi YO Yang KS 2003 Preparations of pitch-based CFACF webs by
electrospinning Carbon 41 2655-2657
Sayyadnejad M Ghaffarian H Saeidi M 2008 Removal of hydrogen sulfide by zinc oxide
nanoparticles in drilling fluid Int J Environ Sci Tech 5 565-569
Sensoy T Chenevert ME Sharma MM 2009 Minimizing water invasion in shales using
nanoparticles SPE Annual Technical Conference and Exhibition New Orleans
Sharma MM Chenevert ME Guo Q Ji L Friedheim J Zhang R 2012 A new family of
nanoparticle based drilling fluids SPE Annual Technical Conference and Exhibition San
Antonio
Simell PA Hirvensalo EK Smolander VT 1999 Steam reforming of gasification gas tar
over dolomite with benzene as a model compound Ind Eng Chem Res 38 1250-1257
Song K Zhang H Wu Q Zhang Z Zhou C Zhang Q Lei T 2015 Structure and
thermal properties of tar from gasification of agricultural crop residue J Therm Anal
Calorim 119 27-35
Sun F Lin M Dong Z Zhang J Wang C Wang S Song F 2015 Nanosilica-induced
high mechanical strength of nanocomposite hydrogel for killing fluids J Colloid
Interface Sci 458 45-52
Swierczynski D Courson C Kiennemann A 2008 Study of steam reforming of toluene used
as model compound of tar produced by biomass gasification Chem Eng Process 47
508-513
Wu X Liu Y Fang M Mei L Luo B 2011 Preparation and characterization of carbon
foams derived from aluminosilicate and phenolic resin Carbon 49 1782-1786
Yanik J Kommayer C Saglam M Yueksel M 2007 Fast pyrolysis of agricultural wastes
Characterization of pyrolysis products Fuel Process Technol 88 942-947
10
CHAPTER 2 STRUCTURE AND THERMAL PROPERTIES OF TAR FROM
GASIFICATION OF AGRICULTURAL CROP RESIDUE1
21 INTRODUCTION
Energy shortage environmental pollution and global warming have been becoming crucial
issues in the past few decades Biomass from industrial crops such as straw and corn stover is
one of the promising alternatives to petroleum-based resources for meeting societyrsquos increasing
demand for material and energy (Ghani et al 2013) Through thermochemical transformation
including pyrolysis and gasification biomass generates gases liquids and solid fuels Tar is an
inevitable by-product in the thermal conversion processes of biomass The disposal of tar is very
cumbersome and costly The usual methods such as landfilling can lead to environment
contamination due to tarrsquos high resistance to degradation (Li and Suzuki 2010) On the other
hand tar is a valuable resource for chemicals and carbonaceous materials For example tar has
been used for the substitution of phenol in phenol-formaldehyde (PF) resins (Lu and Wu 2013)
wood preservatives (Suzuki et al 1997) and utilized for the preparation of activated carbon
fibers (Bui et al 2009) Understanding of the chemical structure and thermal properties of tar is
essential for enhancing the performance of the resultant materials
Tar represents a complex mixture of condensable hydrocarbons including single ring to
five-ring aromatic compounds along with other oxygen-containing hydrocarbons and complex
polycyclic aromatic hydrocarbons (PAHs) (Li and Suzuki 2009b) Its chemical composition
depends on the sources of biomass and thermochemical conversion conditions (Aigner et al
2009 Ku and Mun 2006 Yanik et al 2007) The structure of pitch from coal or petroleum has
This chapter previously appeared as Song K Zhang H Wu Q Zhang Z Zhou C
Zhang Q Lei T Structure and Thermal Properties of Tar from Gasification of Agricultural
Crop Residue J Therm Anal Calorim 2015 119 27-35 It is reprinted by permission of
Springer
11
been well investigated (Alcantildeiz-Monge et al 2001 Jiang et al 2007 Sun et al 2011)
However little attention has been paid to the chemical composition of tar from biomass
gasification or pyrolysis Therefore it is necessary to quantitatively characterize the constituents
of tar to facilitate its further processing and utilization
Aside from the chemical composition of tar its thermal degradation behavior also plays an
essential role in understanding the thermal stability properties of tar derived chemicals and
materials Decomposition of tar mainly occurs through cracking steam reforming dry reforming
and carbon formation reactions (Li and Suzuki 2009b) Previous research has focused on
combustion properties of tar from different biomass sources in the presence of oxygen or
catalysts (Li and Suzuki 2009b Li et al 2009) However few studies have considered the
thermal behavior of tar under controlled inert atmosphere In addition tar decomposition analysis
has been frequently simplified by selecting a model compound of tar such as naphthalene (Devi
et al 2005) toluene (Swierczynski et al 2008) benzene (Simell et al 1999) and 1-
methylnaphthalene (Dou et al 2003) However a single model component cannot reflect the
complex decomposition reaction mechanism of real tar and the interactions of its components
Thus thermal analysis performed on the entire tar material is required
The objective of this study was to investigate the chemical composition and thermal
degradation of biomass tar obtained from corn stover gasification aiming at facilitating the
further processing and utilization of this promising biomaterial The tar composition was
characterized by gas chromatography-mass spectroscopy (GC-MS) Fourier transform infrared
(FTIR) spectroscopy and elemental analysis Thermogravimetry with multiple-heating rates
under non-isothermal conditions was used to provide data for thermal kinetic analysis of this
material
12
22 MATERIALS AND METHODS
221 Materials
Tar was produced by gasification of corn stover feedstock at 500-600 degC in Xigou Biomass
Fuel Gas Plant (Xihe Shanxi China) The plant used fixed bed downdraft gasifiers producing
about 200 m3 of fuel gas per hour mainly for cooking uses The gasification efficiency was about
75 and total energy output was about 11times10-9 Jh The plant consumed about 180 tons of
agricultural residues per year The collected tar material was vacuum dried to remove the water
at 80 degC and then placed in a sealed container for further analysis
222 Characterization
2221 GC-MS Analysis
The dried tar (5 g) was added into ethyl acetate (50 mL) with a ratio (tarsolvent = 1 g10
mL) The obtained mixture was kept under vigorous magnetic stirring at room temperature for 24
h The resulting suspension was centrifuged for 30 min and the upper liquid fraction was
collected and diluted to a mass concentration of 05 for GC-MS analysis (Figure 21) The
solid fraction was dried in vacuum at 80 degC and weighed (141 g) prior to elemental analysis
The liquid fraction had a mass of 360 g tar in ethyl acetate taking up 7180 wt of the original
dried tar A HP-3800 gas chromatograph (GC) equipped with splitsplitless injector and a HP-
8410 automatic sampler with splitless injection were used to analyze the composition of tar The
injector was maintained at 250 degC with helium as the carrier gas at a flow rate of approximately
10 mLmin The GC was equipped with a 30 m (length) times 025 mm (inner diameter) Hewlett
Packard HP-5MS capillary column The oven temperature was kept at 40 degC for 3 min and then
heated to 200 degC at 15 degCmin followed with further heating to 280 degC at 1 degCmin This
temperature was held for 5 min The end of the column was directly introduced into the ion
13
source of a HP 5970 mass selective detector (MSD) with electron ionization (EI) mode During
the test the transfer line was set at 270 degC ion source was kept at 250 degC and electron energy
remained at 70 eV The data acquisition was done with HP-UX chemstation software associated
with a HP-UNIX computer and NBS mass spectra library database The quantitative evaluation
was based on the relative percent areas of the single peaks related to the total peak area
Figure 21 Scheme illustrating the drying and centrifuging processes of biomass tar for GC-MS
analysis
2222 FTIR Spectroscopy
A Bruker FTIR analyzer (Tensor-27 Bruker Optics Inc Billerica MA) equipped with an
attenuated total reflectance (ATR) cell of ZnSe single crystal was used for the study The FTIR
spectra of the dried tar and the residue after its decomposition at 600 degC by a heating rate of
10 degCmin in N2 atmosphere were recorded Each spectrum was recorded by accumulation of 32
scans in N2 atmosphere with a spectral resolution of 4 cm-1 between 4000 and 700 cm-1 The
baseline was corrected at 3750 1800 and 700 cm-1 by the attached software (OPUS 72 Bruker)
2223 Elemental Analysis
The elemental composition of tar was analyzed using a Perkin-Elmer automatic CHN
analyzer (Atlantic Microlab Inc Norcross GA USA) The content of C H and N was obtained
14
directly while the oxygen content was determined by the difference in mass between the initial
tar and the total mass of C H and O In this study the dried whole tar and thermally treated tar
with different temperatures (180 250 350 and 600 degC for 1 h) and N2 atmosphere were
analyzed and compared
2224 Thermogravimetry (TG) Analysis
A TA Q50 analyzer (TA Instruments Inc New Castle DE United States) with a resolution
of 01 μg was used to study the thermal decomposition of the tar Non-isothermal conditions
from 30 to 800 degC were applied at various heating rates of 5 10 15 20 25 and 30 degCmin in the
N2 atmosphere (60 mLmin) The material was ground into powder and dried in vacuum at 80 degC
for 48 h prior to analysis A sample of 5-10 mg was used for each measurement At least three
replicated samples were run at each heating rate to guarantee the repeatability and reliability of
data The mass loss curves (TG) and differential TG curves (DTG) were recorded as a function
of temperature
2225 Thermal Kinetic Analysis
The thermal analysis kinetics of solid state reaction is commonly based on a single-step
kinetic equation (Brown et al 1980)
d120572d119905 = 119870(119879)119891(120572) (21)
where K is the temperature-dependent reaction rate constant T is the temperature f(α) is a
reaction function depending on actual reaction mechanism and dαdt is the rate of biomass
conversion The extent of conversion α is defined as
120572 = (1198820 minus119882t)(1198820 minus119882f) (22)
15
where W0 Wt and Wf are the mass of the sample during the decomposition process at the initial
given time and final moment respectively The reaction rate constant (K) is commonly
described by the Arrhenius equation
119870(119879) = 119860exp(minus119864119877119879) (23)
where A is the pre-exponential factor (s-1) R is the universal gas constant (8314 J(Kmiddotmol)) E is
the apparent activation energy (kJmol) and T is the absolute temperature (K) Combination of
Eq 21 and Eq 23 gives the following kinetic function
d120572d119905 = 119860exp(minus119864119877119879)119891(120572) (24)
Thermal analysis kinetic study is usually carried out in an isothermal or a non-isothermal
experiment The former process is completed in narrower temperature ranges and truly
isothermal conditions cannot be gained for the very low and high reaction extent (α) resulting
partially from self-heating or self-cooling (Maciejewski 2000) The non-isothermal method is
suitable for a broader temperature range to detect the complex nature of multi-step solid state
reaction processes (Maciejewski 2000) For dynamic non-isothermal analysis the heating rate is
defined as = dTdt Thus the basic expression to obtain the kinetic triplet [E A and f(α)] based
on experimental data can be described as
d120572d119879 = (119860120573)exp(minus119864119877119879)119891(120572) (25)
The analytical methods used to obtain the kinetic parameters under non-isothermal
conditions generally include model-fitting and model-free methods The former approach is
considered as insufficient in non-isothermal kinetic studies considering the limited applicability
of single heating rate data (Burnham 2000 Khawam and Flanagan 2005) On the other hand
the model-free methods based on multi-heating rates and iso-conversional data are more helpful
in the kinetic analysis (Vyazovkin et al 2011) The method has been effective to obtain the
16
thermal kinetic parameters of biomass (Li and Suzuki 2009a Loacutepez et al 2013) The Friedman
method and the distributed activation energy model (DAEM) are two common model-free
methods
The Friedman method is a differential iso-conversional method assuming a single nth-order
reaction occurs which is based on the below function by taking the natural logarithm of Eq 25
ln(120573d120572d119879) = ln119860 + ln[119891(120572)] minus 119864119877119879 (26)
For a particular reaction order model replacing f(α) by (1-α)n gives the following function
ln(120573d120572d119879) = ln119860 + 119899ln(1 minus 120572) minus 119864119877119879 (27)
By plotting ln(βdαdT) against 1T the apparent activation energy (E) and the pre-exponential
factor (A) at a given conversion rate (α) can be obtained from the slope and intercept of the linear
portion of the plot
The DAEM method was originally proposed by Vand (Vand 1943) and further developed
(Miura and Maki 1998) to describe complex reactions by assuming that a set of parallel
irreversible 1st order reactions occur simultaneously (Miura 1995 Miura and Maki 1998) The
model has the following form
1 minus 120572 = int exp (minus119896 int eminus119864 119877119879frasl d119905119905
0) 119891(119864)
infin
0d119864 (28)
where f(E) is the distribution of activation energies representing different reactions and k is the
frequency factor corresponding to the E value Through theoretical derivation and approximation
[26] a simplified equation is obtained as
ln(1205731198792) = ln(119896119877119864) + 06075 minus 119864119877119879 (29)
At a selected extent of conversion E and A can be determined by plotting ln(βT2) against
1T Thus the relationship between activation energy and extent of conversion can be also
17
obtained At least three sets of data are needed in the DAEM method Six heating rates (5 10 15
20 25 and 30 degCmin) were selected in this study
23 RESULTS AND DISCUSSION
231 Chemical Composition
The chemical composition of the tar from the GC-MS analysis is presented in Table 21
The tar was composed mainly of phenols and PAHs representing approximately 80 of the
dissolved tar in ethyl acetate in the molecular mass range from 94 to 202 (Table 21) Phenols
accounted for 45 of the tar including phenol ethylphenol methylphenol dimethylphenol and
methoxyphenol The PAHs mainly consisted of naphthalene methylnaphthalene acenaphthylene
anthracene biphenyl fluoranthene and phenanthrene which accounted for 31 of the soluble
tar in ethyl acetate Besides the tar contained 7 of furans and 17 of other materials such as
aliphatics esters acids etc Thus the main components of the tar were phenols and PAHs
similar to the results found in the investigation on tars from wood and bamboo (Ku and Mun
2006 Mun and Ku 2010) It was found that at higher temperatures more phenolics and
hydrocarbons were formed in biomass tars (Elliott 1988) The tar in this study was produced
from biomass gasification at around 500-600 degC and had 45 phenols and 31 PAHs which
was in an agreement with the results from previous studies
The typical IR detectable functional groups in the tar (Figure 22) are listed in Table 22
These data were similar to those of other tars reported in the literature (Pakdel and Roy 1991
Prauchner et al 2001) The IR spectra showed that the tar contained methylene groups (2923
2854 cm-1) rather than methyl groups The aromatic structure was indicated by the IR bands at
3060 1597 1512 830 and 750 cm-1 The absorption at 1265 and 1036 cm-1 were asymmetrical
and symmetrical stretching of aryl-alkyl ethers associated with aromatic rings In addition the IR
18
Table 21 Chemical components of the biomass tar by GC-MS
Component Formula Molecular Weight Relative Content ()
4-ethyl-phenol C8H10O 122 944
Phenol C6H6O 94 749
3-methyl-phenol C7H8O 108 638
Naphthalene C10H8 128 614
Acenaphthylene C12H8 152 569
23-dihydro-Benzofuran C8H8O 120 530
Anthracene C14H10 178 461
2-methyl-phenol C7H8O 108 351
4-ethyl-2-methoxy-phenol C9H12O2 152 343
1-methyl-naphthalene C11H10 142 326
2-methyl-naphthalene C11H10 142 258
25-dimethyl-phenol C8H10O 122 226
2-methoxy-4-vinylphenol C9H10O2 150 224
24-dimethyl-phenol C8H10O 122 222
4-ethyl-3-methyl-phenol C9H12O 136 202
1H-phenalene C13H10 166 202
Dibenzofuran C12H8O 168 160
2-methoxy-phenol C7H8O2 124 159
23-Dimethylhydroquinone C8H10O2 138 158
Biphenyl C12H10 154 156
26-dimethoxy-phenol C8H10O3 154 155
17-dimethyl-naphthalene C12H12 156 153
Fluoranthene C16H10 202 145
26-dimethoxy-4-(2-propenyl)-phenol C11H14O3 194 143
11-(13-butadiyne-14-diyl)bis-benzene C16H10 202 122
2-ethenyl-naphthalene C12H10 154 120
Phenanthrene C14H10 178 111
Others 1559
19
stretching of carbonyl groups at 1686 cm-1 was lower than the typical stretching of carbonyl at
1715 cm-1 in ketone which was probably caused by the conjugation of carbonyl groups with
aromatic structure and the delocalization of π electrons (Silverstein et al 2005) In summary the
FTIR spectra indicated the predominance of phenols aromatic structures ethers aliphatic and
carbonyl groups which agreed well with the GC-MS data These groups disappeared in the
residue after thermal degradation indicating that the main components of the biomass tar
decomposed completely at 600 degC in the N2 atmosphere (Figure 22)
Figure 22 FTIR spectra of the original tar and the tar after thermal treatment at 600 ˚C under N2
atmosphere
The elemental analysis showed the enrichment of carbon from ca 50 (in biomass) to ca
75 in the tar but the oxygen content of the tar at ca 15 was still high Temperature
treatment up to 600 degC decreased the oxygen content from ca 16 to 13 (Table 23) The high
oxygen content in comparison with fossil pitches (Alcantildeiz-Monge et al 2001) was a problem
from the energetic point of view On the other hand biomass tar was more reactive as indicated
by the higher HC and OC values compared to fossil pitches (Alcantildeiz-Monge et al 2001)
which was supported by its constituents (aliphatics esters acids carbonyl etc) based on GC-
20
MS and FTIR analysis The values of HC and OC largely decreased when the thermal treatment
temperature reached 600 degC It was proposed that thermal-chemical conversion of tar was
associated with volatilization of low molecular mass hydrocarbons and reactions such as
dehydrogenation condensation and polymerization through the loss of side alky groups from
aromatic compounds (Lewis 1987) Therefore the decreased HC and OC values at higher
thermal treatment temperatures were probably caused by dehydrogenation and the loss of side
groups such as aliphatic groups associated with aromatic rings
Table 22 The IR absorption bands for functional groups of the biomass tar
Wavenumber (cm-1) Functional Groups Compounds
3271 O-H Stretching Phenols
3060 C-H Stretching Aromatic
2923 2854 CH2 Asymmetrical and symmetrical stretching Alkyl aliphatic
1686 C=O stretching Carbonyl
1597 Aromatic skeletal vibration together with C=O Aromatic
stretching vibration
1512 Aromatic skeletal vibration Aromatic
1450 CH2 Symmetrical bending vibration Alkyl aliphatic
1265 1036 C-O-C Asymmetrical and symmetrical stretching Aryl-alkyl ether
1115 C-O-C Asymmetrical stretching Dialkyl ethers
830 750 C-H out-of-plane bending Aromatic
Table 23 Elemental analysis of biomass tar
Samples C () H () N () O () HC c OC
Original a 7513 667 256 1564 0089 0208
180 ˚C b 7605 622 255 1518 0082 0200
250 ˚C 7672 595 285 1448 0078 0189
350 ˚C 7911 515 337 1237 0065 0156
600 ˚C 8083 283 327 1307 0035 0162
a The tar after being dried by vacuum b The tar by thermal treatment at 180 ˚C under nitrogen atmosphere c The ratio of hydrogen and carbon determined by mass
21
231 Thermal Decomposition
Figure 23 Thermal gravimetric curves of biomass tar at different heating rates under nitrogen
atmosphere (a) the temperature dependence of the extent of conversion (α) for different heating
rates (b)
Typical TG profiles of the tar at different heating rates are presented in Figure 23a The
onset decomposition temperature (defined as the temperature at the mass loss of 5 ) was within
the range of 133-162 degC depending on the heating rates The DTG curves showed one distinct
peak between 183 degC (5 degCmin) and 252 degC (30 degCmin) under each heating rate indicating the
highest decomposition rate of the tar Under all heating conditions the final solid residue was in
the range of 28-30 at 600 degC The onset and main thermal degradation temperatures of the tar
were slightly lower compared with previously studied biomass feedstock such as wood (Shen et
al 2011) corn stover (Ma et al 2013) and other agricultural residue (Yao et al 2008 Yi et al
2013) This could be attributed to relatively low molecular mass components in the tar formed by
the breakdown of high molecular mass lignocellulosic materials during biomass gasification The
thermal decomposition process of the tar occurred in a wide temperature range at each heating
rate indicating the complex chemical composition of the tar (confirmed by the GC-MS and
FTIR analysis) The peak of mass loss rate in the DTG curves shifted toward higher temperatures
with the increasing heating rates (Figure 23b) This was due to the heat transfer lag at higher
heating rates However the final mass loss of tar was not affected by the heating rates
22
Figure 24 Arrhenius plots at selected conversion rates by Friedman (a) and DAEM (b) method
The kinetic parameters from the Friedman and DAEM models are determined by the iso-
conversional method and the data is presented in Figure 24 with the extent of conversion (α)
plotted as a function of temperature The Friedman method simplified the decomposition of tar
as a single reaction and the extent of conversion behaved as a global degradation rate to which
all tar components contributed as a uniform group The DAEM method assumed a set of parallel
irreversible 1st order reactions occurring simultaneously This approach was widely applied for
the thermal kinetic analysis of biomass including agricultural residues (Ma et al 2013 Sonobe
and Worasuwannarak 2008) wood (Shen et al 2011) and pyrolysis products from fowl
dropping (Li and Suzuki 2009b) The Arrhenius plots of ln(ddT) as a function of 1T by
Friedman method and ln(T2) against 1T by the DAEM method are shown in Figure 24 Linear
and parallel relationships were observed from the conversion range of 01-06 indicating
unchanged activation energies at this stage Accordingly the thermal decomposition of the tar
could be described as a set of parallel single reactions or a uniform multiple reaction mechanism
within the conversion rates of 01-06 The unsatisfactory parallelity of the plots at higher
conversion rates (αgt06) indicated the change of reaction mechanism which was interpreted as a
sign of a multiple-step reaction mechanism (Ozawa 1965) The change of reaction mechanism at
23
higher conversion rates could be due to the complex reactions in the thermal decomposition
process of the main components in the tar (Yao et al 2008)
Figure 25 The activation energy (E) plotted against the extent of conversion rate (α)
The average apparent activation energy data calculated from the slopes of the Arrhenius
plots by the two models is shown as a function of conversion (Figure 25) The activation energy
values from the Friedman and DAEM methods showed the same trends and increased essentially
only above the conversion rate of 06 The similar results were reported in the study of natural
fibers (Yao et al 2008) The differential Friedman method gave an average activation energy
value of 107 kJmol in the conversion range of 01-06 while the DAEM method led to an
average value of 85 kJmol within the same conversion range The value by the Friedman
method was higher than the one by the DAEM method It was suggested that different kinetics
analysis methods were complementary rather than competitive (Brown et al 2000) Thus an
appropriate activation energy range should be acquired by applying different methods
Consequently the general activation energy range of 80-110 kJmol was obtained for the thermal
decomposition of the tar in the N2 atmosphere This was within activation energy range (60-170
kJmol) from a variety of biomass (Di Blasi 2002 Groslashnli et al 2002 Kumar et al 2008) As
mentioned above the reaction mechanism changed when the conversion rate was larger than 06
24
which resulted in the complexity of modeling the entire thermal decomposition process of the tar
Therefore this study focused on the conversion range of 01-06 within which the
decomposition of main components completed during the aforementioned temperature range
from 183 to 252 degC By this way the degradation process of the tar was simplified which was
quite meaningful for understanding the thermal properties of tar derived materials
24 CONCLUSIONS
In this study a comprehensive analysis of chemical composition and thermal degradation
of the tar from corn stover gasification was carried out The tar was a complex mixture mainly
composed of highly branched PAHs furans aliphatics and esters as indicated by the GC-MS
and FTIR spectroscopy The elemental analysis showed that biomass tar with higher HC and
OC was more oxygenated and less aromatic than fossil pitches implying that the tar was more
reactive The complex composition of the tar led to a broad thermal decomposition temperature
range The tar decomposed at a low temperature (183-252 degC depending on the heating rates)
compared with biomass feedstock due to the low molecular mass components in the tar
produced by gasification The thermal decomposition kinetics of the tar indicated that single
reaction mechanism can be applied at low conversion and the reaction mechanism changed at
higher conversions caused by the complex reactions in decomposition process of biomass tar
The tar decomposition was simplified by focusing on the conversion range of 01-06 and a
general activation energy range of 80-110 kJmol by the two models The simplified approach is
helpful for better understanding the thermal properties of tar derived materials and facilitating its
further processing and utilization
25
25 REFERENCES
Aigner I Wolfesberger U Hofbauer H 2009 Tar content and composition in producer gas of
fluidized bed gasification and low temperature pyrolysis of straw and wood - influence of
temperature International Conference on Polygeneration Strategies Vienna
Alcantildeiz-Monge J Cazorla-Amoroacutes D Linares-Solano A 2001 Characterisation of coal tar
pitches by thermal analysis infrared spectroscopy and solvent fractionation Fuel 80 41-
48
Brown ME Dollimore D Galwey AK (Eds) 1980 Reactions in the Solid State Elsevier
Science
Brown ME Maciejewski M Vyazovkin S Nomen R Sempere J Burnham A
Opfermann J Strey R Anderson HL Kemmler A Keuleers R Janssens J
Desseyn HO Li C-R Tang TB Roduit B Malek J Mitsuhashi T 2000
Computational aspects of kinetic analysis Part A The ICTAC kinetics project-data
methods and results Thermochim Acta 355 125-143
Bui NN Kim BH Yang KS Dela Cruz ME Ferraris JP 2009 Activated carbon fibers
from electrospinning of polyacrylonitrilepitch blends Carbon 47 2538-2539
Burnham AK 2000 Computational aspects of kinetic analysis Part D The ICTAC kinetics
project- multi-thermal-history model-fitting methods and their relation to isoconversional
methods Thermochim Acta 355 165-170
Devi L Ptasinski KJ Janssen FJJG 2005 Pretreated olivine as tar removal catalyst for
biomass gasifiers investigation using naphthalene as model biomass tar Fuel Process
Technol 86 707-730
Di Blasi C 2002 Modeling intra- and extra-particle processes of wood fast pyrolysis AlChE J
48 2386-2397
Dou B Gao J Sha X Baek SW 2003 Catalytic cracking of tar component from high-
temperature fuel gas Appl Therm Eng 23 2229-2239
Elliott DC 1988 Relation of reaction time and temperature to chemical composition of
pyrolysis oils in Soltes EJ Milne TA (Eds) Pyrolysis Oils from Biomass American
Chemical Society Washington DC pp 55-65
Ghani WAWAK Mohd A da Silva G Bachmann RT Taufiq-Yap YH Rashid U
Al-Muhtaseb AaH 2013 Biochar production from waste rubber-wood-sawdust and its
potential use in C sequestration Chemical and physical characterization Ind Crops Prod
44 18-24
Groslashnli MG Vaacuterhegyi G Di Blasi C 2002 Thermogravimetric analysis and devolatilization
kinetics of wood Ind Eng Chem Res 41 4201-4208
26
Jiang J Wang Q Wang Y Tong W Xiao B 2007 GCMS analysis of coal tar
composition produced from coal pyrolysis Bull Chem Soc Ethiop 21 229-240
Khawam A Flanagan DR 2005 Role of isoconversional methods in varying activation
energies of solid-state kinetics - II Nonisothermal kinetic studies Thermochim Acta 436
101-112
Ku CS Mun SP 2006 Characterization of pyrolysis tar derived from lignocellulosic biomass
J Ind Eng Chem 12 853-861
Kumar A Wang L Dzenis YA Jones DD Hanna MA 2008 Thermogravimetric
characterization of corn stover as gasification and pyrolysis feedstock Biomass
Bioenergy 32 460-467
Lewis IC 1987 Chemistry of pitch carbonization Fuel 66 1527-1531
Li C Suzuki K 2009a Kinetic analyses of biomass tar pyrolysis using the distributed
activation energy model by TGDTA technique J Therm Anal Calorim 98 261-266
Li C Suzuki K 2009b Tar property analysis reforming mechanism and model for biomass
gasification-An overview Renew Sus Energ Rev 13 594-604
Li C Yamamoto Y Suzuki M Hirabayashi D Suzuki K 2009 Study on the combustion
kinetic characteristics of biomass tar catalysts J Therm Anal Calorim 95 991-997
Li CS Suzuki K 2010 Resources properties and utilization of tar Resour Conserv Recy
54 905-915
Loacutepez R Fernaacutendez C Goacutemez X Martiacutenez O Saacutenchez M 2013 Thermogravimetric
analysis of lignocellulosic and microalgae biomasses and their blends during combustion
J Therm Anal Calorim 114 295-305
Lu KT Wu LY 2013 Substitution of phenol in phenol-formaldehyde (PF) resins by wood
tar for plywood adhesives Holzforschung 67 413-419
Ma F Zeng Y Wang J Yang Y Yang X Zhang X 2013 Thermogravimetric study and
kinetic analysis of fungal pretreated corn stover using the distributed activation energy
model Bioresour Technol 128 417-422
Maciejewski M 2000 Computational aspects of kinetic analysis Part B The ICTAC Kinetics
Project-the decomposition kinetics of calcium carbonate revisited or some tips on
survival in the kinetic minefield Thermochim Acta 355 145-154
Miura K 1995 A new and simple method to estimate f(E) and k0(E) in the distributed
activation energy model from three Sets of experimental data Energy Fuels 9 302-307
Miura K Maki T 1998 A simple method for estimating f(E) and k0(E) in the distributed
activation energy model Energy Fuels 12 864-869
27
Mun S Ku C 2010 Pyrolysis GC-MS analysis of tars formed during the aging of wood and
bamboo crude vinegars J Wood Sci 56 47-52
Ozawa T 1965 A new method of analyzing thermogravimetric data Bull Chem Soc Jpn 38
1881-1886
Pakdel H Roy C 1991 Hydrocarbon content of liquid products and tar from pyrolysis and
gasification of wood Energy Fuels 5 427-436
Prauchner MJ Pasa VMD Otani C Otani S 2001 Characterization and thermal
polymerization of Eucalyptus tar pitches Energy Fuels 15 449-454
Shen DK Gu S Jin B Fang MX 2011 Thermal degradation mechanisms of wood under
inert and oxidative environments using DAEM methods Bioresour Technol 102 2047-
2052
Silverstein RRM Webster FX Kiemle DJ (Eds) 2005 The spectrometric identification of
organic compounds John Wiley amp Sons Australia Limited Hoboken
Simell PA Hirvensalo EK Smolander VT 1999 Steam reforming of gasification gas tar
over dolomite with benzene as a model compound Ind Eng Chem Res 38 1250-1257
Sonobe T Worasuwannarak N 2008 Kinetic analyses of biomass pyrolysis using the
distributed activation energy model Fuel 87 414-421
Sun M Ma XX Yao QX Wang RC Ma YX Feng G Shang JX Xu L Yang YH
2011 GC-MS and TG-FTIR study of petroleum ether extract and residue from low
temperature coal tar Energy Fuels 25 1140-1145
Suzuki T Yamakawa M Yamamoto K Watanabe T Funaki M 1997 Recovery of wood
preservatives from wood pyrolysis tar by solvent extraction Holzforschung 51 214-218
Swierczynski D Courson C Kiennemann A 2008 Study of steam reforming of toluene used
as model compound of tar produced by biomass gasification Chem Eng Process 47
508-513
Vand V 1943 A theory of the irreversible electrical resistance changes of metallic films
evaporated in vacuum Proc Phys Soc 55 0222-0246
Vyazovkin S Burnham AK Criado JM Peacuterez-Maqueda LA Popescu C Sbirrazzuoli
N 2011 ICTAC kinetics committee recommendations for performing kinetic
computations on thermal analysis data Thermochim Acta 520 1-19
Yanik J Kommayer C Saglam M Yueksel M 2007 Fast pyrolysis of agricultural wastes
Characterization of pyrolysis products Fuel Process Technol 88 942-947
28
Yao F Wu Q Lei Y Guo W Xu Y 2008 Thermal decomposition kinetics of natural
fibers activation energy with dynamic thermogravimetric analysis Polym Degrad Stab
93 90-98
Yi Q Qi F Cheng G Zhang Y Xiao B Hu Z Liu S Cai H Xu S 2013
Thermogravimetric analysis of co-combustion of biomass and biochar J Therm Anal
Calorim 112 1475-1479
29
CHAPTER 3 FABRICATING ELECTROSPUN NANOFIBER WITH ANTIMICROBIAL
CAPABILITY A FACILE ROUTE TO RECYCLE BIOMASS TAR2
31 INTRODUCTION
Energy shortage environmental pollution and global warming are crucial issues that drive
us to utilize renewable natural resources in a more sustainable way Biomass and biofuels are
promising alternatives to petroleum-derived materials and energy due to their unique
characteristics including abundance renewability and carbon neutrality Thermochemical
transformations such as pyrolysis and gasification can convert biomass into biofuels (Vassilev et
al 2010) However tar (heavy hydrocarbons) is always produced as a by-product from biomass
thermochemical conversion processes (Di Marcello et al 2014) The tar needs to be removed
from the producer gas to avoid operational problems associated with clogging in downstream
units and the poisoning of catalysts in end-use applications (Tuomi et al 2015) The disposal of
tar can cause environmental pollution due to its high resistance to degradation (Li and Suzuki
2010) and the current treatments focus on tar reforming processes using steam and catalysts
(Wang et al 2013 Widayatno et al 2014) However these processes are quite complex and
costly Therefore comprehensive separation and utilization technologies for biomass tar are
needed for sustainable application of biomass biofuels and valued-added chemicals and to
expand the scope of biomass utilization
Considering its high carbon content it should be possible to utilize biomass tar as a carbon-
based feedstock Tar is a complex mixture of hydrocarbons including single ring to five-ring
polycyclic aromatic hydrocarbons (PAHs) along with other oxygen-containing hydrocarbons
This chapter previously appeared as Song K Wu Q Zhang Z Ren S Lei T Dooley
KM Liu D Janes ME Fabricating Electrospun Nanofibers with Antimicrobial Capability A
Facile Route to Recycle Biomass Tar Fuel 2015 150 123-130 It is reprinted by permission of
Elsevier
30
such as polyphenols (Li and Suzuki 2009 Rice et al 2011) Tar from biomass gasification is
mainly composed of phenols aromatics furans aliphatics and esters (Song et al 2015 Yu et al
2014) Elemental analysis showed that the tar with higher HC and OC was more oxygenated
and less aromatic than fossil pitches implying that the tar was more reactive (Song et al 2015)
The components of the tar can be extracted to use as valuable substitutes for petroleum derived
chemicals In the past a larger number of chemicals such as anthracene acenaphthene pyrene
phenol and most of heterocyclic aromatic compounds were extracted from coal tar but the
procedures for separation and purification were quite complex (Amen-Chen et al 1997 Li and
Suzuki 2010) Accordingly it is much more practical and cost-effective to utilize tar as a whole
Using the entire tar or pitch carbon fibers and carbon foams were fabricated and utilized as
adsorption or filtration medium due to their large surface areas and high porosities (Bui et al
2009 Li et al 2011) However most previous research focused on using tar or pitch from coal
and petroleum and little attention was paid to the utilization of tar from biomass Limited
attempts were made to use wood tar as preservatives for wood and as a component in phenol-
formaldehyde resin formulation in plywood adhesives (Lu and Wu 2013 Suzuki et al 1997)
However no study has been carried out so far to manufacture fibrous materials using tar from
biomass thermochemical conversions
Among the fiber fabricating techniques electrospinning has emerged as a simple and
highly versatile method to prepare multifunctional fibers from a remarkable range of organic and
inorganic materials (Reneker and Yarin 2008) For typical electrospinning the spinning
solutions or suspensions are ejected from the needle tip under the driving force of high voltage
During the travel of the electrospun jet from a needle tip to a grounded collector the solvent
evaporates and ultrafine fibers form and are deposited on the collector Owing to their desirable
31
characteristics including small width large specific surface area multi-scale porosity and high
flexibility for surface functionalization these electrospun nanofibers have wide applications in
adsorption filtration optoelectronics sensors tissue engineering and antimicrobial materials
(Greiner and Wendorff 2007) Some industrial products such as filtration and purification films
are produced by electrospinning and continuous efforts have been made to optimize the
electrospinning process (Persano et al 2013) Electrospun fibers have been produced from
petroleum-based isotropic pitch dispersed in tetrahydrofuran (THF) (Park et al 2003 Park et al
2004) However these fibers were beaded due to a low solution viscosity resulted from the low
molecular weight and solubility of the tar in solvents This problem can be resolved by blending
tar or pitch with a polymer such as polyacrylonitrile (PAN) (Bui et al 2009) Combining the
outstanding electrospinnability of PAN and the variety of surface functional groups found in tar
enables fabrication of continuous electrospun nanofibers with varying functionalities
In this study functional nanofibers were prepared by electrospinning tarPAN suspensions
The electrospinnability of the tarPAN suspensions and the properties of the resultant nanofibers
with varying tar contents were investigated The electrospun nanofibers were characterized by
field emission scanning electron microscopy (FE-SEM) attenuated total reflection Fourier
transform infrared (ATR-FTIR) spectroscopy thermal gravimetric analysis (TGA) and N2
adsorptiondesorption measurements Additionally antimicrobial activities of the electrospun
nanofibers were tested against Gram-positive S aureus and Gram-negative E coli bacteria
32 MATERIALS AND METHODS
321 Materials
Tar was produced from the gasification of corn stover at 500-600 degC in the Xigou Biomass
Fuel Gas Plant Shanxi China The collected tar material was dried in a vacuum oven at 80 degC
32
for at least 48 h to remove water The dried tar was placed in a sealed container for further
treatment Polyacrylonitrile (PAN Mw = 150000 gmol) and N N-dimethylformamide (DMF)
were supplied by Sigma-Aldrich (St Louis MO USA)
322 Electrospinning SolutionsSuspensions
PAN powder (1 g) was mixed with DMF (9 g) and vigorously stirred overnight at room
temperature to obtain a homogenous solution Meanwhile the dried tar powder was dispersed in
DMF under vigorous magnetic stirring for at least 24 h The as-prepared PAN solution and tar
suspensions were mixed and transferred to an ultrasonic bath further dispersing the tar for 30
min to create the final electrospinning tarPAN suspensions The suspensions with the addition
of 30 50 and 100 wt tar based on PAN by weight were designated as 30TarPAN 50TarPAN
and 100TarPAN respectively (numbers representing relative weight percentage of tar to PAN in
the suspensions)
Conductivities of the prepared solutions and suspensions were determined using an Oakton
PC700 pHmVConductivitydegC bench meter (Oakton Instruments Vernon Hills IL USA)
Shear viscosities were measured by a rheometer (AR2000ex TA Instruments New Castle DE
USA) A 40 mm cone-plate geometry with a cone angle of 1 deg59ʹ42ʹʹ and a truncation of 56 μm
was used for the viscosity measurements The viscosities were measured at shear rates ranging
from 01 to 1000 s-1 at 25 degC To avoid evaporation of solvent during testing a solvent trap cover
was used to seal the 56 μm gap between cone and parallel plate and the moat on the top of the
cover was filled with low-viscosity silicon oil
323 Fabrication of Electrospun TarPAN Nanofibers
The prepared precursor solution or suspension was transferred into a 5 mL glass syringe
with a 0413 mm inner diameter stainless steel needle (Figure 31) The needle was connected to
33
a high voltage power supply (Gamma High Voltage Research Ormond Beach FL USA) which
generated a positive DC Voltage of 15 kV The solution or suspension was fed at a flow rate of
05 mLh by a syringe pump (Chemyx Fusion 100 Stafford TX USA) A piece of grounded
aluminum foil placed at a horizontal distance of 20 cm from the needle tip was used to collect
ultrafine electrospun nanofibers at a relative humidity of 60 and a temperature of 25 degC The
nanofibers so obtained were dried in a vacuum oven at 60 degC to remove the residual solvent
(DMF) and then sealed for storage prior to structure and property analysis
Figure 31 Schematic illustrating the process for fabricating biomass tarPAN nanofibers by
electrospinning
324 Characterizations
Surface morphologies of the neat PAN and tarPAN nanofibers were observed with a field
emission scanning electron microscope (FE-SEM FEI QuantaTM 3D FEG Dual Beam SEMFIB
Hillsboro OR USA) at 10 kV Each specimen was coated with a thin layer of gold prior to the
FE-SEM observation The distribution of the nanofiber diameters was obtained by analysis of
FE-SEM micrographs using image processing software (Image J 146r) One hundred individual
nanofibers were randomly measured from each image and the average and standard deviation
values were obtained
34
Fourier transform infrared (FTIR) spectra of the nanofibers were collected using a Bruker
FTIR spectrometer (Alpha Bruker Optics Inc Billerica MA USA) in attenuated total
reflectance (ATR) mode Each spectrum between 4000 and 600 cm-1 was recorded by
accumulation of 64 scans with a spectral resolution of 4 cm-1 The absorption band at 2243 cm-1
due to the CN stretching vibration was used for spectrum normalization This absorption band
was assumed to be essentially unaltered in the eletrospun PAN and tarPAN nanofibers
The thermal decomposition of the nanofibers was investigated by thermogravimetric
analysis (TGA TA Q50 analyzer TA Instruments New Castle DE USA) with a resolution of
01 μg Samples of 5-10 mg were heated from 30 to 600 degC at a rate of 10 degCmin The
measurements were carried out under a N2 atmosphere at a flow rate of 60 mLmin Differential
scanning calorimetry (DSC) measurements were performed with a TA Q200 system under a
nitrogen atmosphere at a flow rate of 60 mLmin Each sample with an approximate weight of 5
mg was scanned from 40 to 350 degC at a heating rate of 10 degCmin
The porosity of the electrospun neat PAN and tarPAN nanofibers was calculated through
the following equation (Xu et al 2007)
Porosity = (ρ0ndashρ)ρ0times100 (31)
where ρ0 and ρ (gmL) are the densities of cast film and electrospun nanofiber respectively The
film samples were cast from a PAN solution and tarPAN suspensions in Petri dishes followed
by evaporation and further vacuum drying at 80 degC overnight
The nitrogen adsorption and desorption isotherms were determined using a Quantachrome
Autosorb-1 porosimeter (Boynton Beach FL United States) at 77 K in order to determine the
intra-fiber porosity and pore size distribution of the electrospun nanofibers Prior to the
adsorption measurements each sample of 1 g was outgassed at 353 K under vacuum until a
35
stable pressure (lt004 mmHg) was obtained The specific surface area was determined from the
nitrogen adsorption branch of the isotherm by the Brunauer-Emmett-Teller (BET) method
(Brunauer et al 1938) The intra-fiber pore size distribution was determined from the nitrogen
desorption branch according to the Barrett-Joyner-Halenda (BJH) method (Barrett et al 1951)
Antimicrobial activity of the as-spun neat PAN and tarPAN nanofibers was tested against
both Gram-positive S aureus and Gram-negative E coli by viable cell counting methods S
aureus and E coli were cultivated in sterilized Tryptic Soy Broth and then incubated overnight at
37 degC with a shaking incubator Culture medium (1 mL) was diluted with 9 mL of sterilized
broth solution The as-spun nanofibers (25 mg) were immersed into the diluted culture
suspension (5 mL) After 24 h incubation and shaking at 37 degC different dilutions (10-1 to 10-5)
were made by successively adding 1 mL culture into 9 mL of broth solution Then 02 mL of the
diluted culture was spread on an agar plate and incubated at 37 degC for 24 h The number of
colonies was counted and three repeats were performed for each sample The antimicrobial
capability of the tarPAN fibers was defined as follows
Antimicrobial () = (A-B)Atimes100 (32)
where A and B are the number of colonies (colony forming unit CFUmL) before and after the
electrospun nanofibers were added respectively
33 RESULTS AND DISCUSSION
331 Characteristics of Electrospinning Solutions
The properties of precursor solution or suspensions including conductivity viscosity and
concentration are important parameters in determining microstructure of the electrospun
nanofibers DMF was selected for preparing the precursor solutionssuspensions because it was
an excellent solvent for PAN and also a good dispersing agent for biomass tar Homogeneous
36
PAN solutions and tarPAN suspensions were prepared and conductivities and viscosities were
measured The values of conductivity were 557 599 614 and 658 μSm for PAN 30TarPAN
50TarPAN and 100TarPAN respectively The improved conductivity with respect to the
increased tar content could be attributed to the presence of the polar functional groups of the tar
components such as hydroxyl carboxyl carbonyl and ethers (Song et al 2015) Similar
findings were obtained when polar materials were blended with polymers in electrospinning
solutions (Chen et al 2013 Zhou et al 2011) The increased conductivity promoted more
continuous spinning of smaller diameter and bead-free fibers because of the increased charge
density in the electrospinning jets (Greiner and Wendorff 2007) However the conductivity
alone does not determine the morphology of the electrospun nanofibers
Figure 32 Variations of apparent viscosity with shear rates for PAN solutions and tarPAN
suspensions
Shear viscosities of PAN solutions and tarPAN suspensions at a shear rate range of 01-
1000 s-1 are shown in Figure 32 The PAN solution was basically a Newtonian fluid at low shear
rates (01-100 s-1) At greater than 100 s-1 the viscosity of the PAN solution decreased with an
37
increase of shear rates exhibiting a typical pseudoplastic behavior resulting from a gradual
removal of chain entanglements with increased shear stress (Zhou et al 2011) Compared to the
PAN solution the viscosities of the tarPAN suspensions were greatly decreased at all shear rates
although the near Newtonian behavior at the lower shear rates persisted except for 100TarPAN
For this sample with equal weights of tar and PAN the viscosity at the lower shear rates was
only slightly lower but the shear-thinning behavior began almost immediately The viscosity
decrease can be attributed to further disruption of PAN chain-chain interactions (entanglements)
by the tar making the PAN molecules much easier to align The low molecular weight tar
essentially acted as a swelling agent (plasticizer) On the other hand the increased viscosities
obtained upon increasing the tar content can be attributed to contributions from the non-swelling
tar components of higher viscosity than DMF It was well known that electrospinning solutions
or suspensions are subjected to very high shear rates when flowing through a steel needle Thus
the PAN solutions and tarPAN suspensions were even less viscous during the electrospinning
process
332 Microstructure of Electrospun Fibers
Surface morphologies of the electrospun PAN and tarPAN nanofibers are shown in Figure
33 The tar suspension without PAN in DMF was not electrospinnable forming discrete droplets
rather than continuous fibers This was due to the low molecular weights of the tar components
which resulted in non-viscous and non-elastic fluid behavior At such a low viscosity the
viscoelastic stress in the electrospun jet was not strong enough to counter the high Coulombic
forces and high surface tension The blending of the biomass tar with PAN allowed
electrospinning of continuous nanofibers to take place due to the excellent electrospinnability of
PAN Nearly homogenous fibers without any beads were randomly deposited on the grounded
38
collector (Figure 33) However it was noted that some bulges appeared on the surface of the
electrospun nanofibers as the tar content increased (Figure 33D) due to aggregation of the tar A
further increase in the tar content of the blends made continuous fiber spinning quite difficult
Consequently one hundred percent of the tar based on PAN by weight represented the largest tar
fraction that could be used to make continuous electrospun nanofibers In addition some surface
pits or dents were present on the rough surfaces of the electrospun nanofibers observed from the
inset photos at a higher magnification (Figure 33) This was due to the rapid evaporative cooling
of the solvent that occurred when the electrospinning jet was being propelled toward the
collector (Park et al 2004) Furthermore the surfaces of the tarPAN nanofibers became much
rougher than the PAN nanofibers especially for the 100TarPAN This could be caused by some
phase separation between the tar and PAN when the solvent evaporated
Figure 33 FE-SEM micrographs of the electrospun nanofibers (inserted photos are at higher
magnification) A PAN B 30TarPAN C 50TarPAN D 100TarPAN
39
Figure 34 Average diameters of the neat PAN and tarPAN electrospun nanofibers
Although the addition of tar had little effect on the surface morphology of the PAN
nanofibers it influenced the average diameter of the nanofibers (Figure 34) The average
diameter of nanofibers from solutions of PAN in DMF was 422 nm The diameters of tarPAN
composite nanofibers increased continuously with respect to tar content up to 948 nm at 100 wt
tar loading level The increased concentrations of the electrospinning suspensions with additional
tar content contributed to these larger nanofiber diameters and the effect was probably larger
than those from the increased conductivity and decreased viscosity Additionally the size
uniformity of tarPAN fibers at 30 and 50 wt tar loading levels was better than that of fibers
with the largest tar content (Figure 34) This can be mainly attributed to the aggregation of tar
and the phase separation mentioned above which became more obvious for 100TarPAN
333 ATR-FTIR Spectra of Electrospun fibers
ATR-FTIR spectra of the PAN and tarPAN nanofibers were collected (Figure 35)
Characteristic absorbance peaks for the PAN nanofibers were observed including the CH2
asymmetrical and symmetrical stretching vibrations at 2929 and 2869 cm-1 the intense CN
stretch at 2243 cm-1 CH2 bending at 1450 cm-1 CH2 wagging at 1364 cm-1 CH wagging at 1248
cm-1 and the skeletal vibration of the PAN backbone at 1070 cm-1 (Arshad et al 2011 Coleman
40
and Petcavich 1978 Liang and Krimm 1958) The bands at 1664 cm-1 appeared as a result of
impurities in the polymer (Liang and Krimm 1958) For the tarPAN nanofibers aside from the
absorption peaks of PAN additional absorption bands characteristic of the tar compounds
appeared namely OH stretching (3359 cm-1) carbonyl stretching (1701 cm-1) aromatic skeletal
vibrations (1609 and 1507 cm-1) asymmetrical stretching of ethers (1113 cm-1) and C-H out-of-
plane bending of aromatics (828 and 760 cm-1) These peaks are typical of IR absorption in
phenols acids ketones aromatics and ethers in the tar (Song et al 2015) and they were not
present in the PAN nanofibers In addition the absorption peaks of the tar components showed
increased intensities with increased tar content in the nanofibers The bands at 2929 2869 and
1450 cm-1 which were ascribed to CH2 absorption from both PAN and tar also showed increased
intensity with increased addition of tar All of these findings confirmed that the tar was
successfully incorporated into the tarPAN electrospun nanofibers
Figure 35 The ATR-FTIR spectra of the PAN 30TarPAN 50TarPAN and 100TarPAN
electrospun nanofibers
41
334 Thermal Properties
Figure 36 TG (solid curves) and DTG (dotted curves) of the PAN fibers tarPAN fibers and
original tar
Figure 36 shows comparisons of measured TG and DTG curves of the PAN nanofibers
tarPAN composite nanofibers and the original tar The as-spun PAN nanofibers showed three
main weight loss stages In the first stage (up to 285 degC) there was only a slight weight loss In
the second stage rapid PAN decomposition with a 30 weight loss occurred in a temperature
range from 285 to 315 degC This weight loss was due to the side chain degradation of the PAN
polymer with release of volatile gases (Chatterjee et al 1995 Xue et al 1997) A further
decrease of weight (from 70 to 42 ) over a broad temperature range of 315-460 degC in the third
stage was mainly caused by decomposition of the carbon-carbon main chain (Chen et al 2013)
Further heating up to the 600 degC did not lead to any significant additional weight loss
The tarPAN composite nanofibers showed an overlap of the mass losses of tar and PAN
Compared with the neat PAN fibers it was clearly seen that the tarPAN nanofibers began to
lose weight at a lower temperature because of the lower decomposition temperature of some tar
components (Table 31 and Figure 36) The pure tar started to degrade rapidly at a temperature
42
of about 150 degC at which point the mass loss was 5 wt Therefore the weight loss of the
tarPAN nanofibers in the first stage (up to 280 ordmC) can be ascribed completely to the degradation
of tar components Further weight loss of the tarPAN nanofibers was mainly due to the
decomposition of the PAN polymer Additionally the thermal stability of the tarPAN nanofibers
decreased slightly with an increased addition of tar components At 600 degC a 35 wt residue
was observed for the tarPAN composite nanofibers Considering the comparable residual
weights of the tarPAN and the PAN nanofibers it was suggested that biomass tar be used as
precursor materials to manufacture carbon nanofibers The future demand for carbon nanofibers
will increase significant and alternative raw materials must be identified and implemented to
reduce their price (Frank et al 2014) Therefore biomass tar can be a cheaper precursor for
producing low-cost carbon nanofibers Further investigations need to be done in this area with
regard to the complicated composition and low thermal stability of the tar
Table 31 Thermal properties of the electrospun neat PAN and tarPAN fibers
Sample T10
a
(degC)
T50
(degC)
Residue
()
Tcyc b
(degC)
∆Hcyc c
(Jg)
PAN 285 420 38 308 376
30TarPAN 223 411 36 292 394
50TarPAN 219 410 36 290 399
100TarPAN 195 408 35 286 439
a T10 T50 the temperature corresponding to 10 50 wt of weight loss b Tcyc cyclization temperature c ∆Hcyc heat of cyclization
The DSC for the PAN nanofibers showed a strong exothermic peak at 308 degC (Table 31
Figure 37) which is attributed to the cyclization of the nitrile groups of PAN (Sui et al 2013
Wu et al 2012) However the cyclization of PAN in the tarPAN nanofibers differed from that
in the neat PAN nanofibers With an increased content of tar in the electrospun fibers the
43
cyclization temperature (Tcyc) shifted toward lower temperatures and the heat of cyclization
(∆Hcyc) increased This altered reaction behavior upon addition of tar resulted from the catalytic
action and reactions of the hydroxyl groups of phenolic compounds and the acid groups of
carboxylic acids that were constituents of the biomass tar The cyclization of PAN during heating
could be initiated or catalyzed by these ionizable groups (Kim et al 1993) The hydroxyl or acid
groups of the tars located at the PAN interfaces acted catalytically lowering the reactionrsquos
activation energy and thus decreasing Tcyc (Figure 37) The increasing ∆Hcyc indicated a higher
conversion of CN groups in the cyclization reaction also consistent with the presence of
catalytically active functional groups Alternatively it was reported that a lower cyclization
temperature of PAN might be due to the better chain orientation on the molecular level (Gu et al
2005 Zhang et al 2010) Thus the lower Tcyc and higher ∆Hcyc of the tarPAN nanofibers were
also resulted from the plasticizing effects of the tars facilitating the orientation of PAN
molecular chains during the electrospinning processes
Figure 37 DSC of the PAN (solid curves) and tarPAN fibers (dotted curves) The inset shows a
schematic of a tar-initiated PAN cyclization reaction (Ar-OH indicates a phenolic component of
the tar)
44
335 Surface Area and Porosity
Both intra- and inter-fiber pores existed in the electrospun nanofibers The intra-fiber pores
of the neat PAN and tarPAN nanofibers were investigated by nitrogen adsorptiondesorption
measurements at 77 K The isotherms of the electrospun fibers are somewhat similar to a type IV
adsorption process with a hysteresis loop at high PP0 (Figure 38) indicating that a mesopore
structure exists (Sing et al 1985) Similar mesopore characteristics were found in electrospun
nanofibers from cellulose reinforced polyacrylamide (Zhou et al 2013) The isotherms of the
neat PAN and tarPAN nanofibers showed similar hysteresis loops The difference between the
adsorption and desorption branches at low PP0 indicated that the swelling of the polymer opened
up new micropores during the course of the measurement Such swelling was a common
phenomenon in certain polymeric adsorbents but its occurrence here demonstrated that for
adsorbates with greater attraction to certain functional groups of the tar and additional surface
area could be created above the characteristic value of pure PAN (which was resistant to most
organic solvents with a Tg of 85 ordmC)
Figure 38 Nitrogen adsorptiondesorption isotherm at 77 K and BJH pore size distribution (inset)
of the PAN nanofibers Dv(d) is the derivative of pore volume with respect to pore diameter
45
The inset of Figure 38 shows the pore size distribution The diameters of the neat PAN
fibers were mainly between 1-27 nm confirming the predominantly mesoporous structure The
calculated surface area total pore volume and average pore diameters from the isotherms of the
electrospun fibers are shown in Table 32 The tarPAN nanofibers exhibited lower BET surface
areas and total pore volumes compared to the neat PAN nanofibers The average pore diameter
of the tarPAN nanofibers showed an increasing trend with increasing tar content consistent with
swelling of the PAN by the tar
The total porosity of the electrospun nanofibers representing the sum of the contributions
from the larger inter-fiber voids and the intra-fiber pores was obtained by calculating the
densities of the as-spun nanofibers and the corresponding cast films (Table 32) The average
porosity of the neat PAN nanofibers was 63 The porosity decreased to 61 58 and 51
with an addition of 30 50 and 100 wt tar respectively The decreased average porosity of the
tarPAN composite nanofibers was consistent with increased fiber diameters Due to the inter-
and intra-fiber pores and high specific surface area of the tarPAN electrospun nanofibers they
can be considered in the applications of adsorption of hazardous gas or heavy metals for
environmental protection
Table 32 Morphological characteristics of the neat PAN and tarPAN nanofibers
Sample BET surface area
(m2g)
Total pore
volume
(cm3g)
Average pore diameter
(nm)
Total porosity
()
PAN 14 0020 56 63
30TarPAN 12 0019 62 61
50TarPAN 12 0018 57 58
100TarPAN 10 0017 71 51
46
336 Antimicrobial Activity
Figure 39 Antibacterial activity of the neat PAN and tarPAN nanofibers against S aureus (A B
and C) and E coli (D E and F) (A) and (D) PAN (B) and (E) 50TarPAN (C) and (F)
100TarPAN
The effects of the tarPAN electrospun nanofibers on the growth of the bacteria S aureus
and E coli are shown in Figure 39 The counted numbers of bacterial colonies in the diluted
bacteria suspensions decreased after the tarPAN nanofibers were used while the neat PAN
nanofibers showed no effect on the growth of the bacteria An increase in the tar content of the
electrospun nanofibers helped improve the broad-spectrum antimicrobial activities against S
aureus and E coli The calculated antimicrobial capability values of 30TarPAN 50TarPAN
and 100TarPAN nanofibers against S aureus were (8plusmn2) (19plusmn3) and (36plusmn7) respectively
while the values of corresponding nanofibers against E coli were (9plusmn3) (17plusmn4) and
(39plusmn6) respectively The antimicrobial capability of the tarPAN nanofibers was attributed to
the action of the phenolic components in the biomass tar It was reported that phenolic
compounds affected the growth and metabolism of bacteria by adsorbing on cell membranes
interacting with enzymes and disturbing cell membrane permeability (Medina et al 2006
47
Pereira et al 2007 Vaquero et al 2007) The phenolic compounds diffused slowly into the
broth and inhibited the growth of the bacteria Thus the larger content of tar in the electrospun
nanofibers offered more phenolic compounds diffusing into the broth leading to improved
antimicrobial capability with lower colony forming units of the bacteria In addition the porous
characteristics of electrospun fibers resulted in an increased surface area which was helpful for
antimicrobial efficacy through increased exposure of phenolic compounds to the surrounding
bacteria Electrospun polymer nanofibers loaded with silver nanoparticles were used in numerous
applications such as wound dressing (Rujitanaroj et al 2008) and tissue scaffolds (Xing et al
2010) Compared with silver nanoparticles biomass tar showed lower antimicrobial efficacy
mainly due to the lower quantities of phenolic compounds that could diffuse into the broth
solution However biomass tar is a much cheaper additive than silver nanoparticles and can
largely reduce the cost of antimicrobial materials The antimicrobial efficacy of biomass tar can
be improved by further manipulating the composition and concentration of phenolic compounds
in the tar-derived electrospun nanofibers
34 CONCLUSIONS
With the goal of utilizing biomass tar to the greatest extent variable tar amounts were
blended with PAN prior to electrospinning The contents of tar significantly affected the
morphology thermal properties pore characteristics and antimicrobial activity of the resulting
electrospun nanofibers Continuous nanofibers were produced at the tar content levels up to 100
wt based on the weight of PAN The tarPAN nanofibers exhibited increased average diameters
and surface roughness with increasing content of tar ATR-FTIR spectroscopy revealed that the
tar was successfully incorporated into the tarPAN nanofibers The tarPAN nanofibers were less
thermally stable than the neat PAN nanofibers due to the relatively low onset temperature of
48
degradation of biomass tar and their thermal stability decreased with increasing amount of tar
However the tarPAN nanofibers had a comparable amount of residual weight (35) compared
to PAN (38) at 600 degC suggesting that tars can be an attracting precursor for manufacturing
carbon nanofibers Furthermore the addition of tar facilitated catalytically the cyclization of
PAN which is helpful for stabilization processes in the manufacture of PAN-based carbon fibers
The tarPAN nanofibers exhibited increased antimicrobial capacity against S aureus and E coli
with increased tar content This study provides a sustainable and economical way to recycle
biomass tar and can help improve the economics of biofuel production and reduce associated
environmental contamination
35 REFERENCES
Amen-Chen C Pakdel H Roy C 1997 Separation of phenols from Eucalyptus wood tar
Biomass Bioenergy 13 25-37
Arshad SN Naraghi M Chasiotis I 2011 Strong carbon nanofibers from electrospun
polyacrylonitrile Carbon 49 1710-1719
Barrett EP Joyner LG Halenda PP 1951 The determination of pore volume and area
distributions in porous substances I Computations from nitrogen isotherms J Am
Chem Soc 73 373-380
Brunauer S Emmett PH Teller E 1938 Adsorption of gases in multimolecular layers J
Am Chem Soc 60 309-319
Bui NN Kim BH Yang KS Dela Cruz ME Ferraris JP 2009 Activated carbon fibers
from electrospinning of polyacrylonitrilepitch blends Carbon 47 2538-2539
Chatterjee N Basu S Palit SK Maiti MM 1995 An XRD characterization of the thermal
degradation of polyacrylonitrile J Polym Sci Part B Polym Phys 33 1705-1712
Chen M Wang C Fang W Wang J Zhang W Jin G Diao G 2013 Electrospinning of
calixarene-functionalized polyacrylonitrile nanofiber membranes and application as an
adsorbent and catalyst support Langmuir 29 11858-11867
Coleman MM Petcavich RJ 1978 Fourier transform infrared studies on the thermal
degradation of polyacrylonitrile J Polym Sci Polym Phys Ed 16 821-832
49
Di Marcello M Gallucci K Rapagnagrave S Gruber R Matt M 2014 HPTLC and UV
spectroscopy as innovative methods for biomass gasification tars analysis Fuel 116 94-
102
Frank E Steudle LM Ingildeev D Spoumlrl JM Buchmeiser MR 2014 Carbon fibers
precursor systems processing structure and properties Angew Chem Int Ed 53 5262-
5298
Greiner A Wendorff JH 2007 Electrospinning A fascinating method for the preparation of
ultrathin fibres Angew Chem Int Ed 46 5670-5703
Gu S Ren J Wu Q 2005 Preparation and structures of electrospun PAN nanofibers as a
precursor of carbon nanofibers Synth Met 155 157-161
Kim J Kim YC Ahn W Kim CY 1993 Reaction mechanisms of polyacrylonitrile on
thermal treatment Polym Eng Sci 33 1452-1457
Li C Suzuki K 2009 Tar property analysis reforming mechanism and model for biomass
gasification-An overview Renew Sus Energ Rev 13 594-604
Li CS Suzuki K 2010 Resources properties and utilization of tar Resour Conserv Recy
54 905-915
Li S Tian Y Zhong Y Yan X Song Y Guo Q Shi J Liu L 2011 Formation
mechanism of carbon foams derived from mesophase pitch Carbon 49 618-624
Liang CY Krimm S 1958 Infrared spectra of high polymers VII Polyacrylonitrile J Polym
Sci 31 513-522
Lu KT Wu LY 2013 Substitution of phenol in phenol-formaldehyde (PF) resins by wood
tar for plywood adhesives Holzforschung 67 413-419
Medina E de Castro A Romero C Brenes M 2006 Comparison of the concentrations of
phenolic compounds in olive oils and other plant oilsthinsp correlation with antimicrobial
activity J Agric Food Chem 54 4954-4961
Park SH Kim C Choi YO Yang KS 2003 Preparations of pitch-based CFACF webs by
electrospinning Carbon 41 2655-2657
Park SH Kim C Yang KS 2004 Preparation of carbonized fiber web from electrospinning
of isotropic pitch Synth Met 143 175-179
Pereira JA Oliveira I Sousa A Valentatildeo P Andrade PB Ferreira ICFR Ferreres F
Bento A Seabra R Estevinho L 2007 Walnut (Juglans regia L) leaves Phenolic
compounds antibacterial activity and antioxidant potential of different cultivars Food
Chem Toxicol 45 2287-2295
50
Persano L Camposeo A Tekmen C Pisignano D 2013 Industrial upscaling of
electrospinning and applications of polymer nanofibers a review Macromolecular
Materials and Engineering 298 504-520
Reneker DH Yarin AL 2008 Electrospinning jets and polymer nanofibers Polymer 49
2387-2425
Rice JW Fu J Suuberg EM 2011 Thermodynamics of multicomponent PAH mixtures and
development of tarlike behavior Ind Eng Chem Res 50 3613-3620
Rujitanaroj P Pimpha N Supaphol P 2008 Wound-dressing materials with antibacterial
activity from electrospun gelatin fiber mats containing silver nanoparticles Polymer 49
4723-4732
Sing K Everett D Haul R Moscou L Pierotti R Rouqueacuterol J Siemieniewska T 1985
Reporting physisorption data for gassolid systems with special reference to the
determination of surface area and porosity Pure Appl Chem 57 603-619
Song K Zhang H Wu Q Zhang Z Zhou C Zhang Q Lei T 2015 Structure and
thermal properties of tar from gasification of agricultural crop residue J Therm Anal
Calorim 119 27-35
Sui G Sun F Yang X Ji J Zhong W 2013 Highly aligned polyacrylonitrile-based nano-
scale carbon fibres with homogeneous structure and desirable properties Compos Sci
Technol 87 77-85
Suzuki T Yamakawa M Yamamoto K Watanabe T Funaki M 1997 Recovery of wood
preservatives from wood pyrolysis tar by solvent extraction Holzforschung 51 214-218
Tuomi S Kurkela E Simell P Reinikainen M 2015 Behaviour of tars on the filter in high
temperature filtration of biomass-based gasification gas Fuel 139 220-231
Vaquero MJR Alberto MR de Nadra MCM 2007 Antibacterial effect of phenolic
compounds from different wines Food Control 18 93-101
Vassilev SV Baxter D Andersen LK Vassileva CG 2010 An overview of the chemical
composition of biomass Fuel 89 913-933
Wang L Li D Koike M Watanabe H Xu Y Nakagawa Y Tomishige K 2013
Catalytic performance and characterization of NindashCo catalysts for the steam reforming of
biomass tar to synthesis gas Fuel 112 654-661
Widayatno WB Guan G Rizkiana J Hao X Wang Z Samart C Abudula A 2014
Steam reforming of tar derived from Fallopia Japonica stem over its own chars prepared
at different conditions Fuel 132 204-210
Wu M Wang Q Li K Wu Y Liu H 2012 Optimization of stabilization conditions for
electrospun polyacrylonitrile nanofibers Polym Degrad Stab 97 1511-1519
51
Xing Z-C Chae W-P Baek J-Y Choi M-J Jung Y Kang I-K 2010 In vitro
assessment of antibacterial activity and cytocompatibility of silver-containing PHBV
nanofibrous scaffolds for tissue engineering Biomacromolecules 11 1248-1253
Xu X Chen X Liu A Hong Z Jing X 2007 Electrospun poly(L-lactide)-grafted
hydroxyapatitepoly(L-lactide) nanocomposite fibers Eur Polym J 43 3187-3196
Xue TJ McKinney MA Wilkie CA 1997 The thermal degradation of polyacrylonitrile
Polym Degrad Stab 58 193-202
Yu H Zhang Z Li Z Chen D 2014 Characteristics of tar formation during cellulose
hemicellulose and lignin gasification Fuel 118 250-256
Zhang H Nie H Yu D Wu C Zhang Y White CJB Zhu L 2010 Surface
modification of electrospun polyacrylonitrile nanofiber towards developing an affinity
membrane for bromelain adsorption Desalination 256 141-147
Zhou C Chu R Wu R Wu Q 2011 Electrospun polyethylene oxidecellulose nanocrystal
composite nanofibrous mats with homogeneous and heterogeneous microstructures
Biomacromolecules 12 2617-2625
Zhou C Lee S Dooley K Wu Q 2013 A facile approach to fabricate porous
nanocomposite gels based on partially hydrolyzed polyacrylamide and cellulose
nanocrystals for adsorbing methylene blue at low concentrations J Hazard Mater 263
334-341
52
CHAPTER 4 POROUS CARBON NANOFIBERS FROM ELECTROSPUN BIOMASS
TARPOLYACRYLONITRILESILVER HYBRIDS AS ANTIMICROBIAL
MATERIALS3
41 INTRODUCTION
Carbon nanofibers (CNFs) with diameters in the submicron and nanometer range have
attracted an increasing attention due to their superior chemical electrical and mechanical
properties (Gardea et al 2013 Morgan 2005 Zhang et al 2014) Among various CNFs porous
CNFs exhibit promising applications in energy conversion and storage gas adsorption and
biomedical fields attributed to their ultrahigh specific surface area and porosity (Aykut 2012
Wang et al 2013 Xu et al 2013) The future demand for porous CNFs with diverse
functionalities is expected to increase significantly and alternative raw materials have to be
identified and implemented to reduce their production cost Renewable raw materials from
biomass sources are attractive for producing low-cost CNFs with minimal environmental impact
due to their unique characteristics including abundance and renewability (Wu et al 2013 Xu et
al 2014)
Tar an industrial by-product from biomass pyrolysis or gasification is a potential source
for producing such low-cost CNFs (Song et al 2015b) Currently tar is treated as an industrial
waste and its disposal is extremely difficult and costly due to its complex chemical composition
and high resistance to biodegradation Current efforts focus on tar reforming processes using
steam or catalysts (Guan et al 2013 Li et al 2014) but these treatments are quite complicated
costly and time-consuming Our previous study indicated that biomass tar mainly contained
phenols and aromatics originated from lignin decomposition during pyrolysis or gasification
This chapter previously appeared as Song K Wu Q Zhang Z Ren S Lei T
Negulescu II Zhang Q Porous Carbon Nanofibers from Electrospun Biomass
TarPolyacrylonitrileSilver Hybrids as Antimicrobial Materials ACS Appl Mater Interfaces
2015 7 15108-15116 It is reprinted by permission of American Chemical Society
53
processes and presented a high carbon content (ie over 75) (Song et al 2015b) Thus the
biomass tar can be a promising low-cost precursor for manufacturing CNFs Tar or pitch derived
from coal and petroleum was successfully processed into carbon fibers with a high specific
surface area and porosity (Derbyshire et al 2001 Kim et al 2013) However no reports of
CNFs based on tar from biomass conversions have been found It is thus of significant practical
interest to utilize biomass tar as a low-cost precursor for carbon materials instead of disposing it
as a waste causing environmental pollutions
CNFs are commonly produced through preparations of precursor fibers followed by
thermo-oxidative stabilization and carbonization processes (Frank et al 2014) Although
traditional spinning methods such as wet spinning and melt spinning have been used to
manufacture precursor fibers electrospinning emerges as a simple and highly versatile approach
to fabricate multifunctional nanofibers with diameters down to a few nanometers (Matsumoto et
al 2013 Reneker and Yarin 2008) Various polymeric materials including polyacrylonitrile
(PAN) cellulose and pitch are electrospun into precursor nanofibers and diversified CNFs are
obtained with subsequent stabilization activation and carbonization treatments (Joshi et al
2010 Zhang et al 2014) The small dimension of electrospun CNFs creates a larger specific
surface area compared to CNFs from traditional spinning methods (Inagaki et al 2012)
Nevertheless technical difficulties emerge from complex compositions of tar when it is used for
electrospinning Tar is composed of a number of mixed substances which cannot be dissolved
by solvents completely Furthermore most components of tar have relatively low molecular
weights Thus precursor suspensions prepared by tar exhibit inadequate homogeneity and low
viscosity which is detrimental for producing smooth and continuous electrospun fibers
Consequently it is hard to obtain tar-based electrospun nanofibers with uniform diameters and
54
beaded or dumb-bell shaped fibers were usually produced (Park et al 2004 Park and Jang
2003) However the electrospinning ability of tar can be improved by blending it with a polymer
such as PAN with excellent electrospinning ability The mixture of petroleum derived pitch and
PAN was successfully electrospun into continuous fibers and activated carbon fibers with a high
specific surface area ranging from 732 to 1877 m2g were prepared through subsequent
stabilization carbonization and steam activation processes (Bui et al 2009) It is noteworthy
that tar derived CNFs may not be able to perform well in high strength applications due to
structural heterogeneity of tar and efforts have been made to enhance their mechanical
properties by modifying compositions and molecular structures of tar (Kim et al 2014)
Nevertheless tar can be used to fabricate electrospun CNFs with various functionalities such as
antimicrobial capacity by incorporating silver nanoparticles (Li et al 1998)
The aim of this study was to fabricate porous CNFs with antimicrobial capabilities from
recycled biomass tar as low-cost precursor by electrospinning and subsequent stabilization and
carbonization processes Suspensions of biomass tar PAN and silver nanoparticles were
prepared and electrospun into precursor nanofibers that were further converted to porous CNFs
by oxidative stabilization and carbonization in an inert atmosphere The effects of tar loading
levels on electrospinning ability of suspensions morphologies chemical structures thermal
properties pore features and antimicrobial performance of resultant CNFs were investigated
42 MATERIALS AND METHODS
421 Materials
Tar was collected from the gasification of corn stover at 500-600 degC in Xigou Biomass
Fuel Gas Plant Shanxi China Water in the tar was removed by drying in a vacuum oven at
80 degC for at least 48 h The dried tar was then stored in a sealed container for further processing
55
PAN (Mw = 150000 gmol) N N-dimethylformamide (DMF) and silver nitrate (AgNO3) were
purchased from Sigma-Aldrich (St Louis MO USA)
422 Fabrication of Carbon Fiber Precursors
PAN was added in DMF and mixed using a magnetic stirrer for 24 h at room temperature
A certain amount of dried tar powder was dispersed in DMF under vigorous magnetic stirring for
at least 24 h at room temperature The PAN solution and tar suspension in DMF were blended
and the mixture was transferred to an ultrasonic bath to further disperse the tar in the blend for 30
min The concentration of PAN in the mixture was fixed at 10 wt The loading levels of tar
were 0 50 and 100 wt with respect to weight of PAN (Table 41) Silver nitrate powder was
then added into the prepared tarPAN suspensions (molar ratio of AgNO3 and repeating unit of
PAN was 110) The resultant suspensions were shielded from light and stirred for 2 h in an ice
bath to ensure complete dissolution of silver nitrate Afterwards silver ions were reduced to
silver nanoparticles by heating the suspensions to 90 degC in a water bath and holding at this
temperature for 15 min Finally the suspensions containing tar PAN and silver nanoparticles
were cooled down to room temperature prior to electrospinning
Table 41 Compositions and carbon yields of PANAg and tarPANAg electrospun nanofibers
Sample CPAN (wt) CTar (wt ) RSP Carbon Yield
PANAg 10 0 110 45
50TarPANAg 10 50 110 44
100TarPANAg 10 100 110 42
CPAN is the concentration of PAN in the suspensions CTar is the content of tar based on the
weight of PAN RSP is the molar ratio of silver nitrate to the repeating unit of PAN Carbon
yield is based by the weight ratio of carbonized nanofibers and as-spun nanofibers
Subsequently each precursor suspension was loaded into a 5 mL BD plastic syringe
attached with a stainless steel needle tip (internal diameter 0584 mm) The needle was connected
56
to a high-voltage power supply (Gamma High Voltage Research Ormond Beach FL USA)
which generated a positive DC voltage of 15 kV The flow rate of the suspensions was controlled
at 05 mLh by an electric syringe pump (Chemyx Fusion 100 Stafford TX USA) A grounded
metal plate covered with aluminum foil served as the collector which was horizontally placed
and perpendicular to the needle tip with a 20 cm separation The collected nanofibers were dried
in a vacuum oven to remove the residual solvent and stored in a desiccator prior to further
treatments The as-spun nanofibers were designated as PANAg 50TarPANAg and
100TarPANAg with tar contents of 0 50 and 100 wt based on PAN by weight respectively
423 Stabilization and Carbonization
The following stabilization and carbonization were performed in a high temperature tubular
furnace (GSL-1100 MTI Corporation Richmond CA USA) The as-spun nanofibers were
stabilized in air by heating up to 300 degC at a heating rate of 1 degCmin and holding at this
temperature for 1 h The stabilized nanofibers were subsequently carbonized in N2 atmosphere
by heating up to 900 degC at a heating rate of 5 degCmin and holding at this temperature for 1 h The
resultant CNFs are designated as PANAg-CNF 50TarPANAg-CNF and 100TarPANAg-
CNF respectively
424 Characterizations
Shear viscosities of the precursor suspensions were measured using a rheometer with a 40
mm cone-plate geometry (AR2000ex TA Instruments New Castle DE USA) The apparent
viscosities were recorded at shear rates ranging from 01 to 1000 s-1 for each suspension at a
controlled temperature of 25 degC using a Peltier device A solvent trap cover was used to avoid
solvent evaporation during the measurements UV-vis measurements were performed to confirm
Ag nanoparticle formation with a Varian UV-vis spectrophotometer (Evolution 600 Thermo
57
Electron Corp USA) The UV absorbance was collected at a wavelength range of 300-600 cm-1
for the electrospun suspensions diluted with the solvent (DMF)
Surface morphologies of the as-spun nanofibers and CNFs were examined by a field
emission scanning electron microscope (FE-SEM FEI QuantaTM 3D FEG Dual Beam SEMFIB
Hillsboro OR USA) operated at 10 kV The as-spun nanofibers were coated with a thin layer of
gold prior to FE-SEM observation and the CNFs were observed without coating The diameters
of the as-spun nanofibers and CNFs were obtained by measuring the randomly selected
nanofibers on the FE-SEM images using an image processing software (Image J 148) Fifty
individual nanofibers were measured for each sample to determine the average diameter The
chemical structure information of the as-spun stabilized and carbonized nanofibers was
obtained from a Bruker FTIR spectrometer (Alpha Bruker Optics Inc Billerica MA USA)
with an attenuated total reflectance (ATR) mode The spectra were recorded between 4000 and
600 cm-1 with a spectral resolution of 4 cm-1
Thermal degradation of the as-spun and stabilized nanofibers was studied with a TA Q50
analyzer (New Castle DE USA) at a resolution of 01 μg The thermogravimetric (TG) and
differential thermogravimetric (DTG) curves were collected from 30 to 600 degC for the as-spun
nanofibers and from 30 to 800 degC for the stabilized nanofibers at a heating rate of 10 degCmin
Sample weight was about 50 mg and the test was conducted in a N2 atmosphere with a N2 flow
rate of 60 mLmin Differential scanning calorimetry (DSC) measurements were performed with
a TA Q200 system in a nitrogen atmosphere Each sample with an approximate weight of 5 mg
was scanned from 40 to 350 degC at a heating rate of 10 degCmin
N2 adsorption and desorption isotherms of the as-spun and CNFs were measured at 77 K
on a Micromeritics TriStar II 3020 analyzer (Norcross GA United States) The samples were
58
outgassed at 110 degC for 24 h prior to data collection The specific surface area and pore size
distribution of the as-spun nanofibers were calculated using the Braunauer-Emmett-Teller (BET)
method and the Barrett-Joyner-Halenda (BJH) method The specific surface area of the CNFs
was calculated both by BET and Langmuir methods The density function theory (DFT)
assuming slit-shaped pores was used to determine the pore size distribution of the CNFs The
total pore volumes of the as-spun nanofibers and CNFs were obtained from the nitrogen
adsorbed at a relative pressure of 099
425 Antimicrobial Test
Antimicrobial activities of the as-spun nanofibers and CNFs against both Gram-positive
Staphylococcus aureus (S aureus) and Gram-negative Escherichia coli (E coli) bacteria were
tested according to the modified Kirby-Bauer method (Kong and Jang 2008 Rujitanaroj et al
2010) S aureus and E coli were cultivated in sterilized tryptic soy broth and incubated
overnight at 37 degC in a shaking incubator After 24 h different dilutions were made by
successively adding 1 mL aliquot of culture into 9 mL broth solution In the same manner five
serial dilutions were made The diluted culture of 02 mL was then uniformly spread on an agar
plate The as-spun nanofiber and CNF membranes were cut into rectangles of 10 times 5 mm2
sterilized by UV irradiation for 30 min and placed on the agar plates containing bacteria for
cultivation in an incubator at 37 degC for 24 h Finally the inhibition zones were observed after 24
h to assess the antimicrobial capability of the as-spun nanofibers and CNFs
43 RESULTS AND DISCUSSION
431 Properties of electrospinning suspensions
A homogeneous precursor suspension is a key prerequisite for successfully producing
smooth and continuous electrospun nanofiber In this study homogeneous suspensions
59
consisting of biomass tar PAN and silver nanoparticles were obtained using DMF as solvent
due to its outstanding solubilization power for PAN and good dispersing ability for biomass tar
The shear viscosities of the precursor suspensions at a shear rate range of 01-1000 s-1 are shown
in Figure 41A The suspension without tar (PANAg) exhibited Newtonian fluid behavior
without obvious viscosity variations at low shear rates Then the viscosity decreased at high
shear rates and a pseudoplastic behavior was observed due to gradual disentanglements of PAN
chains by an increased shear stress The suspension of 50TarPANAg showed a similar behavior
but its viscosity value decreased nearly by half compared to the suspension of PANAg as a
result of the disruption of PAN molecular chain-chain interactions by the tar The
100TarPANAg showed almost the same viscosities as the 50TarPANAg at middle and high
shear rates but exhibited higher viscosities at low shear rates The initial shear thinning behavior
at low shear rates was caused by the higher concentration of tar in the 100TarPANAg The
disruption of chain entanglements by an increasing tar content made PAN molecules much easier
to align leading to the immediate pseudoplastic fluid behavior at low shear rates
Figure 41 Basic properties of the electrospinning suspensions (A) The shear viscosity-shear rate
relationships for PANAg 50 TarPANAg and 100TarPANAg (B) UV absorbance of PAN
and PANAg
AgNO3 was dissolved at a low temperature and then reduced to silver nanoparticles by
direct heating DMF and the polyphenols in the tar probably served as reducing agents
60
(Pastoriza-Santos and Liz-Marzaacuten 2009 Wang et al 2012 Zou et al 2013) This green method
was applied to avoid the use of environmentally hazardous chemical reducing agents such as
NaBH4 and dimethylhydrazine To confirm the formation of silver nanoparticles UV absorbance
of the suspensions was measured (Figure 41B) The PANAg suspension showed an intensive
absorbance peak at about 420 nm while no peak around this wavelength was observed for pure
PAN solution This peak was the characteristic surface plasmon resonance (SPR) band of silver
nanoparticles (Abdelgawad et al 2014 Li et al 2015) and its presence indicated the formation
of silver nanoparticles by reducing AgNO3 in the suspensions
432 Surface Morphology
Continuous electrospun nanofibers without beads were produced from the precursor
suspensions with different tarPAN ratios (Figure 42) However some bulges appeared and
became more obvious with increased tar content in the as-spun nanofibers especially for the
100TarPANAg composition The rough surface resulted from aggregations of tar at a higher
concentration and phase separations between the tar and PAN when the solvent rapidly
evaporated during the travelling of electrospinning jets toward the collector (Park et al 2004)
Further increase in the tar loading levels made the electrospinning much more difficulty and
impractical due to undesirable tar aggregations and formations of inhomogeneous
electrospinning suspensions The average diameter of the as-spun nanofibers increased with an
increase of tar content with the values of (392plusmn48) nm (613plusmn50) nm and (903plusmn137) nm for
PANAg 50TarPANAg and 100TarPANAg respectively (Figure 43) The increasing trend
of the average diameters of the as-spun nanofibers with increased tar contents was due to
increased concentrations of solutes (tar and PAN) in the precursor suspensions and lower
contents of the solvent (DMF) In addition the diameter variations of the as-spun nanofibers
61
became much larger (Figure 43) resulting from rougher surfaces and more non-uniformly sized
nanofibers with increased tar addition
Figure 42 FE-SEM micrographs of the as-spun nanofibers (A PANAg C 50TarPANAg E
100TarPANAg) and CNFs (B PANAg-CNF D 50TarPANAg-CNF F 100TarPANAg-
CNF) (The inset at the bottom-right of each micrograph shows a higher magnification image)
After the as-spun nanofibers were converted to CNFs by the stabilization and carbonization
the continuous fibrous morphology was preserved (Figure 42) Compared with as-spun
nanofibers the average diameters of the CNFs decreased to (226plusmn21) nm (359plusmn34) nm and
(507plusmn71) nm for PANAg-CNF 50TarPANAg-CNF and 100TarPANAg-CNF respectively
(Figure 43) The resultant CNFs became more uniformly sized with smaller diameter variations
62
compared to the as-spun nanofibers This was caused by thermal decompositions and shrinkages
of the as-spun nanofibers in the stabilization and carbonization processes The thermal
decompositions (mainly of tar components) also created more pores on surfaces of the CNFs
especially for the 100TarPANAg-CNF (inset of Figure 42F)
Figure 43 A compasrison of average diameters of the as-spun nanofibers and CNFs from three
different formulations
433 Chemical Structure
ATR-FTIR spectra of the as-spun nanofibers are shown in Figure 44A The distinctive
absorbance features for PAN were present in all the as-spun nanofibers including CequivN
stretching at 2245 cm-1 CH2 bending at 1452 cm-1 CH wagging at 1256 cm-1 and skeletal
vibration of PAN molecular chain at 1072 cm-1 (Arshad et al 2011 Kampalanonwat and
Supaphol 2010 Liang and Krimm 1958) Compared with PANAg the 50TarPANAg and
100TarPANAg compositions exhibited additional absorption peaks attributed to the main tar
components (ie phenols aromatics acids etc) including 3300-3400 cm-1 (OH stretching)
1705 cm-1 (carbonyl stretching) 1609 cm-1 (aromatic skeletal vibration) 830 cm-1 and 764 cm-1
(C-H out-of-plane bending of aromatics) (Park et al 2004 Song et al 2015a) These absorption
peaks were not found in the PANAg without tar indicating that the tar was successfully
63
incorporated in the tar containing as-spun nanofibers In addition the peaks at 2933 and 2871
cm-1 were ascribed to CH2 stretching of both PAN and tar
Figure 44 ATR-FTIR spectra of the as-spun (A) stabilized (B) and carbonized (C) nanofibers
for different tar loading levels (I-PANAg II-50TarPANAg and III-100TarPANAg)
The chemical structure of the as-spun nanofibers was significantly altered by the oxidative
stabilization treatment (Figure 44B) The most significant change was the decrease in the
intensity of CequivN absorption at 2245 cm-1 for all the stabilized nanofibers In addition new
absorption peaks at 1584 cm-1 attributed to the combination of C=N and C=C stretching 1340
cm-1 ascribed to O-H bending (in-plane) and 806 cm-1 due to C=C-H bending were present
(Dalton et al 1999 Wu and Qin 2014 Zhang et al 2003) These absorption peaks resulted
from the generations of conjugated C=N containing structures from intramolecular cyclization of
the nitrile groups and conjugated C=C structures from dehydrogenations at the stabilization
64
stage (Frank et al 2014 Wu and Qin 2014) In addition the broad absorption band at 3100-
3500 cm-1 was attributed to the overlaps of the stretching bands from aromatic C-H O-H and N-
H stretching in the stabilized nanofibers Previous researches also reported carbonyl groups at
1680 cm-1 (Dalton et al 1999 Zhang et al 2003) but this was not obvious in the present study
These oxygen-containing groups (ie hydroxyl and carbonyl) were induced by the oxidative
stabilization processes The stabilized nanofibers were then subjected to thermal treatment in an
inert atmosphere and thereby converted into the CNFs Volatile compounds (eg HCN H2O N2
etc) were removed to give the CNFs with a high carbon yield with respect to the original as-spun
nanofibers The FTIR spectra of the CNFs showed little discernible structure due to strong
absorbance of carbon (Figure 44C)
434 Thermal Properties
Figure 45 TG and DTG curves of the as-spun (A) and stabilized (B) nanofibers with three
different tar contents
Thermal stability of the as-spun and stabilized nanofibers is shown in Figure 45 The
PANAg as-spun nanofibers with no obvious weight loss up to 300 degC underwent a fast
decomposition stage from 300 to 350 degC (Figure 45A) However the 50TarPANAg and
100TarPANAg as-spun nanofibers began to degrade at a much lower temperature than the
PANAg nanofibers due to lower initial degradation temperatures of tar components (Song et al
65
2015a) This was consistent with the DTG peaks of the as-spun nanofibers which moved toward
lower temperatures with increased tar contents The residual weights of the PANAg
50TarPANAg and 100TarPANAg as-spun nanofibers at 600 degC were 63 58 and 49
respectively The main decomposition temperatures of the stabilized nanofibers shifted to higher
temperatures compared to the corresponding as-spun nanofibers indicating the effectiveness of
thermo-oxidative stabilization treatments The main weight loss of stabilized nanofibers was
mainly due to the removing of volatile compounds by crosslinking condensation
dehydrogenation and denitrogenation reactions (Frank et al 2014) In addition the DTG peaks
of the stabilized nanofibers at approximately 180 degC were attributed to decompositions of the
oxygen-containing groups such as C=O and OH in the stabilized nanofibers Because of these
thermal degradations the precursor nanofibers shrunk and the formed CNFs exhibited reduced
and more uniform diameters confirming the morphological observations
Figure 46 DSC curves of the as-spun (A) and stabilized (B) nanofibers with different tar
contents
DSC curves of the as-spun PANAg nanofibers showed a sharp exothermic peak at 317 degC
(Figure 46A) attributed to the cyclization reactions of the nitrile groups in PAN (Frank et al
2014 Kim et al 1993 Zhang et al 2003) Through the cyclization the PAN polymer chains
were converted into a heteroaromatic ladder structure After the tar additions the as-spun
66
nanofibers exhibited a broader peak and initiated the cyclization reactions at lower temperatures
The peak temperature of the 100TarPANAg (305 degC) was much lower than that of the PANAg
(317 degC) although there was no obvious difference between the PANAg and 50TarPANAg
(319 degC) These changes with tar additions indicated the change of the cyclization mechanism of
PAN It was recognized that the cyclization of PAN homopolymer initiated by a radical
mechanism was faster than the cyclization of PAN copolymers following an ionic mechanism
(Frank et al 2014 Gupta et al 1991) The ionizable groups of tar such as hydroxyl and
carboxylic groups located at the interfaces of PAN and tar initiated catalytically the cyclization
reactions of PAN and lowered the onset temperatures (Kim et al 1993) Although the tar
slowed down cyclization reactions of PAN to avoid fusion of the as-spun nanofibers due to
overheating by sharply exothermic reactions at subsequent thermal stabilization and
carbonization some structural flaws could be induced in resultant CNFs by these ionic groups of
tar leading to inferior mechanical properties (Zhang et al 2003) When the as-spun nanofibers
were stabilized in air the introduced oxygen-containing groups helped improve the
hygroscopicity of the stabilized nanofibers (Wu and Qin 2014 Zhang et al 2003) Thus the
endotherm peaks at 90-110 degC of the stabilized nanofibers were due to the release of water
(Figure 46B) In addition the PAN cyclization peaks of the stabilized nanofibers became hardly
seen indicating basic completions of the oxidative stabilization
435 Pore Structure
N2 adsorptiondesorption isotherms and pore size distributions of the as-spun and CNFs are
shown in Figure 47 According to the International Union of Pure and Applied Chemistry
(IUPAC) classification (Sing et al 1985) the isotherms of the as-spun nanofibers were type IV
with a H3 type hysteresis loop (Figure 47A) indicating the presence of mesopores (2 nmltpore
67
sizelt50 nm) in the nanofibers with a non-uniform size This was consistent with the wide pore
size distributions of the electrospun nanofibers determined by the BJH method (Figure 47C)
with peak values of 35 114 and 186 nm for the PANAg 50TarPANAg and
100TarPANAg respectively The BET specific surface area and total pore volume of the as-
spun nanofibers also increased with an increase of tar loading levels (Table 42) The increase in
specific surface area pore volume and pore size with increased tar content in the as-spun
nanofibers was attributed to phase separations of tar and PAN The complex composition of tar
made it extremely difficult to be well blended with PAN Thus phase separations between the tar
and PAN during solvent evaporations contributed to the increase of surface area volume and
size of pores This became more obvious when the tar components aggregated in some domains
of the as-spun nanofibers
Figure 47 N2 adsorptiondesorption isotherms and pore size distribution of the as-spun
nanofibers (A and C) and CNFs (B and D) with different tar contents
68
During the stabilization and carbonization processes of the as-spun nanofibers their pore
structure underwent dramatic changes Compared to the as-spun nanofibers the CNFs had much
higher specific surface areas and pore volumes (Table 42) Based on the IUPAC classification
(Sing et al 1985) the isotherms of the CNFs are typical of type I (Figure 47B) indicating the
dominance of micropores which is similar to other PAN based carbon fibers (Park and Jang
2003) The N2 adsorption completed at very low relative pressure regions (PPolt005) because of
multidirectional interactions between pore walls and the adsorbate The pore size distribution
calculated by DFT showed that the CNFs had a uniform pore size with peak values of 17 16
and 17 nm for PANAg-CNF 50TarPANAg-CNF and 100TarPANAg-CNF respectively
confirming the predominance of micropores (Figure 47D) The tar-containing CNFs showed a
much larger N2 adsorption capacity as compared to that of the CNFs without tar (Figure 47B)
The specific surface area of the CNFs calculated by both BET and Langmuir methods indicated a
large increase when the tar was added and the pore volumes exhibited the same trend (Table 42)
consistent with the FE-SEM observation Furthermore the fraction of micropore volumes for
50TarPANAg-CNF (991) and 100TarPANAg-CNF (97) was much higher than that for
PANAg-CNF (742) similar to the results of pitch based electrospun carbon fibers (Park et al
2003) The large increase in the specific surface area and the high microporosity obtained with
the tar incorporation was attributed to the combined effects of the phase separations between the
tar and PAN and thermal decompositions of the tar constituents A similar result was reported
for the PANpitch derived electrospun CNFs (Kim et al 2011) The noticeably different
structures of the tar and PAN caused inhomogeneous distributions of the tar in the PAN matrix
and formation of tar aggregates throughout the as-spun nanofibers Some aggregates of the tar
degraded thermally when the as-spun nanofibers were converted to the CNFs Thus more pores
69
(mainly micropores) were created with tar addition leading to increased specific surface areas
and larger micropore volumes in the CNFs (Figure 48)
Table 42 Specific surface area and pore volumes of the as-spun nanofibers and CNFs
SBET
(m2g)
SLangmuir
(m2g)
Vp
(cm3g)
Vmp
(cm3g)
VmpVp
()
PANAg 654
0013 00009 69
50TarPANAg 829
0033 00006 18
100TarPANAg 824
0032 00005 16
PANAg-CNF 9479 9778 0043 00319 742
50TarPANAg-CNF 41025 41438 0133 01318 991
100TarPANAg-CNF 43781 43950 0144 01397 970
SBET is BET specific surface area SLangmuir is the specific surface area calculated by Langmuir
model Vp is the total pore volume Vmp is the micropore volume VmpVp is the fraction of
micropore volume
Figure 48 A schematic illustrating the fabrication of the porous tar-derived CNFs through
electrospinning followed by stabilization and carbonization processes
70
436 Antimicrobial Performance
Figure 49 Antimicrobial activities of the as-spun nanofibers (upper row) and CNFs (lower row)
with different tar contents against S aureus
Formation of inhibition zones around the as-spun nanofibers and CNFs were monitored in
order to evaluate their antimicrobial activities against S aureus (Figure 49) The similar
situation was observed for E coli (the figure is not shown) Clear inhibition zones around the as-
spun nanofiber samples were observed after 24 h incubation indicating their excellent
antimicrobial efficiency against both S aureus and E coli The antimicrobial activities were
preserved after the stabilization and carbonization processes with obvious formation of
inhibition zones around the CNFs Silver nanoparticles with their effective biocidal ability were
incorporated into the nanofibers to give antimicrobial capabilities although the mechanism of
killing microorganisms by silver was not clearly explained (Kong and Jang 2008 Li et al 1998
Song et al 2011) In this study the silver nanoparticles were proposed to diffuse into the broth
and to inhibit the growth of bacteria The porous features of the as-spun nanofibers and CNFs
resulted in large specific surface areas and pore volumes which made the diffusion of silver
nanoparticles into the broth more easily increasing the exposure and contact of silver
nanoparticles to the bacteria (Figure 48) (Kong and Jang 2008) Consequently the tar
71
containing as-spun nanofibers and CNFs had higher specific surface areas and pore volumes
which might enhance their antimicrobial efficacy The effect of tar loading levels on the
antimicrobial performance of as-spun nanofibers and CNFs needs to be further studied The
antimicrobial efficacy was affected by the porosity and pore size distribution of the carbon
materials which could be controlled by tuning the composition and concentration of tar
Electrospun polymer nanofibers incorporated with silver nanoparticles were intensively studied
and showed attractive applications in wound dressing tissue scaffolds and package materials
(Rujitanaroj et al 2008 Xing et al 2010) The incorporation of tar could reduce the cost of
silver-based antimicrobial materials
44 CONCLUSIONS
Continuous microporous CNFs from biomass tarPANsilver hybrids with antimicrobial
capabilities were fabricated through electrospinning and subsequent thermal stabilization and
carbonization Silver nitrate was reduced to silver nanoparticles which conferred the
antimicrobial abilities to the as-spun nanofibers and CNFs The as-spun nanofibers showed
larger average diameters with increased tar loading levels due to larger concentrations of tar and
PAN in the suspensions However the increased contents of tar made the fiber surface rougher
and increased fiber diameter variations resulted from tar aggregations and phase separations
between tar and PAN In addition the incorporation of tar reduced the thermal stability of the as-
spun nanofibers due to relatively lower onset degradation temperatures of the tar components
The tar also slowed down the cyclization reactions of PAN by its ionizable groups which was
helpful for subsequent stabilization processes The as-spun nanofibers exhibited mesopore
characteristics while micropores dominated in the CNFs due to the combined effects of thermal
decompositions of some tar constituents and phase separations of tar and PAN The large
72
specific surface areas and the volumes of pores of the as-spun nanofibers and CNFs made the
silver nanoparticles more easily diffuse into the broth endowing their excellent antimicrobial
abilities Therefore biomass tar can be a low-cost precursor for manufacturing antimicrobial
carbon materials extending applications of biomass products and reducing environmental
pollutions associated to tar disposal
45 REFERENCES
Abdelgawad AM Hudson SM Rojas OJ 2014 Antimicrobial wound dressing nanofiber
mats from multicomponent (chitosansilver-NPspolyvinyl alcohol) systems Carbohydr
Polym 100 166-178
Arshad SN Naraghi M Chasiotis I 2011 Strong carbon nanofibers from electrospun
polyacrylonitrile Carbon 49 1710-1719
Aykut Y 2012 Enhanced field electron emission from electrospun Co-loaded activated porous
carbon nanofibers ACS Appl Mater Interfaces 4 3405-3415
Bui NN Kim BH Yang KS Dela Cruz ME Ferraris JP 2009 Activated carbon fibers
from electrospinning of polyacrylonitrilepitch blends Carbon 47 2538-2539
Dalton S Heatley F Budd PM 1999 Thermal stabilization of polyacrylonitrile fibres
Polymer 40 5531-5543
Derbyshire F Andrews R Jacques D Jagtoyen M Kimber G Rantell T 2001 Synthesis
of isotropic carbon fibers and activated carbon fibers from pitch precursors Fuel 80 345-
356
Frank E Steudle LM Ingildeev D Spoumlrl JM Buchmeiser MR 2014 Carbon fibers
precursor systems processing structure and properties Angew Chem Int Ed 53 5262-
5298
Gardea F Naraghi M Lagoudas D 2013 Effect of Thermal Interface on Heat Flow in
Carbon Nanofiber Composites ACS Appl Mater Interfaces 6 1061-1072
Guan G Kaewpanha M Hao X Zhu A Kasai Y Kakuta S Kusakabe K Abudula A
2013 Steam reforming of tar derived from lignin over pompom-like potassium-promoted
iron-based catalysts formed on calcined scallop shell Bioresour Technol 139 280-284
Gupta A Paliwal D Bajaj P 1991 Acrylic precursors for carbon fibers J Macromol Sci C
31 1-89
Inagaki M Yang Y Kang F 2012 Carbon nanofibers prepared via electrospinning Adv
Mater 24 2547-2566
73
Joshi P Zhang L Chen Q Galipeau D Fong H Qiao Q 2010 Electrospun carbon
nanofibers as low-cost counter electrode for dye-sensitized solar cells ACS Appl Mater
Interfaces 2 3572-3577
Kampalanonwat P Supaphol P 2010 Preparation and adsorption behavior of aminated
electrospun polyacrylonitrile nanofiber mats for heavy metal ion removal ACS Appl
Mater Interfaces 2 3619-3627
Kim BH Yang KS Kim YA Kim YJ An B Oshida K 2011 Solvent-induced
porosity control of carbon nanofiber webs for supercapacitor J Power Sources 196
10496-10501
Kim BJ Eom Y Kato O Miyawaki J Kim BC Mochida I Yoon SH 2014
Preparation of carbon fibers with excellent mechanical properties from isotropic pitches
Carbon 77 747-755
Kim BJ Kil H Watanabe N Seo MH Kim BH Yang KS Kato O Miyawaki J
Mochida I Yoon SH 2013 Preparation of novel isotropic pitch with high softening
point and solvent solubility for pitch-based electrospun carbon nanofiber Curr Org
Chem 17 1463-1468
Kim J Kim YC Ahn W Kim CY 1993 Reaction mechanisms of polyacrylonitrile on
thermal treatment Polym Eng Sci 33 1452-1457
Kong H Jang J 2008 Antibacterial properties of novel poly (methyl methacrylate) nanofiber
containing silver nanoparticles Langmuir 24 2051-2056
Li C Wan Y Wang J Wang Y Jiang X Han L 1998 Antibacterial pitch-based
activated carbon fiber supporting silver Carbon 36 61-65
Li R Roy AD Bridges J Dooley KM 2014 Tar reforming in model gasifier effluents
transition metalrare earth oxide catalysts Ind Eng Chem Res 53 7999-8011
Li Z Wang L Chen S Feng C Chen S Yin N Yang J Wang H Xu Y 2015
Facilely green synthesis of silver nanoparticles into bacterial cellulose Cellulose 22 373-
383
Liang CY Krimm S 1958 Infrared spectra of high polymers VII Polyacrylonitrile J Polym
Sci 31 513-522
Matsumoto H Imaizumi S Konosu Y Ashizawa M Minagawa M Tanioka A Lu W
Tour JM 2013 Electrospun composite nanofiber yarns containing oriented graphene
nanoribbons ACS Appl Mater Interfaces 5 6225-6231
Morgan P (Eds) 2005 Carbon fibers and their composites 1st ed Taylor amp Francis Group
Boca Raton
74
Park SH Kim C Choi YO Yang KS 2003 Preparations of pitch-based CFACF webs by
electrospinning Carbon 41 2655-2657
Park SH Kim C Yang KS 2004 Preparation of carbonized fiber web from electrospinning
of isotropic pitch Synth Met 143 175-179
Park SJ Jang YS 2003 Preparation and characterization of activated carbon fibers supported
with silver metal for antibacterial behavior J Colloid Interface Sci 261 238-243
Pastoriza-Santos I Liz-Marzaacuten LM 2009 NN-dimethylformamide as a reaction medium for
metal nanoparticle synthesis Adv Funct Mater 19 679-688
Reneker DH Yarin AL 2008 Electrospinning jets and polymer nanofibers Polymer 49
2387-2425
Rujitanaroj P Pimpha N Supaphol P 2008 Wound-dressing materials with antibacterial
activity from electrospun gelatin fiber mats containing silver nanoparticles Polymer 49
4723-4732
Rujitanaroj Po Pimpha N Supaphol P 2010 Preparation characterization and antibacterial
properties of electrospun polyacrylonitrile fibrous membranes containing silver
nanoparticles J Appl Polym Sci 116 1967-1976
Sing K Everett D Haul R Moscou L Pierotti R Rouqueacuterol J Siemieniewska T 1985
Reporting physisorption data for gassolid systems with special reference to the
determination of surface area and porosity Pure Appl Chem 57 603-619
Song J Kang H Lee C Hwang SH Jang J 2011 Aqueous synthesis of silver
nanoparticle embedded cationic polymer nanofibers and their antibacterial activity ACS
Appl Mater Interfaces 4 460-465
Song K Wu Q Zhang Z Ren S Lei T Dooley KM Liu D Janes ME 2015a
Fabricating electrospun nanofibers with antimicrobial capability A facile route to recycle
biomass tar Fuel 150 123-130
Song K Zhang H Wu Q Zhang Z Zhou C Zhang Q Lei T 2015b Structure and
thermal properties of tar from gasification of agricultural crop residue J Therm Anal
Calorim 119 27-35
Wang M Huang Z Bai Y Kang F Inagaki M 2013 Porous carbon nanofibers
preparation and potential applications Curr Org Chem 17 1434-1447
Wang S Bai J Li C Zhang J 2012 Functionalization of electrospun β-
cyclodextrinpolyacrylonitrile (PAN) with silver nanoparticles Broad-spectrum
antibacterial property Appl Surf Sci 261 499-503
75
Wu S Qin X 2014 Effects of the stabilization temperature on the structure and properties of
polyacrylonitrile-based stabilized electrospun nanofiber microyarns J Therm Anal
Calorim 116 303-308
Wu Z Li C Liang H Chen J Yu S 2013 Ultralight flexible and fire-resistant carbon
nanofiber aerogels from bacterial cellulose Angew Chem Int Ed 125 2997-3001
Xing Z-C Chae W-P Baek J-Y Choi M-J Jung Y Kang I-K 2010 In vitro
assessment of antibacterial activity and cytocompatibility of silver-containing PHBV
nanofibrous scaffolds for tissue engineering Biomacromolecules 11 1248-1253
Xu X Zhou J Jiang L Lubineau G Chen Y Wu XF Piere R 2013 Porous core-shell
carbon fibers derived from lignin and cellulose nanofibrils Mater Lett 109 175-178
Xu X Zhou J Jiang L Lubineau G Payne SA Gutschmidt D 2014 Lignin-based
carbon fibers Carbon nanotube decoration and superior thermal stability Carbon 80 91-
102
Zhang L Aboagye A Kelkar A Lai C Fong H 2014 A review carbon nanofibers from
electrospun polyacrylonitrile and their applications J Mater Sci 49 463-480
Zhang W Liu J Wu G 2003 Evolution of structure and properties of PAN precursors
during their conversion to carbon fibers Carbon 41 2805-2812
Zou M Du M Zhu H Xu C Li N Fu Y 2013 Synthesis of silver nanoparticles in
electrospun polyacrylonitrile nanofibers using tea polyphenols as the reductant Polym
Eng Sci 53 1099-1108
76
CHAPTER 5 RHEOLOGICAL AND FLUID FILTRATION PROPERTIES OF LOW
SOLID DRILLING FLUIDS ADDED WITH CELLULOSE NANOPARTICLES
51 INTRODUCTION
In oil and gas industry bentonite is a montomorillonite clay commonly used in drilling
fluids due to its inherent and well-performing rheological properties (Baruah et al 2013
Bourgoyne et al 1991 Hermoso et al 2015) The bentonite suspensions exhibit excellent shear
thinning behavior that offers a good pumpability of drilling fluids and outstanding carrying
capacity of drilled cuttings (Bourgoyne et al 1991) The viscosity of bentonite-based drilling
fluids is accomplished by arranging bentonite particles into an edge-to-face orientation
(Luckham and Rossi 1999) In conventional drilling fluids a relatively large content of
bentonite is needed to achieve the anticipated rheological and filtration characteristics However
a high concentration of bentonite in drilling fluids can lower drilling efficiency and even result in
a series of problems such as differential sticking inefficient wellbore cleaning and formation
damage Consequently a properly designed low-solid system that has a lower solid content than
conventional bentonite drilling fluids is desired for faster penetration rates thinner filter cakes
highly efficient wellbore cleaning easier fluid maintenance and improved hydraulics Low solid
drilling fluids can be prepared by substituting one or more polymers for bentonite which gives
rheology and fluid loss properties comparable to that of a higher concentration of ordinary
bentonite A wide range of polymeric additives including xantham gum starch sodium
carboxymethyl cellulose polyanionic cellulose polyacrylamide and polyacrylate can be added
into drilling fluids for achieving desired rheological and filtration properties (Fereydouni et al
2012 Hamed and Belhadri 2009 Jang et al 2015 Menezes et al 2010)
Recently micro and nanoparticles are attracting more attention for improving the
performance of drilling fluids to meet increasing challenges in drilling and production of oil and
77
gas from non-conventional reservoirs and under harsh conditions such as high temperature and
high pressure (Abdo and Haneef 2012 Al-Yasiri and Al-Sallami 2015) Such micro and
nanoparticles play an essential role in decreasing the permeability of shale formation
maintaining borehole stability intensifying mud cake quality reducing fluid loss improving
cutting removal ability lowering the friction eliminating differential pipe sticking protecting
reservoir and enhancing oil and gas recovery (Kasiralvalad 2014) To achieve these goals a
variety of micro and nanoparticles have been studied including nano-silica (Sensoy et al 2009
Sharma et al 2012) nano metallic oxide (Barry et al 2015 Cheraghian et al 2013
Sayyadnejad et al 2008) graphite and grapheme oxide (Kosynkin et al 2011 Nasser et al
2013) clay nanoparticles (Abdo and Haneef 2013) polymer-based nanoparticles (Jiang et al
2009 Qu et al 2007) and combinations of these nanoparticles Drilling technologists can
modify rheological and fluid filtration properties of the drilling fluids by changing type
composition size distribution surface characteristics of the nanoparticles to meet requirements
of any particular situation of drilling and production In most cases a very low concentration
(lt1) of nanoparticles is needed in these nano-enhanced drilling fluids (Amanullah et al 2011)
Thus nanoparticles can be good potential candidates for formulating low solid drilling fluids
However most of the above nanoparticles are non-renewable and non-biodegradable and their
use subjects to cost and environmental impact Therefore it is highly desirable to develop
renewable biodegradable and more cost-effective nanoparticle additives in low solid drilling
fluids
Cellulose is the most abundant renewable and biodegradable biopolymer in nature which
widely exists in various natural resources such as wood cotton hemp linen chitin and bacteria
(Moon et al 2011) Cellulose nanoparticles (CNPs) including cellulose nanocrystals (CNCs)
78
and cellulose nanofibers (CNFs) can be obtained from these cellulosic source materials by a
purification pretreatment followed by chemical or mechanical separation approaches including
acid hydrolysis enzyme hydrolysis 2266-Tetramethyl-1-piperidinyloxy (TEMPO) mediated
oxidation ultrasonic grinding and high-pressure homogenization treatments (Chun et al 2011
Moon et al 2011) CNPs have a high specific surface area large aspect ratio and high thermal
stability (Cho and Park 2011 Li et al 2015a) In addition aqueous suspensions of CNPs
exhibit similar fluid flow properties to those of bentonite with low viscosities at high flow rates
and high viscosities at low flow rates (Li et al 2015b) These excellent characteristics attracted
the interest to use CNPs as efficient additives for producing technically reliable economically
attractive environmentally friendly low solid drilling fluids to meet the technical needs and
challenges of the oil and gas industry
The objective of this study was to develop novel and eco-friendly low solid drilling fluids
formulated with bentonite polyanionic cellulose (PAC) and CNPs including CNCs and CNFs
The effects of concentrations and morphology of CNPs on the rheological and fluid filtration
properties of the low solid drilling fluids were investigated The changes of filter cake
characteristics including surface morphologies thickness porosity and permeability in response
to additions of the CNPs in the fluid systems were studied to in-depth understand the interactions
between CNPs and bentonite
52 MATERIALS AND METHODS
521 Materials
Wyoming sodium bentonite was supplied from Baroid Industrial Drilling Products Inc
(Houston TX USA) PAC was used as a filtration control agent and purchased from Hallibuton
Company (Houston TX USA) Sulfuric acid was applied from Sigma-Aldrich (St Louis MO
79
USA) CNFs (Celish KY 100-S Grade) were purchased from Daicel Chemical Industries Ltd
(Tokyo Japan) CNCs were produced through the hydrolysis of CNFs using 64 sulfuric acid at
45ordmC for 1 h and further mechanical separation processes by a high-pressure homogenizer
(Microfluidizer M-110P Microfluidics Corp Newton MA USA) The morphologies of CNFs
and CNCs were examined by a transmission electron microscope (TEM JEOL 100 CX JEOL
USA Inc Peabody MA USA) with an accelerating voltage at 80 kV The width distribution of
CNFs and CNCs was obtained from the analysis of TEM images using an image processing
software (ImageJ 148) Fifty individual fibers were randomly selected to measure the width and
length of each
522 Formulations of Drilling Fluids
Table 51 Formulations of the bentonite drilling fluids added with CNPs
Bentonite
(g)
CNPs
(g)
PAC
(g)
Water
(mL)
Solids
(wt)
BT6 210 0 03 3287 609
BT6CNP005 210 0175 03 3285 614
BT5CNP010 175 0350 03 3319 519
BT4CNP015 140 0525 03 3352 424
BT3CNP020 105 0700 03 3385 329
BT2CNP025 70 0875 03 3418 234
BT1CNP030 35 1050 03 3452 139
CNP040 0 1400 03 3483 049
The bentonite bentoniteCNPs and CNP suspensions were prepared in a standard 350 mL
laboratory barrel (Table 51) Specifically CNFs and CNCs were dispersed in water under
vigorous mechanical stirring for 30 min at room temperature The bentonite powder was then
added and stirred for 10 min Finally PAC was added into the above suspensions and stirred for
80
another 10 min The nomenclature of the drilling fluids samples is designated as BTx
BTxCNPy and CNPy where x (wt) and y (wt) are the concentrations of bentonite and
CNPs (ie CNFs or CNCs) based on the final weight of drilling fluids
523 Rheological Testing
Rheological properties of the drilling fluids were tested by two types of viscometers A
sophisticated TA rheometer equipped with a standard Peltier concentric cylinder geometry
(AR2000ex TA Instruments New Castle DE USA) was used to measure the viscosities of the
drilling fluids under a wide range of shear rates Concentric cylinder geometries are commonly
used for testing low viscosity fluids such as drilling fluids The geometry includes a stainless
steel cup with a radius of 1519 mm configured by a rotator with a radius of 1401 mm The
apparent viscosities were measured at shear rates ranging from 01 to 1000 s-1 with a controlled
temperature of 25degC using the Peltier device A 20 mL sample of drilling fluids was tested for
each measurement
In addition an industrial rotating viscometer (NL Baroid NL Industries Inc Houston
TX) was used to measure viscosities yield point and gel strength of the drilling fluids according
to American Petroleum Institute (API) standard The drilling fluids were stirred before
measuring to ensure that the steady-state conditions were met The rheological parameters
including apparent viscosity ( ) plastic viscosity (p ) and yield point (
y ) were obtained by
the following equations
2600 (51)
300600 p (52)
py 300 (53)
81
where 300 and 600 were the dial readings at 300 and 600 rpm respectively The gel strength of
the drilling fluids including Gelin and Gel10min was recorded by noting the maximum dial
deflection at 3 rpm after the drilling fluid remained static for 10 s and 10 min respectively
524 Fluid Filtration Testing
Fluid filtration properties of the drilling fluids were evaluated by a standard filter press
with a regulated CO2 pressurization system and standard filter papers (Fann Instrument Co
Houston TX) All the filtration tests were conducted at the pressure of (100plusmn5) psi ((690plusmn35)
kPa) and the temperature of 25ordmC according to American Petroleum Institute standard The
volume of filtrate was determined by the mass of the filtrate obtained from a digital balance and
the average density of the filtrate Thus the filtrate volume versus time was obtained for each
drilling fluid system At the end of 30 min the filter paper with filter cake was removed from the
cell and the thickness of the cake was measured When the filter cakes dried their surface
morphologies were examined by a field emission scanning electron microscope (FE-SEM FEI
QuantaTM 3D FEG Dual Beam SEMFIB Hillsboro OR USA) operated at 10 kV The samples
of dried filter cakes were coated with a thin layer of gold prior to the FE-SEM observation
53 RESULTS AND DISCUSSION
531 Fluid Rheological Properties
Drilling fluids are commonly characterized as shear thinning non-Newtonian fluids with
viscosity that decreases with an increasing shear rate (Bourgoyne et al 1991) The drilling fluids
with obvious shear thinning behaviors are more easily pumped downhole and highly desired in
drilling field The shear rate dependence of viscosities of the drilling fluids is shown in Figure
51 The bentonite drilling fluids (BT6) without CNPs exhibited a good shear thinning behavior
With additions of CNPs (CNCs and CNFs) and simultaneous reductions of bentonite the
82
pseudoplastic behavior of the drilling fluids remained This was due to the superior shear
thinning characteristics of CNP suspensions (Li et al 2015a Moon et al 2011) which was
confirmed by the fluids of CNC040 and CNF040 without bentonite (Figure 51A B) Therefore
CNPs could be potential good additives in low solid drilling fluids in which the amount of
bentonite was reduced considering their excellent shear thinning behavior Moreover the
viscosities of the drilling fluids showed a decreased trend with increased additions of CNPs
(Figure 51A B) which was in accord with the changes of apparent viscosities measured by the
industrial rotation viscometer (Table 52) The viscosity drop with increased CNPs and decreased
bentonite contents was caused by the reduced solid content making particles in the drilling fluids
much easier to align under shear stress
Figure 51 Apparent viscosity and shear stress versus shear rates of the drilling fluids
83
The shear rate dependence of shear stress of the drilling fluids is shown in Figure 51C and
51D Different rheological models such as Bingham plastic model power law model and
Herschel-Bulkey model could be used to evaluate the shear stress-shear rate relationships of the
non-Newtonian drilling fluids The Herschel-Bulkey model as a rheological model to describe
non-Newtonian fluid in non-linear way was found to be better for characterizing the non-
Newtonian behavior of drilling fluids (Barry et al 2015) Three parameters including yield
point (o ) consistence coefficient ( K ) and flow behavior index ( n ) were obtained according
to the following equation
n
o K (54)
where and are shear stress and shear rate respectively The yield point the stress that must
be applied to initiate flow was calculated by extrapolating the curve of shear stress against shear
rate to zero-shear condition The consistence coefficient and flow behavior index were obtained
by fitting the shear stress-shear rate curve to the above equation with the 95 confidence bounds
The values of flow index were lower than 1 (Table 52) confirming the shear-thinning behavior
of the drilling fluids The yield point decreased with an increasing CNP content indicating that
lower force was required to start the flow of the drilling fluids but the capacity of cutting
carrying might be compromised The values of yield point measured by the industrial rotation
viscometer showed a similar trend (Table 52) In addition the plastic viscosities and gel strength
of the drilling fluids also showed similar changes to the yield point A decreased plastic
viscosities with increased CNPs were due to the reduced low solid contents in the drilling fluids
which could improve drilling efficiency because of the low viscosity of drilling fluids at the bit
However the lower gel strength could affect the ability of the drilling fluids to suspend drilled
cuttings and weighting material when circulation was ceased As a result a part of bentonite
84
could be replaced by CNPs for producing low solid drilling fluids but it was not practicable to
apply drilling fluids with a very low content (lt3 wt)
Table 52 Rheological properties of the bentonite drilling fluids added with CNPs
Although both CNCs and CNFs exhibited shear thinning behavior and similar trends of
viscosity yield stress and gel strength differences were found between them The shear thinning
behavior decreased as the solid content of the drilling fluids added with CNCs reduced from 614
wt (BT6CNC005) to 139 wt (BT1CNC030) and showed solid content dependence at low
shear rates and relatively little solid content dependence at high rates (Figure 51A) Compared to
Formulations
(cP)
p
( cP )
y
(lb100 sq ft)
Gel Strength
(lb100 sq ft) Herschel-Bulkley Model
10
(s)
10
(min) o (Pa)
K
(Pamiddots) n
BT6 41 28 26 8 26 410 064 059
BT6CNC005 46 29 29 11 33 500 053 062
BT5CNC010 33 21 23 7 21 294 037 063
BT4CNC015 26 17 17 5 15 197 032 062
BT3CNC020 19 13 12 3 8 103 025 062
BT2CNC025 14 8 11 2 4 021 021 061
BT1CNC030 10 8 4 1 2 003 008 071
CNC040 6 5 2 1 2 003 001 097
BT6CNF005 45 30 29 9 29 548 125 051
BT5CNF010 40 26 28 7 23 268 056 060
BT4CNF015 35 23 24 6 18 179 060 057
BT3CNF020 29 18 21 5 11 106 048 057
BT2CNF025 24 15 17 5 8 084 047 055
BT1CNF030 20 12 17 4 6 041 044 053
CNF040 16 9 14 4 6 028 069 044
85
CNC-DF the shear thinning behavior of the fluids incorporated with CNFs presented less solid
content dependence (Figure 51B) Furthermore the values of viscosities of the drilling fluids
with CNCs decreased but not much from BT6CNC005 to BT3CNC020 and a large drop of
viscosity at low shear rates were observed by further adding CNCs and reducing bentonite
contents (BT2CNC025 and BT1CNC030) In contrast viscosities of the drilling fluids with
CNFs still had relatively larger values at very low solid contents compared to CNC-DF In
addition the values of apparent viscosity plastic viscosity yield point and gel strength for the
CNC-DF measured by the industrial rotational viscometer were larger than those for the CNF-
DF especially at very low solid contents (049-234 wt)
Figure 52 TEM images and diameter distributions of the CNCs (A) and CNFs (B)
The differences in rheological properties between CNC and CNF added low solid drilling
fluids can be explained by their distinct structural characteristics CNFs were finer cellulose
fibrils manufactured by mechanical refining of wood or plant fibers and CNCs were produced
by further acid hydrolysis of CNFs CNCs were rod-like or whisker shaped nanoparticles with
an average aspect ratio of 42plusmn13 ((69plusmn23) nm in width and (290plusmn31) nm in length) (Figure
52A) but CNFs were very long and curved fibers with a much higher aspect ratio ((114plusmn49)
nm in width and up to several micrometers in length) (Figure 52B) Since both of them had an
86
average width in nanometer range (1-100 nm) they were defined as nanoparticles CNFs were
considered as reminiscent of elementary fibrils in wood and plant cellulose biosynthesis process
and contained both amorphous and crystalline regions and CNCs were reminiscent of the
crystalline regions within the elementary fibrils (Moon et al 2011) Thus CNCs were more
rigid while CNFs were more flexible Moreover the sulfuric acid treatment introduced sulfate
groups and made surfaces of the resulted CNCs negatively charged It was reported that more
sulfate groups were found on the surface of CNCs compared to CNFs by X-ray photoelectron
spectroscopy (Li et al 2015a) The negatively charged surfaces of CNCs promoted the
formation of stabilized suspensions in which individual CNCs were well dispersed while the
CNFs were highly intertwined This made CNCs in the suspensions much easier to align under
shear than the CNFs Consequently the pure CNC suspension (CNF040) had lower viscosities
compared to CNF040 (Figure 51A B) When CNPs and bentonite were blended in the
suspensions the differences in rheological properties of the CNC-DF and CNF-DF could be
attributed to their different interactions with bentonite and CNPs Bentonite consists of platelet
layers with negatively charged surfaces (Bourgoyne et al 1991 Luckham and Rossi 1999)
Thus the negative charges on the surfaces of CNCs resulted in the generation of repulsive forces
between CNCs and bentonite in the fluid system which could cause their aggregations By
contrast CNFs were produced by mechanical disintegration processes without the involvement
of sulfuric acid and their surfaces were not negatively charged so the strong aggregations were
not expected in the CNFsbentonite fluid system Furthermore the highly entangled CNFs could
hold bentonite particles in the fluids and formed a flexible 3D network This network increased
the resistance to flow of the CNF-DF and larger viscosities shear stress and gel strength than
CNC-DF were observed which became more obvious at higher CNP contents
87
532 Fluid Filtration Properties
Figure 53 Filtration volume versus square root of time for CNC-DF (A) and CNF-DF (B)
The flow of mud filtrate through a filter cake is described by the following Darcyrsquos Law
(Bourgoyne et al 1991)
c
f
h
pA
dt
dV
(55)
where fV t A p ch is the filtrate volume (mL) time (s) permeability (D) cross-
section area (cm2) pressure drop across the filter cake (atm) viscosity (cP) and thickness of
filter cake (cm) respectively The solution to Darcyrsquos Law can be expressed as
tA
f
fpV
sm
scf )1(2 (56)
where scf is the volume fraction of solids in the drilling fluid and smf is the volume fraction of
solids in the filter cake From this equation linear relationships between fluid filtrate loss and
square root of time and linear was expected assuming the remaining parameters were constant
88
This was confirmed by the plots of filtrate volume against the square root of time for the drilling
fluids added with CNPs and the control (Figure 53)
Figure 54 Standard fluid loss and filter cake characteristics of the drilling fluids
The standard water loss (30-min filtrate volume) of the drilling fluids increased slowly
within the CNP concentration range of 0-02 wt but rapidly went up when the CNP
concentration was larger than 02 wt (Figure 54A) This could be explained by further
investigating the characteristics of filter cakes including cake thickness and permeability The
thickness of filter cakes showed a decreased trend with an increasing CNP concentration (Figure
54B) The permeability of the filter cakes was calculated based on Darcyrsquos Law assuming the
constant cross-section area (45 cm2) pressure difference (690 Pa) viscosity of filtrate (1times10-3
Pamiddots) and temperature (25ordmC) No significant changes in the permeability of filter cakes were
observed with varied CNP concentration except for CNF040 (Figure 54D) It should be pointed
89
out that the filtration of CNC040 could not be measured successfully due to combined effects of
the extremely low solid content (040 wt) and small dimensions of CNCs resulting in filtrate
spurting out shortly after the pressure was applied According to the Darcyrsquos Law the fluid loss
was proportional to the permeability but inversely proportional to cake thickness Therefore the
increased fluid loss of the drilling fluids with the increased CNP concentration was mainly due to
the decreased cake thickness especially when the CNP concentration was larger than 02 wt
Figure 55 FE-SEM images of filter cakes formed by the drilling fluids of BT6 (A)
BT1CNC030 (B) BT1CNF030 (C) and CNF040 (D)
Although the filtrate volume of CNC-DF and CNF-DF showed the same trend with
varied concentrations of CNCs or CNFs and there was no obvious difference in the standard
fluid loss between them it was found that their filter cakes had different characteristics The
filter cakes of CNC-DF exhibited lower values of thickness and permeability but higher porosity
compared to CNF-DF (Figure 54) The porosity was calculated by the following equation
90
c
DW
hD
WW2
)(4
(57)
where WW DW D is the porosity of filter cakes weight of wet filter cakes weight of
dried filter cakes density of filtrate and diameter of wet filter cake respectively In addition the
filter cakes of CNC-DF and CNF-DF also showed different surface microstructure observed by
FE-SEM (Figure 55) The filter cake of CNC-DF presented no significantly different surface
morphologies from that of the control and no CNCs were discernible due to their small
dimensions (Figure 55A B) By contrast the CNFs were easily observed on the surfaces of
filter cake from CNF-DF and these fibers bound bentonite particles closely like tree roots in the
soil (Figure 55C) When no bentonite was added the CNF network was more obvious (Figure
55D)
The differences in features of filter cakes between CNC-DF and CNF-DF were attributed
to their different surface morphologies and interactions with bentonite As discussed above the
electrostatic repulsive forces between CNCs and bentonite promoted their aggregation and
CNCs and bentonite dominated regions formed separately (Figure 56) These separations
contributed to the higher porosity of filter cakes formed by CNC-DF compared to CNF-DF
(Figure 54C) The higher porosity of CNC-DF filter cakes did not result in larger permeability
since the pores were confined by the surrounding CNCs and bentonite particles and these pores
were not interconnected sufficiently However the thin and long CNFs bound the dispersed
bentonite particles closely and forming a flexible 3D network resulting in relatively low porosity
of filter cakes (Figure 54C) The 3D network also caused thicker filter cakes as more bentonite
could be retained in the CNFbentonite filter cakes (Figure 54B) This was why the cake
thickness of BT6CNF005 added with only 005 wt CNFs was significantly larger than that of
BT6 and even the cake thickness of BT5CNF010 and BT4CNF015 was also larger although
91
their solid content decreased compared to the control (Figure 54B) Meanwhile it must be
realized that there was still some little separation or pores between the immiscible CNFs and
bentonite Consequently the long CNFs increased the connectivity of the pores and offered paths
for the filtrate to flow through the filter cakes (Figure 55C Figure 56) resulting in larger cake
permeability compared to CNCs The CNF040 was an extreme case that no bentonite existed in
the CNF network and a sudden jump in the permeability of its filter cakes was present (Figure
54D)
Figure 56 A schematic illustrating the formation of filter cakes by the drilling fluids added with
CNCs and CNFs on borehole walls
From the above discussions the abundant and environmental-friendly CNPs proved to be
promising nanomaterials to manufacture low solid drilling fluids The CNPs with very low
concentrations could be added in the drilling fluids to build up a suitable viscosity at relatively
low solid levels and to maintain the desired viscosity throughout the drilling operation Effective
filter cakes could be formed on the wellbore walls with the CNP added low solid drilling fluids
Moreover the nanoparticles have the potential to improve wellbore stability by plugging pores of
subsurface formations such as shale preventing drilling fluid loss into formation and subsurface
fluid intrusion into the wellbore (Sensoy et al 2009 Wilson 2012) However it has to be
92
pointed out that a minimum amount of bentonite is required to maintain an adequate yield point
and form efficient filter cakes with CNPs to prevent large fluid loss The size distributions and
surfaces of CNPs can be tailored to maximize their function as a performance modifier in low
solid drilling fluids Thus the interactions between plate pallets of bentonite and surfaces of
CNPs can be controlled and optimized to improve the rheological properties and filter cakes
characteristics of the low solid drilling fluids made by them This work demonstrates a pathway
for development and applications of renewable and biodegradable nanomaterials in well service
fluids which becomes especially important with increased environmental regulation
54 CONCLUSIONS
The low solid drilling fluids were successfully prepared by substituting CNPs (CNCs and
CNFs) for a part of bentonite in the fluid system Both the CNC-DF and CNF-DF exhibited
similar pseudoplastic behavior due to the excellent shear thinning characteristics of CNP
suspensions Additionally the viscosity yield point and gel strength of the drilling fluids
decreased with additions of CNPs In comparison the CNC-DF fluids had lower values of
viscosity yield point and gel strength than CNF-DF attributed to their distinct structure
characteristics and different interactions with bentonite in the fluid system The small size and
negatively charged surfaces of CNCs caused the generation of repulsive forces with bentonite
promoting the aggregation and separation of CNCs and bentonite In contrast these repulsive
forces were not present in CNFbentonite fluid system and the highly entangled CNFs formed a
flexible 3D network which increased the resistance to flow under shear stress and the larger
viscosity yield point and gel strength were observed On the other hand the filtrate volume of
the drilling fluids increased with an increasing content of CNPs and no significant difference in
standard fluid loss was found between CNC-DF and CNF-DF However the filter cakes of CNC-
93
DF showed lower values of thickness and permeability but higher porosity compared to CNF-
DF The high porosity and low permeability of the filter cakes from CNC-DF were attributed to
isolated pores formed by the aggregation and separation of CNCs and bentonite The flexible 3D
network of CNFs bound more bentonite particles closely resulting thicker filter cakes with lower
porosities Meanwhile the CNFs provided the paths of filtrate flow and increased the pore
connectivity in the filter cakes contributing to its higher permeability The rheological and fluid
filtration properties of CNP added drilling fluids could be further optimized by tailoring the size
distributions and surface functionality of CNPs A new strategy is thus provided to prepare well
service fluids using biopolymer nanoparticles from renewable and biodegradable resources for
oil and gas exploitation
55 REFERENCES
Abdo J Haneef MD 2012 Nano-enhanced drilling fluids pioneering approach to overcome
uncompromising drilling problems J Energ Resour Technol 134 014501
Abdo J Haneef MD 2013 Clay nanoparticles modified drilling fluids for drilling of deep
hydrocarbon wells Appl Clay Sci 86 76-82
Al-Yasiri MS Al-Sallami WT 2015 How the drilling fluids can be made more efficient by
using nanomaterials Am J Nano Res Appl 3 41-45
Amanullah M AlArfaj MK Al-abdullatif ZA 2011 Preliminary test results of nano-based
drilling fluids for oil and gas field application SPEIADC Drilling Conference and
Exhibition Amsterdam
Barry MM Jung Y Lee JK Phuoc TX Chyu MK 2015 Fluid filtration and rheological
properties of nanoparticle additive and intercalated clay hybrid bentonite drilling fluids J
Pet Sci Eng 127 338-346
Baruah B Mishra M Bhattacharjee CR Nihalani MC Mishra SK Baruah SD Phukan
P Goswamee RL 2013 The effect of particle size of clay on the viscosity build up
property of mixed metal hydroxides (MMH) in the low solid-drilling mud compositions
Appl Clay Sci 80-81 169-175
Bourgoyne AT Millheim KK Chenevert ME Young FS (Eds) 1991 Applied Drilling
Engineering first ed Society of Petroleum Engineers Richardson
94
Cheraghian G Hemmati M Masihi M Bazgir S 2013 An experimental investigation of the
enhanced oil recovery and improved performance of drilling fluids using titanium dioxide
and fumed silica nanoparticles J Nanostruct Chem 3 78
Cho MJ Park BD 2011 Tensile and thermal properties of nanocellulose-reinforced poly
(vinyl alcohol) nanocomposites J Ind Eng Chem 17 36-40
Chun SJ Lee SY Doh GH Lee S Kim JH 2011 Preparation of ultrastrength
nanopapers using cellulose nanofibrils J Ind Eng Chem 17 521-526
Fereydouni M Sabbaghi S Saboori R Zeinali S 2012 Effect of polyanionic cellulose
polymer nanoparticles on rheological properties of drilling mud Int J Nanosci
Nanotechnol 8 171-174
Hamed SB Belhadri M 2009 Rheological properties of biopolymers drilling fluids J Pet
Sci Eng 67 84-90
Hermoso J Martinez-Boza F Gallegos C 2015 Influence of aqueous phase volume fraction
organoclay concentration and pressure on invert-emulsion oil muds rheology J Ind Eng
Chem 22 341-349
Jang HY Zhang K Chon BH Choi HJ 2015 Enhanced oil recovery performance and
viscosity characteristics of polysaccharide xanthan gum solution J Ind Eng Chem 21
741-745
Jiang L Yuan L Zheng Q 2009 Research and applications of nanometer bentonite complex
Petrol Drill Tech 37 57-60
Kasiralvalad E 2014 The great potential of nanomaterials in drilling amp drilling fluid
applications Int J Nano Dimens 5 463-471
Kosynkin DV Ceriotti G Wilson KC Lomeda JR Scorsone JT Patel AD Friedheim
JE Tour JM 2011 Graphene oxide as a high-performance fluid-loss-control additive
in water-based drilling fluids ACS Appl Mater Interfaces 4 222-227
Li M Wu Q Song K Lee S Qing Y Wu Y 2015a Cellulose nanoparticles structure-
morphology-rheology relationships ACS Sustain Chem Eng 3 821-832
Li M Wu Q Song K Qing Y Wu Y 2015b Cellulose nanoparticles as modifiers for
rheology and fluid loss in bentonite water-based fluids ACS Appl Mater Interfaces 7
5006-5016
Luckham PF Rossi S 1999 The colloidal and rheological properties of bentonite suspensions
Adv Colloid Interface Sci 82 43-92
Menezes R Marques L Campos L Ferreira H Santana L Neves G 2010 Use of
statistical design to study the influence of CMC on the rheological properties of bentonite
dispersions for water-based drilling fluids Appl Clay Sci 49 13-20
95
Moon RJ Martini A Nairn J Simonsen J Youngblood J 2011 Cellulose nanomaterials
review structure properties and nanocomposites Chem Soc Rev 40 3941-3994
Nasser J Jesil A Mohiuddin T Al Ruqeshi M Devi G Mohataram S 2013
Experimental investigation of drilling fluid performance as nanoparticles World J Nano
Sci Eng 3 57-61
Qu Y Sun J Su Y 2007 Study on properties of nanocomposite poly (styrene-b-acrylamide)
Petrol Drill Tech 35 50-52
Sayyadnejad M Ghaffarian H Saeidi M 2008 Removal of hydrogen sulfide by zinc oxide
nanoparticles in drilling fluid Int J Environ Sci Tech 5 565-569
Sensoy T Chenevert ME Sharma MM 2009 Minimizing water invasion in shales using
nanoparticles SPE Annual Technical Conference and Exhibition New Orleans
Sharma MM Chenevert ME Guo Q Ji L Friedheim J Zhang R 2012 A new family of
nanoparticle based drilling fluids SPE Annual Technical Conference and Exhibition San
Antonio
Wilson A 2012 Nanoparticle use in drilling fluids can effectively reduce permeability in shale
J Pet Technol 64 87-90
96
CHAPTER 6 NOVEL BIOPOLYMER WATER-BASED DRILLING FLUIDS FOR
ENHANCING DRILLING PERFORMANCE
61 INTRODUCTION
Drilling fluids have to perform essential tasks including controlling formation pressures
minimizing formation damage maintaining wellbore stability suspending and carrying out
cuttings and cooling as well as lubricating drilling bit (Bourgoyne et al 1991 Gonzaacutelez et al
2011) Successful drilling operations are highly dependent on the selection of drilling fluids with
desirable properties which are determined by their rheological and fluid filtration properties to a
large extent Lack in required performance of drilling fluids may cause severe drilling problems
such as differential sticking lost circulation wellbore instability and formation damage These
problems become more serious in deep drilling due to deteriorations of drilling fluid properties
resulted from considerable increase in temperature and pressure (Abdo and Haneef 2013) The
flocculation of bentonite at high temperature and high pressure (HTHP) conditions is one of
main factors leading to the malfunctions of drilling fluids (Abdo et al 2014) Therefore it is
highly desirable to find various additives to compensate for bentonite deficiencies
Recently nanotechnology has opened the doorway to the development of a new generation
of fluids defined as smart fluids in which nanoparticles are added for improvedenhanced drilling
and oil recovery (Abdo and Haneef 2013 Farbod et al 2015 Sun et al 2015) Due to the
unique characteristics like small dimensions and high surface area to volume ratio of
nanoparticles they attracted increasing attention as additives in drilling fluids by enhancing
drilling performance including eliminating differential pipe sticking lowering the friction
maintaining borehole stability reducing fluid loss improving cutting removal ability
intensifying mud cake quality decreasing the permeability of shale formation reducing
formation damage and enhancing oil and gas recovery (Kasiralvalad 2014) In order to obtain
97
these performance improvements various nano additives in drilling fluids were studied
Graphene oxide presented good performance as a filtration additive in water-based drilling fluids
at a very low concentration (02 wt) giving an average API fluid loss of 61 mL and a filter
cake of 20 μm thick compared to an fluid loss of 72 mL and a filter cake of 290 μm thick from a
standard fluid in the oil industry (Kosynkin et al 2011) Carbon nanotubes were dispersed in
drilling fluids to enhance the thermal conductivity and filtration properties (Fazelabdolabadi et
al 2015) A core-shell structured nano silica composite was prepared and added into drilling
fluids which showed improved rheology filtration lubricity and pore plugging ability (Mao et
al 2015) In addition a variety of nano metallic oxide like CuO ZnO and TiO2 was also
investigated as an additive to improve performance of drilling fluids especially at HTHT
conditions (Cheraghian et al 2013 Ponmani et al 2015 William et al 2014) Although these
nanoparticles as additives in drilling fluids bring superior properties most of they are expensive
to prepare nonrenewable and nonbiodegradable With more stringent control of pollution safe
risk and cost it is crucial to apply more environmental friendly and cost-effective nanoparticle
as additives in drilling fluids
Nanocellulose as an earth abundant biodegradable and renewable biopolymer
nanomaterial receives great attention due to its excellent characteristics such as nanoscale
dimensions high surface area to volume ratio high mechanical strengthweight performance
and large flexibility (Habibi et al 2010 Hartmann et al 2016) It is extracted from various
cellulosic resources like wood cotton chitin by mechanical treatment acid hydrolysis or
enzymatic hydrolysis Based on the morphology of nanocellulose it can be categorized by
cellulose nanocrystals (CNCs) and cellulose nanofibers (CNFs) CNCs show rod-like shape with
several nanometers in width and 50-500 nm in length while CNFs exhibit highly entangled
98
network and larger aspect ratio with 4-20 nm in width and several micrometers in length (Moon
et al 2011) The differences in the size and shape between them may lead to diverse interface
effects which play an essential role in structure and properties of materials in study The
versatility of nanocellulose makes room for consideration in a wide range of revolutionary
applications It came into view of oilfield researchers and captured great interest judged by the
related patents issued in the past several years CNCs was added in well fluids to increase the
viscosity of water-based well service fluids such as kill pill fracturing fluid and gravel packing
fluid and improve the strength of cement (Rincon-Torres and Hall 2013) CNCs from chitin was
used as additives in cement and wellbore fluids to inhibit corrosion in pipelines and downhole
tools (Hall 2014) Additionally CNCs were added in a variety of well fluids such as fracturing
fluids stimulation fluids completion fluids conformance control fluids and drilling fluids for
treating a subterranean formation by replacing conventional polymers in these fluids (Lafitte et
al 2015) The adding of nanocellulose as environmental friendly materials could reduce
potential harmful effects on both drilling personals and the environment These previous patents
open the door to apply nanocellulose in drilling fluids but further systematic work is required
Specifically the size effects of nanocellulose on rheological and filtration properties of drilling
fluids and characteristics of formed filter cakes especially under HTHP conditions are essential
to fully in-depth understand functions of nanocellulose in the fluids
In this study a novel low-cost and ecologically friendly water-based drilling fluid
containing nanocellulose bentonite and other additives including sodium hydroxide lignite
polyanionic cellulose (PAC) and Rev dust were developed for enhancing drilling performance
The effect of nanocellulose morphology and concentrations on the rheological and fluid filtration
properties of the drilling fluids were investigated The fluid loss of the drilling fluids under low
99
temperature and low pressure (LTLP) and HTHP was measured and compared associated to the
distinct microstructure of nanocellulose and their interactions with bentonite in the fluids
Special emphasis was placed on characteristics of formed filter cakes to demonstrate the
effectiveness and performance of nanocellulose in the drilling fluids
62 MATERIALS AND METHODS
621 Materials
Sulfuric acid and sodium hydroxide (ACS reagent) was purchased from Sigma-Aldrich
Corp (St Louis MO USA) Wyoming sodium bentonite was provided by Baroid Industrial
Drilling Products Inc (Houston TX USA) Lignite was supplied from Halliburton (Houston
TX USA) PAC was purchased from Halliburton Company (Houston TX USA) Rev dust was
provided by Turbo-Chem International Inc (Dr Scott LA USA) Two types of nanocellulose
were used in this study One is CNFs (Celish KY 100-S grade 25 wt solid content) supplied by
Daicel Chemical Industries Ltd (Tokyo Japan) The other one is CNCs produced by breaking
down the CNFs using acid hydrolysis Specifically the sulfuric acid (64 wt) hydrolysis of the
CNFs at 45 ˚C for 1 h followed by further mechanical separation by a high-pressure
homogenizer (Microfluidizer M-110P Microfluidics Corp Newton MA USA) were applied to
produce stable water suspensions of CNCs with an average concentration of 15 wt The
surface morphologies of CNCs and CNFs were observed under a transmission electron
microscope (TEM JEOL 100 CX Peabody MA USA)
622 Formations of Drilling Fluids
Water-based drilling fluids consisting of bentonite nanocellulose and other additives
including sodium hydroxide lignite PAC and rev dust were prepared to be as close as
commercial drilling fluids under use in drilling fields All the drilling fluids were prepared in a
100
standard 350 mL laboratory barrel The concentrations of these components in the water-based
drilling fluids were listed in Table 61 The contents of sodium hydroxide lignite PAC and Rev
Dust were constant for each experiment and they were used as a pH control agent deflocculant
filtration control agent and substance of simulating drilled solids respectively Bentonite and
nanocellulose varied from 10 g to 20 g and from 035 to 350 g in 350 mL water respectively
For unit conversions 1 g substance in 350 mL water is equal to 1 lbbbl in field units
Table 61 Formulations of the drilling fluids
Formulations BT a
(g)
CN b
(g )
NaOH
(g)
Lignite
(g)
PAC
(g)
Rev Dust
(g)
BT20 20 0 025 1 05 5
BT10 10 0 025 1 05 5
BT10CN035 10 035 025 1 05 5
BT10CN105 10 105 025 1 05 5
BT10CN175 10 175 025 1 05 5
BT10CN245 10 245 025 1 05 5
BT10CN350 10 350 025 1 05 5
a Bentonite b Nanocellulose including CNCs and CNFs
623 Rheological Measurements
Rheological properties of the drilling fluids were measured by an industrial rotating
viscometer (NL Baroid NL Industries Inc Houston TX) The apparent viscosity ( ) plastic
viscosity (p ) and yield point (
y ) were calculated using the following formulas according to
American Petroleum Institute (API) recommended standard procedure of testing water-based
drilling fluids
2600 (61)
300600 p (62)
101
py 300 (63)
where 300 and 600 were dial readings from the viscometer at a rotating speed of 300 and 600
rpm respectively To reach steady state conditions the drilling fluids were stirred for 10 min
prior to rheological measurements In addition the gel strength including Gelin and Gel10min of
the drilling fluids was obtained by recording the maximum dial readings at 3 rpm after the fluid
was stirred at 600 rpm for 1 min followed by maintaining static for 10 s and 10 min respectively
624 Fluid Filtration Testing
The LTLP filtration testing was conducted using a standard filter press with a regulated
CO2 pressuring system and standard Fann filter papers (Fann Instrument Co Houston TX
USA) The measurements were completed at the pressure of (100plusmn5) psi ((39plusmn035) bar) and the
temperature of 25 ˚C according to American Petroleum Institute (API) recommended standard
procedure of testing water-based drilling fluids The mass of the filtrate against time was
measured by a digital balance and then the volume of filtrate was calculated by its mass and
density Thus the API fluid loss versus time was determined After the measurements the filter
cakes were removed from the cells and their thickness was recorded Subsequently these filter
cakes were freeze-dried and coated with a thin layer of gold for observing their surface
morphologies by a field emission scanning electron microscope (FE-SEM FEI QuantaTM 3D
FEG Dual Beam SEMFIB Hillsboro OR USA)
The HTHP filtration testing was completed by a permeability plugging apparatus (PPA)
and ceramic discs (Fann Instrument Co Houston TX USA) This equipment was designed to
simulate field well conditions and these discs closely simulated the structure of formation
providing a more authentic representation of downhole filtration A 300 mL sample of the
drilling fluids was loaded into the PPA cell and a ceramic disc with an average pore throat
102
diameter of 20 μm was then inserted The measurements were conducted at the pressure of 1000
psi and the temperature of 200 ˚F The spurt loss (VS) was recorded at the time when the pressure
initially reached 1000 psi The API fluid loss (V) was calculated by the following equation
)2( 30VVV S (64)
where V30 was the fluid loss at 30 min At the end of testing thickness of the filter cakes
deposited on the ceramic disks was recorded Subsequently the filter cakes were removed and
the ceramic disks were dried and coated with a thin layer of gold prior to FE-SEM observation
63 RESULTS AND DISCUSSION
631 Structure of Nanocellulose
Figure 61 TEM photographs and diameter distributions (inserted plots) of the CNCs (A) and
CNFs (B)
The CNCs showed needle-like or whisker shaped morphology (Figure 61A) while the
CNFs exhibited highly entangled network consisting of long nanofibers (Figure 61B) The
CNCs have an average width of (82plusmn23) nm and length of (3216plusmn347) nm giving an aspect
ratio of 39plusmn15 The average diameter of CNFs was measured to be (186plusmn69) nm and the length
was much large in micrometers compared to CNCs Accordingly the CNFs had wider
distribution of diameters and higher aspect ratio than CNCs resulting from the aggregations and
large length of CNFs In addition it was worth mentioning that the sulfuric acid hydrolysis
103
introduced negatively charged sulfate groups onto the surface of CNCs confirmed by the zeta
potential and X-ray photoelectron spectroscopy analysis in our previous work (Li et al 2015)
These sulfate groups would resulted in more stabilized suspensions with individual CNCs well
dispersed in them compared to the CNFs without charged surfaces (Habibi et al 2010) Due to
these structural differences in dimension shape and surface characteristics between the CNCs
and CNFs it was expected that they would produce different effects on rheological and fluid
filtration properties of the drilling fluids
632 Rheological Properties
Figure 62 Viscosity and shear stress as functions of shear rates for the drilling fluids with
different concentrations of nanocellulose
Drilling fluids are commonly considered as non-Newtonian fluids with viscosity decreases
with increased shear rates (Bourgoyne et al 1991) High viscosity of drilling fluids at low rates
104
was required to suspend drilled cuttings and carry them out of the wellbore and low viscosity of
drilling fluids at high rates made it easier for them to flow into downhole Consequently various
additives were used to improve the rheological performance of drilling fluids (Abdo and Haneef
2013 Hamed and Belhadri 2009 Mahto and Sharma 2004) The nanocellulose was thus added
in drilling fluids due to its excellent rheological property besides its abundance and
environmental benefits It was found that the water suspensions of nanocellulose showed obvious
shear thinning behavior with high viscosity at low shear rates and low viscosity at high shear
rates (Moon et al 2011) This phenomenon increased as concentration was raised and showed
concentration dependence at low rates and reduced concentration dependence at high rates (Li et
al 2015 Moon et al 2011) The effects of nanocellulose concentration on the rheological
properties of the drilling fluids were shown in Figure 62 and Table 62 The control sample
without nanocellulose exhibited significant shear thinning behavior and its calculated values of
apparent viscosity and plastic viscosity were 775 cP and 70 cP respectively When the
bentonite content was reduced by half from 20 lbbbl to 10 lbbbl the apparent viscosity and
plastic viscosity of the fluids largely decreased with the values of 350 cP and 30 cP
respectively (Table 62) Maintaining the content of bentonite at 10 lbbbl in the fluids
nanocellulose was added with its concentration varied from 035 to 350 lbbbl It was seen that
the drilling fluids added with CNCs or CNFs still presented a marked shear thinning behavior
similar to the control (Figure 62) confirming the non-Newtonian fluid properties of
nanocellulose suspensions Meanwhile the viscosity went up with increased concentrations of
nanocellulose in the fluids When the content of nanocellulose increased to 105 lbbbl the
apparent viscosity and plastic viscosity of the fluids added with CNCs were 675 cP and 60 cP
and the corresponding values for CNFs were 875 cP and 65 cP which more or less reached the
105
level of the control By further increasing the concentration of nanocellulose the viscosity yield
stress and gel strength of the fluids continued to rise Here it was found that decreasing the
content of bentonite and adding a small amount of nanocellulose the rheological performance of
the drilling fluids maintained and even be improved This would be extremely beneficial because
of the reduced solid content in the drilling fluids which was preferred for faster drilling rate
decreased cost in solid control and fluid maintenance reduced formation damage and improved
hydraulics (Mahto and Sharma 2004)
Table 62 Rheological properties of the drilling fluids with different contents of nanocellulose
Formulations
(cP)
p
( cP )
y
(lb100 sq ft)
Gel Strength
(lb100 sq ft)
Gelin Gel10min
BT20 775 70 15 16 23
BT10 350 30 10 10 10
BT10CNC035 450 40 10 10 12
BT10CNC105 675 60 15 25 90
BT10CNC175 965 68 57 20 127
BT10CNC245 1425 90 105 40 150
BT10CNC350 2075 115 185 84 231
BT10CNF035 450 40 10 10 15
BT10CNF105 875 65 45 20 25
BT10CNF175 1305 76 109 23 24
BT10CNF245 2195 103 233 50 60
BT10CNF350 3405 124 473 90 95
The morphologies of nanocellulose played an essential role in the rheological properties of
the drilling fluids When the lowest amount (035 lbbbl) of CNCs or CNFs was added they had
almost same values of apparent viscosity plastic viscosity yield point and gel strength (Table
106
62) As the content of nanocellulose was above 035 lbbbl the rheological values (excluding
Gel10min) of the fluids with CNCs were lower than those of the fluids with CNFs and the
differences between them became much larger with increased concentration of nanocellulose
For instance at the nanocellulose concentration of 350 lbbbl the fluids with CNCs had
apparent viscosity plastic viscosity yield point and initial gel strength values of 2075 cP 115
cP 185 lb100 sq ft and 84 lb100 sq ft respectively whereas the corresponding values for the
fluids with CNFs were 3405 cP 124 cP 473 lb100 sq ft and 90 lb100 sq ft respectively
These differences were attributed to the distinct structure between CNCs and CNFs The smaller
size and well dispersion of the CNCs made them much easier to flow in the fluids under shear
stress (Li et al 2015) By contrast the long fibers of CNFs formed a highly entangled network
where the platelets of bentonite resided and this system was much difficult to flow under the
same shear stress In addition the Gelin of the fluids with CNCs was slightly lower than that of
the fluids with CNFs but the Gel10min reversed The BT10CNC350 had a Gel10min value of 231
lb100 sq ft which was much larger than 95 lb100 sq ft for the BT10CNF350 (Table 62) This
was due to the stronger hydrogen bonding properties of CNCs compared to CNFs The surfaces
of nanocellulose had hydroxyl groups which could form hydrogen bonding between these
nanoparticles (Moon et al 2011) Compared to CNFs CNCs had a higher specific surface area
because of their smaller dimensions resulting in a larger number of hydroxyl groups available to
form more hydrogen bonds Accordingly a stronger hydrogen bonding network was expected in
the fluids with CNCs making them much harder to flow However it took some time to build an
effective hydrogen bonding network among CNCs in the fluids The formed network was very
weak within a very short time (10 seconds in this study) after a high speed of shear (600 rpm or
1022 s-1) At this time the gel strength (Gelin) of the fluids with CNCs was still lower compared
107
to the fluids with CNFs Giving a longer time (10 min) the stronger network with a larger
number of hydrogen bonds was established so much higher shear stress was required to initiate
the flow of the fluids with CNCs This kind of system was not built due to the limited hydroxyl
groups of CNFs and larger dimensions leading to the lower Gel10min values of the fluids with
CNFs (Figure 63)
Figure 63 Schematic illustrating the formations of hydrogen bonding among CNCs and CNFs in
the fluids
633 Fluid Filtration Under LTLP
A preferred drilling fluid should have desired filtration properties such as a reasonable
range of fluid loss as well as thin and dense filter cakes formed on the walls of wellbores which
could prevent fluid loss circulation differential sticking and even wellbore collapse (Bourgoyne
et al 1991) In Figure 64 the filtration volume of the drilling fluids under LTLP conditions
against the square root of time was shown and linear relationships were observed This could be
explained by Darcyrsquos Law which was commonly used to describe the flow of drilling fluids
filtrate through the filter cakes (Barry et al 2015 Bourgoyne et al 1991) The linear
relationship between filtrate volume and square root of time was expected according to the
solution to Darcyrsquos Law
108
tA
f
fpV
sm
scf )1(2 (65)
where fV t A p scf smf is filtrate volume (mL) time (s) permeability (D) cross-
section area (cm2) of filter cakes pressure drop across filter cakes (atm) viscosity (cP) of filtrate
volume fraction of solids in drilling fluids and volume fraction of solids in filter cakes The
control (BT20) had a fluid loss of 1247 mL and the value increased to 1536 mL when the
bentonite content decreased to 10 lbbbl (Table 63) After the nanocellulose was added the fluid
loss was slightly larger than BT20 but not obviously different from BT10 with varied values in
the small ranges of 1369-1578 mL for the fluids with CNCs and 1632-1752 mL for the fluids
with CNFs respectively This indicated that the concentration of nanocellulose didnrsquot have a
significant effect on the filtrate volume of the drilling fluids under LTLP conditions
Additionally it was noticed that the fluid loss of the fluids with CNFs was a little higher than
that of the fluids with CNCs which would be explained by further investigating the formed filter
cakes
Figure 64 Filtration volume versus square root of time for the drilling fluids under LTLP
conditions
109
Table 63 The API fluid loss thickness and permeability of filter cakes for the drilling fluids
under LTLP conditions
Formulations Vf
(mL)
hc
(cm )
k
(μD)
khc
(μDcm)
BT20 1247 013 232 178
BT10 1536 010 217 217
BT10CNC035 1369 010 194 194
BT10CNC105 1578 010 255 255
BT10CNC175 1473 011 232 211
BT10CNC245 1534 016 346 216
BT10CNC350 1446 027 546 202
BT10CNF035 1632 010 231 231
BT10CNF105 1655 011 263 239
BT10CNF175 1679 016 361 226
BT10CNF245 1752 022 526 239
BT10CNF350 1735 032 745 233
The characteristics of filter cakes were shown in Table 63 and Figure 65 The thickness of
filter cakes for BT20 and BT10 was 013 cm and 010 cm respectively When a small content
(lt175 lbbbl for CNCs and lt105 lbbbl for CNCs) of nanocellulose was added into the fluids
the thickness of filter cakes almost unchanged within the values of 010-011 cm As more
nanocellulose was used the thickness of filter cakes increased quickly and reached to 027 cm
for BT10CNC350 and 032 cm for BT10CNF350 The similar trend was found for the
permeability of the filter cakes calculated by the following equation
c
f
h
pA
dt
dV
(66)
where ch is the thickness of filter cake (cm) To calculated the permeability A p and
were assumed to be constant with the values of 45 cm2 690 Pa and 1times10-3 Pamiddots respectively
110
The increased thickness and permeability of filter cakes with larger amount of nanocellulose
(gt175 lbbbl for CNCs and gt105 lbbbl for CNFs) resulted from more loose structure of cakes
caused by the added nanofibers especially for CNFs (Figure 65) These nanofibers and
bentonite were not miscible and the interfaces between them could offer paths for the filtrate to
flow through the filter cakes and enhanced the connectivity of pores in the filter cakes This
phenomenon became more obvious with increased concentration of nanocellulose and larger
nanofibers resulting in relatively larger permeability of filter cakes with CNFs compared to
CNCs In addition filtrate volume was proportional to permeability but inversely proportional to
thickness of filter cakes according to the above equation Then the ratio of permeability to cake
thickness was calculated and found to fit well with the values of filtrate volume (Table 63)
Consequently the slightly higher fluid loss of the drilling fluids with CNFs compared to the
fluids added by CNCs was contributed by both the increased permeability and thickness of filter
cakes but the former made a bigger one than the later
Figure 65 Surface and cross sectional FE-SEM images of the filter cakes for BT20 (A and D)
BT10CNC350 (B and E) and BT10CNF350 (C and F) under LTLP conditions (A B and C
Cross section morphology D E and F Surface morphology)
111
634 Fluid Filtration Under HTHP
Figure 66 The API fluid loss and cake thickness of the drilling fluids under HTHP conditions
The API fluid loss and cake thickness of the drilling fluids under HTHP conditions were
shown in Figure 66 The control (BT20) had a filtrate volume of 50 mL at the end of 30 min
testing time When the bentonite content decreased by half the filtrate spurted out quickly and
continuously and the applied pressure could not go up to 1000 psi making the measurement of
fluid loss for BT10 unattainable This indicated that 10 lbbbl of bentonite in the fluids was not
enough to plug the pores (diameter 20 μm) of the ceramic disks in this study However this
situation was avoided by adding nanocellulose into the drilling fluids with 10 lbbbl of bentonite
The fluid loss decreased with increased concentrations of nanocellulose As the CNFs were
above 105 lbbbl the filtrate volume of the fluids was even lower than that of the control sample
with values ranging from 36-47 mL depending on the amount of CNFs In addition the fluids
with CNFs performed much better than those with CNCs although the former had a little higher
thickness of filter cakes than the later The differences in filtrate volume between the fluids
added with CNCs and CNFs were related to their different pore plugging ability under HTHP
conditions
112
Figure 67 Surface and cross sectional FE-SEM images of the ceramic disks for BT20 (A and D)
BT10CNC350 (B and E) and BT10CNF350 (C and F) under HTHP conditions (A B and C
Cross section morphology D E and F Surface morphology)
The penetration of the drilling fluids into the porous ceramic disk was shown in Figure 67
It was seen that the solids mainly entered into the surface of the disks with a depth of 100-300
μm Compared to BT20 the fluids added with nanocellulose had a lower penetration depth due
to the reduced solid contents in the drilling fluids The fluids with CNCs could not seal the pores
in the disks completely because of their very small dimensions On the contrary the fluids with
CNFs plugged the pores more efficiently with their long entangled fibers contributing to the
lower fluid loss of the drilling fluids with CNFs Therefore a decreased amount of bentonite
from 20 lbbbl to 10 lbbbl with addition of a small fraction of CNFs (105-350 lbbbl) could
reduce the fluid loss and formation damage with a less penetration depth Additionally it was
worth mentioning that the effect of nanocellulose on pore plugging ability was dependent on the
size of itself and pores of disks Therefore the size of nanocellulose could be tuned by changing
113
the preparation conditions such as concentrations of sulfuric acid and time of acid hydrolysis to
maximize the plugging capability for subsurface formations with different pore diameters
64 CONCLUSIONS
The novel low cost ecologically friendly and high performance water-based drilling fluids
were successfully fabricated by replacing half of bentonite in traditional fluids with earth
abundant nanocellulose The added nanocellulose played an essential role in improving the
rheological and fluid filtration properties of the drilling fluids The fluids with nanocellulose
showed similar non-Newtonian fluid behavior to the control due to the excellent shear thinning
properties of water suspensions of nanocellulose The viscosity yield point and gel strength of
the fluids increased with an increasing concentration of nanocellulose The fluids with CNCs
were easier to flow due to their small dimensions and well dispersions than the fluids added by
CNFs having long and highly entangled nanofibers resulting in lower values in viscosity yield
point and initial gel strength for the former compared to the later The high 10-min gel strength
of the fluids with CNCs was attributed to the strong hydrogen bonding network formed among
CNCs For filtration properties the fluid loss of the drilling fluids added with nanocellulose was
larger than the control under LTLP conditions due to the enhanced connectivity of pores in the
filter cakes by the nanocellulose However the nanocellulose performed much better under
HTHP conditions especially the CNFs The long and highly intertwined CNFs plugged the pores
in the ceramic disks efficiently leading to lower fluid loss even than the control when the
content of CNFs was above 105 lbbbl Furthermore the dimensions of nanocellulse could be
controlled to maximize the plugging effect of subsurface formations with different pore sizes
Therefore a novel pathway was provided to develop novel renewable biopolymer additives in
114
water-based drilling fluids with enhanced performance and advantages of low cost and
ecologically friendly
65 REFERENCES
Abdo J Haneef MD 2013 Clay nanoparticles modified drilling fluids for drilling of deep
hydrocarbon wells Appl Clay Sci 86 76-82
Abdo J Zaier R Hassan E AL‐Sharji H Al‐Shabibi A 2014 ZnOndashclay nanocomposites
for enhance drilling at HTHP conditions Surf Interface Anal 46 970-974
Barry MM Jung Y Lee JK Phuoc TX Chyu MK 2015 Fluid filtration and rheological
properties of nanoparticle additive and intercalated clay hybrid bentonite drilling fluids J
Pet Sci Eng 127 338-346
Bourgoyne AT Millheim KK Chenevert ME Young FS (Eds) 1991 Applied Drilling
Engineering first ed Society of Petroleum Engineers Richardson
Cheraghian G Hemmati M Masihi M Bazgir S 2013 An experimental investigation of the
enhanced oil recovery and improved performance of drilling fluids using titanium dioxide
and fumed silica nanoparticles J Nanostruct Chem 3 78
Farbod M Kouhpeymani asl R Noghreh abadi AR 2015 Morphology dependence of
thermal and rheological properties of oil-based nanofluids of CuO nanostructures
Colloids Surf A 474 71-75
Fazelabdolabadi B Khodadadi AA Sedaghatzadeh M 2015 Thermal and rheological
properties improvement of drilling fluids using functionalized carbon nanotubes Appl
Nanosci 5 651-659
Gonzaacutelez J Quintero F Arellano J Maacuterquez R Saacutenchez C Perniacutea D 2011 Effects of
interactions between solids and surfactants on the tribological properties of water-based
drilling fluids Colloids Surf A 391 216-223
Habibi Y Lucia LA Rojas OJ 2010 Cellulose nanocrystals chemistry self-assembly and
applications Chem Rev 110 3479-3500
Hall LJ 2014 Chitin nanocrystal containing wellbore fluids United States Patent US
20140238677 A1
Hamed SB Belhadri M 2009 Rheological properties of biopolymers drilling fluids J Pet
Sci Eng 67 84-90
Hartmann R Sirviouml JA Sliz R Laitinen O Liimatainen H Aumlmmaumllauml A Fabritius T
Illikainen M 2016 Interactions between aminated cellulose nanocrystals and quartz
Adsorption and wettability studies Colloids Surf A 489 207-215
115
Kasiralvalad E 2014 The great potential of nanomaterials in drilling amp drilling fluid
applications Int J Nano Dimens 5 463-471
Kosynkin DV Ceriotti G Wilson KC Lomeda JR Scorsone JT Patel AD Friedheim
JE Tour JM 2011 Graphene oxide as a high-performance fluid-loss-control additive
in water-based drilling fluids ACS Appl Mater Interfaces 4 222-227
Lafitte V Lee JC James SG Del Valle JF Yakovlev AV Panga MK Szabo GH
2015 Fluids and methods including nanocellulose United States Patent US 20150072902
A1
Li M Wu Q Song K Lee S Qing Y Wu Y 2015 Cellulose nanoparticles structure-
morphology-rheology relationships ACS Sustain Chem Eng 3 821-832
Mahto V Sharma V 2004 Rheological study of a water based oil well drilling fluid J Pet
Sci Eng 45 123-128
Mao H Qiu Z Shen Z Huang W Zhong H Dai W 2015 Novel hydrophobic associated
polymer based nano-silica composite with core-shell structure for intelligent drilling fluid
under ultra-high temperature and ultra-high pressure Prog Nat Sci Mater Int 25 90-93
Moon RJ Martini A Nairn J Simonsen J Youngblood J 2011 Cellulose nanomaterials
review structure properties and nanocomposites Chem Soc Rev 40 3941-3994
Ponmani S Nagarajan R Sangwai JS 2015 Effect of nanofluids of CuO and ZnO in
polyethylene glycol and polyvinylpyrrolidone on the thermal electrical and filtration-
loss properties of water-based drilling fluids SPE J
Rincon-Torres MT Hall LJ 2013 Cellulose nanowhiskers in well services United States
Patent US 20130196883 A1
Sun F Lin M Dong Z Zhang J Wang C Wang S Song F 2015 Nanosilica-induced
high mechanical strength of nanocomposite hydrogel for killing fluids J Colloid
Interface Sci 458 45-52
William JKM Ponmani S Samuel R Nagarajan R Sangwai JS 2014 Effect of CuO
and ZnO nanofluids in xanthan gum on thermal electrical and high pressure rheology of
water-based drilling fluids J Pet Sci Eng 117 15-27
116
CHAPTER 7 OVERALL CONCLUSIONS
71 MAIN CONCLUSIONS
In this study biomass resources (tar and nanocellulose) were utilized to prepare low-cost
nanocomposite and drilling fluids On one hand tar from biomss gasification was recycled for
fabricating low-cost antimicrobial nanofiber by electrospinning On the other hand
nanocellulose was used as a ldquogreenrdquo additive in drilling fluids for improving rheological and
fluid filtration properties The conclusions of this study are as follows
The tar was a complex mixture mainly composed of highly branched PAHs furans
aliphatics and esters as indicated by the GC-MS and FTIR spectroscopy The elemental analysis
showed that biomass tar with higher HC and OC was more oxygenated and less aromatic than
fossil pitches implying that the tar was more reactive The complex composition of the tar led to
a broad thermal decomposition temperature range The tar decomposed at a low temperature
(183-252 degC depending on the heating rates) compared with biomass feedstock due to the low
molecular mass components in the tar produced by gasification The thermal kinetics of the tar
indicated that single reaction mechanism can be applied in low conversion rates and the reaction
mechanism changed in higher conversions caused by the complex reactions in decomposition
process of biomass tar
The tar and PAN was blended and electrospun into nanofibers The contents of tar in the
blends significantly affected the morphology thermal properties pore characteristics and
antimicrobial activity of the resulting electrospun nanofibers Continuous nanofibers were
produced at the tar content levels up to 100 wt based on the weight of PAN The tarPAN
nanofibers exhibited increased average diameters and surface roughness with increasing content
of tar ATR-FTIR spectroscopy revealed that the tar was successfully incorporated into the
117
tarPAN nanofibers The tarPAN nanofibers were less thermally stable than the neat PAN
nanofibers due to the relatively low onset temperature of degradation of biomass tar and their
thermal stability decreased with increasing amount of tar However the tarPAN nanofibers had
a comparable amount of residual weight (35) compared to PAN (38) at 600 degC suggesting
that tars can be an attracting precursor for manufacturing carbon nanofibers Furthermore the
addition of tar facilitated catalytically the cyclization of PAN which is helpful for stabilization
processes in the manufacture of PAN-based carbon fibers The tarPAN nanofibers exhibited
increased antimicrobial capacity against S aureus and E coli with increased tar content
Continuous microporous CNFs from biomass tarPANsilver hybrids with antimicrobial
capabilities were fabricated through electrospinning and subsequent thermal stabilization and
carbonization Silver nitrate was reduced to silver nanoparticles which conferred the
antimicrobial abilities to the as-spun nanofibers and CNFs The as-spun nanofibers showed
larger average diameters with increased tar loading levels due to larger concentrations of tar and
PAN in the suspensions However the increased contents of tar made the fiber surface rougher
and increased fiber diameter variations resulted from tar aggregations and phase separations
between tar and PAN In addition the incorporation of tar reduced the thermal stability of the as-
spun nanofibers due to relatively lower onset degradation temperatures of the tar components
The tar also slowed down the cyclization reactions of PAN by its ionizable groups which was
helpful for subsequent stabilization processes The as-spun nanofibers exhibited mesopore
characteristics while micropores dominated in the CNFs due to the combined effects of thermal
decompositions of some tar constituents and phase separations of tar and PAN The large
specific surface areas and the volumes of pores of the as-spun nanofibers and CNFs made the
118
silver nanoparticles more easily diffuse into the broth endowing their excellent antimicrobial
abilities
In addition the low solid drilling fluids were successfully prepared by substituting
nanocelulose (CNCs and CNFs) for a part of bentonite in the fluid system Both the CNC-DF
and CNF-DF exhibited similar pseudoplastic behavior due to the excellent shear thinning
characteristics of CNP suspensions Additionally the viscosity yield point and gel strength of
the drilling fluids decreased with additions of CNPs In comparison the CNC-DF fluids had
lower values of viscosity yield point and gel strength than CNF-DF attributed to their distinct
structure characteristics and different interactions with bentonite in the fluid system On the other
hand the filtrate volume of the drilling fluids increased with an increasing content of CNPs and
no significant difference in standard fluid loss was found between CNC-DF and CNF-DF
However the filter cakes of CNC-DF showed lower values of thickness and permeability but
higher porosity compared to CNF-DF The high porosity and low permeability of the filter cakes
from CNC-DF were attributed to isolated pores formed by the aggregation and separation of
CNCs and bentonite The flexible 3D network of CNFs bound more bentonite particles closely
resulting thicker filter cakes with lower porosities Meanwhile the CNFs provided the paths of
filtrate flow and increased the pore connectivity in the filter cakes contributing to its higher
permeability The rheological and fluid filtration properties of CNP added drilling fluids could be
further optimized by tailoring the size distributions and surface functionality of CNPs
Finally nanocellulose was added into the water-based drilling fluids composed of reduced
amount of bentonite as well as other additives which simulated the fluids under field use The
added nanocellulose played an essential role in improving the rheological and fluid filtration
properties of the drilling fluids The fluids with nanocellulose showed similar non-Newtonian
119
fluid behavior to the control due to the excellent shear thinning properties of water suspensions
of nanocellulose The viscosity yield point and gel strength of the fluids increased with an
increasing concentration of nanocellulose The fluids with CNCs were easier to flow due to their
small dimensions and well dispersions than the fluids added by CNFs having long and highly
entangled nanofibers resulting in lower values in viscosity yield point and initial gel strength
for the former compared to the later The high 10-min gel strength of the fluids with CNCs was
attributed to the strong hydrogen bonding network formed among CNCs For filtration properties
the fluid loss of the drilling fluids added with nanocellulose was larger than the control under
LTLP conditions due to the enhanced connectivity of pores in the filter cakes by the
nanocellulose However the nanocellulose performed much better under HTHP conditions
especially the CNFs The long and highly intertwined CNFs plugged the pores in the ceramic
disks efficiently leading to lower fluid loss even than the control when the content of CNFs was
above 105 lbbbl Furthermore the dimensions of nanocellulse could be controlled to maximize
the plugging effect of subsurface formations with different pore sizes Therefore a novel
pathway was provided to develop novel renewable biopolymer additives in water-based drilling
fluids with enhanced performance and advantages of low cost and ecologically friendly
72 FUTURE WORK
Due to the relatively high carbon content in biomass tar it is a promising materials for
carbon materials including carbon fibers porous carbon and carbon foam Different carbon
materials have been fabricated and characterized using coal or petroleum derived pitch which has
a similar composition to tar However carbon materials produced by tar from biomass
conversions have not been reported Consequently it is expected to manufacture biomass tar-
based carbon materials using this abundant and low-cost carbon precursor In this study the
120
biomass tar derived carbon fibers were prepared by electrospinning with PAN The obtained
showed porous structure that showed potential in a wide of applications including absorption
separation and filtration Continued work could be done to measure the performance of the
fabricated tar-derived carbon in these applications In addition the biomass tar could be also
used to produce porous carbon and carbon foam materials The synthesis of porous carbon
materials can be achieved by various methods including chemical or physical activation
catalytic activation carbonization of polymer blends containing thermally decomposable
components carbonization of a polymer aerogel and templating method These porous carbons
provide unique benefits such as high specific surface area and large porosity in combination with
good chemical and mechanical stability which can be widely used in applications such as gas
separation water purification catalyst supports and electrodes for electrochemical double layer
capacitors and fuel cells In addition carbon foam can be produced from a carbon precursor
under high pressure or made by introducing gas bubbles into the liquid resin allowing the
bubbles to grow and stabilize solidifying and then carbonizing Through these work the tar-
associated environmental damage can be reduced and the efficiency of biomass utilization can be
also largely improved
For the application of nanocellulose in fluids for oil and gas exploitation future work could
be continued to use nanocellulose as a functional additive in fracturing fluids The traditional
fracturing fluids are mainly formulated by guar gum whose price increases a lot in recent years
A cheaper substitute for guar gum is high desirable to reduce the cost of oil and gas production
Nanocellulose is a promising candidate due to its excellent characteristics such as good
rheological properties and eco-friendliness Little work has been done in application of
nanocellulose in fracturing fluids until now The rheology of nanocellulose crosslinked by borax
121
crosslinking mechanism by different crosslinkers the interactions between guar gum and
nanocellulose the suspending capability of fluids added with nanocellulose will be the
interesting research spots
122
APPENDIX PERMISSION LETTER
For chapter 2
SPRINGER LICENSE
TERMS AND CONDITIONS
Mar 17 2016
This is a License Agreement between Kunlin Song (You) and Springer (Springer) provided
by Copyright Clearance Center (CCC) The license consists of your order details the terms
and conditions provided by Springer and the payment terms and conditions
All payments must be made in full to CCC For payment instructions please see
information listed at the bottom of this form
License Number 3830961068578
License date Mar 16 2016
Licensed content publisher Springer
Licensed content publication Journal of Thermal Analysis and Calorimetry
Licensed content title Structure and thermal properties of tar from gasification of
agricultural crop residue
Licensed content author Kunlin Song
Licensed content date Jan 1 2014
Volume number 119
Issue number 1
Type of Use ThesisDissertation
Portion Full text
Number of copies 1
Author of this Springer article Yes and you are a contributor of the new work
Country of republication other
Order reference number None
Title of your thesis
dissertation
APPLICATION OF BIOMASS IN NANOCOMPOSITES AND
DRILLING FLUIDS
Expected completion date May 2016
Estimated size(pages) 150
Total 000 USD
Terms and Conditions
123
Introduction
The publisher for this copyrighted material is Springer By clicking accept in connection with
completing this licensing transaction you agree that the following terms and conditions apply to
this transaction (along with the Billing and Payment terms and conditions established by
Copyright Clearance Center Inc (CCC) at the time that you opened your Rightslink account
and that are available at any time at httpmyaccountcopyrightcom)
Limited License
With reference to your request to reuse material on which Springer controls the copyright
permission is granted for the use indicated in your enquiry under the following conditions
- Licenses are for one-time use only with a maximum distribution equal to the number stated in
your request
- Springer material represents original material which does not carry references to other sources
If the material in question appears with a credit to another source this permission is not valid
and authorization has to be obtained from the original copyright holder
- This permission
bull is non-exclusive
bull is only valid if no personal rights trademarks or competitive products are infringed
bull explicitly excludes the right for derivatives
- Springer does not supply original artwork or content
- According to the format which you have selected the following conditions apply accordingly
bull Print and Electronic This License include use in electronic form provided it is password
protected on intranet or CD-RomDVD or E-bookE-journal It may not be republished in
electronic open access
bull Print This License excludes use in electronic form
bull Electronic This License only pertains to use in electronic form provided it is password
protected on intranet or CD-RomDVD or E-bookE-journal It may not be republished in
electronic open access
For any electronic use not mentioned please contact Springer at permissionsspringerspi-
globalcom
- Although Springer controls the copyright to the material and is entitled to negotiate on rights
this license is only valid subject to courtesy information to the author (address is given in the
articlechapter)
- If you are an STM Signatory or your work will be published by an STM Signatory and you are
requesting to reuse figurestablesillustrations or single text extracts permission is granted
according to STM Permissions Guidelines httpwwwstm-assocorgpermissions-guidelines
For any electronic use not mentioned in the Guidelines please contact Springer
atpermissionsspringerspi-globalcom If you request to reuse more content than stipulated in
the STM Permissions Guidelines you will be charged a permission fee for the excess content
Permission is valid upon payment of the fee as indicated in the licensing process If permission
is granted free of charge on this occasion that does not prejudice any rights we might have to
charge for reproduction of our copyrighted material in the future
-If your request is for reuse in a Thesis permission is granted free of charge under the following
conditions
This license is valid for one-time use only for the purpose of defending your thesis and with a
maximum of 100 extra copies in paper If the thesis is going to be published permission needs
to be reobtained
124
- includes use in an electronic form provided it is an author-created version of the thesis on
hisher own website and hisher universityrsquos repository including UMI (according to the
definition on the Sherpa website httpwwwsherpaacukromeo)
- is subject to courtesy information to the co-author or corresponding author
Geographic Rights Scope
Licenses may be exercised anywhere in the world
AlteringModifying Material Not Permitted
Figures tables and illustrations may be altered minimally to serve your work You may not
alter or modify text in any manner Abbreviations additions deletions andor any other
alterations shall be made only with prior written authorization of the author(s)
Reservation of Rights
Springer reserves all rights not specifically granted in the combination of (i) the license details
provided by you and accepted in the course of this licensing transaction and (ii) these terms and
conditions and (iii) CCCs Billing and Payment terms and conditions
License Contingent on Payment
While you may exercise the rights licensed immediately upon issuance of the license at the end
of the licensing process for the transaction provided that you have disclosed complete and
accurate details of your proposed use no license is finally effective unless and until full
payment is received from you (either by Springer or by CCC) as provided in CCCs Billing and
Payment terms and conditions If full payment is not received by the date due then any license
preliminarily granted shall be deemed automatically revoked and shall be void as if never
granted Further in the event that you breach any of these terms and conditions or any of CCCs
Billing and Payment terms and conditions the license is automatically revoked and shall be void
as if never granted Use of materials as described in a revoked license as well as any use of the
materials beyond the scope of an unrevoked license may constitute copyright infringement and
Springer reserves the right to take any and all action to protect its copyright in the materials
Copyright Notice Disclaimer
You must include the following copyright and permission notice in connection with any
reproduction of the licensed material
Springer bookjournal title chapterarticle title volume year of publication page name(s) of
author(s) (original copyright notice as given in the publication in which the material was
originally published) With permission of Springer
In case of use of a graph or illustration the caption of the graph or illustration must be included
as it is indicated in the original publication
Warranties None
Springer makes no representations or warranties with respect to the licensed material and adopts
on its own behalf the limitations and disclaimers established by CCC on its behalf in its Billing
and Payment terms and conditions for this licensing transaction
Indemnity
You hereby indemnify and agree to hold harmless Springer and CCC and their respective
officers directors employees and agents from and against any and all claims arising out of your
use of the licensed material other than as specifically authorized pursuant to this license
No Transfer of License
This license is personal to you and may not be sublicensed assigned or transferred by you
without Springers written permission
No Amendment Except in Writing
125
This license may not be amended except in a writing signed by both parties (or in the case of
Springer by CCC on Springers behalf)
Objection to Contrary Terms
Springer hereby objects to any terms contained in any purchase order acknowledgment check
endorsement or other writing prepared by you which terms are inconsistent with these terms
and conditions or CCCs Billing and Payment terms and conditions These terms and conditions
together with CCCs Billing and Payment terms and conditions (which are incorporated herein)
comprise the entire agreement between you and Springer (and CCC) concerning this licensing
transaction In the event of any conflict between your obligations established by these terms and
conditions and those established by CCCs Billing and Payment terms and conditions these
terms and conditions shall control
Jurisdiction
All disputes that may arise in connection with this present License or the breach thereof shall
be settled exclusively by arbitration to be held in the Federal Republic of Germany in
accordance with German law
Other conditions V 12AUG2015
Questions customercarecopyrightcom or +1-855-239-3415 (toll free in the US) or +1-
978-646-2777
126
For chapter 3
ELSEVIER LICENSE
TERMS AND CONDITIONS
Mar 17 2016
This is a License Agreement between Kunlin Song (You) and Elsevier (Elsevier) provided
by Copyright Clearance Center (CCC) The license consists of your order details the terms
and conditions provided by Elsevier and the payment terms and conditions
All payments must be made in full to CCC For payment instructions please see
information listed at the bottom of this form
Supplier Elsevier Limited
The BoulevardLangford Lane
KidlingtonOxfordOX5 1GBUK
Registered Company Number 1982084
Customer name Kunlin Song
Customer address Room 112 RNR Bldg
BATON ROUGE LA 70803
License number 3830961299554
License date Mar 16 2016
Licensed content publisher Elsevier
Licensed content publication Fuel
Licensed content title Fabricating electrospun nanofibers with
antimicrobial capability A facile route to recycle
biomass tar
Licensed content author Kunlin SongQinglin WuZhen ZhangSuxia
RenTingzhou LeiKerry M DooleyDa
LiuMarlene E Janes
Licensed content date 15 June 2015
Licensed content volume number 150
Licensed content issue number na
Number of pages 8
Start Page 123
End Page 130
Type of Use reuse in a thesisdissertation
127
Intended publisher of new work other
Portion full article
Format electronic
Are you the author of this Elsevier article Yes
Will you be translating No
Title of your thesisdissertation APPLICATION OF BIOMASS IN
NANOCOMPOSITES AND DRILLING FLUIDS
Expected completion date May 2016
Estimated size (number of pages) 150
Elsevier VAT number GB 494 6272 12
Permissions price 000 USD
VATLocal Sales Tax 000 USD 000 GBP
Total 000 USD
Terms and Conditions
INTRODUCTION 1 The publisher for this copyrighted material is Elsevier By clicking accept in connection
with completing this licensing transaction you agree that the following terms and conditions
apply to this transaction (along with the Billing and Payment terms and conditions established
by Copyright Clearance Center Inc (CCC) at the time that you opened your Rightslink
account and that are available at any time athttpmyaccountcopyrightcom)
GENERAL TERMS 2 Elsevier hereby grants you permission to reproduce the aforementioned material subject to the
terms and conditions indicated
3 Acknowledgement If any part of the material to be used (for example figures) has appeared
in our publication with credit or acknowledgement to another source permission must also be
sought from that source If such permission is not obtained then that material may not be
included in your publicationcopies Suitable acknowledgement to the source must be made
either as a footnote or in a reference list at the end of your publication as follows
Reprinted from Publication title Vol edition number Author(s) Title of article title of
chapter Pages No Copyright (Year) with permission from Elsevier [OR APPLICABLE
SOCIETY COPYRIGHT OWNER] Also Lancet special credit - Reprinted from The Lancet
Vol number Author(s) Title of article Pages No Copyright (Year) with permission from
Elsevier
4 Reproduction of this material is confined to the purpose andor media for which permission is
hereby given
5 AlteringModifying Material Not Permitted However figures and illustrations may be
alteredadapted minimally to serve your work Any other abbreviations additions deletions
andor any other alterations shall be made only with prior written authorization of Elsevier Ltd
(Please contact Elsevier at permissionselseviercom)
6 If the permission fee for the requested use of our material is waived in this instance please be
128
advised that your future requests for Elsevier materials may attract a fee
7 Reservation of Rights Publisher reserves all rights not specifically granted in the combination
of (i) the license details provided by you and accepted in the course of this licensing transaction
(ii) these terms and conditions and (iii) CCCs Billing and Payment terms and conditions
8 License Contingent Upon Payment While you may exercise the rights licensed immediately
upon issuance of the license at the end of the licensing process for the transaction provided that
you have disclosed complete and accurate details of your proposed use no license is finally
effective unless and until full payment is received from you (either by publisher or by CCC) as
provided in CCCs Billing and Payment terms and conditions If full payment is not received on
a timely basis then any license preliminarily granted shall be deemed automatically revoked and
shall be void as if never granted Further in the event that you breach any of these terms and
conditions or any of CCCs Billing and Payment terms and conditions the license is
automatically revoked and shall be void as if never granted Use of materials as described in a
revoked license as well as any use of the materials beyond the scope of an unrevoked license
may constitute copyright infringement and publisher reserves the right to take any and all action
to protect its copyright in the materials
9 Warranties Publisher makes no representations or warranties with respect to the licensed
material
10 Indemnity You hereby indemnify and agree to hold harmless publisher and CCC and their
respective officers directors employees and agents from and against any and all claims arising
out of your use of the licensed material other than as specifically authorized pursuant to this
license
11 No Transfer of License This license is personal to you and may not be sublicensed
assigned or transferred by you to any other person without publishers written permission
12 No Amendment Except in Writing This license may not be amended except in a writing
signed by both parties (or in the case of publisher by CCC on publishers behalf)
13 Objection to Contrary Terms Publisher hereby objects to any terms contained in any
purchase order acknowledgment check endorsement or other writing prepared by you which
terms are inconsistent with these terms and conditions or CCCs Billing and Payment terms and
conditions These terms and conditions together with CCCs Billing and Payment terms and
conditions (which are incorporated herein) comprise the entire agreement between you and
publisher (and CCC) concerning this licensing transaction In the event of any conflict between
your obligations established by these terms and conditions and those established by CCCs
Billing and Payment terms and conditions these terms and conditions shall control
14 Revocation Elsevier or Copyright Clearance Center may deny the permissions described in
this License at their sole discretion for any reason or no reason with a full refund payable to
you Notice of such denial will be made using the contact information provided by you Failure
to receive such notice will not alter or invalidate the denial In no event will Elsevier or
Copyright Clearance Center be responsible or liable for any costs expenses or damage incurred
by you as a result of a denial of your permission request other than a refund of the amount(s)
paid by you to Elsevier andor Copyright Clearance Center for denied permissions
LIMITED LICENSE The following terms and conditions apply only to specific license types
15 Translation This permission is granted for non-exclusive world English rights only unless
your license was granted for translation rights If you licensed translation rights you may only
translate this content into the languages you requested A professional translator must perform
129
all translations and reproduce the content word for word preserving the integrity of the article
16 Posting licensed content on any Website The following terms and conditions apply as
follows Licensing material from an Elsevier journal All content posted to the web site must
maintain the copyright information line on the bottom of each image A hyper-text must be
included to the Homepage of the journal from which you are licensing
athttpwwwsciencedirectcomsciencejournalxxxxx or the Elsevier homepage for books
athttpwwwelseviercom Central Storage This license does not include permission for a
scanned version of the material to be stored in a central repository such as that provided by
HeronXanEdu
Licensing material from an Elsevier book A hyper-text link must be included to the Elsevier
homepage at httpwwwelseviercom All content posted to the web site must maintain the
copyright information line on the bottom of each image
Posting licensed content on Electronic reserve In addition to the above the following clauses
are applicable The web site must be password-protected and made available only to bona fide
students registered on a relevant course This permission is granted for 1 year only You may
obtain a new license for future website posting
17 For journal authors the following clauses are applicable in addition to the above
Preprints A preprint is an authors own write-up of research results and analysis it has not been peer-
reviewed nor has it had any other value added to it by a publisher (such as formatting
copyright technical enhancement etc)
Authors can share their preprints anywhere at any time Preprints should not be added to or
enhanced in any way in order to appear more like or to substitute for the final versions of
articles however authors can update their preprints on arXiv or RePEc with their Accepted
Author Manuscript (see below)
If accepted for publication we encourage authors to link from the preprint to their formal
publication via its DOI Millions of researchers have access to the formal publications on
ScienceDirect and so links will help users to find access cite and use the best available
version Please note that Cell Press The Lancet and some society-owned have different preprint
policies Information on these policies is available on the journal homepage
Accepted Author Manuscripts An accepted author manuscript is the manuscript of an article
that has been accepted for publication and which typically includes author-incorporated changes
suggested during submission peer review and editor-author communications
Authors can share their accepted author manuscript
immediately
o via their non-commercial person homepage or blog
o by updating a preprint in arXiv or RePEc with the accepted manuscript
o via their research institute or institutional repository for internal
institutional uses or as part of an invitation-only research collaboration
work-group
o directly by providing copies to their students or to research collaborators
for their personal use
o for private scholarly sharing as part of an invitation-only work group on
commercial sites with which Elsevier has an agreement
after the embargo period
o via non-commercial hosting platforms such as their institutional
130
repository
o via commercial sites with which Elsevier has an agreement
In all cases accepted manuscripts should
link to the formal publication via its DOI
bear a CC-BY-NC-ND license - this is easy to do
if aggregated with other manuscripts for example in a repository or other site be
shared in alignment with our hosting policy not be added to or enhanced in any way to
appear more like or to substitute for the published journal article
Published journal article (JPA) A published journal article (PJA) is the definitive final record
of published research that appears or will appear in the journal and embodies all value-adding
publishing activities including peer review co-ordination copy-editing formatting (if relevant)
pagination and online enrichment
Policies for sharing publishing journal articles differ for subscription and gold open access
articles
Subscription Articles If you are an author please share a link to your article rather than the
full-text Millions of researchers have access to the formal publications on ScienceDirect and so
links will help your users to find access cite and use the best available version
Theses and dissertations which contain embedded PJAs as part of the formal submission can be
posted publicly by the awarding institution with DOI links back to the formal publications on
ScienceDirect
If you are affiliated with a library that subscribes to ScienceDirect you have additional private
sharing rights for others research accessed under that agreement This includes use for
classroom teaching and internal training at the institution (including use in course packs and
courseware programs) and inclusion of the article for grant funding purposes
Gold Open Access Articles May be shared according to the author-selected end-user license
and should contain a CrossMark logo the end user license and a DOI link to the formal
publication on ScienceDirect
Please refer to Elseviers posting policy for further information
18 For book authors the following clauses are applicable in addition to the above Authors
are permitted to place a brief summary of their work online only You are not allowed to
download and post the published electronic version of your chapter nor may you scan the
printed edition to create an electronic version Posting to a repository Authors are permitted to
post a summary of their chapter only in their institutions repository
19 ThesisDissertation If your license is for use in a thesisdissertation your thesis may be
submitted to your institution in either print or electronic form Should your thesis be published
commercially please reapply for permission These requirements include permission for the
Library and Archives of Canada to supply single copies on demand of the complete thesis and
include permission for ProquestUMI to supply single copies on demand of the complete
thesis Should your thesis be published commercially please reapply for permission Theses and
dissertations which contain embedded PJAs as part of the formal submission can be posted
publicly by the awarding institution with DOI links back to the formal publications on
ScienceDirect
Elsevier Open Access Terms and Conditions
You can publish open access with Elsevier in hundreds of open access journals or in nearly 2000
established subscription journals that support open access publishing Permitted third party re-
use of these open access articles is defined by the authors choice of Creative Commons user
131
license See our open access license policy for more information
Terms amp Conditions applicable to all Open Access articles published with Elsevier Any reuse of the article must not represent the author as endorsing the adaptation of the article
nor should the article be modified in such a way as to damage the authors honour or reputation
If any changes have been made such changes must be clearly indicated
The author(s) must be appropriately credited and we ask that you include the end user license
and a DOI link to the formal publication on ScienceDirect
If any part of the material to be used (for example figures) has appeared in our publication with
credit or acknowledgement to another source it is the responsibility of the user to ensure their
reuse complies with the terms and conditions determined by the rights holder
Additional Terms amp Conditions applicable to each Creative Commons user license CC BY The CC-BY license allows users to copy to create extracts abstracts and new works
from the Article to alter and revise the Article and to make commercial use of the Article
(including reuse andor resale of the Article by commercial entities) provided the user gives
appropriate credit (with a link to the formal publication through the relevant DOI) provides a
link to the license indicates if changes were made and the licensor is not represented as
endorsing the use made of the work The full details of the license are available
at httpcreativecommonsorglicensesby40
CC BY NC SA The CC BY-NC-SA license allows users to copy to create extracts abstracts
and new works from the Article to alter and revise the Article provided this is not done for
commercial purposes and that the user gives appropriate credit (with a link to the formal
publication through the relevant DOI) provides a link to the license indicates if changes were
made and the licensor is not represented as endorsing the use made of the work Further any
new works must be made available on the same conditions The full details of the license are
available at httpcreativecommonsorglicensesby-nc-sa40
CC BY NC ND The CC BY-NC-ND license allows users to copy and distribute the Article
provided this is not done for commercial purposes and further does not permit distribution of the
Article if it is changed or edited in any way and provided the user gives appropriate credit (with
a link to the formal publication through the relevant DOI) provides a link to the license and
that the licensor is not represented as endorsing the use made of the work The full details of the
license are available at httpcreativecommonsorglicensesby-nc-nd40 Any commercial
reuse of Open Access articles published with a CC BY NC SA or CC BY NC ND license
requires permission from Elsevier and will be subject to a fee
Commercial reuse includes
Associating advertising with the full text of the Article
Charging fees for document delivery or access
Article aggregation
Systematic distribution via e-mail lists or share buttons
Posting or linking by commercial companies for use by customers of those companies
20 Other Conditions
v18
Questions customercarecopyrightcom or +1-855-239-3415 (toll free in the US) or +1-978-
646-2777
132
For chapter 4
Title Porous Carbon Nanofibers from Electrospun Biomass TarPolyacrylonitrileSilver
Hybrids as Antimicrobial Materials
Author Kunlin Song Qinglin Wu Zhen Zhang et al
Publication
Applied Materials
Publisher American Chemical Society
Date Jul 1 2015
Copyright copy 2015 American Chemical Society
PERMISSIONLICENSE IS GRANTED FOR YOUR ORDER AT NO CHARGE
This type of permissionlicense instead of the standard Terms amp Conditions is sent to you
because no fee is being charged for your order Please note the following
Permission is granted for your request in both print and electronic formats and
translations
If figures andor tables were requested they may be adapted or used in part
Please print this page for your records and send a copy of it to your publishergraduate
school
Appropriate credit for the requested material should be given as follows Reprinted
(adapted) with permission from (COMPLETE REFERENCE CITATION) Copyright
(YEAR) American Chemical Society Insert appropriate information in place of the
capitalized words
One-time permission is granted only for the use specified in your request No additional
uses are granted (such as derivative works or other editions) For any other uses please
submit a new request
133
VITA
Kunlin Song was born in Sichuan Province China He obtained the BS in Wood Science
and Engineering from Beijing Forestry University Beijing China in 2009 He got his MS Wood
Science and Technology from Chinese Academy of Forestry Beijing China with Dr Yafang Yin
as advisor in 2012 where he studied wood cell wall polymers (cellulose lignin and
hemicellulose) Since 2012 he has studied in School of Renewable Natural Resources at
Louisiana State University as a PhD candidate with Dr Qinglin Wu as advisor His research
focuses the preparation characterization and application of electrospun nanofibers and
composites He anticipates graduating with his PhD degree in August 2016
- Louisiana State University
- LSU Digital Commons
-
- 2016
-
- Application of Biomass Derived Materials in Nanocomposites and Drilling Fluids
-
- Kunlin Song
-
- Recommended Citation
-
- tmp1483830367pdfWnHMi
-