recent economic dvlp_sro_wa2012(1)
TRANSCRIPT

The year 2012 was characterized by an extremely uncertain global and subregional economicclimate, and a volatile political setting in West Africa. This raises the challenges for the calibration of a policy advice given the changing economic circumstances in the worldeconomy and their ever-shifting implications for West Africa. During the same year, andjust before the advent of military events in Mali and Guinea-Bissau, the West Africanregion was poised for economic consolidation. The speed with which the political falloutin those latter two countries is resolved will determine the depth of socio-economic progressin 2012 and beyond.
West Africa must diversify to address its economic vulnerabilities. Thus, to inoculate itselffrom trade shocks, the subregion must diversify the origins and destinations of its tradedgoods; and furthermore preserve possession of good governance that demands an ever acutevigilance. The global output growth slowed down in 2011 and recent forecasts for 2012 and2013 show anemic growth for different regions of the world due to the continuing economicfallout in the Euro zone. Given the interdependence of trade, financial and resource flow,the developing countries have not been immune from developed countries’ economic crisis,dimming the growth prospects for 2012 and beyond.
Concerning policy harmonization, some progress has been recorded. Mainly, some achie-vements are noted about women empowerment and gender equality, with several ECOWAScountries achieving some 20-30 per cent or more participation of women in parliament. Despite these strides, the African Union target of 50 per cent parliamentary representationby women is still out of sight.
The ECA sub regional office for West Africa (SRO-WA), based in Niamey (Niger),covers 15 countries, all member States of the ECOWAS. These member States servedby the SRO-WA are: Benin, Burkina Faso, Cape Verde, Côte d’Ivoire, the Gambia, Ghana,Guinea, Guinea Bissau, Liberia, Mali, Niger, Nigeria, Senegal, Sierra Leone and Togo.
The ECA/SRO-WA enables the Commission to translate its normative and analytical workinto operational activities at Sub Regional Office for West Africa level. The Office acti -vities are directed towards strengthening cooperation and sub-regional integration withinthe framework of NEPAD and internationally-agreed goals, including those set out in theMillennium Declaration. In addition, ECA/SRO-WA coordinates the position of membersStates on a broad spectrum of socio-economic development issues.
The Office also works in close partnership with Regional Economic Communities (RECs),particularly, the Economic Community of West African States (ECOWAS) and UEMOA(West African Economic and Monetary Union) as well as sectoral intergovernmental bodies,the private sector and civil society organizations.
ISBN: demande en cours-:HSMJPD=VVVVV]:
Recent_economic_dvlp_couverture:Uneca 07/02/2013 11:27 Page 1

COMMISSION ÉCONOMIQUEDES NATIONS UNIES POUR L’AFRIQUE
UNITED NATIONS ECONOMIC COMMISSIONFOR AFRICA
RECENT ECONOMIC AND SOCIAL DEVELOPMENTS
IN WEST AFRICA AND PROSPECTS FOR 2012
ECA-WA/ICE.15/2012/02
Original: ENGLISH
Recent_economic_dvlp_interieur:Bal 06/02/2013 15:38 Page 1

Layout: JePublie - www.jepublie.com
© United Nations Economic Commission For Africa, 2013
Recent_economic_dvlp_interieur:Bal 06/02/2013 15:38 Page 2

3
TABLE OF CONTENTS
ACRONYMS AND ABBREVIATIONS......................................................9
PREFACE ..............................................................................................11
EXECUTIVE SUMMARY ......................................................................13
1: INTRODUCTION ............................................................................17
2: GLOBAL ECONOMIC DEVELOPMENTS IN 2011 AND IMPLICATIONS FOR WEST AFRICA ..........................................19
2.1 Global Economy in 2011 and Prospect for 2012 ....................192.2 Commodity Prices and Prospects for 2012 ..............................232.3 Implications of Global Economic Trends on West AfricanEconomy ..........................................................................................32
3: ECONOMIC DEVELOPMENTS IN WEST AFRICA IN 2011............373.1 Economic Growth Performance in West Africa......................373.2 Sectoral Decomposition of Growth ........................................403.3 Performance of Key Macroeconomic Aggregates ..................42
4: SOCIAL DEVELOPMENTS IN WEST AFRICA IN 2011 ..................554.1 Population Structure and Growth ..........................................554.2 Poverty and Income Distribution ............................................574.3 Health and Education ..............................................................584.4 Gender ........................................................................................64
5: ECONOMIC AND SOCIAL PROSPECTS FOR 2012 AND 2013 IN WEST AFRICA ................................................................................67
6: CONCLUSION AND RECOMMENDATIONS ................................71
REFERENCES ......................................................................................77
APPENDIXES ......................................................................................79
Recent_economic_dvlp_interieur:Bal 06/02/2013 15:38 Page 3

Recent_economic_dvlp_interieur:Bal 06/02/2013 15:38 Page 4

5
LIST OF TABLES
1: The Global Real GDP Outlook in Summary (Percentage change) ..........................................................................20
2: Key nominal price indices (Actual and forecasts, 2000=100) ....24
3: The Global Outlook in Summary (Percentage change from previous year, except interest rates and oil policy) ..........................33
4: Real GDP Growth Rates of ECOWAS member States (Percent change) ................................................................................38
5: Composition of GDP Growth by Source of Demand................39
6: Component of GDP growth by Supply Sources ........................41
7: Trends of the Ratio of Currency outside Banks to Broad Money Supply (2002-2011) ..............................................................46
8: ECOWAS member States Consumer Prices, 2004-2011............48
9: Number of Countries that met the Convergence Criteria in ECOWAS........................................................................................53
10: Population Dynamics ..................................................................56
11: Poverty and Income Distribution in West Africa ......................58
12: Education Efficiency in West Africa ..........................................60
13: Health Indicators in West Africa, 2011 ......................................61
14: Access to Basic Utilities(health services ) ..................................62
15: Access to Basic Utilities (water) ..................................................63
16: Gender Issues in West Africa ......................................................65
Recent_economic_dvlp_interieur:Bal 06/02/2013 15:38 Page 5

6
RECENT ECONOMIC AND SOCIAL DEVELOPMENTS IN WEST AFRICA AND PROSPECTS FOR 2012
LIST OF BOXES
1: Sierra Leone: Economic Impact of Tonkolili Iron Ore Project,2012-2014 ............................................................................................29
2: West Africa: Prospects for Oil and Gas ........................................35
3: Convergence Criteria for the Economies of West Africa ............54
Recent_economic_dvlp_interieur:Bal 06/02/2013 15:38 Page 6

RECENT ECONOMIC AND SOCIAL DEVELOPMENTS IN WEST AFRICA AND PROSPECTS FOR 2012
7
LIST OF FIGURES
1: Trends in Prices of Major Cereals ................................................23
2: Trends in Commodities Prices (US dollar)..................................24
3: Trends in Prices of Mineral Resources (US dollar) ....................25
4: Real GDP growth rates and Projections as of January 2012......37
5: Gross Domestic Product per capita Growth in ECOWAS,Annual Growth (%)............................................................................40
6: Growth in West Africa, Oil Exporting Vs Oil ImportingCountries (%) ......................................................................................40
7: Shows The Relative Dependence Of West African States OnNatural Resource Rents......................................................................42
8: ECOWAS member States: Overall Fiscal Balance, 2008-2011(Percent of GDP) ..............................................................43
9: ECOWAS Member States: Government Debt (Percent of GDP) ..44
10: Composition of exports, 2009 (%) ..............................................49
11: Terms of Trade of Goods (2008-2011)........................................49
12: Domestic Investment in Selected ECOWAS countries (As ratio of GDP) ..............................................................................50
13: Gross National Savings-Total Investment Gap, 2008-2011 ....51
14: ECOWAS member States: Current Account Balance (2008-2011)(Percent of GDP) ..........................................................52
15: Labor Force Participation rate in West Africa............................57
16: Education in West Africa: Adult Literacy Rate (%) ................59
17: Vulnerability of West African countries to Food and Fuel PriceShocks, 2009 ........................................................................................69
Recent_economic_dvlp_interieur:Bal 06/02/2013 15:38 Page 7

Recent_economic_dvlp_interieur:Bal 06/02/2013 15:38 Page 8

9
ACRONYMS AND ABBREVIATIONS
AfDB African Development Bank AGOA African Growth and Opportunity ActAIDS Acquired Immunodeficiency SyndromeCET Common External TariffECA Economic Commission for AfricaECOWAS Economic Community of West African StatesEIU Economic Intelligence UnitEPA Economic Partnership AgreementEU European UnionFDI Foreign Direct InvestmentGDP Gross Domestic ProductHIV Human Immunodeficiency VirusIMF International Monetary FundMDG Millennium Development GoalODA Official Development AssistanceOECD Organisation for Economic Co-operation
and DevelopmentPRSP Poverty Reduction Strategy PaperSSA Sub-Saharan AfricaUEMOA West African Economic and Monetary UnionUNCTAD United Nations Commission for Trade
and DevelopmentUNDP United Nations Development ProgrammeWAMA West African Monetary AgencyWAMZ West African Monetary ZoneWEO World Economic OutlookWTO World Trade Organization
Recent_economic_dvlp_interieur:Bal 06/02/2013 15:38 Page 9

Recent_economic_dvlp_interieur:Bal 06/02/2013 15:38 Page 10

PREFACE
The present report on the Economic and Social Conditions inWest Africa for 2011 is a regular document presented to provide:(i) member States with an overview of the economic and socialconditions in West Africa and prospects for 2012; and (ii) policy adviceon selected policy issues in the sub-region.
This year’s report was compiled against the backdrop of an extremelyuncertain global and subregional economic climate, and a volatilepolitical setting in West Africa. As the report argues, the volatile globaleconomic environment poses challenges for the calibration of a policyadvice given the changing economic circumstances in the world economyand their ever-shifting implications for West Africa. Before the advent ofrecent military events in Mali and Guinea-Bissau, the West Africanregion was poised for economic consolidation. This rosy scenario is nowunder threat, and the speed with which the political fallout in thetwo countries is resolved will determine the depth of socio-economicprogress in 2012 and beyond.
Notwithstanding these ongoing events, the key message of this reportremains salient: West Africa must diversify to address its economicvulnerabilities. In particular, the subregion must grasp the opportunitycreated by elevated commodity prices to increase the number of sourcesof growth by promoting the manufacturing sector through value additionto its primary commodities. This will address the high unemploymentlevels, especially among the youth. Second, the subregion must inoculateitself from trade shocks by diversifying the origins and destinations of itstraded goods. Indeed, the developed countries’ economic woes havebrought into sharp focus the folly of over-concentrated trade. The finalpoint on diversification is the need to increase the sources of finance,including through vibrant domestic and regional resource mobilization
11
Recent_economic_dvlp_interieur:Bal 06/02/2013 15:38 Page 11

efforts. Underpinning these diversification efforts is the need to jealouslyprotect the political and economic governance gains of recent years.Good governance is a delicate possession that demands an ever acutevigilance.
This report was prepared by the ECA Sub-Regional Office for WestAfrica (ECA/SRO-WA), under the guidance of the Officer in Charge,Mr. Aboubacry Demba LOM.
I would like to thank the project leader, Mr. Mzwanele G. Mfunwawho received the support of the consultant, Professor Adeola Adenikinjuof the University of Ibadan, Nigeria ; besides invaluable suggestions weremade by other team members: Mr. Oliver P. Maponga, Mr. Joseph Foumbi,Mrs. Selamawit Abebe, and colleagues from the ECA Headquarters.The team had also benefited of special advice from Mr. Emile Ahohe,during his short mission at the ECA/SRO-WA.
The report was edited and formatted by Mrs. Dana Palade,Mrs. Kadijiatou Amadou and Mr. Privat Denis Akochayé.
An abridged version of the report served as a background documentto the 2012 meeting of the Intergovernmental Committee of Expertsthat took place in Bamako, Mali, from 15 to 16 March 2012. While it ispossible that they may not necessarily share some of the issues raised inthe document, we wish to acknowledge the delegates’ inputs in shapingthe key message of this report.
MR. ABOUBACRY D. LOM
Officer-In-Charge UNECA Sub-Regional Office for West Africa.
RECENT ECONOMIC AND SOCIAL DEVELOPMENTS IN WEST AFRICA AND PROSPECTS FOR 2012
Recent_economic_dvlp_interieur:Bal 06/02/2013 15:38 Page 12

13
EXECUTIVE SUMMARY
Global output growth slowed down in 2011, and recent forecastsfor 2012 and 2013 show anemic growth for different regions of the worlddue to the continuing economic fallout in the Euro zone. Weak economicgrowth, high unemployment rate, and loss of business and consumerconfidence are all serving to arrest the growth of aggregate demand, andhence diminish the import appetite from developing countries. Due totrade, financial and resource flow interdependence the developingcountries have not been immune from developed countries’ economiccrisis, dimming the growth prospects for 2012 and beyond.
The Economic Community of West African States (ECOWAS) grewby 6½ per cent in 2011 with member States, bar Côte d’Ivoire, registeringpositive growth rates. This growth was driven by performance in theprimary and tertiary sectors. Performance in the primary sector waspartly due mainly to favorable weather, a growing demand for exportcommodities in the international markets, and oil production. Thebuoyancy in the tertiary sector stemmed from the recovery in tourism,telecommunications, financial services, and commerce. The increasingdemocratic settlement and social stability have also increased privatesector confidence to invest in the countries and therefore contributed tothe growth. However, the now resolved electoral impasse in Côte d’Ivoireundermined the region’s economic performance in 2011, and the recentmilitary upheavals in Mali and Guinea-Bissau will undercut economicactivity in 2012.
The detailed analysis of the macroeconomic conditions in variousWest African countries shows mixed prospects for 2012. In fact, thesubregional growth rate was projected to be sustained at above 6 percent before the Mali and Guinea turmoil, as well as the deepeningdrought and the concomitant humanitarian disaster in the Sahel region.
Looking ahead, the economic prospects for ECOWAS countries willdepend on a combination of external and internal developments.
Recent_economic_dvlp_interieur:Bal 06/02/2013 15:38 Page 13

Fundamentally however, in 2012 and onwards West Africa must starttaking specific steps to address its numerous economic vulnerabilities,including to climate change and constant political governance setbacks.Externally, continuous weaknesses in developed economies will impactnegatively on certain commodity prices, as well as on capital flows to theECOWAS countries. The narrow composition of exports from WestAfrica implies that the subregion’s economic fortunes get instantlyaffected by the price swings of such exports. At the same time,fluctuations in development assistance and other financial flows are aptto have a magnified effect on the fiscal performance of the subregion’scountries due to these flows’ large share in the national budgets.
In ECOWAS, the average annual inflation rate nudged up from 10per cent in 2010 to 10⅓ per cent in 2011, sparked by surging costs of food,accommodation, energy, and transportation. Transport costs soared inline with readjustment of ex-pump fuel prices as crude oil prices startedescalating again on the international market. With respect to publicfinance, ECOWAS countries recorded an overall fiscal deficit of 3¾ percent of GDP in 2011, down from a deficit of 5¼ per cent of GDP in 2010.Although this is an improvement it still reflects an impaired fiscalsituation for a subregion where average fiscal deficits of less than 3 percent are the norm. This higher than normal fiscal deficit for thesubregion stemmed from counter-cyclical policies seeking to preservesocial spending to avert a deterioration in citizens’ living standards, andto maintain or increase capital spending on infrastructure in the face ofstagnant revenue growth.
The subregion continued to make progress towards strengtheningregional integration. The countries have to adhere to a set of convergencecriteria that will allow them to deepen their economic integration.However, in 2011, there was a general slowdown towards meeting someof these requirements, especially with the resurgence of budgetaryimbalances. This deterioration was also observed in respect of realinterest rates. However, there was a slight improvement in the centralbank financing of fiscal deficits and accumulation of domestic arrears.
Concerning policy harmonization, some progress has been recorded.In the energy sector, for example, several policies and institutions havebeen adopted and established to promote subregional cooperation. Policyharmonization in the mineral sector was strengthened with the adoptionof the ECOWAS Mineral Development Policy during 2011. However,there is need to expand the level of development and interconnectionsof payments systems, capital account liberalization, and total adoption
14
RECENT ECONOMIC AND SOCIAL DEVELOPMENTS IN WEST AFRICA AND PROSPECTS FOR 2012
Recent_economic_dvlp_interieur:Bal 06/02/2013 15:38 Page 14

of the ECOWAS common external tariff, the harmonization of statistics,transit trade facilitation, as well as the removal of all barriers to the freemovement of persons, capital and goods within the community.
The West African subregion has registered mixed progress on socialdevelopment indicators even against rapid economic growth. The keyMDG of reducing extremely poverty remains elusive for many countries,and has not been helped by the economic growth that is driven by labor-saving sectors such as high-tech extractive industries and telephony.Even the proportion of working people living on less than $US1.25 a dayhas increased between 2009 and 2010. Some countries have madeimportant progress on health and education fronts with a surge in schoolenrolments, even if quality has been questionable, and the under-5mortality having fallen. Similarly, the battle against the HIV/AIDS isprogressing with new HIV infections falling, and the roll-out of neededdrugs gaining momentum. Finally, some achievements are notedconcerning women empowerment and gender equality, with severalECOWAS countries achieving some 20-30 per cent or more participationof women in parliament. Despite these strides, the African Union targetof 50 per cent parliamentary representation by women is still out of sight.
The key message resonating through this report’s analysis is that thesubregion must work to avoid limiting itself to a narrow range ofeconomic options in such areas as sources of growth, trading partnerships,and sources of revenue. Specifically, three areas must receive attention.
First, economic growth in the subregion hinges critically on two maindevelopments: weather conditions and their impact on agriculture, andchanges in international prices for primary commodities originatingfrom the subregion. Reducing reliance on these developments will entailinvesting more in the agricultural sector, including mechanization,irrigation, and creating agricultural value chains. It will also entailpromoting other sectors, primarily ushering in the right environment forthe private sector to invest so as to increase the contribution of themanufacturing sector in economic growth through value addition. Itwill also be this sector that will lead to diversified export composition andthe creation of sustainable jobs. Prospects for value addition in specificminerals and agricultural commodities should also be part of thesubregional strategy to create sustainable jobs and reduce poverty.
Second, the ECOWAS member States must seek ways to diversifytrading partners in order to reduce their vulnerability to shocksoriginating from specific regions. The developed countries’ economicwoes since 2008 have brought urgency to this long recognized economic
RECENT ECONOMIC AND SOCIAL DEVELOPMENTS IN WEST AFRICA AND PROSPECTS FOR 2012
15
Recent_economic_dvlp_interieur:Bal 06/02/2013 15:38 Page 15

imperative. The emergence of so-called BRICS (made up of Brazil,Russia, India, China, and South Africa) and other fast developing nationsoffer an opportunity for West Africa to diversify trade away from“traditional” trade partners in the West. Moreover, the sources for long-term loans can similarly be diversified, and indications to this effect areemerging. Such strengthened South-South cooperation will alsofacilitate a transfer of appropriate technology, thus easing the burden ofadjustments.
Finally, fiscal revenues in the subregion have a narrow source: taxrevenues from few tax-paying entities, mostly a few large multinationaland local companies. The bulk of revenues, ranging from 50 per cent toas high as 70 per cent for some member States, is made up of grants orsome other donor flows. Clearly, there is need to diversify into moresustainable revenue sources. The merits of doing more on domestic andregional resource mobilization have become obvious. The importance ofthe diaspora remittances in countries such as Mali and Senegal has beennoted, and these need more attention, and their use should be for long-term growth and development of member States rather than forcurrent consumption only. Policy harmonization should also facilitatethe marshaling of regional resources via increased stock exchangecollaboration and other means.
The report will unpack these messages in its analysis and providerecommendations that, on the whole, can concretely bring the long-desired development to West Africa.
RECENT ECONOMIC AND SOCIAL DEVELOPMENTS IN WEST AFRICA AND PROSPECTS FOR 2012
Recent_economic_dvlp_interieur:Bal 06/02/2013 15:38 Page 16

17
CHAPTER 1: INTRODUCTION
1. Against the backdrop of heightened global economic uncertainty,and the subregional political fallout in some ECOWAS member States,this report seeks to take stock of economic and social performance of WestAfrica in 2011. The aim is to unearth key lessons from this performancewith a view of constructing an appropriate policy advice. The overallobjective is to contribute to the ongoing efforts of propelling forwardthe socio-economic development of the subregion.
2. In pursuit of the above objective, the report is divided into sixchapters. After the current introductory chapter, chapter 2 on economicdevelopments takes a parenthetical look at the economic developmentsin other parts of the world, focusing on the aspects that have relevancefor West Africa’s economic prospects. Given that West Africa is aneconomic bloc highly depended on primary commodities, this chapteralso traces the price trends of key mineral and agricultural products, andhow these changes impacted and will impact the subregion.
3. Chapter 3 of the report is devoted to the economic development inWest Africa. The chapter reviews the macroeconomic conditions thatprevailed in 2011, and how these were influenced by both external andinternal developments. The chapter also analyzes how the swings incommodity prices affected macroeconomic indicators, including inflation.The economic relationship of West Africa with the rest of the world mattersenormously. Therefore, the chapter looks at some of the key accountsof the balance of payments such as the trade and current accounts.
4. The developments in the social conditions in West Africa arediscussed in chapter 4 of the report, with special emphasis on progresstowards the Millennium Development Goals (MDGs). The chaptertakes a multi-year analytical approach in its assessment when the
Recent_economic_dvlp_interieur:Bal 06/02/2013 15:38 Page 17

RECENT ECONOMIC AND SOCIAL DEVELOPMENTS IN WEST AFRICA AND PROSPECTS FOR 2012
changes in some indicators are invisible year on year. The aim is toexpound on the needed policy adjustments to overcome hurdles wherethere is regress, or to encourage acceleration where progress is impaired.
5. Chapter 5 of the report makes a prognosis of what 2012 has instore for West Africa, on the basis of past performance and the use ofupdated projections here and abroad. Needless to say, such a forecast canonly be tentative in view of fast evolving economic and political eventsin the subregion and in key economic markets for West Africa’ products.
6. Lastly, chapter 6 makes recommendations, some of which areapplicable in the short term while others seek to re-iterate and underscoremember States’ own commitments to promote long-term socio-economicdevelopment of the subregion. These recommendations are consistentwith the key message of the report about the need for diversificationto insulate West Africa from the severe impacts of economic shocks andput the subregion on a sustainable development path.
Recent_economic_dvlp_interieur:Bal 06/02/2013 15:38 Page 18

CHAPTER 2: GLOBAL ECONOMICDEVELOPMENTS IN 2011
AND IMPLICATIONS FOR WEST AFRICA
■ 2.1 Global Economy in 2011 and Prospect for 2012
7. The expected strong recovery from the 2008 global economic crisishas proved to be long and unsteady. After three years (2009-2011) offragile and uneven economic recovery, the immediate outlook of theglobal economy remains cloudy. A mild recession in the Euro zonecountries in 2012 is foreseen, following the flare up of the sovereign debtcrisis, a general loss of confidence, the effects of bank deleveraging on thereal economy, and the impact of the fiscal consolidation in response tomarket pressures (IMF 2012e). The global economy had expanded by 5⅓per cent in 2010 and slowed to 4 per cent in 2011 (Table 1).
8. In individual countries, after contracting in 2009 and a rebound in2010, the US economy is poised to grow at a slower pace of 2 per cent in2012, held back by the torpid growth in private consumption and jobcreation, as well as the combination of high oil prices and depressedincomes. After contracting by 4⅓ per cent in 2009, the EU area economyrebounded amidst unsettled conditions in 2010 and 2011. In fact, thelingering fiscal un-sustainability and high unemployment issues are setto drag the Euro economy back into a recession in 2012, led by economiccontraction in several Euro area countries (for example, Italy, Spain,Greece, Netherlands, and Portugal). Other big European economies(Germany and France) will barely grow at about ½ per cent each onaverage (UNDESA, 2012). The rebound of Japan from the March 2011earthquake will average 2 per cent on account of reconstruction after aneconomic contraction in 2011 (Table 1).
19
Recent_economic_dvlp_interieur:Bal 06/02/2013 15:38 Page 19

9. The fiscal austerity programmes that contributed to the sluggishgrowth in developed countries were triggered by fiscal and debtunsustainability in several countries in the zone. Despite a concertedeffort by EU member States, and international and European regionalfinancial institutions to avert a fiscal meltdown, the sovereign debt stressin the Euro zone continued into 2012. In the US, fiscal policy outlookalso remains bleak, even if recent data (particularly on employment)show some economic pick-up. Still the US is steeped in debt, and thedebt to GDP ratio is estimated to have reached 94½ per cent in 2011, andis projected to exceed 100 per cent by 2013. Unless developed countriesheed the warning against abrupt fiscal austerity measures, globalprosperity will remain in abeyance a while longer.
10. As Table 1 further shows, some of the key emerging anddeveloping countries are expected to remain somewhat resilient,although they are not totally immune to the developed countries’economic maladies. The economic malaise in developed countries isaffecting the emerging and developing countries via trade and financialchannels, thus arresting the pace of their growth. Huge emergingeconomies, including the BRICS countries (in particular, China andIndia), are expected to play a key role in saving the world economy fromfalling into a recession. Even if China’s economic growth slowed in 2011its appetite for mineral commodities, it is expected to remain voraciousas the real estate market picks up speed in 2012 and beyond (EIU, 2012).It is also important that the country has scope for countervailing fiscalresponse to keep the economy growing, even if economic woes in the EUaffect China’s exports (IMF, 2012b).
Notes: e = estimate, f = forecast
Table 1: The Global Real GDP Outlook in Summary (Percentage change)Source: IMF, 2012e; ECOWAS, 2011
20
RECENT ECONOMIC AND SOCIAL DEVELOPMENTS IN WEST AFRICA AND PROSPECTS FOR 2012
2008 2009 2010 2011e 2012f 2013fWorld 2.8 -0.6 5.3 3.9 3.5 4.1Euro Area 0.4 -4.3 1.9 1.4 -0.3 0.9Japan -1.1 -5.5 4.4 -0.7 2.0 1.7United States -0.3 -3.5 3.0 1.7 2.1 2.4China 9.6 9.2 10.4 9.2 8.2 8.8India 6.2 6.6 10.6 7.2 6.9 7.3Brazil 5.2 -0.3 7.5 2.7 3.0 4.1Russia 5.2 -7.8 4.3 4.3 4.0 3.9Africa 5.6 2.5 4.5 5.6 5.3 5.6Sub-Saharan Africa 5.6 2.8 5.3 5.1 5.4 5.3
Recent_economic_dvlp_interieur:Bal 06/02/2013 15:38 Page 20

11. The economies of two other BRICS members, India and Brazil,have cooled but remain sound. India’s economy decelerated in 2011 butis expected to grow apace if the country succeeds in its search for newexport markets and its slow internal policy-making processes improve.How fast the economy grows will also depend on how tight monetarypolicy becomes to rein in inflation which, at about 7 per cent, hasreignited concerns about creeping price instability. Brazil suffered anotable slowdown in 2011 from 7½ per cent in 2010. The recentloosening of monetary and fiscal policies against the backdrop of abatinginflation should propel economic growth to higher levels than currentforecasts show even if exports markets remain flaccid (EIU, 2012).
12. The African economies were buffeted by a number of internaland external shocks, stalled global economic growth, regional militaryconflicts, droughts, and floods. According to the ECOWAS database(ECOWAS, 2011), the continent’s GDP still grew above 5 per cent in2011, up from 4½ per cent in 2010, with a further growth of 5⅓ per centexpected in 2012. These rates masked vast disparities among subregionsand countries. After being hit by the Arab Spring in 2011, North Africais expected to rebound in 2012 as oil production resumes. SouthernAfrica’s growth will be led by the oil-rich Angola. Since mid-July 2011,a severe drought affected the East African region, leading to foodshortages in many parts, and an upsurge in the number of refugeesseeking sustenance elsewhere in the subregion. Overall, the continent’seconomic prospects will be determined by a number of factors such as:the increase in global food and fuel prices, economic fortunes indeveloped nations and the BRICS, the drought situation, theconsolidation of political stability in North Africa, the speed with whichWest Africa resolves the spate of recent military conflicts, and the extentof flood damage to agricultural production in some Central Africancountries (UNDESA, 2012).
13. World trade has also been affected by the ongoing depression inglobal economic activity. The growth of world trade decelerated from12½ per cent in 2010 to 6½ per cent in 2011. Current forecasts showthat this rate will decrease further to 4¾ per cent in 2012 before risingto 6¾ per cent in 2013 with the emerging markets at the centre of thisbrisk trade (World Bank, 2011a). The US trade deficit stood at 4¾ percent of GDP in 2011, and is expected to remain at about the same levelin 2012 (EIU, 2012). On account of economic uncertainty and impaired
21
RECENT ECONOMIC AND SOCIAL DEVELOPMENTS IN WEST AFRICA AND PROSPECTS FOR 2012
Recent_economic_dvlp_interieur:Bal 06/02/2013 15:38 Page 21

balance sheets, US households remain cautious in their spending, acaution that could narrow the trade deficit in 2013. The current accountof the Euro area, as a whole, will be near-balanced in 2011 and 2012, withdiverse records within the area (IMF, 2011f).
14. Current account balances in emerging and developing countriesworsened in 2011 and are expected to weaken even more in 2012 duepartly to the high growth of imports fuelled by the fiscal stimuli, and highfood and oil prices. There are, however, some exceptions. For instance,China recorded a current account surplus of 5½ per cent of GDP in2011. This surplus is expected to widen to 6 per cent in 2012, althoughits size will continue to be lower than the double-digit levels recordedbefore the economic and financial strains (IMF, 2011c).
15. The intractable unemployment problem remains a majorconstraint to economic activities in both developed and developingcountries. The unemployment rate averaged 8½ per cent in developedcountries in 2011, well above the pre-crisis level of 5¾ per cent registeredin 2007 (UNDESA, 2011). Among developing countries, while someregions have made much progress in reducing unemployment belowthe pre-crisis level, problems of open unemployment (especially youthunemployment) and underemployment remain acute in a number ofAfrican and Western Asian countries (UNDESA, ibid). Overall, globaljob shortfall is expected to increase from 64 million in 2011 to 71 millionin 2012, partly as a result of the poor economic recovery in developedcountries. Employment rates are not expected to attain their pre-crisislevel until well after 2015 (UNDESA, ibid).
16. Worldwide inflationary pressures intensified during 2011, andwere sparked by three main factors: adverse supply shocks pushed byfood and oil prices, strong demand growth in large developing countriesas a result of rising incomes, and reflationary monetary problems inmajor developed countries. However, inflationary pressures are not aserious problem in the developed countries where they are expected toremain moderate in 2012 and 2013, as a result of weak aggregate demandarising from high unemployment rate, low business and householdconfidence, and subdued wage pressures. International commodity pricesare also expected to modulate inflationary pressures in 2012 and 2013(UNDESA, 2011).
22
RECENT ECONOMIC AND SOCIAL DEVELOPMENTS IN WEST AFRICA AND PROSPECTS FOR 2012
Recent_economic_dvlp_interieur:Bal 06/02/2013 15:38 Page 22

17. The contagion effects of developments in the OECD (Organisationfor Economic Co-operation and Development) countries will continueto be felt in most developing countries through several channels. Capitalflows to developing countries have weakened sharply as investorswithdrew substantial sums from developing country markets in thesecond half of 2011. Overall gross capital flows declined from $US309billion in second half of 2010 to $US170 billion in same period of 2011.European imports also declined by an annualized 17 per cent in 2011.Developing country exports declined at a 1⅓ per cent annualized pacein the third quarter of 2011, although the effect is highest in South Asia(World Bank, 2011a).
■ 2.2 Commodity Prices and Prospects for 2012
18. Most commodity prices remained relatively high in 2011, but areprojected to weaken in 2012 and 2013 as the global economy continuesto flounder. Agricultural prices began to rise sharply in mid-2010 due toadverse weather conditions and high energy prices, which divertedagricultural land to bio-fuel production. Overall, agricultural pricesincreased by 20 per cent between 2010 and 2011 (Figures 1 and 2).
19. Food prices in 2011 averaged 19 per cent above 2010 levels aswell, on the back of rising oil prices. Given the low stock levels foragricultural (especially food), prices will remain sensitive to adverseweather conditions and energy prices (Table 2).
Figure 1: Trends in Prices of Major CerealsSource: World Bank, 2011a
RECENT ECONOMIC AND SOCIAL DEVELOPMENTS IN WEST AFRICA AND PROSPECTS FOR 2012
23
Recent_economic_dvlp_interieur:Bal 06/02/2013 15:38 Page 23

24
Figure 2: Trends in Commodities Prices (US dollar)Source: World Bank, 2011a
20. Table 2 shows that energy prices rose sharply in 2011 following theloss of 1.3 million barrels per day of Libyan oil exports. Fears of furtherdisruptions in major oil producing countries also played a role. TheWorld Bank (2011a) projects that crude oil prices will be close to $US100per barrel in 2012 and 2013 (Figure 3).
21. Table 2 also shows that metals and minerals have fully recoupedall the price losses from 2009 due to strong demand and restocking inChina, and rising demand in India and Brazil. Even as the Chinesedemand growth slowed in 2010, stronger growth in the OECD countriesmore than offset the Chinese decline. By February 2011, prices of metalsexceeded their 2008 peak by 4 per cent, with tin and copper prices risingparticularly steeply due to supply constraints.
Note: e = estimate, f = forecast
Table 2: Key nominal price indices (Actual and forecasts, 2000=100) Source: World Bank, 2011a
RECENT ECONOMIC AND SOCIAL DEVELOPMENTS IN WEST AFRICA AND PROSPECTS FOR 2012
2005 2006 2007 2008 2009 2010 2011e 2012fEnergy 188 221 245 342 214 271 362 345Non Energy 149 190 233 275 209 267 321 284Agriculture 133 150 180 229 198 231 277 230Food 134 147 185 247 205 224 265 222Beverages 137 145 170 210 220 254 286 238Raw Materials 131 160 175 196 169 237 304 247Metals andMinerals
179 275 339 336 222 337 406 395
Fertilizers 163 169 240 567 293 280 349 283ManufacturingUnit Value (MUV)
110 112 117 125 118 121 127 123
Recent_economic_dvlp_interieur:Bal 06/02/2013 15:38 Page 24

25
RECENT ECONOMIC AND SOCIAL DEVELOPMENTS IN WEST AFRICA AND PROSPECTS FOR 2012
22. Other metals markets have been less supply-constrained, inparticular aluminium, where China is a net exporter. Prices are expectedto strengthen further in 2012 as demand recovers, notably from China,mainly for construction and infrastructure industry materials such ascopper, aluminium, and iron ore. Projected trends in the prices of gold,crude oil, and natural gas are shown in Figure 3.
Figure 3: Trends in Prices of Mineral Resources (US dollar)Source: World Bank, 2011a
23. The prices of commodity of critical importance to West Africahad different fluctuation patterns. Some of these are outlined in the nextfew paragraphs.
2.2.1 Crude oil
24. Oil production constitutes a critical export product for a numberof West African countries such Nigeria, Cape Verde, Côte d’Ivoire, andlately Ghana. According to the World Bank (2011), oil prices on averagewere $US104 per oil barrel in 2011 and will decline to an estimated$US98 per oil barrel in 2012 due to slowing global demand, growingsupply, efficiency improvements, and substitution away from oil. Thehigh oil prices and weakening economic growth impacted oil demandin 2011, with world consumption growth of just ⅔ of one per cent – a littlemore than one-quarter of the large jump in 2010. OECD oil demanddeclined for the fifth time in the past six years, and is on track to fall againin 2012. Non-OECD oil demand growth of 3 per cent was down fromits 2010 level. Looking ahead in 2012, world oil demand is projected torise by 3½ per cent, with all of the growth in emerging markets.
Recent_economic_dvlp_interieur:Bal 06/02/2013 15:38 Page 25

25. The oil price increase will be curtailed by increased production.Oil production in Libya is expected to fully recover by 2014, and Iraq’soil output is expected to reach nearly 3¼ million barrels per day in 2012.Non-OPEC countries are expected to continue to rise moderately theiroil supply, in part due to high prices, but also continued technologicaladvances that have brought new supplies from shale deposits anddeepwater offshore. Production increases are expected from a number ofareas, including Ghana in West Africa. Globally there are no resourceconstraints in the distant future (World Bank, 2011a).
2.2.2 Natural gas
26. Nigeria’s natural gas production is an important contributor of itsGDP. Natural gas prices have been falling steadily since mid-2011,mainly owing to abundant supply and growing inventories as a result ofunusually mild winter weather in the northern hemisphere (EIU, 2012).Prices were trading at close to $US2.25 per million thermal units in thefirst week of March 2011, and remained week through the first half of2012. Prices are expected to start to pick up in the second half of 2012assuming more normal winter weather conditions, and to continue torise into 2013, as a result of slower production growth and moves toexport gas, while still-high oil prices will shift consumption towardsnatural gas.
27. Looking ahead, the Economic Intelligence Unit (EIU, ibid) seesthe global demand for natural gas growing in 2012-2013 at an annualaverage rate of 5½ per cent as a result of efforts to reduce carbon dioxide(CO2) emissions and strong demand for liquefied natural gas (LNG) inthe developing world. In Africa, Nigeria, Algeria, and Angola have plansto boost production of LNG in 2012-2013.
2.2.3 Cotton
28. Cotton is a major export for a number of ECOWAS memberStates such as Benin, Mali, and Burkina Faso. During 2010-2011 cottonprices have been volatile largely due to speculation. After rising in April2011, prices fell steadily and stood at 96.7 US cents per pound at theend of 2011. Prices surged again in early 2012 when India announced its
26
RECENT ECONOMIC AND SOCIAL DEVELOPMENTS IN WEST AFRICA AND PROSPECTS FOR 2012
Recent_economic_dvlp_interieur:Bal 06/02/2013 15:38 Page 26

cotton export ban, but have since slipped back to stand at around 98 UScents per pound in mid-March. For the rest of 2012 the EIU (2012)expects cotton prices to remain between 90 and 100 US cents per pound,which on an annual average basis means that prices will be almost 37 percent below their previous year’s level.
29. Cotton consumption growth will be constrained by sluggish globaleconomic growth and the increasing use of substitute products such aspolyester when cotton prices surge. On the production side, the EIU(ibid) sees the world cotton production in 2011-2012 increase by 9½ percent year-on-year.
2.2.4 Cocoa
30. Cocoa constitutes a major export for Ghana and Côte d’Ivoire inWest Africa. After rising dramatically in the first two months of 2011,cocoa prices moderated to an average of 144 US cents per pound in July,as the political impasse in Côte d’Ivoire was being resolved. Theydeclined steadily thereafter to 94 US cents per pound in earlyJanuary 2012, underpinned by the prospect of another surplus in 2011-2012 and by the more general sell-off in commodity markets globally.Prices have risen since then to 110 US cents per pound in early 2012 inresponse to risks to West Africa’s cocoa production. The EIU (2012)expects prices to recover further in the second and third quarters of 2012underpinned by emerging tightness in the cocoa market. However, theywill remain well below the levels seen a year earlier, when they wereboosted by the political impasse. Overall, following an almost 5 per centdecline in 2011, the annual average price of cocoa is expected to fallby 17¼ per cent in 2012, and it would decline more sharply if anotherglobal recession were to occur (2012).
2.2.5 Natural rubber
31. Movements in the prices of natural rubber are important forLiberia. On an annual average basis, rubber prices rose by 27 per centin 2011, with spot prices averaging $US4,420 per ton, but they had beenfollowing a downward trend since the first quarter of 2011. Spot pricesfell particularly sharply after the earthquake and tsunami disaster in
RECENT ECONOMIC AND SOCIAL DEVELOPMENTS IN WEST AFRICA AND PROSPECTS FOR 2012
27
Recent_economic_dvlp_interieur:Bal 06/02/2013 15:38 Page 27

Japan in March 2011 – a decline that mirrored a more general fall incommodity prices, as investors became more risk averse. Prices werealso under pressure owing to general concerns about the crisis in theEuro zone and the poor outlook for the global economy. Later in 2011,prices were hit by the flooding in Thailand that disrupted automotiveproduction, while leaving rubber-producing areas largely unscathed.Global sufficiency will improve in 2012-2013 to an equivalent of 8½weeks’ consumption at the end of 2012, meaning that prices will remaintame for some time (EIU, 2012).
2.2.6 Gold
32. Gold is one of the major exports in Ghana, Liberia, Guinea-Conakry, Mali, Burkina Faso, and Senegal. After some volatility in thesecond half of 2011, gold prices approached $US1,790 per troy ounce inearly February 2012, and declined to around $US1,700 per troy ounce atthe end of February. There remains a substantial risk of another collapsein gold prices before 2013 (EIU, 2012). If the fears of a double-dip globalrecession in the Euro zone are realized, the investors could sell off theirgold positions to offset losses, suppressing prices. Conversely, should theglobal recovery gather pace more quickly than anticipated, investors maydecide that gold prices have peaked and seek to take profits to invest themelsewhere, triggering a collapse in prices (World Gold Council, 2012).
33. On the other hand, macroeconomic policies could help shore upthe gold price. With loose monetary policy expected to continue in mostmarkets during much of 2013, gold’s attractiveness as an inflation hedgeis likely to continue, and so demand for the year as a whole will remainpositive at 3¾ per cent. Investment demand in the form of bars andcoins was also being driven by China in 2011 with year-on-year growthof 43 per cent. This came despite Chinese investors taking part in thewider global sell off in the fourth quarter when Chinese demand fellby 2 per cent year on year. Developments in the American economy alsohave a significant impact on the trend in the gold price.
34. Total gold supply is estimated to have contracted by close to 6per cent in 2011. While mine output and scrap sales were little changedfrom the 2010 levels, persistent net buying by central banks reducedoverall supply of the metal (World Bureau of Metal Statistics, 2012).
28
RECENT ECONOMIC AND SOCIAL DEVELOPMENTS IN WEST AFRICA AND PROSPECTS FOR 2012
Recent_economic_dvlp_interieur:Bal 06/02/2013 15:38 Page 28

RECENT ECONOMIC AND SOCIAL DEVELOPMENTS IN WEST AFRICA AND PROSPECTS FOR 2012
29
2.2.7 Iron ore
35. Iron is an important export mineral for Guinea, Liberia, and latelySierra Leone (Box 1). Iron ore has recently enjoyed record-high prices ataround $US150 per ton on the back of high demand from China.However, this price is set to tumble over the next seven years asburgeoning supply in Africa hits the international market for thecommodity, according to a new research conducted in the AustralianNational University (Business Day, 2012). Most analysts expect that theiron ore price will begin to fall around 2014, as large amounts of supplystart to flow into the market. If more of the planned African capacitycomes on stream, prices could further tumble to $US60 per ton in the nextseven years, a price drop last seen during the global financial crisis whenthe demand for commodities crashed. In West and Central Africa, 17 keyiron ore projects provide new additional production capacity. Moreover,China’s economy grew at its weakest pace in nearly three years in the firstquarter, with the annual rate of expansion slowing more than expectedto 8¼ per cent from 9 per cent in the previous three months.
Source: IMF, 2011a
Box 1: Sierra Leone: Economic Impact of Tonkolili Iron Ore Project, 2012-2014
The discovery at Tonkolili has an estimated 10½ billion tons of high grade iron oredeposits. It is one of the largest iron ore discoveries in Africa. In August 2010, theGovernment of Sierra Leone signed a mining lease agreement with a private, foreignmining company – African Minerals Limited (AML) – for the development andmining of the Tonkolili deposits. The project, which has an estimated mine-life inexcess of 60 years, is being developed in three phases. Phase I is expected to produce12 million tons of iron ore per annum starting from 2012. The total investment ofthis phase is projected at about $US1.4 billion (63 per cent of 2011 GDP). Thefunding is provided by the investor through equity and issuance of debt.
Realization of phase I of the project will have a significant impact on economicactivity, exports, and budget revenue in coming years. Accordinggly, a one-timeupward shift in real GDP growth from 5⅓ per cent in 2011 to 51 per cent in 2012 isprojected, and total exports from Sierra Leone are expected to quadruple. The taxeffect is expected to be relatively small in 2012 but increases substantially from 2013onwards, as taxable income turns positive. Annual tax receipts are projected to be 1½per cent of non-iron ore GDP in 2012 and 6½ per cent in 2013. Payment of corporateincome taxes, which is projected to start in 2013, could be delayed by two or threeyears if investments for Phase II start in 2012. In this case, however, tax revenues inthe outer years of the project would be higher than under the current scenario.Phases II and III are expected to boost annual production incrementally by 23and 45 million tons, respectively.
Recent_economic_dvlp_interieur:Bal 06/02/2013 15:38 Page 29

2.2.8 Uranium
36. Niger is one of the world’s top uranium producers. The price ofuranium has been high and apt to remain so for some time. The long-term price support comes from international competition for thecommodity as a result of escalating nuclear programs in nations such asIndia and China. There are plans worldwide for 547 new reactors, eitherunder construction, planned, or proposed (EIU, 2012). When viewedfrom a demand side, the price of uranium is expected to keep rising.Indeed, governments worldwide are struggling to find solutions tocontrol green house gas emissions and produce affordable energy, andnuclear power is the cleanest, least expensive, and most secure source ofelectricity (EIU, ibid).
2.2.9 Bauxite
37. In West Africa, bauxite is being produced and exported by Guinea-Conakry, Ghana, and Sierra Leone. As the global aluminum industrycontinues its recovery, demand for both bauxite and alumina has beenstrong. It is forecast to remain so in the years to come, driven by capacitygrowth in China, the Middle East and India. Indeed, meeting demandhas proved to be a challenge and is something that the industry hasstruggled with in the past, and this high demand combined with limitedsupply will help support high prices in the foreseeable future (EIU, 2012).
2.2.10 Timber
38. Nigeria is one of the top timber/lumber exporting countries in theworld. Log and lumber prices held relatively steady throughout 2011.During the year, the average price for a log delivered to the mill was$US481 per one thousand board feet (or $US481/mbf), varying in anarrow range between a high of $US503 per million board feet in Marchand a low of $US466/mbf in the most recent month of December. Regionallog prices held up in 2011 because of the increased level of log exportsto China from private forestlands. Through the first seven monthsof 2012 timber sales prices have averaged $US329/mbf, compared withthe $US282/mbf projected for the entire fiscal year in the NovemberForecast (EIU, 2012). Looking ahead, since a significant recovery in
30
RECENT ECONOMIC AND SOCIAL DEVELOPMENTS IN WEST AFRICA AND PROSPECTS FOR 2012
Recent_economic_dvlp_interieur:Bal 06/02/2013 15:38 Page 30

the US (especially its housing market) is not foreseen over the nextseveral years, timber prices are likely to underperform for a while longer.
2.2.11 Wheat and rice
39. Rice is the staple food for many West African countries, and oneof the most important import products. Following a brief period of relativestability during 2009, wheat prices began rising up in mid-2010 followingweather-induced production shortfalls in Eastern Europe and CentralAsia. In the latter half of 2010, wheat prices increased by almost 120 percent, reaching and remaining at above $US300 per ton. While wheatmarkets are tight by historical standards, the rice market appears to bewell-supplied. For most of 2010, rice prices fluctuated within a narrowband of $US450 to $US500 per ton, far below the early-2008 peak of$US900 per ton, but twice as much as its historical average (EIU, 2012).
40. However, prices gained momentum and increased almost 30 percent between May and November 2011, mainly in response to policyadjustments in Thailand, which is responsible for 25 to 30 per cent ofglobal rice exports. These adjustments sought to render support to thecountry’s rice farmers by limiting the fall in prices. Furthermore, therice price rose due to some flooding in South East Asia which damagedpart of Thailand’s rice crop. These two events imply that for 2011 andwell into 2012 rice prices will remain elevated (EIU, ibid).
2.2.12 Sugar
41. West Africa depends on other regions for its sugar needs. Annualaverage prices of sugar rose by 23¾ per cent in 2011, to just over 26 UScents per pound, as stocks start to build more rapidly in 2012. Betterthan expected crops from some of the major suppliers (especiallyThailand and India) helped tip the market off February’s three-decadepeak of 36.08 US cents per pound, culminating in a 43 per cent reductionfrom the peak by May 2011. So far in 2012 sugar prices have risen byaround 10 per cent amid downward revisions to Brazilian crop prospects,slower than expected Indian export releases and spillover strength fromenergy markets (lifting bio-ethanol demand prospects) (EIU, 2012).
RECENT ECONOMIC AND SOCIAL DEVELOPMENTS IN WEST AFRICA AND PROSPECTS FOR 2012
31
Recent_economic_dvlp_interieur:Bal 06/02/2013 15:38 Page 31

42. World sugar consumption recovered from three years of below-trend growth, expanding by 2½ per cent in the 2011/12 season, to 168¾million tons. Better crops and a consequent drop in prices are releasingmore latent demand in most regions of the developing world, where theengine of growth—indirect use in soft drinks and manufactured foods—slowed markedly during the recent period of supply shortfalls and highercosts. On the supply side, the global sugar production is expected togrow at 5¼ per cent in 2011-2012 as higher output from India, Russia,Europe, Ukraine and smaller producers outweighs a highly unusualdownturn in the largest producer, Brazil (EIU, ibid).
■ 2.3 Implications of Global Economic Trends on West African Economy
43. The stuttering economic growth in developed countries will likelydampen the economic prosperity in West Africa, as many of thesubregion’s export destinations are in regions deeply immersed in theeconomic malaise. For example, Spain and Portugal – countries whoseeconomies are expected to shrink in 2012 – together import over 90 percent of Cape Verde’s products (EIU, 2012). This calls for a search forexport markets other than Europe by West African countries (especiallyCape Verde and Sierra Leone, whose dependence on Europe is 50 percent or more for exports). The subregion’s countries whose exportdestinations are the BRICS group, other fast growing emergingeconomies (for example, Chile for Guinea, and South Korea, Indonesia,and Thailand for Mali), and countries within the subregion, will berelatively left unscathed by the global slowdown.
44. The fluctuating global macroeconomic indicators have implicationsfor West Africa too. As inflation increased worldwide during 2011, thismay induce some key export markets to tighten policy leading toslackened appetite for imports from West Africa. Moreover, as the fiscalausterity measures are being rolled out, an appetite for imports fromWest Africa could be suppressed. The flow of remittances to West Africabetween 2011 and 2012 is likely to be weaker than before the economicstress. Similarly, official development assistance (ODA) to West Africamay decline due to difficult economic conditions in some donorcountries, with significant negative consequences for governmentspending in many West African countries in 2012 and beyond. Net
32
RECENT ECONOMIC AND SOCIAL DEVELOPMENTS IN WEST AFRICA AND PROSPECTS FOR 2012
Recent_economic_dvlp_interieur:Bal 06/02/2013 15:38 Page 32

private and official capital flows to developing countries declinedfrom 5¾ per cent of GDP in 2010 to 4½ per cent in 2011 (Table 3). Thishas adversely affected developing countries that are highly depended onthese flows. This dependency is shown by Benin, for example, whosegrants account for an average of 56 per cent of external financing (WorldBank, 2011a).
Notes: PPP = purchasing power parity, e = estimate, f = forecast
Table 3: The Global Outlook in Summary (Percentage change from previous year, except interest rates and oil policy)
Source: World Bank, 2011a
45. Relatively higher commodity demand and prices have spurredrapid growth in West Africa’s exports and output in 2011, improving theterms of trade as well as external balances. Most commodity pricesincreased in 2011, but the variations and sensitivity to economic shocksvaried across commodities. The prices of food items that are of criticalimportance to West Africa have been rising, whereas metal and energyprices had been fluctuating significantly.
46. For an oil-dependent economy like Nigeria, Europe and the USaccount for over 60 per cent of total exports. Oil accounts for nearly 80per cent of total budget revenue for Nigeria. On the basis of the recentand expected maintenance of relatively high oil price in 2012, most oilexporters in West Africa are expected to enjoy relatively healthy current
RECENT ECONOMIC AND SOCIAL DEVELOPMENTS IN WEST AFRICA AND PROSPECTS FOR 2012
33
2009 2010 2011e 2012f 2013g
World Trade Volume -10.6 12.4 6.6 4.7 6.8
Non Oil Commodities -22.0 22.4 20.7 -9.3 -3.3
Oil Price (US$ per oil barrel) 61.8 79.0 104.0 98.2 97.1
International Capital Flows to developing countries [% of GDP]
Net private and official inflows 4.2 5.8 4.5
Net private inflows [equity + debt]
3.7 5.4 4.3 3.3 3.7
Sub-Saharan Africa 4.0 3.7 3.9 3.5 4.4
Recent_economic_dvlp_interieur:Bal 06/02/2013 15:38 Page 33

RECENT ECONOMIC AND SOCIAL DEVELOPMENTS IN WEST AFRICA AND PROSPECTS FOR 2012
34
account balances. However, they have to be wary of the challenges ofefficient public finance management that often follow from oil windfallin order to avert potential mismanagement and the so called “Dutch-disease” and resource curse. By comparison, West Africa’s oil-importingcountries will see their current account balances worsen.
47. The implications of gold price changes are immense for BurkinaFaso, Ghana, Mali, and Guinea. Elevated gold prices provide impetusfor increased exploration and investment, including by artisanal andsmall scale miners. As noted before, the price could swing unfavorablyfor gold exporters. Indeed, authorities should be aware that gold is notonly a store of wealth but also a risk asset, meaning that once the riskabates then both the demand and price will decline. As of early May2012 gold was trading around $US1,600, which is 16 per cent below itspeak in September 2011. This should be a clear warning that the highgold price is not permanent. This means that while the price is highthese exporters should build fiscal buffers in preparation for pricereversals. They should also strive to diversify their economies bysupporting value-adding activities to gold production, for example bypromoting the jewellery manufacturing industry.
48. The high prices of exports from Sierra Leone and Niger bodewell for their development, offering them an opportunity to dealdecisively with grinding poverty and poor infrastructure. Authoritiesshould also be mindful of changing prices, and accordingly they willhave to consider accumulating savings for the times when prices aredropping. Creating sovereign wealth funds is one means of ensuringlittle waste during boom times.
49. The steady recovery of cotton prices bodes well for Mali andBurkina Faso, the major cotton producers in the subregion. The volatilityin cotton prices means that these countries should be cautious in theirplanning so as to avoid a financing gap. As mentioned, the cotton priceis likely to be depressed because of its sensitivity to economicdevelopments in Europe, and the increasing encroachment by substituteproducts.
Recent_economic_dvlp_interieur:Bal 06/02/2013 15:38 Page 34

RECENT ECONOMIC AND SOCIAL DEVELOPMENTS IN WEST AFRICA AND PROSPECTS FOR 2012
Source: OPEC, 2011
Box 2: West Africa: Prospects for Oil and Gas
Africa contains less than 4 per cent of the world’s proven oil reserves but accountsfor just over 6 per cent of global output of crude oil and LNG. It is of particularsignificance to the international oil industry, however, in that it contains five countrieswhere output is expected to increase. These countries are: Angola, EquatorialGuinea, Côte d’Ivoire, Ghana, and Nigeria.
African countries have attracted large amounts of upstream investment from theinternational oil industry. Two of the countries - Angola and Nigeria - produce over2 million bpd each and have considerable potential to increase their output.Equatorial Guinea and Côte d’Ivoire are expected to show reasonable gains from amuch lower base. Chad was once also forecast to provide significant gains in output,but its production has recently gone into decline following major disagreementsbetween the government and its foreign oil industry partners.
The region is also well-endowed with natural gas and has the world’s seventh-largestexporter of LNG, Nigeria. Its proven reserves constitute 3 per cent of the world’s total.Commercial production outside Nigeria, however, is very low. Much of West Africa’sgas is re-injected into oil reservoirs. There is considerable potential for commercialproduction of natural gas if markets can be developed. Nigeria has progressed furthestwith this, having LNG exports already and being in the process of developing marketsin neighboring countries through the development of a gas transmission system.
Oil and gas developments in Africa carry a considerable amount of political risk.Relations between international oil companies and African governments have notalways proved easy, as in the case of Chad. In Nigeria, the oil companies have comeunder fierce attack from the inhabitants of the main oil- and gas-producing areas forwhat is seen as their collusion with the federal government in diverting oil revenuesaway from the producing regions to other parts of Nigeria, notably the Muslimnorth. In recent years, these protests from the largely non-Muslim south-east havespilled over into violence, leading to the kidnapping and even deaths of foreign oilworkers. At the height of the crisis, some international oil firms were forced to shut-in production and plans to increase the production of oil and gas were delayed.However, the amnesty programme implemented in 2009 has doused the violence.
With proven oil and LNG reserves of 48.8 billion oil barrels (bbl), Africa accountsfor 4 per cent of the world total. Of these 48.8 billion bbl, 35.9 billion bbl, or nearly74 per cent, are in Nigeria. Angola has some 3.4 billion bbl, corresponding to just over11 per cent, leaving the remaining 7.5 billion bbl, or 15% per cent, spread amongstthe following countries: Cameroon, Chad, Congo DR, Congo-Brazzaville,Equatorial Guinea, Gabon, and Côte d’Ivoire. Ghana, with an estimated reserveof 5 billion barrels, is the latest entrant into the oil producing countries club. Theregion’s crude oil and LNG production is similarly concentrated in Nigeria-with anoutput of 2.6 million barrels per day, or 51 per cent of the regional total-and Angola,whose 1.3 million barrels per day production accounts for 25 per cent of regionalproduction. The remaining seven countries produce some 1.2 million barrels per day,equivalent to 24 per cent of the total.
35
Recent_economic_dvlp_interieur:Bal 06/02/2013 15:38 Page 35

RECENT ECONOMIC AND SOCIAL DEVELOPMENTS IN WEST AFRICA AND PROSPECTS FOR 2012
50. The rising grain prices pose formidable obstacles to efforts toeradicate hunger especially in low-income West African countries thatare heavily dependent on food imports, such as Niger and Mali. Acombination of unfavorable weather conditions in the subregion andthe policy measures to support favorable prices for farmers in the majorexporters of rice and other grains means that most West African countriesshould make financial adjustments in preparation of higher food importbill. The ECOWAS member States should invest more in agriculture toavoid the humanitarian crisis that predictably unfolds whenever droughtsor steep international prices visit their staple food.
51. Ghana’s oil production came at the time when the country isenjoying relatively high cocoa and gold prices. Furthermore, the countryhas recently given more attention to its agricultural sector by allocatingmore resources for support. The challenge will be to avoid the temptationof loosening up on these worthy initiatives when the oil revenues startto flow. The country has a chance to avoid an over-concentration ofexports and, with continued agricultural support, will have a welldiversified economy that is able to parry severe economic shocks.
52. To conclude, it is a fact of economic life that there will be boomsand busts in the price of commodities. Therefore both importers andexporters must steel themselves for these inevitabilities, including bybuilding economic buffers through diversifying exports and revenuesources. While the temptation may be great to be lax in the tax effort inview of commodity boom, exporting countries should be aware that thisboom can end overnight, while tax reforms can take time to implement.For importers of staple food, the need for investing in agriculture hasnever been more urgent. Humanitarian crisis due to food insecurityhas become a regular feature in West Africa, especially in the Sahelregion. The relatively high commodity prices give these countries achance to break this unfortunate and foreseeable cycle of misery.
Recent_economic_dvlp_interieur:Bal 06/02/2013 15:38 Page 36

CHAPTER 3: ECONOMIC DEVELOPMENTS IN WEST AFRICA IN 2011
■ 3.1 Economic Growth Performance in West Africa
53. Economic growth in West Africa accelerated from 5¾ per cent in2009 to 6¾ per cent in 2010 before decelerating marginally to 6½ per centin 2011 (World Bank, 2011a). Between 2005 and 2011, the averageeconomic growth was in excess of 5 per cent per annum, making WestAfrica one of the fastest growing zones in the world (Figure 4). Nigeria,the subregion’s largest economy, grew by 7¼ per cent in 2011, drivenlargely by the non-oil sectors of telecommunication, agriculture,wholesale, and retail trade. Ghana recorded the highest growth rate of13½ per cent in 2011 fueled by new oil exploration and non-oil sectors,especially the construction and agricultural sectors (Table 4).
Figure 4: Real GDP growth rates and Projections as of January 2012Source: World Bank, 2011a
54. While Guinea and Togo recorded positive GDP growth rates in2011, these rates would have been higher in the absence of politicaldisturbances and insecurity in these countries. In 2011, Côte d’Ivoire’s
37
Recent_economic_dvlp_interieur:Bal 06/02/2013 15:38 Page 37

economy shrank by close to 5 per cent due to power shortages and,importantly, political uncertainty following the disputed 2010 elections.Benin is slowly recovering from the devastating flood that affectedagricultural production in 2010, growing by 3 per cent in 2011 up from2½ per cent in 2010 (Table 4).
55. The main drivers of growth in the subregion have been growth indomestic demand, particularly the rising consumption, investment, andgovernment spending on productive activities. Public consumption alsoplayed role in Burkina Faso, Cape Verde, Mali, and Sierra Leone due tohuge public capital projects to upgrade road and transport infrastructure.In Benin, gross fixed capital formation was the main source of GDP growthin 2011. There was, however, a deceleration in the contribution of externaltrade sector between 2008 and 2011 for a number of countries (Table 6). InBurkina Faso, private consumption and gross fixed capital formationdominated sources of output growth from the demand side (Table 5).
Table 4: Real GDP Growth Rates of ECOWAS member States (Percent change)
56. External demand for high priced commodities from the subregionalso played a key role in boosting growth and sustaining it over the lastfew years. Trade growth in most of the countries has been strong,supported by rising commodity prices, benefiting both oil and non-oilproducers in the first half of 2011.
57. Prudent macroeconomic policies and financial support frommultilateral agencies also boosted economic growth in West Africa. Manyof the countries are implementing one form or the other of poverty
38
RECENT ECONOMIC AND SOCIAL DEVELOPMENTS IN WEST AFRICA AND PROSPECTS FOR 2012
Recent_economic_dvlp_interieur:Bal 06/02/2013 15:38 Page 38

reduction and growth strategy document with the support of the WorldBank and the International Monetary Fund (IMF). For example, Nigeriahas the Vision 20:2020; Benin has the Extended Credit Facility with theIMF which provides the basis of financial and technical support by otherdevelopment partners; and Cape Verde has recently negotiated a newpolicy support Instrument for 2011-2013 with the IMF (IMF, 2012c).
Note : * 2010, ** 2009, + aggregate consumption
Table 5: Composition of GDP Growth by Source of DemandSource: ECOWAS, 2011
58. The impact of growth on the per capita incomes remains low insome countries like Benin, Côte d’Ivoire, and Togo, and relatively highin Cape Verde and Ghana (Figure 5). The growth in per capita incomewas generally positive suggesting an improvement in the standard ofliving for people in the region. The exception was in Côte d’Ivoire wherethe per capita income shrank by ¾ of one per cent in 2011, although thiswas a major improvement over the 4⅓ per cent in the contraction of percapita income in 2010. Most of the countries recorded per capita incomegrowth of over 2 per cent in 2011.
RECENT ECONOMIC AND SOCIAL DEVELOPMENTS IN WEST AFRICA AND PROSPECTS FOR 2012
39
Public
Consumption
(%)
Private
Consumption
Gross Fixed
Capital
Formation
Exports Imports
Country 2008 2011 2008 2011 2008 2011 2008 2011 2008 2011
Benin 8.71 4.86 10.26 4.72 14.54 16.72 12.97 2.39 6.64 4.28
Burkina Faso 20.79 19.7* 66.25 64.2* 33.03 33.3* 12.5 18.2* 33.2 36.1*
Cape Verde 4.4 15.2 8.1 6.7 8.0 -1.0 16.2 4.2 10.5 2.0
Côte d’Ivoire - - 81.5+ 80.3+ 18.54 19.74 - - - -
The Gambia - - - - 0.3 2.8 23.1 15.2* 33.5 22.2*
Ghana - - - - 9.9 13.4* 18.7 25.2* -36.4 -34*
Guinea - - - - - - - - - -
Guinea Bissau 2** -29.3 5** 8.9 12** 8.1 0** 11.8 12** 4.1
Liberia - - - - - - - - - -
Mali 17.6 17.3* 71.6 71* 21.3 21.2* 29.2 25* 43 35.9*
Niger 12.8 -42.3 11.2 10.5 59.5 4.2 27.5 11.1 40.1 -2.6
Nigeria - - - - -4.7 1.1 42.7 40.5 -19.2 -22.1
Senegal 5.2 5.4 11.9 4.8 13.9 8.0 13.8 11.2 21.5 11.0
Sierra Leone 14.4 59.6 72.9 61.7 30.1 19.7 16.6 25.8 35.8 44.1
Togo - - 99.1+ 99.6+ 17.67 17.53 - - - -
Recent_economic_dvlp_interieur:Bal 06/02/2013 15:38 Page 39

40
Figure 5: Gross Domestic Product per capita Growth in ECOWAS, Annual Growth (%)
■ 3.2 Sectoral Decomposition of Growth
59. Most West African countries’ growth in 2011 was led by theprimary and tertiary sectors. On average, oil exporting countriesexpanded faster than oil-importing countries. As mentioned earlier, oneimportant feature of growth in oil exporting countries is the growingprominence of the non-oil sector, with a sustained increasing share inGDP growth over the last few years. The strength of the non-oil sectorreflects ongoing efforts in some oil-exporting countries to diversify theireconomies. Nigeria and Ghana, for example, have initiated a number ofprogrammes to support agricultural development, thus enhancing theagriculture’s contribution to GDP. As noted earlier, in Nigeriatelecommunication, construction, manufacturing, and trade sectors wereimportant, while in Ghana construction, agriculture, mining, oil, andservices sectors were major contributors to GDP.
Figure 6: Growth in West Africa, Oil Exporting Vs Oil Importing Countries (%)Source: IMF, 2011f
RECENT ECONOMIC AND SOCIAL DEVELOPMENTS IN WEST AFRICA AND PROSPECTS FOR 2012
Recent_economic_dvlp_interieur:Bal 06/02/2013 15:38 Page 40

41
RECENT ECONOMIC AND SOCIAL DEVELOPMENTS IN WEST AFRICA AND PROSPECTS FOR 2012
60. From the supply side, the impressive economic growth wasgenerated by several factors in the subregion. For example, a strongperformance of the agricultural and mining sectors helped Sierra Leone,while Liberia benefited from increased rubber export earnings andincreased activity in the mineral sector.
Note: * 2010, ** 2009
Table 6: Component of GDP growth by Supply SourcesSource: ECOWAS, 2011
61. In concluding this section, West African countries should strive toreduce dependence on a few commodities (Figure 7). While countriessuch as Nigeria and Ghana are trying to develop agricultural sector,their efforts are not as robust as they should, given that the expenditureon agriculture is still below that stipulated in the Maputo Declaration.
Primary Sector (%) Secondary Sector (%) Tertiary Sector (%)
S/N Country 2008 2011 2008 2011 2008 2011
1 Benin 15.91 4.76 9.01 6.44 11.51 6.94
2 Burkina Faso 8.59 4.28* 3.75 11.00* 3.78 5.0*
3 Cape Verde -10.6 -0.8 -2.3 -0.2 2.9 0.2
4 Côte d’Ivoire 35.15 33.05 23.36 22.67 41.49 43.83
5 The Gambia 25.3 26.2* 13.4 13.0* 61.3 60.8*
6 Ghana 48.6 51.1* 31 30.2* 20.4 19.6*
7 Guinea 3.6 3.2* 9.4 2.3* 2.4 1.3*
8 Guinea Bissau 3.9** 4.2 2.3** 4.6 2.3** 4.2
9 Liberia 575.7 638.8* 63.2 71.3* 210.7 242.8*
10 Mali 26.7 10.5* 5.0 2.7* 10.3 8.3*
11 Niger 46.1 44.0 10.1 11.2 43.7 44.9
12 Nigeria 56.06** 57.03* 7.14** 4.16* 36.46** 38.81*
13 Senegal 18.6 3.9 -1.7 5.7 2.2 4.1
14 Sierra Leone 4.5 4.13 -17.6 13.0 10.3 7.13
15 Togo 40.79 42.71 18.15 16.63 41.06 40.66
Recent_economic_dvlp_interieur:Bal 06/02/2013 15:38 Page 41

42
Figure 7: Shows The Relative Dependence Of West African States On Natural Resource Rents
Source: AfDB, 2011
■ 3.3 Performance of Key Macroeconomic Aggregates
3.3.1 Fiscal Performance in West Africa
62. There was a slight improvement in fiscal performance in WestAfrica in 2011. The ECOWAS countries recorded an overall fiscal deficitof 3¾ per cent of GDP in 2011 on average, which was still animprovement from the deficit of over 5 per cent of GDP in 2010(ECOWAS, 2011). However, for a subregion where an average deficit ofless than 3 per cent of GDP is the norm, the current situation indicatessome fiscal impairment stemming from revenue shortfall. The deficitsfor 2010 and 2011 were attributed to a significant growth in capitalinvestments and a wage bill, while the growth in revenues and grants hadremained stagnant. Cape Verde, Côte d’Ivoire, Senegal, and Sierra Leoneran fiscal deficit as a ratio of GDP that was above 5 per cent in 2011(Figure 8).
63. The continued strong counter-cyclical fiscal stance reflects effortsto preserve social spending in order to guard against a reversal of theimprovements in citizens’ living standards achieved in the recent past.
RECENT ECONOMIC AND SOCIAL DEVELOPMENTS IN WEST AFRICA AND PROSPECTS FOR 2012
Recent_economic_dvlp_interieur:Bal 06/02/2013 15:38 Page 42

43
RECENT ECONOMIC AND SOCIAL DEVELOPMENTS IN WEST AFRICA AND PROSPECTS FOR 2012
Furthermore, the accommodative stance seeks to close infrastructuralgaps, particularly those related to electricity supply constraints andtransport bottlenecks. These public spending efforts took hold amid agrowing consensus over the important role and place of the State insteering West African economies onto sustainable development path,especially by building and strengthening productive capacities. Publicexpenditures were shared between public investment to improve theinfrastructure necessary for economic activities such as roads, energy,and airport upgrade. Other expenditures were for boosting minimumwage in the public sector, and on activities to provide employment. InCape Verde there was rise in investment partly linked to the constructionof the country’s ports. Mali has also spent massively on modernizationof Bamako’s airport, building a third bridge in Bamako, as well as onuniversity and vocational training infrastructures.
Figure 8: ECOWAS member States: Overall Fiscal Balance, 2008-2011(Percent of GDP)
64. On the revenue side, government revenue did not rise as much fora number of reasons including the decline in trade taxes in lockstep withthe fall in exports. As mentioned before, countries such as Cape Verdethat depend on exports towards European markets were hardest hit,incurring the widest gap between government expenditure and revenue.
65. Worsening fiscal balances have reignited concerns over debtsustainability, and prompted some countries to shift the objective of
Recent_economic_dvlp_interieur:Bal 06/02/2013 15:38 Page 43

fiscal policy from short-term demand management to medium-termfiscal sustainability. Nigeria and Ghana, for example, limited thewidening of their fiscal deficits through a combination of increasedgovernment revenue, achieved by means of strengthening their customsand tax administration capacities, and a retrenchment in discretionaryspending. Under its 2010-2011 budget, Ghana planned to implement afiscal consolidation programme that would target a real growth of fiscalspending of 3 to 4 per cent.
66. Nonetheless, the debt situation appears manageable, with thesubregion’s average government debt as a per cent of GDP standing at43 per cent, with seven countries clustered below 40 per cent of GDP.Liberia benefited from debt forgiveness initiatives, enabling the countryto dramatically reduce its debt from over 200 per cent of GDP in 2009to just 14 per cent of GDP in 2011. In the same period Guinea-Bissaureduced government debt from 158 per cent of GDP to just 45 per centof GDP. As of 2011, the relatively highly indebted countries are CapeVerde (77¾ per cent of GDP), Guinea-Conakry (72¼ per cent of GDP),and Côte d’Ivoire (68 per cent of GDP) (Figure 9).
Figure 9: ECOWAS Member States: Government Debt (Percent of GDP)
67. Considering the uncertainty of the global economy, the policyand reform implications for West Africa are clear. The subregion shouldimprove its fiscal situation by expanding the revenue sources, and taxefforts should be bolstered through the requisite regulatory andadministrative reforms. The need to mobilize resources better has
44
RECENT ECONOMIC AND SOCIAL DEVELOPMENTS IN WEST AFRICA AND PROSPECTS FOR 2012
Recent_economic_dvlp_interieur:Bal 06/02/2013 15:38 Page 44

become urgent both nationally and regionally, and requires changing theinvestment ambience, continuing improvements in economicgovernance, and accelerating the regional integration agenda particularlyon banking and financial arrangements. Doing so will also address theperennial problem of limited options when the prices of primarycommodities plunge. Currently, the share of non-tax revenue in totalrevenue is very small. For example, non-tax revenue accounted for 2½per cent of GDP in Benin in 2011. Senegal had the lowest rate of lessthan 1 per cent, and Nigeria had the highest rate of 18 per cent in 2011,arising from proprietorship of oil wells. The non-diversification ofrevenue is a source of revenue volatility in the subregion. These policyand reform implications will also be pivotal in ensuring that thesubregion’s debt levels remain low.
68. Finally, in an environment of global slump, high unemploymentand a threat of worsening poverty, fiscal consolidation would bepremature in countries where growth was weak (below 4 per cent: Benin,Côte d’Ivoire, The Gambia, Guinea-Conakry, Mali, Niger, and Senegal),unless borrowing capacity is eroded, as is the case in The Gambia, Côted’Ivoire, and Guinea-Conakry with government debt hovering around70 per cent of GDP.
3.3.2 Monetary Developments in West Africa
69. In view of the need to stimulate domestic demand and nurture theongoing recovery, the monetary policy stance continued its expansionarytack in the majority of West African countries, with the exception ofGhana and Nigeria. Table 7 shows that the ratio of currency outsidebanks to broad money supply registered a declining trend in most WestAfrican countries, indicating relative improvements in financialintermediation and public confidence in the banking system during theperiod under review. In Liberia and Sierra Leone this is attributable to theimproving public confidence in the banking system, following therestoration of peace and stability in the aftermath of political disturbances.In The Gambia, Nigeria, and Ghana the trends are driven by innovationsin the banking system, particularly, the introduction of electronic bankingservices that have provided alternative and more efficient forms ofpayments. These rates of services were as high as 34½ per cent in Guinea,and at their lowest in Cape Verde at 8⅓ per cent in 2011.
RECENT ECONOMIC AND SOCIAL DEVELOPMENTS IN WEST AFRICA AND PROSPECTS FOR 2012
45
Recent_economic_dvlp_interieur:Bal 06/02/2013 15:38 Page 45

46
Table 7: Trends of the Ratio of Currency outside Banks to Broad Money Supply (2002-2011)Source: ECOWAS, 2011
70. One of the challenges of monetary policy, particularly in some ofthe countries that pursued expansionary or neutral monetary policystances, was the weak effect of reduced interest rates on the real sector.Despite relatively low-interest rates in many countries, credit to theprivate sector still stagnated, as commercial banks adopted cautiousattitudes amid uncertainty in global economic conditions.
2002 2003 2004 2005 2006 2007 2008 2009 2010 2011
Benin 33.9 34.3 25.8 31.7 34.8 27.5 32.7 30.5 29.3 31.9
Burkina Faso 19.1 38.0 28.0 25.6 21.5 24.9 23.4 25.7 23.8 24.8
Côte d’Ivoire 47.6 32.2 34.7 36.2 35.5 36.8 36.0 34.9 37.2 36.5
Guinea Bissau 81.3 69.9 74.9 77.3 71.9 63.1 59.8 65.9 68.4 59.3
Mali 39.5 43.4 35.9 40.3 36.9 31.8 31.5 30.4 31.7 33.6
Niger 28.8 43.7 41.9 43.5 46.0 37.4 36.9 35.7 38.1 36.8
Senegal 19.8 26.4 23.8 24.9 25.9 24.5 22.9 23.4 25.1 22.8
Togo 27.0 18.7 23.9 20.1 26.0 27.1 24.3 26.7 25.8 23.9
Cape Verde 12.3 11.5 10.8 10.5 9.0 8.9 8.5 9.1 8.7 8.4
Liberia 35.0 39.9 37.4 34.1 31.0 27.7 21.5 20.4 22.5 25.7
The Gambia 24.9 25.8 26.1 23.2 25.0 20.4 18.7 19.6 21.5 22.1
Ghana 31.2 31.5 27.4 26.4 24.1 22.9 20.6 22.0 21.8 22.4
Guinea 42.4 43.5 40.7 38.6 40.2 41.7 34.6 36.4 35.9 35.6
Nigeria 29.0 25.3 20.3 20.0 16.2 12.7 9.7 8.5 9.6 11.8
Sierra Leone 39.3 41.0 37.1 31.9 31.3 28.7 25.8 27.6 25.9 24.0
RECENT ECONOMIC AND SOCIAL DEVELOPMENTS IN WEST AFRICA AND PROSPECTS FOR 2012
Recent_economic_dvlp_interieur:Bal 06/02/2013 15:39 Page 46

47
RECENT ECONOMIC AND SOCIAL DEVELOPMENTS IN WEST AFRICA AND PROSPECTS FOR 2012
3.3.3 Inflation
71. Consumer price developments in West African countries arepresented in Table 8. Inflation rate picked up from 9⅓ per cent in 2009to 10 per cent in 2010, and rose further to 10⅓ per cent in 2011 in theECOWAS subregion (ECOWAS, 2011). The main elements thataccounted for the upward trend in prices were food, accommodation,transportation, and energy in line with crude oil price increases in theglobal market. Inflationary pressures differed from country to country,with a number of countries (Guinea-Conakry, Nigeria, and SierraLeone) clustered in a double-digit zone and others veering in thatdirection. The country-specific factors included increased domesticdemand (Benin, Ghana, and Nigeria); robust public spending, especiallyduring their presidential elections in 2011(Nigeria, Sierra Leone, Liberia,and The Gambia); the lagged effects of currency depreciation oflate 2009; introduction of the goods and services tax (Sierra Leone);and the spillover effects of exchange rate depreciation (Côte d’Ivoireand Nigeria).
2004 2005 2006 2007 2008 2009 2010 2011
Benin 0.9 5.4 3.8 1.3 8.0 2.2 2.1 2.8
Burkina Faso -0.4 6.4 2.4 -0.2 10.7 2.6 -0.6 1.9
Cape Verde -0.9 0.4 4.8 4.4 6.8 1.0 2.1 5.0
Côte d’Ivoire 1.5 3.9 2.5 1.9 6.3 1.0 1.4 3.0
The Gambia 14.3 5.0 2.1 5.4 4.5 4.6 5.0 5.9
Ghana 12.6 15.1 10.2 10.7 16.5 19.3 10.7 8.7
Guinea 17.5 31.4 34.7 22.9 18.4 4.7 15.5 20.6
Guinea Bissau 0.8 3.2 0.7 4.6 10.4 -1.6 1.1 4.6
Liberia 3.6 6.9 7.2 13.7 17.5 7.4 7.3 8.8
Mali -3.1 6.4 1.5 1.5 9.1 2.2 1.3 2.8
Recent_economic_dvlp_interieur:Bal 06/02/2013 15:39 Page 47

48
Table 8: ECOWAS member States Consumer Prices, 2004-2011
72. The policy implications for the inflation trend suggest thatcountries with high inflation rates must tighten sufficiently to maintainmacroeconomic stability but not so fast as to choke off economic growth.For those countries with low inflation rates (Benin, Burkina Faso, andMali with rates below 3 per cent), there is scope to continue with growth-supportive policies to generate employment, while keeping an eye onbudding macroeconomic instability and unmanageable debt.
3.3.4 Trade and Exchange rate Movements in ECOWAS Countries
73. West Africa’s share of world merchandise trade declined between2001 and 2011, in terms of both exports and imports. The subregionaccounted for just ¾ of one per cent of world merchandise exports in2001, and this has declined further to ½ per cent share in 2011, in linewith the fall in Africa’s share of world exports. The value of imports, incontrast, has been stable with little change between 2001 and 2011(WTO, 2011).
74. West Africa’s exports are principally of minerals (includingpetroleum). As mentioned earlier in the report, sector shares of exportearnings are determined more by trends in world prices than changes inexport volumes. In the early 2011, the value of mineral exports declinedslightly while the value of agriculture commodities increased slightly,with manufactures remaining stable. While the export prices of primary
2004 2005 2006 2007 2008 2009 2010 2011
Niger 0.4 7.8 0.1 0.1 10.5 1.1 0.9 4.0
Nigeria 15.0 17.9 6.2 5.4 11.6 12.5 13.7 10.6
Senegal 0.5 1.7 2.1 5.9 5.8 -1.7 1.2 3.6
Sierra Leone 14.2 12.0 9.5 11.6 14.8 9.2 17.8 18.0
Togo 0.4 6.8 2.2 0.9 8.7 1.9 3.2 4.0
RECENT ECONOMIC AND SOCIAL DEVELOPMENTS IN WEST AFRICA AND PROSPECTS FOR 2012
Recent_economic_dvlp_interieur:Bal 06/02/2013 15:39 Page 48

49
RECENT ECONOMIC AND SOCIAL DEVELOPMENTS IN WEST AFRICA AND PROSPECTS FOR 2012
commodities overall held their value in 2009 (Figure 10), this was drivenlargely by increased world prices for timber and crude petroleum.
Figure 10: Composition of exports, 2009 (%)Source: WTO, 2011
75. On net, the sustained demand (especially from emerging Asiaand the BRICS) ensured high commodity and oil prices, which eclipsedthe price drop of other exports from the subregion. In the event, theterms of trade improved for some ECOWAS countries, while in othersthey declined (Figure 11; data for Liberia not available). The subregionas a whole shows little change from 2010 to 2011.
Figure 11: Terms of Trade of Goods (2008-2011)Source: IMF, 2011e
76. During the mid-term review of the African Growth andOpportunity Act (AGOA), the preferential arrangement governing the
Recent_economic_dvlp_interieur:Bal 06/02/2013 15:39 Page 49

US-African trade and investment relations, in May 2011 the AGOAForum’s discussions centered on the fact that the Act will expire in 2015.The ensuing recommendations not only were about the extension ofthe life of the Act, but also contained suggestions to modify the Act toinclude: (i) the relaxation of some aspects that hinder greaterinclusiveness and accessibility of the Act to the beneficiaries; (ii) someflexibility on the rules of origin and requirements on third-countrysourcing of yarn and textile inputs; and (iii) a distinction betweenrelatively well-off AGOA eligible countries and those emerging fromconflict to enable the Act to meet its goal of promoting development(UNECA and AUC, 2011).
3.3.5 Savings and Investments
77. According to the United Nations Conference on Trade andDevelopment (2010), domestic savings and investment rates in WestAfrica in the 1990s were well below the rates recorded in the 1980s, andwere lower still in the 2000s than in the 1990s, which had been aparticularly difficult period (Figure 12). According to the same source(UNCTAD, ibid), savings and investment rates fell by 23¾ per cent and26¼ per cent, respectively, in the period 2005-2008 and by 17½ per centand 19¼ per cent, respectively, in the period 2009-2011.
Figure 12: Domestic Investment in Selected ECOWAS countries (As ratio of GDP)Source: AfDB, 2011
78. The gap between savings and investment has widened, makingthe subregion ever more dependent on external financing for itsdevelopment (Figure 13; data for Liberia not available from source). InWest Africa, available data indicate that net average domestic savings
50
RECENT ECONOMIC AND SOCIAL DEVELOPMENTS IN WEST AFRICA AND PROSPECTS FOR 2012
Recent_economic_dvlp_interieur:Bal 06/02/2013 15:39 Page 50

barely exceeded 12 per cent of GDP in 2011, with only two countriesrecording rates of 15 per cent of GDP and above: Côte d’Ivoire (18½ percent), and Ghana (15¾ per cent).
Figure 13: Gross National Savings-Total Investment Gap, 2008-2011Source: IMF, 2011e
3.3.6 Foreign Capital Flows and Remittances in West Africa
79. On average, the current account deficit slightly widened in WestAfrica in 2011, from 1¾ per cent of GDP in 2010 to 2¼ per cent of GDPin 2011 (Figure 14). Oil-importing countries saw imports’ growthaccelerating, fuelled by public investment, rising private demand, andincreasing oil and food prices. However, the export earnings of this groupof countries rebounded somewhat. As a result, the current accountdeficits were moderate. However, the oil importing countries emergingfrom conflicts (in particular, Liberia) posted relatively larger currentaccount deficits due to their relatively dire need for imported goods of allkinds, including food and reconstruction equipment. For example,Liberia’s deep current account imbalance is due to the large UNMILpresence, which accounts for around 50 per cent of imports. Besidesthis, imports consists of capital imports for large investments projects.
RECENT ECONOMIC AND SOCIAL DEVELOPMENTS IN WEST AFRICA AND PROSPECTS FOR 2012
51
Recent_economic_dvlp_interieur:Bal 06/02/2013 15:39 Page 51

Figure 14: ECOWAS member States: Current Account Balance (2008-2011)(Percent of GDP)
80. The policy implications point to the need for member States tousher in an apt savings environment that entails: promoting thecollaboration among the stock exchanges in the subregion; narrowing theborrowing-savings gaps so as to encourage the bank intermediationmechanism to channel savings towards investments; and, wherenecessary, calibrating the tax system to encourage savings rather thanconsumption.
81. Since the changes in the current account are driven by a narrowrange of factors (changes in commodity prices), the central message ofthis report becomes applicable again: there is need to diversify awayfrom these narrow range of resources, lest the member States becomeconstrained in foreign exchange if the said prices turn unfavorable.
3.3.7 Macroeconomic and Policy Convergence in West Africa
82. The continued poor macroeconomic conditions in the world havehad an impact on countries in West Africa, worsening their capability tomeet the macroeconomic convergence criteria in the context ofECOWAS, WAMZ, and UEMOA integration agenda, particularly thesecondary criteria (Box 3).
52
RECENT ECONOMIC AND SOCIAL DEVELOPMENTS IN WEST AFRICA AND PROSPECTS FOR 2012
Recent_economic_dvlp_interieur:Bal 06/02/2013 15:39 Page 52

83. Table 9 shows how the subregion’s countries have performanceagainst the ECOWAS’s convergence criteria. The number of countriesthat met the ECOWAS budgetary imbalances criterion actually declinedfrom the peak of eight in 2007 to four in 2010 and further to two in 2011.The number of countries that met the ECOWAS inflation criterionhowever rose from seven to ten between 2010 and 2011. Performance inrespect of gross external reserves declined from 11 countries in 2009 toten in 2010 and 2011. In 2011, 13 countries met the ECOWAS criteriaon budget deficit financing by central bank.
84. With respect to secondary criteria of ECOWAS, the situation in2011 showed a general lack of improvement over 2010. The number ofcountries that met the salary mass and tax revenue/GDP ratio remainedunchanged between 2010 and 2011. However, only very few countrieswere able to meet other criteria. The number of countries that met thereal interest rate condition fell from seven in 2010 to five in 2011. Realexchange rate stability and the public investment/tax revenue ratio hadincrease in number of countries that complied.
Table 9: Number of Countries that met the Convergence Criteria in ECOWASSource: WAMA, 2012
85. Table 9 further shows that none of the countries in the subregionhas been able to meet all conditions. Niger, with eight out of the tenconvergence criteria, is the best performer. The worst performance wasrecorded by Guinea, which met only one secondary criterion. In between
RECENT ECONOMIC AND SOCIAL DEVELOPMENTS IN WEST AFRICA AND PROSPECTS FOR 2012
53
2005 2006 2007 2008 2009 2010 2011
Budget Deficit/GDP 5 6 8 7 3 4 2
Inflation 9 9 7 1 10 7 10
Gross External Reserves 1 9 9 1 11 10 10
Central Bank BudgetDeficit Financing
15 13 15 13 12 12 13
Domestic Arrears 5 6 6 7 8 10 11
Tax Revenue/GDP 2 2 2 2 2 2 2
Salary Mass/Tax Revenue 7 8 9 7 6 4 4
Public Investment/Tax Revenue
6 7 7 7 7 6 10
Real Interest Rate 7 6 6 0 11 7 5
Real Exchange RateStability
11 12 13 6 12 10 12
Recent_economic_dvlp_interieur:Bal 06/02/2013 15:39 Page 53

were countries like Mali, Burkina Faso, Senegal, and Togo whichobserved seven convergence criteria. Benin and Cape Verde met six of thecriteria each.
86. The Report of the 26th Meeting of the Governors of the WAMZfor Policy harmonization came up with a number of recommendationsto speed up the member States’ move towards meeting at least the Zone’sconvergence criteria. These recommendations include the need for:(i) government expenditure to be channeled towards growth promotingactivities and sectors including agriculture, tourism and infrastructure inorder to create jobs and reduce poverty; (ii) member countries to spur thedomestication of Fiscal Responsibility Act that was endorsed by countriessince 2007 to ensure sound public expenditure management; and(iii) member countries to intensify efforts to strengthen domestic revenuemobilization and broaden the tax base to include the informal sector aswell as modernization of revenue agencies for effective managementof revenues.
RECENT ECONOMIC AND SOCIAL DEVELOPMENTS IN WEST AFRICA AND PROSPECTS FOR 2012
Box 3: Convergence Criteria for the Economies of West Africa
Recent_economic_dvlp_interieur:Bal 06/02/2013 15:39 Page 54

CHAPTER 4: SOCIAL DEVELOPMENTS IN WEST AFRICA IN 2011
87. West Africa’s economic rebound and sustained growth are yet totranslate into commensurate progress towards social development,including the many indicators laid out in the MDG agenda. This is notto say that West Africa has not made any progress. In fact, most WestAfrican countries have positively progressed at a varying pace towardsall MDG targets, with notable reduction in undernourishment, increasedprimary school enrolment, and improvement on some health indicators.However, poverty rates, maternal mortality rates, and unemploymentrates have remained extremely high in most countries.
88. This part of the report reviews social, institutional, andenvironmental developments in West Africa.
■ 4.1 Population Structure and Growth
89. West Africa constitutes nearly 30 per cent of Africa’s totalpopulation. Nigeria is the most densely populated country in thecontinent, and accounts for about 51 per cent of the total population ofWest Africa. Most of the other countries are small. The populationgrowth rate in the region is one of the highest in the world, reflecting acombination of declining death rate and rising birth rate. The smallsizes of the population in some countries pose a major constraint toeconomies of scale required in large infrastructure investments in sectorslike power, telecommunication, and railway. Another feature of thepopulation is the high share of young people in the age structure of thepopulation and the rising urbanization rate in most countries.
55
Recent_economic_dvlp_interieur:Bal 06/02/2013 15:39 Page 55

90. The population structure of the subregion is both an asset and alsoa developmental challenge for the countries. The youthfulness of thepopulation implies that there is an available pool of labor force in thefuture to meet productive requirements. On the other hand, it alsoimposes some challenges for the government in the provision ofeducation and health infrastructure as well as job opportunities. As Table10 shows, the youth dependency ratio is very high in these countries,made more difficult by the current environment of joblessness andpoverty.
Table 10: Population DynamicsSource: World Bank, 2011b
56
RECENT ECONOMIC AND SOCIAL DEVELOPMENTS IN WEST AFRICA AND PROSPECTS FOR 2012
Country Population Average annual
populationgrowth
Population agecomposition
(%)
Dependency ratio(%) of workingage population
(million) (%)Ages 0-14
Ages15-64
Ages65 +
Young Old
1990 2009 20151990-2009
2009-2015
2009 2009 2009 2009 2009
Benin 4.8 8.9 10.6 3.3 2.9 43 54 3 80 6BurkinaFaso
8.8 15.8 19 3.1 3.1 46 52 2 90 4
Cape Verde
Côted’Ivoire
12.6 21.1 24.2 2.7 2.3 41 55 4 73 7
Ghana 15 23.8 26.6 2.4 1.8 38 58 4 66 6
Guinea 6.1 10.1 11.8 2.6 2.7 43 54 3 79 6
GuineaBissau
1 1.6 1.8 2.4 2.3 43 54 3 79 6
Liberia 2.2 4 4.8 3.2 3.2 43 54 3 79 6
Mali 8.7 13 15.4 2.1 2.8 44 54 2 83 4
Niger 7.9 15.3 19.1 3.5 3.7 50 48 2 104 4
Nigeria 97.3 154.7 178.7 2.4 2.4 43 54 3 78 6
Senegal 7.5 12.5 14.5 2.7 2.4 44 54 2 81 4
SierraLeone
4.1 5.7 6.6 1.8 2.3 43 55 2 79 3
TheGambia
0.9 1.7 2 3.4 2.5 42 55 3 77 5
Togo 3.9 6.6 7.6 2.7 2.3 40 57 4 71 6
LatinAmerica
435.6 572.5 606.9 1.4 1 28 65 7 43 10
East Asia 1599.6 1943.8 2035.8 1 0.8 23 70 11 28 16
South Asia 1128.7 1567.7 1706.5 1.7 1.4 32 63 5 51 7
Recent_economic_dvlp_interieur:Bal 06/02/2013 15:39 Page 56

91. Figure 15 shows the labor force participation rate across the WestAfrican states. The rate of women participation is low in Mali, Niger, andNigeria compared with Ghana and Liberia where it almost equals thatof men.
Figure 15: Labor Force Participation rate in West AfricaSource: AfDB, 2011
■ 4.2 Poverty and Income Distribution
92. The overall progress towards achieving the MDGs remains mixedin most West African countries, and subject to formidable challenges.Poverty rates remain chronically high, with the proportion of employedpeople living on less than $US1.25 a day having increased from 60 to66 per cent between 2009 and 2011. However, as Table 11 shows manycountries have made some remarkable progress from the conditions thatprevailed at the turn of the millennium.
RECENT ECONOMIC AND SOCIAL DEVELOPMENTS IN WEST AFRICA AND PROSPECTS FOR 2012
57
CountryShare of populationbelow PPP $1.25 a
day (%)
Poverty gap ratio at PPP $1.25 a
day (%)
Share ofpopulation belowPPP $2 a day (%)
Poverty gap ratio at PPP $2 a day
(%)Country 2000 2011 2000 2011 2000 2011 2000 2011
Benin 47.3 22.4 15.7 7.0 75.3 67.1 33.5 18.7
Burkina Faso 56.5 30.2 20.3 16.2 81.2 70.1 39.3 21.0
Cape Verde - 21.0 17,4 6.1 42.3 27.8 16.3 8.1
Côte d’Ivoire 24.1 7.5 14.1 7.5 72.0 44.3 32.1 14.9
The Gambia 34.3 12.1 12.1 5.8 56.7 31.0 27.1 13.7
Ghana 30.0 14.4 18.0 10.6 79.5 42.7 24.8 16.8
Guinea 40.2 43.3 21.7 15.0 81.0 61.7 41.0 26.5
Guinea Bissau 52.1 48.8 16.5 7.9 79.2 60.4 34.8 19.5
Liberia - 70.7 50.6 40.8 98.3 89.6 68.4 51.2
Mali 86.1 51.4 36.8 18.8 83.1 68.0 46.5 26.9
Recent_economic_dvlp_interieur:Bal 06/02/2013 15:39 Page 57

Table 11: Poverty and Income Distribution in West AfricaSource: World Bank, 2011b
93. In Nigeria, 64½ per cent of the population lived below $US1.25per day in 2011, a slight decline from 68½ per cent in 2000. In Liberia,the proportion was 70¾ per cent. Côte d’Ivoire has the lowest rate of8 per cent. Poverty gap ratio shows that among the countries in the subregion, Liberia has the highest ratio of 51¼ per cent, Sierra Leone 31 percent, and Nigeria 28 per cent. While Sierra Leone and Liberia have justemerged from civil war, Nigeria’s case is a consequence of the oil wealth.
94. Regarding eradication of extreme hunger, many West Africancountries recorded a decline in malnutrition over the past year. Theproportion of the population below the minimum level of dietary energyconsumption has fallen from 28 to 25 per cent in West Africa (WorldBank, 2011b). However, this positive trend remains threatened by risinginternational food prices in 2012.
■ 4.3 Health and Education
95. Progress has been made across the subregion in some indicatorsof education outcomes, where primary school enrolment ratio increasedby 16 per cent between 2001 and 2011 (Figure 16). The abolition ofprimary school fees in some states in Nigeria resulted in a threefoldincrease in primary-school enrolment since 2007, reaching 95 per centin 2011. However, many West African countries are confronted with thechallenge of improving the quality of education (Table 12). Completionrates of primary school and the pupil-to-teacher ratios, both proxies forquality provision, are poor by international standard. Despite someimprovements in primary and secondary completion rates at about60 per cent in most countries, class size has remained very large.
58
CountryShare of populationbelow PPP $1.25 a
day (%)
Poverty gap ratio at PPP $1.25 a
day (%)
Share ofpopulation belowPPP $2 a day (%)
Poverty gap ratio at PPP $2 a day
(%)Country 2000 2011 2000 2011 2000 2011 2000 2011
Niger 78.2 43.1 26.5 9.9 85.8 72.4 45.8 25.2
Nigeria 68.5 64.4 35.7 22.3 85.6 72.5 48.7 28.0
Senegal 54.1 33.5 21.2 9.8 65.8 55.4 37.0 20.5
Sierra Leone 62.8 53.4 20.3 8.2 77.9 59.0 40.5 31.0
Togo - 38.7 22.9 8.7 74.6 53.4 33.9 22.1
RECENT ECONOMIC AND SOCIAL DEVELOPMENTS IN WEST AFRICA AND PROSPECTS FOR 2012
Recent_economic_dvlp_interieur:Bal 06/02/2013 15:39 Page 58

Figure 16: Education in West Africa: Adult Literacy Rate (%) Source: World Bank, 2011b
96. The disproportionate focus on primary education compared to thehigher educational skills needed by the labor market is one of the majordrivers of unemployment (World Bank, 2011b). This has beenacknowledged by the African Union (AU) resolutions for the SecondDecade of Education (2007-2016), which considers all levels of educationas crucial elements of economic and social development.
59
RECENT ECONOMIC AND SOCIAL DEVELOPMENTS IN WEST AFRICA AND PROSPECTS FOR 2012
Gross intake ratio in first grade ofprimary education
Transition rate to secondaryeducation
% of relevant age group % of relevant age group
Country Male 2009 Female 2009 Male 2008 Female 2008
Benin 161 152 - -
Burkina Faso 90 83 56 51
Cape Verde
Côte d’Ivoire 77 67 47 45
Ghana 109 111 91 92
Guinea 106 96 50 40
Guinea Bissau - - - -
Liberia 117 107 64 60
Mali 102 89 72 68
Niger 97 83 56 62
Nigeria 102 83 44 44
Senegal 96 102 62 57
Sierra Leone 201 182 - -
Recent_economic_dvlp_interieur:Bal 06/02/2013 15:39 Page 59

Table 12: Education Efficiency in West AfricaSource: World Bank, 2011b
97. Table 13 shows the access to basic health services in West Africancountries. Health indicators in the subregion are still far below fromthose prevalent in other developing regions, and also vary among thecountries in the subregion. Life expectancy for males is highest in CapeVerde (69½ years) and lowest in Guinea Bissau (46¾ years), Sierra Leone(47½ years), and Nigeria (48¾ years). For females, the life expectancyat birth is highest in Cape Verde at 77¼ years, followed by Benin(67½ years), and Togo (65½ years). It is lowest in Guinea Bissau, Niger,and Sierra Leone where it averages 50¼ years.
98. Health expenditure as a share of GDP is below 5 per cent formost countries, and on the average the private sector spends more onhealth than the public sector. Overall health expenditure per capita wasbelow $US100 in 2011 for all countries except Cape Verde, where itis $US145 per capita. This low expenditure on health partly explainsthe prevalence of various forms of preventable and communicablediseases in West Africa, and why life expectancy remains one of thelowest in the world, and child and maternal mortality rates remainamong the highest in the world.
60
Gross intake ratio in first grade ofprimary education
Transition rate to secondaryeducation
% of relevant age group % of relevant age group
Country Male 2009 Female 2009 Male 2008 Female 2008
The Gambia 91 96 83 83
Togo 105 102 66 58
Latin America - - - -
East Asia 105 107 - -
South Asia 126 117 80 80
RECENT ECONOMIC AND SOCIAL DEVELOPMENTS IN WEST AFRICA AND PROSPECTS FOR 2012
Life expectancy atbirth (years)
Share of GDP (%)Share of Health
Expenditure (%)
HealthExpenditure
per capita($) 2011
Country Male Female Public Private Public Private
Benin 64.3 67.5 2.4 2.0 54.9 45.1 32.7
Burkina Faso 54.0 56.8 4.1 2.5 61.4 38.6 39.6
Recent_economic_dvlp_interieur:Bal 06/02/2013 15:39 Page 60

Table 13: Health Indicators in West Africa, 2011Source: World Bank, 2011b
99. Many West African countries have shown some progress towardsachieving certain health-related MDGs. The aggregate under-fivemortality rate dropped from 160 to 115 per 1,000 births between 2001and 2011. Ghana, Liberia, and Nigeria have all reduced their under-five mortality rates by 50 per cent or more. However, the highest rates ofchild mortality in the world continue to be found in sub-Saharan Africa(SSA). In 2010, one in eight children died before their fifth birthday.All 31 countries with under-five mortality rates exceeding 100 per1,000 live births in 2009 were in SSA. Although the SSA under-fivemortality rates have declined by 28 per cent since 1995, and even morein West Africa, the improvement is insufficient to meet the targets set inthe MDGs.
100. In terms of maternal health, progress also remains mixed. Thelatest available data show an overall decline in maternal mortalityworldwide (UN, 2010) (Table 14). West and East Africa have shown
61
Life expectancy atbirth (years)
Share of GDP (%)Share of Health
Expenditure (%)
HealthExpenditure
per capita($) 2011
Country Male Female Public Private Public Private
Cape Verde 69.4 77.2 3.0 1.4 73.0 27.0 145.8
Côte d’Ivoire 57.8 60.5 1.4 4.2 19.8 80.2 56.4
The Gambia 55.8 58.0 3.2 3.3 50.0 50.0 27.4
Ghana 56.0 58.6 3.4 4.0 46.0 54.0 46.2
Guinea 57.3 61.5 1.3 5.2 16.2 83.8 19.0
Guinea Bissau 46.8 50.1 1.8 4.9 26.6 73.4 18.9
Liberia 57.8 60.5 6.0 8.6 39.4 60.6 30.2
Mali 49.7 50.2 2.9 3.1 48.9 51.1 39.5
Niger 52.1 53.7 3.8 2.9 37.6 62.4 70.2
Nigeria 48.7 50.1 2.6 3.9 43.9 56.1 49.5
Senegal 55.4 58.5 3.4 2.8 77.1 22.9 59.6
Sierra Leone 47.4 50.1 1.6 13.5 9.2 90.8 44.8
Togo 62.0 65.6 2.2 4.6 19.9 80.1 30.0
RECENT ECONOMIC AND SOCIAL DEVELOPMENTS IN WEST AFRICA AND PROSPECTS FOR 2012
Recent_economic_dvlp_interieur:Bal 06/02/2013 15:39 Page 61

significant progress, with a 24¼ per cent and 26½ per cent reduction inmaternal mortality between 1990 and 2010, respectively. In comparison,Southern Africa has experienced an increase in maternal mortality rates,from 150 deaths per 100,000 live births in 2000 to 281 per 100,000 in 2010.West Africa has also seen an 8.1 per cent increase over the same period.As a whole, SSA only experienced a 3⅓ per cent reduction in maternalmortality rates since 1990, which remains far from the MDG 5.
101. Three of the six countries that account for 50 per cent of allmaternal deaths globally are in Africa, namely Nigeria (West Africa),Ethiopia (East Africa), and DRC (Central Africa). It is thereforepertinent for governments to put maternal health as a central focus oftheir health agenda, otherwise Africa will continue to have the highestburden of maternal deaths worldwide.
Table 14: Access to Basic Utilities(health services )Source: AfDB, 2011
102. On the fight against the HIV/AIDS pandemic, the HIVincidence fell by over 25 per cent between 2001 and 2010. At the end of2010, 45 per cent of adults and children eligible for antiretroviral therapy(ART) were receiving it, compared with only 4 per cent seven years
62
RECENT ECONOMIC AND SOCIAL DEVELOPMENTS IN WEST AFRICA AND PROSPECTS FOR 2012
Access to Health Services Access to Health Services
2006 (%) 2008 (%)
Country Total Urban Rural Total Urban Rural
Benin 65 78 57 75 84 69
Burkina Faso 72 97 66 76 95 72
Cape Verde 80 86 73 84 85 82
Côte d’Ivoire 81 98 66 80 93 68
The Gambia 92 96 86
Ghana 80 90 71 82 90 74
Guinea 70 91 59 71 89 61
Guinea Bissau 57 82 47 61 83 51
Liberia 64 72 52 68 79 51
Mali 60 86 48 56 81 44
Niger 42 91 32 48 96 39
Nigeria 47 65 30 58 75 42
Senegal 77 93 65 69 92 52
Sierra Leone 53 83 32 49 86 26
Togo 59 86 40 60 87 41
Recent_economic_dvlp_interieur:Bal 06/02/2013 15:39 Page 62

earlier. AIDS-related deaths decreased by 21 per cent in West Africa overthe past year as well. Furthermore, there has been pronounced progressin reducing the incidence and impact of HIV among children under 15,with 32 per cent fewer children newly infected and 26 per cent fewerAIDS-related deaths among children. However, while access to ARTand prevention efforts have improved, the total number of people livingwith HIV in West Africa has remained high at 15½ million people in2009 (UNAIDS, 2010).
103. Progress in access to safe drinking water and improved sanitation,which have direct bearing on health status, has been steady across WestAfrica (Table 15). In 2009, some West African countries showed animprovement in coverage of improved drinking water by over 70 per cent.For example, Ghana improved water supply coverage from approximately35 per cent to about 55 per cent between 1992 and 2010. Likewise, Nigeriaimproved coverage from 30 to 60 per cent during the same period. Despitethis progress, evidence showed that inequities in access and outcomesexist, based on income variance and geographical location. Average accessto safe drinking water services was four times higher for urban householdscompared to their counterparts in rural areas.
Table 15: Access to Basic Utilities (water)Source: AfDB, 2011
RECENT ECONOMIC AND SOCIAL DEVELOPMENTS IN WEST AFRICA AND PROSPECTS FOR 2012
63
Access to Health Services Access to Health Services
2006 (%) 2008 (%)
Country Total Urban Rural Total Urban Rural
Benin 65 78 57 75 84 69
Burkina Faso 72 97 66 76 95 72
Cape Verde 80 86 73 84 85 82
Côte d’Ivoire 81 98 66 80 93 68
The Gambia 92 96 86
Ghana 80 90 71 82 90 74
Guinea 70 91 59 71 89 61
Guinea Bissau 57 82 47 61 83 51
Liberia 64 72 52 68 79 51
Mali 60 86 48 56 81 44
Niger 42 91 32 48 96 39
Nigeria 47 65 30 58 75 42
Senegal 77 93 65 69 92 52
Sierra Leone 53 83 32 49 86 26
Togo 59 86 40 60 87 41
Recent_economic_dvlp_interieur:Bal 06/02/2013 15:39 Page 63

■ 4.4 Gender
104. West Africa progressed somewhat on women empowerment andgender equality in 2010 and 2011 (Table 24). Gender parity in primaryschools was on track in some countries, although it was seriously off-trackfor higher levels of education in all countries. One of the key indicatorsof women empowerment relates to enhanced participation of women indecision-making. Some ECOWAS countries made notable progress byachieving 20-30 per cent or more participation of women in parliament.Some of the examples that can be cited include Nigeria (25⅓ per cent),Liberia, (48¼ per cent), and Ghana (27½ per cent). However, genderinequality remained a concern especially in relation to employmentand income.
105. As can be seen in Table 16, with the exception of Cape Verde, allcountries in West Africa are below the African Union target of 50 per centparliamentary representation of women. In terms of employment in thenon-agricultural sector, only Nigeria has more that 50 per cent of itswomen in the non-agricultural sector. For the other countries, agricultureis the main source of employment for women. For example, in Benin86 per cent of women are employed in agriculture.
106. To address issues of gender inequality, some of the countries inthe subregion, like Nigeria, have established a separate Ministry ofWomen Affairs. While these ministries will not themselves solve thegender inequality problem, if they help draw attention, and marshal therequisite political will and resources, they must be applauded. Howeverit must always be clear: the ultimate objective is to register real progresstowards eliminating gender inequality.
64
RECENT ECONOMIC AND SOCIAL DEVELOPMENTS IN WEST AFRICA AND PROSPECTS FOR 2012
Recent_economic_dvlp_interieur:Bal 06/02/2013 15:39 Page 64

Table 16: Gender Issues in West Africa Source: World Bank, 2011b
Ratio of girls toboys in primary &secondary school
(%)
Ratio of literateyoung women tomen (% ages 15-
24)
Women innational
parliament (% oftotal seats
Share of womenemployed in thenon agricultural
sector (%)
Country 2001 2011 2001 2011 2001 2011 2001 2011
Benin 65.0 85.9 43.0 68.9 6.0 10.8 5.9 13.6
Burkina Faso 70.2 86.2 34.7 56.9 8.1 16.4 16.0 32.1
Cape Verde 73.0 104.3 41.9 72.5 45.3 102.2 30.1 45.2
Côte d’Ivoire 69.3 97.6 73.6 84.6 6.0 28.9 8.9 21.6
The Gambia 81.6 92.6 65.4 85.9 2.0 10.0 14.3 32.1
Ghana 89.7 96.0 86.2 97.6 10.3 21.9 31.7 43.2
Guinea 62.5 78.1 - 79.5 9.0 18.5 24.5 38.9
Guinea Bissau 65.8 73.9 52.5 79.1 9.0 15.4 25.2 46.2
Liberia 71.9 83.4 74.8 114.9 8.6 32.5 13.4 38.3
Mali 70.3 89.5 56.0 83.1 12.2 15.4 17.3 25.8
Niger 65.8 76.9 58.7 78.0 1.1 12.8 24.1 45.9
Nigeria 80.2 102.5 64.9 87.4 15.9 30.2 35.8 56.8
Senegal 81.9 109.5 52.8 75.7 12.0 24.9 37.9 40.4
Sierra Leone 54.0 78.4 51.6 71.8 9.0 13.6 12.0 25.8
Togo 50.2 69.6 76.0 89.3 0.7 11.3 41.0 64.2
RECENT ECONOMIC AND SOCIAL DEVELOPMENTS IN WEST AFRICA AND PROSPECTS FOR 2012
Recent_economic_dvlp_interieur:Bal 06/02/2013 15:39 Page 65

Recent_economic_dvlp_interieur:Bal 06/02/2013 15:39 Page 66

CHAPTER 5: ECONOMIC AND SOCIAL PROSPECTS
FOR 2012 AND 2013 IN WEST AFRICA
107. Growth in the ECOWAS region was robust in 2011 at 6½ percent. This high growth rate was expected to be maintained or increasedin 2012 as new countries enter the oil and mineral production processes,and the economies of countries emerging from conflict rebound.Specifically, Côte d’Ivoire’s economy should pick up sharply after thereturn to political stability. Such a pickup is significant since the countryaccounts for 30 per cent of UEMOA’s GDP, and the recovery will assistneighboring countries through the resumption of trade, remittances,and investments. In other economies in the subregion: iron oreproduction should help raise pace of growth in Sierra Leone and Liberia;Guinea’s mining investment is set to rise sharply due to new policyframework and political stability, thus raising growth; and oil productionin Ghana should boost GDP growth. These activities will enable thesubregion to retain its status among the fastest growing economic zonesin the world. Moreover, factors such as the rising of investment flowsfrom emerging countries (for example, China) would offset the expecteddecline in international capital flows from traditional sources, and therising middle income class will boost consumer spending.
108. Whether this positive scenario materializes will depend on thespeed with which the subregion resolves the political impasse engulfingMali and Guinea-Bissau, and how effectively the Community deals withthe drought that adversely affected Burkina Faso, The Gambia, Mali,Niger, and Senegal, and with humanitarian crisis intensifying in theSahel. Before these political events, most of the countries in the subregionhad moved up on the international scales of governance, macroeconomicreforms, openness, and transparency. For instance, elections weresuccessfully held in Liberia, Nigeria, Togo, Guinea, and Senegal.
67
Recent_economic_dvlp_interieur:Bal 06/02/2013 15:39 Page 67

109. Moreover, the economic possibilities in 2012 are such that thecloudy global economic growth prospects will continue to have chaineffects across the world including the West African countries throughtrade, investment, and capital flows. While the recovery in globaleconomy is expected to be slow and patchy in 2012, it is expected thatmost of the primary commodity exports of West Africa will continue toenjoy relatively high prices, driven by high demand from emergingcountries and the search for safe assets such as gold in the face ofinvestors’ loss of confidence in their economies. Moreover, heightenedconcerns about fossil fuels will ensure that uranium prices will remainhigh, giving countries such as Niger an opportunity to grow faster.Therefore, West Africa is likely to withstand the global economic slumpmuch better than many other subregions.
110. There is the possibility that a precipitous increase in the pricesof oil and food will adversely impact the economies of importingcountries in the subregion. While the oil price increase could be kept incheck by sluggish economic growth in the developed countries and newoil supplies due to the re-entrance of new countries in the productionline, the prices of food have been rising and are likely to steepen in theyear ahead.
111. Another challenge in 2012 and 2013 relates to the declining paceof private and official international capital flows into developingcountries. This may constrain the fiscal and monetary space available forthe countries of the South to mitigate the impact of the downfall in theprices of their commodity exports. These countries may have to beproactive in their response to possible downturn on government fiscalrevenues by prioritizing their spending and providing an environmentconducive for private investment in infrastructure. The countrieshowever need to be cautious of high inflation and fiscal deficits goingforward.
112. On net, while the subregion faces political governance anddrought challenges, the prospects for 2012 point to growth that remainsrelatively high. However, member States need to be mindful that keymacroeconomic indicators are likely to come under pressure: inflationarypressures that emerged last year are likely to intensify driven largely byfood price increases. In response, monetary policies are unlikely totighten fast enough in fear of arresting an already precarious growth.
68
RECENT ECONOMIC AND SOCIAL DEVELOPMENTS IN WEST AFRICA AND PROSPECTS FOR 2012
Recent_economic_dvlp_interieur:Bal 06/02/2013 15:39 Page 68

Government revenues will be eclipsed by expenditures as member Statesseek to improve infrastructure and maintain social spending. Fiscaldeficits and government debt may therefore rise in the short term asprivate and public capital inflows remain under pressure.
113. Beyond these short-term scenarios, there are long-term structuralissues the ECOWAS member States need to continue addressing suchas undiversified production and export structure, low human capital,the high rate of youth unemployment, state fragility, and climate change.For example, figure 17 shows the vulnerability ratio for differentcountries in the subregion. Countries like The Gambia, Côte d’Ivoire,Guinea, Togo, Niger, Burkina Faso, Senegal, and Mali in that order arethe most vulnerable to increase in food and fuel prices. However, lowercommodity prices would also ease headline inflation in many of thesecountries.
Figure 17: Vulnerability of West African countries to Food and Fuel Price Shocks, 2009*Source: AfDB, 2011
Note: * vulnerability is defined as share of food and fuel imports as per cent of GDP
114. Therefore, the subregion must evaluate its vulnerabilities andprepare contingencies to deal with them in the event the global economydeteriorates further. Vulnerabilities could come from less access to globalfinancial markets, which may affect the ability of governments and firmsto finance growing balance sheet deficits. Also, declining demand forexports of developing countries could put pressures on balance ofpayments and government accounts of countries that are heavily relianton commodity exports and remittances inflows.
RECENT ECONOMIC AND SOCIAL DEVELOPMENTS IN WEST AFRICA AND PROSPECTS FOR 2012
Recent_economic_dvlp_interieur:Bal 06/02/2013 15:39 Page 69

Recent_economic_dvlp_interieur:Bal 06/02/2013 15:39 Page 70

CHAPTER 6: CONCLUSION AND RECOMMENDATIONS
115. Economic activity in West Africa has remained brisk evenagainst a gloomy global economy. This activity has been supported byelevated prices of export primary commodities of critical importance tothe subregion. Combined with some capital inflows in the form ofODA and private flows, the subregion has managed to roll out strongcounter-cyclical policies aiming to maintain social spending in orderto cushion the impact of slower growth and job losses on the poor, andto sustain public infrastructure investment programmes. On the otherhand, the price of imports of critical importance to West Africa also rose.The high prices of imported food items such as rice threatened toundermine efforts to reduce poverty in a subregion already facing severedrought, especially in the Sahel region. While the price of oil benefitedexporters in the subregion in 2011, oil importers faced high importbills, with spillover effects to food and transport costs. As a result,macroeconomic instability in the form of inflation and fiscal deficits hasintensified.
116. Looking ahead to 2012, the subregion is expected to remain onits high growth trajectory, supported by continuing high primarycommodities and accommodative fiscal and monetary policies, especiallyin countries where budget deficits and public debts are low, and wherethe inflation is not threatening macroeconomic stability. However, thereare severe downside risks to this expected high growth. These risksinclude how a combination of external and internal developments pansout. Externally, continuous weaknesses in developed economies willimpact negatively on certain commodity prices, as well as on capitalflows to ECOWAS countries. Internally, it will be critical to find shortand long term solutions to the vulnerability to drought and other climatechange issues so as to avoid humanitarian tragedy and worsening poverty.
71
Recent_economic_dvlp_interieur:Bal 06/02/2013 15:39 Page 71

West Africa must also address the underlying factors that expose it toconstant political governance slippages.
117. On the social front, while the subregion has enjoyed relativelygood economic growth rates in recent years, this growth has not madea serious dent on social indicators. Indeed, most of the subregion’sgrowth was generated by industries that are not labor-intensive, suchas oil, minerals, and telephony. The greater contribution by theagricultural sector stemmed from a better rainy season and buoyantagricultural commodity prices, rather than from structural reforms forsustainable high performance of the sector. In the event, dire povertyand joblessness remain rife, with the latter affecting the youthparticularly hard. The low employment content and poor socialoutcomes of West Africa’s growth are the result of lack of meaningfuleconomic diversification and continued heavy dependence oncommodity production and exports. This highlights the need forpromoting economic transformation for West Africa to accelerate andsustain growth in order to raise incomes, create employment, andeliminate extreme poverty. Some of the specific measures aresummarized in the next few paragraphs.
118. First, for the MDGs and other social development goals to beattained, West African countries must find ways to translate economicgrowth into meaningful job creation and social development. This canbe done by implementing several broad actions, including: strengtheningthe mainstreaming of social development objectives in national growthand development strategies with adequate budgetary allocations toachieving the MDGs; promote active private sector and NGOinvolvement in efforts to achieve social development goals; and improvenational capacity to monitor and report on MDGs and other socialdevelopment goals, including strengthening national statistical systems.West African countries must also focus on the social developmentindicators in which they lag behind other subregion.
119. Second, given the uncertain international economic and businessenvironment projected for 2012 and 2013, countries in the subregionmust promote the manufacturing sector, strengthen internationalcompetitiveness, and reduce constraints to long-term, non-resource-based economic development. In this regard, there is continuing need to:improve macroeconomic management; strengthen domestic institutions
72
RECENT ECONOMIC AND SOCIAL DEVELOPMENTS IN WEST AFRICA AND PROSPECTS FOR 2012
Recent_economic_dvlp_interieur:Bal 06/02/2013 15:39 Page 72

and capacity; reduce corruption and misuse of government resources;commit to stable inflation and exchange rates in line with agreed regionalconvergence criteria; and ensure low real and nominal interests.
120. Third, West African governments should reduce uncertaintysurrounding trade policy. They should: reduce high tariff rates; concludethe EPA regional negotiations with the EU; remove non-tariff barriersto trade; and strengthen the implementation of the protocol on freemovements of people across the subregion. They should also implementthe Common External Tariff in order to boost trade and free movementof agricultural products to facilitate an effective regional market. Moreefforts to improve governance are needed, including the transparency ofthe electoral process.
121. Fourth, as part of diversifying the origins and destinations oftraded goods and services, West African countries should strengthen theSouth-South cooperation between West African countries and otheremerging countries, in particular, China, Russia, India, and Brazil, giventhe increasing role of these countries in international development andtrade. This cooperation has to generate maximum benefits for memberStates and the subregion. For example, the ECOWAS-Chinamemorandum of understanding should be strengthened to facilitate thegrowth and maturity of the regional industrial sector. Furthermore, it isworth stressing that such strengthened cooperation can facilitate theexchange of appropriate technologies among developing countries,thereby reducing adjustment costs.
122. Fifth, economic diversification should be an important mediumto long-term strategy for countries of the subregion, in order to minimizethe problems associated with focusing on a few sectors. The dependenceon rain-fed agriculture and one or two mineral exports is not asustainable strategy for long-term economic growth and development.In particular, these countries become vulnerable to vagaries of weather,cyclical commodity prices and other factors beyond their control. Effortsshould be made towards creating and exploiting value chains inagriculture and mining through strengthening value additions. Value-addition in these sectors will create more jobs locally, increase incomes,boost intra-country trade, and also diversify exports and lift the profileof West African countries in global trade.
RECENT ECONOMIC AND SOCIAL DEVELOPMENTS IN WEST AFRICA AND PROSPECTS FOR 2012
73
Recent_economic_dvlp_interieur:Bal 06/02/2013 15:39 Page 73

123. Sixth, the subregion must meet the infrastructure deficit head on.To support governments’ efforts, public-private partnerships must bepromoted through the development and implementation of appropriatepolicy and institutional frameworks. Furthermore, strengthened regionalcollaborations in infrastructure provision will facilitate the pooling ofrequired capital resources to develop the high-cost infrastructure. Thework of subregional institutions such as the West African Gas Pipelinesand the West African Power Pool in facilitating interconnectivity will helpaddress these infrastructure bottlenecks. The promotion of renewableenergy should be an integral part of the sub regional energy strategy.
124. Seventh, regional initiatives to foster regional integration mustbe reinvigorated and regional institutions and member States shouldstrive to attain all convergence criteria among the West African states.Beyond regional integration, these criteria have a further benefit ofensuring sustainable economic development within and betweenmember States.
125. Eighth, the promotion of environmentally friendly growth shouldbe intensified in order to sustain development. It is also important for theWest African countries to adopt and implement environmentally friendlypolicies as part of sound and sustainable development strategies. Theinitiative by the United Nations to launch a Global Green New Deal, ledby the United Nations Environment Programme, is noteworthy for itsaim to ensure that measures to protect the environment and addressclimate change also create new economic opportunities, including fortrade and investment. Concomitantly, measures to cope with the globaleconomic predicament and resuscitate growth should help preserve theenvironment and mitigate climate change, including throughinvestments in clean industries and technologies.
126. Ninth, as part of efforts to diversify revenue sources, West Africancountries must intensify their domestic and regional resourcemobilization efforts in order to close the funding gap. In this regard,member States should improve the management of transnationalresources such as water-ways, forestry, and fishery, and through policyand action attract more diaspora remittances.
127. Finally, the upheavals in Mali and Guinea demonstrate that thegovernance gains of the last years cannot be taken for granted. They
74
RECENT ECONOMIC AND SOCIAL DEVELOPMENTS IN WEST AFRICA AND PROSPECTS FOR 2012
Recent_economic_dvlp_interieur:Bal 06/02/2013 15:39 Page 74

must be guarded at all times, lest they retract the social and economicachievements of the last decade or so. The example of Côte d’Ivoire is acase in point, showing how political unrests can undermine not only thecountry in questions but the entire region through economic and sociallinkages. The implementation of the ECOWAS Conflict Preventionand Management framework should be strengthened to ensuresustainable peace and stability.
RECENT ECONOMIC AND SOCIAL DEVELOPMENTS IN WEST AFRICA AND PROSPECTS FOR 2012
Recent_economic_dvlp_interieur:Bal 06/02/2013 15:39 Page 75

Recent_economic_dvlp_interieur:Bal 06/02/2013 15:39 Page 76
REFERENCES
1. African Development Bank (AfDB), 2011, African DevelopmentIndicators (ADI)
2. Business Day, 2012, “African threat to iron ore prices,” April 23.Available at: http://www.smh.com.au/business/african-threat-to-iron-ore-price-20120422-1xf2w.html
3. Economic Community of West African States (ECOWAS), 2011,ECOWAS Macroeconomic Database and Multilateral SurveillanceSystems (ECOMAC), available at: http://www.ecomac.ecowas.int/
4. Economic Intelligence Unit (EIU), 2012 (April), Various Country& Commodity Reports, available at: http://www.eiu.com/default.aspx
5. IMF, 2011a, IMF Country Report 11/361, Washington DC6. IMF, 2011b, IMF Country Report No 11/129, Washington DC7. IMF, 2011c, IMF Country Report No 11/192, Washington DC8. IMF, 2011d, IMF Country Report No 11/201, Washington DC9. IMF, 2011e, Regional Economic Outlook. Washington DC. October10. IMF, 2011f, World Economic Outlook, Washington D.C., October.11. IMF, 2012a, “Global Economic Prospects and Policy Changes.” A
Paper Prepared for the Meeting of G-20 Deputies, January 19-20,Mexico City
12. IMF, 2012b, China Economic Outlook, Washington DC, February2012
13. IMF, 2012c, Country Report No. 12/29, Washington DC14. IMF, 2012d, WEO Database, April, Washington DC15. IMF, 2012e, World Economic Outlook, Washington DC April16. Organization for Economic Cooperation and Development (OECD),
2011, OECD Economic Outlook, Volume 2011/2 November17. Organization of the Petroleum Exporting Countries (OPEC), 2011,
Annual Statistical Bulletin, 2010/2011 Edition18. UNAIDS, 2010, Global Report on the AIDS Epidemic, Geneva.19. UNCTAD, 2010, Trade and Development Report 1999, Geneva.
77
Recent_economic_dvlp_interieur:Bal 06/02/2013 15:39 Page 77

20. United Nations (UN), 2010, The Millennium Development GoalsReport, UN Department of Public Information (DPI), New York.
21. United Nations Department of Economic and Social Affairs(UNDESA), 2010, World Economic Situation and Prospects, New York.
22. United Nations Department of Economic and Social Affairs(UNDESA), 2012, World Economic Situation and Prospects 2012,New York.
23. United Nations Department of Economic and Social Affairs(UNDESA), 2011, World Economic Outlook: World EconomicSituations and Prospect 2011 Global Outlook, New York, available at:http://www.un.org/esa/policy/wess/wesp.html
24. United Nations Economic Commission for Africa (UNECA), andAfrican Union Commission (AUC), 2011, Report on a Survey ofAGOA’s Past, Present and Future Prospects: The Experiences andExpectations of Sub-Saharan Africa, Addis Ababa
25. West African Monetary Agency (WAMA), 2012, Data Statistics,available at: http://www.amao-wama.org/en/statistics.aspx
26. World Bank, 2011a, Global Economic Prospects 2011, Washington DC27. World Bank, 2011b, World Development Indicators (WDI),
Washington D.C, 28. World Bureau of Metal Statistics, 2012, WBMS Database, April 2012,
available at: http://www.world-bureau.com/services.asp29. World Gold Council, 2012, World Gold Statistics, April 2012,
available at: http://www.gold.org/investment/statistics/30. World Trade Organization (WTO), 2010, International Trade
Statistics 2001, Geneva31. World Trade Organization, (WTO), 2011, International Trade
Statistics 2011, Geneva
78
RECENT ECONOMIC AND SOCIAL DEVELOPMENTS IN WEST AFRICA AND PROSPECTS FOR 2012
Recent_economic_dvlp_interieur:Bal 06/02/2013 15:39 Page 78

APPENDIXES
Appendix 1: The Global Real GDP Outlook in Summary (% change from previous year)
Source: World Bank, 2012 Notes: PPP = Purchasing Power Parity, e=estimate, f=forecast
Appendix 2: Real GDP growth rates of ECOWAS Member States
Real GDP growth 2009 2010 2011e 2012f 2013fWorld -2.3 4.1 2.7 2.5 3.1Memo item: world [PPP weight] -0.9 5.0 3.7 3.4 4.0High income -3.7 3.0 1.6 1.4 2.0Euro Area -4.2 1.7 1.6 -0.3 1.1Japan -5.5 4.5 -0.9 1.9 1.6United States -3.5 3.0 1.7 2.2 2.4Developing countries 2.0 7.3 6.0 5.4 6.0East Asia and Pacific 7.5 9.7 8.2 7.8 7.8Europe and Central Asia -6.5 5.2 5.3 3.2 4.0Latin America and Caribbean -2.0 6.0 4.2 3.6 4.2Middle East and N. Africa 4.0 3.6 1.7 2.3 3.2South Asia 6.1 9.1 6.6 5.8 7.1Sub-Saharan Africa 2.0 4.8 4.9 5.3 5.6
2002 2003 2004 2005 2006 2007 2008 2009 2010 2011
AFRICA 5.7 5.2 5.6 5.9 6.2 6.4 5.6 2.5 4.5 5.6
ECOWAS 3.9 7.7 5.6 5.9 5.3 5.7 5.6 5.6 6.8 6.5
UEMOA 1.3 3.4 2.7 4.2 2.9 3.2 3.9 3.1 3.9 3.8● Benin 4.4 3.9 3.1 2.9 3.8 4.6 5.0 2.7 2.8 3.4● Burkina Faso 4.6 8.0 4.6 8.6 5.5 3.6 5.2 3.2 5.2 5.8● Côte d’Ivoire -1.7 -1.4 1.2 1.7 0.7 1.6 2.3 3.8 3.0 -5.8● Guinea Bissau -7.2 0.3 2.8 4.3 2.1 3.2 3.2 3.0 3.5 4.3● Mali 4.3 7.6 2.3 6.1 5.3 4.3 5.0 4.5 4.5 5.4● Niger 5.8 3.8 -0.8 7.4 5.8 3.4 9.6 -0.9 7.5 6.0● Senegal 1.2 6.7 5.8 5.7 2.5 4.9 3.2 2.2 4.0 4.2● Togo -1.3 4.8 2.5 1.2 3.9 2.1 2.4 3.2 3.4 3.7
79
Recent_economic_dvlp_interieur:Bal 06/02/2013 15:39 Page 79

Source: ECOWAS, 2011
Appendix 3: Composition of GDP Growth by Source of Demand
Note : * 2010, ** 2009, + Aggregate ConsumptionSource: WAMA, 2011
80
2002 2003 2004 2005 2006 2007 2008 2009 2010 2011
WAMZ 4.6 9.1 6.4 6.4 5.9 6.4 6.1 6.4 7.6 7.2● The Gambia 1.3 7.4 6.6 0.3 3.4 6.0 6.1 4.6 5.5 5.3● Ghana 4.5 5.2 5.6 5.9 6.4 6.5 8.4 4.7 6.6 13.6● Guinea 4.2 1.2 2.3 3.0 2.4 1.8 4.9 -0.3 1.9 4.3● Liberia 7.8 -1.9 -2.8 1.4 3.1 3.2 3.5 3.6 3.7 3.9● Nigeria 4.6 9.6 6.6 6.5 6.0 6.5 6.0 6.7 7.9 7.0● Sierra Leone 6.5 10.7 9.6 7.6 6.0 6.0 4.0 3.2 5.0 5.6● Cape Verde 5.3 4.7 4.3 5.6 10.1 8.6 6.1 4.0 5.6 5.8
RECENT ECONOMIC AND SOCIAL DEVELOPMENTS IN WEST AFRICA AND PROSPECTS FOR 2012
PublicConsumption
(%)
PrivateConsumption
GFCF Exports Imports
Country 2008 2011 2008 2011 2008 2011 2008 2011 2008 2011
Benin 8.71 4.86 10.26 4.72 14.54 16.72 12.97 2.39 6.64 4.28
Burkina Faso 20.79 19.7* 66.25 64.2* 33.03 33.3* 12.5 18.2* 33.2 36.1*
Cape Verde 4.4 15.2 8.1 6.7 8.0 -1.0 16.2 4.2 10.5 2.0
Côte d’Ivoire - - 81.5+ 80.3+ 18.54 19.74 - - - -
The Gambia - - - - 0.3 2.8 23.1 15.2* 33.5 22.2*
Ghana - - - - 9.9 13.4* 18.7 25.2* -36.4 -34*
Guinea - - - - - - - - - -
Guinea Bissau 2** -29.3 5** 8.9 12** 8.1 0** 11.8 12** 4.1
Liberia - - - - - - - - - -
Mali 17.6 17.3* 71.6 71* 21.3 21.2* 29.2 25* 43 35.9*
Niger 12.8 -42.3 11.2 10.5 59.5 4.2 27.5 11.1 40.1 -2.6
Nigeria - - - - -4.7 1.1 42.7 40.5 -19.2 -22.1
Senegal 5.2 5.4 11.9 4.8 13.9 8.0 13.8 11.2 21.5 11.0
Sierra Leone 14.4 59.6 72.9 61.7 30.1 19.7 16.6 25.8 35.8 44.1
Togo - - 99.1+ 99.6+ 17.67 17.53 - - - -
Recent_economic_dvlp_interieur:Bal 06/02/2013 15:39 Page 80

Appendix 4: Regional Shares of World Merchandise Trade, 2001 and 2011
Source: WTO, 2011
Appendix 5: Composition of Regional Exports (Sector % Share inRegional Total)
Source: WTO, 2011
Appendix 6: Composition of Regional Imports (Sector % Share inRegional Total)
Source: WTO, 2011
RECENT ECONOMIC AND SOCIAL DEVELOPMENTS IN WEST AFRICA AND PROSPECTS FOR 2012
81
Region Real Export Growth (%) Real Import Growth (%)
2001 2011 2001 2011
North America 16. 1 21.4 23.2 34.3
Western Europe 37.5 37.6 39.6 37.8
Asia 25.7 31.5 22.8 24.6
Latin America 4.8 7.2 6.0 8.1
Africa 2.7 2.1 2.6 2.1
West Africa 0.6 0.5 0.8 0.6
Region Agriculture Minerals Manufactures
2009 2011 2009 2011 2009 2011
North America 13.5 14.7 9.7 13.8 76.8 71.5
Western Europe 12.8 13.9 8.4 11.9 79.8 74.2
Asia 8.2 12.1 10.5 16.2 79.3 71.7
Latin America 23.6 24.6 23.0 46.1 53.4 29.3
Africa 18.4 22.7 62.1 68.1 19.5 9.2
West Africa 12.0 16.4 58.7 63.0 29.3 20.6
Region Agriculture Minerals Manufactures
2009 2011 2009 2011 2009 2011
North America 8.6 9.0 13.8 14.6 77.6 76.4
Western Europe 11.2 10.1 12.5 13.8 76.4 76.1
Asia 12.1 9.7 18.9 20.0 70.0 70.3
Latin America 10.6 12.4 12.4 13.6 77.0 74.0
Africa 18.9 17.7 13.8 15.1 67.3 76.2
West Africa 14.3 13.0 11.7 12.0 74.0 75.0
Recent_economic_dvlp_interieur:Bal 06/02/2013 15:39 Page 81

Appendix 7: Average Tariffs by Country
Source: WTO, 2010, and African Development Bank, 2011
Appendix 8: Share of External Trade Balance in GDP in ECOWAS,2005-2011 (%)
Source: WTO, 2011
82
RECENT ECONOMIC AND SOCIAL DEVELOPMENTS IN WEST AFRICA AND PROSPECTS FOR 2012
Country 1990 -1995 2000 – 2005 2006 – 2011Benin 41.0 12.0 15.6
Burkina Faso 21.0 12.0 6.9Cape Verde 15.2 - 11.2
Côte d’Ivoire 22.9 12.0 13.1The Gambia 12.9 10.3 14.8
Ghana 16.7 14.6 8.6Guinea 11.9 - 11.9
Guinea Bissau 15.2 17.2 10.7Liberia 11.7 12.3 15.6
Mali 12.9 10.7 8.4Niger 16.4 14.3 9.1
Nigeria 33.7 30.0 10.0Senegal 13.3 12.0 8.4
Sierra Leone 30.3 - 13.6Togo 15.0 12.0 13.9
Country 2005 2006 2007 2008 2009 2010 2011
Benin -12.6 -11.3 -15.3 -13.6 -14.3 -12.5 -12.2
Burkina Faso -15.6 -15.3 - - - -12.4 -10.5
Cape Verde -32.9 -35.6 -38.0 -39.2 -41.8 -41.5 -37.6
Côte d’Ivoire 7.5 10.3 5.9 7.7 8.0 8.6 9.5
The Gambia -22.8 -17.5 -16.3 -18.6 -19.7 -13.2 -12.6
Ghana -25.3 -15.5 -16.3 -19.5 -10.8 -3.1 -2.0
Guinea -1.3 -3.3 -4.6 -5.3 -4.7 0.3 -3.0
Guinea Bissau - - - - - -32.9 -24.5
Liberia -14.0 -54.6 -162.5 -141.5 - -138.5 -124.7
Mali -11.7 -8.1 -9.4 - - -6.8 -8.3
Niger -9.2 - - - - - -14.5
Nigeria 15.5 15.1 15.1 12.3 8.7 10.3 14.6
Senegal -15.6 -17.5 -22.3 -26.6 -19.9 -12.4 -8.5
Sierra Leone -12.9 -7.6 -7.0 -13.0 -12.8 -3.1 -4.5
Togo -16.9 -19.5 -20.5 - -7.2 -9.6 -8.5
Recent_economic_dvlp_interieur:Bal 06/02/2013 15:39 Page 82
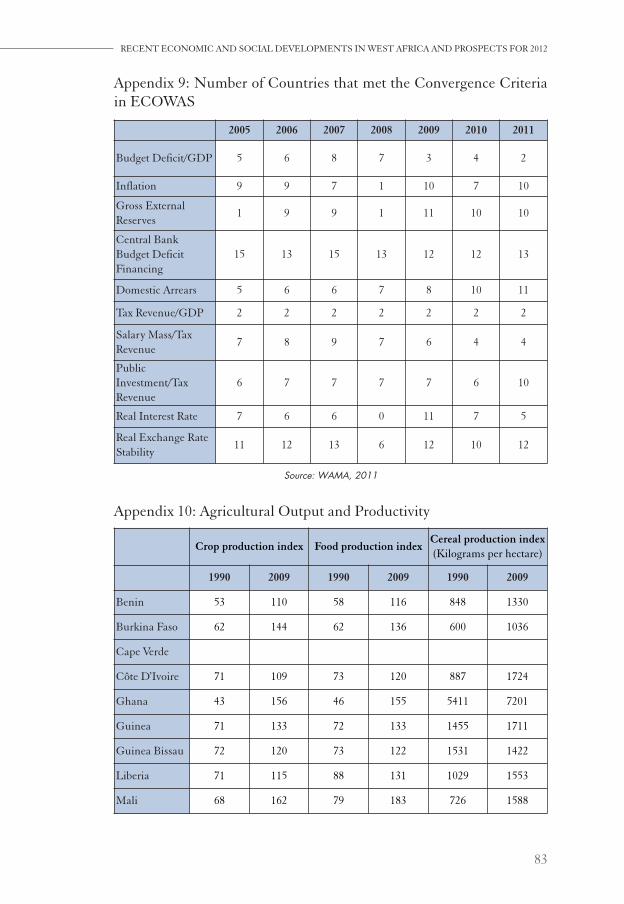
Appendix 9: Number of Countries that met the Convergence Criteriain ECOWAS
Source: WAMA, 2011
Appendix 10: Agricultural Output and Productivity
RECENT ECONOMIC AND SOCIAL DEVELOPMENTS IN WEST AFRICA AND PROSPECTS FOR 2012
83
2005 2006 2007 2008 2009 2010 2011
Budget Deficit/GDP 5 6 8 7 3 4 2
Inflation 9 9 7 1 10 7 10
Gross ExternalReserves
1 9 9 1 11 10 10
Central BankBudget DeficitFinancing
15 13 15 13 12 12 13
Domestic Arrears 5 6 6 7 8 10 11
Tax Revenue/GDP 2 2 2 2 2 2 2
Salary Mass/TaxRevenue
7 8 9 7 6 4 4
PublicInvestment/TaxRevenue
6 7 7 7 7 6 10
Real Interest Rate 7 6 6 0 11 7 5
Real Exchange RateStability
11 12 13 6 12 10 12
Crop production index Food production indexCereal production index(Kilograms per hectare)
1990 2009 1990 2009 1990 2009
Benin 53 110 58 116 848 1330
Burkina Faso 62 144 62 136 600 1036
Cape Verde
Côte D’Ivoire 71 109 73 120 887 1724
Ghana 43 156 46 155 5411 7201
Guinea 71 133 72 133 1455 1711
Guinea Bissau 72 120 73 122 1531 1422
Liberia 71 115 88 131 1029 1553
Mali 68 162 79 183 726 1588
Recent_economic_dvlp_interieur:Bal 06/02/2013 15:39 Page 83

Source: FAO, 2011
Appendix 11: Population Dynamics
84
Crop production index Food production indexCereal production index(Kilograms per hectare)
1990 2009 1990 2009 1990 2009
Niger 64 210 61 186 310 489
Nigeria 60 134 60 135 1148 1598
Senegal 72 130 73 134 795 1135
Sierra Leone 127 204 121 201 1202 989
The Gambia 55 114 60 117 1004 1053
Togo 71 109 74 132 747 1136
Latin America 75.8 128.1 71.2 131.2 2089 3282
East Asia 69.9 133.1 62.7 135.1 3795 4843
South Asia 78 119.3 74.5 122.7 1926 2628
Country Population
Averageannual
populationgrowth
Population agecomposition (%)
Dependencyratio (%)
of working age population
(million) (%)Ages 0-14
Ages 15 -64
Ages 65 +
Young Old
1990 2009 20151990-2009
2009-2015
2009 2009 2009 2009 2009
Benin 4.8 8.9 10.6 3.3 2.9 43 54 3 80 6
Burkina Faso 8.8 15.8 19 3.1 3.1 46 52 2 90 4
Cape Verde
Côte D’Ivoire 12.6 21.1 24.2 2.7 2.3 41 55 4 73 7
Ghana 15 23.8 26.6 2.4 1.8 38 58 4 66 6
Guinea 6.1 10.1 11.8 2.6 2.7 43 54 3 79 6
GuineaBissau
1 1.6 1.8 2.4 2.3 43 54 3 79 6
Liberia 2.2 4 4.8 3.2 3.2 43 54 3 79 6
Mali 8.7 13 15.4 2.1 2.8 44 54 2 83 4
Niger 7.9 15.3 19.1 3.5 3.7 50 48 2 104 4
RECENT ECONOMIC AND SOCIAL DEVELOPMENTS IN WEST AFRICA AND PROSPECTS FOR 2012
Recent_economic_dvlp_interieur:Bal 06/02/2013 15:39 Page 84

Source: World Bank, 2011
Appendix 12: Poverty and Income Distribution in West Africa
85
Country Population
Averageannual
populationgrowth
Population agecomposition (%)
Dependencyratio (%)
of working age population
(million) (%)Ages 0-14
Ages 15 -64
Ages 65 +
Young Old
1990 2009 20151990-2009
2009-2015
2009 2009 2009 2009 2009
Nigeria 97.3 154.7 178.7 2.4 2.4 43 54 3 78 6
Senegal 7.5 12.5 14.5 2.7 2.4 44 54 2 81 4
Sierra Leone 4.1 5.7 6.6 1.8 2.3 43 55 2 79 3
The Gambia 0.9 1.7 2 3.4 2.5 42 55 3 77 5
Togo 3.9 6.6 7.6 2.7 2.3 40 57 4 71 6
LatinAmerica
435.6 572.5 606.9 1.4 1 28 65 7 43 10
East Asia 1599.6 1943.8 2035.8 1 0.8 23 70 11 28 16
South Asia 1128.7 1567.7 1706.5 1.7 1.4 32 63 5 51 7
Share of populationbelow PPP $1.25 a
day (%)
Poverty gap ratio atPPP $1.25 a day
(%)
Share ofpopulation belowPPP $2 a day (%)
Poverty gap ratio atPPP $2 a day (%)
Country 2000 2011 2000 2011 2000 2011 2000 2011
Benin 47.3 22.4 15.7 7.0 75.3 67.1 33.5 18.7
BurkinaFaso
56.5 30.2 20.3 16.2 81.2 70.1 39.3 21.0
CapeVerde
- 21.0 17,4 6.1 42.3 27.8 16.3 8.1
Côted’Ivoire
24.1 7.5 14.1 7.5 72.0 44.3 32.1 14.9
TheGambia
34.3 12.1 12.1 5.8 56.7 31.0 27.1 13.7
Ghana 30.0 14.4 18.0 10.6 79.5 42.7 24.8 16.8
Guinea 40.2 43.3 21.7 15.0 81.0 61.7 41.0 26.5
GuineaBissau
52.1 48.8 16.5 7.9 79.2 60.4 34.8 19.5
Liberia - 70.7 50.6 40.8 98.3 89.6 68.4 51.2
Mali 86.1 51.4 36.8 18.8 83.1 68.0 46.5 26.9
RECENT ECONOMIC AND SOCIAL DEVELOPMENTS IN WEST AFRICA AND PROSPECTS FOR 2012
Recent_economic_dvlp_interieur:Bal 06/02/2013 15:39 Page 85

Source: World Bank, 2011
Appendix 13: Education Efficiency in West Africa
Source: World Bank, 2011
86
Share of populationbelow PPP $1.25 a
day (%)
Poverty gap ratio atPPP $1.25 a day
(%)
Share ofpopulation belowPPP $2 a day (%)
Poverty gap ratio atPPP $2 a day (%)
Country 2000 2011 2000 2011 2000 2011 2000 2011
Niger 78.2 43.1 26.5 9.9 85.8 72.4 45.8 25.2
Nigeria 68.5 64.4 35.7 22.3 85.6 72.5 48.7 28.0
Senegal 54.1 33.5 21.2 9.8 65.8 55.4 37.0 20.5
SierraLeone
62.8 53.4 20.3 8.2 77.9 59.0 40.5 31.0
Togo - 38.7 22.9 8.7 74.6 53.4 33.9 22.1
RECENT ECONOMIC AND SOCIAL DEVELOPMENTS IN WEST AFRICA AND PROSPECTS FOR 2012
Gross intake ratio in first grade of primary education
Transition rate to secondaryeducation
% of relevant age group % of relevant age group
Country Male 2009 Female 2009 Male 2008 Female 2008
Benin 161 152 - -
Burkina Faso 90 83 56 51
Cape Verde
Côte D’Ivoire 77 67 47 45
Ghana 109 111 91 92
Guinea 106 96 50 40
Guinea Bissau - - - -
Liberia 117 107 64 60
Mali 102 89 72 68
Niger 97 83 56 62
Nigeria 102 83 44 44
Senegal 96 102 62 57
Sierra Leone 201 182 - -
The Gambia 91 96 83 83
Togo 105 102 66 58
Latin America - - - -
East Asia 105 107 - -
South Asia 126 117 80 80
Recent_economic_dvlp_interieur:Bal 06/02/2013 15:39 Page 86

Appendix 14: Health Indicators in West Africa, 2011
Source: IMF, 2011(b)
RECENT ECONOMIC AND SOCIAL DEVELOPMENTS IN WEST AFRICA AND PROSPECTS FOR 2012
87
Life expectancyat birth (years)
Share of GDP(%)
Share of HealthExpenditure (%)
Health Expenditure per capita ($) 2011
Country Male Female Public Private Public Private
Benin 64.3 67.5 2.4 2.0 54.9 45.1 32.7
BurkinaFaso
54.0 56.8 4.1 2.5 61.4 38.6 39.6
Cape Verde 69.4 77.2 3.0 1.4 73.0 27.0 145.8
Côted’Ivoire
57.8 60.5 1.4 4.2 19.8 80.2 56.4
TheGambia
55.8 58.0 3.2 3.3 50.0 50.0 27.4
Ghana 56.0 58.6 3.4 4.0 46.0 54.0 46.2
Guinea 57.3 61.5 1.3 5.2 16.2 83.8 19.0
GuineaBissau
46.8 50.1 1.8 4.9 26.6 73.4 18.9
Liberia 57.8 60.5 6.0 8.6 39.4 60.6 30.2
Mali 49.7 50.2 2.9 3.1 48.9 51.1 39.5
Niger 52.1 53.7 3.8 2.9 37.6 62.4 70.2
Nigeria 48.7 50.1 2.6 3.9 43.9 56.1 49.5
Senegal 55.4 58.5 3.4 2.8 77.1 22.9 59.6
SierraLeone
47.4 50.1 1.6 13.5 9.2 90.8 44.8
Togo 62.0 65.6 2.2 4.6 19.9 80.1 30.0
Recent_economic_dvlp_interieur:Bal 06/02/2013 15:39 Page 87

Appendix 15: Access to Basic Health Services
Source: African Development Bank, 2011
Appendix 16: Access to Clean Water
Source: African Development Bank, 2011
88
RECENT ECONOMIC AND SOCIAL DEVELOPMENTS IN WEST AFRICA AND PROSPECTS FOR 2012
Access to Health Services Access to Health ServicesTotal Urban Rural Total Urban Rural
2006 2008(% ) (% )
Benin 65 78 57 75 84 69Burkina Faso 72 97 66 76 95 72Cape Verde 80 86 73 84 85 82Côte d’Ivoire 81 98 66 80 93 68The Gambia - - - 92 96 86Ghana 80 90 71 82 90 74Guinea 70 91 59 71 89 61Guinea Bissau 57 82 47 61 83 51Liberia 64 72 52 68 79 51Mali 60 86 48 56 81 44Niger 42 91 32 48 96 39Nigeria 47 65 30 58 75 42Senegal 77 93 65 69 92 52Sierra Leone 53 83 32 49 86 26Togo 59 86 40 60 87 41
Recent_economic_dvlp_interieur:Bal 06/02/2013 15:39 Page 88

Appendix 17: Gender Issues in West Africa
Source: African Development Bank, 2011
RECENT ECONOMIC AND SOCIAL DEVELOPMENTS IN WEST AFRICA AND PROSPECTS FOR 2012
89
Ratio of girls toboys in primary &secondary school
(%)
Ratio of literateyoung women to
men (% ages 15-24)
Women innational
parliament (% of total seats
Share of womenemployed in thenon agricultural
sector (%)
2001 2011 2001 2011 2001 2011 2001 2011
Benin 65.0 85.9- 43.0 68.9 6.0 10.8 5.9 13.6
Burkina Faso 70.2 86.2 34.7 56.9 8.1 16.4 16.0 32.1
Cape Verde 73.0 104.3 41.9 72.5 45.3 102.2 30.1 45.2
Côte d’Ivoire 69.3 97.6 73.6 84.6 6.0 28.9 8.9 21.6
The Gambia 81.6 92.6 65.4 85.9 2.0 10.0 14.3 32.1
Ghana 89.7 96.0 86.2 97.6 10.3 21.9 31.7 43.2
Guinea 62.5 78.1 - 79.5 9.0 18.5 24.5 38.9
GuineaBissau
65.8 73.9 52.5 79.1 9.0 15.4 25.2 46.2
Liberia 71.9 83.4 74.8 114.9 8.6 32.5 13.4 38.3
Mali 70.3 89.5 56.0 83.1 12.2 15.4 17.3 25.8
Niger 65.8 76.9 58.7 78.0 1.1 12.8 24.1 45.9
Nigeria 80.2 102.5 64.9 87.4 15.9 30.2 35.8 56.8
Senegal 81.9 109.5 52.8 75.7 12.0 24.9 37.9 40.4
Sierra Leone 54.0 78.4 51.6 71.8 9.0 13.6 12.0 25.8
Togo 50.2 69.6 76.0 89.3 0.7 11.3 41.0 64.2
Recent_economic_dvlp_interieur:Bal 06/02/2013 15:39 Page 89

Appendix 18: ICT Indicators in ECOWAS, 2010
Source: ITU, 2011
Appendix 19: Ranking of Countries by Major Indicators of DoingBusiness, 2011
RECENT ECONOMIC AND SOCIAL DEVELOPMENTS IN WEST AFRICA AND PROSPECTS FOR 2012
Land Lines(per 100 people)
Mobile TelephoneSubscribers
(per 100 people)
Internet Users(per 100 people)
2008 2009 2008 2009 2008 2009
Benin 1.39 1.4 43.17 56.3 2.01 2.2
Burkina Faso 0.85 1.1 17.91 20.9 0.98 0.8
Cape Verde 14.18 14.3 54.68 77.5 20.28 29.7
Côte d’Ivoire 1.71 1.3 50.22 63.3 3.17 4.6
The Gambia 3.06 2.9 73.01 84.0 7.14 7.6
Ghana 0.63 1.1 50.45 63.4 4.35 5.4
Guinea 0.49 0.2 25.46 55.7 0.88 0.9
Guinea Bissau 0.27 0.3 29.81 34.8 0.72 2.3
Liberia 0.06 0.1 21.06 21.3 0.58 0.5
Mali 0.57 0.6 22.38 28.8 0.86 1.9
Niger 0.17 0.4 11.90 17 0.57 0.8
Nigeria 0.87 0.9 41.70 47.2 7.28 28.4
Senegal 1.85 2.2 41.95 55.1 7.94 7.4
Sierra Leone Na 0.6 15.31 20.4 0.21 0.3
Togo 1.75 2.7 27.22 33.1 6.16 5.4
Country SB CP RP GC PI PT TB EC CB
Ghana 99 151 36 48 44 78 89 45 129
Cape Verde 120 89 104 152 132 100 55 38 183
Nigeria 110 167 179 89 59 134 146 97 99
Sierra Leone 61 166 169 128 28 159 136 144 149
The Gambia 115 80 121 138 173 176 87 67 121
Burkina Faso 119 77 118 152 147 148 175 108 100
90
Recent_economic_dvlp_interieur:Bal 06/02/2013 15:39 Page 90

Where: SB - Starting a Business; CP - Dealing with Construction Permit; RP - Registering Property; GC - GettingCredit; PI - Protecting Investors; PT - Paying Taxes; TB - Trading across Borders; EC - Enforcing Contract; CB -Closing a Business
Source: Transparency International, 2012
Appendix 20: Real GDP growth rates of ECOWAS Member States
Source: IMF, 2011
91
Country SB CP RP GC PI PT TB EC CB
Senegal 101 117 167 152 167 170 67 148 79
Mali 117 87 88 152 147 159 154 133 106
Liberia 64 135 176 138 147 84 136 166 148
Togo 169 152 158 152 147 157 93 151 84
Côte d’Ivoire 172 165 151 152 154 167 127 177 118
Benin 157 125 129 152 154 144 174 138 183
Niger 159 162 84 152 154 167 127 177 118
Guinea Bissau 183 103 175 152 132 133 117 139 123
Guinea 181 171 166 168 173 173 129 164 183
2009 2010 2011e 2012f 2013fAFRICA 2.5 4.5 4.8 5.3 5.6UEMOA● Benin 2.7 2.8 3.4 4.3 4.8● Burkina Faso 3.2 5.2 5.8 5.2 5.4● Côte d’Ivoire 3.8 3.0 -5.8 4.9 5.5● Guinea Bissau 3.0 3.5 4.8 4.7 5.0● Mali 4.5 4.5 5.4 5.1 5.9● Niger -0.9 7.5 6.0 8.5 6.8● Senegal 2.2 4.0 4.2 4.4 4.4● Togo 3.2 3.4 3.7 6.7 6.9WAMZ● The Gambia 4.6 5.5 5.3 5.4 5.8● Ghana 4.7 6.6 13.6 9.0 8.0● Guinea -0.3 1.9 4.3 4.5 5.0● Liberia 3.6 3.7 3.9 - -● Nigeria 6.7 7.9 7.0 7.1 7,4● Sierra Leone 3.2 5.0 5.6 44.0 13.0● Cape Verde 4.0 5.6 5.8 6.4 6.6
RECENT ECONOMIC AND SOCIAL DEVELOPMENTS IN WEST AFRICA AND PROSPECTS FOR 2012
Recent_economic_dvlp_interieur:Bal 06/02/2013 15:39 Page 91

Appendix 21: Convergence Criteria for the Economies of West Africa
RECENT ECONOMIC AND SOCIAL DEVELOPMENTS IN WEST AFRICA AND PROSPECTS FOR 2012
Recent_economic_dvlp_interieur:Bal 06/02/2013 15:39 Page 92

Recent_economic_dvlp_interieur:Bal 06/02/2013 15:39 Page 93

Recent_economic_dvlp_interieur:Bal 06/02/2013 15:39 Page 94

Recent_economic_dvlp_interieur:Bal 06/02/2013 15:39 Page 95

Printed in France,February, 2013
Registration of copyright: February, 2013
Recent_economic_dvlp_interieur:Bal 06/02/2013 15:39 Page 96

Recent_economic_dvlp_interieur:Bal 06/02/2013 15:39 Page 97

Recent_economic_dvlp_interieur:Bal 06/02/2013 15:39 Page 98

Recent_economic_dvlp_interieur:Bal 06/02/2013 15:39 Page 99

Recent_economic_dvlp_interieur:Bal 06/02/2013 15:39 Page 100

The year 2012 was characterized by an extremely uncertain global and subregional economicclimate, and a volatile political setting in West Africa. This raises the challenges for the calibration of a policy advice given the changing economic circumstances in the worldeconomy and their ever-shifting implications for West Africa. During the same year, andjust before the advent of military events in Mali and Guinea-Bissau, the West Africanregion was poised for economic consolidation. The speed with which the political falloutin those latter two countries is resolved will determine the depth of socio-economic progressin 2012 and beyond.
West Africa must diversify to address its economic vulnerabilities. Thus, to inoculate itselffrom trade shocks, the subregion must diversify the origins and destinations of its tradedgoods; and furthermore preserve possession of good governance that demands an ever acutevigilance. The global output growth slowed down in 2011 and recent forecasts for 2012 and2013 show anemic growth for different regions of the world due to the continuing economicfallout in the Euro zone. Given the interdependence of trade, financial and resource flow,the developing countries have not been immune from developed countries’ economic crisis,dimming the growth prospects for 2012 and beyond.
Concerning policy harmonization, some progress has been recorded. Mainly, some achie-vements are noted about women empowerment and gender equality, with several ECOWAScountries achieving some 20-30 per cent or more participation of women in parliament. Despite these strides, the African Union target of 50 per cent parliamentary representationby women is still out of sight.
The ECA sub regional office for West Africa (SRO-WA), based in Niamey (Niger),covers 15 countries, all member States of the ECOWAS. These member States servedby the SRO-WA are: Benin, Burkina Faso, Cape Verde, Côte d’Ivoire, the Gambia, Ghana,Guinea, Guinea Bissau, Liberia, Mali, Niger, Nigeria, Senegal, Sierra Leone and Togo.
The ECA/SRO-WA enables the Commission to translate its normative and analytical workinto operational activities at Sub Regional Office for West Africa level. The Office acti -vities are directed towards strengthening cooperation and sub-regional integration withinthe framework of NEPAD and internationally-agreed goals, including those set out in theMillennium Declaration. In addition, ECA/SRO-WA coordinates the position of membersStates on a broad spectrum of socio-economic development issues.
The Office also works in close partnership with Regional Economic Communities (RECs),particularly, the Economic Community of West African States (ECOWAS) and UEMOA(West African Economic and Monetary Union) as well as sectoral intergovernmental bodies,the private sector and civil society organizations.
ISBN: demande en cours-:HSMJPD=VVVVV]:
Recent_economic_dvlp_couverture:Uneca 07/02/2013 11:27 Page 1