recent economic and financial developments, and … · recent economic and financial developments,...
TRANSCRIPT

Takehiro Sato
Member of the Policy Board
Recent Economic and Financial Developments,
and Monetary Policy
Speech at a Meeting with Business Leaders in Oita
Bank of Japan
J u n e 5 , 2 0 1 4

1
I. Introduction
Thank you for giving me this opportunity to exchange views with people representing the
political, economic, and financial arena of Oita Prefecture. I would like to take this
opportunity to express my sincere gratitude for your cooperation with the activities of the
Bank of Japan's Oita Branch.
In today's speech, I will begin by focusing on economic and financial developments in
Japan and abroad, as well as the Bank's recent monetary policy. I will then touch briefly
on the economy of Oita Prefecture. Following my speech, I would like to hear your views
on actual conditions in the local economy and on the Bank's conduct of monetary policy.
II. Recent Economic and Financial Developments in Japan and Abroad
A. Developments in Japan's Economic Activity and Prices following the
Consumption Tax Hike
Regarding recent developments in Japan's economy, although statistics relating to
production and sales for April 2014 indicate a reactionary decline in domestic private
demand following the consumption tax hike, the economy seems to remain resilient as a
trend. It should be noted that (1) some sentiment indicators are weak, although this was
expected, and (2) a reactionary decline in demand following the front-loaded increase prior
to the tax hike is somewhat hard to gauge due to supply-side constraints. Let me follow up
on this latter point. In the automobile industry, for example, it is considered that a
production decrease as a whole caused by the decline in demand will come to a halt in the
July-September quarter of 2014. Nevertheless, according to anecdotal information, there
are some concerns about a possible decline in that quarter and thereafter, because
production for the April-June quarter is not expected to be much affected by the decline in
demand following the front-loaded increase, as backlog orders from the January-March
quarter had piled up due to supply-side constraints. This suggests that we need to remain
cautious about this decline in demand, although there are many views that recent
developments have generally been as expected. From a somewhat longer-term perspective,
I consider the critical point to be the extent to which positive effects on the employment and
income situation -- such as the recent rise in base pay -- will be able to offset negative
effects of the decline in real disposable income that is caused by the tax hike.

2
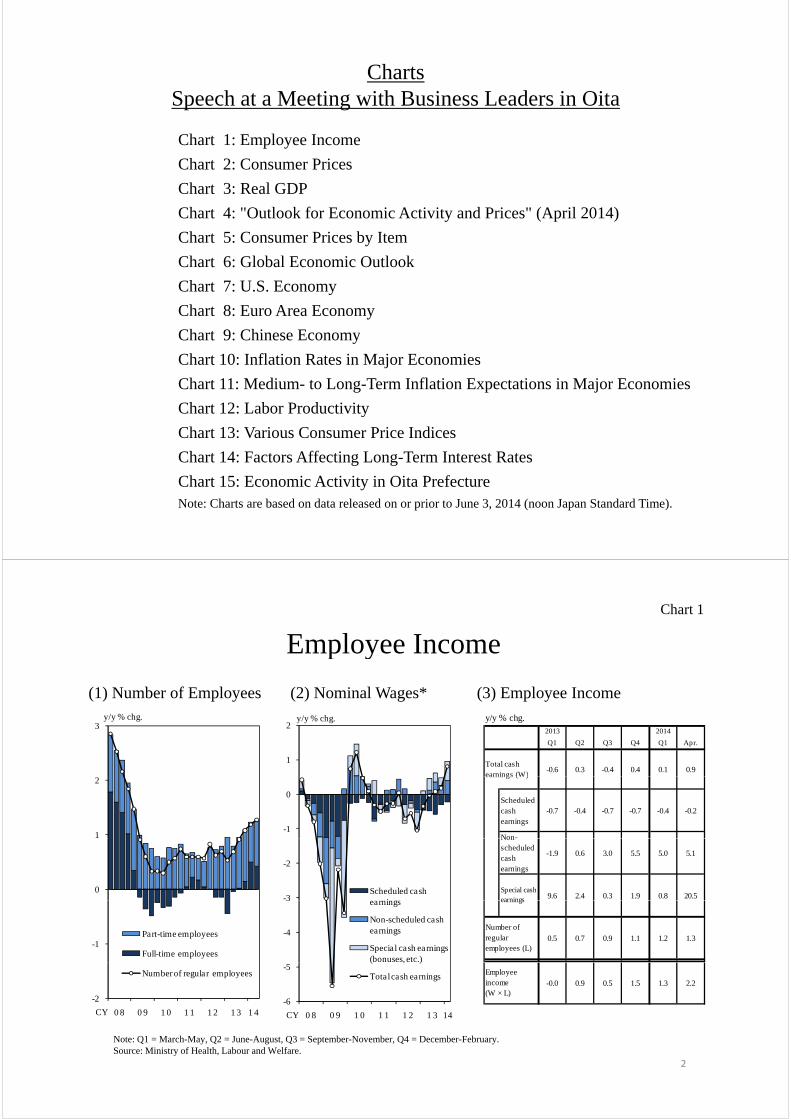
In this regard, the recent employee income situation can be understood as follows. On the
one hand, the rate of increase in nominal wages has remained weak at around 0 percent on a
year-on-year basis, given that scheduled cash earnings are depressed -- reflecting the recent
rise in the number of non-regular employees whose working hours are relatively short --
despite the increases in non-scheduled cash earnings and special cash earnings. On the
other hand, the total number of employees is boosted by the increase in non-regular
employees; consequently, nominal employee income -- which is calculated by multiplying
nominal wages by the number of employees -- has been increasing moderately at around 1
percent on a year-on-year basis (Chart 1). Considering that the recent movements toward
raising base pay will likely increase scheduled cash earnings from this summer, and that a
rise in base pay, should it be realized, will positively affect non-scheduled cash earnings and
special cash earnings, it is natural to think that nominal employee income will increase at a
somewhat accelerated pace. In my view, with this employment and income situation
acting as a tailwind, Japan's economy will remain resilient against the consumption tax
hike.
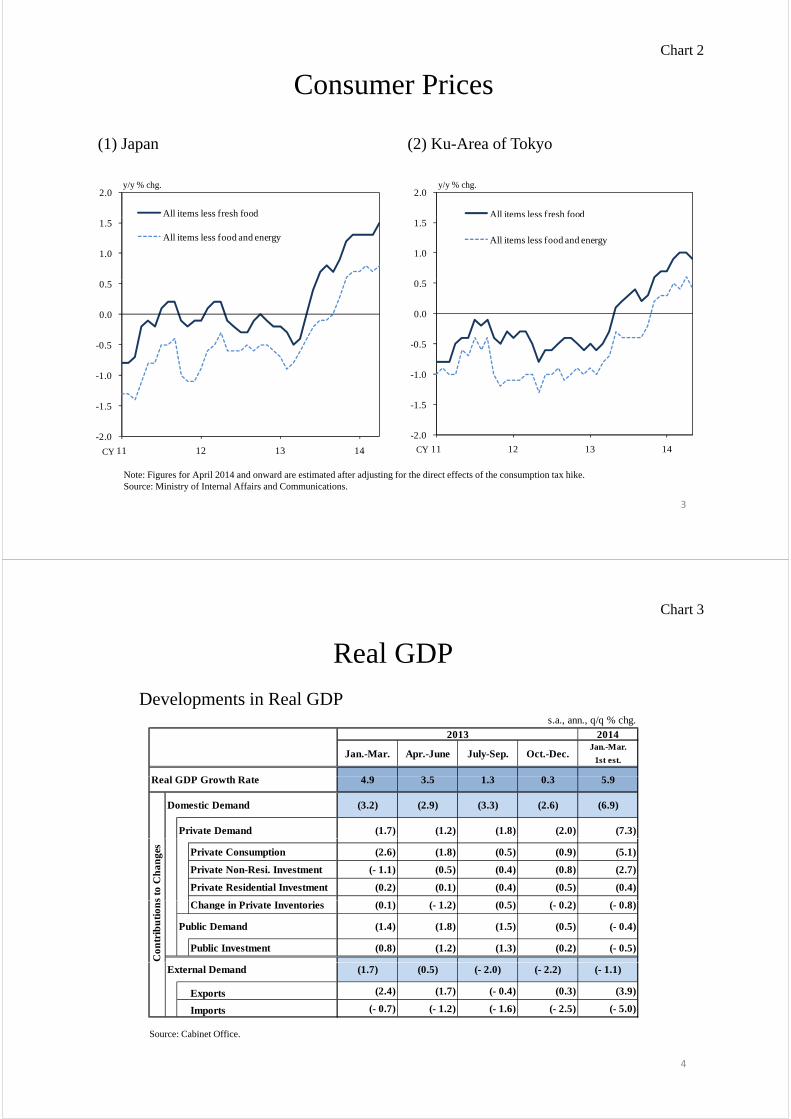
The consumer price index (CPI) figures since the consumption tax hike show that,
excluding the effects of the tax hike, the year-on-year rate of increase in the CPI for all
items less fresh food, or the core CPI, was generally around the previous month's level, and
this is also a supporting factor for the assessment of the underlying trend that I just
mentioned (Chart 2). Prior to the release of the CPI figures, there was a lot of conflicting
anecdotal information -- such as price hikes exceeding the rise in consumption tax and price
cuts through discount sales. It turned out, however, that the rise in consumption tax alone
has basically been passed on to consumers. From another perspective, consumer demand
can be regarded as having been resilient enough to accept the passing on of the rise in tax.
Japan's economy is expected to return to a moderate recovery trend from the summer, as the
subsequent decline in demand following the front-loaded increase wanes.
B. Understanding of Coexistence of the Weaker-than-Expected Economic Growth
Rate and Higher-than-Expected Prices
Japan's economy has decelerated from a high annual growth rate of around 4 percent in the
first half of 2013 to around 1 percent in the second half (Chart 3). This is partly due to

3
sluggish exports despite the yen's depreciation, but a significant increase in imports should
also be noted. Imports surged due to firm domestic demand as well as the front-loaded
increase in demand prior to the consumption tax hike, thereby pushing down the headline
GDP growth rate. However, focusing on domestic demand excluding net external demand,
the economy did not see much of a slowdown given that this demand kept growing at
around 3 percent on an annual basis throughout the calendar year. As GDP growth for the
second half of 2013 was weaker than expected, this will have a smaller carry-over effect on
GDP growth for fiscal 2014. Partly reflecting this technical factor, the median of the
Policy Board members' forecasts for 2014 presented in the April 2014 Outlook for
Economic Activity and Prices (hereafter the Outlook Report) was revised downward, and
there was also a downward revision to forecasts for fiscal 2013. However, the mechanism
of economic recovery will be maintained in a situation where exports recover and domestic
demand remains resilient as a trend (Chart 4). Regarding the April-June quarter of 2014,
the contribution of net external demand to GDP growth is expected to turn positive,
reflecting a decline in imports, and this will in turn act as a buffer against a decline in
domestic private demand. As I will describe shortly, recovery of overseas economies --
especially the U.S. economy, which is getting over the effects of the unusually severe winter
weather and has started to return to a recovery trend -- is expected to act as a tailwind for
Japan's economy.
In the meantime, the core CPI for fiscal 2013, which was revised upward from the median
of the Policy Board members' forecasts in the January 2014 interim assessment of the
Outlook Report, registered 0.8 percent on a year-on-year basis. The fundamental reason
behind this upward revision to prices despite the downward revision to the GDP growth rate
will be explained later. In what follows, I highlight the role of imports in this context.
One factor contributing to the rise in the CPI is a rise in energy prices stemming from the
yen's depreciation. However, it is also the case that the year-on-year rate of increase in the
CPI for all items less food and energy, or the core-core CPI, for April 2014 excluding the
effects of the consumption tax hike registered 0.8 percent, which shows that prices other
than those of energy have also been rising. In terms of price hikes for items other than

4
energy and related goods, I am focusing on the price changes in digital appliances (Chart
5).1
The CPI for digital appliances has risen by around 30 percentage points, from the range of
minus 22-23 percent for February 2012 to the range of 6-7 percent for February 2014 on a
year-on-year basis. This had an indispensable effect on the rise in the core-core CPI. As
the background to this, it can be pointed out that prices of digital appliances had fallen to
the bottom and fierce price competition in the household electrical appliances industry came
to an end. It should not be overlooked that the halt in the price decline of digital
appliances is attributable to the fact that prices of these products had become more
susceptible to the effects of the yen's depreciation with the increased import penetration
ratio. A decline in competitiveness and pricing power in the industry in Japan can be
pointed out as a reason behind such susceptibility. However, the CPI for digital appliances
became more or less flat on a year-on-year basis in the March-April period of 2014
excluding the effects of the consumption tax hike as the yen's depreciation paused, and the
core-core CPI for the Ku-area of Tokyo in May declined by 0.2 percentage point from the
previous month on the same basis. The effects of the halt to the yen's depreciation trend
on future developments in prices should be monitored carefully.
C. Overseas Economic and Financial Developments
As I just mentioned, Japan's economy is expected to continue growing at a pace above its
potential as a trend due to the ongoing firm domestic demand, while it will be affected by
the front-loaded increase and subsequent decline in demand prior to and after the
consumption tax hike. The probability of this scenario will be enhanced by the moderate
increase in exports led by the recovery of overseas economies, particularly advanced
economies. In this regard, recent developments in overseas economies will support
Japan's economy through exports; for example, the U.S. economy has been recovering
moderately, led by private demand, with the recovery becoming more widespread, and the
euro area economy is also recovering moderately (Chart 6).
1 Digital appliances refer to the following CPI items: TV sets, mobile audio players, electronic
dictionaries, video recorders, personal computers (desktop type), personal computers (note type), PC
printers, digital cameras, and video cameras.
5
With regard to the U.S. economy, the pace of recovery will accelerate gradually, mainly in
private consumption, as the improvement in households' balance sheets makes progress
supported by the ongoing recovery trend of housing prices as a whole, and as the effects of
fiscal drag fade. These positive effects will likely continue spreading to firms' production
activity, and thus the recovery trend of business fixed investment is likely to become more
evident (Chart 7). Of course, the Federal Reserve's (Fed's) policy developments and their
subsequent effects on global financial markets should be monitored as downside risks. In
this regard, the end in autumn 2014 to the Fed's asset purchase program has broadly been
incorporated into the markets at this point. In addition, the statement by the Federal Open
Market Committee (FOMC) has clarified the view that "it likely will be appropriate to
maintain the current target range for the federal funds rate for a considerable time after the
asset purchase program ends." My understanding is that the Fed will communicate
carefully with market participants in order to avoid bringing instability to financial markets.
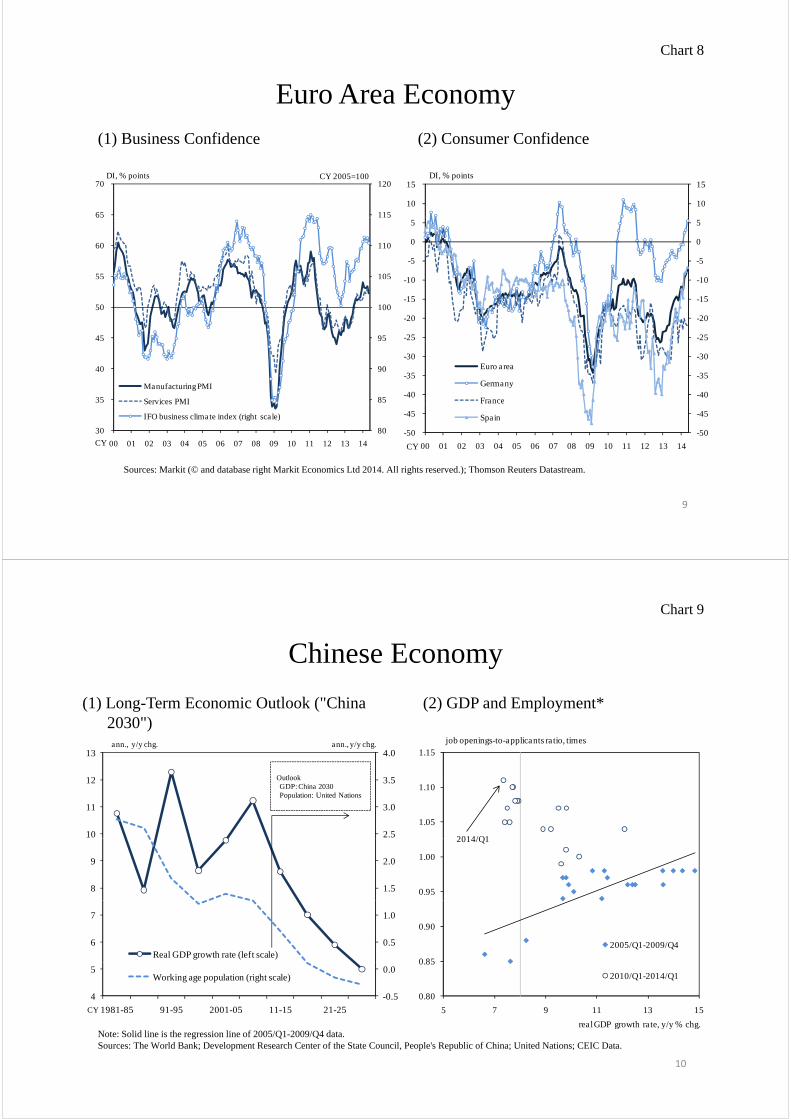
Regarding the euro area economy, there are various adjustment pressures associated with
the excess debt problems in the public and private sectors. However, the economy is
expected to continue recovering moderately supported by ongoing recovery in domestic
demand, reflecting improvement in various economic entities' sentiment (Chart 8).
As just described, advanced economies are likely to recover moderately, led by the U.S.
economy. Meanwhile, emerging and commodity-exporting economies will likely continue
to lack growth momentum for the time being, especially in those economies that are
restraining aggregate demand, such as by raising interest rates.
Looking at the Chinese economy, domestic demand is likely to continue facing downside
pressure amid ongoing progress in structural reforms. However, since the authorities have
formulated concrete policy measures to underpin economic activity and external demand is
expected to continue picking up, the economy is likely to maintain stable growth in general
at around the current pace.
From a somewhat longer-term perspective, however, there are concerns about the Chinese
economy due to factors such as demographic changes (Chart 9). Labor supply and

6
demand conditions seem to be tight, although the growth rate has fallen from double digits
to the range of 7-8 percent. This implies the possibility that China's potential growth rate
is declining considerably. While the authorities have set the growth target at around 7.5
percent, some of them have said that some downward deviation from 7.5 percent is within
the target range. It is better to take a conservative view that China's growth rate is likely to
be around 7.5 percent at its highest, despite the government's measures to underpin
economic activity.
D. Risks to Overseas Economies
The outlook for overseas economies that I have explained is subject to both upside and
downside risks. Geopolitical risks such as the recent situation in Ukraine should be
carefully monitored in the short run. In addition, I am personally concerned about the
possibility of a disinflationary trend and decline in potential growth rates in Europe and the
United States in the medium to long run (Chart 10).
The euro area in particular should be carefully monitored as the disinflationary trend might
be prolonged, mainly in peripheral countries. Several peripheral countries in particular are
expected to continue facing downward pressure on wages in order to retain competitiveness
under the appreciation of the euro, and the European Commission and the European Central
Bank (ECB) have revised down their inflation forecasts for both this year and the next.
Medium- to long-term inflation expectations both in Europe and the United States have
been stable at around 2 percent, which is one of the reasons why the policy authorities in the
euro area have taken the view that it will not enter stagnant deflation like Japan (Chart 11).
However, Japan's experience suggests the possibility that low inflation continuing for a long
time changed people's inflation expectations in a backward-looking manner, and thus
medium- to long-term inflation expectations also lowered adaptively. In fact, as the
disinflationary trend continues, short- and medium-term inflation expectations by economic
entities and the markets have already started to decline somewhat in the euro area as well.
If the stability in medium- to long-term inflation expectations is undermined, various policy
actions are expected to be taken. The ECB has already revealed its policy stance that it

7
will not hesitate to make use of unconventional measures to address the risk of prolonged
disinflation, and I therefore am keeping a watchful eye on its future conduct of monetary
policy. It should also continue to be noted that the financial system is still somewhat
fragile in the euro area.
In the United States, deflationary concerns have not been observed so far, and instead
short-term inflation expectations in the private sector have been revised upward. However,
the inflation rate has recently been lower than the Fed's forecast, partly reflecting the stable
energy prices brought about by the shale revolution. Therefore, I feel it necessary to take
into account the risk that the inflation rate will remain lower than the optimal level from a
somewhat longer-term perspective.
It also should be noted that an argument that raises concerns about secular stagnation of the
global economy has attracted somewhat more attention. Lawrence Summers, for example,
has argued that there is a possibility that the level of equilibrium real interest rate -- or, the
natural rate of interest -- that is consistent with full employment has declined to the range of
minus 2-3 percent in the United States since the late 2000s, as there has not been excess
demand in the economy before and after the financial crisis, and because prices have been
stable, with the actual GDP rate continuing to be far below the potential one.2 The
argument regarding secular stagnation after the crisis seems reasonable, considering the
experience in Japan -- namely, that it continued to be difficult to boost demand, in part
reflecting the financial crisis in the late 1990s and demographic changes since the 2000s.
Paul Krugman previously noted that Japan's equilibrium real interest rate had temporarily
declined to around minus 4 percent.3 What is new about the arguments of Summers is that
the equilibrium real interest rate has been declining for a long time, not temporarily, on a
global scale, against the background of, for example, excess savings in countries with a
current account surplus and the decrease in the nominal investment amount arising from
declining capital goods prices.
2 For details, please view Lawrence Summers' recorded remarks at the Fourteenth Jacques Polak
Annual Research Conference held by the IMF in November 2013
(http://www.imf.org/external/np/res/seminars/2013/arc/index.htm). 3 See Paul Krugman, "It's Baaack: Japan's Slump and the Return of the Liquidity Trap," Brookings
Papers on Economic Activity 2, 1998, pp.137-205.

8
Leaving aside the question of whether the equilibrium real interest rate has actually been
declining in negative territory for a long time, it seems plausible that growth momentum in
the global economy has declined somewhat more than in a typical cyclical pattern,
reflecting the prolonged downturn in demand, the deceleration in labor input, and the
slowdown in technological innovation. As a background to this, for example, the forecast
for global growth by the International Monetary Fund (IMF) has been consistently revised
down, and growth rates in emerging economies are far lower than those before the Lehman
shock. Assuming that the equilibrium real interest rate has declined due in part to the
slowdown in the potential growth rate, and that weak growth in demand has started to
become chronic in this situation, it becomes easier to understand the current disinflationary
trend in advanced economies and the downward trend in inflation rates in emerging
economies.
However, we should avoid making a hasty conclusion. It is not easy to grasp the situation
of the potential growth rate and the slack in the economy.4 There are various arguments
over whether the decline in the inflation rate is solely attributable to a cyclical factor or is
rooted in a structural one, as described earlier. It also is often difficult to distinguish a
cyclical factor from a structural one. If the potential inflation rate has not declined much,
the current disinflationary trend could simply reflect the slack in capital stock and in the
labor market, and it is possible that disinflationary pressure will ease as the slack dissipates.
As just described, the inflation outlook and its implication for macroeconomic policy could
change depending on how to understand the current potential growth rate. Thus, I will
continue to carefully monitor this matter.
III. The Conduct of Monetary Policy for the Immediate Future
A. Interim Review on Quantitative and Qualitative Monetary Easing
Fourteen months have passed since the Bank introduced quantitative and qualitative
4 There are many earlier studies on uncertainties regarding estimation of potential growth rates and
slack in the economy. See, for example, Athanasios Orphanides, "Monetary Policy Rules Based on
Real-Time Data," American Economic Review, 91 (4), 2001, pp. 964-985. For examples of such
estimation in Japan and the United States, see, respectively, Takuji Fueki et al., "Measuring Potential
Growth in Japan: Some Practical Caveats," Bank of Japan Review Series, No. 2010-E-1, 2010, and
Mitsuhiro Osada et al., "Beikoku no Roudou Shijyou no Surakku nitsuite (The Slack in U.S. Labor
Markets)," Bank of Japan Review Series, No. 2014-J-2, 2014 (available in Japanese).

9
monetary easing (QQE) in April 2013. Looking at economic and price developments over
this period, as mentioned earlier, economic growth has turned out to be somewhat lower
than the Bank's projection, due to developments in exports and imports, and prices have
been higher than projected. Economic and price developments so far have been in line
with the Bank's projection on the whole. Thus, the Bank summarized in the April 2014
Outlook Report that QQE has been exerting its intended effects. The Bank's Policy Board
has judged it appropriate to steadily pursue QQE under its current guidelines.
However, although prices are higher than projected, the transmission mechanism of QQE,
such as progress in the so-called portfolio rebalancing and a rise in medium- to long-term
inflation expectations, has not yet been observed to the extent the Bank initially intended.
Of course, I have no intention of denying that the mechanism is working. In fact, some
marginal changes have been observed; for example, financial institutions are gradually
taking a more active risk-taking stance. However, the current price hike seems to be
affected not only by the yen's depreciation and the rise in energy prices but also by the fact
that the economy -- mainly on the employment front -- is starting to reach the upper limit of
supply capacity sooner than expected, as the economic recovery is led mainly by
nonmanufacturing, for which labor productivity is lower than that in manufacturing. In
what follows, I explain this matter.
B. Mechanism of Price Hikes
In the April 2014 Outlook Report, the mechanism of price hikes is explained as follows: the
output gap, which shows the utilization of labor and capital, has been improving mainly on
the labor front, reflecting firm domestic demand, which tends to have large stimulative
effects on employment, and it appears to have reached around the past long-term average of
about zero; in this situation, upward pressure on wages and prices due to the tightening of
supply and demand conditions is likely to steadily increase. Actually, the bottleneck
caused by the labor shortage can be observed widely, and its effects are reflected in the
hourly pay of non-regular employees such as part-time workers. The effects of wage hikes
easily penetrate prices, particularly in the services sector -- which is relatively labor
intensive -- and such effects seem to have already appeared in services prices, such as for
meals outside the home (Chart 5).
10
Let me note that there are various approaches to estimating the output gap, and estimates
are subject to a margin of error. However, in light of the overall macroeconomic
information -- such as tightness of the current labor conditions and the reduction in excess
production capacity shown in the March 2014 Tankan (Short-Term Economic Survey of
Enterprises in Japan) -- it could be considered that the output gap, regardless of whether it
has or has not reached about zero, has already narrowed to a considerable degree. This
narrowing seems to be affecting prices to some extent. Nevertheless, it should be noted
that this situation seems to reflect not only the demand-side pick-up but also supply-side
constraints, and therefore attention needs to be paid to the possibility that the mechanism of
economic and price recovery could be different from what the Bank initially aimed for.
In other words, it is possible that the potential growth rate of Japan's economy has declined,
especially after the Lehman shock. This is because manufacturers' stagnant fixed
investment in Japan led to a slowdown in accumulation of capital stock, which in turn
decreased labor productivity. Tight labor conditions, due to the recovery led mainly by
nonmanufacturing, seem to be affected by lower labor productivity in nonmanufacturing
compared to manufacturing (Chart 12).
It is true that wage increases induced by tight labor conditions are a profit-squeezing factor
and thus not preferable for firms. If corporate profits are constrained by labor costs,
business fixed investment will be restricted and stock prices will be affected, and
consequently wage hikes will not be sustainable. It is desirable to see wage increases that
are in line with growth in labor productivity. In this regard, in achieving sustainable wage
increases, it is indispensable to have a boost in labor productivity in nonmanufacturing,
such as through investment aimed at labor saving. If such efforts toward improvement in
labor productivity in nonmanufacturing feed back into manufacturing and a virtuous cycle
in the overall economy is generated, the growth potential will be raised, thereby enhancing
the probability of achieving the price stability target of 2 percent in the medium to long term.
Currently, in my view, people's perception of labor conditions is tighter than what is
suggested by statistics, as labor shortages are being reported widely. It can be considered
that Japan's economy is at a critical point in terms of whether its growth will slow due to

11
supply-side constraints or it steps up to a new stage of growth by leveraging such
constraints as a driving force to further improve its labor productivity.
C. Importance of Flexibility in the Conduct of Monetary Policy
When the price stability target was introduced in January 2013, the Bank clearly stipulated
that the conduct of monetary policy has to be flexible by examining various risk factors,
including those related to financial imbalances, in addition to the assessment of current
developments and outlook for economic activity and prices, from the perspective of
achieving sustainable growth with price stability.
The importance of flexibility in monetary policy is what I have been focusing on to date.
Monetary policy requires long and variable time lags before its effects permeate the
economy, and thereafter prices. Therefore, to achieve a sustainable growth path in the
context of price stability, monetary policy needs to be flexible, taking into account future
prospects. In other words, the Bank examines the current conditions and the outlook for
economic activity and prices, and also analyzes various risk factors including the
accumulation of financial imbalances.
In addition, the Bank clearly commits to continuing with QQE, aiming to achieve the price
stability target of 2 percent, as long as it is necessary for maintaining that target in a stable
manner. In my understanding, the timeframe for "maintaining that target in a stable
manner" should be assessed on a forecast basis.
In this regard, the price stability target is by no means a rigid and superficial framework that
simply aims to raise the inflation rate to reach 2 percent temporarily. Rather, it is a flexible
and practical framework that accommodates the needs arising from economic
developments.
As described in the minutes of the Monetary Policy Meeting held on April 30, 2014, my
own view on the outlook for prices is somewhat more cautious than the majority view of the
Bank's Policy Board members. However, this does not mean that I am skeptical of QQE's
effects, nor does it mean that I deny the effectiveness of the QQE's transmission mechanism.

12
My understanding is that the price stability target is not a framework that calls for the
inflation rate to reach 2 percent with surgical precision, but rather that it represents a
flexible policy framework in which some degree of latitude -- both upside and downside --
should be accommodated. Based on this understanding, I see some flexibility with regard
to the achievement of the 2 percent price stability target.
On this point, what the price stability target aims to achieve is not a situation in which only
prices will rise. Rather, it aims to achieve an environment in which the improvement of
the overall economy results in higher wages and then higher prices in a well-balanced
manner. It is necessary to avoid any misunderstanding that the Bank has been solely
pursuing a pick-up in prices without due attention to the economy.
Let me turn to price indicators that are referred to in assessing the achievement of the price
stability target. It is sometimes misunderstood that the degree of such achievement is
merely assessed by using the core CPI, given that forecasts of the Policy Board members
are made in terms of the CPI on this basis. In fact, the price stability target is set based on
the CPI for all items, not the core CPI. However, this does not mean that the degree of
achievement of the target is assessed only by using the CPI for all items.
To evaluate price developments, it is necessary to appropriately understand the underlying
trend of price changes by excluding temporary destabilizing factors. In doing so, the
indicator that appropriately assesses price developments depends on each country's
economic structure. The Bank puts emphasis on the core CPI that excludes fresh food,
which fluctuates largely due to such factors as the weather. This CPI is used for Policy
Board members' forecasts in the Outlook Report. To understand the underlying trend in
prices, however, a wide range of indicators should be monitored carefully while fully taking
into account characteristics of each indicator. Such indicators include not only the CPI for
all items, the core CPI, and the core-core CPI, but also the CPI for all items less imputed
rents -- which represents a concept similar to the cost of living -- as well as those relating to
wages. It is important to note that monetary policy is not tied to specific indicators (Chart
13).

13
D. Developments in Long-Term Interest Rates
Next, I would like to talk about developments in long-term interest rates. Market
participants' price outlook has been lower than the Bank's baseline scenario to date, and as a
matter of fact, long-term interest rates have been stable at low levels partly due to asset
purchases by the Bank. Future developments in long-term interest rates depend on market
participants' economic and price outlook, but I am paying close attention to whether the
price situation and nominal long-term interest rates will develop in a consistent manner in a
situation where the rate of increase in the core CPI excluding the effects of the consumption
tax hike has been around 1¼ percent on a year-on-year basis for six consecutive months.
Here, let me recap how QQE will work on nominal long-term interest rates through its
transmission mechanism. Nominal long-term interest rates combine two elements: one is
the average of future short-term rates and the other is premiums (Chart 14). Based on this
understanding, the Bank has specified its forward guidance -- namely, that it will continue
with the QQE, aiming to achieve the price stability target, as long as it is necessary for
maintaining that target in a stable manner. This in effect will exert downward pressure on
the average of expected future short-term rates. In addition, premiums will be prevented
from widening through the Bank's massive purchases of JGBs with relatively longer
maturities. However, under such unconventional policy, nominal interest rates are likely to
face upward pressure as the effects of the policy start to appear, preceding the improvement
in the economy and prices. Referring to the elements that I have just explained, expected
future short-term rates are likely to rise if market participants judge that an exit from current
easing policy is at hand.
In the case of a rise in nominal long-term interest rates, even when a central bank increases
its purchases of government bonds, or otherwise is put under pressure to increase such
purchases, in order to suppress the government's borrowing costs, the premiums might
possibly rise if it is judged by market participants that the central bank's purchases will
weaken fiscal discipline. This is because, when the level of long-term interest rates is
formulated, it is the market's judgment that matters rather than a central bank's intention.
These arguments are hypothetical and can be regarded as simply the result of brain storming

14
at this point. However, as the economy heads toward overcoming deflation, the effects
will start to spread to long-term interest rates. At that point, the Bank's monetary policy,
including the process through which it will eventually exit from the current easing policy,
should not be decided by giving consideration to fiscal sustainability, but instead be decided
solely from the standpoint of achieving the 2 percent price stability target. In that sense, I
would like to reemphasize that the government's commitment to medium- to long-term
fiscal consolidation plays an important role in ensuring the ultimate success of QQE.
IV. Concluding Remarks: Economic Activity in Oita Prefecture
Economic activity in Oita Prefecture is somewhat more sluggish than that in Japan as a
whole, which has been showing clear recovery. The share of manufacturing in this
prefecture is larger than that in the country overall. Electronic parts and devices -- which
face a decline in orders due to increased competition with foreign manufacturers and to
sluggish sales of final products -- account for a large share of manufacturing in the
prefecture. Accordingly, the industrial production index for this prefecture has been below
that for the whole country as a trend, albeit with some fluctuations due to the front-loaded
increase in demand prior to the consumption tax hike (Chart 15). Considering that Japan's
current economic recovery is characterized as being led mainly by nonmanufacturing, the
large share of manufacturing in the prefecture's industrial structure might be the reason for
the sluggish recovery compared with that of the country as a whole.
It also should be noted that positive developments have been spreading. Anecdotal
information suggests that, although private consumption -- mainly apparel, high-end goods,
furniture, and household electrical appliances -- has been affected by the reactionary decline
in demand following the front-loaded increase prior to the consumption tax hike, the decline
is not significant despite a larger-than-expected front-loaded increase in demand. Private
consumption is therefore likely to remain resilient in a situation where labor supply and
demand conditions continue to improve. Business fixed investment will likely expand
significantly in nonmanufacturing, due, for example, to new construction of large
distribution sites and to an extensive renovation of a new commercial complex, which will
open at Kyushu Railway Company's Oita Station. Such investment is also scheduled to
start increasing in manufacturing owing to positive developments such as the establishment

15
of new production lines for some new products, in addition to a rebound from the decline
observed in fiscal 2013.
From the medium- to long-term perspective, it is encouraging that the private and public
sectors are making joint efforts that make the most of regional characteristics. I would like
to give two examples. First, joint efforts have been made in the field of renewable energy.
Oita Prefecture is a frontrunner in Japan in this field, being ranked first in terms of the
self-sufficiency rate of such energy and taking second place in terms of the supply amount.
After the Great East Japan Earthquake, entry into the power generation business using
renewable energy sources in the prefecture has become active, due in part to the
introduction of the country's feed-in tariff scheme for renewable energy. In particular,
geothermal power generation business is very active in Oita Prefecture, which is rich in hot
spring sources and daily inflow of water, both of which rank number one in Japan.
Substantial support for this power generation business is available; for example, the
prefectural government and the private sector have jointly established a fund to encourage
firms to start such business by utilizing the heat of hot springs. Second, joint efforts have
also been made in the field of tourism. Oita Prefecture is rich in tourism resources,
including some of the most popular hot spring sites in Japan, such as Beppu and Yufuin.
With a view to taking advantage of such resources, the prefecture formulated the "Tourism
Strategies" in 2012 and is actively doing promotion both in Japan and abroad under the
slogan "'OITA' The Best Onsen (Hot Spring) Area in Japan." In addition, there have been
events such as the start of operation in October 2013 of the super luxury sleeper cruise train
called the Seven Stars in Kyushu, or Nanatsuboshi, and the extension of the
Higashi-Kyushu Expressway in fiscal 2014. These will likely promote an increase in the
number of visitors. I hope the economic activity in Oita Prefecture will become more
active through these various joint efforts of the private and public sectors.
ChartsS h t M ti ith B i L d i OitSpeech at a Meeting with Business Leaders in Oita
Chart 1: Employee Income
Chart 2: Consumer Prices
Chart 3: Real GDP
Chart 4: "Outlook for Economic Activity and Prices" (April 2014)Chart 4: Outlook for Economic Activity and Prices (April 2014)
Chart 5: Consumer Prices by Item
Chart 6: Global Economic Outlook
Chart 7: U.S. Economy
Chart 8: Euro Area Economy
Chart 9: Chinese Economyy
Chart 10: Inflation Rates in Major Economies
Chart 11: Medium- to Long-Term Inflation Expectations in Major Economies
Ch 12 L b P d i iChart 12: Labor Productivity
Chart 13: Various Consumer Price Indices
Chart 14: Factors Affecting Long-Term Interest Ratesg g
Chart 15: Economic Activity in Oita PrefectureNote: Charts are based on data released on or prior to June 3, 2014 (noon Japan Standard Time).
Employee IncomeChart 1
/ % h
Employee Income
(1) Number of Employees (2) Nominal Wages* (3) Employee Income/ % h
3y/y % chg.
1
2y/y % chg. y/y % chg.
2013 2014
Q1 Q2 Q3 Q4 Q1 Apr.
-0.6 0.3 -0.4 0.4 0.1 0.9Total cashearnings (W)
1
2
-1
0Scheduledcashearnings
-0.7 -0.4 -0.7 -0.7 -0.4 -0.2
Non-
earnings (W)
0-3
-2
Scheduled cash i
Nonscheduledcashearnings
-1.9 0.6 3.0 5.5 5.0 5.1
Special cashearnings 9.6 2.4 0.3 1.9 0.8 20.5
-1Part-time employees
Full-time employees
-4
3 earnings
Non-scheduled cash earnings
Special cash earnings (bonuses, etc.)
earnings
0.5 0.7 0.9 1.1 1.2 1.3
Number ofregularemployees (L)
-2
0 8 0 9 1 0 1 1 1 2 1 3 1 4
Number of regular employees
CY-6
-5
0 8 0 9 1 0 1 1 1 2 1 3 14
( , )
Total cash earnings
CY
-0.0 0.9 0.5 1.5 1.3 2.2Employeeincome(W × L)
2
Note: Q1 = March-May, Q2 = June-August, Q3 = September-November, Q4 = December-February.Source: Ministry of Health, Labour and Welfare.
Consumer PricesChart 2
Consumer Prices
(2) Ku-Area of Tokyo(1) Japan
2.0
All items less fresh food
y/y % chg.2.0
All items less fresh food
y/y % chg.
1.0
1.5
All items less food and energy
1.0
1.5
All items less food and energy
0 5
0.0
0.5
0.0
0.5
1 5
-1.0
-0.5
1 5
-1.0
-0.5
-2.0
-1.5
11 12 13 14CY-2.0
-1.5
11 12 13 14CY
Note: Figures for April 2014 and onward are estimated after adjusting for the direct effects of the consumption tax hike.Source: Ministry of Internal Affairs and Communications.
3
Real GDP
Chart 3
Real GDP
Developments in Real GDPs.a., ann., q/q % chg.
2014Jan.-Mar.
1st est.
R l GDP G th R t 4 9 3 5 1 3 0 3 5 9
2013
Jan.-Mar. Apr.-June July-Sep. Oct.-Dec.
Real GDP Growth Rate 4.9 3.5 1.3 0.3 5.9
Domestic Demand (3.2) (2.9) (3.3) (2.6) (6.9)
Private Demand (1.7) (1.2) (1.8) (2.0) (7.3)
Private Consumption (2.6) (1.8) (0.5) (0.9) (5.1)
Private Non-Resi. Investment (- 1.1) (0.5) (0.4) (0.8) (2.7)
Private Residential Investment (0.2) (0.1) (0.4) (0.5) (0.4)
s to
Ch
ange
s
Change in Private Inventories (0.1) (- 1.2) (0.5) (- 0.2) (- 0.8)
Public Demand (1.4) (1.8) (1.5) (0.5) (- 0.4)
Public Investment (0.8) (1.2) (1.3) (0.2) (- 0.5)
Con
trib
uti
ons
External Demand (1.7) (0.5) (- 2.0) (- 2.2) (- 1.1)
Exports (2.4) (1.7) (- 0.4) (0.3) (3.9)
Imports (- 0.7) (- 1.2) (- 1.6) (- 2.5) (- 5.0)
Source: Cabinet Office.
4

"Outlook for Economic Activity and Prices" Chart 4
(April 2014)Forecasts of the Majority of Policy Board Members
y/y % chg.
Excluding the effects of theconsumption tax hikes
Real GDPCPI (all items less
fresh food)
+2.2 to +2.3
[+2.2]
+2.5 to +2.9 +0.7 to +0.9
[+2 7] [+0 7]
+0.8
Forecasts made in
January 2014
Fiscal 2013
[+2.7] [+0.7]
+0.8 to +1.3 +3.0 to +3.5 +1.0 to +1.5
[+1.1] [+3.3] [+1.3]
+0.9 to +1.5 +2.9 to +3.6 +0.9 to +1.6Forecasts made in
January 2014
Fiscal 2014
0.9 to 1.5 2.9 to 3.6 0.9 to 1.6
[+1.4] [+3.3] [+1.3]
+1.2 to +1.5 +1.9 to +2.8 +1.2 to +2.1
[+1.5] [+2.6] [+1.9]
Forecasts made in January 2014
Fiscal 2015
+1.2 to +1.8 +1.7 to +2.9 +1.0 to +2.2
[+1.5] [+2.6] [+1.9]
+1.0 to +1.5 +2.0 to +3.0 +1.3 to +2.3Fiscal 2016
Forecasts made in January 2014
[+1.3] [+2.8] [+2.1]Fiscal 2016
Note: Figures in brackets indicate the median of the Policy Board members' forecasts (point estimates).Source: Bank of Japan. 5
Consumer Prices by ItemChart 5
Consumer Prices by Item
(1) Energy (2) Digital Appliances (3) Meals Outside the Home
0 8
1.0
Meals outside the home
y/y % chg.
5.0
10.0
Digital appliances
y/y % chg.
9.0
10.0
Energy
y/y % chg.
0.6
0.8
-5.0
0.0
6 0
7.0
8.0
0.4
-15.0
-10.0
4.0
5.0
6.0
0.0
0.2
30 0
-25.0
-20.0
2.0
3.0
-0.2
12 13 14CY
-35.0
-30.0
12 13 14CY
0.0
1.0
12 13 14CY
Notes: 1. Figures for April 2014 and onward are estimated after adjusting for the direct effects of the consumption tax hike.2. Prices of digital appliances refer to those of the following CPI items: TV sets, mobile audio players, electronic dictionaries, video
recorders, personal computers (desktop type), personal computers (note type), PC printers, digital cameras, and video cameras.Source: Ministry of Internal Affairs and Communications. 6

Global Economic Outlook
Chart 6
Global Economic Outlook
IMF Projections (as of April 2014)
2014 2015projection projection
3.6 3.9( 0 1) ( 0 1)
CY
World 3.2 3.0
real GDP growh rate, y/y % chg.
2012 2013
(-0.1) (-0.1)2.2 2.3
(0.0) (0.0)2.8 3.0
(0.0) (0.0)1 2 1 5
Advanced economies 1.4 1.3
United States 2.8 1.9
1.2 1.5(0.1) (0.1)1.4 1.0
(-0.3) (0.0)4.9 5.3Emerging market and developing
5 0 4 7
Euro area -0.7 -0.5
Japan 1.4 1.5
(-0.2) (-0.1)6.7 6.8
(0.0) (0.0)7.5 7.3
(0.0) (0.0)China 7.7 7.7
economies 5.0 4.7
Developing Asia 6.7 6.5
( ) ( )4.9 5.4
(-0.2) (-0.2)2.5 3.0
(-0.4) (-0.3)Latin America and the Caribbean 3.1 2.7
ASEAN 6.2 5.2
Notes: 1. Figures are calculated using GDP based on purchasing power parity (PPP) shares of the world total from the International Monetary Fund.
2. Figures in parentheses are the difference from the January 2014 World Economic Outlook .Source: International Monetary Fund.
7
U S Economy
Chart 7
U.S. Economy
(2) Households' Balance Sheet(1) Fiscal Balance*
83tril. U.S. dollar
40001600
CBO Projections
U.S. bil. dollar U.S. bil. dollar15
increase and decrease from the peak (2007/Q3), tril. U.S. dollar
68
73
78 Net assets of U.S. households
3000
3500
800
1200
CBO Projections
0
5
10
58
63
68
2500
3000
0
400
-10
-5
0
43
48
53
1500
2000
1200
-800
-400
Fiscal balance
Expenditure (right scale) 25
-20
-15
Other assets and liabilities (right scale)Stocks including pension funds (right scale)Real estate (right scale)
38
43
02 04 06 08 10 12CY
1000-1600
-1200
01 03 05 07 09 11 13 15
p ( g )
Revenue (right scale)
FY
-30
-25
07 08 09 10 11 12 13
Real estate (right scale)Net assets (right scale)
Note: Congressional Budget Office (CBO) Projections are as of April 2014. Accounting year basis (from October of previous year to September of current year).
Sources: Congressional Budget Office; Haver Analytics. 8
Euro Area Economy
Chart 8
Euro Area Economy(1) Business Confidence (2) Consumer Confidence
115
120
65
70 DI, % points CY 2005=100
10
15
10
15 DI, % points
105
110
115
55
60
65
10
-5
0
5
10
-5
0
5
95
100
45
50
-25
-20
-15
-10
-25
-20
-15
-10
85
90
35
40
Manufacturing PMI
Services PMI-40
-35
-30
-40
-35
-30 Euro area
Germany
France
80 30
00 01 02 03 04 05 06 07 08 09 10 11 12 13 14
Services PMI
IFO business climate index (right scale)
CY-50
-45
-50
-45
00 01 02 03 04 05 06 07 08 09 10 11 12 13 14
France
Spain
CY
Sources: Markit (© and database right Markit Economics Ltd 2014. All rights reserved.); Thomson Reuters Datastream.
9
Chinese Economy
Chart 9
Chinese Economy
(2) GDP and Employment*(1) Long-Term Economic Outlook ("China
1.15job openings-to-applicants ratio, times
2030")
4.013
O tlook
ann., y/y chg. ann., y/y chg.
1.05
1.10
2014/Q12.5
3.0
3.5
10
11
12 OutlookGDP: China 2030Population: United Nations
0.95
1.00
2014/Q1
1.5
2.0
8
9
0 85
0.90
2005/Q1-2009/Q40.5
1.0
6
7
Real GDP growth rate (left scale)
0.80
0.85
5 7 9 11 13 15
2010/Q1-2014/Q1
realGDP growth rate y/y % chg
-0.5
0.0
4
5
1981-85 91-95 2001-05 11-15 21-25
Working age population (right scale)
CY
real GDP growth rate, y/y % chg.
10
Note: Solid line is the regression line of 2005/Q1-2009/Q4 data.Sources: The World Bank; Development Research Center of the State Council, People's Republic of China; United Nations; CEIC Data.

Inflation Rates in Major Economies
Chart 10
Inflation Rates in Major Economies
CPI Inflation Rates in Japan, the United States, and the Euro Area
2 5
3.0
3.5 Japan
United States
Euro area
y/y % chg.
1.5
2.0
2.5
0.0
0.5
1.0
-1.5
-1.0
-0.5
-2.0
00 01 02 03 04 05 06 07 08 09 10 11 12 13 14CY
Notes: 1. Figures for the United States include all items excluding food and energy. Figures for the euro area includeall items excluding energy and unprocessed food Figures for Japan include all items less food and energyall items excluding energy and unprocessed food. Figures for Japan include all items less food and energy
(alcoholic beverages are excluded from food).2. Figures for Japan for April 2014 and onward are estimated after adjusting for the direct effects of the
consumption tax hike. Sources: Ministry of Internal Affairs and Communications; Eurostat; Bloomberg. 11
Medium- to Long-Term Inflation Expectations in Chart 11
Major EconomiesCPI Projections for 6-10 Years Ahead <Consensus Forecasts>
4.5
5.0
Japan
United States
y/y % chg.
3 0
3.5
4.0 Euro area
2.0
2.5
3.0
1.0
1.5
0.0
0.5
90 92 94 96 98 00 02 04 06 08 10 12 14CY
Note: Survey is conducted every April and October.Source: Consensus Economics Inc.
12

Labor ProductivityChart 12
Labor Productivity
Labor Productivity of Manufacturing and Nonmanufacturing
8.5
9.0mil. yen
7.5
8.0
6.5
7.0
All industries
5 5
6.0
All industries
Manufacuturing
Nonmanufacturing
5.0
5.5
90 95 00 05 10 12FY
Notes: 1. Labor productivity = (value added / number of employees ) × 1002. All industries and nonmanufacturing exclude Finance and Insurance.
Source: Ministry of Finance.13
Various Consumer Price IndicesChart 13
y/y % chg.
Various Consumer Price IndicesVarious CPI Inflation Rates in Japan
2.0
2.5
3.0 All items
All items less fresh food
All items less food and energy
All items less imputed rent
0.5
1.0
1.5 Laspeyres chain index, all items less fresh food
10 percent trimmed mean, all items
-1.0
-0.5
0.0
-2.5
-2.0
-1.5
-3.0
06 07 08 09 10 11 12 13 14CYNotes: 1. Figures for April 2014 and onward are estimated after adjusting for the direct effects of the consumption tax hike.
2. Figures for the 10 percent trimmed mean are weighted averages of items; these items are obtained by rearrangingyear-on-year rates of price change in ascending order and then excluding items in both the upper and lower
10 il b i h10 percent tails by weight.3. Figures for the Laspeyres chain index for 2006 are the year-on-year rates for the fixed-base method.
Source: Ministry of Internal Affairs and Communications.
14

Factors Affecting Long-Term Interest Rates
Chart 14
Factors Affecting Long-Term Interest Rates
JGB purchasesJGB purchases by the Bank
(Downward factors)
(Nominal)E pected short term +
( )long-term
interest rates
= Expected short-terminterest rates
Premiums+
(Upward factors)Improvement in the outlook for economic activity and prices
1. A rise in U.S. interest rates
2. An increase in interest rate volatilityy
15
Economic Activity in Oita PrefectureChart 15
Economic Activity in Oita Prefecture(1) Industrial Production (2) Active Job Openings-to-
Applicants Ratio(3) Business Fixed Investment
(Tankan)*
115
120
Oita Prefecture
Japan
CY 2010=100
1.08
1.00
1.10
Oita Prefecture
Japan
s.a.; times
265
240
260
280FY 2005=100
All industries
Manufacturing
105
110
JapanMETIprojection
0.88
0.80
0.90
Japan
164
177
200
180
200
220Nonmanufacturing
95
100
0 60
0.70
164
120
140
160
85
90
0.50
0.60
6876
66
76
60
80
100
120
75
80
08 09 10 11 12 13 14CY
0.30
0.40
08 09 10 11 12 13 14CY
4855
4245
20
40
60
05 06 07 08 09 10 11 12 13 14FY
16
Note: Figures from fiscal 2009 onward are based on the new lease accounting standard (figures up to fiscal 2008 are based on the previous standard). Sources: Statistics and Research Division, Oita Prefectural Government; Ministry of Economy Trade and Industry (METI); Ministry of Health, Labour
and Welfare; Oita Labour Bureau; Bank of Japan.