recent economic developments in iranen.middleeastbank.ir/uploads/qredissue1.pdf · recent economic...
TRANSCRIPT

Recent Economic Developments in IranA Quarterly Report
Issue No. 1, January 2016

DisclaimerThe data, information and analyses presented in this Report are for information purposes only. The data and in-formation are taken from the referenced sources and while every effort has been made to keep them up to date and correct, no representations or warranties of any kind, express or implied, are made about their completeness, accuracy, reliability or suitability for any purpose. Your use of this Report does not entail any responsibility or obligation by Middle East Bank or any entity or person associated with it.

Table of Contents
Iran’s Economy at a Glance 21. The Real Sector 3
1.1 Energy 31.2 Manufacturing 4
2. Labor Force 43. Prices 54. Balance of Payments 7
4.1 Current Account Balance 85. Exchange Rate 96. Monetary and Credit Aggregates 97. Government Budget 118. Capital Market 129. Other Economic Developments 13
MIDDLE EAST BANK
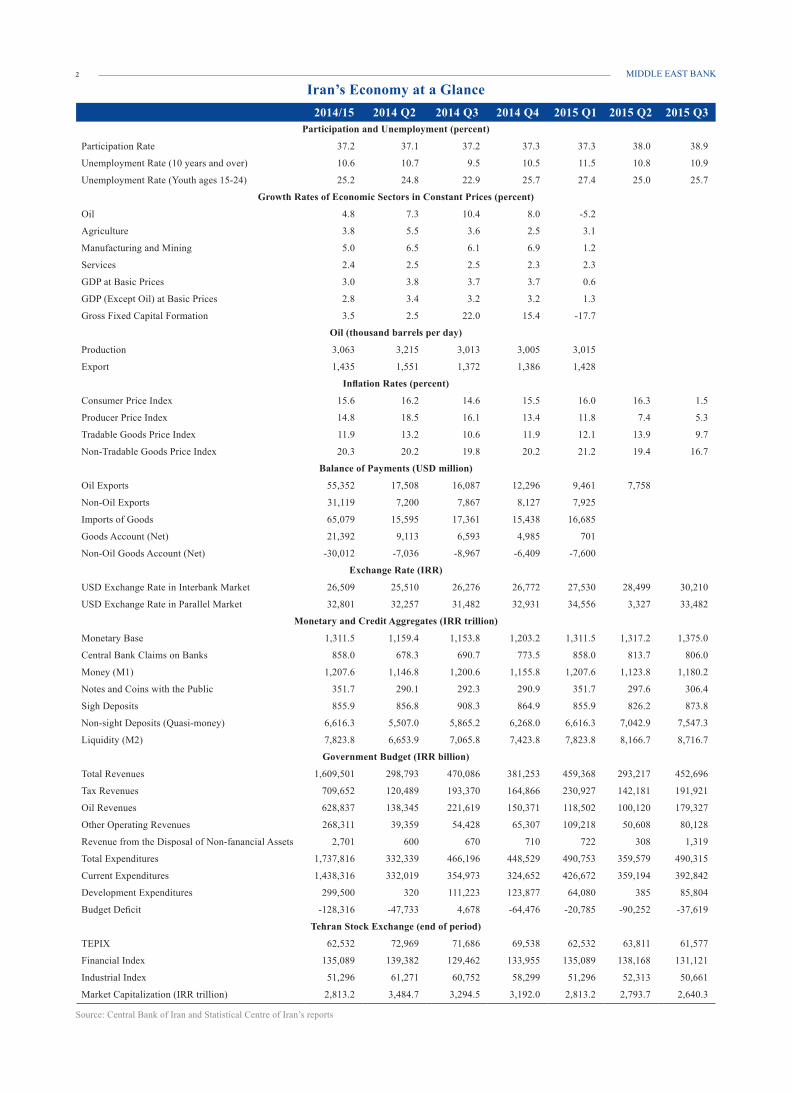
2014/15 2014 Q2 2014 Q3 2014 Q4 2015 Q1 2015 Q2 2015 Q3Participation and Unemployment (percent)
Participation Rate 37.2 37.1 37.2 37.3 37.3 38.0 38.9
Unemployment Rate (10 years and over) 10.6 10.7 9.5 10.5 11.5 10.8 10.9
Unemployment Rate (Youth ages 15-24) 25.2 24.8 22.9 25.7 27.4 25.0 25.7
Growth Rates of Economic Sectors in Constant Prices (percent)
Oil 4.8 7.3 10.4 8.0 -5.2
Agriculture 3.8 5.5 3.6 2.5 3.1
Manufacturing and Mining 5.0 6.5 6.1 6.9 1.2
Services 2.4 2.5 2.5 2.3 2.3
GDP at Basic Prices 3.0 3.8 3.7 3.7 0.6
GDP (Except Oil) at Basic Prices 2.8 3.4 3.2 3.2 1.3
Gross Fixed Capital Formation 3.5 2.5 22.0 15.4 -17.7
Oil (thousand barrels per day)
Production 3,063 3,215 3,013 3,005 3,015
Export 1,435 1,551 1,372 1,386 1,428
Inflation Rates (percent)
Consumer Price Index 15.6 16.2 14.6 15.5 16.0 16.3 1.5
Producer Price Index 14.8 18.5 16.1 13.4 11.8 7.4 5.3
Tradable Goods Price Index 11.9 13.2 10.6 11.9 12.1 13.9 9.7
Non-Tradable Goods Price Index 20.3 20.2 19.8 20.2 21.2 19.4 16.7
Balance of Payments (USD million)
Oil Exports 55,352 17,508 16,087 12,296 9,461 7,758
Non-Oil Exports 31,119 7,200 7,867 8,127 7,925
Imports of Goods 65,079 15,595 17,361 15,438 16,685
Goods Account (Net) 21,392 9,113 6,593 4,985 701
Non-Oil Goods Account (Net) -30,012 -7,036 -8,967 -6,409 -7,600
Exchange Rate (IRR)
USD Exchange Rate in Interbank Market 26,509 25,510 26,276 26,772 27,530 28,499 30,210
USD Exchange Rate in Parallel Market 32,801 32,257 31,482 32,931 34,556 3,327 33,482
Monetary and Credit Aggregates (IRR trillion)
Monetary Base 1,311.5 1,159.4 1,153.8 1,203.2 1,311.5 1,317.2 1,375.0
Central Bank Claims on Banks 858.0 678.3 690.7 773.5 858.0 813.7 806.0
Money (M1) 1,207.6 1,146.8 1,200.6 1,155.8 1,207.6 1,123.8 1,180.2
Notes and Coins with the Public 351.7 290.1 292.3 290.9 351.7 297.6 306.4
Sigh Deposits 855.9 856.8 908.3 864.9 855.9 826.2 873.8
Non-sight Deposits (Quasi-money) 6,616.3 5,507.0 5,865.2 6,268.0 6,616.3 7,042.9 7,547.3
Liquidity (M2) 7,823.8 6,653.9 7,065.8 7,423.8 7,823.8 8,166.7 8,716.7
Government Budget (IRR billion)
Total Revenues 1,609,501 298,793 470,086 381,253 459,368 293,217 452,696
Tax Revenues 709,652 120,489 193,370 164,866 230,927 142,181 191,921
Oil Revenues 628,837 138,345 221,619 150,371 118,502 100,120 179,327
Other Operating Revenues 268,311 39,359 54,428 65,307 109,218 50,608 80,128
Revenue from the Disposal of Non-fanancial Assets 2,701 600 670 710 722 308 1,319
Total Expenditures 1,737,816 332,339 466,196 448,529 490,753 359,579 490,315
Current Expenditures 1,438,316 332,019 354,973 324,652 426,672 359,194 392,842
Development Expenditures 299,500 320 111,223 123,877 64,080 385 85,804
Budget Deficit -128,316 -47,733 4,678 -64,476 -20,785 -90,252 -37,619
Tehran Stock Exchange (end of period)
TEPIX 62,532 72,969 71,686 69,538 62,532 63,811 61,577
Financial Index 135,089 139,382 129,462 133,955 135,089 138,168 131,121
Industrial Index 51,296 61,271 60,752 58,299 51,296 52,313 50,661
Market Capitalization (IRR trillion) 2,813.2 3,484.7 3,294.5 3,192.0 2,813.2 2,793.7 2,640.3
Source: Central Bank of Iran and Statistical Centre of Iran’s reports
Iran’s Economy at a Glance2

Recent Economic Developments in Iran, A Quarterly Report, Issue No. 1
Table 1 - Real Growth Rates of the Main Economic Sectors in the First Half of 2015 (percentage)
Gross Domestic Product 1.0
Agriculture 5.7Industry -1.1Services 0.9Source: Statistical Centre of Iran, Quarterly national account report, First half of 1394
1. The Real SectorIn 2014/15 Iran’s economy came out of two years of recession and experienced a 3.0 percent GDP growth, primarily as a re-sult of good performance by the two sectors of manufacturing and mining that grew by 5.0 percent and oil that grew by 4.8 percent. The same two sectors, however, have performed worse than others during the first half of the current Iranian year that corresponds to spring and summer of 2015, with the oil sec-tor even experiencing a contraction. Although official statistics from the Central Bank are not yet available, the manufacturing and mining sector may have contracted in spring given the Sta-
tistics Center of Iran’s report that in that season production fell in manufacturing sector by 2.0 percent and in mining sector by 0.6 percent. It thus appears that the trend of Iran’s economic growth has slowed since the winter of 2014 despite the positive political outlook in the aftermath of the nuclear deal with the group of 5+1. Figure 1 demonstrates the growth performance of the main eco-nomic sectors during the latest 12 quarters for which official statistics have been published.
An analysis of the overall investment levels also points to a slowdown in economic growth of the country. As can be seen in Figure 2, gross fixed capital formation in winter of 2015 con-
tracted in real terms, and that is likely to have had a negative effect on production in spring and summers.
The Statistics Center of Iran has announced that economic growth during the six month period of spring and summer 2015
has been 1.0 percent. Details of this estimate by sector are pre-sented in Table 1.
It is likely that construction activities have also contracted as private investment in housing declined by 6.9 percent in the spring of 2015 compared to the same season last year. Several other construction and housing indicators are also consistent with a contraction in this sector.
1.1 EnergyIran is estimated to have 34 trillion cubic meters of proven nat-
ural gas reserves, the world’s largest proven reserves, ahead of Russia with its 32.6 trillion cubic meters of reserves that is in second place, although the US Energy Information Agency (EIA) names Russia as possessing the largest volume of natu-ral gas reserves. As for proven oil reserves, Iran with its 157.6 billion barrels comes in the fourth place following Venezuela, Saudi Arabia and Canada. Both production and export of Iranian oil have been declin-
Figure 1: Real Growth Rates of GDP and its Main Components, 2012-15 (percentage)
Figure 2: Real Growth Rates of the Fixed Capital Formation, 2012-15 (percentage)
Source: Central Bank of Iran, Economic Trends
Source: Central Bank of Iran, Economic Trends
3

MIDDLE EAST BANK
EIA estimates that Iran’s daily oil production in spring and sum-mer of 2015 have remained at the same level as in winter, but an OPEC report in September states that Iran’s oil production in spring was 3.0 percent higher than in winter and reached 3.1 million bpd. Assuming that domestic consumption has stayed unchanged in spring, these data imply that oil export should have exceeded 1.5 million bpd. The Central Bank of the Islamic Republic of Iran has also stated that net oil export (including crude oil and petroleum products) in spring of 2015 stood at 1.42 million bpd, showing an 8.3 percent decline compared to the same period in 2014. In spring 2015, average sales price of Iran’s crude oil was USD60.7 per barrel, showing a 42.9 percent decline relative to spring 2014. Iran’s Oil Minister has predicted an increase of half a million bpd in export upon the removal of the im-posed sanctions, implying the return of Iran’s oil export to the level prior to the execution of oil sanctions in spring 2012. It should be noted that the reduction of half a million bpd during those two years removed about USD50 million per day from the country’s oil income given oil prices of about USD100 per barrel, while at current prices of less than USD50 per barrel,
their return will raise oil revenue by less than USD25 million per day. In spring 2015 domestic consumption of natural gas witnessed a 7 percent increase compared to the same period last year and reached 445.4 million cubic meters per day, and net exports of natural gas reached 4.2 million cubic meters per day.
1.2 ManufacturingIn 2014/15 the number of establishment permits of manufactur-ing units decreased by 4.3 percent, contributing to the contrac-tion of investments in manufacturing by 16.4 percent. Conse-quently, the number of operational permits must have decreased in spring 2015 and this must have led, in turn, to declines in the number of permits and the level of investment in manufacturing units. That growth rate of the value added in the manufacturing and mining sector has been declining since the spring of 2014, implying the likelihood of a halt in economic growth in 2015. With the exception of the auto industries, in 2014 the ratio of inventory to production in all public industries reached their maximum of the past 5 years, demonstrating demand weakness in these industries.
2. Labor ForceAs of the end of 2014, Iran’s population had an annual growth rate of 1.2 percent and numbered over 77.8 million, of which 56.4 percent live in urban areas and the remaining 21.4 per-cent are scattered in rural areas. The overall unemployment rate
reached 10.8 percent in spring 2015 and 10.9 percent in the summer. Table 2 presents detailed labor statistics of Iran in the summer of 2015.
Figure 3: Production and Exports of Oil, 2012-15 (thousand barrels per day)
Source: Central Bank of Iran, Economic Trends
ing during the past three years, mainly because of economic sanctions on the country. Since the beginning of 2013, the gap between the country’s oil production and export (that should equal domestic consumption plus the change in inventory,) has
decreased from 1.9 million barrels per day (bpd) during the first half of 2013 to 1.6 million bpd in March 2015.Figure 3 demonstrates the trends of Iran’s crude oil production and export during the past three years.
Table 2: Labor Force Indicators by Gender and Urban and Rural Area in Summer 2015 (percentage)
Total Male Female Urban RuralParticipation Rate (10 years and over) 38.9 64.2 13.8 38.1 14.1
Unemployment Rate (10 years and over) 10.9 8.9 19.9 12.2 7.4Unemployment Rate (15 years and over) 10.9 8.9 19.9 12.2 7.4Unemployment Rate (Youth ages 15-24) 25.7 21.6 44.2 29.7 17.8Unemployment Rate (Youth ages 15-29) 23.4 19 41.3 26.2 16.1
Share of Agriculture in Employment 19.2 18.3 24 5.7 52.1
Share of Manufacturing in Employment 32.2 34 22.9 34.8 25.9
Share of Services in Employment 48.6 47.8 53.1 59.5 22.1
Share of Underemployment 8.5 9.2 4.6 7.3 11.5
Source: Statistical Centre of Iran, A Selection of Labor Force Survey Results, Summer 1394
4
Recent Economic Developments in Iran, A Quarterly Report, Issue No. 1
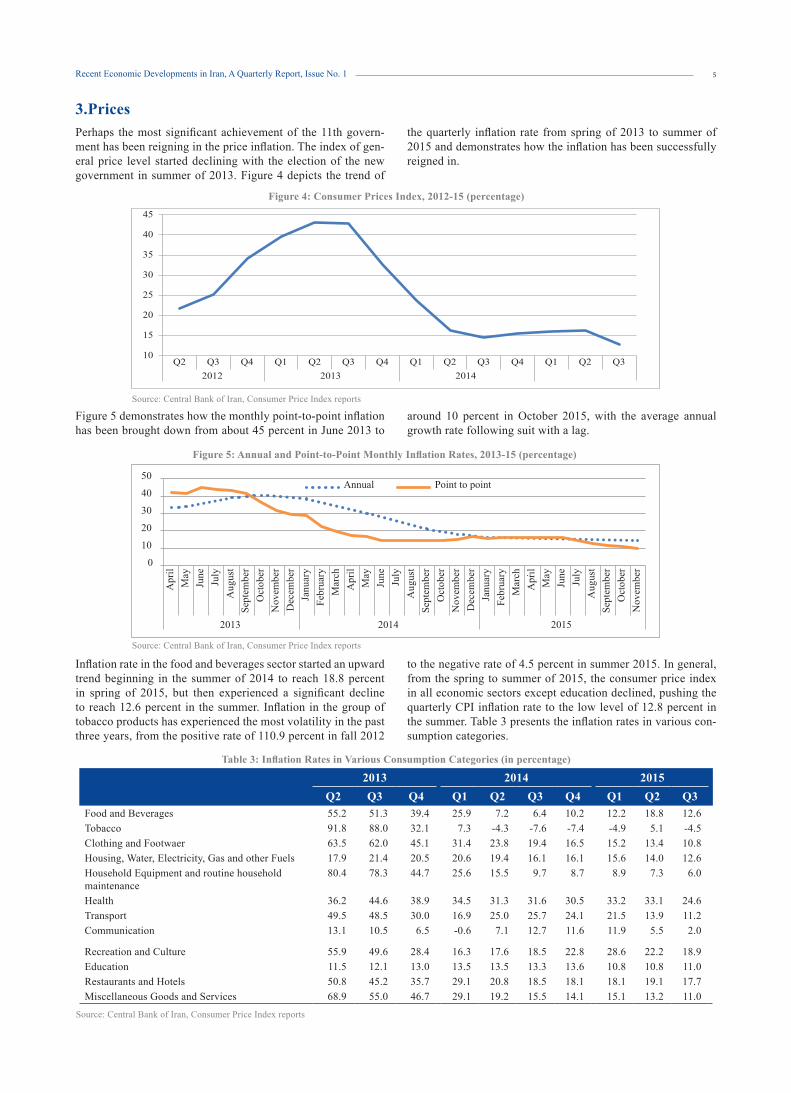
3.PricesPerhaps the most significant achievement of the 11th govern-ment has been reigning in the price inflation. The index of gen-eral price level started declining with the election of the new government in summer of 2013. Figure 4 depicts the trend of
the quarterly inflation rate from spring of 2013 to summer of 2015 and demonstrates how the inflation has been successfully reigned in.
Figure 5 demonstrates how the monthly point-to-point inflation has been brought down from about 45 percent in June 2013 to
around 10 percent in October 2015, with the average annual growth rate following suit with a lag.
Figure 4: Consumer Prices Index, 2012-15 (percentage)
Figure 5: Annual and Point-to-Point Monthly Inflation Rates, 2013-15 (percentage)
Source: Central Bank of Iran, Consumer Price Index reports
Source: Central Bank of Iran, Consumer Price Index reports
Inflation rate in the food and beverages sector started an upward trend beginning in the summer of 2014 to reach 18.8 percent in spring of 2015, but then experienced a significant decline to reach 12.6 percent in the summer. Inflation in the group of tobacco products has experienced the most volatility in the past three years, from the positive rate of 110.9 percent in fall 2012
to the negative rate of 4.5 percent in summer 2015. In general, from the spring to summer of 2015, the consumer price index in all economic sectors except education declined, pushing the quarterly CPI inflation rate to the low level of 12.8 percent in the summer. Table 3 presents the inflation rates in various con-sumption categories.
Table 3: Inflation Rates in Various Consumption Categories (in percentage)
2013 2014 2015Q2 Q3 Q4 Q1 Q2 Q3 Q4 Q1 Q2 Q3
Food and Beverages 55.2 51.3 39.4 25.9 7.2 6.4 10.2 12.2 18.8 12.6Tobacco 91.8 88.0 32.1 7.3 -4.3 -7.6 -7.4 -4.9 5.1 -4.5Clothing and Footwaer 63.5 62.0 45.1 31.4 23.8 19.4 16.5 15.2 13.4 10.8Housing, Water, Electricity, Gas and other Fuels 17.9 21.4 20.5 20.6 19.4 16.1 16.1 15.6 14.0 12.6Household Equipment and routine household maintenance
80.4 78.3 44.7 25.6 15.5 9.7 8.7 8.9 7.3 6.0
Health 36.2 44.6 38.9 34.5 31.3 31.6 30.5 33.2 33.1 24.6Transport 49.5 48.5 30.0 16.9 25.0 25.7 24.1 21.5 13.9 11.2Communication 13.1 10.5 6.5 -0.6 7.1 12.7 11.6 11.9 5.5 2.0
Recreation and Culture 55.9 49.6 28.4 16.3 17.6 18.5 22.8 28.6 22.2 18.9Education 11.5 12.1 13.0 13.5 13.5 13.3 13.6 10.8 10.8 11.0Restaurants and Hotels 50.8 45.2 35.7 29.1 20.8 18.5 18.1 18.1 19.1 17.7Miscellaneous Goods and Services 68.9 55.0 46.7 29.1 19.2 15.5 14.1 15.1 13.2 11.0
Source: Central Bank of Iran, Consumer Price Index reports
5

MIDDLE EAST BANK
Table 4 shows the monthly point-to-point inflation rates in dif-ferent consumption categories in 2015.
Considering separately the inflation rates in the two groups of tradable and non-tradable consumption categories, in recent years inflation has been stronger in the tradable goods, and this may appear contradictory to the country’s oil dependence and struggle with the Dutch Disease. Indeed, as a result of the ex-plosive depreciation of the IRR versus the USD in 2012, the Iranian economy experienced a trend in complete contrast to what the Dutch Disease literature would have expected, where-
by increasingly more expensive imports aggravated the infla-tion problem. But with the relative stability of the exchange rate since fall 2013, the accelerating growth in the price of the tradable goods reversed course and inflation rate in this cate-gory started to decline and then fall behind the inflation rate in non-tradable category. These developments are demonstrated in Figure 6.
Table 4:Point-to-Point Monthly Inflation Rates in Various Consumption Categories in 2015 (percentage)
April May June Julay August September October NovemberFood and Beverages 14.9 20.8 20.8 16.0 12.0 10.0 7.1 6.4
Tobacco -4.4 -5.6 -5.3 -4.9 -4.5 -4.2 -2.0 -1.5Clothing and Footwaer 14.8 13.0 12.3 11.3 10.7 10.3 9.8 9.8Housing, Water, Electricity, Gas and other Fuels
14.5 14.0 13.4 13.3 12.4 12.0 11.8 11.8
Household Equipment and Routine Household Maintenance
8.4 7.0 6.4 6.4 5.9 5.6 5.3 4.8
Health 33.2 33.5 32.6 26.1 24.3 23.3 23.6 21.9Transport 21.8 7.8 12.2 11.3 11.5 10.9 10.0 10.2Communication 11.5 -1.5 -3.4 -3.2 4.4 4.8 4.7 6
Recreation and Culture 24.2 23.5 18.8 19.1 18.8 18.8 17.7 5.4Education 10.7 10.7 11.1 11.1 11.0 11.0 22.0 20.9Restaurants and Hotels 19.4 19.2 18.7 18.4 17.9 16.9 15.8 15.2Miscellaneous Goods and Services 14.7 12.7 12.2 11.2 10.6 11.3 10.6 10.9
Source: Central Bank of Iran, Consumer Price Index reports
Figure 6: Inflation Rates for Tradable and Non-tradable Goods (percentage)
Source: Central Bank of Iran, Consumer Price Index - Tradable and Non-tradable Goods reports
Table 5 presents the monthly point-to-point inflation rates in 2015
The inflation of the producer price index (PPI) has also continued its declining trend during the second and third quarters of 2015 to reach low single digits. Since the PPI inflation influences the
CPI inflation with a lag, it is quite likely that the latter will also reach single digit levels during winter 2016. Figure 7 shows the producer price inflation rates during the past 14 quarters.
Table 5: Point-to-Point Monthly Inflation Rates for Tradable and Non-tradable Goods in 2015 (percentage)
April May June Julay August September OctoberTradable 13.4 13.8 14.5 11.7 9.3 8.0 6.3
Non-tradable 20.5 19.3 18.4 17.2 16.6 16.2 16.3
Source: Central Bank of Iran, Consumer Price Index - Tradable and Non-tradable Goods reports
6

Recent Economic Developments in Iran, A Quarterly Report, Issue No. 1
Source: Central Bank of Iran, Producer Price Index reports
During the past year the inflation rate in services sector has been higher than in other sectors, although the former experienced a sharp decline in spring. Only the agriculture sector has been somewhat resistant to inflation declines during the spring and summer. In light of the drought and difficulties on the supply side of the agriculture sector, this resistance may frustrate efforts to
bring down inflation much further.Table 6 presents the monthly point-to-point PPI inflation rates for the economy as a whole and its main sectors during thus far in the current Iranian year, i.e., the past 8 months. Negative infla-tion rate in the manufacturing sector in recent months is further evidence that this sector may have entered a recessionary phase.
Figure 7: Point-to-Point Monthly Inflation Rates of Producer Prices (percentage)
Table 6: Point-to-Point Monthly Inflation Rates of Producer Prices (percentage)
April May June Julay August September October NovemberGeneral Index 8.9 6.0 7.5 5.7 5.6 4.6 4.5 3.9Manufacturing 5.1 1.8 2.4 1.4 1.0 -1.9 -2.6 -3.0Agriculture, Forestry and Fishing 9.7 6.0 10.8 7.8 7.1 7.1 7.5 6.6Services 14.9 13.6 14.5 12.0 12.9 14.6 15.3 14.6
Source: Central Bank of Iran, Producer Price Index reports
4.Balance of PaymentsParallel with the sharp decline in global oil prices, Iran’s oil ex-port revenues have been falling, and this has caused a 33.1 per-
cent drop in Iran’s trade balance in 2014. Figure 8 demonstrates the trends of various trade balance components during 2012-15.
Source: Central Bank of Iran, Economic Trends
Figure 8: Components of Goods Account (USD million)
7

MIDDLE EAST BANK
It can be observed that non-oil export has been continuing its mild upward trend despite the strong volatility of the oil market. Some have argued that Iran’s non-oil exports are highly depen-dent on oil but Figure 8 seems to refute it and give credence to the view that the country can increasingly count on its non-oil exports regardless of what happens to oil. The decline of oil ex-port revenues has led to fall of goods account balance in winter 2015 to its lowest level during the past three years. Customs data
for spring 2015 reveal a 3.3 percent growth in exports and a 15.6 percent contraction in imports compared to a year earlier. In sum-mer 2015 both exports and imports fell, by 10.3 percent and 25.6 percent, respectively. The net effect has been an improvement in Iran’s trade balance during the past seasons. Figure 9 demonstrates customs exports and import during the past 14 quarters.
Source: Central Bank of Iran, Economic Trends; Islamic Republic of Iran Customs Administration, Monthly reports
Figure 9: Customs Imports and Exports (USD million)
During the first eight months of the current Iranian year, i.e., April-November 2015, customs exports and imports amounted to USD21.2 billion and USD27.3 billion, respectively, indicating
the contraction of exports by 10 percent and of imports by 21 percent compared to the same period in 2014. Figure 10 shows Iran’s major trade partners during this period.
Source: Islamic Republic of Iran Customs Administration, Monthly reports
Figure 10: Trade Partners in the first 8 Months of 2015
It is worth noting that the country’s overall trade balance (in-cluding oil and non-oil commodities) during winter 2015 came close to zero and, given the continuation of weak oil prices, this situation has not changed since. Consequently, the growth of for-eign reserves will face difficulties and this, in turn, will affect the growth of the monetary base. Under such circumstances, au-thorities will have an easier time implementing an expansionary
monetary policy in the fall and winter.
4.1. Current Accounts BalanceThe current accounts balance has been positive since winter 2013, but turned negative in winter 2015 due to the sharp drop in goods account balance. Details of the balance of payments in the past 12 quarters are presented in Table 7.
Table 7: Current Account Components (USD million)
2012 2013 2014 2015Q2 Q3 Q4 Q1 Q2 Q3 Q4 Q1 Q2 Q3 Q4 Q1
Goods account (net) 9,875 5,375 8,195 5,114 10,368 8,201 6,065 7,336 9,113 6,593 4,985 701
Services account (net) -3,435 -4,919 -4,321 -8,054 -4,745 -4,602 4,723 -2,513 -2,270 -1,387 -1,342 -1,986Income account (net) 142 230 417 248 342 148 145 480 211 289 297 146Current transfers account (net)
118 128 151 155 149 146 144 146 125 126 129 131
Current account balance
6,700 814 4,442 -2,537 6,114 3,893 11,077 5,449 7,179 5,621 4,069 -1,008
Source: Central Bank of Iran, Economic Trends
8

Recent Economic Developments in Iran, A Quarterly Report, Issue No. 1
According to preliminary data released by the Central Bank, during the spring of 2015 the current account balance reached USD3.9 billion, which is 45.1 below its level in spring 2014. Net goods account during this season was USD4.8 billion (in-cluding USD17.7 billion exports and USD12.9 billion imports)
which shows a 90 percent drop from a year earlier. The Central Bank has noted that the main factor behind this decline has been the 39.3 percent drop in oil exports, but as shown earlier, the sig-nificant decrease in non-oil exports has also played an important role in this decline.
5.Exchange RateSince late 2012 the gap between the “reference exchange rate” (the one used by the government to convert USD into IRR in its annual budgets) and the free market exchange rate has widened and in February 2013 reached its maximum of IRR24,734. In that month the free market USD/IRR exchange rate also reached its maximum of IRR36,994 per USD. In mid-July 2013 the ref-erence exchange rate was done away with and the Central Bank started its daily announcements of the interbank exchange rate. Alongside this move, the 2013 presidential election and the vic-tory of President Rouhani calmed down the foreign exchange market and brought back stability to it. The gap between the free market exchange rate and the interbank exchange rate gradually
narrowed, and following the approval of the nuclear deal by the US senate in September 2015, the gap reached its minimum of IRR2,727. The nuclear deal agreement in April provided a good opportunity for the Central Bank to move away from the multiple exchange rate system and move toward a single exchange rate. As a way of influencing the market exchange rate, at times the Central Bank raised foreign exchange supply through a private bank, creating a massive economic rent that could aggravate exchange rate vol-atility. Figure 11 depicts the developments of the USD/IRR exchange rate during 2012-2015.
Source: Central Bank of Iran, Exchange rate archive
Figure 11: USD/IRR Exchange Rate
An important issue in protecting comparative advantages is to make sure that the national currency does not appreciate in real terms, i.e., that the foreign exchange rates move in parallel with the difference between the domestic and foreign inflation rates. This 11th government has also been emphasizing such a policy
from the beginning and statistics indicate that it has been more of less holding. This can also be seen in Figure 12 that traces month-ly point-to-point inflation rates as well as changes in the free mar-ket and interbank exchange rates during the past three years.
Source: Central Bank of Iran, Exchange rate archive; Consumer Price Index reports
Figure 12: Point-to-Point Monthly Depreciation Rate of IRR vs. USD (percentage)
As seen in Figure 12, during 2013 alongside the reigning in of inflation and controlling exchange rate volatility, USD/IRR ex-change rate in the interbank was also raised by 100 percent and in that way the gap between free market and interbank exchange rates narrowed, and of summer 2014 they both started to move in
accordance with the domestic-foreign inflation rate gap. During the second and third quarters of 2015 and in the aftermath of the nuclear deal, IRR has strengthened relative to USD in the free market but has maintained its value in the interbank market.
6.Monetary and Credit Aggregates Components of Iran’s monetary base since 2012 are presented in Table 8.
9

MIDDLE EAST BANK
The main factor behind the growth of the monetary base in 2014 has been the growth in banks’ indebtedness to the Central Bank. Given the government’s announced decision not to borrow from the Central Bank, government borrowings from banks, and with
that banks’ indebtedness to the Central Bank, have increased. The close relationship between growth of the monetary base and growth of banks’ indebtedness to the Central Bank is readily dis-cernible in Figure 13.
Table 8: Monetary Base Components, 2012-15
Balance at the end of the period (trillion IRR) Percentage change (2015Q2 to 2015Q1)2012/13 2013/14 2014/15 2015Q2
Monetary Base 975.8 1,184.9 1,311.5 1,317.2 0.4
Foreign assets (net) 769.2 1,678.3 1,580.4 1,648.2 4.3Claims on public sector (net) 46.0 38.7 33.3 112.8 239.1Claims on banks 488.3 602.6 858.0 813.7 -5.2Others (net) -327.7 -1,134.7 -1,160.3 -1,257.5 8.4
Source: Central Bank of Iran, Economic Trends; Ravand, Volume 22, Number 69; Speech of Deputy Governor of Central Bank of Iran in 21th Conference on Monetary and Exchange Rate Policy
From the end of winter 2015 to the end of spring, despite a 5.2 percent drop in banks’ indebtedness to the Central Bank, the monetary base grew by 0.4 percent. This growth was mainly due to the very high growth of 239.1 percent in government’s net debt to the Central Bank which, in the absence of other balancing changes, would have raised the monetary base by 6.1 percent. Net foreign assets of the Central Bank also grew by 4.3 percent, and this alone would have raised the monetary base by 5.2 per-cent. On the other hand, changes in Central Bank claims on banks and the net of other items would have had opposite effects on the growth of the monetary base -- of, respectively, negative 3.4 per-cent and negative 7.5 percent. Therefore, in analyzing the causes of the monetary base growth in spring 2015, it becomes obvious
that the main culprit has again been the government’s indebted-ness to the Central Bank. In other words, the government has not been able to practice fiscal discipline, primarily because of the pressure from declining oil prices, and has, as usual, resorted to Central Bank resources.The 0.4 percent growth of the monetary base has led to a 4.1 per-cent growth in broad money (M2). Most recent statistics indicate that during spring and summer of 2015, the monetary base has grown by 4.8 percent, and this has led to an 11.4 percent growth in M2 during the same two seasons.Table 9 demonstrates statistics on the level and growth rate of broad money and its main components during the past 10 quar-ters.
Source: Central Bank of Iran, Selected Economic Indicators reports, Monetary and Credit AggregatesNote: The growth rate of each quarter is calculated relative to the preceding winter
Figure 13: Growth Rates of the Monetary Base and Banks’ Indebtedness to the Central Bank (percentage)
Table 9: Liquidity and its Components (in IRR trillions, and growth rates in percentages)
2013 2014 2015Q2 Q3 Q4 Q1 Q2 Q3 Q4 Q1 Q2 Q3
Money Level 1,071.2 1,101.5 1,079.4 1,196.0 1,146.8 1,200.6 1,155.8 1,207.6 1,123.8 1,180.2Growth rate -5.8 -3.1 -5.0 5.2 -4.1 0.4 -3.4 1.0 -6.9 -2.3
Notes and coins with the public
Level 278.3 280.7 276.0 334.1 290.1 292.3 290.9 351.7 297.6 306.4Growth rate -15.7 -15.0 -16.4 1.2 -13.2 -12.5 -12.9 5.3 -15.4 -12.9
Sight deposits Level 793.0 820.8 803.3 861.9 856.8 908.3 864.9 855.9 826.2 873.8Growth rate -1.7 1.8 -0.4 6.9 -0.6 5.4 0.3 -0.7 -3.5 2.1
Quasi-money Level 3,658.3 3,962.4 4,428.3 5,199.5 5,507.0 5,865.2 6,268.0 6,616.3 7,042.9 7,547.3Growth rate 5.4 14.2 27.6 49.8 5.9 12.8 20.6 27.2 6.4 14.1
Liquidity Level 4,729.5 5,064.0 5,507.7 6,395.5 6,653.9 7,065.8 7,423.8 7,823.8 8,147.8 8,716.7Growth rate 2.7 9.9 19.6 38.8 4.0 10.5 16.1 22.3 4.1 11.4
Source: Central Bank of Iran, Selected Economic Indicators reports, Monetary and Credit AggregatesNote: The growth rate of each quarter is calculated relative to the preceding winter
10
Recent Economic Developments in Iran, A Quarterly Report, Issue No. 1
Despite the success in controlling the growth of the monetary base, broad money grew fast in spring 2015, mainly because of the large increase in sight deposits. This points to the fact that in the current environment in which the annual inflation rate has reached 15 percent or lower, interest rates of 20 percent and above on time deposits are highly attractive. This observation is
backed by the 40.1 percent growth of time deposits during the pe-riod from spring 2014 to spring 2015. At the end of summer, the money multiplier stood at 6.2 and the contribution of its growth to the monetary base growth had improved. It can thus be argued that the Central Bank has been relatively successful in correcting the structure of the liquidity growth.
7.Government BudgetGovernment’s budget balance during the spring and summer of 2015 has been highly influenced by the drop in oil export in-comes. Although in the legislated budget for the current Iranian year (2014/2015) the price of oil has been correctly estimated to
be around USD50 per barrel, budget deficit during the first half of the year (spring and summer 2015) reached IRR127.9 trillion. Table 10 presents details of the government budget.
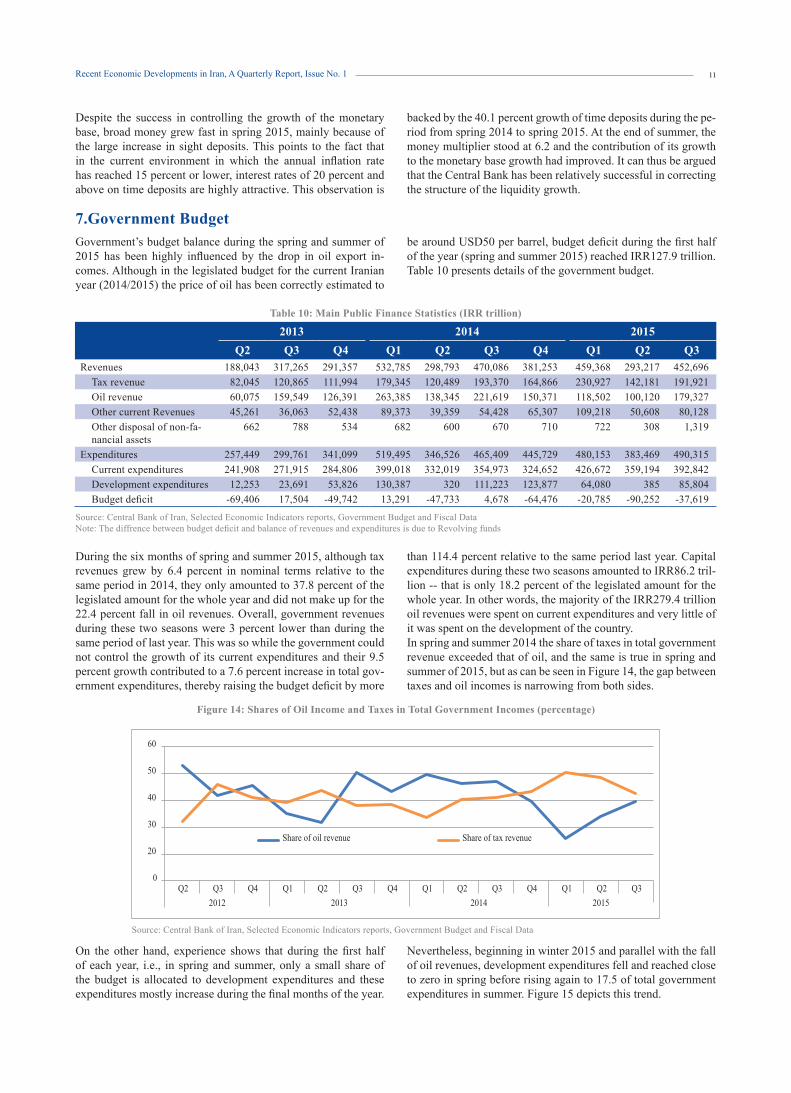
During the six months of spring and summer 2015, although tax revenues grew by 6.4 percent in nominal terms relative to the same period in 2014, they only amounted to 37.8 percent of the legislated amount for the whole year and did not make up for the 22.4 percent fall in oil revenues. Overall, government revenues during these two seasons were 3 percent lower than during the same period of last year. This was so while the government could not control the growth of its current expenditures and their 9.5 percent growth contributed to a 7.6 percent increase in total gov-ernment expenditures, thereby raising the budget deficit by more
than 114.4 percent relative to the same period last year. Capital expenditures during these two seasons amounted to IRR86.2 tril-lion -- that is only 18.2 percent of the legislated amount for the whole year. In other words, the majority of the IRR279.4 trillion oil revenues were spent on current expenditures and very little of it was spent on the development of the country. In spring and summer 2014 the share of taxes in total government revenue exceeded that of oil, and the same is true in spring and summer of 2015, but as can be seen in Figure 14, the gap between taxes and oil incomes is narrowing from both sides.
Table 10: Main Public Finance Statistics (IRR trillion)
2013 2014 2015Q2 Q3 Q4 Q1 Q2 Q3 Q4 Q1 Q2 Q3
Revenues 188,043 317,265 291,357 532,785 298,793 470,086 381,253 459,368 293,217 452,696Tax revenue 82,045 120,865 111,994 179,345 120,489 193,370 164,866 230,927 142,181 191,921Oil revenue 60,075 159,549 126,391 263,385 138,345 221,619 150,371 118,502 100,120 179,327Other current Revenues 45,261 36,063 52,438 89,373 39,359 54,428 65,307 109,218 50,608 80,128Other disposal of non-fa-nancial assets
662 788 534 682 600 670 710 722 308 1,319
Expenditures 257,449 299,761 341,099 519,495 346,526 465,409 445,729 480,153 383,469 490,315Current expenditures 241,908 271,915 284,806 399,018 332,019 354,973 324,652 426,672 359,194 392,842Development expenditures 12,253 23,691 53,826 130,387 320 111,223 123,877 64,080 385 85,804Budget deficit -69,406 17,504 -49,742 13,291 -47,733 4,678 -64,476 -20,785 -90,252 -37,619
Source: Central Bank of Iran, Selected Economic Indicators reports, Government Budget and Fiscal DataNote: The diffrence between budget deficit and balance of revenues and expenditures is due to Revolving funds
Source: Central Bank of Iran, Selected Economic Indicators reports, Government Budget and Fiscal Data
Figure 14: Shares of Oil Income and Taxes in Total Government Incomes (percentage)
On the other hand, experience shows that during the first half of each year, i.e., in spring and summer, only a small share of the budget is allocated to development expenditures and these expenditures mostly increase during the final months of the year.
Nevertheless, beginning in winter 2015 and parallel with the fall of oil revenues, development expenditures fell and reached close to zero in spring before rising again to 17.5 of total government expenditures in summer. Figure 15 depicts this trend.
11

MIDDLE EAST BANK
Source: Central Bank of Iran, Selected Economic Indicators reports, Government Budget and Fiscal Data
Figure 15: Current and Developmental Expenditures as Percentages of Total Public Expenditures
It can clearly be seen that the 11th government, too, has been un-successful in using oil revenues for developmental investments. Moreover, not only has its budget deficit exerted inflationary pressures, but its use of foreign exchange resources for current
expenditures would cause further inflation. A cause for concern is that these actions, along with the possibility of expansionary monetary policy in fall and winter to boost production, may re-verse the achievements in reigning in inflation.
8. Capital MarketThe main index of the Tehran Stock Exchange, TEPIX, fell by 1.6 percent since winter. Taking into account the annual inflation rate of about 14 percent, the real rate of return of the market has
been much more negative. Table 11 demonstrates the trends of the main stock market indices since the beginning of spring 2013.
Table 11: Main Stock Exchange Indices, 2012-15
2013 2014 2015Q2 Q3 Q4 Q1 Q2 Q3 Q4 Q1 Q2 Q3
TEPIX 78,917 61,707 86,957 79,015 72,969 71,686 69,538 62,532 63,811 61,577
Financial index 80,911 118,392 169,996 157,628 139,382 129,462 133,955 135,089 138,168 131,121
Industrial index 42,086 51,766 72,717 65,837 61,271 60,752 58,299 51,296 52,313 50,661
Market capitalization (trillion rials) 2,328 3,014 4,259 3,866 3,485 3,294 3,192 2,813 2,794 2,640
Source: Tehran Stock Exchange, Capital Market Indices Statistics
It can be seen that all three indices have been generally falling since winter 2014. At the end of fall 2015, market capitalization was 16.8 percent lower than a year earlier and investors had in-
curred IRR536 trillion in capital loss. Figure 16 shows the trends of the three major stock market indices during the past three quarters.
Source: Tehran Stock Exchange, Capital Market Indices Statistics
Figure 16: Main Stock Exchange Indices in 2015
12

Recent Economic Developments in Iran, A Quarterly Report, Issue No. 1
9.Other Economic DevelopmentsOne of the most significant recent events in Iran’s economy is the initial offering of Islamic Treasury bonds in the over-the-counter (OTC) market. These bonds are comparable to short term trea-sury bonds and this is the first time that such an instrument is being used to finance budget deficit in Iran. 400 thousand of these bonds were initially offered on September 30th and 383,838 of these bonds were purchased at IRR900,500. These bonds have a face price of IRR1,000,000 and maturity date of March 13, 2016, and so the above purchase price implies an interest rate of about 26 percent. In this regard the following points should be taken into account:• In line with the budget law of 2014, the Government has turned
IRR10 trillion of its debt to private contractors into bonds. This figure equals 7.8 percent of the current year’s budget deficit of IRR128 trillion, and so the Islamic treasury bonds do not yet play a significant role in government finance.
• So far only 3.8 percent of the treasury bonds have been pur-chased in OTC market and there is much ambiguity as to whether or not the initial offering of these bonds would con-tinue.
• The effective interest rate on these treasury bonds is higher than those on other instruments such as “sokuk” and “murabe-heh” that exist in the market. Even in the secondary market, the effective interest rate on these bonds has reached 28 percent -- which is much higher than the effective interest rate of below 22 percent on time deposits. This is despite the fact that else-where in the world the interest rate on government bonds are below the rates on other instruments as government bonds are considered risk free, and interest rate on other instruments are determined accordingly depending on the degree of their per-ceived risks. Therefore, it is clear that the government’s credit risk in Iran is assessed to be higher than many private firms. It may be argued that that initial suppliers of these bonds have been contractors to whom the government is indebted, rather than the government itself, and because of these contractors’ liquidity shortage they were willing to underprice their bonds and thus the low effective rates of return have nothing to do with the government. But such an argument can be refuted given that the effective rate of return on these bonds in the sec-ondary market has even exceeded that in the primary market, and this is certainly independent of the contractors’ liquidity shortage.
• President Rouhani, in his televised Interview of October 13th said that these bonds may be sold to the banks, and banks may in turn use them to settle their accounts with the Cen-tral Bank. Such a mechanism would effectively amount to the government financing its deficit through printing money and borrowing from the Central Bank, which will have inflationary consequences. Even if these bonds are not transferred from the banking system to the Central Bank, practically no change will occur in the current methods of government financing. By bor-rowing from then banks, the government is currently forcing them to borrow from the Central Bank given that the existing
reserves of the banks are not large enough for that purpose. If Islamic treasury bonds are transferred to the banking sys-tem, what had happened with the government bonds will be repeated and there will effectively be no difference between the Islamic treasury bonds and government bonds. Govern-ment bonds are also essentially offered to contractors and oth-er firms that are creditors to the government and these cred-itors will effectively transfer government’s debt to the banks by buying back these bonds through the banking system. As a result, Islamic treasury bonds should be traded exclusively in the secondary OTC market.
• Above weaknesses aside, the mere staging of Islamic treasury bonds should be welcomed. The formation of a market for government bonds would in itself limit the inflationary effects of government deficits, and this is quite significant given the current concerns with reigning in inflation. Given the reces-sionary situation during the first half of the current Iranian year, i.e., spring and summer 2015, stimulating demand and production through the banking system seems to be necessary, and by relieving the banks from financing government deficits, the goal can be attained without expanding the monetary base.
• Another positive outcome of the issuance of Islamic treasury bonds is the creation of a new instrument for monetary pol-icy execution. In most countries the central bank executes monetary policy by buying or selling government bonds. In this way, the interest rate is manipulated through open market mechanisms of supply and demand. In Iran, however, in the absence of treasury bonds, interest rates are set by discretion or by instruments such as changing the legal reserve ratio. Such methods of policy making are of course sub-optimal and ineffi-cient and have always been a source of dispute among Central Bank officials, banks and the business community. The for-mation of a treasury bonds market puts a suitable and efficient instrument at the disposal of the Central Bank for monetary policy implementation.
• The formation of government bonds market helps improve and expand other debt markets. At present, Iran’s debt market is very small and does not correctly price risks and returns. In principal, interest rates on private papers should follow those of treasury bonds adjusted for the formers’ risks. In the ab-sence of treasury bonds such relationships would not take shape. But now that this prerequisite market has formed, more private firms may consider raising capital in this market in-stead of through the banking system. With the development of the debt market, the interest rate will be determined in that market through the free interaction of market forces, and this would contribute to the more efficient allocation of financial resources. In such an environment one can hope that discre-tionary interest rate setting would end and banks would be able to freely and competitively set their own interest rates depending on their perceived risks. As such, the issuance of the Islamic treasury bonds may be the cornerstone of financial liberation in Iran.
13

Middle East Bank HeadquartersNo. 2, 5th St., Ahmad Qasir (Bokharest) Ave., Tehran, IranTel: (+98 21) 42178000 Fax: (+98 21) 88701095www.middleeastbank.ir [email protected]