real world nox performance of euro vi-d trucks and
TRANSCRIPT

JULY 2021
WORKING PAPER 2021-26
Real world NOx performance of Euro VI-D trucks and recommendations for Euro VIIAuthors: Felipe Rodríguez and Huzeifa Badshah
Keywords: heavy-duty trucks, compliance testing, pollutants, real-world emissions
IntroductionIn 2018, 99% of the European Union’s urban population was exposed to ground ozone levels in excess of air quality guidelines set by the World Health Organization (WHO) and 74% to levels of particulate matter with diameters of less than 2.5 micrometers (PM2.5) above WHO’s air quality guidelines (European Environment Agency, 2020). Such a prevalent level of exposure to air pollution is a major threat to public health (Mulholland et al., 2021).
On-road diesel vehicle emissions, mainly in the form of nitrogen oxides (NOx), play a crucial role as precursors for the formation of PM2.5 and ground-level ozone. As a result, approximately 35,000 premature deaths from PM2.5 and ozone in the European Union were associated with diesel vehicles in 2015 (Anenberg et al., 2017).
Despite the regulatory efforts of the past decade, heavy-duty vehicles (HDVs) continue to be a major source of NOx emissions, and are responsible for around 40% of the emissions of that air pollutant in the European Union while only representing 2.4% of the fleet (European Commission, 2018). This can largely be attributed to the gap between real-world emissions and those certified as compliant with pollutant emissions standards.
Current HDV pollutant emission standards date to more than a decade ago. The European Union adopted the current Euro VI standards in 2009 and began their implementation in 2013. Euro VI standards—implemented by EU regulation 582/2011—introduced in-use testing using portable emissions measurement systems (PEMS) as a central policy design element to improve the real-world emissions performance. In the early implementation days of Euro VI, it had already become evident that the implementation of in-use PEMS tests largely improved the on-road NOx performance of HDVs compared to previous emissions standards (Muncrief, 2015).
Acknowledgments: The authors thank all reviewers of this report for their guidance and constructive comments, with special thanks to Francisco Posada, Liuhanzi Yang, Bharadwaj Sathiamoorthy and Pierre-Louis Ragon from the International Council on Clean Transportation. The work of Konstantin Weller from Graz University of Technology in carrying out vehicle testing is greatly appreciated. The authors also thank the Swedish Transport Agency, the Swedish Transport Administration and VTT Technical Research Centre for providing additional test data used in this analysis. Funding for this work was generously provided by the European Climate Foundation.
Errata: A previous version of this report contained erroneous calculations under Euro VI-E provisions. These have been corrected in the text and in Figure 2.
© 2021 INTERNATIONAL COUNCIL ON CLEAN TRANSPORTATION
www.theicct.org
twitter @theicct

2 ICCT WORKING PAPER 2021-26 | NOX PERFORMANCE OF EURO VI-D TRUCKS AND RECOMMENDATIONS FOR EURO VII
Still, the Euro VI in-use PEMS test does not cover all the operating conditions that can be found in real-world use cases of HDVs, mainly the low-speed driving with low engine power and cold-start conditions representative of urban driving conditions. Cognizant of this situation, the European Commission has strived to extend the reach of the in-use PEMS through the different Euro VI implementation steps shown in Table 1.
Table 1. Euro VI implementation steps and respective in-use PEMS test changes
StepImplementation date
New types / All new HDVsPEMS power
thresholdPEMS minimum
coolant temperature
A 01.2013 / 01.2014
20% of max. power70°C
B (PI)a 01.2013 / 01.2014
B (CI)b 09.2014 / 09.2015
C 01.2016 / 01.2017
D 09.2018 / 09.201910% of max. power
E 09.2020 / 09.2021 30°Ca PI stands for positive-ignition engines, like gasoline enginesb CI stands for compression-ignition engines, like diesel engines
While the real-world performance of Euro VI-C HDVs has been documented in detail (Giechaskiel et al., 2019; Grigoratos et al., 2019; Vermeulen et al., 2019), there is little publicly available information on the real-world performance of Euro VI-D vehicles. The purpose of this paper is to fill that knowledge gap.
In this study, we summarize the current regulatory provisions for in-use PEMS testing, analyze the real-world emissions of seven Euro VI-D trucks, and evaluate the avenues for extending the in-use PEMS test provisions to better capture a wider range of frequently occurring conditions in real operation.
Furthermore, we analyze the impact that recent Euro VII proposals can have on driving the adoption of additional emission control technologies and compare the stringency of these proposals to California’s Heavy-Duty Omnibus Regulation, also referred to as the HDV low-NOx rule.
Regulatory backgroundThe Euro VI in-use PEMS test is performed to demonstrate compliance during the type-approval of new heavy-duty engines, as well as during in-service conformity (ISC) examinations. Thus, we refer to this on-road evaluation as the ISC test.
The ISC test is performed on the road following a well-defined range of testing conditions. These include the route type and length, payload, and ambient conditions, among others, as summarized in Table 2 for the Euro VI-D ISC test.
Table 2. ISC test conditions according to the Euro VI-D provisions
Testing requirements Three engines per engine family are tested. First test is performed at 18 months with a minimum of 25,000 km and then every two years. Testing is allowed up to useful life.
Payload At 10% to 100% for ISC, and 50-60% for type-approval demonstration.
Trip requirements 30% urban, 25% rural, and 45% motorway for HDVs over 12 tonnes (N3). Urban, rural, and motorway definition agreed with approval authority prior to testing.
Test length Long enough to complete four to eight times the work performed during the WHTCa
Ambient conditions Temperature: -7°C to 38°C Pressure: < 82.5 kPa (~1,600 meters elevation)
Treatment of DPF regeneration If regeneration occurs during testing, the manufacturer can request that the trip be voided.
a WHTC stands for the World Harmonized Transient Cycle, an engine dynamometer test cycle used for certification

3 ICCT WORKING PAPER 2021-26 | NOX PERFORMANCE OF EURO VI-D TRUCKS AND RECOMMENDATIONS FOR EURO VII
The test data is evaluated for compliance using the moving average window (MAW) evaluation method. Under the MAW method, mass emissions are calculated for subsets of a complete data set, called windows. The window size is defined by the work over the window, which must be equal to the WHTC work.1 However, not all windows are considered for evaluation. Only valid windows, as defined by requirements on the average power and the engine temperature, are used (see Table 3). A vehicle is deemed compliant if the average emissions of at least 90% of all valid windows are below the ISC limit, which is set at 1.5 times the limit over the WHTC. The key features of the data evaluation for assessing compliance under the Euro VI-D provisions are shown in Table 3.
Table 3. Window validation and evaluation of test data for compliance under the Euro VI-D provisions
ISC test NOx limit 0.69 gNOx / kWh = 1.5 × WHTC limit
Compliance evaluation Moving average window (MAW). 90% of valid windows below the in-use limits, also called 90th percentile evaluation.
Cold-start inclusion None. Evaluation of data starts once the engine has warmed up and reached a coolant temperature of 70°C.
Low-power inclusion Average engine power of the window must be greater than or equal to 10% of the rated engine power
Low-speed inclusion The average speed in urban operation must be between 15 km/h and 30 km/h
Urban operation The test is deemed invalid if less than 50% of windows are valid or if no urban-only window is left after deleting the 10% worst NOx windows.
Recently, the European Commission amended EU regulation 582/2011, introduced a number of new elements into the last implementation step of Euro VI, step E. Among them, Euro VI-E modifies the evaluation procedure of the ISC test, lowering the minimum coolant temperature for the start of data evaluation from 70°C to 30°C.
While this represents a broadening of the evaluation conditions aimed towards including cold-start emissions, it does not fully capture them. Since the ISC tests can be conducted with an ambient temperature as low as -7°C, there will be a large portion of the cold-start emissions that are omitted from the data evaluation because of the time that the engine coolant takes to reach 30°C. Furthermore, by the time data evaluation begins in such a case, the temperature of the aftertreatment system is expected to be significantly over 30°C, as it warms up at a much faster rate than the engine.
The European Union is now in the process of developing the next generation of pollutant emission standards, Euro VII. To do so, the European Commission created the Advisory Group on Vehicle Emission Standards (AGVES)2 and commissioned a group of contractors—the CLOVE consortium—to evaluate different regulatory options.3
In April 2021, the CLOVE consortium presented to AGVES its recommendations on possible limits and testing provisions (CLOVE Consortium, 2021). In it, the CLOVE consortium proposes extending the boundary conditions of the on-road PEMS test and its evaluation, as shown in Table 4.
1 The window size can also be defined in terms the CO2 emitted over the WHTC.2 AGVES consists of a wide spectrum of stakeholders including industry, civil society, research, and government
among others.3 The CLOVE consortium is formed by the following companies and institutions: Emisia (Greece), Aristotle
University of Thessaloniki (Greece), TNO (the Netherlands), the Graz University of Technology (Austria), Ricardo (UK), FEV (Germany), and VTT Technical Research Centre (Finland).

4 ICCT WORKING PAPER 2021-26 | NOX PERFORMANCE OF EURO VI-D TRUCKS AND RECOMMENDATIONS FOR EURO VII
Table 4. CLOVE proposal for on-road test and compliance evaluation for Euro VII ISC
Compliance evaluation and limits
Compliance would be evaluated using the average work-specific NOx emissions (i.e., gNOx/kWh) in three evaluation methods, with respective separate limits, as outlined below. All three limits would have to be met to demonstrate compliance.
1. 100th percentile of MAW (i.e., worst of all windows), aimed at capturing cold-start operation. Limit would range from 175 to 350 mgNOx/kWh.
2. Cumulative emissions from the start of the test to the point that three times the work done over the WHTC (3×WWHTC) is reached. This is dubbed the emissions budget. Limit would range from 100 to 150 mgNOx/kWh.
3. 90th percentile of MAW, aimed at capturing hot operation. Limit would be set at 90 mgNOx/kWh.
Ambient conditions
Normal conditions: Between -7°C and 35°C and up to an altitude of 1,600 m.
Extended conditions: Between -10°C and 45°C, and up to an altitude of 2,200 m. The applicable limits would be double those over the normal conditions.
Cold-start Evaluation of data begins at engine start. No requirement for the minimum temperature of the engine coolant or the aftertreatment system
Test lengthNo minimum requirement. However, for trips shorter than 3×WWHTC, the work-specific emissions are calculated using 3×WWHTC in the denominator, regardless of the actual trip length. For example, if the trip length is 1.5×WWHTC, then the work-specific emissions used for assessing compliance are reduced in half.
Low-power inclusion
Testing with any payloads is possible, even empty conditions.
No conditions are placed on the trip composition.
Low-load operation is allowed. However, the proposal introduces the concept of reference power—defined at 10% of the engine’s rated power, Prated—and introduces a reference power correction. The work-specific emissions are adjusted downwards by this factor. For example, if the average power is 5% of Prated, then the work-specific emissions used for assessing compliance are reduced in half.
Methodology and data sourcesPortable Emissions Measurement Systems were used to collect emissions data from vehicles driven on different routes, some of them compliant with the ISC test requirements. Data from non-ISC type tests that focused on replicating possible real-world duty cycles was also collected and analyzed in this study. Critical parameters such as speed, power, and temperatures were captured by an on-board data acquisition system. This data was merged with the PEMS Data Acquisition System and provided at a 1Hz resolution as raw data for each test.
Data sourcesData from three different PEMS campaigns on seven heavy-duty diesel trucks were analyzed in this study, as summarized in Table 5. Testing of vehicles 1, 2, and 3 were commissioned by the ICCT to Graz University of Technology. Vehicles 4 and 6 were tested by AVL MTC Motortestcenter AB for the Swedish Transport Agency and the Swedish Transport Administration. Vehicles 5 and 7 were tested by VTT Technical Research Centre.
The vehicles were produced by five different manufacturers, with vehicles 5, 6, and 7 belonging to the same brand. Five vehicles were tractor-trailers and two were urban rigid trucks. Vehicle 7 was equipped with a dual-fuel LNG engine with HPDI technology. All seven trucks were N3 vehicles certified to meet Euro VI-D emission standards and were first registered between 2019 and 2020.

5 ICCT WORKING PAPER 2021-26 | NOX PERFORMANCE OF EURO VI-D TRUCKS AND RECOMMENDATIONS FOR EURO VII
Table 5. Vehicle specifications
VehicleRated power
(kW)Speed (rpm)
Torque (Nm)
Engine size (L)
WHTC work (kW)
GCVW (tonnes)
Axle / body configuration
Vehicle 1 194 2300 1000 7 17 16 4x2, rigid
Vehicle 2 375 1800 2884 12 36 40 4x2, tractor
Vehicle 3 175 1800 1000 8 17 15 4x2, rigid
Vehicle 4 427 1900 3000 16 42 40 4x2, tractor
Vehicle 5 338 2100 2300 13 32 40 4x2, tractor
Vehicle 6 345 1900 2600 13 34 40 4x2, tractor
Vehicle 7 338 2100 2300 13 32 40 4x2, LNG tractor
A total of 18 tests were compliant with the Euro VI in-service conformity (ISC) testing provisions, supplemented by 15 real-world operation tests that did not comply with the ISC boundary conditions, hereafter referred to as non-ISC tests. All ISC tests included cold-start operation and varied in payload from 10%–100%, as summarized in Table 6.
Table 6. Summary of ISC tests evaluated
Vehicle
ISC tests
Number of tests Payload Ambient temperature
Vehicle 1 3 55% 8°C
Vehicle 2 3 10% 15°C
Vehicle 3 3 10% 19°C
Vehicle 4 4 1x10%, 2x55%, 1x100% 8°C
Vehicle 5 1 60% 7°C
Vehicle 6 2 55% 11°C
Vehicle 7 2 60% 4°C
For the non-ISC tests, only 8 of the 15 included cold-start operation (see Table 7). Since cold-start emissions are usually the highest NOx emitting event of a test, we only analyze the eight non-ISC tests that include cold-start for this study. The non-ISC tests presented in this study varied widely in operating conditions. Still, the analysis focuses on low-load, low-speed operation to evaluate NOx emissions in challenging control areas.
Table 7. Summary of non-ISC tests evaluated
Vehicle
Non-ISC tests
Non-ISC route Cold-startNumber of tests Payload
Vehicle 1 1 20% Low-load Yes
Vehicle 2 3 10% Low-load, urban, regional Yes
Vehicle 3 4 10% Low-load, 2 × urban, regional Yes
Data processing The raw test data was analyzed in detail to gain a good understanding of the vehicles’ performance in different operating conditions. The results were also post-processed according to the regulatory evaluation methods to assess compliance with applicable limits and to quantify the reductions necessary to meet future limits. The objective of these analyses was to gain a better understanding of highest NOx emitting operating conditions, evaluate the different data processing mechanisms, and provide technical

6 ICCT WORKING PAPER 2021-26 | NOX PERFORMANCE OF EURO VI-D TRUCKS AND RECOMMENDATIONS FOR EURO VII
feedback on the ongoing Euro VII developments. The data processing routine, with the respective evaluation methods, is outlined in Figure 1.
Euro VIICLOVE
Raw test data from each vehicle
Parameters of interest:• Engine rpm and vehicle speed• Engine power output during test• Coolant and exhaust temperatures• NOx emissions
Speed bins• 1-10 km/h• 10-20 km/h• 20-40 km/h• 40-50 km/h• 60-80 km/h• >80 km/h
Power bins(% of Prated)• 0-5%• 5-10%• 10-20%• 20-30%• >30%
Trip validation, for ISC tests
Euro VIISC-MAWmethod
California’s3B-MAW
Power threshold• 5%, 10%
Coolant temperature threshold• No exclusion, 30°C, 70°C
Percentile for evaluation• 90th, 95th, 100th
g N
Ox /
kW
hg
NO
x / k
m%
of
NO
x by
mas
s sh
are
Idle (0-6% of normalized CO2)Low (6-20% of normalized CO2)Med/High (>20% of normalized CO2)
Validation with EMROAD
100th percentile3×WWHTC budget90th percentile
Figure 1. Schematic representation of the evaluation methodology for NOx emissions
The test data was used to perform six different assessments, which are summarized below.
1. Compliance under the ISC provisions set by the Euro VI-D standards.
2. Compliance under the ISC provisions set by the final implementation step of Euro VI standards. That is, we evaluated if the vehicles type-approved to Euro VI-D would comply with the Euro VI-E provisions.
3. Real-world performance of the vehicles with different engine loads and at different vehicle speeds, independently of the compliance evaluation provisions set by Euro VI.
4. Impact on compliance from further extensions to ISC provisions for evaluating the test data. These extensions aim to include a larger portion of vehicle operating conditions. To this end, we explored different exclusion criteria such as the window power, the definition of the cold-start temperature, and the percentile used for compliance evaluation.
5. Evaluation of test data with the provisions from the newly adopted on-road tests provisions in California, called the 3-Bin MAW method. The aim of this analysis is to identify the level of improvement that Euro VI-D vehicles would

7 ICCT WORKING PAPER 2021-26 | NOX PERFORMANCE OF EURO VI-D TRUCKS AND RECOMMENDATIONS FOR EURO VII
need to comply with California’s Heavy-Duty Omnibus Regulation (California Air Resources Board, 2020).
6. Evaluation of test data with the provisions proposed by the CLOVE consortium. The aim of this analysis is to identify the level of improvement that Euro VI-D would need to comply with the proposed CLOVE limits.
Validation of post-processing methodologyThe work-based trip validation and work-based windows results obtained using the existing compliance standards (Euro VI-D) were cross validated against the EMROAD tool (Joint Research Centre, 2020). EMROAD, developed by the European Commissions’ Joint Research Centre, is primarily used to support the development of PEMS data evaluation methods under the European legislative framework. The EMROAD golden data set is a PEMS test in compliance with the ISC regulations used to benchmark calculations conducted with any tool against those obtained from EMROAD. The data processing routine developed for this study were comparable against the EMROAD tool, resulting in differences of less than 0.2% when calculating the work-specific emissions used for compliance evaluation (see Table 3).
Compliance evaluation against regulatory requirements To assess the compliance of the test vehicles against the regulatory provisions, we evaluated the NOx emissions using the MAW method over the tests conforming to the ISC requirements (see Table 6). Although the test vehicles were all certified to Euro VI-D, we also evaluated the test data following the Euro VI-E provisions.
The MAW analysis was done using the engine work as the central metric. That is, the window size was defined by the reference engine work, equaling the work performed over the WHTC cycle. A new window was started at each second of test data, provided there were sufficient data available to complete the reference work. A vehicle is deemed compliant if the average emission of at least 90% of valid-windows is below the ISC-limit of 0.69 gNOx/kWh, which equals the limit of 0.46 gNOx/kWh over the WHTC, multiplied by a conformity factor of 1.5. The validity criteria for windows differs slightly between Euro VI-D and Euro VI-E provisions. For Euro VI-D, the engine coolant temperature at the start of any window must be above 70°C. In Euro VI-E, that threshold is lowered to 30°C. Compliance is evaluated using a weighted average of the cold and hot performance. The worst valid window starting with a coolant temperature above 30°C but below 70°C is weighted with 0.14, and the 90th percentile of the hot windows, that is the value used for compliance under Euro VI-D, is weighted with 0.86. The results are shown in Figure 2.

8 ICCT WORKING PAPER 2021-26 | NOX PERFORMANCE OF EURO VI-D TRUCKS AND RECOMMENDATIONS FOR EURO VII
Vehicle 1 Vehicle 2 Vehicle 3 Vehicle 4 Vehicle 5 Vehicle 6 Vehicle 70.0
0.1
0.2
0.3
0.4
0.5
0.6
0.7
0.8
ISC
MA
W N
Ox (
g/k
Wh)
Euro VI-E evaluationEuro VI-D evaluation
Euro VII SC limit
Euro VI WHTC limit
Figure 2. Evaluation of NOx emissions using Euro VI-D and Euro VI-E ISC provisions. Bar is the average over all tests. Whiskers represent the min-to-max range for each vehicle.
Of the 18 ISC tests, all but one meet the on-road NOx limits, not only using the Euro VI-D data evaluation provisions, but also using Euro VI-E provisions. For Vehicle 4, a single ISC test out of four resulted in emissions above ISC limit. Across all vehicles, the average Euro VI-D ISC NOx emissions—that is, the value obtained from the 90th percentile of the MAW method—were found to be 0.27 g/kWh. That is, around 1.7 times lower than the WHTC certification limit and about 2.5 times lower than the ISC limit. However, as indicated in Figure 2, there is large variability in the NOx emissions across vehicles. For example, Vehicle 4 yields 0.63 gNOx/kWh while Vehicle 7 yields only 0.03 gNOx/kWh.
Euro VI-E leads to the weighted inclusion of one additional window with low engine coolant temperature into the MAW evaluation. However, as shown in Figure 2, this extension has a limited impact on the MAW NOx emissions used to assess compliance. A deeper analysis of the test data reveals the causes of this observation:
» By the time the engine coolant temperature has reached 30°C, the temperature of the aftertreatment systems is around 75 °C, which is significantly higher than the ambient temperature. As a result, the emissions of the worst valid window starting with a coolant temperature above 30°C but below 70°C exhibits NOx emissions that are, in average across all vehicles, only 50% higher than those captured by Euro VI-D. Therefore, the Euro VI-E provisions, which were developed to capture cold-start emissions, do not do so in practice.
» While the tests were performed by experienced teams observing the urban, rural, and motorway route requirements prescribed in the regulation, some of the runs did not result in valid ISC test. For Vehicle 2 and Vehicle 3, which were tested at low payloads, no urban-only windows were left in some tests after removing invalid windows and deleting the 10% worst performing windows. Thus, many of the additional windows that would have been made valid by the extended coolant temperature provisions of Euro VI-E were then invalidated by the 10% average power requirement.
9 ICCT WORKING PAPER 2021-26 | NOX PERFORMANCE OF EURO VI-D TRUCKS AND RECOMMENDATIONS FOR EURO VII
In summary, given that current Euro VI-D vehicles can already comply with the requirements under Euro VI-E, this last implementation step of the Euro VI emission standards is not expected to have a measurable impact on improving the cold-start and urban operation performance of HDVs.
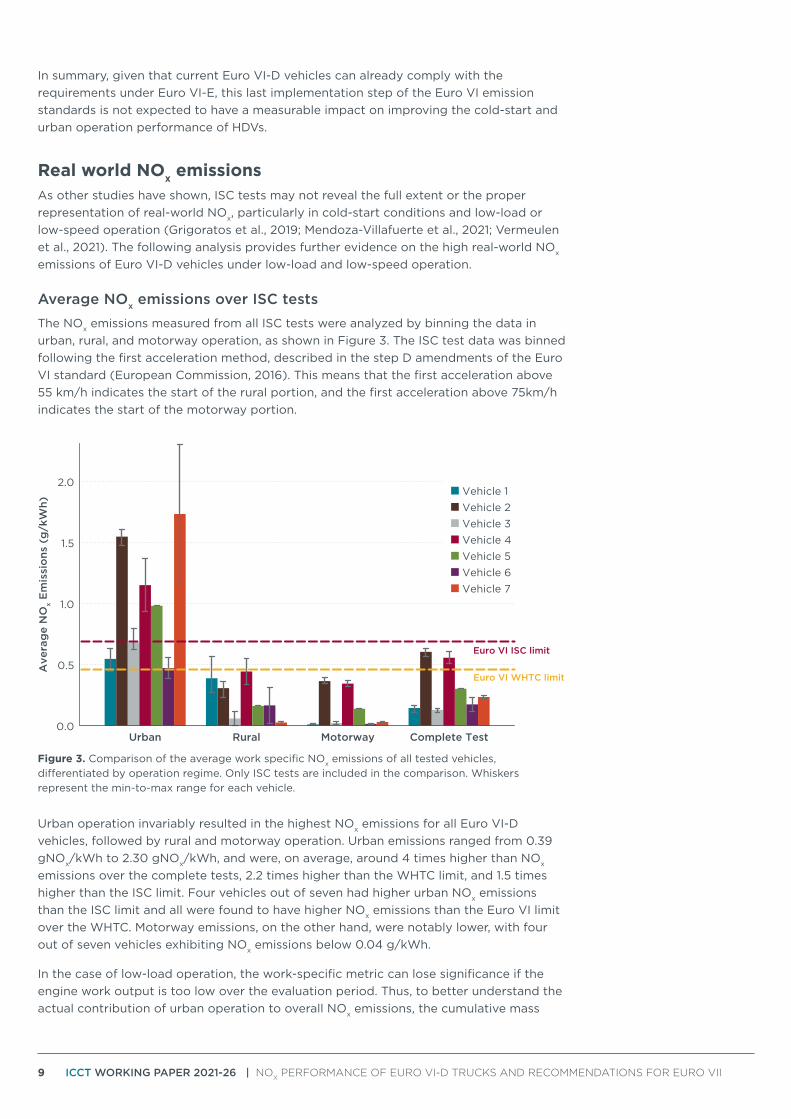
Real world NOx emissions As other studies have shown, ISC tests may not reveal the full extent or the proper representation of real-world NOx, particularly in cold-start conditions and low-load or low-speed operation (Grigoratos et al., 2019; Mendoza-Villafuerte et al., 2021; Vermeulen et al., 2021). The following analysis provides further evidence on the high real-world NOx emissions of Euro VI-D vehicles under low-load and low-speed operation.
Average NOx emissions over ISC tests The NOx emissions measured from all ISC tests were analyzed by binning the data in urban, rural, and motorway operation, as shown in Figure 3. The ISC test data was binned following the first acceleration method, described in the step D amendments of the Euro VI standard (European Commission, 2016). This means that the first acceleration above 55 km/h indicates the start of the rural portion, and the first acceleration above 75km/h indicates the start of the motorway portion.
Euro VI ISC limit
Euro VI WHTC limit
Urban Rural Motorway Complete Test0.0
0.5
1.0
1.5
2.0
Ave
rag
e N
Ox E
mis
sio
ns (
g/k
Wh)
Vehicle 1Vehicle 2Vehicle 3Vehicle 4Vehicle 5Vehicle 6Vehicle 7
Figure 3. Comparison of the average work specific NOx emissions of all tested vehicles, differentiated by operation regime. Only ISC tests are included in the comparison. Whiskers represent the min-to-max range for each vehicle.
Urban operation invariably resulted in the highest NOx emissions for all Euro VI-D vehicles, followed by rural and motorway operation. Urban emissions ranged from 0.39 gNOx/kWh to 2.30 gNOx/kWh, and were, on average, around 4 times higher than NOx emissions over the complete tests, 2.2 times higher than the WHTC limit, and 1.5 times higher than the ISC limit. Four vehicles out of seven had higher urban NOx emissions than the ISC limit and all were found to have higher NOx emissions than the Euro VI limit over the WHTC. Motorway emissions, on the other hand, were notably lower, with four out of seven vehicles exhibiting NOx emissions below 0.04 g/kWh.
In the case of low-load operation, the work-specific metric can lose significance if the engine work output is too low over the evaluation period. Thus, to better understand the actual contribution of urban operation to overall NOx emissions, the cumulative mass

10 ICCT WORKING PAPER 2021-26 | NOX PERFORMANCE OF EURO VI-D TRUCKS AND RECOMMENDATIONS FOR EURO VII
of NOx emitted over each operation regime was analyzed. As shown in Figure 4, urban operation was responsible for 50% to 90% of total NOx emissions over the ISC tests, with four vehicles emitting more than 70% of their NOx emissions in this type of operation.
Urban Rural Motorway0
20
40
60
80
100
Mas
s sh
are
of
tota
l NO
x em
issi
ons
(%
)
Vehicle 1Vehicle 2Vehicle 3Vehicle 4Vehicle 5Vehicle 6Vehicle 7
Figure 4. Average share of total NOx emissions over the different operation conditions. Only ISC tests are included in the comparison. Whiskers represent the min-to-max range for each vehicle.
Average NOx emissions over non-ISC tests Vehicles 2 and 3 were tested over various non-ISC routes, targeted at capturing the following three real-world operation conditions:
1. Low-load operation: The on-road test was designed to approximate California’s low-load cycle (LLC), introduced by the state’s new Heavy-Duty Omnibus Regulation. The test represents real-world vehicle operations, characterized by low engine loads and low vehicle speeds, with approximately two hours of test duration and with several transitions between high- and low-load.
2. Urban delivery: The on-road test was designed to approximate to the driving profile in the urban delivery cycle of VECTO.4 An urban trip of 30 minutes– 45 minutes was followed by a short motorway operation of less than 5 minutes, and then continued again with urban driving. This combination was repeated three times totaling around two hours of driving.
3. Regional delivery: The test included a combination of urban, rural, and motorway operation. The goal was for the on-road test to approximate the driving profile in the regional delivery cycle of VECTO, and not to satisfy the ISC requirements under Euro VI-D. The test duration was approximately 2.5 hours.
The work-specific NOx emissions, averaged over the entirety of the tests described above, are shown in Figure 4. Vehicle 2, which was a 40-tonne tractor-trailer loaded at 10% of its maximum payload, exhibited emissions in low-load operation that are 4 times higher than the WHTC limit. In the urban route, the average NOx emissions are 3
4 VECTO is a simulation tool and the cornerstone of the CO2 emissions certification procedure for HDVs in the EU

11 ICCT WORKING PAPER 2021-26 | NOX PERFORMANCE OF EURO VI-D TRUCKS AND RECOMMENDATIONS FOR EURO VII
times the WHTC limit. Vehicle 3, which was a 15-tonne rigid truck loaded at 10% of its maximum payload, exhibited better NOx emissions performance. In the low-load route, NOx emissions were 1.6 times higher than the WHTC limit. The emissions over the urban route were close to the WHTC limit.
Vehicle 2 Vehicle 30.00
0.25
0.50
0.75
1.00
1.25
1.50
1.75
Ave
rag
e N
Ox e
mis
sio
ns (
g/k
Wh)
Euro VI ISC limit
Euro VI WHTC limit
Low loadUrbanRegional
Figure 5. Work-specific NOx emissions of Vehicle 2 and Vehicle 3 over non-ISC tests
Speed and Power Bins for ISC testsTo better understand the NOx emissions performance in different operation regimes, we classified all ISC data into several power and vehicle speed bins, using the moving average window principle with a fixed window size of 20 minutes, and starting a new window at every second of data. The results, shown in Figure 6, are presented as the average value from all vehicles, represented by the bars, and the results of each vehicle, represented by the markers. The results include three different metrics:
1. Average emissions-specific NOx emissions, in g/kWh: The mass emissions over a window divided by the work done. All window results are averaged.
2. Average distance-specific NOx emissions, in g/km: The mass emissions over a window divided by the distance covered. All window results are averaged.
3. NOx mass share: The total mass from all windows within the respective speed bins divided by the total mass from all windows in all speed bins.

12 ICCT WORKING PAPER 2021-26 | NOX PERFORMANCE OF EURO VI-D TRUCKS AND RECOMMENDATIONS FOR EURO VII
1-10 10-20 20-40 40-60 60-80 >80 0-5% 5-10% 10-20% 20-30% >30%
Speed bins (km/h) Power bins (% of Prated)
0
1
2
3
NO
x em
issi
ons
(g
/km
)
0.0
0.5
1.0
1.5
2.0
2.5
NO
x em
issi
ons
(g
/km
)
0
20
40
60
NO
x mas
s sh
are
(%)
NO
x mas
s sh
are
(%)
0
20
40
60
0
1
2
3
NO
x em
issi
ons
(g
/kW
h)
0
1
2
3
NO
x em
issi
ons
(g
/kW
h)
Vehicle 1Vehicle 2Vehicle 3Vehicle 4Vehicle 5Vehicle 6Vehicle 7
Figure 6. NOx emissions over the ISC tests, evaluated with a fixed 20-minute window size and binned by their average power and vehicle speed
Distance- and work-specific NOx emissions are highest for low-speed and low-load operation. This is due to a combination of poor performance of the emissions control system—resulting in high amounts of NOx being emitted at the tailpipe—and a shrinking denominator in these operating conditions during the evaluation window with a fixed duration of 20 minutes. Thus, the following discussion focuses on the NOx mass share (bottom diagrams in Figure 6).
Low-speed operation, below 20 km/h of average speed, contributes substantially to the overall NOx emissions. For Vehicles 1 and 2, low-speed NOx emissions account for around 15% and 35% of the total emissions over the ISC tests, respectively. Vehicle 3, despite having the second-best NOx emissions results under the Euro VI-D compliance evaluation methodology (see Figure 2), exhibited the worst low-speed performance, with around 60% of NOx emissions attributed to speeds below 20 km/h.
Similarly, low-load operation—that is, with an average value below 10% of the engine’s rated power—represents a disproportionate portion of NOx emissions. For Vehicles 1, 2 and 3, the share of NOx emissions in low-load operation are approximately 30%, 40%, and 60%, respectively. Vehicle 7, an LNG tractor-trailer exhibiting the best results of the

13 ICCT WORKING PAPER 2021-26 | NOX PERFORMANCE OF EURO VI-D TRUCKS AND RECOMMENDATIONS FOR EURO VII
seven tested vehicles under the Euro VI-D compliance evaluation methodology (see Figure 2), exhibited the highest share of NOx emissions in the 5%–10% power bin, at around 50% of overall NOx emissions.
This moving average analysis with a fixed window size of 20 minutes, illustrates the limitations of Euro VI-D HDVs in low-speed and low-load conditions, even when the official ISC-test results indicate adequate performance. Vehicles 3 and 7 illustrate this point well: While they obtained the best results under the official Euro VI-D compliance evaluation, they also showed the worst low-speed and low-load NOx values.
Analysis of Euro VI in-service-conformity evaluation The analysis in the previous sections shows that the current Euro VI provisions for ISC on-road tests have limitations capturing some real-world operating conditions with high NOx emissions, such as cold-start, low-load, and low-speed driving. In this section we consider possible extensions to the current ISC provisions to improve their performance. To that end, we conducted a sensitivity analysis on the different thresholds and exclusions of the Euro VI ISC methodology. We assessed the following three parameters and values:
1. Average power threshold of valid windows: Expressed as a percentage of the engine’s rated power, we assessed a value of 10% (current under Euro VI) and 5%.
2. Exclusion of cold-start data: The relevant metric is the engine’s coolant temperature at which the data evaluation begins. We assessed a 70°C threshold (Euro VI-D provisions), a 30°C threshold (Euro VI-E provisions), and a scenario which included all data beginning with the engine start.
3. Percentile used for assessing compliance: In the Euro VI MAW method, only 90% of the windows must exhibit average NOx emissions below the set limit. We assessed the 90th percentile evaluation, together with the 95th percentile and the 100th percentile (i.e., the worst window is used to assess compliance).
The key results of this assessment are shown Figure 7. The figure displays the impact that extending the ISC provisions would have on the NOx emissions used for compliance for each individual vehicle tested. For each vehicle, the three dimensions of the analysis are presented as follows: The two separate diagrams distinguish between the power threshold values of 5% and 10%, the cold temperature exclusions are shown by the different sets of bars, and the color scheme in each bar-set represents the percentile used for evaluation. Further results for each vehicle, including the NOx emissions over each window, can be found in Figure A 1 in the Appendix.

14 ICCT WORKING PAPER 2021-26 | NOX PERFORMANCE OF EURO VI-D TRUCKS AND RECOMMENDATIONS FOR EURO VII
0.0
0.2
0.4
0.6
0.8
Vehicle 1
Vehicle 3
Vehicle 5
Vehicle 7
Vehicle 2
Vehicle 4
Vehicle 6
0.00
0.25
0.50
0.75
1.00
1.25
1.50
0.0
0.2
0.4
0.6
0.00
0.25
0.50
0.75
1.00
1.25
1.50
0.0
0.2
0.4
0.6
0.8
0.0
0.2
0.4
0.6
All
dat
a
30°C
70°C A
lld
ata
30°C
70°C A
lld
ata
30°C
70°C A
lld
ata
30°C
70°C
All
dat
a
30°C
70°C A
lld
ata
30°C
70°C A
lld
ata
30°C
70°C A
lld
ata
30°C
70°C
All
dat
a
30°C
70°C A
lld
ata
30°C
70°C
All
dat
a
30°C
70°C A
lld
ata
30°C
70°C
All
dat
a
30°C
70°C A
lld
ata
30°C
70°C
0.0
0.2
0.4
0.6
0.8
NO
x em
issi
ons
(g
/kW
h)
NO
x em
issi
ons
(g
/kW
h)
NO
x em
issi
ons
(g
/kW
h)
NO
x em
issi
ons
(g
/kW
h)
NO
x em
issi
ons
(g
/kW
h)N
Ox e
mis
sio
ns (
g/k
Wh)
NO
x em
issi
ons
(g
/kW
h)
90th perc.95th perc.100th perc.
Notes:
1. The power threshold used for data evaluation is expressed as a percentage of the engine’s rated power.
2. The exclusion of cold start data is a function of the engine’s coolant temperature at which the data evaluation begins.
3. The percentile used for assessing compliance represents the percentage of the windows that must have average emissions below the set limit.
5% powerthreshold
10% powerthreshold
5% powerthreshold
10% powerthreshold
5% powerthreshold
10% powerthreshold
5% powerthreshold
10% powerthreshold
5% powerthreshold
10% powerthreshold
5% powerthreshold
10% powerthreshold
5% powerthreshold
10% powerthreshold
Figure 7. Sensitivity analysis of extending the scope of the ISC MAW evaluation method on the reported NOx emissions.

15 ICCT WORKING PAPER 2021-26 | NOX PERFORMANCE OF EURO VI-D TRUCKS AND RECOMMENDATIONS FOR EURO VII
We arrive at the following findings from the sensitivity analysis of the European ISC MAW method:
1. Extending the cold-start provisions by lowering the minimum engine coolant temperature at which the data evaluation begins has little to no effect if compliance is evaluated using the 90th percentile. For all tested vehicles except Vehicle 5, the 90th percentile NOx emissions were virtually the same, regardless of the threshold used for the coolant temperature in the data evaluation. Thus, including cold-start data into the ISC provisions can only have an impact on compliance if it is accompanied by an increase in the percentile for evaluation.
2. Lowering the power threshold to 5% of rated power without changing the percentile used for evaluation has insignificant effects in most cases. High NOx-emitting events that are included by lowering the power threshold to 5% of Prated are excluded from the compliance verification by the 90th percentile evaluation. Thus, the lowering of the power threshold must go along with an increase in the percentile for evaluation.
3. Starting from the Euro VI-E provisions—that is, a minimum of 10% of rated power and 30°C of coolant temperature—and extending the window evaluation to the 95th percentile is not sufficient to make the ISC test representative of urban conditions. Under this extended ISC evaluation conditions, only Vehicle 4 would exceed the ISC limit. In contrast, five vehicles out of seven showed higher urban NOx emissions than the ISC limit.
4. For the ISC test evaluation to be representative of the real-world urban emissions, the power threshold must be lowered to at least 5% of Prated, all constrains for the inclusion of cold-start data must be removed, and the percentile for evaluation must be increased to 100% (worst window). These extensions to the ISC procedure would ensure that the work-specific NOx emissions used for compliance evaluation are comparable to the measured real-world emissions in urban operation (see Figure 3).
Evaluation using California’s 3-bin methodologyThe California Air Resources Board (CARB) has adopted a new method to evaluate in-use emissions from diesel engines, called the 3-binned moving average window (3B-MAW).
The 3B-MAW method distinguishes between three bins of operation and categorizes them into three separate operational bins, one for idle operation, one for low-load operation, and one for medium- and high-load operation. The mass emissions are evaluated using a MAW method based on a fixed window duration of 300 seconds. The resulting windows are binned into the different operating conditions depending on the normalized CO2 emissions over the window duration, which is a surrogate for power output.5 Compliance is evaluated in each bin separately.
The bins, and the applicable limits are shown in Table 8.
5 The mass CO2 emissions over a window are normalized by the product of the certified work-specific CO2 emissions over the over an FTP test cycle, in units of gCO2/bhp-hr, with the work output that the engine would produce if it were operating at rated power over the window duration.

16 ICCT WORKING PAPER 2021-26 | NOX PERFORMANCE OF EURO VI-D TRUCKS AND RECOMMENDATIONS FOR EURO VII
Table 8. Definitions of bins and applicable limits under California’s 3B-MAW method.
BinNormalized average
window CO2 rate2027 in-use limits at less
than 700,000 km
Idle CO2, normalized ≤ 6% 1.5 × idle limit = 7.5 g NOx / h
Low 6% < CO2, normalized ≤ 20% 1.5 × LLCa limit = 0.10 g NOx / kWh
Medium/high 20% < CO2, normalized 1.5 × FTPb limit = 0.04 g NOx / kWh
a Low-load cycle b Federal Test Procedure, heavy-duty transient cycle
Although CARB specifies a timeline which gradually includes higher contribution from cold-start and lowers the amount of data exclusions, we based the analysis in this study on provisions to be implemented in 2027, where no exclusions of any kind take place when analyzing the in-use test data for compliance evaluation purposes.
The ISC test data from the seven Euro VI-D trucks was processed following the 3B-MAW methodology. The results, summarized in Figure 8, show that most Euro VI-D vehicles tested would already comply with California’s in-use idling standards.6 Furthermore, three out of the seven tested vehicles would also comply with the stringent in-use limits of the medium/high bin, demonstrating the excellent performance of some Euro VI-D vehicles in warmed-up, high-load operation. However, none of the Euro VI-D vehicles would be compliant with the in-use limits set for the low-load bin: The NOx emissions of Euro VI-D vehicles in low-load conditions would need to decrease between 65% and 88% to comply with California’s 2027 in-use provisions.
3B-M
AW
NO
x (g
/h)
0
2
4
6
8
10
12
Idle bin
3B-MAW limit
0.0
0.1
0.2
0.3
0.4
0.5
0.6
0.7
0.8
3B-M
AW
NO
x (g
/kW
h)
Low-load bin
Vehicle 1Vehicle 2Vehicle 3Vehicle 4Vehicle 5Vehicle 6Vehicle 7
0.0
0.1
0.2
0.3
0.4
0.5
0.6
0.7
0.83B
-MA
W N
Ox (
g/k
Wh)
Med./high-load bin
3B-MAW limit
3B-MAW limit
Figure 8. Evaluation of test data following CARB’s 3B-MAW method
Evaluation using CLOVE’s proposal on Euro VIIIn April 2021, the CLOVE consortium presented its recommendations to AGVES on possible Euro VII limits and testing provisions (CLOVE Consortium, 2021), as summarized in Table 4. The proposed Euro VII provisions would define three evaluation methods with
6 The test data from vehicle 6 and 7 was not sufficient to meet the requirements of the 3B-MAW provisions, and thus no idle-bin assessment was possible for those two vehicles.

17 ICCT WORKING PAPER 2021-26 | NOX PERFORMANCE OF EURO VI-D TRUCKS AND RECOMMENDATIONS FOR EURO VII
separate respective limits. Two scenarios are proposed for the limits, referred to as HD2 and HD3, with different levels of stringency:
1. 100th percentile of MAW: Aimed at capturing cold-start operation. Limit would range from 175 mgNOx/kWh (HD3) to 350 mgNOx/kWh (HD2).
2. Cumulative emissions in a test equivalent to 3 times the work done over the WHTC (3×WWHTC): Limit would range from 100 mgNOx/kWh (HD3) to 150 mgNOx/kWh (HD2).
3. 90th percentile of MAW: Aimed at capturing hot operation. Limit would be set at 90 mgNOx/kWh for both HD2 and HD3 scenarios.
The CLOVE consortium also proposes a simplification for the definition of the window work. The WHTC work would be estimated as 0.11 times the rated power. In this analysis, we did not include such definition of the window size, as we found it to overestimate the WHTC work between 15% and 25%. We used the WHTC work in the MAW analysis.
Under the Euro VII proposal from CLOVE, the limits mentioned above would have to be met in ambient temperatures between -7 °C and 35 °C and up to an altitude of 1,600 m. The data evaluation would begin at engine start, without a requirement for the minimum temperature of the engine coolant or the aftertreatment system. No conditions are placed on the minimum payload during testing or on the duration and composition of the trip.
In principle, the above conditions enable testing in all low-power conditions. However, the CLOVE proposal includes provisions to correct—that is, to adjust downwards—the work-specific emissions when the vehicle is operated at a power below 10% of the engine’s rated power. This is called, the reference power correction. For example, if the average power is 5% of Prated, then the work-specific emissions used for assessing compliance are reduced in half.
The test data from the seven Euro VI-D trucks was processed following the CLOVE methodology proposed for Euro VII, with and without the aforementioned reference power correction. The results for Vehicle 2 and Vehicle 3, over non-ISC trips (see Table 7), are shown in Figure 9. For comparison purposes, we also show the results of the evaluation with CARB’s 3B-MAW methodology, in the low-load bin.

18 ICCT WORKING PAPER 2021-26 | NOX PERFORMANCE OF EURO VI-D TRUCKS AND RECOMMENDATIONS FOR EURO VII
3xWHTC
100th,%-ile
3B-MAW,Low-load
0.0
0.5
1.0
1.5
2.0
0.0
0.5
1.0
1.5
0.0
0.2
0.4
0.6
0.8
1.0
0.0
CLOVE Euro VII
0.2
0.4
0.6
0.8
0.0
0.2
0.4
0.6
0.0
0.1
0.2
0.3
0.4
0.5
0.6
NO
x (g
/kW
h)N
Ox (
g/k
Wh)
Low-load test Urban test Regional test
Vehicle 2
Vehicle 3
HD3
HD2
HD3
HD23B-MAWlimit
Without ref.power correction
3xWHTC
100th,%-ile
3B-MAW,Low-load
CLOVE Euro VII
3xWHTC
100th,%-ile
3B-MAW,Low-load
CLOVE Euro VII
Figure 9. NOx emissions from Vehicle 2 and Vehicle 3, over non-ISC tests, using CLOVE’s Euro VII and CARB’s 3B-MAW methodologies. Horizontal lines represent the respective limits over the different data evaluation methods. For Vehicle 3, the urban test results shown are the average of two runs.
The results show that the reference power correction would have a significant impact on the metric used for compliance in the 100th percentile evaluation. For Vehicle 2 and Vehicle 3, a tractor-trailer and a small rigid truck at low payload, the low-load operation below 10% of rated power represents about two-thirds of NOx emitted and accounted for around 75% of all test conditions. Given this prevalence of engine operation below 10% of rated power and the large impact that such operation conditions have on the overall NOx emissions over a trip, the reference power correction provisions do not ensure that those conditions are adequately included in the compliance evaluation and that the regulation drives technology adoption targeted at them. For example, to comply with the HD2 limit on the 100th percentile evaluation, Vehicle 3 would only need to reduce emissions between 15% and 40%. In contrast, to meet CARB’s 3B-MAW low-load bin limit, the improvement would have to be between 70% and 80%.
Figure 10 shows the relative improvement that each Euro VI-D vehicle would have to achieve to comply with CLOVE’s proposal and CARB’s adopted limits. On average for the 7 vehicles tested, California’s standards would require larger relative improvements than CLOVE’s proposal, particularly in low-load and cold-started operation. California’s regulation would mandate approximately a sevenfold improvement (i.e., 85% reduction from current NOx emissions), compared to around a fourfold improvement from the most stringent CLOVE proposal, HD3. However, the elimination of the reference power correction would bring the relative improvement mandated by the 100th percentile limit closer to that estimated from California’s regulation.

19 ICCT WORKING PAPER 2021-26 | NOX PERFORMANCE OF EURO VI-D TRUCKS AND RECOMMENDATIONS FOR EURO VII
100th %-ile 30
2
4
6
8
NO
x im
pro
vem
ent
fact
or
to c
om
ply
wit
h st
and
ard
s
HD2 HD3
3B-MAWLow
Warmed-up, high-load
Compliance
Cold-start, low-load
CLOVE, Euro VII CARB
w/o ref. powercorrection
WHTC Budget 3B-MAWMed/High
CLOVE, Euro VII CARB
90th %-ile
Figure 10. Improvement required in NOx emission performance to comply with CLOVE’s Euro VII and CARB’s limits. Each dot represents the average performance of a single vehicle. Bars are the average across all vehicles.
Findings and policy recommendationsIn this study we analyzed the real-world emissions of seven Euro VI-D trucks, identified limitations of the adopted in-service conformity provisions, and evaluated several avenues to better capture a wider range of common driving conditions. The latter were informed by recent policy developments in the European Union and the United States. We arrived at the following key findings:
» All vehicles meet the on-road NOx limits, not only using the Euro VI-D data evaluation provisions, but also using Euro VI-E provisions. While Euro VI-E includes additional windows with lower engine coolant temperature in the MAW evaluation, the evaluated Euro VI-D vehicles can already comply with the requirements under Euro VI-E. Therefore, this last implementation step of the Euro VI emission standards is not expected to have a measurable impact on improving the cold-start and urban operation performance of HDVs.
» Urban operation is responsible for 50% to 90% of total NOx emissions. Over the analyzed ISC tests, urban operation invariably resulted in the highest NOx emissions for all Euro VI-D vehicles, followed by rural and motorway operation. Low-speed operation at below 20 km/h of average speed and low-load operation with an average value below 10% of the engine’s rated power account for a disproportionate portion of overall NOx emissions.
» The Euro VI ISC methodology to assess step D or step E compliance does not capture the real-world NOx performance in cold-start conditions and low-load or low-speed operation. The two trucks that obtained the best results under the official Euro VI-D compliance evaluation, also showed the worst low-speed and low-load NOx performance.

20 ICCT WORKING PAPER 2021-26 | NOX PERFORMANCE OF EURO VI-D TRUCKS AND RECOMMENDATIONS FOR EURO VII
» For the ISC test evaluation to be representative of the real-world urban emissions, the power threshold would need to be lowered, all cold-start data must be included, and the percentile for evaluation must be increased to 100%. These extensions to the ISC procedure would ensure that the work-specific NOx emissions used for compliance evaluation are comparable to the measured real-world emissions in urban operation.
» To comply with California’s adopted NOx standards for 2027, the NOx emissions of Euro VI-D vehicles in low-load conditions would need to decrease between 65% and 88%. California’s 3B-MAW evaluation protocol is the most demanding for HDV real-world NOx evaluation in the low load component. At higher loads, three out of the seven tested vehicles would already comply with the stringent in-use limits in medium- to high-load operation, demonstrating the excellent performance of some Euro VI-D vehicles in warmed-up, high-load conditions.
» Across the 7 Euro VI-D vehicles tested, NOx emissions would have to be reduced, on average, to one-quarter of current values to comply with CLOVE’s most stringent Euro VII proposal in cold-start and low-load. California’s standards would require larger relative improvements than CLOVE’s proposal, mandating emissions to be reduced to one-seventh of current values.
While Euro VI standards have been successful in improving the real-world NOx performance of new HDVs, the potential of emission control technologies has not been fully exploited. With the upcoming Euro VII standards, the European Commission has an opportunity to put forward an ambitious Euro 7/VII proposal with a robust policy design that will drive advanced emission control technologies to the market, as will be the case with California’s regulation. Based on our findings, we offer the following policy recommendations:
» The proposal put forward by the CLOVE consortium to adjust work-specific emissions downwards through the reference power correction is not recommended. Given the prevalence of engine operation below 10% of rated power and the large impact that such operation conditions have on the overall NOx emissions over a trip, Euro VII provisions should ensure that those conditions are adequately included, and that the regulation drives technology adoption targeted at them. Therefore, the reference power correction should be omitted, or at least modified to only apply to average powers below 5% of rated power, instead of 10% as proposed by CLOVE.
» The Euro VII limits should be set, at a minimum, at the HD3 level proposed by CLOVE. Based on the demonstration programs upholding the NOx limits in California, we conclude that the NOx limits proposed by CLOVE are all feasible. To exploit the same level of technology potential as California HDV Omnibus Regulation, the Euro VII limits should be set at least the HD3 level proposed by CLOVE, avoiding any use of work correction for low-load operation.

21 ICCT WORKING PAPER 2021-26 | NOX PERFORMANCE OF EURO VI-D TRUCKS AND RECOMMENDATIONS FOR EURO VII
ReferencesAnenberg, S. C., Miller, J., Minjares, R., Du, L., Henze, D. K., Lacey, F., Malley, C. S., Emberson, L.,
Franco, V., Klimont, Z., & Heyes, C. (2017). Impacts and mitigation of excess diesel-related NOx emissions in 11 major vehicle markets. Nature, 545(7655), 467–471. https://doi.org/10.1038/nature22086
California Air Resources Board. (2020). Heavy-Duty Engine and Vehicle Omnibus Regulation and Associated Amendments. https://ww2.arb.ca.gov/rulemaking/2020/hdomnibuslownox
CLOVE Consortium. (2021, April 27). Supplements to the Scenarios for HDVs Emission Limits and Test Conditions. Advisory Group on Vehicle Emission Standards (AGVES), Brussels. https://circabc.europa.eu/w/browse/f57c2059-ef63-4baf-b793-015e46f70421
European Commission. (2016). Commission Regulation (EU) 2016/1718 of 20 September 2016 amending Regulation (EU) No 582/2011 with respect to emissions from heavy-duty vehicles as regards the provisions on testing by means of portable emission measurement systems (PEMS) and the procedure for the testing of the durability of replacement pollution control devices (Text with EEA relevance). Official Journal of the European Union, L 259. http://data.europa.eu/eli/reg/2016/1718/oj
European Commission. (2018). IMPACT ASSESSMENT. Accompanying the document Proposal for a Regulation of the European Parliament and of the Council setting CO2 emission performance standards for new heavy duty vehicles (SWD/2018/185 final-2018/0143 (COD)). http://eur-lex.europa.eu/legal-content/EN/TXT/?uri=SWD:2018:185:FIN
European Environment Agency. (2020). Exceedance of air quality standards in urban areas (CSI 004 , AIR 003). https://www.eea.europa.eu/data-and-maps/indicators/exceedance-of-air-quality-limit-2/assessment
Giechaskiel, B., Gioria, R., Carriero, M., Lähde, T., Forloni, F., Perujo, A., Martini, G., Bissi, L. M., & Terenghi, R. (2019). Emission Factors of a Euro VI Heavy-duty Diesel Refuse Collection Vehicle. Sustainability, 11(4), 1067. https://doi.org/10.3390/su11041067
Grigoratos, T., Fontaras, G., Giechaskiel, B., & Zacharof, N. (2019). Real world emissions performance of heavy-duty Euro VI diesel vehicles. Atmospheric Environment, 201, 348–359. https://doi.org/10.1016/j.atmosenv.2018.12.042
Joint Research Centre. (2020). EMROAD (6.04) [Computer software]. https://circabc.europa.eu/w/browse/79a4a9b6-4003-4e02- 956d-048dcef1a169
Mendoza-Villafuerte, P., Demuynck, J., Bosteels, D., Wilkes, T., Robb, L., & Schönen, M. (2021). Demonstration of Extremely Low NOx Emissions with Partly Close-Coupled Emission Control on a Heavy-duty Truck Application. 20. https://www.aecc.eu/wp-content/uploads/2021/05/210219_Vienna_HD-diesel-AECC-FEV-paper-final_v2.pdf
Mulholland, E., Miller, J., Braun, C., Jin, L., & Rodríguez, F. (2021). Quantifying the long-term air quality and health benefits from Euro 7/VII standards in Europe. International Council on Clean Transportation. https://theicct.org/publications/eu-euro7-standards-health-benefits-jun21
Muncrief, R. (2015). Comparing real-world off-cycle NOx emissions control in Euro IV, V, and VI. International Council on Clean Transportation. https://theicct.org/publications/comparing-real-world-cycle-nox-emissions-control-euro-iv-v-and-vi
Vermeulen, R. J., Gijlswijk, R. N. van, Heesen, D. van, Buskermolen, E. G., & Goethem, S. van. (2019). Dutch in-service emissions testing programme 2015-2018 for heavy-duty vehicles: Status quo Euro VI NOx emission (Report TNO 2019 R10519). TNO. https://repository.tudelft.nl/view/tno/uuid:5ed2cb23-3209-4f29-ac35-112ffe1906ed
Vermeulen, R. J., Ligterink, N. E., van Gijlswijk, R. N., van der Mark, P. J., Buskermolen, E. G., & Verhagen, V. E. (2021). Dutch In-service emissions testing programme for heavy-duty vehicles 2019-2020. https://repository.tudelft.nl/islandora/object/uuid%3Aac5f25ba-8158-4823-a119-d868953999c3

22 ICCT WORKING PAPER 2021-26 | NOX PERFORMANCE OF EURO VI-D TRUCKS AND RECOMMENDATIONS FOR EURO VII
AppendixDetailed results for each vehicle are shown in this appendix. These include the NOx emissions over each window, the allocation of those windows to different types of operation, the exhaust temperature, the point in time at which the cold-start requirements are satisfied, and the result of the NOx evaluation using different parameters for the moving average window methodology.
90th-%ile Euro VI-D
90th-%ile Euro VI-E
95th-%ile, 5% power thres.
Cold Start -Euro VI-E
Cold Start -Euro VI-D
Window #
0.0
0.2
0.4
0.6
0.8
1.0
1.2
1.4
1.6
NO
x, (g
/kW
h)0
50
100
150
200
250
300
350
400
Exh
aust
tem
per
atu
re (
°C)
0 2,000 4,000 6,000 8,000 10,000 12,000
Window #
0.0
0.1
0.2
0.3
0.4
0.5
0.6
0.7
NO
x, (g
/kW
h)
0
50
100
150
200
250
300
350
400
Exh
aust
tem
per
atu
re (
°C)
Urban
Rural
Motorway
0 2,000 4,000 6,000 8,000 10,000 12,000
Window #
0.0
0.1
0.2
0.3
0.4
0.5
0.6
0.7
0.8
NO
x, (g
/kW
h)
0
50
100
150
200
250
300
350
400
Exh
aust
tem
per
atu
re (
°C)
0 2,000 4,000 6,000 8,000 10,000 12,000
0 2,000 4,000 6,000 8,000 10,000 12,000
0 2,000 4,000 6,000 8,000 10,000 12,0000 1,000 2,000 3,000 4,000 5,000 6,000 7,000 8,000
0 1,000 2,000 3,000 4,000 5,000 6,000 7,000 8,000 0 1,000 2,000 3,000 4,000 5,000 6,000 7,000 8,000
Window #
0.00
0.25
0.50
0.75
1.00
1.25
1.50
1.75
2.00
NO
x, (g
/kW
h)
0
50
100
150
200
250
300
350
400
Exh
aust
tem
per
atu
re (
°C)
Window #
0.0
0.2
0.4
0.6
0.8
NO
x, (g
/kW
h)
0
50
100
150
200
250
300
350
400
Exh
aust
tem
per
atur
e (°
C)
Window #
0.0
0.1
0.2
0.3
0.4
0.5
0.6
0.7
0.8
NO
x, (g
/kW
h)
0
50
100
150
200
250
300
350
400
Exh
aust
tem
per
atu
re (
°C)
Window #
0.0
0.2
0.4
0.6
0.8
1.0
1.2
NO
x, (g
/kW
h)
0
50
100
150
200
250
300
350
400
Exh
aust
tem
per
atu
re (
°C)
Window #
0.00
0.02
0.04
0.06
0.08
0.10
NO
x, (g
/kW
h)
0
5
10
15
20
25
30
35
Exh
aust
tem
per
atu
re (
°C)
Vehicle 1 Vehicle 2
Vehicle 3 Vehicle 4
Vehicle 5 Vehicle 6
Vehicle 7 Vehicle 7 (zoomed detail)
Figure A1. Detailed window analysis of selected ISC tests for all vehicles