nox control technologies for euro 6 diesel passenger cars: market
TRANSCRIPT
www.theicct.org
SEPTEMBER 2015whiTE PaPER
NOX cONtrOl techNOlOgies fOr eurO 6 Diesel passeNger cars Market peNetratiON aND eXperiMeNtal perfOrMaNce assessMeNt
Liuhanzi Yang, Vicente Franco, Alex Campestrini, John German, and Peter Mock
iN cOllabOratiON with
BeiJinG | BerLin | BrusseLs | sAn FrAnCisCo | WAshinGton
Acknowledgements
the authors would like to acknowledge the Allgemeiner Deutscher Automobil-Club (ADAC) for providing the experimental data. We also thank all internal and external reviewers of earlier versions of this report for their guidance and constructive comments. special thanks go to reinhard Kolke (ADAC), ray Minjares (iCCt), shaojun Zhang (university of Michigan, Ann Arbor), Martin Weiss (european Commission, DG Joint research Centre), Charles n. Freed, and the auto industry representatives who helped verify the vehicle sales data.
For additional information:international Council on Clean transportation europeneue Promenade 6, 10178 Berlin+49 (30) 847129-102
[email protected] | www.theicct.org
© 2015 international Council on Clean transportation
Funding for this work was generously provided by the ClimateWorks Foundation and the stiftung Mercator.
i
executive summAry
Controlling nitrogen oxides (noX) emissions from euro 6 diesel passenger cars is one of the biggest technical challenges facing car manufacturers. three main technologies are available for this purpose: inner-engine modifications coupled with exhaust gas recirculation (eGr), lean-burn noX adsorbers (also called lean noX traps, or Lnts), and selective catalytic reduction (sCr).
As of the full phase-in of the euro 6 standard in the european union in september 2015, all newly registered diesel passenger cars will have to meet a noX emission limit of 80 mg/km over the european light-duty vehicle emission certification cycle (new european Driving Cycle, neDC). While all diesel car manufacturers have managed to meet this requirement during the regulated laboratory test, it is widely accepted that the “real-world” noX emissions of diesel passenger cars are substantially higher than the certified limit. this was one of the main drivers behind the recent amendment of the euro 6 standard to require an on-road, real-driving emissions (rDe) test using portable emission measurement systems (PeMs) for the type approval of passenger cars in the eu. once rDe testing is legally enforced in 2017, passenger cars will have to demonstrate reasonably low emissions under conditions that resemble real-world use more closely than laboratory cycles (although some aspects, such as cold-start emissions and the effects of high-load driving, will not be fully captured). rDe testing will therefore pose additional challenges for diesel passenger car manufacturers in the eu. in the short run, it should lead to more robust implementations of existing NOX control technologies—especially in terms of engine/aftertreatment calibration approaches—but in some cases, it could also have a significant impact upon the hardware choices made by diesel car manufacturers. in the long term, rDe should also deliver substantial improvements in urban air quality in europe as fleet turnover makes pre-rDe diesel cars less prevalent.
in this paper, we combine two automotive databases from reputable sources to report on the evolution of the market share of euro 6 diesel passenger cars and on the relative shares of NOX control technologies selected by car manufacturer in the EU during the phase-in of the Euro 6 standard (2012–2014). We also compare the european diesel passenger car market to that of the us for context. Lnt and sCr are the most prevalent technologies for the control of noX emissions from diesel passenger cars in the european market. Lnts predominate for smaller applications,1 although some manufacturers (e.g., Peugeot-Citroën) have chosen to apply sCr across the board. in the us market, the noX emission limit is even lower than 80 mg/km and the certification cycle (Federal test Procedure, FtP) is more transient and has somewhat higher loads. there, combined aftertreatment systems—better performing, but also more complex and expensive—are featured in some models that otherwise use a single noX control technology in their european market versions.
in order to provide some insights into the relative performance of manufacturers and NOX control technologies, we analyzed the results of chassis dynamometer emissions tests performed by europe’s largest car club, Allgemeiner Deutscher Automobil-Club (ADAC), as part of its ecotest program. these covered 32 euro 6 diesel passenger cars: 11 sCr-, 16 Lnt- and 5 eGr-equipped. the vehicles were tested over both the european
1 According to our data sources, they were found in 95% of Diesel euro 6 vehicles with engine displacements below 1.5 liters sold in the eu in 2014.
ii
ICCT white paper
type-approval cycle (neDC) and Version 2.0 of the new, more realistic Worldwide harmonized Light Vehicles test Cycle (WLtC) that is expected to replace the neDC by 2017. the results indicate that the implementation of NOX control technologies by a few manufacturers is delivering acceptable results over both cycles, whereas other manufacturers are mostly focusing on meeting the limit over the neDC while neglecting real-world operating conditions, even on the relatively low-load WLtC. All vehicles tested by ADAC except one met the legislative limit of 80 mg/km of noX over the (less demanding) neDC cycle. Most eGr- and sCr-equipped vehicles performed better than Lnt-equipped vehicles over the WLtC, but their average emissions were still far higher than those over the neDC (by a factor of 2.3 for eGr-equipped vehicles and 2.8 for sCr-equipped vehicles). the same factor was 8.0 for the average of all Lnt-equipped vehicles. Three LNT-equipped vehicles exhibited very poor performance over the wLTC, with one car emitting up to 1,167 mg/km of noX (i.e., 15 times the regulated limit). this casts a shadow of doubt over the real-world performance of all current (pre-rDe) noX control appro aches, especially those relying on Lnts, and underscores the importance of engine and aftertreatment calibration to realize the full potential of available technologies and achieve satisfactory real-world performance.
iii
NOX cONtrOl techNOlOgies fOr eurO 6 Diesel passeNger cars
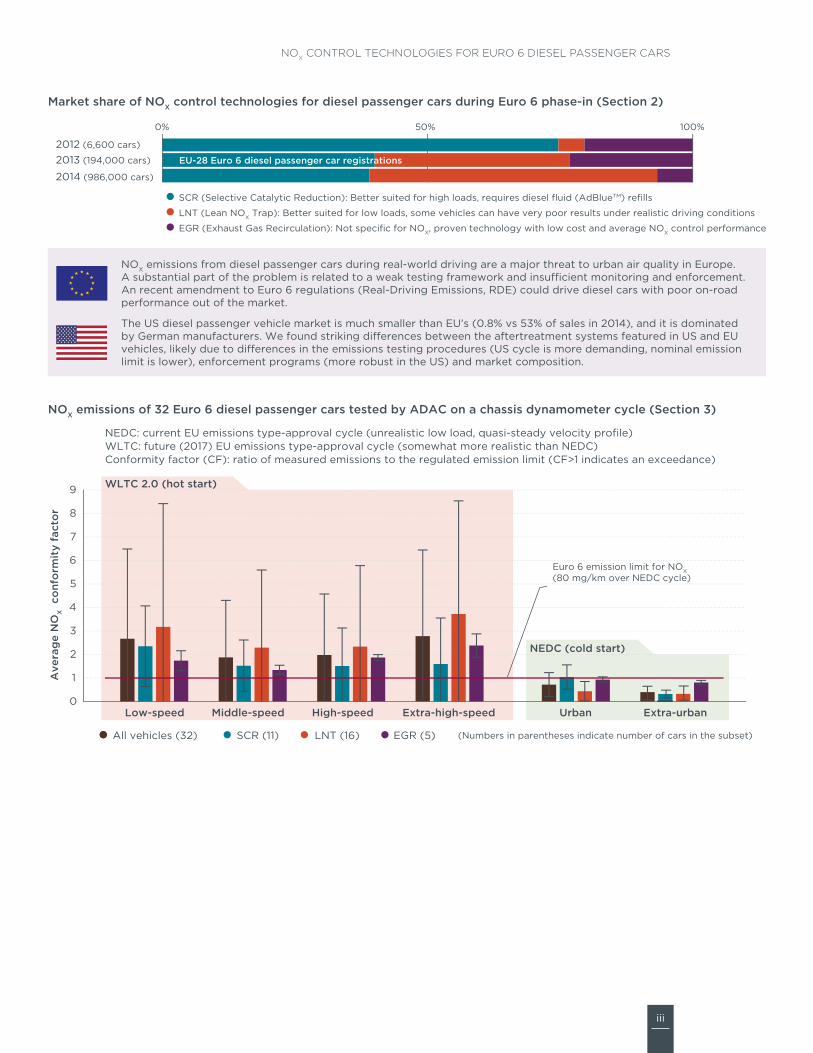
NOX emissions of 32 Euro 6 diesel passenger cars tested by ADAC on a chassis dynamometer cycle (Section 3)
Market share of NOX control technologies for diesel passenger cars during Euro 6 phase-in (Section 2)
2012 (6,600 cars)
2013 (194,000 cars)
2014 (986,000 cars)
Low-speed Middle-speed High-speed Extra-high-speed Urban Extra-urban0
1
2
3
4
5
6
7
8
9
SCR (11) LNT (16) EGR (5)All vehicles (32)
NEDC (cold start)
WLTC 2.0 (hot start)
Ave
rag
e N
OX c
onf
orm
ity
fact
or
Euro 6 emission limit for NOX (80 mg/km over NEDC cycle)
NEDC: current EU emissions type-approval cycle (unrealistic low load, quasi-steady velocity profile)WLTC: future (2017) EU emissions type-approval cycle (somewhat more realistic than NEDC) Conformity factor (CF): ratio of measured emissions to the regulated emission limit (CF>1 indicates an exceedance)
SCR (Selective Catalytic Reduction): Better suited for high loads, requires diesel fluid (AdBlueTM) refills
LNT (Lean NOX Trap): Better suited for low loads, some vehicles can have very poor results under realistic driving conditions
EU-28 Euro 6 diesel passenger car registrations
EGR (Exhaust Gas Recirculation): Not specific for NOX, proven technology with low cost and average NOX control performance
0% 50% 100%
(Numbers in parentheses indicate number of cars in the subset)
NOX emissions from diesel passenger cars during real-world driving are a major threat to urban air quality in Europe. A substantial part of the problem is related to a weak testing framework and insu�cient monitoring and enforcement. An recent amendment to Euro 6 regulations (Real-Driving Emissions, RDE) could drive diesel cars with poor on-road performance out of the market.
The US diesel passenger vehicle market is much smaller than EU’s (0.8% vs 53% of sales in 2014), and it is dominated by German manufacturers. We found striking di�erences between the aftertreatment systems featured in US and EU vehicles, likely due to di�erences in the emissions testing procedures (US cycle is more demanding, nominal emission limit is lower), enforcement programs (more robust in the US) and market composition.

iv
ICCT white paper
tAble of contents
Executive Summary .................................................................................................................... i
abbreviations ............................................................................................................................. v
1. introduction ...........................................................................................................................1
1.1. noX control technologies for euro 6 compliance ................................................................ 1
2. Market analysis ..................................................................................................................... 3
2.1. Diesel markets in the eu and the us ....................................................................................... 3
2.2. Market penetration of euro 6 diesel passenger cars ......................................................... 5
2.2.1. euro 6 diesel market shares by manufacturer ......................................................... 6
2.2.2. euro 6 diesel noX control technology mix, by manufacturer ............................ 7
3. Experimental assessment of emissions control performance .......................................9
3.1. Data source and driving cycles .................................................................................................. 9
3.2. overview of experimental results .............................................................................................12
3.3. Assessment of noX emission results .......................................................................................14
4. Conclusions and policy recommendations ..................................................................... 19
5. References ............................................................................................................................21
v
NOX cONtrOl techNOlOgies fOr eurO 6 Diesel passeNger cars
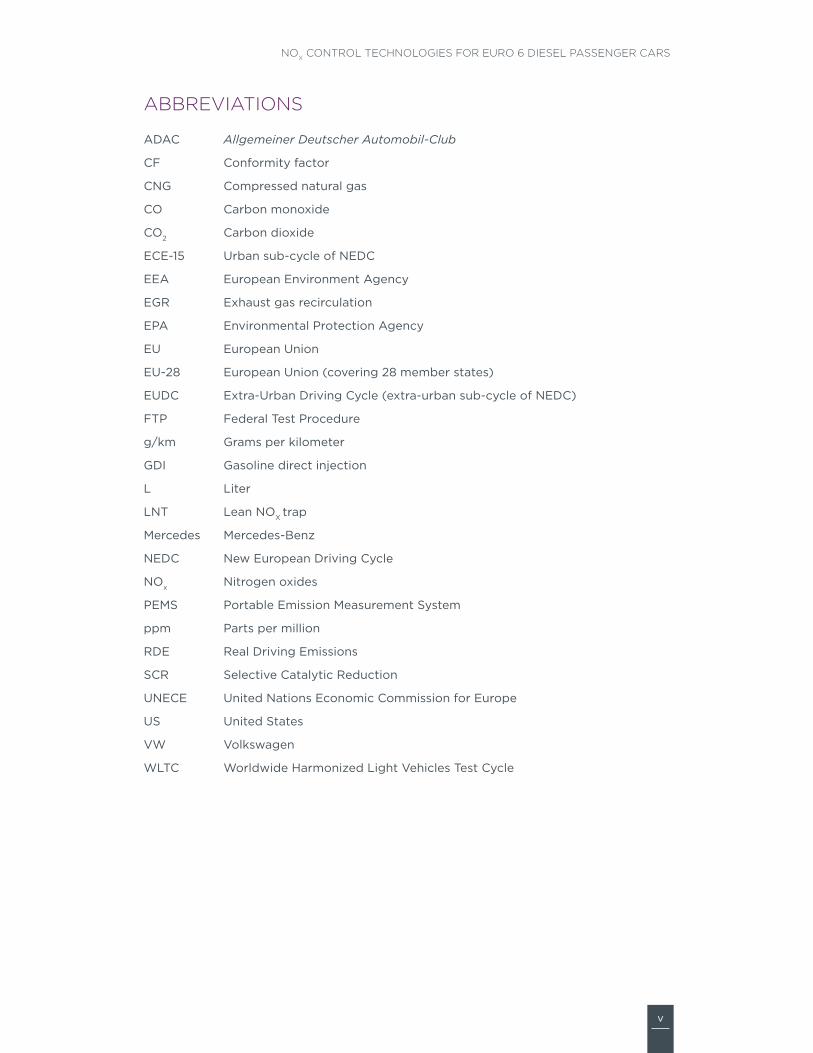
AbbreviAtions
ADAC Allgemeiner Deutscher Automobil-Club
CF Conformity factor
CnG Compressed natural gas
Co Carbon monoxide
Co2 Carbon dioxide
eCe-15 urban sub-cycle of neDC
eeA european environment Agency
eGr exhaust gas recirculation
ePA environmental Protection Agency
eu european union
eu-28 european union (covering 28 member states)
euDC extra-urban Driving Cycle (extra-urban sub-cycle of neDC)
FtP Federal test Procedure
g/km Grams per kilometer
GDi Gasoline direct injection
L Liter
Lnt Lean noX trap
Mercedes Mercedes-Benz
neDC new european Driving Cycle
nox nitrogen oxides
PeMs Portable emission Measurement system
ppm Parts per million
rDe real Driving emissions
sCr selective Catalytic reduction
uneCe united nations economic Commission for europe
us united states
VW Volkswagen
WLtC Worldwide harmonized Light Vehicles test Cycle
1
ICCT white paper
1. introduction
the first part of this paper (section 2) presents a detailed look at the market penetration of diesel euro 6 passenger cars in 2012–2014, the years corresponding to the phase-out of the euro 5 standard and the phase-in of euro 6. the sales data2 were crossed with a second database of the emission control technologies applied by the main european passenger car manufacturers in their diesel euro 6 offerings (ADAC, 2015a). these results offer insights into the different technological choices made by diesel car manufacturers to meet a common regulated target.
in the second part of the paper (section 3), we analyze the results of a series of emissions measurements performed by the German automobile club ADAC on 32 euro 6 passenger cars in a vehicle emissions laboratory as part of the ecotest program (ADAC, 2015b). the emissions of these vehicles were measured over both the emissions certification cycle currently in use in the eu for light-duty vehicles (neDC) and the more realistic WLtC cycle. the results over the WLtC cycle, which is expected to replace neDC for regulatory use in 2017, are taken as a proxy of the real-world performance of the cars under test. the high noX emissions over this cycle suggest that control of noX emissions from euro 6 diesel passenger cars outside of the regulated cycle is generally insufficient, and they also reveal differences among the performances of noX control technologies and vehicle manufacturers.
1.1. NOX CONTROL TEChNOLOgiES fOR EURO 6 COMPLiaNCEthe euro 6 emission standard sets the legal limit for noX emissions from diesel passenger cars at 80 mg/km (as measured over the neDC cycle). this limit applies to all new type approvals of passenger cars in the eu as of september 2014,3 and it is down from 180 mg/km for the euro 5 standard, which no longer applies for emissions type approval (transportPolicy.net, 2015). the transition from euro 5 to euro 6 has driven technological changes in the control of noX emissions from diesel cars to meet the lower emission limit, mostly in the form of dedicated exhaust aftertreatment systems. this effect will likely be amplified after the euro 6 regulations are officially amended to adopt real-driving emissions (rDe) testing with portable emissions measurement systems (PeMs). With this amendment (not yet published in the official Journal of the european union), eu passenger cars will have to demonstrate reasonably low emissions during conditions of use that resemble real-world use more closely than laboratory cycles.
in this section, we briefly introduce the main technologies available to vehicle manufacturers for the control of noX emissions from diesel passenger cars. to that end, table 1 presents an overview of the main technological options for the control of noX emissions from euro 6 passenger cars. the information from this table was synthesized from Bergmann, 2013; Franco, Posada, German, & Mock, 2014; Johnson, 2009, 2013; Lowell & Kamakaté, 2012; Majewski, 2007; Maunula, 2013; Posada, Bandivadekar, & German, 2012; Zheng, reader, & hawley, 2004.
2 the data reported in this paper were synthesized from a number of commercial and public databases on vehicle registrations in the eu by vehicle variant available to the iCCt; see Mock, 2014.
3 For new diesel passenger car registrations, the 80 mg/km limit will apply from september 2015 onward.
2
NOX cONtrOl techNOlOgies fOr eurO 6 Diesel passeNger cars
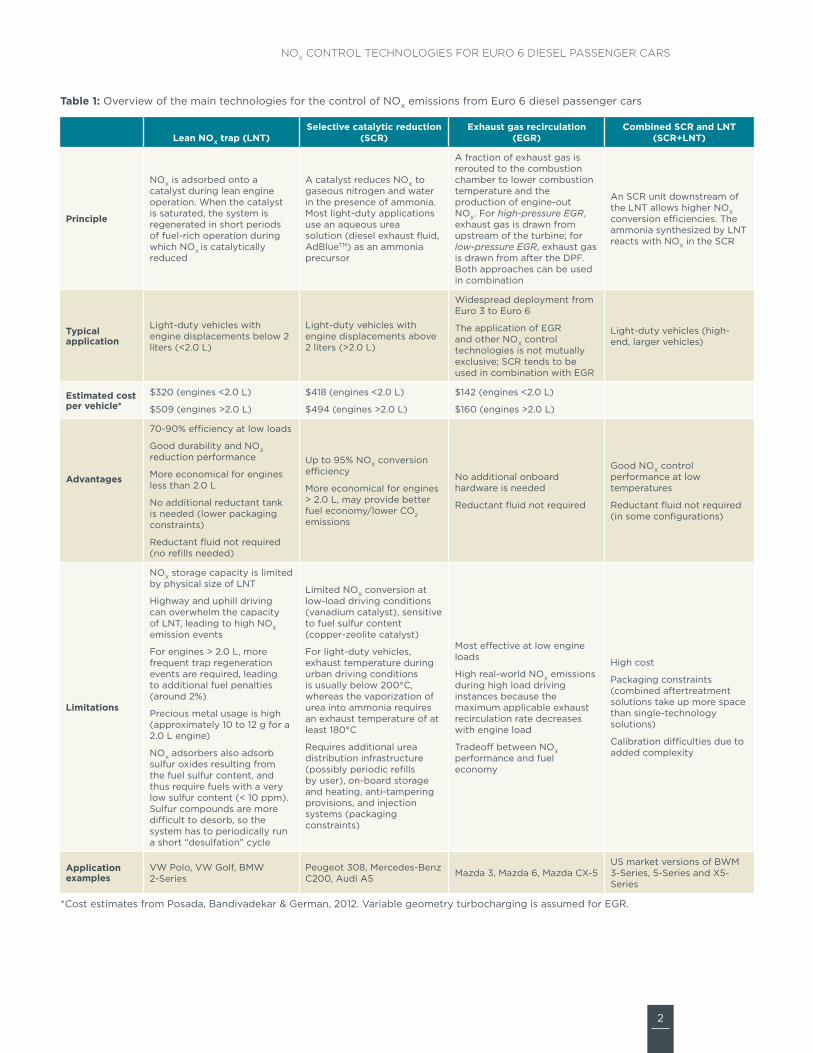
Table 1: overview of the main technologies for the control of noX emissions from euro 6 diesel passenger cars
Lean NOX trap (LNT)Selective catalytic reduction
(SCR)Exhaust gas recirculation
(EgR)Combined SCR and LNT
(SCR+LNT)
Principle
noX is adsorbed onto a catalyst during lean engine operation. When the catalyst is saturated, the system is regenerated in short periods of fuel-rich operation during which noX is catalytically reduced
A catalyst reduces noX to gaseous nitrogen and water in the presence of ammonia. Most light-duty applications use an aqueous urea solution (diesel exhaust fluid, AdBluetM) as an ammonia precursor
A fraction of exhaust gas is rerouted to the combustion chamber to lower combustion temperature and the production of engine-out noX. For high-pressure EGR, exhaust gas is drawn from upstream of the turbine; for low-pressure EGR, exhaust gas is drawn from after the DPF. Both approaches can be used in combination
An sCr unit downstream of the Lnt allows higher noX conversion efficiencies. the ammonia synthesized by Lnt reacts with noX in the sCr
Typical application
Light-duty vehicles with engine displacements below 2 liters (<2.0 L)
Light-duty vehicles with engine displacements above 2 liters (>2.0 L)
Widespread deployment from euro 3 to euro 6
the application of eGr and other noX control technologies is not mutually exclusive; sCr tends to be used in combination with eGr
Light-duty vehicles (high-end, larger vehicles)
Estimated cost per vehicle*
$320 (engines <2.0 L)
$509 (engines >2.0 L)
$418 (engines <2.0 L)
$494 (engines >2.0 L)
$142 (engines <2.0 L)
$160 (engines >2.0 L)
advantages
70-90% efficiency at low loads
Good durability and noX reduction performance
More economical for engines less than 2.0 L
no additional reductant tank is needed (lower packaging constraints)
reductant fluid not required (no refills needed)
up to 95% noX conversion efficiency
More economical for engines > 2.0 L, may provide better fuel economy/lower Co2 emissions
no additional onboard hardware is needed
reductant fluid not required
Good noX control performance at low temperatures
reductant fluid not required (in some configurations)
Limitations
noX storage capacity is limited by physical size of Lnt
highway and uphill driving can overwhelm the capacity of Lnt, leading to high noX emission events
For engines > 2.0 L, more frequent trap regeneration events are required, leading to additional fuel penalties (around 2%)
Precious metal usage is high (approximately 10 to 12 g for a 2.0 L engine)
noX adsorbers also adsorb sulfur oxides resulting from the fuel sulfur content, and thus require fuels with a very low sulfur content (< 10 ppm). sulfur compounds are more difficult to desorb, so the system has to periodically run a short “desulfation” cycle
Limited noX conversion at low-load driving conditions (vanadium catalyst), sensitive to fuel sulfur content (copper-zeolite catalyst)
For light-duty vehicles, exhaust temperature during urban driving conditions is usually below 200°C, whereas the vaporization of urea into ammonia requires an exhaust temperature of at least 180°C
requires additional urea distribution infrastructure (possibly periodic refills by user), on-board storage and heating, anti-tampering provisions, and injection systems (packaging constraints)
Most effective at low engine loads
high real-world noX emissions during high load driving instances because the maximum applicable exhaust recirculation rate decreases with engine load
tradeoff between noX performance and fuel economy
high cost
Packaging constraints (combined aftertreatment solutions take up more space than single-technology solutions)
Calibration difficulties due to added complexity
application examples
VW Polo, VW Golf, BMW 2-series
Peugeot 308, Mercedes-Benz C200, Audi A5 Mazda 3, Mazda 6, Mazda CX-5
us market versions of BWM 3-series, 5-series and X5-series
*Cost estimates from Posada, Bandivadekar & German, 2012. Variable geometry turbocharging is assumed for eGr.
3
ICCT white paper
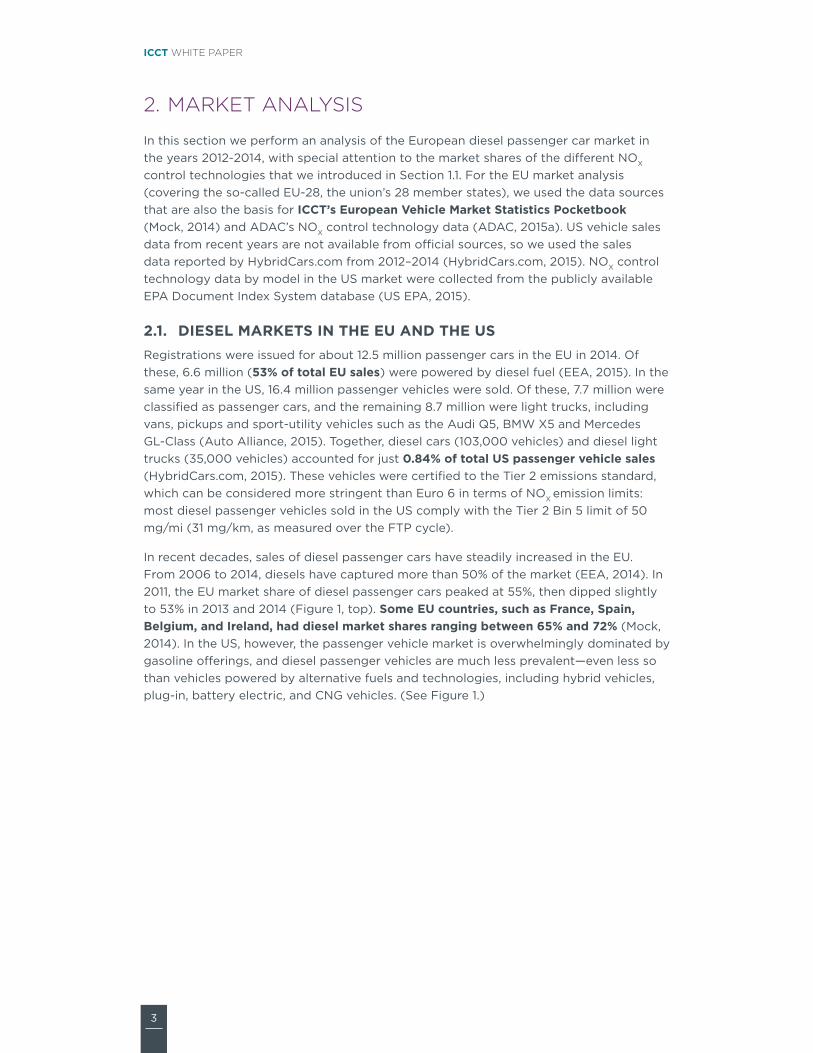
2. mArket AnAlysis
in this section we perform an analysis of the european diesel passenger car market in the years 2012-2014, with special attention to the market shares of the different noX
control technologies that we introduced in section 1.1. For the eu market analysis (covering the so-called eu-28, the union’s 28 member states), we used the data sources that are also the basis for iCCT’s European Vehicle Market Statistics Pocketbook (Mock, 2014) and ADAC’s noX control technology data (ADAC, 2015a). us vehicle sales data from recent years are not available from official sources, so we used the sales data reported by hybridCars.com from 2012–2014 (hybridCars.com, 2015). noX control technology data by model in the us market were collected from the publicly available ePA Document index system database (us ePA, 2015).
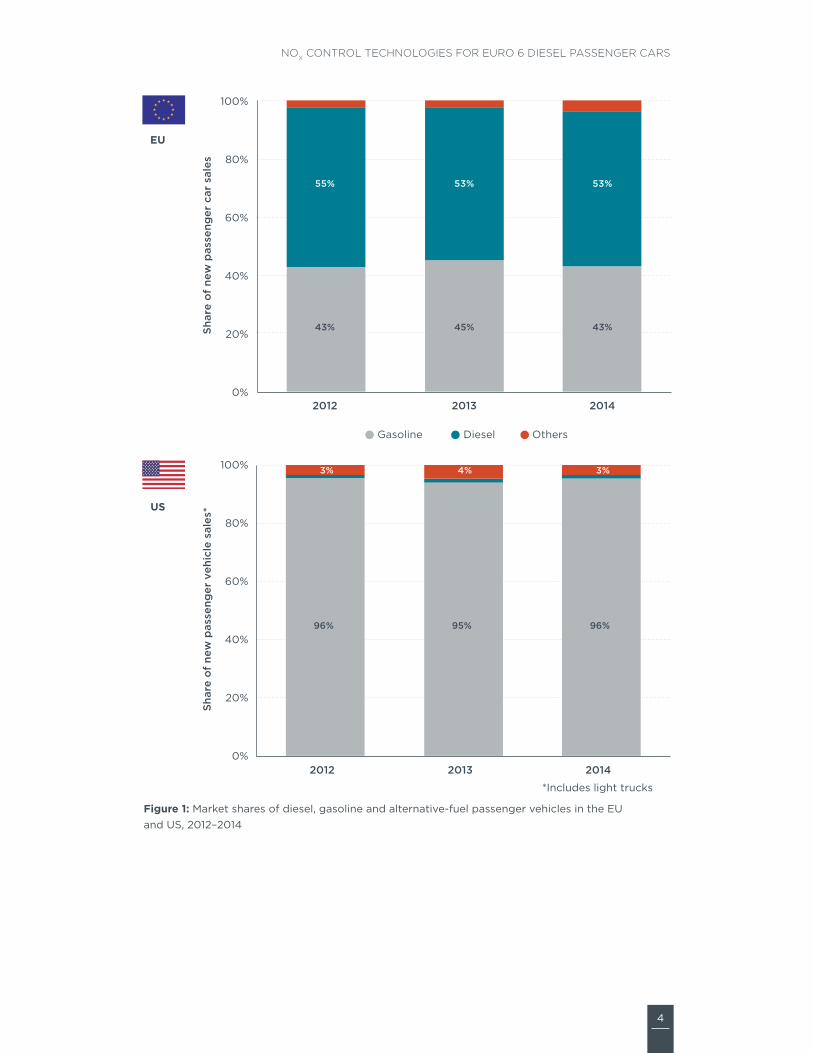
2.1. DiESEL MaRkETS iN ThE EU aND ThE USregistrations were issued for about 12.5 million passenger cars in the eu in 2014. of these, 6.6 million (53% of total EU sales) were powered by diesel fuel (eeA, 2015). in the same year in the us, 16.4 million passenger vehicles were sold. of these, 7.7 million were classified as passenger cars, and the remaining 8.7 million were light trucks, including vans, pickups and sport-utility vehicles such as the Audi Q5, BMW X5 and Mercedes GL-Class (Auto Alliance, 2015). together, diesel cars (103,000 vehicles) and diesel light trucks (35,000 vehicles) accounted for just 0.84% of total US passenger vehicle sales (hybridCars.com, 2015). these vehicles were certified to the tier 2 emissions standard, which can be considered more stringent than euro 6 in terms of noX emission limits: most diesel passenger vehicles sold in the us comply with the tier 2 Bin 5 limit of 50 mg/mi (31 mg/km, as measured over the FtP cycle).
in recent decades, sales of diesel passenger cars have steadily increased in the eu. From 2006 to 2014, diesels have captured more than 50% of the market (eeA, 2014). in 2011, the eu market share of diesel passenger cars peaked at 55%, then dipped slightly to 53% in 2013 and 2014 (Figure 1, top). Some EU countries, such as france, Spain, Belgium, and ireland, had diesel market shares ranging between 65% and 72% (Mock, 2014). in the us, however, the passenger vehicle market is overwhelmingly dominated by gasoline offerings, and diesel passenger vehicles are much less prevalent—even less so than vehicles powered by alternative fuels and technologies, including hybrid vehicles, plug-in, battery electric, and CnG vehicles. (see Figure 1.)
4
NOX cONtrOl techNOlOgies fOr eurO 6 Diesel passeNger cars
43% 45% 43%
55%
0%
20%
40%
60%
80%
100%
2012 2013 2014
53%
Shar
e o
f ne
w p
asse
nger
car
sal
es
Gasoline Diesel Others
EU
96% 95% 96%
3% 4% 3%
0%
20%
40%
60%
80%
100%
2012 2013 2014
US
53%
Shar
e o
f ne
w p
asse
nger
veh
icle
sal
es*
*Includes light trucks
figure 1: Market shares of diesel, gasoline and alternative-fuel passenger vehicles in the eu and us, 2012–2014
5
ICCT white paper
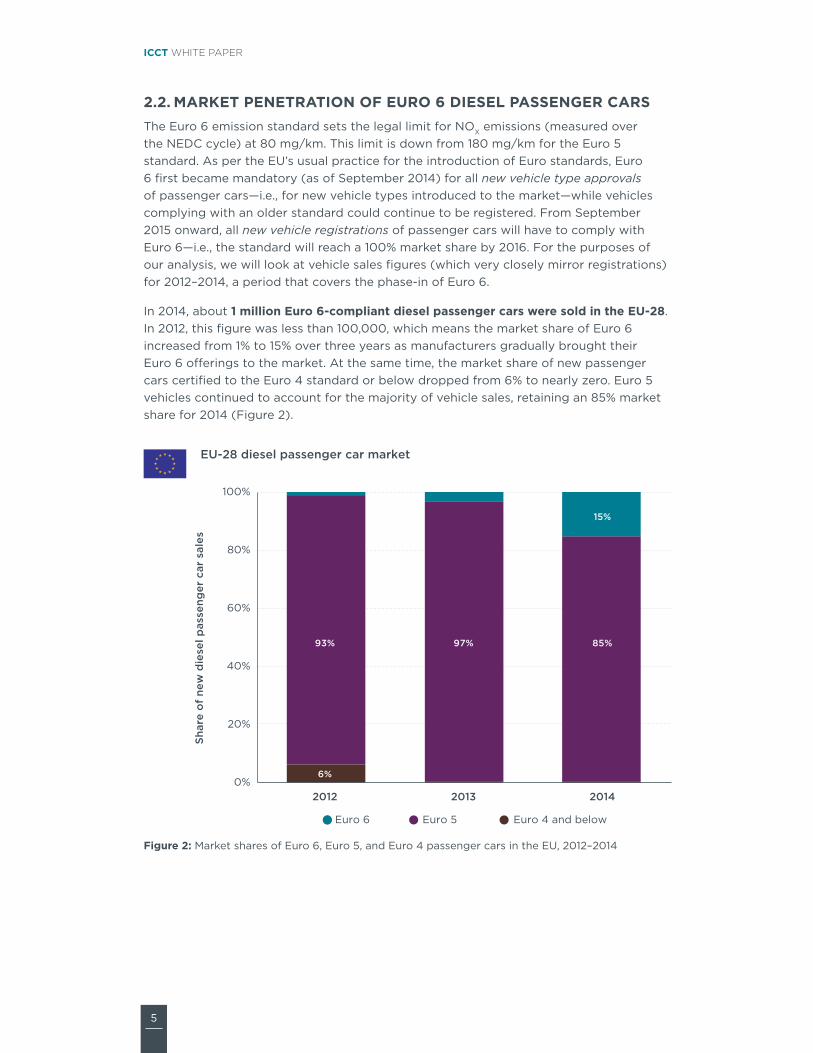
2.2. MaRkET PENETRaTiON Of EURO 6 DiESEL PaSSENgER CaRSthe euro 6 emission standard sets the legal limit for noX emissions (measured over the neDC cycle) at 80 mg/km. this limit is down from 180 mg/km for the euro 5 standard. As per the eu’s usual practice for the introduction of euro standards, euro 6 first became mandatory (as of september 2014) for all new vehicle type approvals of passenger cars—i.e., for new vehicle types introduced to the market—while vehicles complying with an older standard could continue to be registered. From september 2015 onward, all new vehicle registrations of passenger cars will have to comply with euro 6—i.e., the standard will reach a 100% market share by 2016. For the purposes of our analysis, we will look at vehicle sales figures (which very closely mirror registrations) for 2012–2014, a period that covers the phase-in of euro 6.
in 2014, about 1 million Euro 6-compliant diesel passenger cars were sold in the EU-28. in 2012, this figure was less than 100,000, which means the market share of euro 6 increased from 1% to 15% over three years as manufacturers gradually brought their euro 6 offerings to the market. At the same time, the market share of new passenger cars certified to the euro 4 standard or below dropped from 6% to nearly zero. euro 5 vehicles continued to account for the majority of vehicle sales, retaining an 85% market share for 2014 (Figure 2).
0%
20%
40%
60%
80%
100%
2012 2013 2014
93% 85%97%
15%
6%
Euro 6 Euro 5 Euro 4 and below
Shar
e o
f ne
w d
iese
l pas
seng
er c
ar s
ales
EU-28 diesel passenger car market
figure 2: Market shares of euro 6, euro 5, and euro 4 passenger cars in the eu, 2012–2014
6
NOX cONtrOl techNOlOgies fOr eurO 6 Diesel passeNger cars
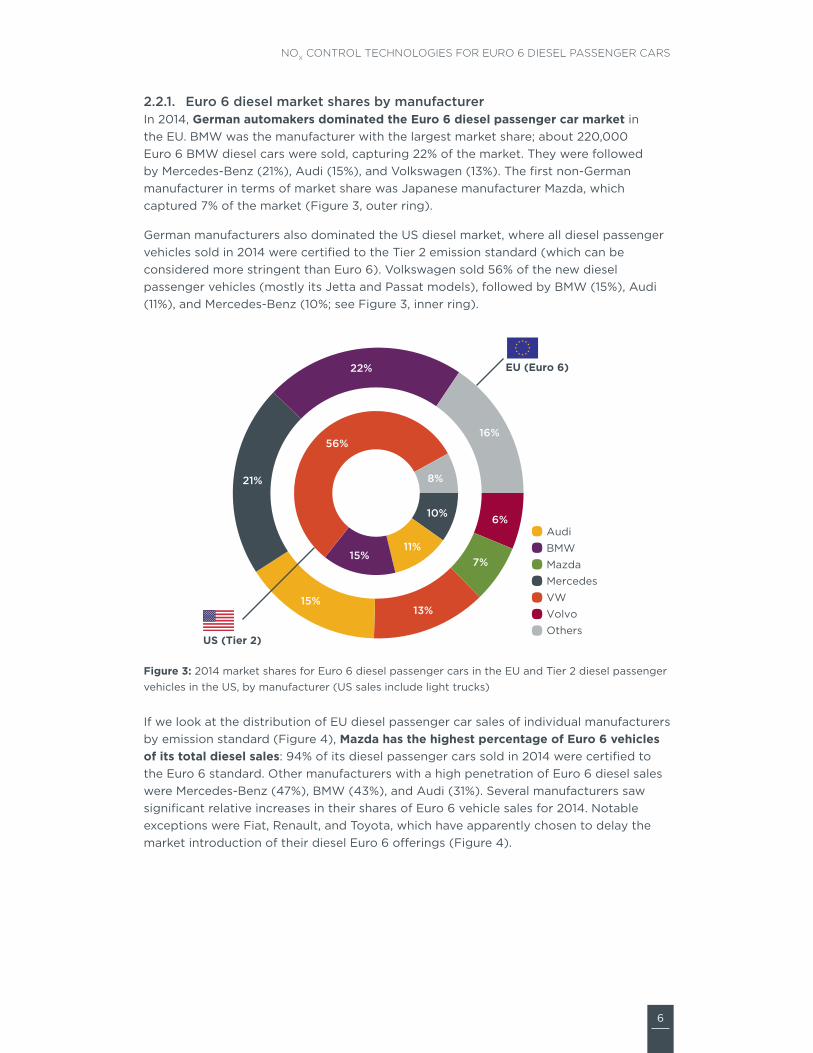
2.2.1. euro 6 diesel market shares by manufacturerin 2014, german automakers dominated the Euro 6 diesel passenger car market in the eu. BMW was the manufacturer with the largest market share; about 220,000 euro 6 BMW diesel cars were sold, capturing 22% of the market. they were followed by Mercedes-Benz (21%), Audi (15%), and Volkswagen (13%). the first non-German manufacturer in terms of market share was Japanese manufacturer Mazda, which captured 7% of the market (Figure 3, outer ring).
German manufacturers also dominated the us diesel market, where all diesel passenger vehicles sold in 2014 were certified to the tier 2 emission standard (which can be considered more stringent than euro 6). Volkswagen sold 56% of the new diesel passenger vehicles (mostly its Jetta and Passat models), followed by BMW (15%), Audi (11%), and Mercedes-Benz (10%; see Figure 3, inner ring).
EU (Euro 6)
US (Tier 2)
AudiBMWMazdaMercedesVWVolvoOthers
15%
21%
22%
16%
6%
7%
13%
56%
15%11%
10%
8%
figure 3: 2014 market shares for euro 6 diesel passenger cars in the eu and tier 2 diesel passenger vehicles in the us, by manufacturer (us sales include light trucks)
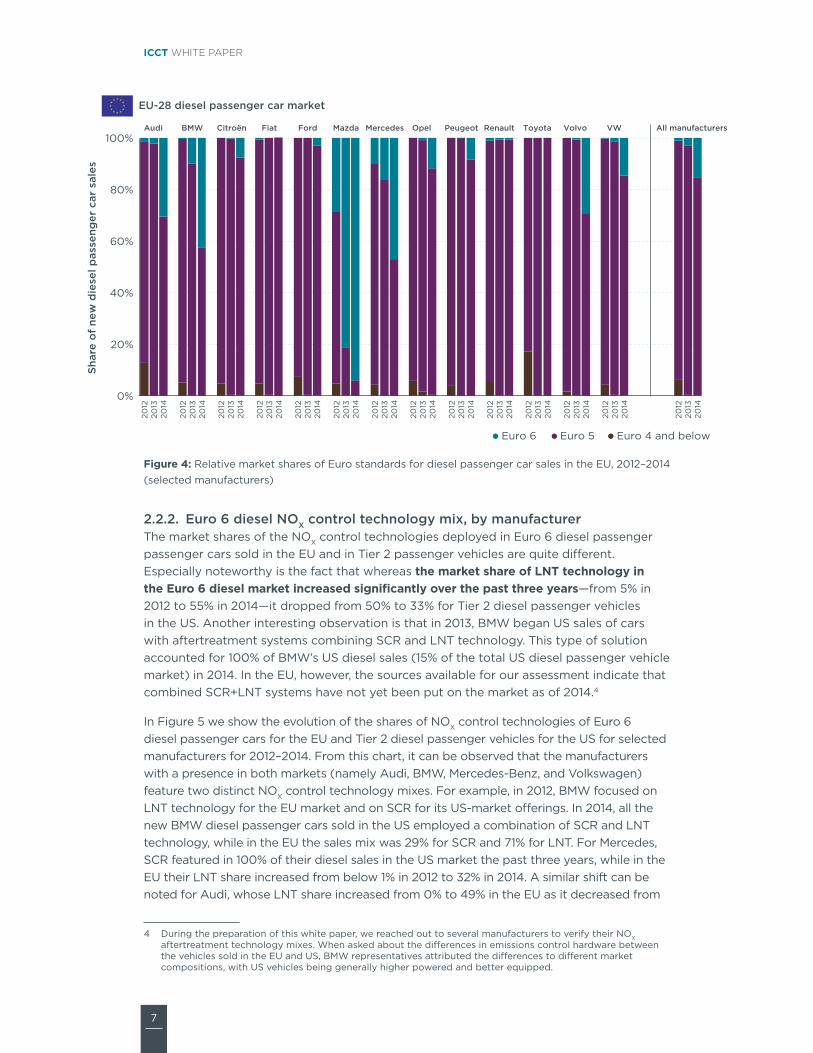
if we look at the distribution of eu diesel passenger car sales of individual manufacturers by emission standard (Figure 4), Mazda has the highest percentage of Euro 6 vehicles of its total diesel sales: 94% of its diesel passenger cars sold in 2014 were certified to the euro 6 standard. other manufacturers with a high penetration of euro 6 diesel sales were Mercedes-Benz (47%), BMW (43%), and Audi (31%). several manufacturers saw significant relative increases in their shares of euro 6 vehicle sales for 2014. notable exceptions were Fiat, renault, and toyota, which have apparently chosen to delay the market introduction of their diesel euro 6 offerings (Figure 4).
7
ICCT white paper
0%
20%
40%
60%
80%
100%20
1220
1320
14
2012
2013
2014
2012
2013
2014
2012
2013
2014
2012
2013
2014
2012
2013
2014
2012
2013
2014
2012
2013
2014
2012
2013
2014
2012
2013
2014
2012
2013
2014
2012
2013
2014
2012
2013
2014
2012
2013
2014
Shar
e o
f ne
w d
iese
l pas
seng
er c
ar s
ales
Euro 6 Euro 5 Euro 4 and below
BMWAudi Citroën Fiat Ford Mazda Mercedes Opel Peugeot Renault Toyota Volvo All manufacturersVW
EU-28 diesel passenger car market
figure 4: relative market shares of euro standards for diesel passenger car sales in the eu, 2012 –2014 (selected manufacturers)
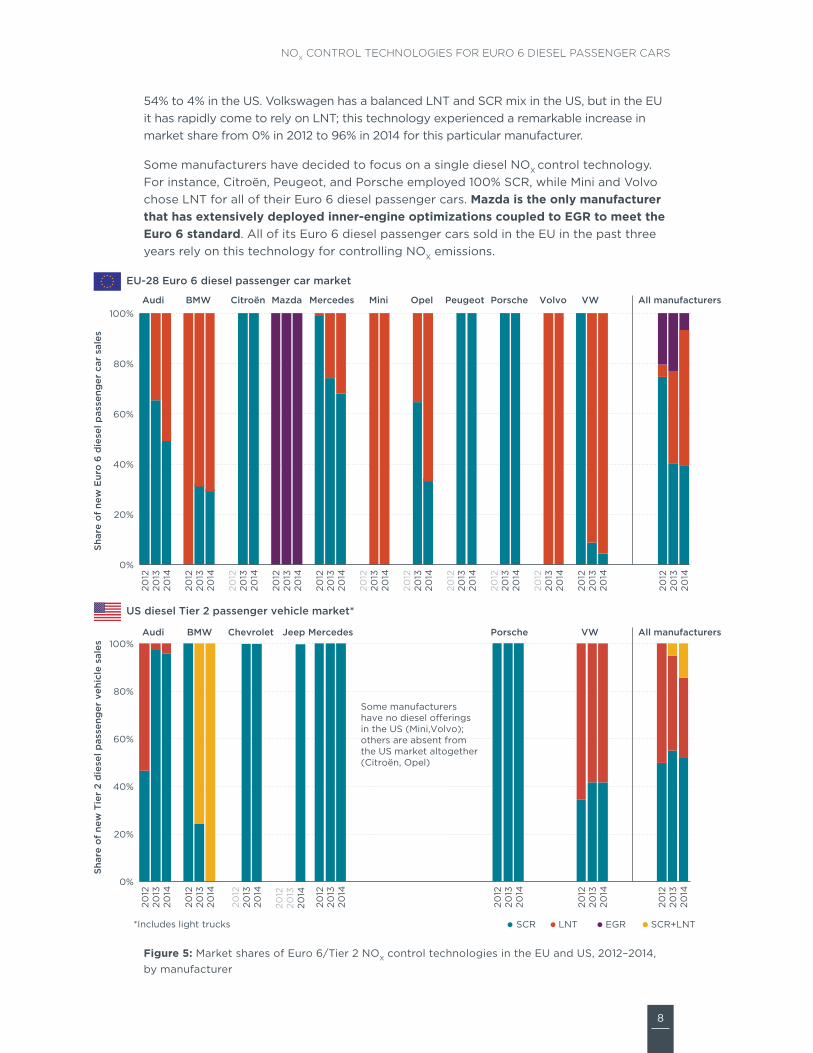
2.2.2. euro 6 diesel NOX control technology mix, by manufacturerthe market shares of the noX control technologies deployed in euro 6 diesel passenger passenger cars sold in the eu and in tier 2 passenger vehicles are quite different. especially noteworthy is the fact that whereas the market share of LNT technology in the Euro 6 diesel market increased significantly over the past three years—from 5% in 2012 to 55% in 2014—it dropped from 50% to 33% for tier 2 diesel passenger vehicles in the us. Another interesting observation is that in 2013, BMW began us sales of cars with aftertreatment systems combining sCr and Lnt technology. this type of solution accounted for 100% of BMW’s us diesel sales (15% of the total us diesel passenger vehicle market) in 2014. in the eu, however, the sources available for our assessment indicate that combined sCr+Lnt systems have not yet been put on the market as of 2014.4
in Figure 5 we show the evolution of the shares of noX control technologies of euro 6 diesel passenger cars for the eu and tier 2 diesel passenger vehicles for the us for selected manufacturers for 2012–2014. From this chart, it can be observed that the manufacturers with a presence in both markets (namely Audi, BMW, Mercedes-Benz, and Volkswagen) feature two distinct noX control technology mixes. For example, in 2012, BMW focused on Lnt technology for the eu market and on sCr for its us-market offerings. in 2014, all the new BMW diesel passenger cars sold in the us employed a combination of sCr and Lnt technology, while in the eu the sales mix was 29% for sCr and 71% for Lnt. For Mercedes, sCr featured in 100% of their diesel sales in the us market the past three years, while in the eu their Lnt share increased from below 1% in 2012 to 32% in 2014. A similar shift can be noted for Audi, whose Lnt share increased from 0% to 49% in the eu as it decreased from
4 During the preparation of this white paper, we reached out to several manufacturers to verify their noX aftertreatment technology mixes. When asked about the differences in emissions control hardware between the vehicles sold in the eu and us, BMW representatives attributed the differences to different market compositions, with us vehicles being generally higher powered and better equipped.
8
NOX cONtrOl techNOlOgies fOr eurO 6 Diesel passeNger cars
54% to 4% in the us. Volkswagen has a balanced Lnt and sCr mix in the us, but in the eu it has rapidly come to rely on Lnt; this technology experienced a remarkable increase in market share from 0% in 2012 to 96% in 2014 for this particular manufacturer.
some manufacturers have decided to focus on a single diesel noX control technology. For instance, Citroën, Peugeot, and Porsche employed 100% sCr, while Mini and Volvo chose Lnt for all of their euro 6 diesel passenger cars. Mazda is the only manufacturer that has extensively deployed inner-engine optimizations coupled to EgR to meet the Euro 6 standard. All of its euro 6 diesel passenger cars sold in the eu in the past three years rely on this technology for controlling noX emissions.
0%
20%
40%
60%
80%
100%
2012
2013
2014
2012
2013
2014
2012
2013
2014
2012
2013
2014
2012
2013
2014
2012
2013
2014
2012
2013
2014
2012
2013
2014
2012
2013
2014
2012
2013
2014
2012
2013
2014
2012
2013
2014
Shar
e o
f ne
w E
uro
6 d
iese
l pas
seng
er c
ar s
ales
BMWAudi Citroën Mazda Mercedes Mini Opel Peugeot Porsche Volvo VW All manufacturers
0%
20%
40%
60%
80%
100%
2012
2013
2014
2012
2013
2014
2012
2013
2014
2012
2013
2014
BMWAudi Mercedes VW
2012
2013
2014
All manufacturers
Shar
e o
f ne
w T
ier
2 d
iese
l pas
seng
er v
ehic
le s
ales
SCR LNT EGR SCR+LNT
2012
2013
2014
Chevrolet
2012
2013
2014
Porsche
2012
2013
2014
Jeep
EU-28 Euro 6 diesel passenger car market
US diesel Tier 2 passenger vehicle market*
*Includes light trucks
Some manufacturershave no diesel o�erings in the US (Mini,Volvo); others are absent from the US market altogether (Citroën, Opel)
figure 5: Market shares of euro 6/tier 2 noX control technologies in the eu and us, 2012–2014, by manufacturer
9
ICCT white paper
3. experimentAl Assessment of emissions control performAnce
in this section, we analyze a large dataset of measured emissions to assess the emissions performance of euro 6 diesel passenger cars, and to investigate differences in performance across the different technologies and vehicle manufacturers.
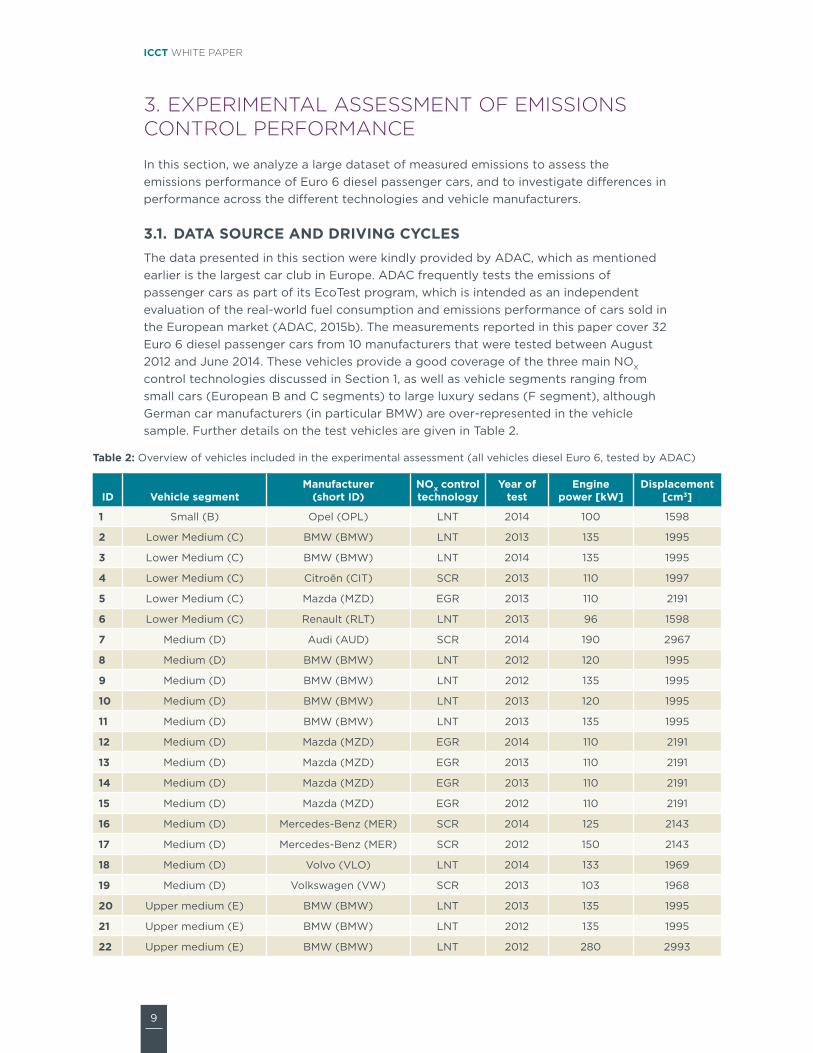
3.1. DaTa SOURCE aND DRiViNg CyCLESthe data presented in this section were kindly provided by ADAC, which as mentioned earlier is the largest car club in europe. ADAC frequently tests the emissions of passenger cars as part of its ecotest program, which is intended as an independent evaluation of the real-world fuel consumption and emissions performance of cars sold in the european market (ADAC, 2015b). the measurements reported in this paper cover 32 euro 6 diesel passenger cars from 10 manufacturers that were tested between August 2012 and June 2014. these vehicles provide a good coverage of the three main noX control technologies discussed in section 1, as well as vehicle segments ranging from small cars (european B and C segments) to large luxury sedans (F segment), although German car manufacturers (in particular BMW) are over-represented in the vehicle sample. Further details on the test vehicles ar e given in table 2.
Table 2: overview of vehicles included in the experimental assessment (all vehicles diesel euro 6, tested by ADAC)
iD Vehicle segmentManufacturer
(short iD)NOX control technology
year of test
Engine power [kw]
Displacement [cm3]
1 small (B) opel (oPL) Lnt 2014 100 1598
2 Lower Medium (C) BMW (BMW) Lnt 2013 135 1995
3 Lower Medium (C) BMW (BMW) Lnt 2014 135 1995
4 Lower Medium (C) Citroën (Cit) sCr 2013 110 1997
5 Lower Medium (C) Mazda (MZD) eGr 2013 110 2191
6 Lower Medium (C) renault (rLt) Lnt 2013 96 1598
7 Medium (D) Audi (AuD) sCr 2014 190 2967
8 Medium (D) BMW (BMW) Lnt 2012 120 1995
9 Medium (D) BMW (BMW) Lnt 2012 135 1995
10 Medium (D) BMW (BMW) Lnt 2013 120 1995
11 Medium (D) BMW (BMW) Lnt 2013 135 1995
12 Medium (D) Mazda (MZD) eGr 2014 110 2191
13 Medium (D) Mazda (MZD) eGr 2013 110 2191
14 Medium (D) Mazda (MZD) eGr 2013 110 2191
15 Medium (D) Mazda (MZD) eGr 2012 110 2191
16 Medium (D) Mercedes-Benz (Mer) sCr 2014 125 2143
17 Medium (D) Mercedes-Benz (Mer) sCr 2012 150 2143
18 Medium (D) Volvo (VLo) Lnt 2014 133 1969
19 Medium (D) Volkswagen (VW) sCr 2013 103 1968
20 upper medium (e) BMW (BMW) Lnt 2013 135 1995
21 upper medium (e) BMW (BMW) Lnt 2012 135 1995
22 upper medium (e) BMW (BMW) Lnt 2012 280 2993
10
NOX cONtrOl techNOlOgies fOr eurO 6 Diesel passeNger cars
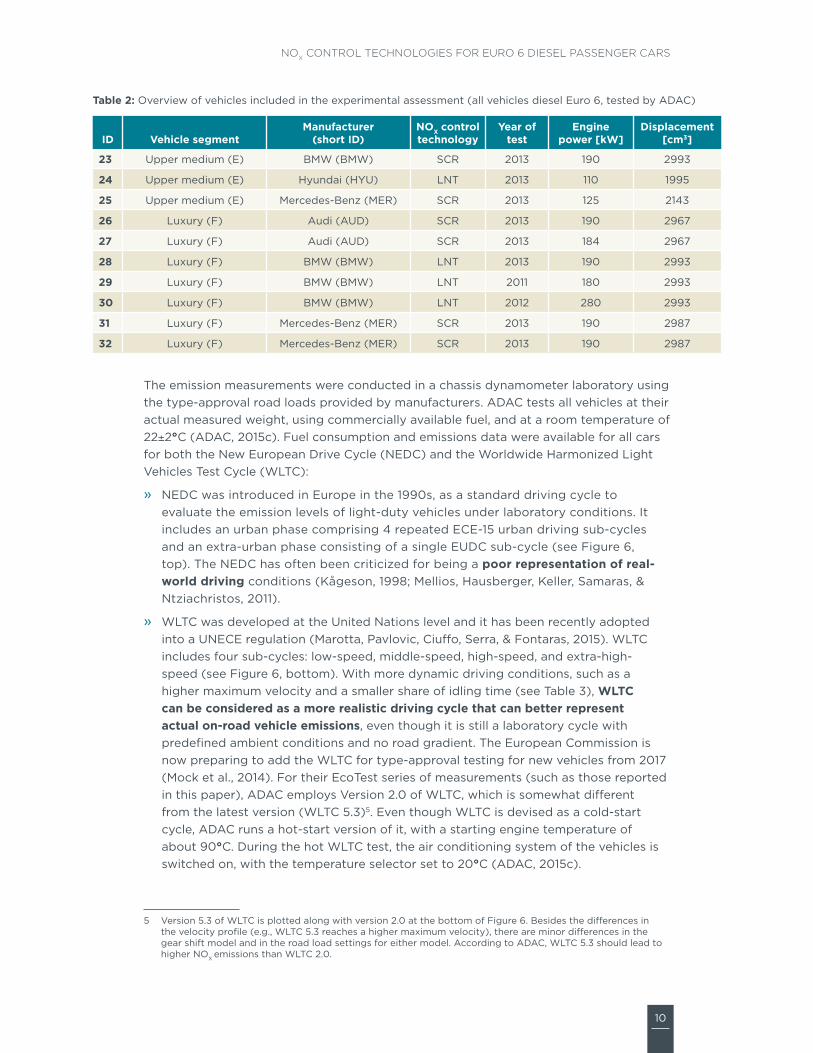
Table 2: overview of vehicles included in the experimental assessment (all vehicles diesel euro 6, tested by ADAC)
iD Vehicle segmentManufacturer
(short iD)NOX control technology
year of test
Engine power [kw]
Displacement [cm3]
23 upper medium (e) BMW (BMW) sCr 2013 190 2993
24 upper medium (e) hyundai (hYu) Lnt 2013 110 1995
25 upper medium (e) Mercedes-Benz (Mer) sCr 2013 125 2143
26 Luxury (F) Audi (AuD) sCr 2013 190 2967
27 Luxury (F) Audi (AuD) sCr 2013 184 2967
28 Luxury (F) BMW (BMW) Lnt 2013 190 2993
29 Luxury (F) BMW (BMW) Lnt 2011 180 2993
30 Luxury (F) BMW (BMW) Lnt 2012 280 2993
31 Luxury (F) Mercedes-Benz (Mer) sCr 2013 190 2987
32 Luxury (F) Mercedes-Benz (Mer) sCr 2013 190 2987
the emission measurements were conducted in a chassis dynamometer laboratory using the type-approval road loads provided by manufacturers. ADAC tests all vehicles at their actual measured weight, using commercially available fuel, and at a room temperature of 22±2°C (ADAC, 2015c). Fuel consumption and emissions data were available for all cars for both the new european Drive Cycle (neDC) and the Worldwide harmonized Light Vehicles test Cycle (WLtC):
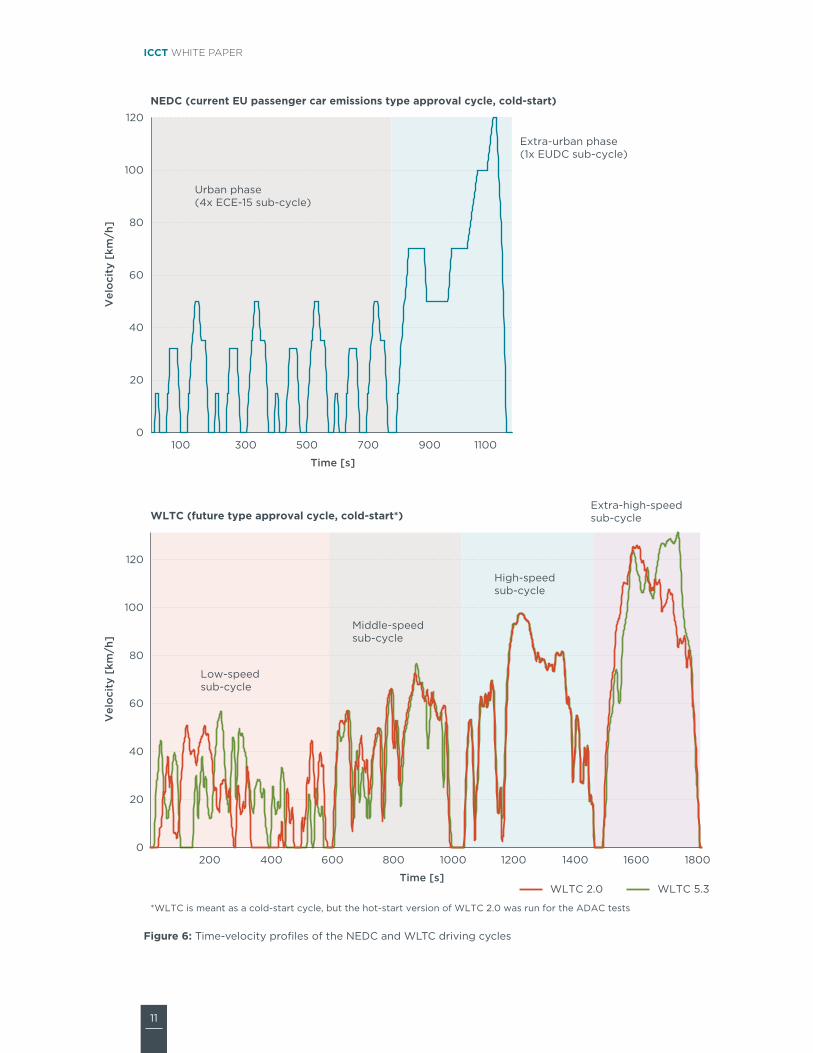
» neDC was introduced in europe in the 1990s, as a standard driving cycle to evaluate the emission levels of light-duty vehicles under laboratory conditions. it includes an urban phase comprising 4 repeated eCe-15 urban driving sub-cycles and an extra-urban phase consisting of a single euDC sub-cycle (see Figure 6, top). the neDC has often been criticized for being a poor representation of real-world driving conditions (Kågeson, 1998; Mellios, hausberger, Keller, samaras, & ntziachristos, 2011).
» WLtC was developed at the united nations level and it has been recently adopted into a uneCe regulation (Marotta, Pavlovic, Ciuffo, serra, & Fontaras, 2015). WLtC includes four sub-cycles: low-speed, middle-speed, high-speed, and extra-high-speed (see Figure 6, bottom). With more dynamic driving conditions, such as a higher maximum velocity and a smaller share of idling time (see table 3), wLTC can be considered as a more realistic driving cycle that can better represent actual on-road vehicle emissions, even though it is still a laboratory cycle with predefined ambient conditions and no road gradient. the european Commission is now preparing to add the WLtC for type-approval testing for new vehicles from 2017 (Mock et al., 2014). For their ecotest series of measurements (such as those reported in this paper), ADAC employs Version 2.0 of WLtC, which is somewhat different from the latest version (WLtC 5.3)5. even though WLtC is devised as a cold-start cycle, ADAC runs a hot-start version of it, with a starting engine temperature of about 90°C. During the hot WLtC test, the air conditioning system of the vehicles is switched on, with the temperature selector set to 20°C (ADAC, 2015c).
5 Version 5.3 of WLtC is plotted along with version 2.0 at the bottom of Figure 6. Besides the differences in the velocity profile (e.g., WLtC 5.3 reaches a higher maximum velocity), there are minor differences in the gear shift model and in the road load settings for either model. According to ADAC, WLtC 5.3 should lead to higher noX emissions than WLtC 2.0.
11
ICCT white paper
Vel
oci
ty [
km/h
]V
elo
city
[km
/h]
Time [s]
200 400 600 800 1000 1200 1400 1600 18000
20
40
60
80
100
120
NEDC (current EU passenger car emissions type approval cycle, cold-start)
WLTC (future type approval cycle, cold-start*)
Time [s]
100 300 500 700 900 11000
20
40
60
80
100
120
*WLTC is meant as a cold-start cycle, but the hot-start version of WLTC 2.0 was run for the ADAC tests
WLTC 2.0 WLTC 5.3
Urban phase (4x ECE-15 sub-cycle)
Extra-urban phase(1x EUDC sub-cycle)
Low-speedsub-cycle
Middle-speedsub-cycle
High-speedsub-cycle
Extra-high-speedsub-cycle
figure 6: time-velocity profiles of the neDC and WLtC driving cycles
12
NOX cONtrOl techNOlOgies fOr eurO 6 Diesel passeNger cars
Table 3: Descriptive parameters of the neDC and WLtC 2.0 driving cycles
NEDC wLTC 2.0
Cycle type Cold-start Cold-start*
Cycle time [s] 1180 1800
Distance [km] 11.03 23.27
Mean velocity [km/h]Whole cycle: 33.6
urban phase: 18.7extra-urban phase: 62.6
Whole cycle: 46.5Low-speed sub-cycle: 18.2 Middle-speed sub-cycle: 41.6high-speed sub-cycle: 55.5extra-high-speed sub-cycle: 89.8
Maximum velocity [km/h] 120.0 125.5
Stop share [% of time] 23.7 13.0
*hot-start version of WLtC used for ADAC ecotest
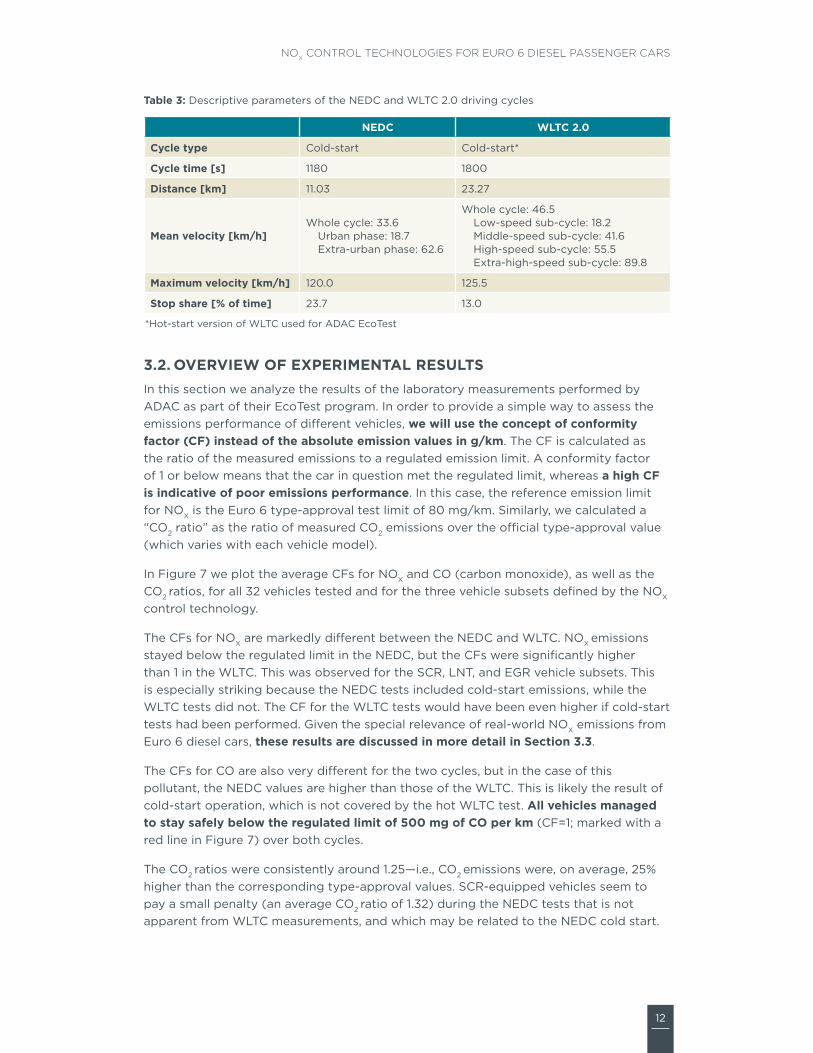
3.2. OVERViEw Of EXPERiMENTaL RESULTSin this section we analyze the results of the laboratory measurements performed by ADAC as part of their ecotest program. in order to provide a simple way to assess the emissions performance of different vehicles, we will use the concept of conformity factor (Cf) instead of the absolute emission values in g/km. the CF is calculated as the ratio of the measured emissions to a regulated emission limit. A conformity factor of 1 or below means that the car in question met the regulated limit, whereas a high Cf is indicative of poor emissions performance. in this case, the reference emission limit for noX is the euro 6 type-approval test limit of 80 mg/km. similarly, we calculated a “Co2 ratio” as the ratio of measured Co2 emissions over the official type-approval value (which varies with each vehicle model).
in Figure 7 we plot the average CFs for noX and Co (carbon monoxide), as well as the Co2 ratios, for all 32 vehicles tested and for the three vehicle subsets defined by the noX
control technology.
the CFs for noX are markedly different between the neDC and WLtC. noX emissions stayed below the regulated limit in the neDC, but the CFs were significantly higher than 1 in the WLtC. this was observed for the sCr, Lnt, and eGr vehicle subsets. this is especially striking because the neDC tests included cold-start emissions, while the WLtC tests did not. the CF for the WLtC tests would have been even higher if cold-start tests had been performed. Given the special relevance of real-world noX emissions from euro 6 diesel cars, these results are discussed in more detail in Section 3.3.
the CFs for Co are also very different for the two cycles, but in the case of this pollutant, the neDC values are higher than those of the WLtC. this is likely the result of cold-start operation, which is not covered by the hot WLtC test. all vehicles managed to stay safely below the regulated limit of 500 mg of CO per km (CF=1; marked with a red line in Figure 7) over both cycles.
the Co2 ratios were consistently around 1.25—i.e., Co2 emissions were, on average, 25% higher than the corresponding type-approval values. sCr-equipped vehicles seem to pay a small penalty (an average Co2 ratio of 1.32) during the neDC tests that is not apparent from WLtC measurements, and which may be related to the neDC cold start.
13
ICCT white paper
All vehicles had a CF<1, meaning that they met the Euro 6 limit for CO(500 mg/km) over both cycles
(Numbers in parentheses indicate number of cars in the subset. Error bars indicate standard deviation)
NEDC (cold start) WLTC 2.0 (hot start) CF=1 line CO2 ratio=1 line
All vehicles (32) SCR (11) LNT (16) EGR (5)0
2
4
6
8
Average NOX conformity factors, by test cycle and NOX control technology
All vehicles (32) SCR (11) LNT (16) EGR (5)0
0.2
0.4
0.6
0.8
1
Average CO conformity factors, by test cycle and NOX control technology
Average CO2 ratios, by test cycle and NOX control technology
The average NOX CFs were below 1 (in compliance) for NEDC, andabove 1 for WLTC for all technologies
All vehicles (32) SCR (11) LNT (16) EGR (5)0
0.5
1
1.5
2The average CO2 emissions over bothcycles were about 25% higher than the o�cial (NEDC-based) type-approval values
figure 7: Average experimental conformity factors for noX and Co, and Co2 ratios, by test cycle and noX control technology

14
NOX CONTROL TECHNOLOGIES FOR EURO 6 DIESEL PASSENGER CARS
3.3. ASSESSMENT OF NOX EMISSION RESULTSIn this section, we will analyze the NOX emission profile of the vehicles tested by ADAC. In Figure 8, we plot the NOX CFs for all the vehicles listed in Table 2. From this chart, it is apparent that all vehicles except one (Vehicle 6, which exceeded the Euro 6 limit by just 1 mg of NOX per km) had a conformity factor below 1 for NEDC (i.e., they met the regulated limit under the type-approval test). On the other hand, the NOX emissions performance over the WLTC cycle was noticeably worse—even though cold-start emissions were avoided by running the hot-start version of the cycle—and some of these outlier vehicles could be considered high emitters.
26
27
7
23
8
91011
202128
29
30
22
23
4
245
12
131415
16
25
31
17 321
6
1819
NOX CF, WLTC 2.0 cycle
NO
X C
F, N
ED
C c
ycle
0 2 4 6 8 10 12 14 160
0.2
0.4
0.6
0.8
1.0
1.2
The vehicles within the yellow rectangle were better than the average for both cycles
The 5 vehicles marked in orange emitted slightly more NOX over WLTC than the remaining 27 combined
Figure 8: Scatterplot of NOX conformity factors for 32 vehicles (ID codes as listed in Table 2)
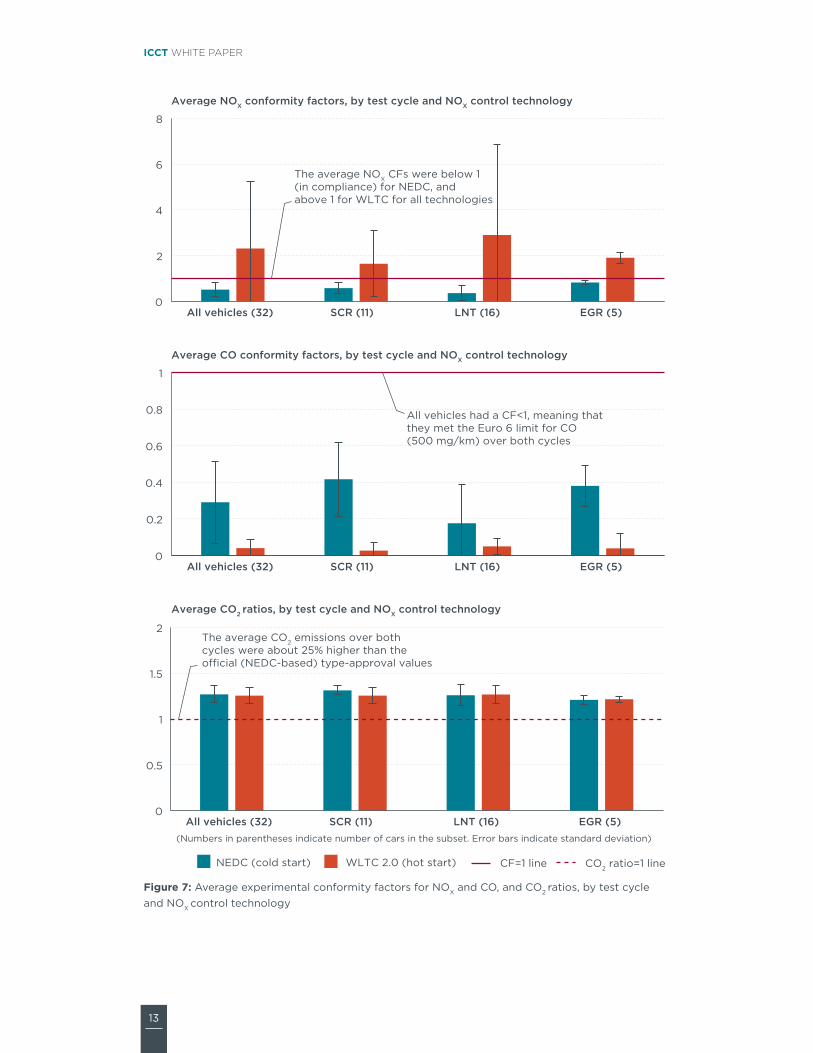
In Figure 9, the NOX CF of each vehicle over the NEDC is plotted against the corresponding NOX CF over WLTC. The results are disaggregated by NOX control technology, vehicle size segment, and manufacturer (respectively, from top to bottom of the figure):
» The results by NOX control technology indicate that most SCR- and EGR-equipped vehicles performed relatively well over the WLTC, but their average CF (1.6 for SCR and 1.9 for EGR) is still higher than the average CF over the NEDC (0.6 for SCR and 0.8 for EGR). LNT-equipped vehicles have the best performance over the NEDC (0.4) but the worst over the WLTC (2.9). Also, three vehicles equipped with LNTs (Vehicles 18, 6, and 24) had extreme NOX emission levels (1167 mg/km, 708 mg/km and 553 mg/km of NOX, respectively). This is a clear indication that, in some cases, LNT technology is tuned to deliver good performance on the certification test, but not necessarily under the more transient, real-world conditions represented by the WLTC.
» By looking at the average NOX CFs of in Figure 9 (middle), we can observe that vehicles of larger size tend to perform better over both the NEDC and WLTC. This is likely due to the fact that larger vehicles tend to employ SCR for NOX emissions control, and SCR has a relatively good performance over both the NEDC and WLTC.
» Figure 9 (bottom) shows the results by vehicle manufacturer. The 13 vehicles from BMW performed especially well over the NEDC (NOX CF of 0.2) and, despite a fivefold increase in emissions, were still somewhat better than average over the WLTC. The single Volkswagen vehicle that was tested by ADAC also had a low CF over both the NEDC and WLTC. Mercedes-Benz vehicles also had a relatively good average performance. Three single vehicles from Volvo, Renault, and Hyundai had
15
ICCT white paper
very high noX emissions over the WLtC (CFs of 14.6, 8.8, and 6.9, respectively). interestingly, these vehicles were just on the edge of compliance under neDC testing (CFs of 0.9, 1.0, and 0.9). These vehicles would very likely be unfit to pass the RDE test, and would thus be left out of the eu market (unless they had their noX control systems recalibrated) if rDe type-approval criteria applied today.
NOX CF, WLTC 2.0 cycle
NO
X C
F, N
ED
C c
ycle
NO
X C
F, N
ED
C c
ycle
NO
X C
F, N
ED
C c
ycle
0 2 4 6 8 10 12 14
0
0.2
0.4
0.6
0.8
1
NOX CF, WLTC 2.0 cycle
0 2 4 6 8 10 12 14
0
0.2
0.4
0.6
0.8
1
NOX CF, WLTC 2.0 cycle
0 2 4 6 8 10 12 14
0
0.2
0.4
0.6
0.8
1
By NOX control technology
SCR (11) LNT (16) EGR (5)
By segment
B (1) C (5) D (13) E (6) F (7)
By manufacturer
AUD (3) BMW (13) CIT (1) HYU (1) MZD (5) MER (5) OPL (1) RLT (1) VW (1) VLO (1)
LNT best over NEDC, worst over WLTC(performance optimized for certification test)
Larger vehicles tend to perform slightly better,both over NEDC and WLTC
Some manufacturers perform relatively well over both NEDC and WLTC;extreme WLTC outliers tend to be “on the edge” of NEDC compliance
larger cars
smaller cars
above average
poor
averagevery poor (likely unfit for RDE; onlyone vehicle tested per manufacturer)
246
18
CF>6: high emitters (outliers)
(Solid dots mark the average of the vehicle subset. Numbers in parentheses indicate the number of cars in the subset)
NEDC CF = WLTC CF line (vehicles close to this line had similar NOX control performance over both cycles)
figure 9: experimental noX emission performance over the neDC and WLtC cycles for all 32 vehicles, by noX control technology, vehicle segment, and manufacturer
16
NOX cONtrOl techNOlOgies fOr eurO 6 Diesel passeNger cars
the results of Figure 9 point to a serious compliance problem for NOX emissions from current Euro 6 diesel passenger cars. it should be noted that noX emissions from diesel cars are a unique case in this sense, and that no other pollutant from either gasoline or diesel passenger cars (with the possible exception of particle number emissions from GDi vehicles) presents a comparable challenge regarding its control.
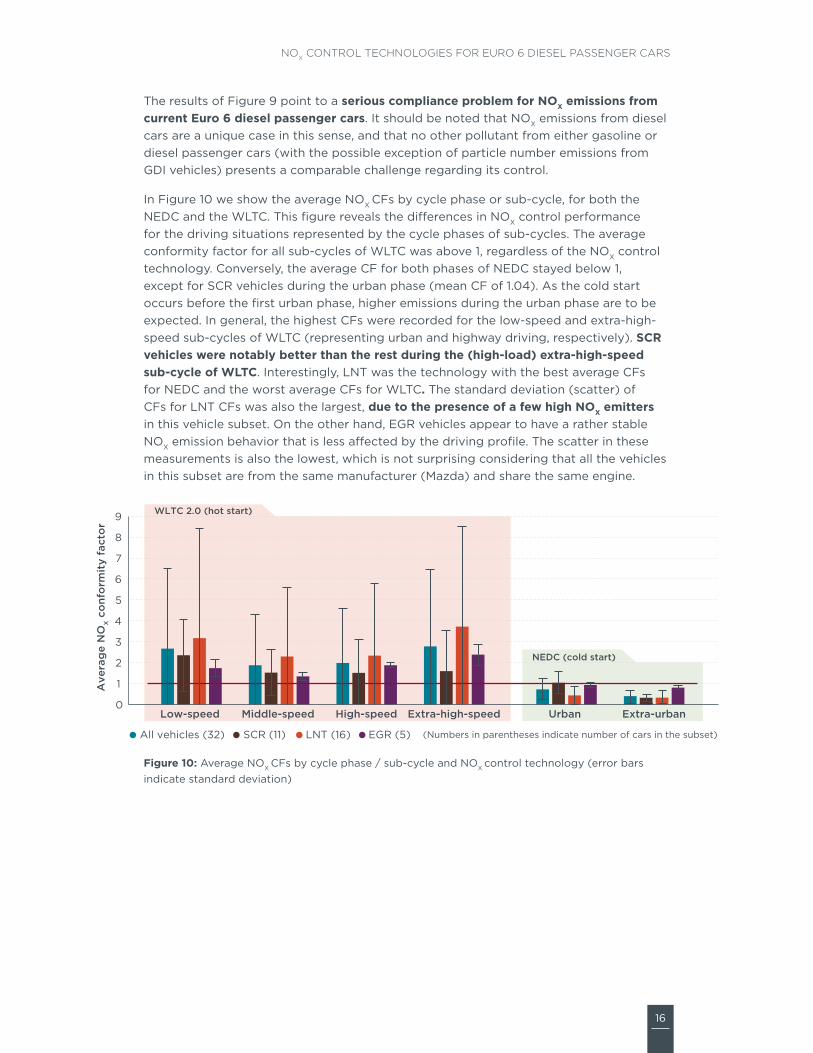
in Figure 10 we show the average noX CFs by cycle phase or sub-cycle, for both the neDC and the WLtC. this figure reveals the differences in noX control performance for the driving situations represented by the cycle phases of sub-cycles. the average conformity factor for all sub-cycles of WLtC was above 1, regardless of the noX control technology. Conversely, the average CF for both phases of neDC stayed below 1, except for sCr vehicles during the urban phase (mean CF of 1.04). As the cold start occurs before the first urban phase, higher emissions during the urban phase are to be expected. in general, the highest CFs were recorded for the low-speed and extra-high-speed sub-cycles of WLtC (representing urban and highway driving, respectively). SCR vehicles were notably better than the rest during the (high-load) extra-high-speed sub-cycle of wLTC. interestingly, Lnt was the technology with the best average CFs for neDC and the worst average CFs for WLtC. the standard deviation (scatter) of CFs for Lnt CFs was also the largest, due to the presence of a few high NOX emitters in this vehicle subset. on the other hand, eGr vehicles appear to have a rather stable noX emission behavior that is less affected by the driving profile. the scatter in these measurements is also the lowest, which is not surprising considering that all the vehicles in this subset are from the same manufacturer (Mazda) and share the same engine.
Low-speed Middle-speed High-speed Extra-high-speed Urban Extra-urban0
1
2
3
4
5
6
7
8
9
SCR (11) LNT (16) EGR (5)All vehicles (32)
NEDC (cold start)
WLTC 2.0 (hot start)
Ave
rag
e N
OX c
onf
orm
ity
fact
or
(Numbers in parentheses indicate number of cars in the subset)
figure 10: Average noX CFs by cycle phase / sub-cycle and noX control technology (error bars indicate standard deviation)
17
ICCT white paper
Finally, in Figure 11 we plot the noX CFs and Co2 ratios of each the different phases of neDC and sub-cycles of WLtC. this figure gives additional information on the type of driving situations that are leading to high noX emissions. the vehicle technologies of the corresponding vehicles are indicated in some of the data markers for reference. Just like in Figure 9, we can observe how the noX CFs over neDC and WLtC are significantly different:
» the results for neDC (top of Figure 11) show that just a couple of vehicles had nox CFs above 1.5 for any phase (the mean noX CF for all neDC phases was 0.5), and this happened for the urban phase only. of the nine urban phases with the highest noX emissions over neDC, six of them are from vehicles equipped with sCr. A likely cause for this is that the neDC is a rather low-load driving cycle, and so the temperature of exhaust usually stays below 300°C. As a result, the sCr catalyst does not warm up sufficiently during the urban phase of neDC and therefore operates less efficiently.
» the results for the WLtC sub-cycles (bottom of Figure 11) show that very high noX emissions occur mostly during the low-speed and extra-high-speed WLtC sub-cycles. three Lnt-equipped vehicles had very poor performance, with noX CFs rising above 10 for eight sub-cycles. to the extent that WLtC can be considered a realistic driving cycle, the results indicate that the current neDC testing framework allows a large discrepancy between the actual, on-road noX emissions and the emission certification tests, and it is therefore insufficient to address air quality problems related to NOX.

18
NOX cONtrOl techNOlOgies fOr eurO 6 Diesel passeNger cars
NO
X C
F, b
y W
LTC
sub
-cyc
le
0.9 1 1.1 1.2 1.3 1.4 1.5 1.6
2
0
4
6
8
10
12
14
16
Low-speed Middle-speed High-speed Extra-high-speed
CO2 ratio, by WLTC sub-cycle
WLTC 2.0 (hot start)
CO2 ratio, by NEDC phase
NO
X C
F, b
y N
ED
C p
hase
0.9 1 1.1 1.2 1.3 1.4 1.5
0.2
00.8
0.8
0.4
0.6
0.8
1
1.2
1.4
1.6
1.8
Urban Extra-urban
Minor NOX excursions(urban phase only, SCR vehicles)
NEDC (cold start)
SCR
LNT
LNTLNT SCR
LNT
SCR
SCR
SCR
LNT
LNT
LNT
SCR
SCR
LNT
LNT
SCR
LNT
LNTLNT
LNT
SCR
SCR
LNT
LNTLNT
LNT
SCR
SCR
SCR
LNT
LNT
LNTLNT
LNT LNT
LNT
LNT
LNT
SCR
SCR
LNT
EGR
EGREGR
EGR
SCR
SCR
SCR
SCR
SCR
LNT
LNT
LNT
SCR
SCR
LNT LNTLNTLNT
LNT LNT
SCR
EGREGR
SCR
SCR
SCR
LNT
LNT LNT
(Solid dots mark the average of the vehicle subset)
Severe NOX excursions for Vehicles 6, 18 and 24(mostly for the low-speed and extra-high-speed sub-cycles)
figure 11: experimental noX emission performance over the neDC and WLtC cycles for all 32 vehicles, by neDC phase/WLtC sub-cycle (see Figure 6).
19
ICCT white paper
4. conclusions And policy recommendAtions
the new euro 6 diesel passenger cars must meet an emission limit of 80 mg of noX per kilometer, down from 180 mg/km for euro 5 diesel vehicles. But this emission limit is not as stringent as it appears on paper, because it applies to an outdated emissions certification driving cycle (neDC) that should soon be replaced by a somewhat more realistic one (WLtC). however, in all likelihood, the biggest challenge for diesel passenger car manufacturers will not arise from the laboratory test under the certification cycle (be it the NEDC or the wLTC), but from the impending real-driving emissions (RDE) test, which is scheduled to become a mandatory step for the type approval of passenger cars in the eu in 2016 (with an initial 20-month monitoring phase during which no on-road emission limits will be enforced). under this new testing framework, diesel passenger cars will have to prove that they can keep noX emissions at reasonably low levels6 during an on-road test that more closely represents real-world driving situations.
the phase-in of the euro 6 standard in the eu was accompanied by the widespread introduction of several technologies to control the noX emissions from diesel passenger cars. in the first part of this paper, we introduced these technologies, and we showed the different strategies that vehicle manufacturers have adopted for their deployment in the eu and us markets. some key differences between eu and us noX technology control choices (e.g., the prevalence of Lnt in europe, and the emergence of combined sCr+Lnt solutions in the us, likely because this type of solution is ultimately required for compliance with the low-emission bins of us tier 2 regulations) seem to indicate that the different regulatory frameworks (the us has lower nominal emission limits, more demanding test cycles, and a robust enforcement and compliance program that the eu lacks) have a direct influence upon the technological choices made by diesel passenger car manufacturers.
in this paper, we focused mostly on noX because the emissions of this pollutant do not seem to be properly controlled outside of the artificial conditions of neDC testing. the experimental results analyzed in this paper add to the overwhelming amount of empirical evidence that NOX emissions from diesel passenger cars are not properly controlled under the current, NEDC-based testing framework. the experimental noX
conformity factors over WLtC and neDC helped us explore the differences among the real-world performance of different technologies, as well as the differences in the robustness of the implementations of these technologies made by individual manufacturers. the fact that the three worst-performing vehicles were all equipped with lean noX traps does not mean that all Lnt-equipped vehicles would be unfit to pass the rDe on-road test. in fact, a few of the best-performing vehicles over both the neDC and the WLtC were equipped with this technology. What those results do indicate is that the current neDC testing framework is insufficient to ensure that euro 6 vehicles have acceptable noX emissions under real conditions of use, and that the new rDe regulations are fully justified and much needed. since rDe cannot apply retroactively to existing euro 6 type-approval certificates, it is essential to act fast and ensure that additional high emitters of NOX are prevented from entering the market. urgent remedial (technological) action on the part of vehicle manufacturers is also required to avoid the stigmatization of diesel cars.
6 As demonstrated in a recent iCCt publication (Franco et al., 2014), this is frequently not the case for the current generation of euro 6 diesel passenger cars.
20
NOX cONtrOl techNOlOgies fOr eurO 6 Diesel passeNger cars
An effective implementation of rDe would be a major step in the right direction that should help address europe’s urban air quality problems in the long run. in the coming months, the european Commission will continue to work with stakeholders to determine the conformity factors that will apply to on-road rDe tests. the european Commission will phase in rDe testing in two subsequent steps with increasing levels of stringency. it is widely expected that the initial step of conformity factors (applicable from September 2017 onward) will lie around a value of 2 for NOX emissions from diesel passenger cars—i.e., these vehicles will still be allowed to emit about twice the regulated euro 6 emission limit of 80 mg/km during the on-road test, effectively making this the first time that the Euro standards will be changed to raise an emission limit instead of lowering it. Moreover, since rDe does not include cold-start emissions, the allowed increase will be substantially higher than is indicated by the conformity factor. the second step of rDe, likely to apply from 2019 onward, should bring conformity factors close to 1 and make euro 6 diesel cars come closer to delivering on their promise (albeit seven years after their initial market introduction). this compromise should address the urgent problem of keeping euro 6 diesel passenger cars with weak on-road noX control from being awarded emissions type-approval certificates in the eu. it will also give manufacturers sufficient lead time to make the necessary calibrations to their software and emissions aftertreatment hardware adjustments to their vehicles to improve their real-world noX emissions performance, which we will continue to watch closely.
21
ICCT white paper
5. references
ADAC. (2015a). ADAC car database. retrieved from https://www.adac.de/infotestrat/autodatenbank/
ADAC. (2015b). ADAC ecotest database.
ADAC. (2015c). ecotest testing and Assessment Protocol, Version 3.2. retrieved from http://www.ecotest.eu/html/ecotest_Protocol_en.pdf
Auto Alliance. (2015). 2014 sales. retrieved from http://www.autoalliance.org/auto-marketplace/sales-data
Bergmann, D. (2013). Developing the Technology Innovation Process for Further Emissions Reduction. Presented at the 6th integer Diesel emissions Conference and Diesel exhaust Fluid Forum, Atlanta.
european environment Agency (eeA). (2014). Monitoring CO2 emissions from passenger cars and vans in 2013. retrieved from http://www.eea.europa.eu/publications/monitoring-co2-emissions-from-passenger
eeA. (2015). New cars’ CO2 emissions well below Europe’s 2015 target. retrieved from http://www.eea.europa.eu/highlights/new-cars2019-co2-emissions-well
Franco, V., Posada, F., German, J., & Mock, P. (2014). Real-world exhaust emissions from modern diesel cars: A meta-analysis of PEMS emissions data from EU (Euro 6) and US (Tier 2 Bin 5/ULEV II) diesel passenger cars (Part 1: Aggregated results). Washington: international Council on Clean transportation (iCCt). retrieved from http://www.theicct.org/real-world-exhaust-emissions-modern-diesel-cars
hybridCars.com. (2015). the hybridCars.com monthly sales dashboard, December 2014. retrieved from http://www.hybridcars.com/december-2014-dashboard/
Johnson, t. (2009). review of diesel emissions and control. International Journal of Engine Research, 10(5), 275–285. retrieved from http://doi.org/10.1243/14680874Jer04009
Johnson, t. (2013). Vehicular emissions in review. SAE Int. J. Engines, 6(2), 699–715. retrieved from http://doi.org/10.4271/2013-01-0538
Kågeson, P. (1998). Cycle-beating and the EU test cycle for cars. european Federation for transport and environment (t&e), Brussels.
Lowell, D., & Kamakaté, F. (2012). Urban off-cycle NOX emissions from Euro IV/V trucks and buses. Washington: iCCt. retrieved from http://www.theicct.org/urban-cycle-nox-emissions-euro-ivv-trucks-and-buses
Majewski, W. A. (2007). noX Adsorbers. DieselNet Technology Guide 2007. retrieved from http://www.dieselnet.com/tech/cat_nox-trap.php
Marotta, A., Pavlovic, J., Ciuffo, B., serra, s., & Fontaras, G. (2015). Gaseous emissions from Light-Duty Vehicles: Moving from neDC to the new WLtP test procedure. Environmental Science & Technology. retrieved from http://doi.org/10.1021/acs.est.5b01364
Maunula, t. (2013). NOX Reduction with the Combinations on LNT and SCR in Diesel Applications. (no. 2013-24-0161). sAe technical Paper. retrieved from http://doi.org/10.4271/2013-24-0161
22
NOX cONtrOl techNOlOgies fOr eurO 6 Diesel passeNger cars
Mellios, G., hausberger, s., Keller, M., samaras, Z., & ntziachristos, L. (2011). Parameterisation of fuel consumption and CO2 emissions of passenger cars and light commercial vehicles for modelling purposes. european Commission Joint research Centre technical report eur 24927 en. Luxembourg: Publications office of the european union.
Mock, P. (2014). European Vehicle Market Statistics Pocketbook 2014. Washington: iCCt. retrieved from http://eupocketbook.theicct.org
Mock, P., Kühlwein, J., tietge, u., Franco, V., Bandivadekar, A., & German, J. (2014). The WLTP: How a new test procedure for cars will affect fuel consumption values in the EU. Washington: iCCt. retrieved from http://www.theicct.org/wltp-how-new-test-procedure-cars-will-affect-fuel-consumption-values-eu
Posada, F., Bandivadekar, A., & German, J. (2012). Estimated Cost of Emission Reduction Technologies for Light-Duty Vehicles. Washington: iCCt. retrieved from http://www.theicct.org/estimated-cost-emission-reduction-technologies-ldvs
transportPolicy.net. (2015). EU: Light-duty: Emissions. retrieved from http://transportpolicy.net/index.php?title=eu:_Light-duty:_emissions
us ePA. (2015). ePA’s transportation and Air Quality Document index system (Dis). retrieved from http://iaspub.epa.gov/otaqpub/pubadvsearch.jsp
Zheng, M., reader, G. t., & hawley, J. G. (2004). Diesel engine exhaust gas recirculation — a review on advanced and novel concepts. Energy Conversion and Management, 45(6), 883–900. retrieved from http://doi.org/10.1016/s0196-8904(03)00194-8