innovation report 2014: innovation, research and growth
TRANSCRIPT

INNOVATION REPORT 2014
Innovation, Research And Growth
MARCH 2014

INNOVATION REPORT 2014
March 2014

Innovation Report 2014
Contents Foreword ......................................................................................................................... i
Summary ........................................................................................................................ 3
1. Introduction ............................................................................................................... 5
1.1 Context .......................................................................................................... 5
1.2 The benefits of innovation ............................................................................. 6
1.3 The innovation system .................................................................................. 8
2. Our innovation infrastructure .................................................................................. 9
2.1 System conditions ......................................................................................... 9
2.2 The innovation infrastructure ....................................................................... 10
2.3 Driving innovation at the local level ............................................................. 15
3. UK’s innovation performance ................................................................................ 19
3.1 Expenditure on R&D and innovation ........................................................... 19
3.2 Innovation outputs ....................................................................................... 25
4. Skills and knowledge generation in the UK ......................................................... 29
4.1 Human capital and skills .............................................................................. 29
4.2 Knowledge generation and research outputs .............................................. 31
5. Innovation in business ........................................................................................... 37
5.1 The need for government action ................................................................. 37
5.2 New developments in business innovation support .................................... 38
6. Innovation with international partners .................................................................. 47
6.1 International connectivity of UK innovation ................................................. 47
6.2 Supporting international collaboration ......................................................... 51
Innovation Report 2014
Figures Figure 2.1: Innovation performance across dimensions ................................................ 10
Figure 2.2: The smart specialisation strategy cycle ....................................................... 17
Figure 3.1: Gross expenditure on R&D as a share of GDP, per cent, 2000-2012 .......... 20
Figure 3.2: International comparison of Government Budget Appropriations or Outlays on R&D, 2012, and Business Expenditure on R&D, 2011 ................................. 21
Figure 3.3: Knowledge-based capital related workers as a percentage of total employed persons, 2012 .............................................................................................. 24
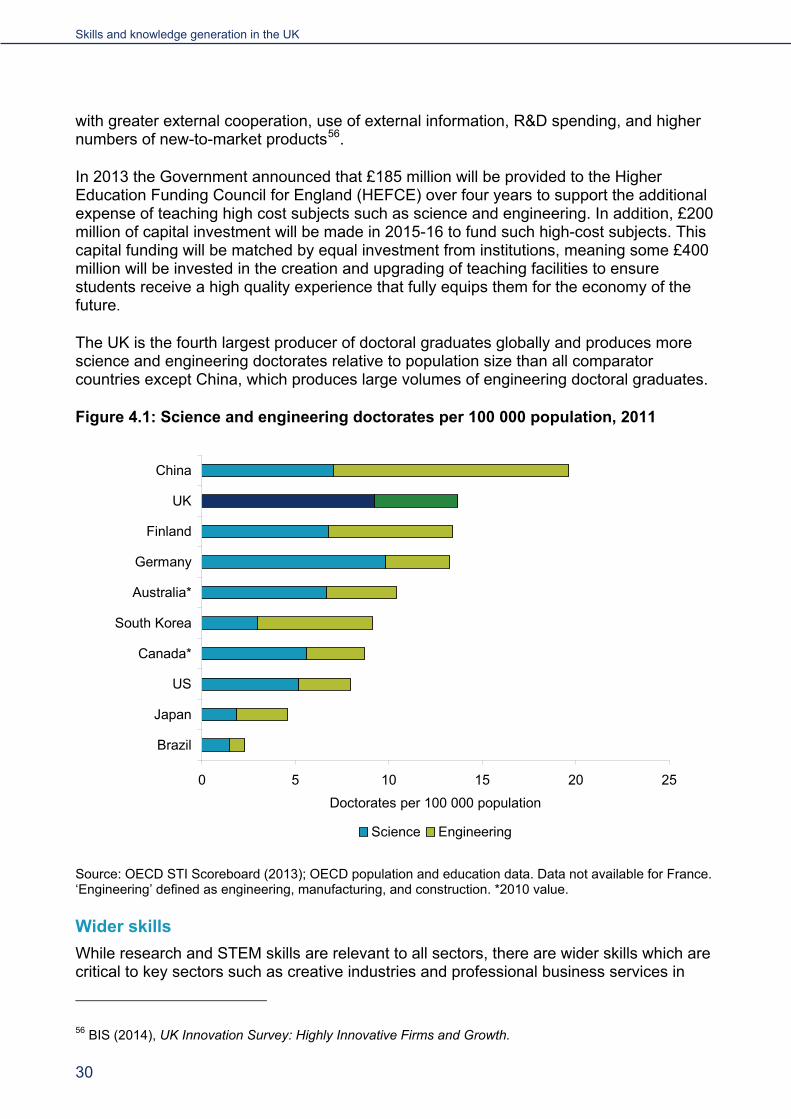
Figure 4.1: Science and engineering doctorates per 100 000 population, 2011 ............ 30
Figure 4.2: Share of one per cent most cited articles, 2000-2012 (excluding the USA) . 34
Figure 4.3: Number of articles in one per cent most cited per hundred researchers, 2000-2012 ............................................................................................................. 35
Figure 5.1: Percentage of innovators reporting barriers to innovation as ‘high’ by firm size, 2008-2010 .................................................................................................... 38
Figure 6.1: Percentage of business R&D financed from abroad, 2000-2012 ................. 49
Figure 6.2: Ownership of R&D performed by businesses in the UK, 1993-2012 ........... 50

Innovation Report 2014
i
Foreword Innovation is vital for prosperity. Using knowledge effectively enhances productivity and welfare and creates new UK market opportunities. We remain one of the world’s leading innovators, with many enviable assets and investment that has held up in challenging circumstances. However, we know the gauntlet is being thrown down - other countries are ramping up their activity.
This Report sets out a range of the most recent evidence explaining the UK’s innovation performance and the latest innovative achievements across business, higher education and research organisations and government.
To maximise impact, our innovation systems must be inter-connected and coherent, reflecting the shape and priorities of the economy as a whole. Through our focus on Eight Great Technologies and as part of Industrial Strategy, business and government are working in partnership to develop sectors and technologies where the UK is leading or has the potential to lead the world and to stimulate growth. This is underpinned by our innovation infrastructure which supports our growing businesses, including through world-leading organisations such as the Intellectual Property Office, British Standards Institute and the National Physical Laboratory.
Our universities are a key source of knowledge and expertise for UK businesses. The UK has world-class universities that provide us with the highly skilled workforce necessary to drive innovation and are second only to the USA in attracting students from around the world. Our research base is well rounded and impactful across most major research fields and is demonstrably world-leading with high and rising research quality, despite increasing competition from emerging powers.
Innovation is transformed into economic growth through businesses. We have an attractive tax environment for companies engaging in R&D and, through the Technology Strategy Board, we provide innovation support to help businesses take the crucial steps in developing innovations. These range from:
• Smart grants to bridge funding gaps in businesses’ innovation processes; to
• Catapult Centres helping businesses to develop new ideas into commercial success in key UK economic sectors; to
• the Small Business Research Initiative, which helps small businesses to find a route to market for their ideas through competing for Government contracts to develop new products and services.
The UK is highly internationally connected. Our research base and institutions have strong overseas links and much of our research and development benefits from foreign investment. In 2011, the UK attracted as much overseas investment in its R&D activity as Canada, Finland, Japan, China, and Russia combined and 42 UK universities are ranked

Foreword
ii
amongst the 100 most international universities globally. In order to further develop our strong international position, we are developing research and innovation collaboration frameworks with key powers around the world, and we are working with our world-class innovation institutions to encourage investment into the UK and enable UK businesses to export. We have worked with the European Commission to build the next innovation and research framework, Horizon 2020, and to improve access for UK businesses to EU funding programmes. The challenge now is to support our business community to access this funding opportunity effectively.
This report provides us with an opportunity to reflect on the UK’s successes and strengths. However, innovation, by its nature, never stays still. The time is right to reflect on what the UK’s innovation system should look like in the next decade if we are to retain our position as one of the world’s leading innovators and build upon the economic recovery. Therefore this document represents the start of a process culminating in a fresh long-term strategy for science and innovation to be released later this year.
DAVID WILLETTS
Minister for Universities and Science
March 2014

Innovation Report 2014
3
Summary Innovation has been, and will continue to be, a key driver of UK growth and economic prosperity, accounting for up to 70 per cent of economic growth in the long term. It enhances health and welfare and helps us to address key challenges facing society such as ensuring clean and sustainable energy and food security, and responding to demographic change. Pushing forward the boundaries of knowledge and development and exploitation of new technologies is central to the Government’s Industrial Strategy.
This report contains the latest evidence on innovation activities, compares UK performance against other economies and highlights policy. The UK continues to perform strongly in a number of areas: our research base remains a world leader and both public and private R&D investment has held up well in a challenging economic environment. We also continue to perform well on intangible asset investment that is essential to innovation. But we need to strengthen our performance in some areas to remain one of the leading innovation nations and to build on our strengths.
The innovation system and infrastructure Leading national innovation systems perform well across a broad range of system metrics, including excellence of research systems, intellectual assets and linkages and entrepreneurship. Our innovation system and the organisations within it continue to provide essential support to businesses and research organisations looking to protect and develop their ideas.
Recently we have seen greater collaboration among our infrastructure organisations, a suite of new measures from the Intellectual Property Office to address the recommendations of the Hargreaves Review, and a particular focus on support for emerging technologies in standards and measurements. Local Enterprise Partnerships (LEPs) are now the key players in steering support for innovation at the local level and are working to maximise the impact of funds available to their regions.
UK innovation performance UK expenditure on R&D as a share of GDP remains behind many of the world’s other major economic powers, but levels of investment have remained stable for a number of years throughout the economic crisis. This has been discussed in detail in a recent BIS review1 and our report builds on that analysis.
The UK’s ranking on international indices of innovation performance is generally respectable, and in some cases has improved over time to place the UK among the top innovation nations. Such studies note the UK strengths such as university-business collaboration and our HE sector, but also highlight areas for improvement, such as the relatively small proportion of firms engaged in innovative activity.
1 https://www.gov.uk/government/uploads/system/uploads/attachment_data/file/277090/bis-14-544-insights-from-international-benchmarking-of-the-UK-science-and-innovation-system-bis-analysis-paper-03.pdf.
Introduction
4
Skills and knowledge generation Our world class research base continues to outperform. The UK research base continues to produce a large output for our moderate size, with a sustained track record of high quality research. With just 4 per cent of the world’s researchers, we account for 6 per cent of world articles, 12 per cent of citations (a key measure of research excellence) and 16 per cent of the most highly cited articles.
Our universities, which include four of the top ten in the world, are a key source of knowledge generation and provide the UK with a highly skilled workforce. We have other strengths in terms of production of the most highly skilled people and rank behind only the USA in terms of attracting foreign students to study here. In some other measures related to talent, such as basic skills and management skills, UK performance is less strong. The Government has taken measures to provide greater support for skills and research with a focus on STEM2 subjects, open access, efficiency, university-business collaboration, research excellence, and the future strategic direction of science and innovation in the UK.
Innovation in business Innovation is central to the success of individual businesses. The 2013 Spending Review placed particular emphasis on support for business-led innovation as a priority for additional investment to drive growth. We are working to remove the barriers that can prevent businesses of all sizes innovating.
The network of Catapult Centres is established and expanding, with two new Catapults opening next year in Energy Systems and Precision Medicine. Through the Industrial Strategy we are promoting technology development and establishing collaborations to boost innovation in key sectors. We are also investing £600 million in Eight Great Technologies to speed up the commercialisation of leading edge research.
The Technology Strategy Board is focussing on small businesses, which experience barriers to innovation more keenly, and is boosting its programmes such as Smart and the SBRI. An additional £250 million has been announced for programmes to allow the Business Bank to support greater numbers of smaller businesses. The UK offers one of the world’s most attractive tax environments for small companies to carry out R&D, and small and medium-sized firms account for a growing share of R&D tax credits.
International innovation Being able to operate effectively with international partners and to draw on resources around the world is becoming more important to UK businesses. The UK is highly internationally connected, with strong overseas links through our research base and high levels of foreign investment. We are a destination of choice for high quality researchers.
The UK remains an attractive R&D destination, leading most of the world in foreign investment into our innovation and research system. Expenditure on R&D by foreign-owned companies now exceeds that of domestically-owned firms. We continue to develop positive, open and mutually supportive relationships with a range of countries around the world, both to encourage investment in the UK and to enable our businesses to export.
2 Science, Technology, Engineering and Maths.

Innovation Report 2014
5
1. Introduction The UK’s research and innovation system is key driver of growth. Pushing forward the boundaries of knowledge and development and exploitation of new technologies is central to the Government’s Industrial Strategy. It is a pre-requisite for long-term growth in productivity and prosperity and the creation of new market opportunities for the UK. It enhances health and welfare and helps us to address key challenges facing society such as clean and sustainable energy, food security and demographic change.
The UK research and innovation system is based on a well regarded, integrated and internationally connected network of institutions, organisations and companies.
The UK Government has an active role in fostering innovation. This involves working with key public and private sector players to address market failures and enhance coordination, collaboration, connectivity and healthy competition in the system.
1.1 Context Innovation is the application of knowledge to the production of goods and services. It means improved product and service quality and enhanced process effectiveness. This report, the fifth of its type, sets out UK performance and outlines developments in innovation policy since our last report in November 2012.
We examine the whole innovation system including the knowledge base in universities and elsewhere, the innovation infrastructure and the business community. As such, the phrases “innovation” and “innovation system” have a broad meaning in this report, which covers the full range of inter-connected institutions, policies and practices. The report tracks a range of innovation indicators that we use to monitor how the UK is performing across a range of outputs and inputs.
Our report follows the recent review for BIS carried out by Tera Allas Insights from international benchmarking of the UK science and innovation system3. This detailed report identified the UK’s innovation strengths and areas to strengthen, and indicated the priority areas to address to capture the maximum benefits from science and innovation. This report uses some similar metrics and we also present further analysis to look more closely at recent movements in performance and changes of policy.
Innovation systems are complex, involving interactions between businesses, knowledge institutions, academics, funders, business support organisations and the innovation infrastructure bodies. In addition, there are important innovation sub-systems oriented
3 Department of Business Innovation and Skills (2014), Insights from international benchmarking of the UK science and innovation system. Accessed at: https://www.gov.uk/government/uploads/system/uploads/attachment_data/file/277090/bis-14-544-insights-from-international-benchmarking-of-the-UK-science-and-innovation-system-bis-analysis-paper-03.pdf.

Introduction
6
around technologies or demands. To benefit as much as possible from the impacts of innovation, we need a coordinated system with cooperation across government and broader public and private sectors.
The government can support innovation policy in a number of ways, including through reducing risk to commercially viable levels, easing credit constraints, ensuring skilled people are provided to the labour market and setting regulatory frameworks and standards4. Innovation is central to the successful delivery of our Industrial Strategy, crucially, and through necessity, this approach is cross-government and long-term.
This report forms part of the context for the Science and Innovation Strategy which will be published in autumn 2014 and will set out the future shape and scale of the UK’s science and innovation system. It examines how we measure the system’s performance and the key challenges for the UK to address to maintain a global leadership position in the face of increased competition. This report provides part of the evidence base for the strategy.
1.2 The benefits of innovation Creating economic growth Innovation is the engine of economic growth and improved living standards. A recent evidence review5 noted that over the past half century the private rate of return to research and development (R&D) in developed economies has been strongly positive, ranging from 20 per cent to as high as 75 per cent.
This is not surprising. Innovation has been transforming the world economy since the industrial revolution. General Purpose Technologies (GPTs) like steam-power, electrification and Information and Communication Technologies (ICT), and the subsequent innovations which built upon them, have revolutionised the way people live and accompanied the fastest period of economic growth in recorded history. On the back of these improvements the time it took to double living standards dropped from five centuries in 1300, to one century in 1800 and then to 28 years in 19296.
These benefits are felt by individuals and firms. Individuals who acquire knowledge, skills, and expertise are rewarded through higher salaries, better job prospects and improved welfare. One recent study7 shows that, over their lifetime, men with a graduate degree earn on average £168,000 more than those with two or more A levels. For women this
4 Department of Business Innovation and Skills (2011) Innovation and Research Strategy for Growth Economics Paper No 15, Accessed at: http://www.bis.gov.uk/assets/biscore/innovation/docs/e/11-1386-economics-innovation-and-research-strategy-for-growth.pdf. 5 Hall, B. et al (2009) Measuring the returns to R&D, National Bureau of Economic Research, Working Paper 15622. 6 Gordon.R (2012), Is U.S. Economic Growth Over? Faltering Innovation Confronts the Six Headwinds, National Bureau of Economic Research, Working Paper 18315. 7 Department of Business, Innovation and Skills (2013), The Impact of University Degrees on the Lifecycle of Earnings: Some Further Analysis, Research Paper 112, Accessed at: https://www.gov.uk/government/uploads/system/uploads/attachment_data/file/229498/bis-13-899-the-impact-of-university-degrees-on-the-lifecycle-of-earnings-further-analysis.pdf.

Innovation Report 2014
7
figure is £250,000. Those who obtain a level 3 Apprenticeship earn between £115,000 and £156,000 more than those with a level 2 qualification8.
Companies benefit through the broad range of services, competencies and knowledge these skilled individuals create. Firms that persistently invest in R&D have higher productivity (13 per cent higher than those with no R&D spending and 9 per cent more than firms who occasionally invest in R&D), better value added per employee, and more exports.9 10 11
Innovation extends far beyond traditional notions of research and development. Between 1998 and 2006 ‘intangible’ assets accounted for 0.4 percentage points of the annual growth in labour productivity12. Such assets include: economic competencies (e.g. management training, market research and branding); scientific and creative property (e.g. patents, licences and designs); and computerised information (e.g. software and databases). The UK is a world leader in the creation of many of these assets. Discussion of the UK’s recent innovation performance on a number of input and output metrics, including measures of intangible assets, is provided in Chapter 3.
Addressing social challenges Full public economic returns from innovation for society have been measured up to three times the level of the private returns.13 In addition to economic impacts innovation will play a critical role in addressing the society’s future challenges. The world’s population is projected to rise from approximately 7 billion now to 9 billion by 205014. The age structure of the UK’s population is changing as people live longer and there are challenging and legally-binding carbon reduction targets to meet. Energy supply, food security and demographic change are examples of where the UK is well placed to use innovation to change a threat into an opportunity through the generation of new scientific knowledge and its application through emerging technologies, including the Eight Great Technologies15.
8 Department of Business, Innovation and Skills (2013), The Impact of Further Education Learning, Research Paper 104, Accessed at: https://www.gov.uk/government/uploads/system/uploads/attachment_data/file/69179/bis-13-597-impact-of-further-education-learning.pdf. 9 Cefis, E., Ciccarelli, M. (2005), ‘Profit differentials and innovation’, Economics of innovation and new technologies 14, Routledge. 10 Cefis, E., Orsenigo, L. (2001), ‘The persistence of innovative activities: A cross-countries and cross-sectors comparative analysis’, Research Policy 11 Lööf et al (2012), ‘R&D Strategy and Firm Performance: What is the Long-Run Impact of Persistent R&D?’ in Innovation & Growth. From R&D Strategies of Innovating Firms to Economy-Wide Technological Change Oxford University Press. 12 Riley, R. and C. Robinson (2011), UK Economic Performance: How Far do Intangibles Count?, Innodrive working paper No. 14. 13 Department of Trade and Industry (2003), DTI Strategy – The Analysis, DTI Economics Paper No 5, Accessed at: http://www.berr.gov.uk/files/file14768.pdf. 14 Department of Business, Skills and Innovation (2001), The Future of Food and Farming: Challenges and Choices for Global Sustainability, Foresight Final Project Report Government Office for Science, Accessed at: http://www.bis.gov.uk/assets/foresight/docs/food-and-farming/11-546-future-of-food-and-farming-report.pdf. 15 Willets. D (2013), Eight Great Technologies, Policy Exchange, Accessed at: http://www.policyexchange.org.uk/images/publications/eight%20great%20technologies.pdf.

Introduction
8
1.3 The innovation system The UK innovation system is a range of interacting elements. It is delivered by a range of different institutions, firms and individuals working in collaboration. We discuss the various players in the system and the UK’s performance in the chapters that follow, covering:
• The innovation infrastructure: the institutions supporting the development and management of intellectual property, standards, measurement, accreditation and design including the Intellectual Property Office, Design Council, the National Measurement System and the British Standards Institution (BSI) (Chapter 2)
• The knowledge base comprises of a range of organisations providing education, training and research including Higher Education Institutions (HEIs), and Public Sector Research Establishments (PSREs) (Chapter 4)
• The business community engaged in innovation across the economy and bodies supporting their commercialisation of innovation, including the Technology Strategy Board (TSB) - the UK’s innovation agency, with the remit to accelerate economic growth by stimulating and supporting business-led innovation – and the intermediate sector organisations such as Research and Technology Organisations (RTOs). The UK also provides an attractive tax environment for companies carrying out R&D (Chapter 5)
• The range of activities that we have in place, working with partners across the innovation landscape, to support international collaboration and investment in innovation, given the UK's uniquely strong internationally connected research and development base (Chapter 6).
Innovation Report 2014
9
2. Our innovation infrastructure Successful innovation systems work as a whole. The UK innovation system is underpinned by a set of public and private organisations, infrastructures, incentives, regulations and frameworks that interact to shape the business environment. These interactions are complex and changing.
Strengthening the coherence of the system, fostering new connections and increasing the commitment of key players have been at the heart of our policy approach over recent years. Steps have been taken to enable innovating businesses to access the knowledge infrastructure more easily, extend their reach to new export markets and strengthen innovation at local level through local leadership and engagement.
2.1 System conditions Innovation is systemic. Although competition is essential to create the incentives for businesses to innovate, formal or informal patterns of collaboration are also frequently found across innovating businesses. ‘Open innovation’16 where firms and other stakeholders collaborate to develop new ideas is an area of increasing policy interest. This is because innovation entails problem-solving, and this frequently involves problems that are outside the existing capabilities of businesses.
Innovation takes many forms. Some modes of innovation are science-based and rest on R&D, while others rest primarily on other skills such as design, or the ability to absorb information from external sources. Some forms of innovation create entirely new goods and services, while others upgrade what already exists. So learning happens through an interactive process with other enterprises and the scientific, information and technology infrastructure.
System conditions have a crucial impact on the extent to which businesses can make innovation decisions. Figure 2.1 provides international comparative evidence showing that the best at innovating tend to have balanced performance across a range of system metrics. The UK was ranked as an “innovation follower” in this study, as discussed in Chapter 3.
16 Evidence suggests that open innovation systems are inherently more likely to produce spillovers (benefits accruing to other firms beyond the returns made by the original firm making the investment) due to the dispersion of knowledge to other firms with an interest in the development of a technology: BIS (2014), Economic Analysis of Spillovers from Programmes of Technological Innovation Support.

Our innovation infrastructure
10
Figure 2.1: Innovation performance across dimensions
0.00
0.20
0.40
0.60
0.80Human resources
Open, excellent researchsystems
Finance and support
Firm investments
Linkages & entrepreneurship
Intellectual assets
Innovators
Economic effects
Modest innovators Moderate innovatorsInnovation followers Innovation leaders
Source: European Commission (2013) Innovation Union Scoreboard
Components of the system must work in a coherent way to be effective. Evidence17 also shows having ‘economic complexity’ through a diverse set of specialised knowledge competencies is a key to growth. The UK performs well on these dimensions, ranked with the leading nations in terms of this economic complexity with a range of unique skills and aptitudes explored later in the report. On collaboration, the UK is second in the EU Innovation Scoreboard for Linkages and Entrepreneurship18. Government plays a key role in creating these conditions that release the innovative potential of the economy.
2.2 The innovation infrastructure The innovation infrastructure offers specialised knowledge to the science infrastructure and businesses, and to wider society. This information acts as a set of resources that reduce the costs of innovation and enable efficiency and connectivity through a range of common languages, best practices and reference sources. These include agreed standards, frameworks and guidance, as well as expert advice and networking activities. It is the informational glue that enables the innovation system to work effectively.
17 http://atlas.media.mit.edu/media/atlas/pdf/HarvardMIT_AtlasOfEconomicComplexity_Part_I.pdf 18 European Commission, Innovation Union Scoreboard, 2013.

Innovation Report 2014
11
Organisations within this infrastructure include the Intellectual Property Office (IPO), the Design Council, the British Standards Institution and the National Physical Laboratory.
We have actively encouraged better collaboration between the innovation infrastructure and businesses to intensify the adoption of digital technology and the exploitation of emerging technologies, and to make the system easier to navigate for SMEs. For instance, expanding the size and scope of the Innovation Vouchers scheme allowed improved access to a greater variety of information services including intellectual property (IP) advisers and design advisers.
Design Design is a key UK strength with a vital role in the innovation process and driving business revenue, from product innovation to commercialisation of science. However, there are parts of the economy where design awareness remains low, including amongst SMEs, and scientists seeking to commercialise new ideas. This is compounded by the fact that the UK design sector is difficult to navigate.
The Design Council champions the value of UK design through a network of partnerships that help connect business leaders, national and local policy makers and design professionals:
• Industrial tech start-ups: Design has a key role in maximising technology’s market potential. The Design Council is extending the reach of small business coaching programmes to help industrial tech start-ups learn how to use design to attract investment, accelerate their technologies to market and reduce risk. Businesses between pre-seed and early stage, and industrial tech ventures with high growth potential, learn how design can help to align products and services with customers and end user needs; how to develop compelling brand stories which stand out in the marketplace; how the right sort of prototyping can help to manage risk; and how design can be used strategically to drive growth of their businesses
• The European Design Innovation Platform (EDIP): The Design Council is heading a £3.2 million European Commission fund with a consortium of 14 partner organisations, including Nesta, Lancaster University, Birmingham University and EU partners. The project, which will be delivered over 3 years, aims to increase the use of design as a strategic means to encourage all forms of innovation, including non-technological user-driven innovation. A web platform will bring together knowledge and examples of design for innovation in the public and private sector. This resource will be available for everyone to find the latest tools and techniques for applying design and making connections. A programme of events for business people, public service managers, and policymakers will also be launched to increase their awareness of design’s role in innovation and growth, and attract investment.
Intellectual property rights UK business invests more in knowledge assets than in physical capital, and British firms have been among the most ‘knowledge intensive’ in Europe since 2000. Intellectual Property Rights (IPRs) provide legal protection to exploit intangible investments. IPRs include:

Our innovation infrastructure
12
• Patents, which protect the technical features and processes that make things work
• Registered designs, which protect the appearance of a product/logo. Designs can also be protected by unregistered design rights, which arise automatically
• Trade marks, which are signs that distinguish goods and services in the marketplace
• Copyright, which protects the expression of ideas, is an automatic right which applies when the work is fixed, that is written or recorded in some way.
As the innovation system evolves, the IP framework has to be significantly reviewed to be fit for the digital age. As part of our implementation programme to the Hargreaves Review (which reported in May 2011), we have introduced, through the IPO:
• IP attachés: specialist IP attachés are now based in the world’s most challenging and fastest growing markets; China, India, Brazil and South East Asia. So far they have provided practical help and support to 293 UK businesses experiencing IP issues
• Small claims track in the IP Enterprise Court: a small claims track in the IP Enterprise Court now gives SMEs the option of pursuing basic IP disputes through an informal hearing, reducing significantly the cost of pursuing IP infringement cases
• The Digital Copyright Hub: the creative industries were supported to create a Digital Copyright Hub, including through financial support of £150,000 kick start funding. Fully realised, this project will mean small companies who wish to licence the works of others should find it easier to do so
• Helping SMEs get value from their IP : an improved range of existing services for business was introduced, including expansion of the IPO-funded IP audit scheme providing high growth SMEs with the ability to manage their own IP and develop a management plan or strategy to make their IP work for them and grow their business19
• Orphan Works and the Extended Collective Licensing Scheme: the Enterprise and Regulatory Reform Act (2013) made it possible to introduce schemes for dealing with ‘orphan works’ (unlocking value of copyright works which cannot currently be used because the owner is unknown), and for extended collective licensing (allowing the clearance of multiple rights quickly and cheaply). These schemes should be operational in autumn 2014
• Codes of Practice for Collecting Societies: minimum standards for collecting societies (organisations which collectively manage copyrights on behalf of rights holders to the tune of £1 billion per annum) have been developed, as well as codes of conduct.
We have taken steps to improve our IP system overall. The Intellectual Property Bill was introduced into Parliament in May 2013 to simplify and improve design and patent protection, clarify the IP legal framework and ensure the international IP system supports
19 http://www.ipo.gov.uk/ip4b/ip4b-uk/ip4b-tools.htm.
Innovation Report 2014
13
UK businesses effectively. The Bill is currently going through its final stages in the House of Commons20.
We also published plans to modernise copyright exceptions in December 2013 and we are now preparing regulations with the aim of the changes coming into force in April 2014. These measures should benefit innovation, competition, research, education and respect for the law21.
A new joint research effort between IPO, Ofcom, and Kantar Media has been providing a benchmark for online copyright infringement. The scale and prevalence of overlapping sets of patent rights which require innovators to reach licensing deals for multiple patents from multiple sources have been investigated to assess whether they are a barrier to SMEs entering the technology sector.
Access to finance for IP-rich firms also has to keep pace with changes. There are barriers to innovation-related investment funding, especially for loan finance. The IPO commissioned an independent report focusing on supply of loan finance for IP rich SMEs, published in November 201322. It focuses on behaviour needed in finance and IP communities to enable IP to be used to leverage investment and support business growth potential. The IPO has been engaging with banks and investors, insurers, academics, business advisors and innovators to develop a response.
Fast-tracking green patents An independent evaluation by the London School of Economics in 2013 showed that the UK fast-tracking green patents scheme successfully stimulates innovation and meets a demand from new businesses23.
Pioneered in the UK in 2009, the objective of the scheme was to stimulate the commercialisation of clean technologies by reducing the time-to-grant for green patents and prioritising them over non-green patents. The scheme reduces time to grant from several years to a few months, and has since also been adopted in Australia, Canada, Israel, Japan, Korea, and USA.
The study showed that the UK scheme was the most popular with 21 per cent of eligible patents applications making use of the system (compared with to 1-2 per cent in Australia, Canada, Japan and Korea). Furthermore, applicants applying via the fast-track system reduced their time-to-grant by an average of 75 per cent (compared with 68 per cent, 49 per cent, 48 per cent, and 42 per cent for Canada, Australia, Israel and USA respectively).
The study found strong evidence that green patent fast-track schemes accelerate the diffusion of knowledge in the short-run. In particular, start-up companies frequently use fast-track applications as a granted patent can help some companies raise private capital.
20 http://services.parliament.uk/bills/2013-14/intellectualproperty.html 21 http://www.ipo.gov.uk/response-2011-copyright-final.pdf 22 http://www.ipo.gov.uk/ipresearch-bankingip.pdf 23 http://ictsd.org/downloads/2013/02/fast-tracking-green-patent-applications-an-empirical-analysis.pdf

Our innovation infrastructure
14
The quality infrastructure The quality infrastructure is part of the innovation infrastructure and consists of organisations such as the British Standards Institution (BSI), the National Physical Laboratory (NPL), National Measurement Office and the UK Accreditation Service (UKAS). Measurement and standards support earlier stages of innovation and technology development. Conformity assessment and accreditation provides confidence that these standards are being maintained once products and services are brought to market. This combined expertise provides significant competitive advantages as markets grow.
Recent initiatives have focused on developing solutions to help technologies and widen access to emerging markets, including:
• Graphene: NPL, as the UK’s National Measurement Institute, has been providing measurement capability (quantum metrology and nanoanalysis techniques) to characterise the graphene produced by various methods and enable its industrial production. This work allows the UK to influence the development of international standards for graphene based on its unique properties
• Synthetic biology, Cell therapies, Offshore renewables and Assisted living: the gap between research and commercialisation can be bridged in part through the strategic use of voluntary standards. To demonstrate the value of this approach, BSI and the TSB started work to deliver advice and, where relevant, standards programmes in these four pilot areas, mapping out standards needs and identifying how standards can enable further development in each field
• Smart cities: The smart cities standards strategy24 (published in 2012) set out a holistic approach covering the role of standards in creating confidence in the smart cities market, helping cities to develop the capabilities for innovative infrastructure as well as ensuring that interoperability issues are resolved. A hierarchy of standards needs was identified, from high-level strategic frameworks supporting cities’ long-term goals to detailed technical specifications. The first phase of standards, published in February 2014, helps cities to take the first steps to becoming smarter. The next phase will be aimed at supporting the growth of the global market for smart cities.
BSI is regarded as a thought leader on standards and as the market leading national standards body globally. This influence provides a powerful mechanism for encouraging alignment with the British standards system and opening up overseas markets to British businesses. In December 2013, as part of the Prime Minister’s trade visit to China, a formal agreement was signed to permit the mutual recognition of British and Chinese standards. This is the first mutual recognition agreement entered into by the Chinese standards authority. The specific standards will include key emerging technology areas.
BSI has been developing other projects around the world to encourage the use of British and European standards in place of conflicting pre-existing local standards. BSI is working in the Gulf, supported by UKTI, to encourage the adoption of British standards which
24 http://www.bsigroup.com/LocalFiles/en-GB/smart-cities/resources/BSI-smart-cities-report-The-Role-of-Standards-in-Smart-Cities-UK-EN.pdf

Innovation Report 2014
15
would assist UK exporters and has created a network of standards bodies from Commonwealth countries to encourage them to update their collection of national standards to reflect changes to British standards.
Standards as frameworks for converging technologies Technological convergence is the process by which existing technologies merge into new forms that bring together different types of technologies, media and applications. For example, the so-called fax revolution was produced by a convergence of telecommunications technology, optical scanning technology, and printing technology. New types of media storage are likely to include additional features like the ability to interface with more devices or play other types of media.
Standards give assurance to the market that interactions between technologies are well defined and help to manage consumers’ and suppliers’ expectations. Recent initiatives such as Smart Cities and Assisted Living involve strands of converging technologies, such as ICT/data, security, infrastructure, construction and healthcare. The role of standards in a world of rapidly evolving and increasingly converging technologies is to provide frameworks for interoperability, whilst still allowing the freedom to innovate.
2.3 Driving innovation at the local level Modern technologies mean that businesses and people are increasingly mobile, but spatial barriers are still significant. Business location choices remain limited by the nature of innovation processes which favour the geographical concentration of interdependent value adding activities and lead to ‘clustering’ effects. A cluster is typically a geographic concentration of inter-connected businesses and suppliers, and associated institutions, such as universities, in related fields. Clusters tend to encourage innovation through both collaboration and competition and recent work has mapped cluster activity in the UK25. However, not all innovation occurs within clusters and highly innovative businesses are found dispersed throughout the UK26.
Our approach has been to intensify interconnections between key players to strengthen local innovation systems. We are improving the effectiveness of local innovation systems through Growth Hubs and local strategies, working with Local Enterprise Partnerships (LEPs). This is being reinforced by the implementation of both the key recommendations from the Witty Review27 on the role of universities in driving growth and the EU Smart Specialisation approach to identifying areas of comparative advantage.
25 Enterprise Research Centre (2014), Localisation of Industrial Activity Across England’s LEPs http://enterpriseresearch.ac.uk/default/assets//File/LEP%20Clusters%20Report%20January%202014%20Final%20Revised.pdf. 26 BIS (2014), UK Innovation Survey: Highly Innovative Firms and Growth 27 Witty Review (2013), Encouraging a British invention revolution: Sir Andrew Witty's review of universities and growth, Accessible at: https://www.gov.uk/government/uploads/system/uploads/attachment_data/file/249720/bis-13-1241-encouraging-a-british-invention-revolution-andrew-witty-review-R1.pdf.

Our innovation infrastructure
16
Local Enterprise Partnerships (LEPs) LEPs are now the key players in steering support for innovation at the local level, and their role is growing. Many LEPs are already delivering innovation initiatives through Regional Growth Fund Growing Places Fund and City-Deals, working with universities, businesses and other partners, to put in place local solutions to help businesses grow. LEPs are in the process of finalising their Strategic Economic Plans with government, and these will be used as the basis on which they will negotiate a “Growth Deal”, providing them with the opportunity to compete for Local Growth Funds, as well as agreeing freedoms and flexibilities. In summer 2013, we announced notional allocations to each LEP from the £5.3 billion of European Structural and Investment Funds (ESIF), for the period 2014-2020. At least £660 million (c.€800million) will be directed towards supporting innovation, and LEPs submitted their plans for this in January 2014.
LEPs are developing activities that will target innovative SMEs with growth potential, and are simplifying access to support through establishing Growth Hubs. They are having partnering discussions with the Growth Accelerator programme, the Manufacturing Advisory Service and the UKTI export service with the aim of increasing the number of SMEs receiving support and increasing intensity of this support. LEPs are also engaging with TSB on how they might work together on this agenda, to enable more world class innovation to be commercialised.
Enterprise M3 LEP and the 5G centre in Surrey The University of Surrey is working with many of the mobile communications global industry leaders to build a new collaborative international research centre which will support the development of 5th Generation cellular communications. The 5G Centre will provide real-time experimental facilities to underpin the development of new mobile broadband internet products and services.
The consortium includes: Aeroflex, AIRCOM International, BBC, BT, EE, Fujitsu Laboratories of Europe, Huawei, Ofcom, Rohde & Schwarz, Samsung, Telefonica and Vodafone. It has pledged time, expertise and other contributions totalling more than £30 million. This was stimulated by the £11.6 million that was awarded by the Higher Education Funding Council for England (HEFCE) under the UK Research Partnership Investment Fund (UKRPIF) in autumn 2013. Enterprise M3 LEP has worked closely with the University (supported with £3 million from the HEFCE Catalyst Fund) and business partners to build on the research and knowledge assets in and around the LEP area, and the Greater Thames Valley LEPs (Enterprise M3, Oxfordshire, Buckinghamshire Thames Valley, Thames Valley Berkshire, Hertfordshire, and Coast to Capital) are supporting an approach that extends across a wide geographical area.
Universities are already taking a leadership role in identifying areas of comparative advantage and embedding these appropriately within LEP strategies to maximise their impact. Sir Andrew Witty’s Review of Universities and Growth, published in October 2013, highlights both the important role that universities play in supporting the economy to grow and the scope to further capitalise on their capacity. It called for an even closer relationship between universities and LEPs in developing and delivering Strategic Economic Plans that will drive growth, with a focus on the genuinely competitive strengths of our local economies.

Innovation Report 2014
17
The Government response to be published in spring 2014 endorses many of the Review conclusions, aiming to help clear the obstructions he has observed, so that his challenges in supporting new technologies to flourish and have market impact can be pursued.
EU Smart Specialisation Smart Specialisation is a method for assessing the particular economic strengths and comparative advantages of particular places. It recognises that businesses are best placed to lead in the identification of new opportunities for growth and understands that the process of discovery used by the most entrepreneurial of firms is one that should be emulated within public policies for innovation. However, it also recognises that innovative businesses need to work closely with universities, other research centres, public agencies and civil society, if investments are to be better embedded into the existing potential of local economies and ever wider flows of trade, ideas and investment.
This approach, illustrated in Figure 2.2, applies to innovation in the fields of technology, business processes, agricultural industries and social innovation, including the reform of public services. It provides for better strategic alignment of all relevant public funding support for innovation from both national and EU sources. It recognises:
• the value of an on-going process of learning, continually driving more productive and sustainable investments in innovation at all levels
• the importance of evidence in designing innovation policy
• that innovation policies need to be embedded into the local economy
• that benefits of new technologies developed can be transferred into related sectors
• that artificial or administrative boundaries should not hinder firms and research institutions in their pursuit of innovation.
Figure 2.2: The smart specialisation strategy cycle

Our innovation infrastructure
18
The new ESIF starting in 2014 have adopted Smart Specialisation principles to ensure that the funds maximise their impact. In the UK, the Devolved Administrations in Scotland, Wales and Northern Ireland and the 39 English LEPs have been charged with developing strategies for ESIF and in many cases have adopted a Smart Specialisation approach to doing so. They are working to incorporate these funds within the framework of their overall Strategic Economic Plans, bringing together European, national and local resources into one seamless whole to better support economic growth and innovation within their area.
Innovation Report 2014
19
3. UK’s innovation performance The UK ranks 7th in the world in terms of its overall level of R&D spending, with 3 per cent of the global total. Its share of innovation spending as a proportion of GDP places it behind several of the leading research nations. However, in recent years, UK R&D investment has held up well in a challenging economic environment and the UK continues to perform well on intangible asset investment that is essential to innovation.
Innovation has been, and will continue to be, a key driver of UK productivity growth and economic prosperity. While it can be clearly and credibly demonstrated that the UK has a world-leading research base, performance on the commercialisation of its outputs is harder to measure, and the results are more nuanced. Currently the UK maintains a respectable position internationally. On some metrics it is among the leading innovation nations in the world, and there are some signs that the performance of the system is on a positive trajectory.
3.1 Expenditure on R&D and innovation Innovation operates in a global system with a significant proportion of innovation28 in advanced economies based on technology transfer from foreign countries. The Organisation of Economic Co-operation and Development (OECD)29 estimates that in 2011 the USA continued to be the world’s largest performer of R&D (approximately 32 per cent30 of the world total), followed by China (16 per cent) and Japan (12 per cent). The UK ranked 7th, with 3 per cent of the overall global spend, amounting to £27.4 billion in 2011.
Across the OECD31 intensity32 of gross expenditure on R&D (GERD) increased from 2.2 per cent in 2001 to 2.4 per cent in 2011. R&D intensity was highest in South Korea and the R&D intensity of China, where expenditure has accelerated significantly in recent years, exceeded that of the UK for the first time in 2011. Expenditure in the UK, while accounting for a lower share of GDP, at 1.8 per cent in 2011, displayed notable stability during the economic crisis (see Figure 3.1). The business sector, critical for the successful commercialisation of research, continues to be the largest performer of R&D in the UK.
28 Department for Business, Innovation and Skills (2014), Insights from international benchmarking of the UK science and innovation system, BIS Analysis Paper Number 03. Accessible at: https://www.gov.uk/government/uploads/system/uploads/attachment_data/file/277090/bis-14-544-insights-from-international-benchmarking-of-the-UK-science-and-innovation-system-bis-analysis-paper-03.pdf. 29 Organisation of Economic Co-operation and Development (2013), OECD Science, Technology and Industry Scoreboard 2013, Accessed at: http://dx.doi.org/10.1787/sti_scoreboard-2013-en. 30 Estimate is based on R&D expenditure by OECD countries, Brazil, India, Indonesia, Russia, China and South Africa. Data on Israel were not available. 31 Organisation of Economic Co-operation and Development (2013), OECD Science, Technology and Industry Scoreboard 2013, Accessed at: http://dx.doi.org/10.1787/sti_scoreboard-2013-en. 32 Intensity of R&D is measured as expenditure as a share of Gross Domestic Output (GDP).

UK’s innovation performance
20
Figure 3.1: Gross expenditure on R&D as a share of GDP, per cent, 2000-2012
China, 2.0
Finland, 3.5
France, 2.3
Germany, 2.9
Russia, 1.1
South Korea, 4.4
UK, 1.7
0
0.5
1
1.5
2
2.5
3
3.5
4
4.5
520
00
2001
2002
2003
2004
2005
2006
2007
2008
2009
2010
2011
2012
Per c
ent
Canada China Finland France GermanyJapan Russia South Korea UK US
Note: Gross Expenditure on R&D is reported from the performers’ perspective. Source: OECD MSTI (2013/2). Data for 2012 are provisional projections.
Public spending and investment Since 2010, the UK science resource budget has been ring-fenced, contributing to the UK’s stable performance on R&D spending. Total funds committed by the Government for R&D, which are captured in the Government Budget Appropriations or Outlays for R&D (GBAORD), decreased by £0.4 billion (or 4 per cent) in real terms from 2010/11 to 2011/12; a fall almost entirely attributable to reductions in defence expenditure on development33. Figure 3.2 shows these funds34 (alongside Business Enterprise Expenditure on R&D (BERD)) as a share of total output: the UK is below the OECD average and well behind the leading countries such as Finland and the USA.
In the UK we have prioritised spending on long-term infrastructure projects and other programmes that will promote economic growth. Significant investment in projects, including autonomous robotics, big data, major upgrades and new facilities at the Harwell Science and Innovation Campus, have been enabled through public spending on the UK science base. As well as providing additional resource funding of £185 million for the TSB to support innovation, we have committed35 to maintaining resource funding for science at £4.6 billion in 2015-16 and capital funding has been increased in real terms from £0.6
33 The sharp fall in 2011-12 net research expenditure was reported by the MOD’s Defence Equipment & Support (DE&S) as a number of project teams have moved from development phase to manufacturing resulting in a tailing off of their spend. 34 Includes Research Councils, Higher Education Funding Councils, Civil Departments, Defence and UK contribution to EU R&D budget. 35 HM Treasury (2013), Autumn Statement 2013 https://www.gov.uk/government/publications/autumn-statement-2013-documents.

Innovation Report 2014
21
billion in 2012-13 to £1.1 billion in 2015-16; this is set to rise in line with inflation every year to 2020-21.
Figure 3.2: International comparison of Government Budget Appropriations or Outlays on R&D, 2012, and Business Expenditure on R&D, 2011
0 0.5 1 1.5 2 2.5 3 3.5
Australia
Canada
Russia
UK
France
Japan
US
Germany
South Korea
Finland
Per cent of GDP
BERD GBAORD
Notes: GBAORD measures the funds committed by governments (principally federal/central) for R&D to be carried out domestically or abroad (including by international organisations). Data for Canada and South Korea GBAORD are for 2011. Data for UK BERD are for 2012. Source: Organisation of Economic Co-operation and Development (2013), Office for National Statistics (2013)
We are also committed to removing barriers to innovation, which can take many forms, across different sectors of the economy. Through the Industrial Strategy, Government and industry are working in partnership to set out a long-term approach to give businesses confidence to invest and grow. The Industrial Strategy has five strands: sectors; technologies; access to finance; procurement; and skills. This offers flexible support to all sectors; however, we have developed sector-specific strategies in eleven sectors where Government intervention can have the most impact.
The agricultural technologies strategy is one of these eleven and was launched in July 2013, with the aim of unlocking a new phase in agricultural innovation. As part of this, Government is investing £70 million36 in a new Agri-Tech Catalyst, which has been set up by the TSB and the Biotechnology and Biological Sciences Research Council to support and fund innovative ideas which advance the sustainable intensification of agriculture and food security. World class Centres for Agricultural Innovation, with £90 million from Government and additional investment from industry, will also support the wide-scale adoption of innovations in the food and farming supply chain.
36 Including £10 million funding from the Department for International Development to support the transfer of technology and new products to developing countries.

UK’s innovation performance
22
The automotive sector is highly innovative, investing £1.7 billion in 2012. The UK automotive industry has already been transformed in recent years, with three cars produced every minute and 1.58 million vehicles produced in 201237. The automotive industrial strategy was also launched in July 2013, with the objective of securing the sector’s long term future, growing the UK share of the global value chain and securing the UK’s position in low carbon R&D. A key part of the strategy, the new Advanced Propulsion Centre, will receive around £1 billion over 10 years. Over the next five years, the sector has also committed to recruit more than 7,600 additional apprentices and 1,700 additional graduates who will be vital to maintaining the UK’s competitive and dynamic position in the world.
Over £600 million has been invested in ‘Eight Great’ emerging technologies where the UK has the depth of research expertise, the business capability to develop a range of applications, and the potential to be at the forefront of commercialisation. A further commitment was announced at the Autumn Statement 2013 to develop a network of research centres in quantum technologies, with a £270 million investment over five years to improve high-level skills and to reinforce the UK’s position as a global leader in this cutting-edge field of research.
A selection of developments announced by Research Councils UK, shows a few examples of the areas where the UK is breaking new ground and has led the world in 201338:
• Advanced manufacturing: The world’s first flexible imaging sensor has been unveiled, with the potential for application in smart packaging, biomedical diagnostics, and surface scanners
• Advanced manufacturing: Tiny LED lights with Wi-Fi-like internet communication capability have been developed to deliver information into a range of domestic, commercial and public spaces
• Regenerative medicine: Scientists have bioengineered the first tooth produced from human gum cells, offering hope that missing teeth may one day be replaced using a person’s own gum cells
• Regenerative medicine: A degradable polymer that can be inserted into broken bones to encourage real bone to regrow is being developed by scientists using a pioneering technique called ‘solvent blending’
• Satellites and space: A software tool, based on software for the European Space Agency’s Envisat satellite, was used to create a program that analyses human brain scans and a simple method for wide-scale screening for Alzheimer’s disease.
37 Department for Business, Innovation and Skills (2013), Driving success – a strategy for growth and sustainability in the UK automotive sector Accessible at: https://www.gov.uk/government/publications/driving-success-uk-automotive-strategy-for-growth-and-sustainability. 38 Research Councils UK (2013), Timelines of Research. http://www.rcuk.ac.uk/research/timelines/.
Innovation Report 2014
23
Business spending and investment The business sector is the largest performer of R&D in the UK, accounting for approximately two-thirds of total GERD, but expenditure is concentrated in a small number of industries (six of the 33 product groups39 used by the Office for National Statistics accounted for two-thirds of BERD in 2012). R&D performed by businesses40 amounted to £17.1 billion in 2012, or 1.1 per cent of GDP (as shown in Figure 3.2); a 4 per cent decrease on 2011 but higher than in 2010 in real terms.
The overall year-on-year fall between 2011 and 2012 was driven largely by trends in the pharmaceutical industry, in which there were some closures of UK R&D facilities, including at Sandwich and Charnwood. The Life Sciences Strategy41 published in December 2011 was designed to support the UK in re-establishing itself as the location of choice for life sciences and recently there have been promising signs of improvement, including the announcement of £330 million R&D investment in Cambridge by a large pharmaceutical organisation. The UK has also remained an attractive destination for international firms wishing to invest in R&D, with expenditure on R&D by foreign-owned firms representing around half of total R&D in 2012.
The accessibility of finance is a key factor in creating an environment attractive for innovation in UK businesses. In addition to £1.25 billion of new resource, the British Business Bank has brought together £2.9 billion of existing government-backed lending and equity solutions and supported approximately 10,000 businesses in the year to September 2013. The 10,000th Start-up Loan was made in November 2013 and the scheme has now lent over £50 million to entrepreneurs. The £300 million Investment Programme has unlocked £125 million lending for smaller businesses through its first two awards totalling £45 million.
Firms are also finding themselves increasingly competing for high value-added activities in global value chains42 and are looking beyond the traditional notion of R&D to drive growth. Investment in knowledge and other intangible assets are important for developing the ability to supply sophisticated, hard-to-imitate products and services. The OECD has developed a methodology for monitoring the development of intangible assets and knowledge-based capital (computerised information, R&D, design and organisational capital) across countries. They find that investment in such “knowledge-based capital” has been positively correlated with income per capita; was more resilient to the downturn in output; and has typically been higher than tangible investment in innovation43 in the UK.
39 Pharmaceuticals (25 percent); computer programming and information service activities (11 percent); motor vehicles and parts (10 percent); aerospace (9 percent); telecommunications (5 percent); and machinery and equipment (6 percent). 40 Office for National Statistics (2013), Business Enterprise R&D - 2012 http://www.ons.gov.uk/ons/rel/rdit1/bus-ent-res-and-dev/2012/index.html. 41 Department for Business, Innovation and Skills (2011), UK Life Sciences Strategy. Accessible at: https://www.gov.uk/government/publications/uk-life-sciences-strategy. 42 Organisation of Economic Co-operation and Development (2013), New Sources of Growth: Knowledge-Based Capital. Accessible at: http://www.oecd.org/sti/inno/knowledge-based-capital-synthesis.pdf. 43 Organisation of Economic Co-operation and Development (2013), Supporting Investment in Knowledge Capital, Growth and Innovation. http://www.oecd.org/sti/inno/newsourcesofgrowthknowledge-basedcapital.htm.

UK’s innovation performance
24
Since 2003, the UK has been ranked second in the world in terms of investment in 'intangible assets' (as a share of private sector value added) including economic competencies, creative and intellectual property and computerised information. New analysis by Nesta44 has shown that not only does the UK invest more on intangible assets than tangible assets - £137.5 billion compared with £89.8 billion in 2011 - this gap has been growing. Whilst market sector45 tangible assets investment has grown by £0.2 billion, intangibles have increased by £3 billion. The analysis also finds that there is most investment observed in workforce training, organisational change and software.
Figure 3.3 shows that in 201246, the proportion of UK workers contributing to knowledge-based capital activities accounted for approximately 27 per cent of the employed workforce, ranking the UK second after the USA (among OECD countries), with particular strengths in organisational capital and computerised information.
Figure 3.3: Knowledge-based capital related workers as a percentage of total employed persons, 2012
0
5
10
15
20
25
30
Finl
and
Germ
any
Fran
ce UK US
Know
ledg
e-ba
sed
capi
tal r
elat
ed w
orke
rs, 2
012
As a
per
cent
age
of to
tal e
mpl
oyed
per
sons
Organisational Capital Computerised Information DesignResearch & Development Overlapping assets
Source: OECD STI Scoreboard (2013)
44 Goodridge, P, Haskel, J, Wallis, G., (2014), UK investment in intangible assets: Report for NESTA, Imperial College Business School, Discussion paper 2014/1. 45 The market sector is defined as sections A-K, M, N, R, S & T according to the 2007 Standard Industrial Classification. It excludes Real Estate Activities (L), Public Administration & Defence (O), Education (P) and Health and Social Work (Q). 46 Organisation of Economic Co-operation and Development (2013), Science, Technology and Industry Scoreboard 2013 http://www.oecd-ilibrary.org/science-and-technology/oecd-science-technology-and-industry-scoreboard-2013_sti_scoreboard-2013-en.
Innovation Report 2014
25
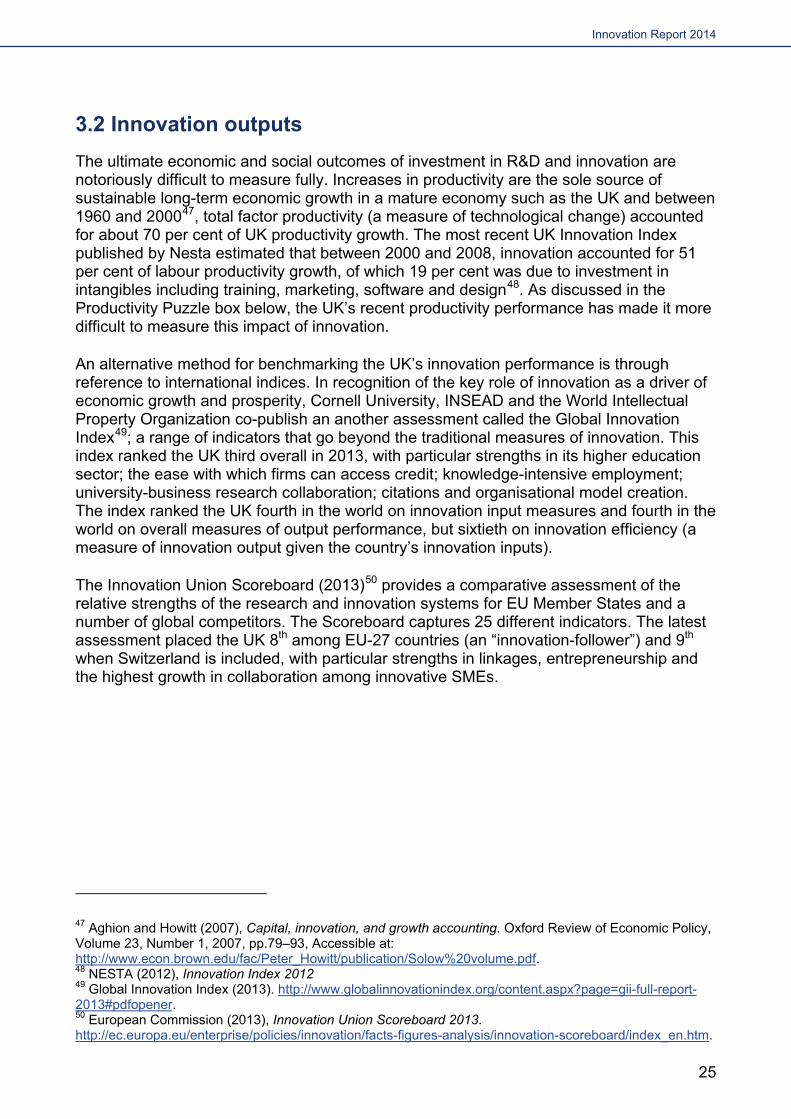
3.2 Innovation outputs The ultimate economic and social outcomes of investment in R&D and innovation are notoriously difficult to measure fully. Increases in productivity are the sole source of sustainable long-term economic growth in a mature economy such as the UK and between 1960 and 200047, total factor productivity (a measure of technological change) accounted for about 70 per cent of UK productivity growth. The most recent UK Innovation Index published by Nesta estimated that between 2000 and 2008, innovation accounted for 51 per cent of labour productivity growth, of which 19 per cent was due to investment in intangibles including training, marketing, software and design48. As discussed in the Productivity Puzzle box below, the UK’s recent productivity performance has made it more difficult to measure this impact of innovation.
An alternative method for benchmarking the UK’s innovation performance is through reference to international indices. In recognition of the key role of innovation as a driver of economic growth and prosperity, Cornell University, INSEAD and the World Intellectual Property Organization co-publish an another assessment called the Global Innovation Index49; a range of indicators that go beyond the traditional measures of innovation. This index ranked the UK third overall in 2013, with particular strengths in its higher education sector; the ease with which firms can access credit; knowledge-intensive employment; university-business research collaboration; citations and organisational model creation. The index ranked the UK fourth in the world on innovation input measures and fourth in the world on overall measures of output performance, but sixtieth on innovation efficiency (a measure of innovation output given the country’s innovation inputs).
The Innovation Union Scoreboard (2013)50 provides a comparative assessment of the relative strengths of the research and innovation systems for EU Member States and a number of global competitors. The Scoreboard captures 25 different indicators. The latest assessment placed the UK 8th among EU-27 countries (an “innovation-follower”) and 9th when Switzerland is included, with particular strengths in linkages, entrepreneurship and the highest growth in collaboration among innovative SMEs.
47 Aghion and Howitt (2007), Capital, innovation, and growth accounting. Oxford Review of Economic Policy, Volume 23, Number 1, 2007, pp.79–93, Accessible at: http://www.econ.brown.edu/fac/Peter_Howitt/publication/Solow%20volume.pdf. 48 NESTA (2012), Innovation Index 2012 49 Global Innovation Index (2013). http://www.globalinnovationindex.org/content.aspx?page=gii-full-report-2013#pdfopener. 50 European Commission (2013), Innovation Union Scoreboard 2013. http://ec.europa.eu/enterprise/policies/innovation/facts-figures-analysis/innovation-scoreboard/index_en.htm.

UK’s innovation performance
26
The productivity puzzle The UK economy has displayed some resilience in the recent economic crisis, with employment performing better than previous recessions and in comparison with other countries; and recent economic growth figures from the Office for Budget Responsibility, which estimate annual economic growth to exceed 2 per cent until 2018, provide a foundation for optimism.
However, UK productivity has performed poorly compared to other countries. ONS analysis51 finds that output per hour worked in the UK was 21 percentage points below the average for the rest of the major G7 industrialised economies in 2012. Understanding the root causes remains a challenge for academics and policy-makers alike. Some hypotheses posed at the start of the recession, such as mis-measurement of true output; firms hoarding labour; and the UK’s over-reliance on certain sectors, have become increasingly untenable as major explanations as time has progressed.
In addition, emerging evidence suggests a range of other hypotheses, including an impaired financial system or a substantial impact of firms substituting capital with labour, could at best only explain a proportion of the observed productivity declines.
A number of hypotheses remain: the need for a ‘new industrial revolution’ to spur future growth, historically low UK business investment and low recognition of and investment in broader ‘intangible’ assets. Indeed the Bank of England has highlighted the importance of these intangible investments to ensure the UK economic recovery is sustained.
Further work is need to examine these theories adapt as the debate changes. However, the potential explanations point to a need for the UK to continue to focus on creating the right framework conditions and supporting the right investments in the next stage of economic recovery and rebalancing.
In the Global Competitiveness Index52, the World Economic Forum (WEF) defines competitiveness as the set of institutions, policies, and factors that determine the level of productivity of a country. According to the WEF Competitiveness Index, the UK is among 37 economies considered to be innovation-driven. This index ranks the UK 10th out of a total of 148 countries (down from 8th in 2012-13). We perform particularly well on university-industry collaboration, the quality of scientific research institutions and marketing. However, in contrast to the Innovation Union Scoreboard, the WEF analysis finds that access to finance is among the most problematic factors for doing business in the UK.
In an international benchmarking of the UK science and innovation system, a report commissioned by the Department for Business, Innovation and Skills considered the full range of metrics across these various scoreboards and indices and recommended a subset which could be clearly attributed to science and innovation and where a clear link to
51 Office for National Statistics (2014), International Comparisons of Productivity - Final Estimates, 2012 Accessible at: http://www.ons.gov.uk/ons/dcp171778_353315.pdf. 52 World Economic Forum (2013), Global Competitiveness Report, 2013-14. http://www3.weforum.org/docs/WEF_GlobalCompetitivenessReport_2013-14.pdf.

Innovation Report 2014
27
economic and societal outcomes exists53. Overall, the report highlighted that the UK’s performance on output measures is mixed when compared to other innovative countries. The mixed performance includes areas of significant strength, such as knowledge-intensive services and the export of technology, and important areas to strengthen, including the large proportion of firms that are not engaging in innovation, and therefore remaining a source of untapped potential. The report identified talent as a key area for improvement, an issue discussed further in the following chapter.
53 Department for Business, Innovation and Skills (2014), Insights from international benchmarking of the UK science and innovation system. BIS Analysis Paper Number 03. Accessible at: https://www.gov.uk/government/uploads/system/uploads/attachment_data/file/277090/bis-14-544-insights-from-international-benchmarking-of-the-UK-science-and-innovation-system-bis-analysis-paper-03.pdf.


Innovation Report 2014
29
4. Skills and knowledge generation in the UK
Talent is at the heart of economic growth. Skilled people in our science and research institutions generate the new knowledge that drives innovation, while in our businesses they provide the capacity to harness these new ideas for commercial ends.
The UK has a world class research base that contributes far beyond its inputs. We have universities that are a key source of knowledge generation and provide the UK with a highly skilled workforce.
We have taken measures to provide greater support for skills and research with a focus on STEM subjects, open access, efficiency, university-business collaboration, research excellence.
4.1 Human capital and skills The research base is a vital part of the innovation system and in the UK is comprised of interlinking universities, public sector research establishments, research funders and research & technology organisations. These organisations have a dual remit of creating new knowledge and building skills in the economy54. The UK science system produces high-quality research in excess of the scale of its inputs.
Central to the ability of businesses to innovate is their capacity to recognise the value of new information and apply it to commercial ends. This is driven by people: their connections to and technical understanding of the research base, and their talent for spotting commercial opportunities and developing products accordingly.
Researchers Researchers produce new knowledge across the research base and business. The number of researchers in the UK remained steady around 250 000 between 2007 and 2011, just under 4 per cent of the global total55. Higher Education accounts for the majority of researchers (60 per cent) with business making up a further 35 per cent.
High-level and technical skills Science, technology, engineering and mathematics (STEM) skills at all levels are vital to the technical capabilities of research institutions and businesses. The Perkins Review, published in November 2013, specifically highlighted the important role played by engineering graduates in the wider UK economy. Highly innovative firms, even those not concentrated in scientific sectors, employ more STEM graduates and this is associated
54 Evidence suggests that Big Science facilities in particular (e.g. particle accelerators) are associated with high levels of skill development due to their multi-disciplinary, mission-led nature: BIS (2014), Innovation from Big Science: Enhancing Big-Science Impact Agenda. 55 OECD MSTI (2013/2). Researcher employment measured in full-time equivalent.
Skills and knowledge generation in the UK
30
with greater external cooperation, use of external information, R&D spending, and higher numbers of new-to-market products56.
In 2013 the Government announced that £185 million will be provided to the Higher Education Funding Council for England (HEFCE) over four years to support the additional expense of teaching high cost subjects such as science and engineering. In addition, £200 million of capital investment will be made in 2015-16 to fund such high-cost subjects. This capital funding will be matched by equal investment from institutions, meaning some £400 million will be invested in the creation and upgrading of teaching facilities to ensure students receive a high quality experience that fully equips them for the economy of the future.
The UK is the fourth largest producer of doctoral graduates globally and produces more science and engineering doctorates relative to population size than all comparator countries except China, which produces large volumes of engineering doctoral graduates.
Figure 4.1: Science and engineering doctorates per 100 000 population, 2011
0 5 10 15 20 25
Brazil
Japan
US
Canada*
South Korea
Australia*
Germany
Finland
UK
China
Doctorates per 100 000 population
Science Engineering
Source: OECD STI Scoreboard (2013); OECD population and education data. Data not available for France. ‘Engineering’ defined as engineering, manufacturing, and construction. *2010 value.
Wider skills While research and STEM skills are relevant to all sectors, there are wider skills which are critical to key sectors such as creative industries and professional business services in
56 BIS (2014), UK Innovation Survey: Highly Innovative Firms and Growth.

Innovation Report 2014
31
particular. The capacity of businesses to absorb and apply new knowledge relies on a well-educated, flexible and creative workforce equipped with the skills needed to turn knowledge into commercial outcomes as well as management and entrepreneurial capability. New research finds that the employment of skills such as product and multimedia design, graphic arts, and software development is linked to innovation performance57.
The UK performs well in certain areas. Within the OECD, the UK is second only to the USA in terms of the share of the workforce engaged in activities relating to R&D, design, software and database activities, and building organisational knowledge58. The UK is also the second most preferred destination for international students after the USA, and its share of the international student market grew from 10.8 per cent to 13 per cent between 2000 and 201159.
On a less positive note, management and basic skills have been identified as a cause for concern60. A recent survey of UK employers found that the number of reported skills-shortage vacancies rose from 16 to 22 per cent between 2011 and 2013. Crucially, 44 per cent of businesses reporting difficulties filling vacancies due to skills shortages said this delayed the development of new products or services61.
Research Councils UK have been stimulating the supply of highly skilled people in key sectors through the development of Doctoral Training Centres to provide training for students within focused research areas, focused on academic or industrially-relevant research topics, or a combination of both.
4.2 Knowledge generation and research outputs Knowledge generation is a key strength of the UK innovation system. Our knowledge infrastructure consists of our universities, and a diverse collection of research and development institutes, both public and private, including Research Council Institutes and Public Sector Research Establishments (PSREs). These organisations create knowledge, solve problems, and train skilled people.
Universities The UK has over 150 universities carrying out different combinations of teaching and research, including 30 of the top 200 universities in the world62. Universities are not simply sources of scientific discoveries; they contribute to a range of innovation functions by creating and maintaining knowledge via research and teaching, building capabilities in teams and individuals, and developing innovation-relevant technologies and new forms of problem-solving.
57 BIS (2014), Innovation and Skills During the Downturn. 58 OECD (2013) STI Scoreboard. 59 OECD (2013), Education at a Glance 2013, UK country note. 60 BIS (2014), Insights from international benchmarking of the UK science and innovation system. 61 UK Commission’s Employer Skills Survey 2013. 62 Times Higher Education – University Rankings 2013 - http://www.timeshighereducation.co.uk/world-university-rankings/2012-13/world-ranking

Skills and knowledge generation in the UK
32
The Research Excellence Framework (REF) is the revised system for assessing the quality of research in UK Higher Education institutions (HEIs) and includes an assessment of the impact of excellent research for the first time. In 2013 all 155 institutions that intended to participate in the REF successfully made their submissions by the deadline on 29 November, submitting the research of 52,077 staff. The REF expert panels have begun to assess submissions, and the outcomes will be published in December 2014.
To ensure that investment creates maximum return for the economy and wider society, significant progress in embedding efficiency is being made across the Higher Education and research system. Between 2005 and 2011, universities and research institutes delivered over £1.38 billion in efficiency and cost savings. HEIs saved over £480 million in 2011-1263; money that can be reinvested in improving their core teaching and research activities.
BIS and HMT have asked Professor Sir Ian Diamond, Vice-Chancellor of the University of Aberdeen and former Chair of the RCUK Executive Group, to carry out a further review of efficiency in Higher Education Institutions. The review is expected to report early in 2015.
University-business collaboration Universities make a significant impact on our economy. In the UK in 2011-12 universities contributed £3.4 billion to the economy through services to business and others, including commercialisation of new knowledge, delivery of professional training and consultancy; an increase of 4 per cent from 2010-1164. Particularly significant is the 11 per cent increase in
63 Universities UK (UUK). 64 Analysis by HEFCE of the twelfth annual Higher Education – Business and Community Interaction (HE-BCI) survey.
Research councils are a key contributor to high quality knowledge generation Engineering and Physical Sciences Research Council (EPSRC) and Jaguar Land Rover (JLR) announce £10 million virtual engineering research programme
This collaboration between JLR and the country’s leading academics will give manufacturers like JLR access to new, world-class simulation tools and processes, enabling them to deliver more complex new vehicle programmes more quickly and save on product development costs by reducing the reliance on physical prototypes. Funding is £4 million each from JLR and EPSRC, and £2 million from four universities.
Natural Environment Research Council (NERC): supporting environmental management
The NERC National Oceanography Centre’s taxonomic and deep-sea ecology skills used a £5 million BP project to operate deep-water observatory systems off Angola. This provided, for the first time, scientifically robust data to distinguish between natural and man-made change in the deep sea where oil and gas operations are carried out, and will allow regulators to establish the environmental conditions before and after drilling. This also helped BP plan the optimal deployment of vessels during marine surveys.

Innovation Report 2014
33
SME expenditure on knowledge exchange activities with UK Higher Education Institutions, for example through access to specialist knowledge or facilities.
The UK Research Partnership Investment Fund (UKRPIF) was established following the 2012 Budget. Administered by HEFCE, it provides between £10 million and £35 million to universities for large, long-term capital projects that have at least double that amount in private co-investment and build on a strong record of research excellence. So far £300 million has been allocated in the first two rounds of the scheme, leveraging over £825 million in private investment. Government has allocated a further £100 million pa for UKRPIF in 2015/16 and 2016/17.
Creating new knowledge through collaboration This £33 million partnership between the University of Liverpool and Unilever aims to develop a state-of-the-art materials chemistry research hub providing an unparalleled suite of open-access facilities. It will help accelerate research and reduce new product discovery times. The hub is helping to drive economic growth and international competitiveness in a range of sectors including sustainable energy; home and personal care; pharmaceutical; and paint and coatings.
Public Sector Research Establishments The diverse range of public sector research establishments (PSREs) contribute to the national and local innovation systems by: providing problem solving capabilities based on their scientific expertise to support industrial innovation; maintaining and providing access to facilities, expertise and unique datasets and collections; and providing scientific advice to underpin public policy development and implementation. PSREs support the knowledge base at both the scientific research and industry levels.
Individual PSREs are routinely reviewed, for example in response to the Government’s agenda for public bodies reform. Specific guidance has been agreed for use across government which seeks to ensure that any review takes account of each PSRE’s role not only in policy and regulation, but also in its broader contribution to innovation and growth.
Research outputs The UK punches well above its weight in terms of research. We have a large output for our modest size: the UK accounts for only 3.2 per cent of global R&D expenditure and 4.1 per cent of global researchers, but we produce 6.4 per cent of world’s research articles65.
Furthermore, UK research is of very high quality66:
• The UK remains strong with 11.6 per cent of the world’s citations, behind just the USA and China
• The UK’s field-weighted citation impact, a relative measure of citations per publication, is first among G8 countries and grew between 2010 and 2012
65 BIS (2013), International Comparative Performance of the UK Research Base – 2013. 66 Ibid.
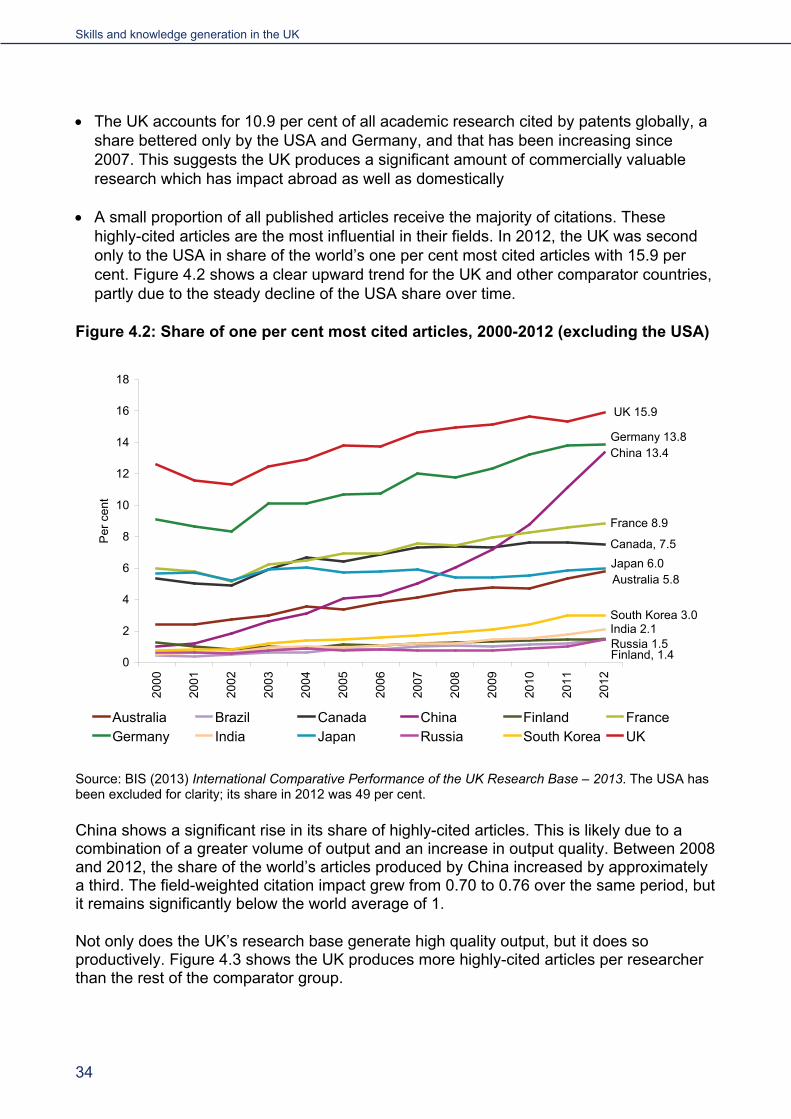
Skills and knowledge generation in the UK
34
• The UK accounts for 10.9 per cent of all academic research cited by patents globally, a share bettered only by the USA and Germany, and that has been increasing since 2007. This suggests the UK produces a significant amount of commercially valuable research which has impact abroad as well as domestically
• A small proportion of all published articles receive the majority of citations. These highly-cited articles are the most influential in their fields. In 2012, the UK was second only to the USA in share of the world’s one per cent most cited articles with 15.9 per cent. Figure 4.2 shows a clear upward trend for the UK and other comparator countries, partly due to the steady decline of the USA share over time.
Figure 4.2: Share of one per cent most cited articles, 2000-2012 (excluding the USA)
Australia 5.8
Canada, 7.5
China 13.4
Finland, 1.4
France 8.9
Germany 13.8
India 2.1
Japan 6.0
Russia 1.5
South Korea 3.0
UK 15.9
0
2
4
6
8
10
12
14
16
18
2000
2001
2002
2003
2004
2005
2006
2007
2008
2009
2010
2011
2012
Per
cen
t
Australia Brazil Canada China Finland FranceGermany India Japan Russia South Korea UK
Source: BIS (2013) International Comparative Performance of the UK Research Base – 2013. The USA has been excluded for clarity; its share in 2012 was 49 per cent.
China shows a significant rise in its share of highly-cited articles. This is likely due to a combination of a greater volume of output and an increase in output quality. Between 2008 and 2012, the share of the world’s articles produced by China increased by approximately a third. The field-weighted citation impact grew from 0.70 to 0.76 over the same period, but it remains significantly below the world average of 1.
Not only does the UK’s research base generate high quality output, but it does so productively. Figure 4.3 shows the UK produces more highly-cited articles per researcher than the rest of the comparator group.

Innovation Report 2014
35
Figure 4.3: Number of articles in one per cent most cited per hundred researchers, 2000-2012
Canada 1.1
China 0.2
Finland 0.8France 0.8
Germany 0.9
Japan 0.2
Russia 0.1
South Korea 0.2
UK 1.5
USA 0.9
0
0.2
0.4
0.6
0.8
1
1.2
1.4
1.6
2000
2001
2002
2003
2004
2005
2006
2007
2008
2009
2010
2011
2012
Artic
les
per h
undr
ed re
sear
cher
s FT
E
Australia Canada China Finland France GermanyJapan Russia South Korea UK USA
Source: BIS calculations based on BIS (2013) International Comparative Performance of the UK Research Base – 2013, and OECD MSTI (2013/2). Researcher employment is measured in full-time equivalent.
Government is committed to ensuring that this and other publicly funded and published research should be accessible free of charge to the user through Open Access policy. This will encourage collaboration and enable SMEs in particular to access more of this high quality research. Research Councils UK’s implementation policy has been operational since April 2013, and includes block grants to HEIs to enable systemic payment of Article Processing Charges. Block funding is being made available to ‘Publication Funds’ in over 100 HEIs totalling £17 million in 2013/14 and £20 million in 2014/15. On 4 December RCUK launched the Gateway to Research, a portal created to allow easier public access to research outputs.


Innovation Report 2014
37
5. Innovation in business Government action aims to overcome barriers to innovation and unlock the UK’s full potential.
Recent developments in innovation support include: supporting innovation in complex systems; supporting innovative SMEs with high-growth potential; backing the commercialisation of emerging technologies; and unlocking and incentivising investment in innovation.
5.1 The need for government action While innovation plays a key role for the economy as a driver of growth and productivity67, it is also central to the success of individual businesses. Innovative businesses grow twice as fast as non-innovators68 and they are also less likely to fail69. We saw in Chapter 2 and Chapter 4 that we have a strong innovation infrastructure supporting businesses in the UK. But barriers to innovation remain which government needs to address to unlock the UK’s full potential.
Innovative activity has spillover effects. For example, research suggests that the R&D activities of high-growth firms influence how innovative their high-growth neighbours are70. The fact that not all benefits accrue to the innovating firm can lead to investment below socially optimum levels. Government acts to encourage more activity, using competitive grant funding and fiscal measures like R&D tax credits.
There are significant barriers to innovation. Of businesses that don’t innovate, thirty percent report factors constraining innovation as a reason for not innovating71. Innovative firms also report several important obstacles to their innovation activity. Figure 4.1 ranks barriers to innovation perceived as ‘high’ by innovative businesses of different sizes, with core barriers being the availability and cost of financing, excessive risk of innovating, and the direct costs of innovating. Barriers are perceived more acutely by smaller businesses.
Government plays an important role in tackling these barriers and unlocking innovative potential. Additionally, recent research suggests that government support for innovation reduces the probability of failure for innovative businesses, and that this impact is separate to the way in which being innovative improves a business’s survival chances72; that is, survival chances are improved both by being innovative and by receiving government support. This may introduce an important new dimension to policy, where government support impacts business survival through a mechanism separate from, and in addition to, innovative activity.
67 See Chapter 1. 68 Mason, Bishop & Robinson (2009), Business Growth and Innovation, NESTA. 69 Roper & Xia (2014), Innovation, Innovation Strategy and Survival, Enterprise Research Centre 70 Sena, Hart, & Bonner (2013), Innovation and UK High-Growth Firms, NESTA Working Paper 13/12. 71 BIS (2012), UK Innovation Survey 2011 – First Findings. 72 Roper & Xia (2014), Innovation, Innovation Strategy and Survival, Enterprise Research Centre
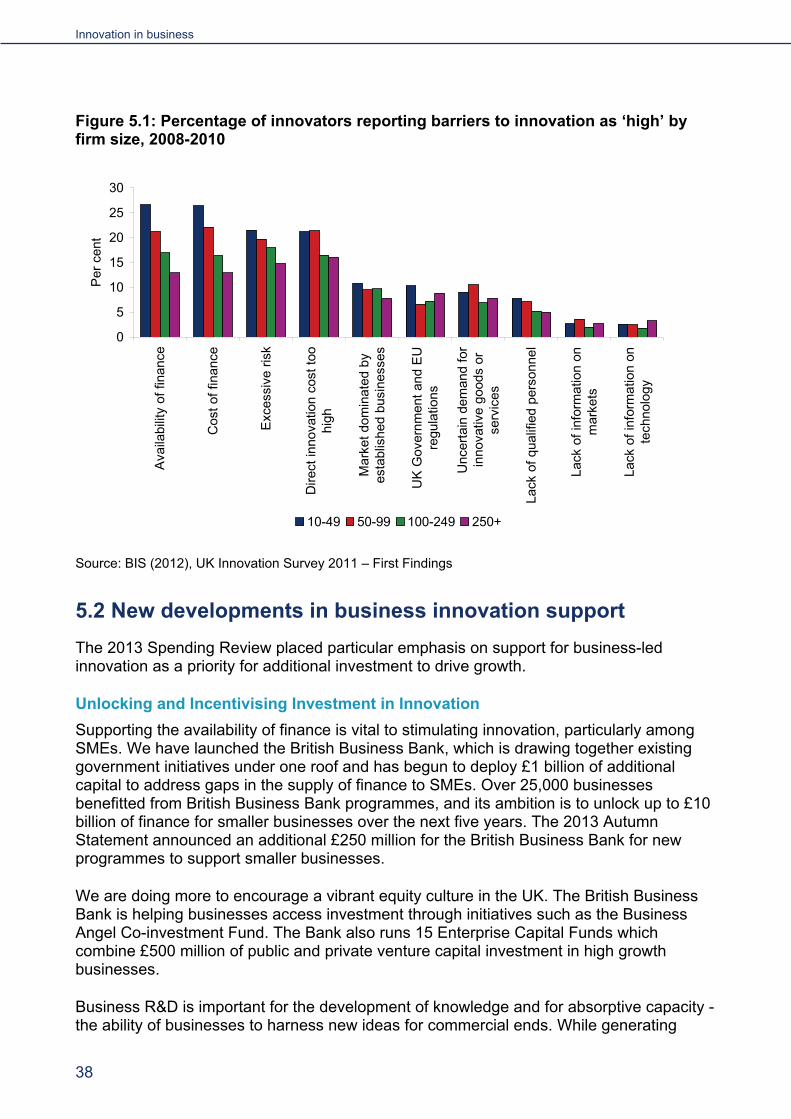
Innovation in business
38
Figure 5.1: Percentage of innovators reporting barriers to innovation as ‘high’ by firm size, 2008-2010
0
5
10
15
20
25
30
Ava
ilabi
lity
of fi
nanc
e
Cos
t of f
inan
ce
Exc
essi
ve ri
sk
Dire
ct in
nova
tion
cost
too
high
Mar
ket d
omin
ated
by
esta
blis
hed
busi
ness
es
UK
Gov
ernm
ent a
nd E
Ure
gula
tions
Unc
erta
in d
eman
d fo
rin
nova
tive
good
s or
serv
ices
Lack
of q
ualif
ied
pers
onne
l
Lack
of i
nfor
mat
ion
onm
arke
ts
Lack
of i
nfor
mat
ion
onte
chno
logy
Per
cen
t
10-49 50-99 100-249 250+
Source: BIS (2012), UK Innovation Survey 2011 – First Findings
5.2 New developments in business innovation support The 2013 Spending Review placed particular emphasis on support for business-led innovation as a priority for additional investment to drive growth.
Unlocking and Incentivising Investment in Innovation Supporting the availability of finance is vital to stimulating innovation, particularly among SMEs. We have launched the British Business Bank, which is drawing together existing government initiatives under one roof and has begun to deploy £1 billion of additional capital to address gaps in the supply of finance to SMEs. Over 25,000 businesses benefitted from British Business Bank programmes, and its ambition is to unlock up to £10 billion of finance for smaller businesses over the next five years. The 2013 Autumn Statement announced an additional £250 million for the British Business Bank for new programmes to support smaller businesses.
We are doing more to encourage a vibrant equity culture in the UK. The British Business Bank is helping businesses access investment through initiatives such as the Business Angel Co-investment Fund. The Bank also runs 15 Enterprise Capital Funds which combine £500 million of public and private venture capital investment in high growth businesses.
Business R&D is important for the development of knowledge and for absorptive capacity - the ability of businesses to harness new ideas for commercial ends. While generating

Innovation Report 2014
39
knowledge of their own, employees engaged in R&D are likely to be more aware of technological developments elsewhere and their commercial potential.
The R&D Tax Credits incentivise companies in all sectors to undertake more R&D. In 2011/12, there were 12,500 claims made. This was an increase of 16 per cent on the previous year and totalled £1.2 billion of support73. Analyses of UK R&D tax credit claims produce a wide range of cost-benefit estimates but indicate that up to £3 of R&D expenditure might be stimulated for every £1 of tax foregone74.
The uptake of R&D tax credits remained strong during the downturn, with the growth in SME claims performing particularly well as the rate of relief under the SME scheme is amongst the most generous in the world. Between the years 2008/09 and 2011/12, the number and value of SME claims grew by 14 per cent and 16 per cent per year. This outpaced claims by large firms which grew by 5 per cent and 2 per cent respectively75. From April 2013 an expenditure credit (RDEC) scheme was introduced to run alongside the existing Large Company R&D tax credit for three years.
Recognising the growing importance of intellectual property for innovation, tax relief was introduced on Patent income from 1 April 2013. The full benefit of the regime will be phased in, with the proportion of income qualifying for relief increasing from 60 per cent in 2013/14 to 100 per cent from 2017.
Supporting innovation in complex systems Many innovative businesses operate in areas involving complex systems and supply chains, multiple players, and where disruptive change is creating a global opportunity that can only be realised through innovation. Co-ordinated support in these areas is needed.
The TSB has convened Innovation Platforms to bring industry, academia and government together to focus on a specific challenge. In consultation and collaboration across the range of actors, the challenges are identified and a programme of activity is defined. The long term commitment to the programme and a range of publically funded interventions give industry the incentive and confidence to invest. Bringing together policy makers and the key stakeholders responsible for delivery gives business unique insights into the direction the Government and markets are moving in. Innovation Platforms have been established in the following areas:
• Low carbon vehicles
• Assisted living
• Low impact buildings
• Detection and identification of infectious agents
• Stratified medicine
73 HMRC R&D Tax Credits Statistics. 74 HMRC Research Report 107 – An evaluation of research and development tax credits. 75 Compound Annual Growth Rate.
Innovation in business
40
• Sustainable agriculture and food.
Each platform uses a range of support initiatives available from the TSB and other relevant funders or interested bodies. Platforms will be linked to and aligned with appropriate sector strategies, for example the Low Carbon Vehicles Innovation Platform76, which was established in 2007 has been directly aligned with the Automotive Council’s technology roadmap which is at the core of the current Automotive Industrial Strategy. Funding provided through the innovation platform helps companies de-risk the innovation process and reduces the direct cost of innovation.
In order to address infrastructure requirements, we have now established a network of Catapult Centres which provide access to the specialist capability and expertise required to transform innovative ideas and technologies rapidly into commercial products and processes. The first seven Catapults are now open in technology areas where the UK has key capability. These are High Value Manufacturing, Cell Therapy, Offshore Renewable Energy, Satellite Applications, Connected Digital Economy, Future Cities and Transport System. A further two Catapults in Energy Systems and Precision Medicine are under development and due to open in 2015. The equipment and expertise provided by Catapults help companies new to the technology area by providing access otherwise restricted to incumbent businesses. In emerging technology areas like Cell Therapies, Catapults also provide companies with support to address regulatory barriers.
The “intermediate sector” comprises organisations who are focused on working closely with business in the areas of translational research and commercialisation of new knowledge and technologies. TSB’s network of Catapult Centres and (predominately private sector) intermediate Research and Technology Organisations (RTOs) provide significant elements of the UK’s intermediate capabilities.
A range of players in the public and private sectors including Catapults, RTOs, PSREs, universities, science parks and innovation campuses play an important role in supporting the development of new technologies and the businesses associated with them. These “intermediate sector” roles can be critical because they provide:
• Access to networks, advice and support, which are significant in the development of new technologies and new products and services
• Technical advice and problem solving capabilities in the development of new technologies and new products and services
• Incubator and grow-on space to support innovative new businesses in their early stages of development, where tenants can access expertise, networks and support.
76 https://www.innovateuk.org/transport#platform

Innovation Report 2014
41
Early impact of Catapult Centres HVM Catapult Secures Rolls Royce Manufacturing in UK Rolls Royce’s new fan and turbine disc facility in Washington Tyne & Wear has recently commenced production. This facility uses manufacturing techniques developed at the Advanced Manufacturing Research Centre (AMRC) in Rotherham, part of the High Value Manufacturing Catapult. The AMRC is part of a network of research centres which aim to work with businesses to apply university research to accelerate the commercialisation of new and emerging manufacturing technologies. The facility has the capacity to manufacture over 2,000 fan and turbine discs a year. They provide the power for a wide range of aircraft including the Airbus A380 and the Eurofighter Typhoon.
Graphene Manufacturer Floats Following Catapult Support In November 2013 Applied Graphene Materials (AGM) floated on the Alternative Investment Market. AGM have developed a proprietary manufacturing process for graphene platelets. The Centre for Process Innovation (CPI), part of the High Value Manufacturing Catapult, helped AGM to scale their manufacturing process up to 1 tonne per year prior to flotation.
Low Carbon Urban Transport Zone (LUTZ) - autonomous vehicles LUTZ is a large programme combining elements that demonstrate at scale, the potential of autonomous vehicles, cloud-enabled mobility and transport on-demand services. It is supported by the Transport Systems Catapult along with members of the Automotive Council, BIS, Milton Keynes Council and industrial partners. LUTZ addresses the key challenge of how to increase mobility by exploring the potential for effective and cost-efficient movement of people in a city.
Integrated Transport and Weather Information Pilot (ITWIP) The ITWIP is a collaboration between the Transport Systems Catapult, Connected Digital Economy Catapult and Sunderland Software City. This pilot project will combine real-time weather and environmental hazard information with the development of new services and applications. We will be bringing together buyers from transport logistic companies, infrastructure companies and public sector bodies to explore the challenges facing transport and logistical decision-makers that could be solved through the development of weather and transport data solutions.
High Value Manufacturing Elite Training Centre In a pilot for how the capability of the Catapults links in to the provision of technical and high level skills, the Government is investing £18 million in an elite training centre at the Manufacturing Technology Centre. Apprentices will learn the latest technology in areas such as intelligent automation, additive layer manufacturing, laser machining and welding. They will be able to test and develop their skills in sponsored placements, including the opportunity to undertake international assignments.
On completion of the programme the apprentices will be registered as incorporated engineers and will have the opportunity to complete an engineering degree. The centre will support engineering graduates to achieve chartered engineer status and industrial design graduates to develop their entrepreneurial skills, enabling them to market test their ideas and launch their own products and enterprises.
Technologies is one of the Industrial Strategy’s four cross-cutting strands (along with procurement, access to finance and skills), identified as priorities for business growth for businesses across the economy. Innovation also permeates the Strategy’s consideration of the needs particular to individual sectors. All sectors and industries innovate, but they do so in different ways. Industry, in partnership with government, has identified that different industrial sectors benefit from varying degrees of government collaboration and support.

Innovation in business
42
Some, typically Advanced Manufacturing sectors (such as Automotive, Nuclear and Life Sciences), need long term partnerships to ensure the constant flow of new knowledge, technologies, skilled engineers and scientists that are necessary for their continued growth.
The Automotive Industrial Strategy committed government and business to a joint £1 billion investment over 10 years in the Advanced Propulsion Centre (APC). The APC will be a facility that encourages communication, collaboration & investment in the technologies of the future. It will offer companies the opportunity to develop their R&D through a clear route to market and manufacture in the UK. The first competition for £75 million of R&D support opened in December 2013.
While others require less long-term collaboration, all industrial strategy sectors have focused on how to best facilitate development of the innovations they need in order to achieve their growth potential. For example, several have Catapults: a key component at the centre of the Life Sciences Strategy is the Cell Therapy Catapult; the Offshore Renewable Energy Catapult is closely aligned to the Offshore Wind Strategy and the Future Cities; and Connected Digital Economy Catapults are key pieces of infrastructure for the Information Economy Strategy.
A new type of programme, Catalyst, designed to jointly harness investment from research councils and the TSB originated with the Life Sciences strategy and is now being applied in other sectors. Catalysts de-risk the innovation process and also help provide access to finance through both direct financial support and an endorsement of the project.
Catalysts Biomedical Catalyst The Biomedical Catalyst was announced in the UK Strategy for Life Sciences in December 2011, with an initial budget of £180 million over three years to be jointly delivered by the TSB and the Medical Research Council. It supports innovative ideas from any sector or discipline, which demonstrate the potential to provide significant positive health and economic impact.
Across the first three rounds the Biomedical Catalyst has awarded more than £120 million of grant funding to 150 projects, which has been matched with around £80 million of private finance. This does not include additional private investment which some of the companies have leveraged in part due to their receipt of a Biomedical Catalyst Grant.
Agri-Tech Catalyst Building on the popularity of the Biomedical Catalyst, a similar mechanism was developed as part of the Agri-Tech Strategy. The Agri-Tech Catalyst will also support innovative ideas which can help make the UK a world leader in agricultural technology, innovation and sustainability. The first round of the Agri-Tech Catalyst closed in December 2013 with a strong level of demand, and grants will be awarded by May 2014. The second round is now open.
Inducing innovation with prizes Innovation inducement or challenge prizes are a long-established means of solving problems. They offer a reward for a developed solution to a specific problem or issue and can play a strategic role in the innovation system, stimulating innovation and providing incentives to innovate where the market might struggle.

Innovation Report 2014
43
BIS has invested £850,000 over three years in the Centre for Challenge Prizes, run by Nesta, which has positioned itself as the leading UK centre for expertise in the development of inducement prizes. This year we have awarded our first prize, which asked for innovations to increase the uptake of cycling in the UK. The ‘Hands Off My Bike Challenge’, funded by BIS, called on innovators to come up with breakthrough ideas to make it more difficult to steal bikes. 130 entries were received and, following a period of live testing, two innovations were awarded and shared a total cash prize of £50,000. We are now also sponsoring the Dynamic Demand Challenge to find innovations that improve the ability of households to shift energy usage to off peak times or towards renewable energy generation. Five finalists have been selected.
The Centre launched the new Open Data Challenge Series - a series of seven challenge prizes intended to generate innovative open data solutions to social challenges. The first prize of £40k in the Crime and Justice series was won by Check That Bike, using open data from police forces in an application designed to disrupt the market in stolen bikes.
BIS is working with Nesta to develop a Longitude Prize for 2014 to mark the 300th anniversary of the first Longitude Prize. This will be targeted at some of today's biggest problems and the challenge will be decided by a public vote. The Technology Strategy Board has pledged the first million pounds towards the challenge prize fund.
Backing the commercialisation of emerging technologies An emerging technology is a recent development from the science base, which has so many new and exciting properties and possible applications that it creates a totally new value proposition, and consequently has the potential to disrupt existing markets.
At Autumn Statement 2012, the Chancellor of the Exchequer announced the investment of an additional £600 million in Eight Great Technologies, identified by David Willetts, in the development of which the UK could lead the world. Each of these technologies has an extraordinary breadth of application and potential to transform industries and sectors.
This investment is helping to accelerate the commercialisation of the Eight Great Technologies through providing new R&D facilities to enable leading edge research. For example, support includes £35 million for centres of excellence in robotics and autonomous systems to be created in and around universities, innovation centres, science parks and enterprise sites to bring together the research base and industry. £45 million is being invested in new facilities and equipment for advanced materials research in areas of UK strength such as advanced composites, high-performance alloys, low-energy electronics and telecommunications, which will benefit a wide range of our manufacturing sectors. We are strengthening the links between these technologies and industry by working with technology leadership groups to address factors including regulatory issues, further public and private investment, and skills needs.
In October 2013, BBSRC announced that £10 million would be invested in a Synthetic Biology fund within the Rainbow Seed Fund to support very early stage companies developing tools for synthetic biology through investment, strategic support and leveraging private capital. The Rainbow Seed Fund, an evergreen technology fund managed by Midven Ltd, was established in 2002 to address the challenge of supporting and accelerating the economic impact of research from PSREs.

Innovation in business
44
Eight Great Technologies The big data revolution and energy-efficient computing: the data deluge will transform scientific enquiry and many industries. The UK can be in the vanguard of the big data revolution and energy-efficient computing. £7.8 million is being invested in the JASMIN National Data Computing Facility to support a wide range of activities, including the Climate and Environmental Monitoring from Space facility and a Cloud based environmental science infrastructure.
Satellites and commercial applications of space: satellites do not just transmit data but collect data by earth observation. We have opportunities to be a world leader in satellites and especially in analysing the data from them. Researchers at NERC’s National Oceanography Centre (NOC) are working with the ESA’s CryoSat satellite to measure storm surges. Even a small improvement to a storm surge model can have a significant impact in terms of the accuracy of warnings and the potential to protect lives and property. The storm surges from the recent North Sea storms were tracked using the CryoSat satellite.
Robotics and autonomous systems: We can already see that this is a general purpose technology with applications ranging from assisted living for disabled people through to nuclear decommissioning.
Life sciences, genomics and synthetic biology: modern genetics has emerged in parallel with the IT revolution and there is a direct link: genetic data comes in digital form. The future is the convergence of “dry” IT and “wet” biological sciences. One of the most ambitious examples of this is synthetic biology: engineering genes to heal, feed, and fuel us. BBSRC have funded a project between the John Innes Centre and antibiotic discovery firm Demuris using synthetic biology to enhance the effectiveness of a novel antibiotic to combat hospital-acquired infections.
Regenerative medicine: will open up new medical techniques for repairing and replacing damaged human tissue. Japanese firm Tokyo Electron Ltd (TEL) has recently relocated its stem cell manufacturing operation to the UK (at the Stevenage Biosicence Catalyst) as a result of the UK's strategic approach and connectivity in the regenerative medicine.
Agri-science: Although genetics is above all associated with human health, advances in agricultural technologies can put the UK at the forefront of the next green revolution. A ‘Cool Farm Tool’ has been developed (by a NERC funded Knowledge Exchange Fellow in conjunction with industry), which gives farmers a simple way to understand their carbon footprint. It gives farmers a simple way to access the latest science so they can understand the greenhouse gases their farms release, and how to reduce them most effectively.
Advanced materials and nano-technology: We can increasingly design new advanced materials from first principles. This will enable technological advances in sectors from aerospace to construction. Quantum photonics is an exciting area where advanced materials and digital IT converge.
Energy and its storage: One of the most important applications of advanced materials is in energy storage. This and other technologies will enable the UK to gain from the global transition to new energy sources.
Innovation Report 2014
45
To explore further how better to fund the commercialisation of emerging technologies through private funds, BIS Ministers recently hosted two round tables bringing together leading figures from the Venture Capital industry, the British Business Bank and the Technology Strategy Board. The round tables focussed on the agri-tech and health sectors. This helped the Department to assess the appetite of industry for technology specific funds and the Department is currently considering how to follow up these roundtables most effectively.
Supporting innovative SMEs with high growth potential SMEs are important for innovation and growth. Not only are many SMEs innovation active, but evidence suggests they can contribute to UK growth more broadly by acting as a ‘seedbed’ for new innovations, increasing competition and replacing unproductive firms77.
However, innovative SMEs face significant barriers to innovation. Research suggests that innovative SMEs find it harder to access finance than other firms78, 79 - consistent with the perceived barriers in Figure 5.1 - while the smaller the firm, the less likely it is to engage external actors and information sources80. Innovative SMEs need support financing innovative activity as well as exploiting opportunities for knowledge exchange.
In December 2013 the Government published Small business: GREAT AMBITION setting out how the Government is making it easier for small businesses to scale up. A key part of this is making it easier for small businesses to develop new ideas and products, and the innovation support provided by the TSB is at the core of this.
The SME support programmes are currently heavily oversubscribed and the existing funding for Smart, the TSB’s programme which tackles the funding gap often experienced by many small and early-stage companies with innovative ideas and high growth potential, supports only 20 per cent of applicants, whereas quality thresholds suggest that at least a further 30 per cent of worthy applicants are being turned away. This is why the expansion of these programmes is a priority identified by TSB for its additional resources in 2015/16. Previous evaluation of Smart and its predecessor (Grant for R&D) indicate that the programme significantly enhances the economic growth potential of these companies and delivers £9 additional gross value added for every £1 invested81. It is likely that future returns will be at a similar level.
Businesses, especially early stage companies, often struggle to fund the feasibility and prototyping stages of the development of new technologies and government departments can find it difficult to engage with these companies. The Small Business Research Initiative (SBRI) programme, enables small businesses to compete for government contracts to develop new products and services which can help tackle public sector challenges. Government benefits from new thinking and with ownership of the intellectual
77 Mole (2002), ‘Augmenting Productivity Growth in SMEs’. 78 Lee, N., Sameen, H. & Martin, L. (2013), Credit and the crisis: Access to finance for innovation small firms since the recession, Big Innovation Centre. 79 Lee, N. (2011), Free to Grow?, NESTA Working Paper 11/01, Table 3. Among actual and potential high-growth firms, the smaller the firm’s initial employment size, the more likely it is to report access to finance or liquidity constraints as obstacles to growth. 80 BIS (2014), UK Innovation Survey: Highly Innovative Firms and Growth 81 Evaluation of Grant for R&D and Smart, PACEC (2009), commissioned by BIS.

Innovation in business
46
property the businesses involved have a funded route to market for their ideas. To date, SBRI competitions across more than 40 public bodies have awarded over 1,400 contracts worth £165 million.
3D camera brings wound care into 21st century Wound care costs the NHS an estimated £3 billion per annum, with approximately 38,000 patients in the East of England alone treated at home for diabetic, leg and pressure ulcers. Because these wounds heal so slowly, it is difficult for clinicians to tell whether treatment is working. Current treatment still involves using rulers, tracing paper and ordinary cameras to work out whether a wound is getting smaller.
Eykona’s technology, via an SBRI contract, has brought the clinical assessment of chronic wounds into the 21st century and established this small British start-up as a market leader.
Following a competitive process it was awarded a development contract by the NHS in the East of England to devise a solution to one of healthcare’s major challenges. Working with tissue viability specialists to perfect the design, Eykona has devised the first hand held camera which can offer precise computer analysed measurements without touching the wound, allowing for earlier decision-making and better treatment outcomes.
The SBRI contract was instrumental in raising a further £2.4 million of private investment and Eykona has now made sales to more than 20 NHS trusts and has been used in Camp Bastion, Afghanistan to assess the wounds of injured soldiers. Eykona has also made sales to the USA, Australia and Denmark.
Budget 2013 announced Government’s intention to ramp up the use of SBRI and committed to expand SBRI among key government departments such that the value of contracts through this route will increase from £40 million in 2012-13 to over £200 million in 2014-15.

Innovation Report 2014
47
6. Innovation with international partners
The flow of knowledge and investment across borders is increasingly a feature of the innovation ecosystem. International co-authorship is typically associated with higher quality research, and multinationals are looking strategically around the world for the best locations for their key functions.
There is a strong positive relationship between innovation, exporting, and business performance82. Consequently, working with international partners and drawing on resources around the world is highly important to the success of UK businesses.
Our research base and institutions have strong overseas links, and much of our research and development benefits from foreign investment. In 2011, the UK attracted as much overseas investment in its R&D activity as Canada, Finland, Japan, China and Russia combined.
However, international collaboration is risky for the individual participants and Government can play a key role in reducing risk by creating conducive conditions and opening access to potential partners and wider funding sources.
To further develop our strong international position, we are developing research and innovation collaboration frameworks with partner countries around the world, and we are working with our world-class innovation institutions to encourage investment into the UK and enable UK businesses to export.
6.1 International connectivity of UK innovation The UK innovation system is highly connected internationally. Our institutions are very attractive to foreign partners who recognise the excellence of our research. Forty-two UK universities appear in the list of the 100 most international universities, recently published in the Times.83
Flows of people and knowledge Academic articles are increasingly being written through international collaboration84 which increases their impact. The UK is no exception. Almost half of UK-authored articles have at least one non-UK co-author and such papers receive on average 24 per cent more citations than the average UK paper.
82 BIS (2014), UK Innovation Survey: Highly Innovative Firms and Growth, and Love & Roper (2013), SME Innovation, Exporting, and Growth, Enterprise Research Centre. 83 Times Higher Education (2014), World University Rankings 2013-14. This indicator considers the ratio of international to domestic staff and students, and international co-authorship in journal publications. Accessed at: 21/02/2014. 84 BIS (2013), International Comparative Performance of the UK Research Base – 2013

Innovation with international partners
48
UK researchers are also highly internationally mobile. The UK is second only to Canada among comparator countries, with 72 per cent of active researchers being internationally mobile between 1996 and 201285. The UK is also a destination of choice for high quality researchers from other countries. In 2012/13, 26 per cent of academics in the UK were non-UK nationals86 and these have tended to be more productive and have greater field-weighted citation impact87 than the researcher outflow group.
Our ability to attract international students also provides opportunities to build links with future researchers from other countries. In the academic year 2011/12, there were nearly 79,000 Chinese students enrolled in higher education in the UK an increase of almost 17 per cent on the previous year88. The GREAT Ambassadors - China scheme, announced in November 2013 and being piloted by UK Trade and Investment (UKTI) with University of Sheffield, aims to link UK businesses with the ever-growing diaspora of Chinese students and graduates by establishing an internship programme and an active alumni network in China.
Research & Development spending The UK is also highly connected to international flows of R&D spending and attracts investment from around the world (both investment in specific R&D projects and longer term Foreign Direct Investment (FDI) linked to our R&D capabilities). This reflects the attractiveness of the UK’s innovation, regulation, tax and knowledge environment.
Total R&D financed from overseas has increased over the last decade and is significantly higher than most other countries89. In 2011, the UK attracted almost $7 billion of overseas-financed R&D. This is the same as Canada, Finland, Japan, China, and Russia combined, more than either France or Germany ($4 billion each) and just under half that of the USA (with $16 billion)90. While the amount of R&D financed from overseas has increased in all sectors over the past decade, the most consistent growth has been seen in the higher education sector. Between 2000 and 2011, overseas-financed R&D in higher education increased year-on-year in real terms at an average annual rate of nearly 9 per cent91.
Since 2008, the percentage of business R&D financed from overseas has remained comfortably above 20 per cent for the UK compared to less than 14 per cent for all our comparator countries92, as illustrated in Figure 6.1. Our long history of attracting R&D finance from overseas is also converting into FDI. In 2012 we performed particularly well, with nearly 300 UKTI-involved FDI projects linked to R&D (an increase of 84 per cent from the previous year).
85 BIS (2013), International Comparative Performance of the UK Research Base – 2013, Comparator group does not include Australia, Finland, South Korea, Brazil, Russia, or India due to data limitations. 86 Higher Education Statistics Agency (HESA), Staff Record 2012/13. 87 BIS (2013), International Comparative Performance of the UK Research Base - 2013 88 HESA, Student Record 2011/12. 89 ONS (2013), Gross Expenditure on Research and Development, 2011. 90 OECD MSTI (2013/2) Purchasing power parity dollars at 2005 prices. 91 ONS (2013), Gross Expenditure on Research and Development, 2011. Compound annual growth rate. Deflator inferred from ONS tables. 92 OECD Main Science and Technology Indicators, (2013/2).

Innovation Report 2014
49
Figure 6.1: Percentage of business R&D financed from abroad, 2000-2012
Canada 10.3
China 1.1
Finland 8.1France 9.0
UK 23.7
USA 5.2
0
5
10
15
20
25
30
3520
00
2001
2002
2003
2004
2005
2006
2007
2008
2009
2010
2011
2012
Per
cen
t
Australia Canada China Finland France GermanyJapan Russia South Korea UK USA
Source: OECD Main Science and Technology Indicators (2013/2)
The international nature of UK business R&D is even more evident when ownership is considered. Approximately half of all business R&D is performed by subsidiaries of foreign companies, most notably the USA (22 per cent) and the EU (17 per cent)93. Growth in foreign ownership has been a significant trend for UK R&D over the past twenty years, as illustrated by Figure 6.2. Notably, between 2010 and 2012 the share of UK business R&D owned by countries other than the USA, Japan, and EU doubled from 5 per cent to 10 per cent. This includes the BRIC nations (Brazil, Russia, India and China) where we have been increasingly focusing collaboration resources in recent years.
93 ONS (2013), Business Enterprise Research and Development - 2012.
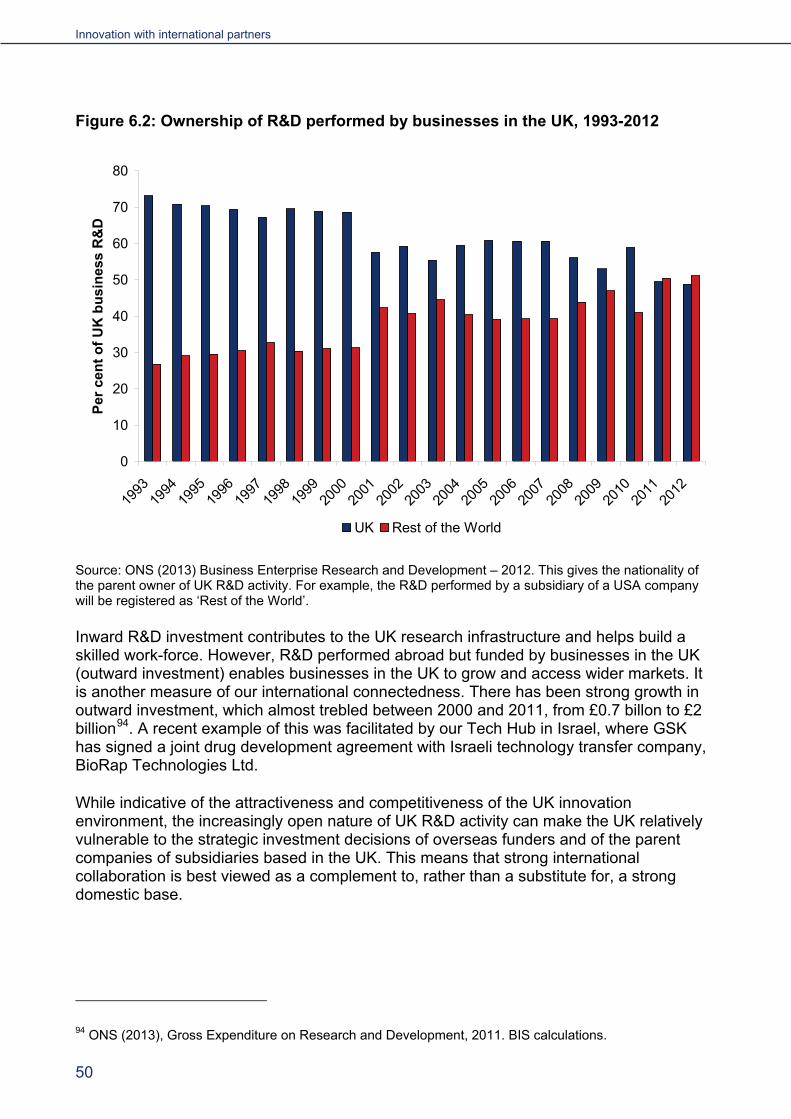
Innovation with international partners
50
Figure 6.2: Ownership of R&D performed by businesses in the UK, 1993-2012
0
10
20
30
40
50
60
70
80
1993
1994
1995
1996
1997
1998
1999
2000
2001
2002
2003
2004
2005
2006
2007
2008
2009
2010
2011
2012
Per c
ent o
f UK
bus
ines
s R
&D
UK Rest of the World
Source: ONS (2013) Business Enterprise Research and Development – 2012. This gives the nationality of the parent owner of UK R&D activity. For example, the R&D performed by a subsidiary of a USA company will be registered as ‘Rest of the World’.
Inward R&D investment contributes to the UK research infrastructure and helps build a skilled work-force. However, R&D performed abroad but funded by businesses in the UK (outward investment) enables businesses in the UK to grow and access wider markets. It is another measure of our international connectedness. There has been strong growth in outward investment, which almost trebled between 2000 and 2011, from £0.7 billon to £2 billion94. A recent example of this was facilitated by our Tech Hub in Israel, where GSK has signed a joint drug development agreement with Israeli technology transfer company, BioRap Technologies Ltd.
While indicative of the attractiveness and competitiveness of the UK innovation environment, the increasingly open nature of UK R&D activity can make the UK relatively vulnerable to the strategic investment decisions of overseas funders and of the parent companies of subsidiaries based in the UK. This means that strong international collaboration is best viewed as a complement to, rather than a substitute for, a strong domestic base.
94 ONS (2013), Gross Expenditure on Research and Development, 2011. BIS calculations.

Innovation Report 2014
51
6.2 Supporting international collaboration With this in mind, we are increasingly focusing our efforts on contributing to the Industrial Strategy and, in particular, on the Eight Great Technologies. We are maintaining our strong engagement with our more traditional allies in Europe and North America. However, growth in research capacity and commercialisation in the BRIC countries offers new opportunities for UK businesses to tap into complementary expertise, financial support and, ultimately, growing markets.
We are therefore adopting a broad approach, ranging from promoting UK strengths to influencing other countries to create the conditions for successful collaboration and enabling UK organisations to access foreign finance or win contracts overseas.
Encouraging UK players to work together This increasingly strategic and coordinated approach will involve a combination of targeted campaigns and programmes in key international partner countries and positive responses to opportunities identified or developed locally. Our Science and Innovation Network (SIN) is increasing its support for innovation-related collaboration and has been key to facilitating nearly all the activities described here. In addition, the FCO’s overseas network promotes science and innovation within its Prosperity Agenda.
The various non-government bodies described earlier in the report work closely together with government, both through formal mechanisms such as the Global Science and Innovation Forum, chaired by the Government Chief Scientific Adviser, and informally through strong professional relationships. Considerable effort is made to ensure that the expertise of each stakeholder organisation is brought to bear on the research and research policy challenges of the future. For instance, the TSB is building its strategic focus around international collaboration and each of the new Catapults is actively identifying where it should focus its international efforts. A partnership agreement between TSB and UKTI sees both organisations working ever closer together, jointly developing international strategies and holding flagship events such as InnovateUK in November 2014. They are also joining up by sharing customer data ensuring innovation-led SMEs get seamless access to the services they need. RCUK is actively exploring in India how its research collaboration can bring greater involvement from industry, with the aim of securing clear impact and commercialisation opportunities.
Promoting the UK as a Key Partner A successful Innovation Conference organised as part of the UK’s G8 presidency demonstrated clearly to a diverse international audience the breadth and depth of our innovation strengths while stimulating debate and new collaborations.
UKTI will launch a new innovation organisation in March 2014 to secure science and innovation investments from international funds and multinational companies. It will also support innovation-focused UK companies using our Eight Great Technologies to internationalise and grow. The organisation will lead UKTI's charge to focus increased efforts on promoting the world leading strengths of the UK’s innovation system, building on the GREAT brand that was launched at the time of the 2012 Olympics and Paralympics Games. It will run a major “innovation is GREAT” campaign to showcase UK innovation

Innovation with international partners
52
capability at key events in ten international markets through trade delegations, print and digital marketing, and 3D holograms of UK innovations and thought leaders.
Enabling UK organisations to access overseas finance The Science and Innovation Network (SIN) have had a number of significant successes during the year that have led to a number of major grants focusing on innovation for UK partners:
• Led by the University of Bath, a consortium of 18 partners including research institutions and SMEs from the UK, Germany, Spain and India, secured EU funding of around €9 million for an R&D project on Sustainable and Eco-Building Materials
• Securing £6.5 million in investment into UK-based innovations through a three year, technology-partnering project working with China’s S&T Commissions in Beijing, Shanghai and Wuxi. The new collaborations will generate income in excess of £42 million and cover technology areas including: medical diagnostics and devices; agri-technology; low carbon; machine to machine communication and water technologies.
Horizon 2020, the EU's new €79 billion funding programme for collaborative research and innovation for the years 2014-2020, formally started on 1 January 2014. The first call for proposals was issued in December 2013 and the UK launch event took place in January 2014. It seeks to support projects ranging from blue sky basic research to near-to-market activities and is structured around a number of areas, including key enabling technologies and societal challenges.
The UK is already a very strong participant in European funding programmes. We had the highest number of participations in the Seventh Framework Programme and the highest share of the budget in 2012 and 2013. The Government aims to increase the number of UK businesses that benefit from European R&D programmes and the TSB has enhanced its network of National Contact Points that will be able to offer expert advice to businesses to help them access Horizon 2020 programmes. The TSB is also establishing a permanent presence in Brussels with two aims: influencing EU research policy and helping UK businesses take advantage of the opportunities afforded by EU research and innovation funding.
SIN/UKTI’s international activities and promotion of the UK also created opportunities for UK organisations to win major contracts overseas:
• UK organisations secured contracts to deliver scientific lasers and services to a newly established pan-European large research project aiming to build lasers with a huge energy density in the Czech Republic, Hungary and Romania, worth a total of £15.7 million
• The Samsung Advanced Institute of Technology (SAIT) Global Research Outreach programme provides grants for research at universities outside of Korea. To date UK universities have attracted approximately $1.7 million of SAIT funding, making the UK the second largest recipient after the USA.

Innovation Report 2014
53
Building influential relationships overseas The UK’s approach to developing positive, open and mutually supportive relationships with a wide range of countries, combined with our reputation for strength in innovation, often leads to major opportunities to help shape thinking overseas. This can significantly improve the conditions for UK organisations collaborating internationally. In particular:
• In December 2013 BSI signed an historic agreement with the government of China, on behalf of the Standardization Administration of China (SAC). This is the first agreement of its kind that SAC has entered into with another National Standards Body. The agreement is to mutually recognise and / or adopt British Standards in China and Chinese Standards in the UK. Ultimately, this will reduce costs and raise quality while simplifying trade procedures, promoting market access and helping to achieve bilateral trade targets
• SIN/UKTI year-long campaign in the USA focused on synthetic biology has led to UK-USA participants agreeing to greater collaboration to standardise methods for measuring the accuracy and comparability of synthetic biology technologies to help accelerate the translation and commercialisation of research
• The Design Council has won a three year European Commission contract to lead a consortium to deliver a project to increase the use of design for innovation and growth across Europe.
Space collaboration There has recently been a strong set of new European collaborations focusing on space.
• Following a mission of Italian experts to the Satellite Applications Catapult, UKSA and the Catapult are in negotiations with one of the Italian participating companies in order to establish a branch in the UK
• The UK Space Agency and the Centre National d’Etudes Spatiales signed an agreement in January 2014 which will further enhance cooperation between the UK and France on: earth observation; telecommunications satellites; space science and technology. It will build the two agencies’ contribution to space activities carried out through the European Space Agency, the European Union and other international organisations
• The Government will also introduce a £80 million Global Collaborative Space Programme over five years as an international pillar to the national space policy. The fund will enable UK scientists and companies to build stronger links with emerging powers in developing space capabilities and technology.
Supporting new collaborations and exploring new models Collaboration with China and India on research and innovation is growing. The UK is now China’s second largest collaborator in scientific research publications and joint UK-China research funding is growing at an increasing rate. The latest £9 million joint funding for
Innovation with international partners
54
research on sustainable materials for infrastructure and marine energy, was announced by the Prime Minister in December 2013.
We are also encouraging the collaboration on R&D involving industrial partners. A £3 million joint investment from the TSB, Research Councils UK, and the Chinese Ministry of Science and Technology will support the development and commercialisation of innovative approaches to sustainable manufacturing. TSB also recently announced a £5 million collaborative R&D programme with the Indian Global Innovation and Technology Alliance covering affordable healthcare and clean-tech, focusing on energy systems.
The Government recently announced a new five year £375 million Newton Fund for programmes that will focus on supporting the development of 15 emerging economies95. These will provide resources to support capacity building around science and innovation in these countries and targeted R&D collaborations that will deliver breakthroughs in development-related challenges.
The IPO has a major programme which focuses on helping businesses to understand and deal with issues associated with intellectual property protection when going overseas. It also supports the Governments of key countries in strengthening their IP protection regime. This includes specialist IP attachés based within the British Embassies’ in Beijing, New Delhi, Brasilia, and Singapore, IP guides for key markets, and online tools designed to help businesses96.
We are committed to further developing and strengthening our collaborations, always seeking new and creative approaches that reflect the evolving global innovation ecosystem.
• Nesta has published a major study of the opportunities for UK engagement in China’s innovation landscape97 to help us develop our approach and focus. We have also agreed with the Ministry of Science and Technology to establish an independent joint UK-China Experts Group, to identify opportunities which will strengthen our collaborations
• At the UK-India Science and Innovation Policy Dialogue in November 2013 it was agreed that the next phase of collaboration would be about demonstrating greater impact, looking to work together to address key global challenges where both countries have expertise. A Task Force will identify potential grand challenges to work on, including cities and urbanization; delivering better public health outcomes; advanced manufacturing; and managing water resources in the face of climate change
• In April 2013, the UK hosted the largest ever UK-Brazil Innovation Roundtable to explore potential areas for collaboration. There is a growing interest in areas as diverse as energy technology, future cities, agri-tech and advanced manufacturing. During 2014 we aim to convert these into funded projects
95 China, India, Brazil, Turkey, South Africa, Colombia, Chile, Mexico, Eqypt, Kazakhstan, Indonesia, Malaysia, Vietnam, Thailand, Philippines. 96 These can be accessed at: www.ipo.gov.uk/ip4b-abroad.htm. 97 Nesta (2013), China’s Absorptive State: research, innovation and prospects for UK-China collaboration.

Innovation Report 2014
55
• In Europe, Nesta has been appointed by the European Commission to develop its Horizon 2020 Innovation Challenge Prizes Programme and to design challenge prizes in areas such as bio-economy, health and transport with the aim of mobilising research and innovation investment in Europe.

© Crown copyright 2014 Cover image: © Jannik C. Meyer, University of Vienna
You may re-use this information (not including logos and front/back cover images) free of charge in any format or medium, under the terms of the Open Government Licence. Visit www.nationalarchives.gov.uk/doc/open-government-licence, write to the Information Policy Team, The National Archives, Kew, London TW9 4DU, or email: [email protected].
This publication available from www.gov.uk/bis
Any enquiries regarding this publication should be sent to: Department for Business, Innovation and Skills 1 Victoria Street London SW1H 0ET Tel: 020 7215 5000 If you require this publication in an alternative format, email [email protected], or call 020 7215 5000. BIS/14/P188