impact of research & innovation on profitable growth in ... · mckinsey & company | 13 in...
TRANSCRIPT

Impact of Research & Innovation on Profitable Growth in ChemicalsGPCA Research & Innovation Summit
Dubai, March 12, 2014
CONFIDENTIAL AND PROPRIETARYAny use of this material without specific permission of McKinsey & Company is strictly prohibited

McKinsey & Company | 1
PPSPOMPARPTFEEPMEDPMiso.PPHOPEABSPANEpoxyPBTSilicone
LLDPEPEEKPESPIPEI LCP
UFPF
PEDPURPIBPETPASBBLDPEPMMABRPSPVC
Skeptics say the "good old times for innovation are over"
1900 1920 1940 1960 1980 2000
"There is an overwhelming consensus among analysts that chemical companies should not spend more on R&D"
European Chemical News
"Innovation will not be a primary growth and value driver in chemicals"
UBS Equity Research
"Lack of innovation has been one of the industry's greatest problems over the past decade"
Goldman Sachs
"Rapid product innovation may not confer a competitive advantage"
ING
SOURCE: McKinsey
Decline of monomer innovation

McKinsey & Company | 2
Enthusiasts see a different picture
New products/ technologies
Industrial enzymes
Liquid crystals
Agchem/GMO seeds
Cultures
Alternative feedstock Methanol to olefins
Coal to olefins
Biomass to chemicals, e.g., bioethanol to ethylene
Resource-efficient processes
New catalystsNew processes, e.g., HPPO, fermentation, electrolysis
Better and better solutions
Oilfield chemicalsFilms and coatingsfor electronics, etc.
... and many more
McKinsey & Company | 3
Beyond stories and opinions …
Top-down perspective Archetypes of successful companies in chemicals –Does Research & Innovation play a role?
Bottom-up perspective Value creation through innovation –What does McKinsey’s InnomaticsTM database say?
McKinsey & Company | 4
Beyond stories and opinions …
Top-down perspective Archetypes of successful companies in chemicals –Does Research & Innovation play a role?
Bottom-up perspective Value creation through innovation –What does McKinsey’s InnomaticsTM database say?

McKinsey & Company | 5SOURCE: Datastream, McKinsey
Chemicals has been capturing a disproportionate share of the valueTRS, indexed – 100 = December 31, 2000, USD
0
50
100
150
200
250
300
350
400
450
Global Market
Oil & Gas
ChemicalsConsumer GoodsConstruction
Automobile
Electronics
201312111009080706050403022001
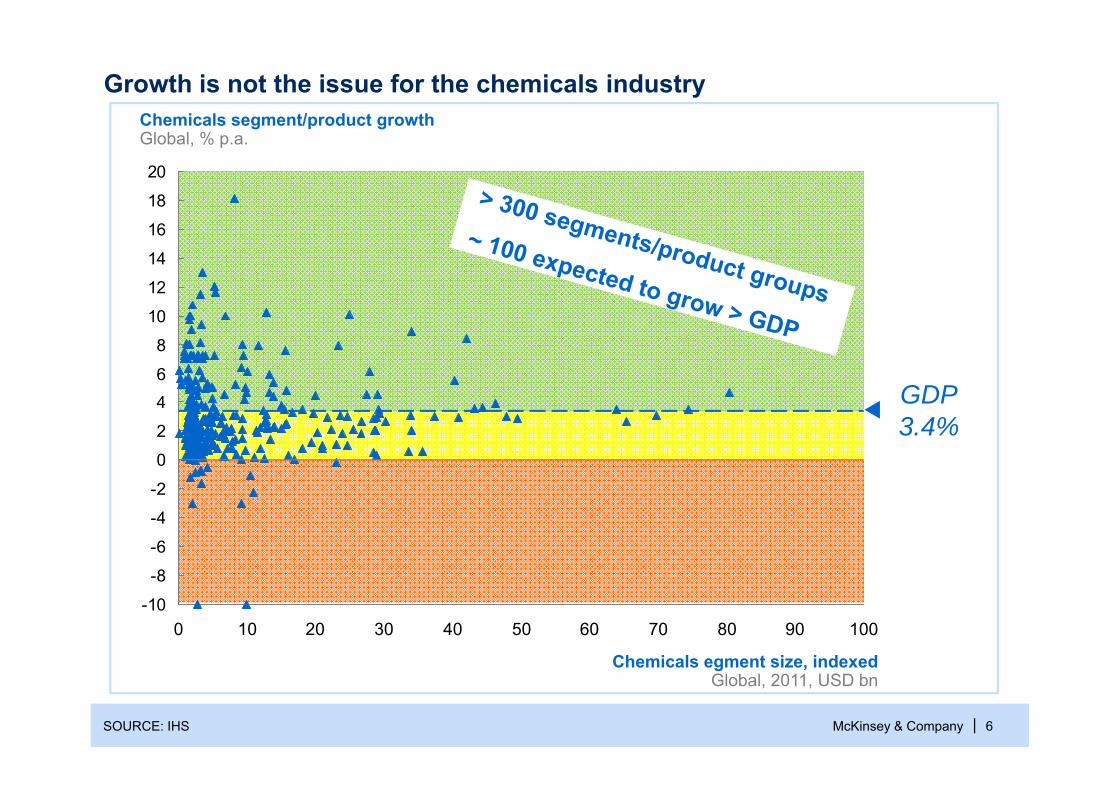
Outlook on profitable growth?
McKinsey & Company | 6
-10
-8-6
-4-2
0246
810
1214
1618
20
1009080706050403020100
Chemicals egment size, indexedGlobal, 2011, USD bn
Chemicals segment/product growthGlobal, % p.a.
Growth is not the issue for the chemicals industry
SOURCE: IHS
GDP3.4%
McKinsey & Company | 7
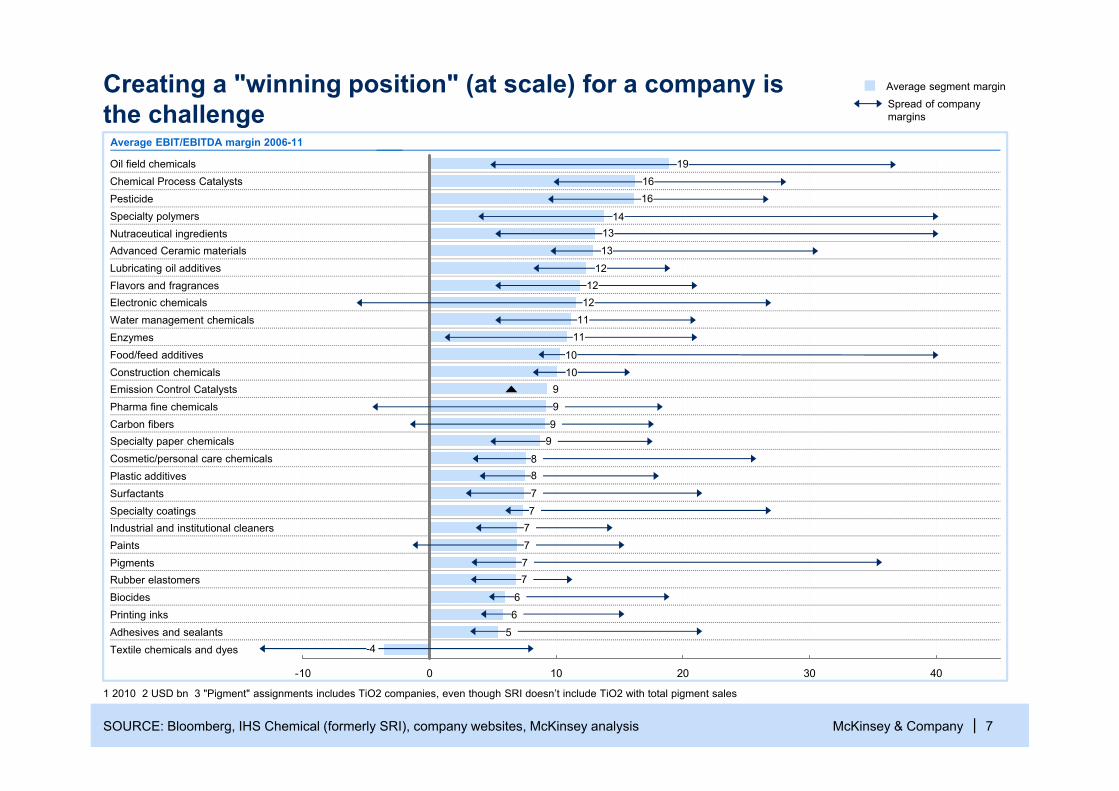
-10 0 10 20 30 40
PigmentsRubber elastomersBiocidesPrinting inksAdhesives and sealantsTextile chemicals and dyes
PaintsIndustrial and institutional cleanersSpecialty coatingsSurfactantsPlastic additivesCosmetic/personal care chemicalsSpecialty paper chemicalsCarbon fibersPharma fine chemicalsEmission Control CatalystsConstruction chemicalsFood/feed additivesEnzymesWater management chemicalsElectronic chemicalsFlavors and fragrancesLubricating oil additivesAdvanced Ceramic materialsNutraceutical ingredientsSpecialty polymersPesticideChemical Process CatalystsOil field chemicals
Creating a "winning position" (at scale) for a company is the challenge
1 2010 2 USD bn 3 "Pigment" assignments includes TiO2 companies, even though SRI doesn’t include TiO2 with total pigment sales
Average EBIT/EBITDA margin 2006-11
SOURCE: Bloomberg, IHS Chemical (formerly SRI), company websites, McKinsey analysis
Average segment marginSpread of company margins
191616
141313
1212
1211
11
1010
999
98877
7777
66
5-4
McKinsey & Company | 8
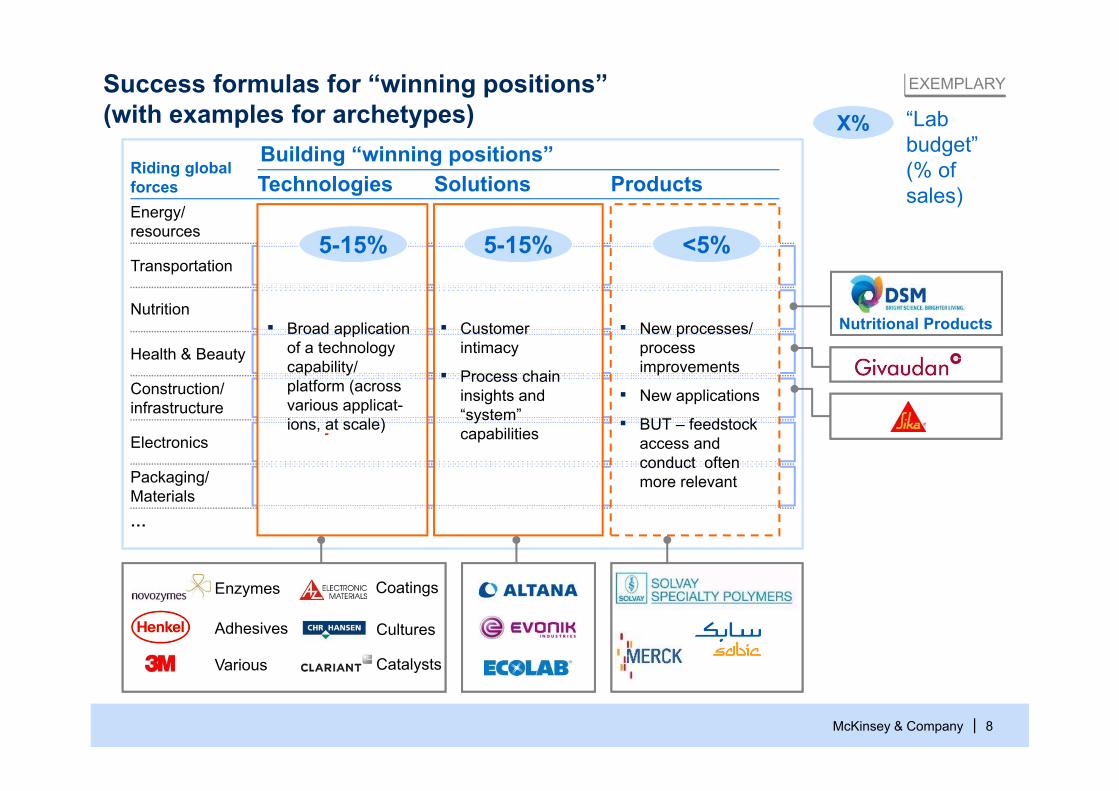
Success formulas for “winning positions” (with examples for archetypes)
EXEMPLARY
…
Energy/resources
Technologies SolutionsBuilding “winning positions”
Riding global forces Products
Nutrition
Transportation
Health & Beauty
Construction/ infrastructure
Electronics
Packaging/ Materials
Adhesives
Various
Enzymes
Cultures
Coatings
Catalysts
▪ Broad application of a technology capability/ platform (across various applicat-ions, at scale)
5-15%
▪ Customer intimacy
▪ Process chain insights and “system” capabilities
▪ New processes/ process improvements
▪ New applications
▪ BUT – feedstock access and conduct often more relevant
5-15% <5%
X% “Lab budget”(% of sales)
Nutritional Products
McKinsey & Company | 9
Beyond stories and opinions …
Top-down perspective Archetypes of successful companies in chemicals –Does Research & Innovation play a role?
Bottom-up perspective Value creation through innovation –What does McKinsey’s InnomaticsTM database say?
McKinsey & Company | 10
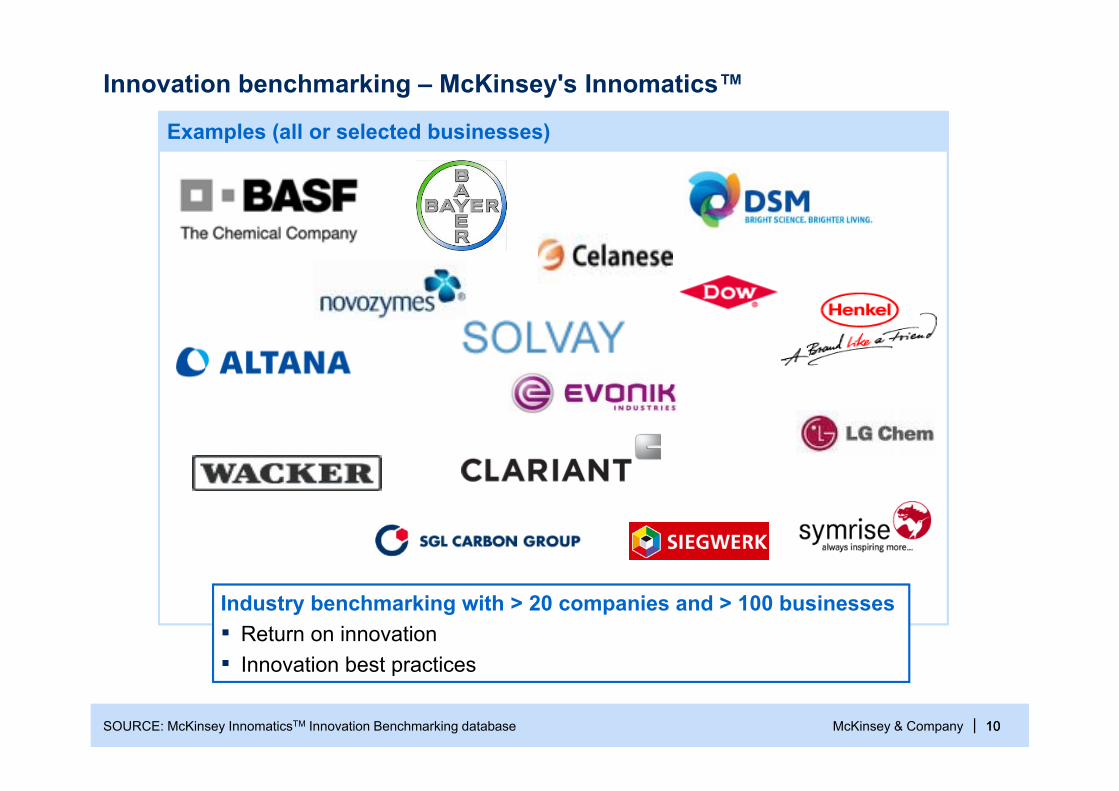
Innovation benchmarking – McKinsey's Innomatics™
SOURCE: McKinsey InnomaticsTM Innovation Benchmarking database 10
Examples (all or selected businesses)
Industry benchmarking with > 20 companies and > 100 businesses▪ Return on innovation ▪ Innovation best practices
McKinsey & Company | 11
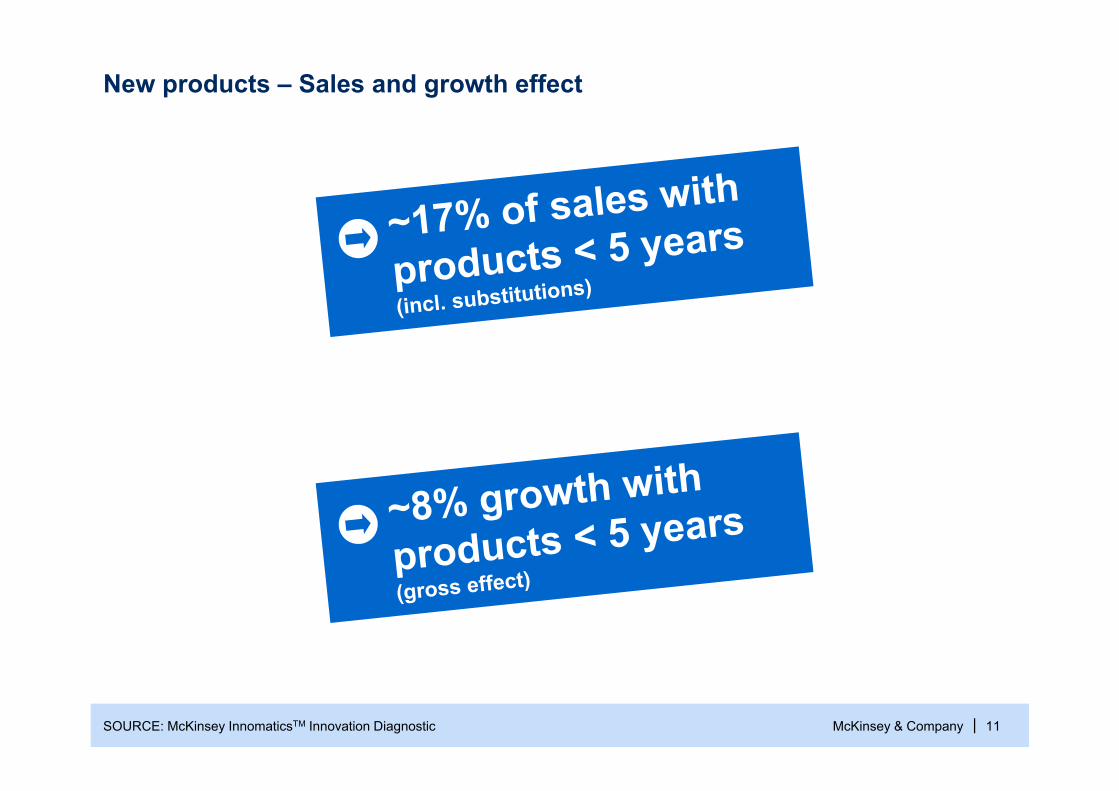
On-top sales from new products (gross effect), % of total sales
Sales from new products, % of total sales
New products – Sales and growth effect
SOURCE: McKinsey InnomaticsTM Innovation Diagnostic
010203040506070
10.09.59.08.58.07.57.06.56.05.55.04.54.03.53.02.52.01.51.00.50
R&D spend for new products/total sales, %
010203040506070
10.09.59.08.58.07.57.06.56.05.55.04.54.03.53.02.52.01.51.00.50
R&D spend for new products/total sales, %
17%
8%
McKinsey & Company | 12
-20
-10
0
10
20
30
40
50
60
70
5.0 5.5 6.0 17.54.54.03.53.02.52.01.51.00.50
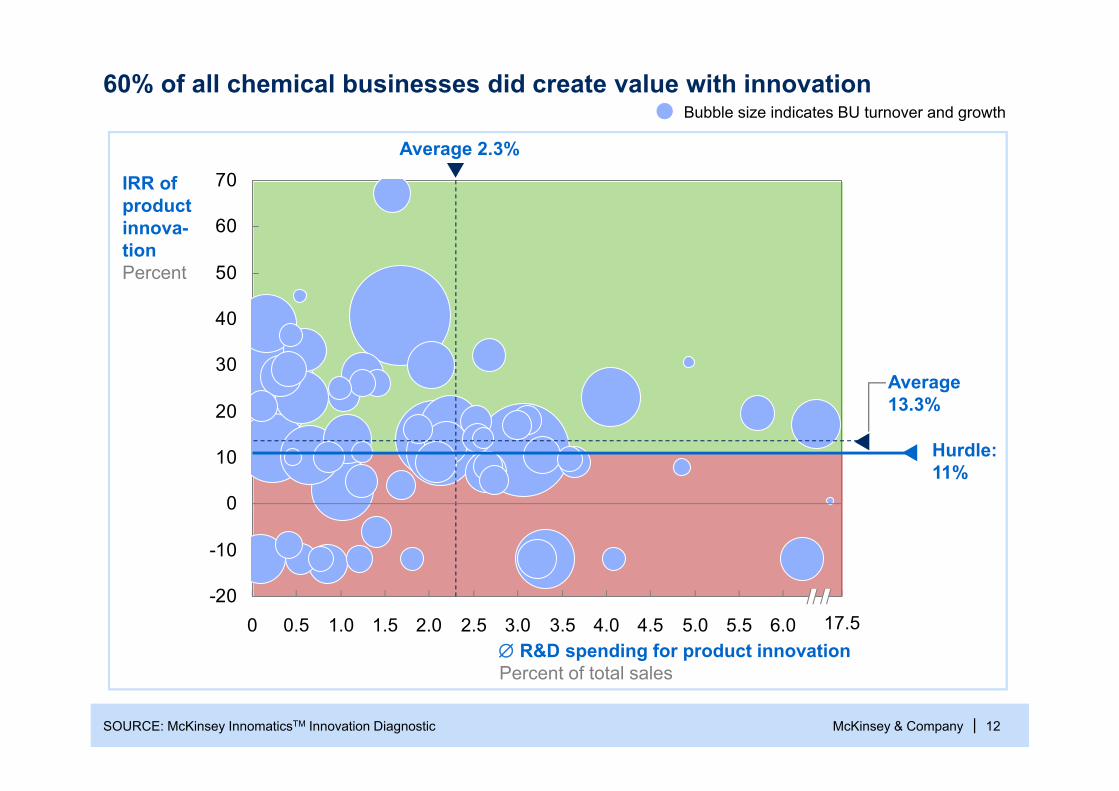
60% of all chemical businesses did create value with innovation
IRR of product innova-tionPercent
R&D spending for product innovationPercent of total sales
Hurdle:11%
Average13.3%
Average 2.3%
SOURCE: McKinsey InnomaticsTM Innovation Diagnostic
Bubble size indicates BU turnover and growth
McKinsey & Company | 13
In summary
Research & Innovation do contribute to growth and value creation of the industry –however, not necessarily for each company
There are very attractive “winning positions” that rely heavily on the ability to innovate at scale
Key observations/success factors for innovation▪ Strategy – reflecting innovation
headroom/tailwind and own capabilities▪ Scale (and/or patience to build) –
critical mass and focus▪ Lab efficiency (and spirit) – work flows,
automation/IT, etc.
McKinsey & Company | 14