application of ionic liquid-based dispersive liquid–liquid microextraction for the analysis of...
TRANSCRIPT

Food Chemistry 161 (2014) 317–322
Contents lists available at ScienceDirect
Food Chemistry
journal homepage: www.elsevier .com/locate / foodchem
Analytical Methods
Application of ionic liquid-based dispersive liquid–liquidmicroextraction for the analysis of ochratoxin A in rice wines
http://dx.doi.org/10.1016/j.foodchem.2014.04.0330308-8146/� 2014 Elsevier Ltd. All rights reserved.
⇑ Corresponding author. Tel.: +86 21 85284925; fax: +86 21 85280293.E-mail address: [email protected] (C. Liu).
Xianwen Lai, Chunqiang Ruan, Ruicen Liu, Chenglan Liu ⇑Key Laboratory of Natural Pesticide and Chemical Biology, Ministry of Education, South China Agricultural University, Guangzhou 510642, PR China
a r t i c l e i n f o
Article history:Received 8 July 2013Received in revised form 6 February 2014Accepted 6 April 2014Available online 15 April 2014
Keywords:Ionic liquidDispersive liquid–liquid microextractionHPLC-FLDOchratoxin ARice wine
a b s t r a c t
A novel and rapid ionic liquid-based dispersive liquid–liquid microextraction (IL-DLLME) method com-bined with liquid chromatography and a fluorescence detector for the analysis of ochratoxin A in ricewines is presented. The following parameters were systematically investigated: type and volume of ionicliquid, volume of dispersive solvent, salt addition, sample pH, and vortex time. Rice wine samples werefirst diluted to 18% alcohol with deionized water, and the pH was adjusted to 3.0. A DLLME procedure wasfollowed that included IL ([HMIM][PF6]) and ethanol as the extraction and dispersive solvents, respec-tively. Under the optimized experimental conditions, good linearity was obtained with a correlation coef-ficient (r) of 0.9998 and a limit of detection (LOD) of 0.04 lg L�1. The recoveries ranged from 75.9% to82.1% with an RSD below 10.4%. The proposed method was successfully applied to analyse OTA samplesfrom several rice wine brands collected in Guangdong province, China.
� 2014 Elsevier Ltd. All rights reserved.
1. Introduction
Ochratoxin A (OTA) is a mycotoxin produced by several fungi(molds) belonging to the Aspergillus and Penicillium species. It ishepatotoxic, nephrotoxic, teratogenic and carcinogenic to animalsand has been classified as a possible human carcinogen (group2B) by the International Agency for Research of Cancer (IARC)(IARC, 1993).
The natural presence of OTA in cereals is widespread, and it isfound in barley, rye, oats, wheat, rice and maize (Duarte, Pena, &Lino, 2010). In addition, other foods, such as dried fruits, spicesand cocoa beans, also contain OTA (Bircan, 2009; De Magalhaes,Sodre, Viscogliosi, & Grenier-Loustalot, 2011; Santos, Marin,Sanchis, & Ramos, 2010). OTA is a moderately stable molecule ofMW 403.81 (C20H18ClNO6), and it can survive most food processing(Alldrick, 1996). Therefore, OTA appears in derived products suchas cereal-derived products (Duarte et al., 2010), wine, beer andgrape juices (Ertan & Mustafa, 2009; Valero, Marin, Ramos, &Sanchis, 2008). Researchers have demonstrated that wine is themajor source of daily OTA intake after cereals (Arroyo-Manzanares, Gamiz-Gracia, & Garcia-Campana, 2012). Thus, theEuropean Union (EU) has set the maximum level of OTA at2 lg kg�1 for wines (European Commission, 2006a).
Chinese rice wine, which is also called yellow wine, is a tradi-tional Chinese alcoholic beverage and is widely consumed in southChina. Chinese rice wine is typically fermented from glutinous riceusing wheat Qu and yeast (Saccharomyces cerevisiae) (Shen, Ying, Li,Zheng, & Qing, 2011). Because of the fermentation process, Chineserice wines could be contaminated with OTA. Therefore, an analysisand an assessment of the OTA levels in Chinese rice wine should beconducted. Thus, very rapid and sensitive analytical methods areneeded to detect OTA in rice wines.
The AOAC has established a method for determined OTA in wineand beer by immunoaffinity column cleanup and liquid chromato-graphic analysis with fluorometric detection (AOAC, 2002). Someother sample treatment methods have been developed to extractOTA from different matrices. Most of these methods are based onimmunoaffinity columns (IACs), which provide very high samplepurification. However, this method is expensive and tedious.Liquid–liquid extraction (LLE) (Gonzalez-Osnaya, Soriano, Molto,& Manes, 2008), solid-phase extraction (SPE) (Reinsch, Topfer,Lehmann, Nehls, & Panne, 2007), SPE with molecular imprintedpolymers (MISPE) (Ali et al., 2010), solid-phase microextraction(SPME) (Aresta, Vatinno, Palmisano, & Zambonin, 2006), andmatrix solid-phase dispersion (MSPD) (Capriotti et al., 2010) haveall been used to extract OTA. A recent review summarized theseanalytical and extraction methodologies in regards to OTA analysis(Turner, Subrahmanyam, & Piletsky, 2009). However, some of thesemethods have a high cost, or some are time-consuming andcomplicated.

318 X. Lai et al. / Food Chemistry 161 (2014) 317–322
In recent years, a novel and rapid microextraction method, dis-persive liquid–liquid microextraction (DLLME), that was intro-duced for liquid sample treatment (Berijani, Assadi, Anbia,Hosseini, & Aghaee, 2006; Zgloa-Grzeskowiak & Grzeskowiak,2011) has been applied for mycotoxin analysis of various samples.These samples include ochratoxin A in wines (Arroyo-Manzanareset al., 2012; Campone, Piccinelli, & Rastrelli, 2011), patulin in applejuices (Victor-Ortega, Lara, Garcia-Campana, & Olmo-Iruela, 2013),zearalenone in beer (Antep & Merdivan, 2012), aflatoxins in ediblenuts and seeds after an IAC step (Arroyo-Manzanares, Huertas-Perez, Gamiz-Gracia, & Garcia-Campana, 2013) and aflatoxins incereals after extraction with methanol/water (8:2, v/v)(Campone, Piccinelli, Celano, & Rastrelli, 2011). DLLME uses a ter-nary component solvent system. Briefly, a cloudy solution isquickly formed by rapidly injecting a mixture of extraction and dis-persive solvents into the liquid samples, and the extraction attainsbalance in a short time. The method has obvious advantages,including a high enrichment factor, simplicity in operation, lowcost and rapidness, and thus, DLLME has attracted the attentionof many research groups.
In the conventional DLLME method, organic solvents that have adensity higher than water are employed as extractants, and theycan be separated and deposited after centrifugation. However, onlya few solvents, which are usually highly toxic chlorinated solventssuch as chloroform, chlorobenzene, carbon tetrachloride, and tet-rachloroethane, can be used with this technique because of its spe-cific requirements (Zgloa-Grzeskowiak & Grzeskowiak, 2011).Room temperature ionic liquids (RTILs) are a group of new organicsalts that contain organic cations and anions that are liquid atroom temperature. They are generally considered environmentallyfriendly solvents and thus have applications in the separation sci-ences because they have several unique properties, such as lowvolatility, chemical and thermal stability, and high solubility (Sun& Armstrong, 2010). In several studies, RTILs have been used asextraction solvents to replace the typical organic solvents inDLLEM such as for the analysis of pesticides in water samples(Liu, Zhao, Zhu, Gao, & Zhou, 2009; Zhang et al., 2012) and as syn-thetic food colourants in soft drinks and confectioneries (Wu et al.,2013). Up to now, no reports have been published that use theIL-DLLME technique for mycotoxin analysis.
The aim of this study was to develop an IL-DLLME method forOTA identification in rice wines using HPLC with a fluorescencedetector (FLD). Several experimental parameters on the extractionefficiency were investigated and optimized: including the type andvolume of IL; the dispersive solvent; the pH; salt addition; and thevortex time. The optimized method was successfully applied to theanalysis of several rice wine brands collected from Guangdongprovince in southern China. To our knowledge, we demonstratethe first application of RTILs as extraction solvents in the DLLMEmethod for OTA in rice wine samples.
2. Materials and methods
2.1. Chemicals and standard solutions
All reagents were analytical grade, solvents were HPLC-grade,and OTA was analytical standard grade. OTA was purchased fromPriboLab (Singapore). Methanol, ethanol and acetonitrile were sup-plied by Shanghai ANPEL Scientific Instrument Co., Ltd. in China.The 1-hexyl-3-methylimidazolium hexafluorophosphate ([HMIM][PF6], P99.0% purity), 1-butyl-3-methylimidazolium hexafluoro-phosphate ([BMIM][PF6], P99.0% purity), 1-octyl-3-methylimida-zolium hexafluorophosphate ([OMIM][PF6], P99.0% purity) and1-octyl-3-methylimidazolium tetrafluoroborate ([OMIM][BF4],P99.0% purity) were purchased from Shanghai Cheng Jie ChemicalCo., Ltd. in China. Ultrapure water (UNIQUE-R20 purification
system with UV+UF optional accessories, Research, China) was usedthroughout this work. A 0.45 lm cellulose membrane filter (Sterli-tech, Kent, WA, USA) was used for filtration of the stock standardsolutions and rice wine samples. A stock solution of OTA(100 lg mL�1) was prepared in methanol, stored in amber glassvials at �20 �C and held for approximately 3 months.
2.2. Instruments and equipment
Chromatographic analysis was performed on an Agilent 1260HPLC system (Agilent Technologies, Germany) equipped with abinary pump, automatic sample injector, degasser, and a fluores-cence detector. The OTA were separated on KR100-10 C18 (5 lm,150 mm � 4.6 mm, Kromasil Limited). The mobile phase was amixture of water, acetonitrile, and acetic acid (51:48:1, v/v/v) ata flow rate of 1.0 mL/min, and the column temperature was25 �C. Detection of OTA was carried out using wavelengths of333 and 360 nm for excitation and emission, respectively. A Centri-fuge 5804R (Eppendorf, Hamburg, Germany) and a XW-80 vortexshaker (Shanghai DiBo Laboratory Equipment Co., Ltd, China) wereused for the sample treatment. All glassware used in the experi-ments were washed with deionized water and acetone and thendried at room temperature.
2.3. Sample treatment
Several rice wine samples having different alcohol percentages(from 28% to 45%) were collected from local stores and the super-market in Guangzhou city, Guangdong province, China. First,appropriate 50–100 mL volumes of the rice wine samples werediluted to 18% alcohol with deionized water, and then the pHwas adjusted to 3.0 using 1.0 M HCl. The diluted rice wine sampleswere filtered through a 0.45 lm cellulose membrane filter and pro-cessed using the IL-DLLME method.
2.4. DLLME protocol
A 5 mL aliquot of rice wine samples (containing 0.9 mL ethanolto be used as the DLLME dispersive solvent) spiked or not with OTAwas placed into a 10 mL conical centrifuge tube. The mixture of theextraction solvent (100 lL [HMIM][PF6]) and the dispersive solvent(0.1 mL ethanol) was rapidly injected into the sample solution witha micropipette. The ternary component system was mixed using avortex mixer at 2800 rpm for 2 min. A cloudy solution quicklyformed in the test tube. After centrifugation for 5 min at3000 rpm, droplets of ionic liquid collected at the bottom of thecentrifuge tube. The upper, aqueous phase was removed with aPasteur pipette. The IL-phase volume was 70 ± 3 lL. The sedi-mented phase was redissolved with 100 lL methanol. The solutionwas transferred into a sample vial, and 20 lL was injected into theHPLC instrument for chromatographic analysis.
3. Results and discussion
3.1. IL-DLLME procedure optimization
To obtain high extraction efficiency, the influence of severalparameters were carefully investigated, including the type and vol-ume of ionic liquid, the volume of the dispersive solvent, samplepH, salt addition and vortex time. In these experiments, a blankrice wine spiked with OTA (4 lg L�1) was used to evaluate theextraction efficiency. To calculate the enrichment factor and recov-ery, Eqs. (1) and (2) were used as follows:
EF ¼ Csed
C0; ð1Þ

0
15
30
45
60
75
90
0
10
20
30
40
50
60
Rec
over
y (%
)
Enr
ichm
ent f
acto
r
Volume of IL (µL)
Enrichment factorRecovery
a
0
15
30
45
60
75
90
0
5
10
15
20
25
30
35
40
Rec
over
y (%
)
Enr
ichm
ent f
acto
r
Volume of ethanol (mL)
Enrichment factor
Recovery
b
Fig. 1. Effect of the volume of ionic liquid (a) and on ethanol (b) the extractionefficiency. Extraction conditions: rice wine sample volume, 5.0 mL; OTA concen-tration 4.0 lg L�1; disperser solvent, ethanol. Other conditions: (b) IL [HMIM][PF6]volume, 100 lL.
X. Lai et al. / Food Chemistry 161 (2014) 317–322 319
where EF is the enrichment factor, Csed is the analyte concentrationin the sediment and C0 is the initial analyte concentration in theaqueous samples.
Csed was calculated from the calibration graph of the OTA stan-dard solution in the concentration range of 0.1–10 lg L�1.
R% ¼ CsedV sed
C0Vaq� 100 ¼ EF� V sed
Vaq� 100; ð2Þ
where R% is the extraction recovery, Vsed is the volume of the sedi-ment phase, and Vaq is the volume of the aqueous sample.
3.1.1. Ionic liquid selectionThe appropriate ILs for water sample extraction should meet
the following requirements: low miscibility with water, low vola-tility, higher density than water, and a strong extraction affinityfor the compound of interest. Because they met the above require-ments, the following imidazolium-based ILs containing hexa-fluorophosphate or tetrafluoroborate anions with different alkylchains were selected: [HMIM][PF6], [BMIM][PF6], [OMIM][PF6],and [OMIM][BF4].
The IL [OMIM][PF6] seriously interfered with the OTA peak inthe HPLC analysis. When the ILs [BMIM][PF6] and [OMIM][BF4]were used as the extraction solvents, the sedimented volumewas too small for the next step. However, when the IL [HMIM][PF6]was used, a sufficient sediment volume and optimal extractionperformance (enrichment factor was approximately 28) for OTAwere obtained. Thus, the IL [HMIM][PF6] was used for all subse-quent experiments.
3.1.2. Ionic liquid volumeThe IL volume is another important factor that can influence the
occurrence of the cloudy state and that can also determine theenrichment performance because lower volumes generally resultin high enrichment factors. However, insufficient extractant vol-ume may lead to lower analyte recovery. To evaluate the effectof volume, different quantities of [HMIM][PF6] (60, 80, 100, 120and 140 lL) dissolved in 100 lL ethanol were tested using thesame IL-DLLME procedure. As shown in Fig. 1a, the recoveryincreased with the volume of IL up to 100 lL, but above 100 lL,the OTA extraction recovery reached a constant level(77.4–80.1%). However, the enrichment factor decreased whenthe IL solvent volume was increased. A high enrichment factor(47.7) occurred at lower volumes (60 lL), but this volume resultedin poor recovery and IL phase collection difficulties. Consequently,100 lL of [HMIM][PF6] was used as the optimum extraction quan-tity in further studies because a higher recovery was obtained andthe EF was acceptable.
3.1.3. Dispersive solvent selection and volumeIn the DLLME method, the key to disperser solvent selection is
miscibility in both the IL phase (extraction solvent) and the aque-ous sample. Thus, ethanol, which has an appropriate miscibilityand high extraction efficiency for OTA, was selected as thedisperser solvent. Another important reason for the selection ofethanol is that rice wine samples contain ethanol.
The disperser solvent volume has a direct impact on the solubil-ity of ionic liquid in aqueous samples and thus influences theextraction efficiency. To obtain its optimal volume, experimentswere performed using different volumes of ethanol (0.5–1.5 mL).However, variations in the ethanol volume cause changes in thesedimented phase volume; hence, it is impossible to evaluate theinfluence of the ethanol volume on the extraction efficiency. Toachieve a constant sedimented phase volume, the volume of etha-nol and IL [HMIM][PF6] were changed. The different ethanol vol-umes (0.4, 0.65, 0.9, 1.15 and 1. 4 mL) were obtained by diluting
the rice wine samples having 38% alcohol to 8%, 13%, 18%, 23%and 28% alcohol with deionized water, respectively. Accordingly,another 100 lL of ethanol containing 85, 90, 100, 115 and 135 lLof [HMIM][PF6] was added. Under these conditions, the volumeof the sedimented phase was constant at 70 ± 3 lL. The resultsare displayed in Fig. 1b. The enrichment factor increased from14.5 to 35.5 as the ethanol volume was increased from 500 to1500 lL. However, the extraction recovery was initially at a con-stant level (76.0–80.7%) but then decreased when the volume ofethanol increased to 1.0 mL. Thus, 1.0 mL of ethanol was chosenas the optimum volume.
3.1.4. Effect of vortex extraction timeHere, the main role of vortex agitation is to thoroughly disperse
the IL [HMIM][PF6] into the sample solution and to accelerate theabsorption process. A series of time intervals (from 0.5 to 5 min)were tested at 2800 rpm, and the results are illustrated in Fig. 2.The extraction recovery and enrichment factor-time curve clearlyindicates that the OTA recovery and enrichment factor increasedas the extraction time was increased. The highest values werereached at 2 min. After 2 min, the recovery and enrichment factorwere both constant (the recoveries were 77.5%, 77.4% and 77.9%,and the enrichment factors were 27.9, 27.7, and 28.8 at 2, 3, and5 min, respectively). This indicated that the maximum target ana-lyte quantity is extracted into the ionic liquid phase when extrac-tion equilibrium is obtained. Therefore, the vortex extraction timefor this method was set at 2 min.
3.1.5. Effect of salt additionIonic strength, which is examined through the addition of salt,
may enhance the partition of analytes into the extraction solvent,

0
15
30
45
60
75
90
0
5
10
15
20
25
30
35
Rec
over
y (%
)
Enr
ichm
ent f
acto
r
Vortex time (min)
Enrichment factorRecovery
Fig. 2. Effect of the vortex times on the extraction efficiency. Extraction conditions:rice wine sample volume, 5 mL; OTA concentration 4.0 lg L�1; IL [HMIM][PF6]volume, 100 lL; disperser solvent (ethanol) volume, 1 mL.
320 X. Lai et al. / Food Chemistry 161 (2014) 317–322
thereby improving the enrichment performance (Liu et al., 2009;Zhang et al., 2012). To investigate the salt addition effect on theIL-DLLME performance, different concentrations of sodium chlo-ride (from 0% to 5%) were added to the fortified rice wine samples.As shown in Fig. 3a, the OTA recovery decreased when the NaClconcentration increased. However, the enrichment factor increasedwhen the NaCl concentration increased. The salt addition couldenhance the solubility of the ionic liquid in the rice wines. The sed-imented phase volume decreased from 70 ± 3 to 50 ± 4 lL whenthe NaCl concentration increased from 0% to 5%. Therefore, no saltwas added during the IL-DLLME procedure.
0
15
30
45
60
75
90
0
5
10
15
20
25
30
35
40
Rec
over
y (%
)
Enr
ichm
ent f
acto
r
Salt addtion (% NaCl)
Enrichment factorRecovery
a
0
15
30
45
60
75
90
0
10
20
30
40
50
Rec
over
y (%
)
Enr
ichm
ent f
acto
r
pH
Enrichment factorRecovery
b
Fig. 3. Effect of the salt addition (a) and pH (b) on the extraction efficiency.Extraction conditions: rice wine sample volume, 5 mL; OTA concentration4.0 lg L�1; IL [HMIM][PF6] volume, 100 lL; the disperser solvent (ethanol) volume,1 mL; Vortex times, 2 min.
3.1.6. Effect of pHThe effect of pH on the IL-DLLME extraction efficiency was
determined over the pH range of 2.0–8.0 by adding 1.0 M HCl intothe rice wine samples while maintaining the other parametersconstant. The results (Fig. 3b) show that the highest OTA recoverywas obtained when the pH was 3.0, but the recovery decreased at apH > 3.0. This suggests that the addition of acid may have a favour-able effect on the OTA extraction efficiency. Thus, a pH of 3.0 wasselected for further experiments.
Based on the previous results, the following optimal conditionswere used in this new IL-DLLME method: 100 lL [HMIM][PF6],1.0 mL ethanol used as the disperser solvent, a vortex time of2 min, a pH for the rice wines samples at approximately 3.0, andno added salt.
3.2. Method validation
Using the optimal conditions, the limits of detection and quan-tification, the correlation coefficient, the linear range and theenrichment factor were investigated to validate the IL-DLLMEmethod. The matrix-matched calibration curve was obtained usingrice wine samples spiked with the following OTA concentrations:0.1, 0.5, 1, 2.5, 5 and 10 lg L�1. After treatment by IL-DLLME, theseconcentrations yielded OTA concentrations in the final extracts of3.3, 14.0, 28.3, 67.0, 141.4, and 278.0 lg L�1, respectively. Eachconcentration level was prepared in triplicate. The calibrationcurve displayed a good linear relationship between the peak areasand OTA concentrations. The calibration curve equation wasy = 0.381x + 0.0038 with a regression coefficient of (R2) = 0.9998.
The limit of detection (LOD) and the limit of quantification(LOQ) of the developed method were 0.04 lg L�1 (3 � S/N) and0.1 lg L�1 (10 � S/N), respectively. As shown, the sensitivity ofthe method allows OTA quantification at concentrations muchlower than the maximum level (2 lg L�1) established for winesamples (European Commission, 2006a).
3.3. Analysis of Chinese rice wines samples
To determine the applicability of the proposed method, 10 dif-ferent Chinese rice wines brands that were collected from the localstores and supermarket in Guangzhou city, Guangdong province,China, were subjected to the IL-DLLME procedure. The resultsshowed that OTA was detected in only one sample, but the OTAconcentration was 0.107 lg L�1, which demonstrated that OTA inChinese rice wines is particularly low, reference to MRLs of OTAin red wines regulated by the UC (European Commission, 2006a).Two rice wine brands were then spiked with OTA at concentrationlevels of 0.5, 2 and 4 lg L�1 and subjected to the entire optimizedanalytical procedure. The results of the recovery and precision (asrelative standard deviation, RSD) experiments (n = 6, independentanalysis) are reported in Table 1. As shown, the spiked recoverieswere between 75.9% and 82.1%, and the RSD values were between2.7% and 10.4%. Very good recoveries were obtained and areconsistent with current legislation, which establishes that the
Table 1Data about the recovery assay to the whole method for two Chinese rice wine brands(Kejia and Ganzhu). Each level was prepared by two triplicate (n = 6).
Spiked level Kejia (45% vol.)a Ganzhu (28% vol.)
Level 1 (0.5 lg L�1) Recovery (%) 82.1 75.9RSD (%) 10.4 7.3
Level 2 (2.0 lg L�1) Recovery (%) 82.1 76.0RSD (%) 5.4 6.9
Level 3 (4.0 lg L�1) Recovery (%) 80.2 79.4RSD (%) 3.4 2.7
a Mean the percentage of alcohol in rice wine sample.
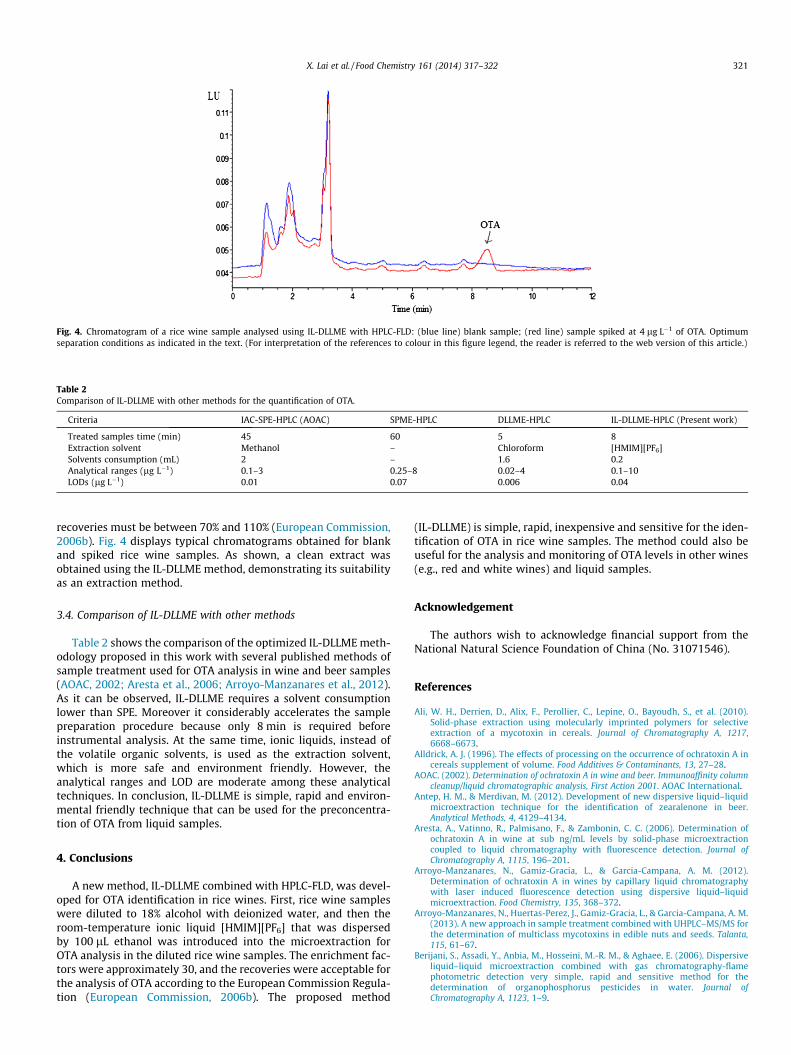
Fig. 4. Chromatogram of a rice wine sample analysed using IL-DLLME with HPLC-FLD: (blue line) blank sample; (red line) sample spiked at 4 lg L�1 of OTA. Optimumseparation conditions as indicated in the text. (For interpretation of the references to colour in this figure legend, the reader is referred to the web version of this article.)
Table 2Comparison of IL-DLLME with other methods for the quantification of OTA.
Criteria IAC-SPE-HPLC (AOAC) SPME-HPLC DLLME-HPLC IL-DLLME-HPLC (Present work)
Treated samples time (min) 45 60 5 8Extraction solvent Methanol – Chloroform [HMIM][PF6]Solvents consumption (mL) 2 – 1.6 0.2Analytical ranges (lg L�1) 0.1–3 0.25–8 0.02–4 0.1–10LODs (lg L�1) 0.01 0.07 0.006 0.04
X. Lai et al. / Food Chemistry 161 (2014) 317–322 321
recoveries must be between 70% and 110% (European Commission,2006b). Fig. 4 displays typical chromatograms obtained for blankand spiked rice wine samples. As shown, a clean extract wasobtained using the IL-DLLME method, demonstrating its suitabilityas an extraction method.
3.4. Comparison of IL-DLLME with other methods
Table 2 shows the comparison of the optimized IL-DLLME meth-odology proposed in this work with several published methods ofsample treatment used for OTA analysis in wine and beer samples(AOAC, 2002; Aresta et al., 2006; Arroyo-Manzanares et al., 2012).As it can be observed, IL-DLLME requires a solvent consumptionlower than SPE. Moreover it considerably accelerates the samplepreparation procedure because only 8 min is required beforeinstrumental analysis. At the same time, ionic liquids, instead ofthe volatile organic solvents, is used as the extraction solvent,which is more safe and environment friendly. However, theanalytical ranges and LOD are moderate among these analyticaltechniques. In conclusion, IL-DLLME is simple, rapid and environ-mental friendly technique that can be used for the preconcentra-tion of OTA from liquid samples.
4. Conclusions
A new method, IL-DLLME combined with HPLC-FLD, was devel-oped for OTA identification in rice wines. First, rice wine sampleswere diluted to 18% alcohol with deionized water, and then theroom-temperature ionic liquid [HMIM][PF6] that was dispersedby 100 lL ethanol was introduced into the microextraction forOTA analysis in the diluted rice wine samples. The enrichment fac-tors were approximately 30, and the recoveries were acceptable forthe analysis of OTA according to the European Commission Regula-tion (European Commission, 2006b). The proposed method
(IL-DLLME) is simple, rapid, inexpensive and sensitive for the iden-tification of OTA in rice wine samples. The method could also beuseful for the analysis and monitoring of OTA levels in other wines(e.g., red and white wines) and liquid samples.
Acknowledgement
The authors wish to acknowledge financial support from theNational Natural Science Foundation of China (No. 31071546).
References
Ali, W. H., Derrien, D., Alix, F., Perollier, C., Lepine, O., Bayoudh, S., et al. (2010).Solid-phase extraction using molecularly imprinted polymers for selectiveextraction of a mycotoxin in cereals. Journal of Chromatography A, 1217,6668–6673.
Alldrick, A. J. (1996). The effects of processing on the occurrence of ochratoxin A incereals supplement of volume. Food Additives & Contaminants, 13, 27–28.
AOAC. (2002). Determination of ochratoxin A in wine and beer. Immunoaffinity columncleanup/liquid chromatographic analysis, First Action 2001. AOAC International.
Antep, H. M., & Merdivan, M. (2012). Development of new dispersive liquid–liquidmicroextraction technique for the identification of zearalenone in beer.Analytical Methods, 4, 4129–4134.
Aresta, A., Vatinno, R., Palmisano, F., & Zambonin, C. C. (2006). Determination ofochratoxin A in wine at sub ng/mL levels by solid-phase microextractioncoupled to liquid chromatography with fluorescence detection. Journal ofChromatography A, 1115, 196–201.
Arroyo-Manzanares, N., Gamiz-Gracia, L., & Garcia-Campana, A. M. (2012).Determination of ochratoxin A in wines by capillary liquid chromatographywith laser induced fluorescence detection using dispersive liquid–liquidmicroextraction. Food Chemistry, 135, 368–372.
Arroyo-Manzanares, N., Huertas-Perez, J., Gamiz-Gracia, L., & Garcia-Campana, A. M.(2013). A new approach in sample treatment combined with UHPLC–MS/MS forthe determination of multiclass mycotoxins in edible nuts and seeds. Talanta,115, 61–67.
Berijani, S., Assadi, Y., Anbia, M., Hosseini, M.-R. M., & Aghaee, E. (2006). Dispersiveliquid–liquid microextraction combined with gas chromatography-flamephotometric detection very simple, rapid and sensitive method for thedetermination of organophosphorus pesticides in water. Journal ofChromatography A, 1123, 1–9.
322 X. Lai et al. / Food Chemistry 161 (2014) 317–322
Bircan, C. (2009). Incidence of ochratoxin A in dried fruits and co-occurrence withaflatoxins in dried figs. Food and Chemical Toxicology, 47, 1996–2001.
Campone, L., Piccinelli, A. L., Celano, R., & Rastrelli, L. (2011). Application ofdispersive liquid–liquid microextraction for the determination of aflatoxins B1,B2, G1 and G2 in cereal products. Journal of Chromatography A, 1218, 7648–7654.
Campone, L., Piccinelli, A. L., & Rastrelli, L. (2011). Dispersive liquid–liquidmicroextraction combined with high-performance liquid chromatography–tandem mass spectrometry for the identification and the accuratequantification by isotope dilution assay of ochratoxin A in wine samples.Analytical and Bioanalytical Chemistry, 399, 1279–1286.
Capriotti, A. L., Cavaliere, C., Giansanti, P., Gubbiotti, R., Samperi, R., & Lagana, A.(2010). Recent developments in matrix solid-phase dispersion extraction.Journal of Chromatography A, 1217, 2521–2532.
De Magalhaes, J. T., Sodre, G. A., Viscogliosi, H., & Grenier-Loustalot, M.-F. (2011).Occurrence of ochratoxin A in Brazilian cocoa beans. Food Control, 22, 744–748.
European Commission. (2006a). Commission Regulation (EC) No. 1881/2006 of 19December 2006 setting maximum levels for certain contaminants in foodstuffs.Official Journal of the European Union L, 364, 5–24.
European Commission. (2006b). Commission Regulation (EC) No. 401/2006 of 23February 2006. Laying down the methods of sampling and analysis for theofficial control of the levels of mycotoxins in foodstuffs. Official Journal of theEuropean Union L, 70, 12–34.
Duarte, S. C., Pena, A., & Lino, C. M. (2010). A review on ochratoxin A occurrence andeffects of processing of cereal and cereal derived food products. FoodMicrobiology, 27, 187–198.
IARC. (1993). Some naturally occurring substances: Items and constituents heterocyclicaromatic amines and mycotoxins. Monographs on the evaluation of carcinogenicrisks to humans (Vol. 56). Lyon: International Agency for Research on Cancer.
Ertan, A., & Mustafa, B. (2009). Ochratoxin A in wines. Food Reviews International, 16,214–232.
Gonzalez-Osnaya, L., Soriano, J. M., Molto, J. C., & Manes, J. (2008). Simple liquidchromatography assay for analyzing ochratoxin A in bovine milk. FoodChemistry, 108, 272–276.
Liu, Y., Zhao, E. C., Zhu, W. T., Gao, H. X., & Zhou, Z. Q. (2009). Determination of fourheterocyclic insecticides by ionic liquid dispersive liquid–liquidmicroextraction in water samples. Journal of Chromatography A, 1216, 885–891.
Reinsch, M., Topfer, A., Lehmann, A., Nehls, I., & Panne, U. (2007). Determination ofochratoxin A in beer by LC–MS/MS ion trap detection. Food Chemistry, 100,312–317.
Santos, L., Marin, S., Sanchis, V., & Ramos, A. J. (2010). Co-occurrence of aflatoxins,ochratoxin A and zearalenone in Capsicum powder samples available on theSpanish market. Food Chemistry, 122, 826–830.
Shen, F., Ying, Y., Li, B., Zheng, Y., & Qing, Z. G. (2011). Multivariate classification ofrice wines according to ageing time and brand based on amino acid profiles.Food Chemistry, 129, 565–569.
Sun, P., & Armstrong, D. W. (2010). Ionic liquids in analytical chemistry. AnalyticaChimica Acta, 661, 1–16.
Turner, N. W., Subrahmanyam, S., & Piletsky, S. A. (2009). Analytical methods fordetermination of mycotoxins: A review. Analytica Chimica Acta, 632, 168–180.
Valero, A., Marin, S., Ramos, A. J., & Sanchis, V. (2008). Survey: Ochratoxin A inEuropean special wines. Food Chemistry, 108, 593–599.
Victor-Ortega, M. D., Lara, F. J., Garcia-Campana, A. M., & Olmo-Iruela, M. D. (2013).Evaluation of dispersive liquid–liquid microextraction for the determination ofpatulin in apple juices using micellar electrokinetic capillary chromatography.Food Control, 31, 353–358.
Wu, H., Guo, J. B., Du, L. M., Tian, H., Hao, C. X., Wang, Z. F., et al. (2013). A rapidshaking-based ionic liquid dispersive liquid phase microextraction for thesimultaneous determination of six synthetic food colourants in soft drinks,sugar- and gelatin-based confectionery by high-performance liquidchromatography. Food Chemistry, 141, 182–186.
Zgloa-Grzeskowiak, A., & Grzeskowiak, T. (2011). Dispersive liquid–liquidmicroextraction. Trends in Analytical Chemistry, 30, 1382–1399.
Zhang, J. H., Li, M., Yang, M. Y., Peng, B., Li, Y. B., Zhou, W. F., et al. (2012). Magneticretrieval of ionic liquids: Fast dispersive liquid–liquid microextraction for thedetermination of benzoylurea insecticides in environmental water. Journal ofChromatography A, 1254, 23–29.