epa method 552.3 - determination of haloacetic acids and ... · liquid-liquid microextraction,...
TRANSCRIPT

METHOD 552.3 DETERMINATION OF HALOACETIC ACIDS AND DALAPON IN
DRINKING WATER BY LIQUID-LIQUID MICROEXTRACTION,
DERIVATIZATION, AND GAS CHROMATOGRAPHY WITH
ELECTRON CAPTURE DETECTION
EPA 815-B-03-002
Revision 1.0
July 2003
M. M. Domino and B.V. Pepich (Shaw Environmental and Infrastructure, Inc.)
D.J. Munch and P.S. Fair (US EPA, Office of Ground Water and Drinking Water)
Y. Xie (Penn State University)
D.J. Munch, J.W. Munch (US EPA, Office of Ground Water and Drinking Water) and A. M. Pawlecki-
Vonderheide (ICI) Method 552.2, Revision 1.0 (1995)
J.W. Hodgeson (USEPA), D. Becker (Technology Applications, Inc.) Method 552.1, (1992)
J.W. Hodgeson (USEPA), J. Collins and R. E. Barth (Technology Applications, Inc.) Method 552.0,
(1990)
TECHNICAL SUPPORT CENTER
OFFICE OF GROUND WATER AND DRINKING WATER
U. S. ENVIRONMENTAL PROTECTION AGENCY
CINCINNATI, OHIO 45268
552.3-1

METHOD 552.3
DETERMINATION OF HALOACETIC ACIDS AND DALAPON IN DRINKING WATER BY
LIQUID-LIQUID MICROEXTRACTION, DERIVATIZATION, AND GAS
CHROMATOGRAPHY WITH ELECTRON CAPTURE DETECTION
1. SCOPE AND APPLICATION
1.1 This is a gas chromatography (GC) method for the determination of haloacetic acids and
dalapon in drinking waters. Accuracy, precision, and Detection Limit (DL) data are
presented for the following compounds in reagent water and finished ground and surface
waters.
Analyte
Bromochloroacetic acid (BCAA)
Bromodichloroacetic acid (BDCAA)
Chlorodibromoacetic acid (CDBAA)
Dalapon
Dibromoacetic acid (DBAA)
Dichloroacetic acid (DCAA)
Monobromoacetic acid (MBAA)
Monochloroacetic acid (MCAA)
Tribromoacetic acid (TBAA)
Trichloroacetic acid (TCAA)
Chemical Abstracts Service(CAS)
Registry Number
5589-96-8
71133-14-7
5278-95-5
75-99-0
631-64-1
79-43-6
79-08-3
79-11-8
75-96-7
76-03-9
1.2 Detection Limits are compound, instrument, and matrix dependent. The DL is defined as
the statistically calculated minimum amount that can be measured with 99% confidence
that the reported value is greater than zero.(1) Detection Limits for the above listed
analytes are provided in Section 17, Table 5. The DL differs from, and is lower than, the
Minimum Reporting Level (MRL) (Sect. 3.17). The concentration range for target
552.3-2

analytes in this method was evaluated between 0.5 µg/L and 30 µg/L for a 40-mL sample.
Precision and accuracy data are presented in Section 17, Tables 6-11.
1.3 This method is restricted to use by or under the supervision of analysts skilled in liquid-
liquid extractions, derivatization procedures and the use of GC and interpretation of gas
chromatograms.
2. SUMMARY OF METHOD
2.1 A 40-mL volume of sample is adjusted to a pH of 0.5 or less and extracted with 4 mL of either
methyl tert-butyl ether (MTBE) or tert-amyl methyl ether (TAME) containing an internal
standard. The haloacetic acids that have been partitioned into the organic phase are then
converted to their methyl esters by the addition of acidic methanol followed by heating for 2
hours. The solvent phase containing the methylated haloacetic acids is separated from the acidic
methanol by adding 7 mL of a concentrated aqueous solution of sodium sulfate. The aqueous
phase is discarded. The extract is then neutralized with a saturated solution of sodium
bicarbonate and the solvent layer is removed for analysis. The target analytes are identified and
quantified by capillary column gas chromatography using an electron capture detector
(GC/ECD). Analytes are quantified using procedural standard calibration.
3. DEFINITIONS
3.1 EXTRACTION BATCH – A set of up to 20 Field Samples (not including calibration
standards and QC samples) extracted together by the same person(s) during a work day
using the same lots of solvents, surrogate solution, and fortifying solutions. Required QC
samples include a Laboratory Reagent Blank, Laboratory Fortified Matrix, either a Field
Duplicate or Laboratory Fortified Matrix Duplicate and an appropriate number of
Continuing Calibration Checks.
3.2 ANALYSIS BATCH – A set of samples that is analyzed on the same instrument during a
24-hour period that begins and ends with the analysis of the appropriate Continuing
Calibration Check standards (CCC). Additional CCCs may be required depending on the
length of the analysis batch and/or the number of Field Samples.
552.3-3

3.3 INTERNAL STANDARD (IS) – A pure analyte added to an extract or standard solution
in a known amount and used to measure the relative responses of other method analytes
and surrogates. The internal standard must be an analyte that is not a sample component.
3.4 SURROGATE ANALYTE (SUR) – A pure analyte, which chemically resembles target
analytes and is extremely unlikely to be found in any sample. This analyte is added to a
sample aliquot in a known amount before extraction or other processing, and is measured
with the same procedures used to measure other sample components. The purpose of the
SUR is to monitor method performance with each sample.
3.5 LABORATORY REAGENT BLANK (LRB) – An aliquot of reagent water or other
blank matrix that is treated exactly as a sample including exposure to all glassware,
equipment, solvents, reagents, sample preservatives, internal standards, and surrogates
that are used in the extraction batch. The LRB is used to determine if method analytes or
other interferences are present in the laboratory environment, the reagents, or the
apparatus.
3.6 LABORATORY FORTIFIED BLANK (LFB) – An aliquot of reagent water or other
blank matrix to which known quantities of the method analytes and all the preservation
compounds are added. The LFB is analyzed exactly like a sample, and its purpose is to
determine whether the methodology is in control, and whether the laboratory is capable of
making accurate and precise measurements.
3.7 LABORATORY FORTIFIED SAMPLE MATRIX (LFSM) – An aliquot of a Field
Sample to which known quantities of the method analytes and all the preservation
compounds are added. The LFSM is processed and analyzed exactly like a sample, and
its purpose is to determine whether the sample matrix contributes bias to the analytical
results. The background concentrations of the analytes in the sample matrix must be
determined in a separate aliquot and the measured values in the LFSM corrected for
background concentrations.
3.8 LABORATORY FORTIFIED SAMPLE MATRIX DUPLICATE (LFSMD) – A second
aliquot of the Field Sample used to prepare the LFSM which is fortified, extracted and
analyzed identically to the LFSM. The LFSMD is used instead of the Field Duplicate to
access method precision and accuracy when the occurrence of a target analyte is
infrequent.
552.3-4

3.9 LABORATORY DUPLICATES (LD1 and LD2) – Two aliquots of the same sample split
in the laboratory and analyzed separately with identical procedures. Analyses of LD1 and
LD2 indicate precision associated with laboratory procedures, but not with sample
collection, preservation, and storage procedures.
3.10 FIELD DUPLICATES (FD1 and FD2) – Two separate samples collected at the same
time and place under identical circumstances, and treated exactly the same throughout
field and laboratory procedures. Analyses of FD1 and FD2 give a measure of the
precision associated with sample collection, preservation, and storage, as well as with
laboratory procedures.
3.11 STOCK STANDARD SOLUTION (SSS) – A concentrated solution containing one or
more method analytes prepared in the laboratory using assayed reference materials or
purchased from a reputable commercial source.
3.12 PRIMARY DILUTION STANDARD (PDS) SOLUTION – A solution containing
method analytes prepared in the laboratory from stock standard solutions and diluted as
needed to prepare calibration solutions and other needed analyte solutions.
3.13 CALIBRATION STANDARD (CAL) – A solution prepared from the primary dilution
standard solution and/or stock standard solutions and the internal standards and surrogate
analytes. The CAL solutions are used to calibrate the instrument response with respect to
analyte concentration.
3.14 CONTINUING CALIBRATION CHECK (CCC) – A calibration standard containing the
method analytes, internal standard(s) and surrogate(s), which is analyzed periodically to
verify the accuracy of the existing calibration for those analytes.
3.15 QUALITY CONTROL SAMPLE (QCS) –A sample prepared using a PDS of method
analytes that is obtained from a source external to the laboratory and different from the
source of calibration standards. The second source PDS and the surrogate PDS are used
to fortify the QCS at a known concentration. The QCS is used to check calibration
standard integrity.
3.16 DETECTION LIMIT – The minimum concentration of an analyte that can be identified,
measured and reported with 99% confidence that the analyte concentration is greater than
zero (Sect. 9.2.4). This is a statistical determination of precision. Accurate quantitation
is not expected at this level.(1)
552.3-5

3.17 MINIMUM REPORTING LEVEL (MRL) – The minimum concentration that can be
reported as a quantified value for a target analyte in a sample following analysis. This
defined concentration can be no lower than the concentration of the lowest continuing
calibration standard for that analyte, and can only be used if acceptable quality control
criteria for this standard are met.
3.18 PROCEDURAL STANDARD CALIBRATION – A calibration method in which
aqueous calibration standards are prepared and processed (e.g., extracted, and/or
derivatized) in exactly the same manner as the samples. All steps in the process from
addition of sampling preservatives through instrumental analyses are included in the
calibration. Using procedural standard calibration compensates for any inefficiencies in
the processing procedure.
3.19 MATERIAL SAFETY DATA SHEET (MSDS) – Written information provided by
vendors concerning a chemical’s toxicity, health hazards, physical properties, fire, and
reactivity data including storage, spill, and handling precautions.
4. INTERFERENCES
4.1 All glassware must be meticulously cleaned. Wash glassware with detergent and tap
water, rinse with tap water followed by reagent water. A final rinse with solvents may be
needed. In place of a solvent rinse, non-volumetric glassware can be muffled at 400 °C
for 2 hours. Volumetric glassware should not be heated in an oven above 120 °C. Store
glassware inverted or capped with aluminum foil.
4.2 Method interferences may be caused by contaminants in solvents, reagents (including
reagent water), sample bottles and caps, and other sample processing hardware that lead
to discrete artifacts and/or elevated baselines in the chromatograms. All items used in the
method must be routinely demonstrated to be free from interferences (less than 1/3 the
MRL for each target) under method conditions by processing and analyzing laboratory
reagent blanks as described in Section 9. Subtracting blank values from sample
results is not permitted.
4.2.1 Sodium sulfate can be a source of method interferences. After screening several
brands, it was found that a grade suitable for pesticide residue analysis had the
lowest amount of method interferants. If the suitability of the available sodium
552.3-6

sulfate is in question, extract and analyze a laboratory reagent blank (Sect. 3.5) to
test for interferences prior to sample processing.
4.2.2 The ester of bromochloroacetic acid (BCAA) coelutes with a low-level interferant
on both the primary and confirmation column. This interferant is present in the
LRB and believed to be dimethyl sulfide that originates in the sodium sulfate.
Because of difference in peak shape, the BCAA ester tends to “ride on” the
interferant allowing accurate quantitation. Concentrations of BCAA at or below
2:g/L may require manual integration of the BCAA.
4.2.3 TAME, which has higher methylation efficiencies for the trihaloacetic acids than
MTBE, is currently only available at 97% purity. Different lots of TAME should
be carefully evaluated for potential interferants. Several lots of TAME contained
an interferant that coeluted with the ester of monochloroacetic acid (MCAA) on
the primary column.
4.3 The esters of the surrogate used in Method 552.2 (2,3-dibromopropanoic acid) and
dichlorobromoacetic acid are not completely resolved under the chromatographic
conditions for the confirmation column listed in Tables 3 and 4. The current surrogate,
2-bromobutanoic acid, is fully resolved from all method compounds on both columns
under the conditions listed in Tables 1-4 (Figs. 1-4).
4.4 Matrix interferences may be caused by contaminants that are extracted from the sample.
The extent of matrix interferences will vary considerably from source to source,
depending upon the water sampled.
4.5 Interferences by phthalate esters can pose a major problem in analysis when using an
electron capture detector (ECD). These compounds generally appear in the chromatogram
as large peaks. Common flexible plastics contain varying amounts of phthalates that are
easily extracted or leached during laboratory operations. Cross contamination of clean
glassware routinely occurs when plastics are handled during extraction steps, especially
when solvent-wetted surfaces are handled. Interferences from phthalates can best be
minimized by avoiding the use of plastics in the laboratory. Exhaustive purification of
reagents and glassware may be required to eliminate background phthalate
contamination.(2,3)
552.3-7

5. SAFETY
5.1 The toxicity or carcinogenicity of each reagent used in this method has not been precisely
defined. Each chemical compound should be treated as a potential health hazard, and
exposure to these chemicals should be minimized. The laboratory is responsible for
maintaining a current awareness file of OSHA regulations regarding the safe handling of
the chemicals specified in this method. A reference file of MSDSs should also be made
available to all personnel involved in the chemical analysis. Additional references to
laboratory safety are available.(4-6)
5.2 Pure standard materials and stock standards of these compounds should be handled with
suitable protection to skin and eyes, and care should be taken not to breathe the vapors or
ingest the materials.
5.3 The toxicities of the extraction solvents, MTBE or TAME, have not been well defined.
Susceptible individuals may experience adverse effects upon skin contact or inhalation of
vapors. Therefore protective clothing and gloves should be used and MTBE or TAME
should be used only in a chemical fume hood or glove box. The same precaution applies
to pure standard materials.
6. EQUIPMENT AND SUPPLIES
6.1 SAMPLE CONTAINERS – Amber glass bottles, at least 50-mL, fitted with PTFE
(polytetrafluoroethylene) lined screw caps.
6.2 EXTRACTION VIALS – 60-mL clear glass vials with PTFE-lined screw caps.
6.3 AUTOSAMPLER VIALS – 2.0-mL amber vials with screw or crimp cap and a PTFE-
faced seal.
6.4 STANDARD SOLUTION STORAGE CONTAINERS – 10- to 20-mL amber glass vials
with PTFE-lined screw caps.
6.5 GRADUATED CONICAL CENTRIFUGE TUBES WITH PTFE-LINED SCREW
CAPS – 15-mL with graduated 1-mL markings (Fisher Cat. #: 05-538-30A or
equivalent).
552.3-8

6.6 PASTEUR PIPETTES – Glass, disposable.
6.7 PIPETTES – Class A, 2.0-, 3.0-, 4.0-, and 7.0-mL glass, or adjustable volume dispensers.
6.8 VOLUMETRIC FLASKS – Class A, suggested sizes include 5-mL, 10-mL, 100-mL.
6.9 MICRO SYRINGES – Various sizes.
6.10 HEATER (BLOCK,or SAND BATH or WATER BATH) – A block heater (Thermolyne
Model DB16525, Fisher Cat. #: 11-716-50 or equivalent) capable of maintaining
regulated, elevated temperature equipped with a sand bath or heating block (Fisher Cat. #:
11-716-27 or equivalent) capable of holding screw cap conical centrifuge tubes in Section
6.5 was used for method development. A thermostated water bath equipped with a
surface layer of small plastic spheres (Fisher Cat. #. 14-220-31 or equivalent) to retard
evaporation and subsequent heating of tube walls may also be used.
6.11 pH PAPER - With a pH range of 0 - 1.5 (Fisher Cat. #. 14-853-55 or equivalent).
6.12 BALANCE – Analytical, capable of weighing to the nearest 0.0001 g.
6.13 VORTEXER – Used to mix sample extracts (VWR Vortex-Genie, Cat. #:14216-184 or
equivalent).
6.14 GAS CHROMATOGRAPH – Capillary GC, with a low volume (150 µL) micro ECD
(Agilent Model 6890 or equivalent). The injector system should not allow analytes to
contact hot stainless steel or other metal surfaces that promote decomposition. The
performance data in Section 17 was collected using hot, splitless injection using a 2-mm
i.d. quartz liner. Other injection techniques such as temperature programmed injection,
cold on-column injection, and large volume injection may be used if the QC criteria of
Sections 9 and 10 are met. Alternate detectors which have equivalent or greater
selectivity for the target compounds may be used.
6.15 AUTOSAMPLER – Agilent Model 7683 or equivalent.
6.16 PRIMARY GC COLUMN – DB-1701, 30-meter length, 0.25-mm i.d., 0.25-µm film,
fused silica capillary with chemically bonded (14%
cyanopropylphenyl-methylpolysiloxane), or equivalent bonded, fused silica column.
552.3-9

6.17 CONFIRMATION GC COLUMN – DB-5.625, 30-meter length, 0.25-mm i.d., 0.25-µm
film, fused silica capillary with chemically bonded (“equivalent to” 5% phenyl
methylpolysiloxane), or equivalent bonded, fused silica column.
7. REAGENTS AND STANDARDS
7.1 REAGENTS AND SOLVENTS – Reagent grade or better chemicals should be used in
all analyses. Unless otherwise indicated, it is intended that all reagents shall conform to
the specifications of the Committee on Analytical Reagents of the American Chemical
Society, where such specifications are available. Other grades may be used, provided it is
first determined that the reagent is of sufficiently high purity to permit its use without
lessening the quality of the determination.
7.1.1 REAGENT WATER – Purified water which does not contain any measurable
quantities of any target analytes or interfering compounds greater than 1/3 the
MRL for each compound of interest.
7.1.2 METHYL tert-BUTYL ETHER (MTBE) – High purity, demonstrated to be free
from analytes and interferences (HPLC grade or better).
7.1.3 Tert-AMYL METHYL ETHER (TAME) – High purity, demonstrated to be free
from analytes and interferences.
7.1.3.1 Currently, TAME is available in > 97% purity. Several manufacturers’
products were evaluated and found to contain a compound that elutes with
MCAA on the primary column. Lots evaluated from Fluka (Riedel-de
Haen), stored over molecular sieves, were free from this interferant.
7.1.4 SODIUM SULFATE, Na2SO4 – Pesticide grade, granular, anhydrous.
Interferences have been observed when lower quality grades have been used. If
interferences are observed, it may be necessary to heat the sodium sulfate in a
shallow tray at 400 °C for up to 4 hr to remove phthalates and other interfering
organic substances. Store in a capped glass bottle rather than a plastic container.
7.1.5 SODIUM BICARBONATE, NaHCO3 – ACS reagent grade.
7.1.6 AMMONIUM CHLORIDE, NH4Cl – ACS reagent grade.
552.3-10

7.1.7 SULFURIC ACID – Concentrated, ACS reagent grade. Substitution of
hydrochloric acid (HCl) is not allowed. Solutions of HCl can contain trace
levels of bromide, which can promote the formation of brominated HAAs.
7.1.8 HELIUM (or HYDROGEN)– 99.999% pure or better, GC carrier gas.
7.1.9 ARGON 95%/METHANE 5% (or NITROGEN) – 99.999% pure or better, ECD
make-up gas.
7.1.10 SODIUM SULFATE SOLUTION – Prepare an aqueous solution of sodium
sulfate in reagent water at a concentration of 150 g/L. Substitution of sodium
chloride is not allowed. Sodium chloride can contain trace levels of bromide,
which can promote the formation of brominated HAAs.
7.1.11 SODIUM BICARBONATE SOLUTION, SATURATED – Add sodium
bicarbonate to a volume of water, mixing periodically until the solution has a
small amount of undissolved sodium bicarbonate that does not disappear upon
further mixing.
7.1.12 10% SULFURIC ACID IN METHANOL SOLUTION – Add 10 mL of sulfuric
acid dropwise (due to heat evolution) to 50-60 mL of methanol contained in a
100-mL volumetric flask that has been placed in a cooling bath. Mix, let cool,
and dilute to the 100-mL mark with methanol.
7.2 STANDARD SOLUTIONS – Standard Solutions may be prepared from certified,
commercially available solutions or from neat compounds. When preparing from neat
material, compound purity needs to be 96% or greater. When a compound purity is
assayed to be 96% or greater, the weight can be used without correction to calculate the
concentration of the stock standard. Solution concentrations listed in this section were
used to develop this method and are included as an example. Standards for sample
fortification generally should be prepared in the smallest volume that can be accurately
measured to minimize the addition of organic solvent to aqueous samples. Laboratories
should use standard QC procedures to determine when Standard Solutions described in
this section need to be replaced.
7.2.1 STANDARD PREPARATION AND STORAGE TECHNIQUES – All Standard
Solutions are prepared from either neat or solid materials following the general
procedure outlined below. This procedure assumes that the standard stock
552.3-11

solutions are prepared in 10-mL volumetric flasks. The procedure should be
scaled accordingly if larger volumetric flasks are used. Most standards in this
method are made up in MTBE, whether the extracting solvent is MTBE or
TAME. This is because MTBE is more water-soluble than TAME.
7.2.1.1 For analytes which are solids in their pure form, prepare stock standard
solutions by accurately weighing the suggested amount (refer to the
sections below for suggested weights) of pure material into a clean, tared
10-mL volumetric flask. Dilute the flask to volume with MTBE and mix
thoroughly.
7.2.1.2 For analytes which are liquid in their pure form at room temperature, place
about 9.8 mL of MTBE into a 10-mL volumetric flask. Allow the flask to
stand, unstoppered, for about 10 minutes to allow solvent film to evaporate
from the inner walls of the volumetric, and weigh to the nearest 0.1 mg.
Using a 10-µL (or gastight) syringe add the desired volume of the neat
standard material to the flask by keeping the syringe needle just above the
surface of the MTBE. Be sure that the standard material falls dropwise
directly into the MTBE without contacting the inner wall of the
volumetric. Record the weight and calculate the concentration of the stock
standard from the net gain in weight. Dilute to volume, stopper, then mix
by inverting the flask several times.
7.2.1.3 Transfer the stock solutions to amber glass vials or amber bottles with
PTFE-lined caps and store at # 0 °C.
7.2.2 INTERNAL STANDARD (IS) SOLUTIONS – 1,2,3-trichloropropane (99+%) is
used as an internal standard for the method. This compound has been shown to be
an effective internal standard for the method analytes, but other compounds may
be used if the QC requirements in Section 9 are met.
7.2.2.1 INTERNAL STANDARD STOCK SOLUTION (2.0 mg/mL) – Prepare
an internal standard stock solution by accurately transferring
approximately 0.0200 g of neat 1,2,3-trichloropropane (weighed to the
nearest 0.1mg) into a 10-mL volumetric flask containing methanol as
described in Section 7.2.1. The resulting concentration of the stock
internal standard solution will be approximately 2.0 mg/mL.
552.3-12

7.2.2.2 INTERNAL STANDARD PRIMARY DILUTION STANDARD
(100µg/mL) – Prepare an internal standard fortification solution at
100µg/mL (or other suitable concentration) by the addition of 500 µL (or
other appropriate volume) of the stock standard to a 10-mL volumetric
flask containing MTBE. Dilute to volume, mix thoroughly and transfer to
an amber glass vial with a PTFE-lined screw cap and store at # 0°C.
7.2.2.3 MTBE (or TAME) EXTRACTION SOLVENT WITH INTERNAL
STANDARD (1.00 µg/mL) – The internal standard 1,2,3-trichloropropane
is added to the extraction solvent prior to analyte extraction to compensate
for any volumetric differences encountered during sample processing.
Have enough working solvent available to extract all calibration standards,
QC samples and field samples in each extraction batch. The volume of
fortified solvent should be determined by the sample workload. Never use
two different lots of working solvent for one extraction batch. The
following example illustrates preparation of 100 mL of fortified solvent.
Add 1 mL of the primary dilution standard (100 µg/mL) to a 100-mL
volumetric flask containing MTBE (or TAME), dilute to volume and mix
thoroughly. Transfer the standard to an amber bottle for storage. This
results in a final internal standard concentration of 1.00 µg/mL. This
solution is used to extract the samples (Sect. 11.1).
7.2.3 SURROGATE (SUR) ANALYTE STANDARD SOLUTION – 2-bromobutanoic
acid (99+%) is used as a surrogate compound in this method to evaluate the
extraction and derivatization procedures. This compound has been shown to be
an effective surrogate for the method analytes and is well resolved from all target
analytes and common interferants on both chromatographic columns. The Method
552.2 surrogate, 2,3-dibromopropanoic acid, can be used with this method, but
requires a longer chromatographic run to separate it from DCBAA (Sect. 4.3).
Other SUR analytes may be used as long as they are halogenated carboxylic acids
and the QC requirements of Section 9.7 are met. All surrogates must be added as
free acids. Alternate candidates should be confirmed to have adequate
esterification efficiencies (e.g. $ 80%) by comparison to a commercially available
premethylated standard. Lower esterification efficiencies may lead to poor SUR
precision.
Note: 2-bromo-2-methylpropanoic acid was ruled out as a potential SUR because
it was found to degrade in the Field and QC Samples if they were not processed
552.3-13

immediately. Nearly 50% of the fortified concentration was lost when samples
were fortified and then allowed to set for 3 hours prior to acidification. Alternate
surrogate compounds MUST be carefully evaluated.
7.2.3.1 SURROGATE STOCK SOLUTION (10 mg/mL) – Prepare surrogate
stock standard solutions of 2-bromobutanoic acid [80-58-0] by accurately
transferring approximately 0.100 g of the neat material (weighed to the
nearest 0.1 mg.) into a clean, tared 10-mL volumetric flask as described in
Section 7.2.1. The resulting concentration of the Surrogate Stock Solution
will be approximately 10 mg/mL.
7.2.3.2 SURROGATE PRIMARY DILUTION STANDARD (20 µg/mL) –
Prepare a primary dilution standard (PDS) at a concentration of 20 µg/mL
(or other suitable concentration) by adding 50 µL (or suitable volume) of
the SUR stock standard to a 25-mL volumetric flask containing MTBE.
Dilute the flask to volume, and mix thoroughly. Transfer the SUR PDS to
an amber glass vial with a PTFE-lined screw cap and store at # 0 °C.
Addition of 20 µL of the primary dilution standard to the 40-mL aqueous
sample results in a surrogate concentration of 10 ng/mL.
7.2.4 ANALYTE STANDARD SOLUTIONS – Obtain the analytes listed in the table
in Section 1.1 as neat or solid free acid standards or as commercially prepared
ampulized solutions from a reputable standard manufacturer. The use of
premethylated standards is not allowed for the preparation of analyte standards.
Prepare the Analyte Stock and Primary Dilution Standards as described below.
7.2.4.1 ANALYTE STOCK SOLUTION – Prepare separate stock standard
solutions for each analyte of interest at a concentration of 1-5 mg/mL in
MTBE. Method analytes are available as neat materials or ampulized
solutions (> 99% purity) from a number of commercial suppliers.
7.2.4.1.1 For analytes which are solids in their pure form, prepare stock
standard solutions by accurately weighing approximately 0.01
to 0.05 grams of pure material in a 10-mL volumetric flask
using the technique described in Section 7.2.1.1.
552.3-14

7.2.4.1.2 For analytes which are liquid in their pure form at room
temperature, add 10.0 µL of standard material to the flask using
the technique described in Section 7.2.1.2.
7.2.4.2 ANALYTE PRIMARY DILUTION STANDARD (PDS)– Prepare the
Analyte PDS solution by combining and diluting the Analyte Stock
Solutions prepared above (Sect. 7.2.4.1) with MTBE. This solution will
be used to prepare the Analyte Secondary Dilution Standard. As a
guideline to the analyst, the concentration used in the primary dilution
standard solution during method development was 100 µg/mL for all ten
analytes.
7.2.4.3ANALYTE SECONDARY DILUTION STANDARD (SDS)– The Analyte
SDS is used to fortify reagent water for calibration standards. Prepare at
least one Analyte SDS by diluting the Analyte PDS with methanol. Two
Analyte SDSs were used during method development. The first was
prepared at a concentration of 5.00 µg/mL (1/20 dilution of the Analyte
PDS) and the second at a concentration of 16.7 µg/L (1/6 dilution of the
Analyte PDS). The SDS should be made daily. It should not be stored,
since methanol will derivatize the acids that it contains. The lowest
calibration standard concentration must be at or below the MRL of each
analyte. The concentrations of the other standards should span the range of
concentration expected in the Field Samples or the working range of the
instrument.
7.2.5 CALIBRATION STANDARDS – At least 5 calibration standards are required to
prepare the initial calibration curve (Sect. 10.2). Fortify an appropriate number of
reagent water solutions with varying amounts of the Analyte PDS over the
concentration range of interest. During method development, the Calibration
Standards typically ranged from 1.0 µg/L to 20 µg/L. The lowest standard must
be at or below the MRL, which will depend upon instrument sensitivity. Because
this method employs a procedural calibration technique , these standards must be
treated like samples and require the addition of all preservation and other
reagents. They are extracted by the procedure described in Section 11.
552.3-15

8. SAMPLE COLLECTION, PRESERVATION, AND STORAGE
8.1 SAMPLE BOTTLE PREPARATION
8.1.1 Grab samples must be collected in accordance with conventional sampling
practices(7) using amber glass containers with PTFE-lined screw caps and
capacities of at least 50 mL.
8.1.2 Prior to shipment to the field, add crystalline or granular ammonium chloride
(NH4Cl) to the sample containers to produce a concentration of 100 mg/L in the
Field Sample. For a typical 50-mL sample, this requires 5 mg of ammonium
chloride.
Note: Enough ammonium chloride must be added to the sample to convert the
free chlorine residual in the sample matrix to combined chlorine. Chloramines,
formed by the reaction of hypochlorite with the ammonium ion, do not react
further to produce additional haloacetic acids at significant concentrations and
protect against microbiological degradation.(8) This concentration of ammonium
chloride was determined to convert 8 mg/L of free chlorine residual to combined
chlorine.
8.2. SAMPLE COLLECTION
8.2.1 Fill sample bottles but take care not to flush out the ammonium chloride. Because
the target analytes of this method are not volatile, it is not necessary to ensure that
the sample bottles are completely headspace free.
8.2.2 When sampling from a water tap, remove the aerator. Open the tap and allow the
system to flush until the water temperature has stabilized (usually about 3-5
minutes). Collect samples from the flowing system.
8.2.3 When sampling from an open body of water, fill a 1-quart wide-mouth bottle or
1 liter beaker with sample from a representative area, and carefully fill sample
vials from the container.
8.2.4 After collecting the sample, seal the bottle and agitate by hand for 15 seconds.
552.3-16

8.3 SAMPLE SHIPMENT AND STORAGE – All samples must be chilled during shipment
and must not exceed 10 °C during the first 48 hours after collection. Samples must be
confirmed to be at or below 10 °C when they are received at the laboratory. Samples
stored in the lab must be held at or below 6 °C and protected from light until extraction.
Samples should not be frozen.
8.4 SAMPLE AND EXTRACT HOLDING TIMES – Chlorinated Field Samples that are
preserved according to the method should not exhibit biological degradation of analytes
during the allotted 14-day storage time. Samples must be extracted within 14 days.
Unchlorinated Field Samples should be extracted as soon as possible to prevent
biological degradation of analytes. Extracts must be stored at # -10 °C or less and
protected from light in glass vials with PTFE-lined caps. MTBE extracts must be
analyzed within 21 days of extraction. TAME extracts must be analyzed within 28 days
of extraction.
8.4.1 The brominated trihaloacetic acids can exhibit degradation during storage.
Tribromoacetic acid (TBAA), the least stable HAA ester, is degraded to
bromoform. This is thought to occur as a result of peroxide contamination in the
solvent. Low concentrations of peroxides that were barely detectable with the
commercially available peroxide test strips were found to generate significant
levels of bromoform in standard solutions. Bromoform can be chromatographed
under method conditions (see Tables 1-4), and can be monitored as an indication
of high peroxide levels in the solvent. If large bromoform peaks are observed in
HAA-fortified reagent water samples (or calibration standards), the ether solvent
should be purified or replaced. Storing these solvents under nitrogen minimizes
peroxide formation.
8.4.2 Extracts that were prepared using the TAME procedure showed much lower
tendency to form bromoform during the method development studies. This is
thought to be associated with lower levels of peroxides. This may be due to
TAME being stored over molecular sieves (Sect. 7.1.3).
9. QUALITY CONTROL
9.1 Each laboratory using this method is required to operate a formal Quality Control (QC)
program. The requirements of this program consist of an Initial Demonstration of
Capability (IDC) , and subsequent analysis in each analysis batch of a Laboratory
552.3-17
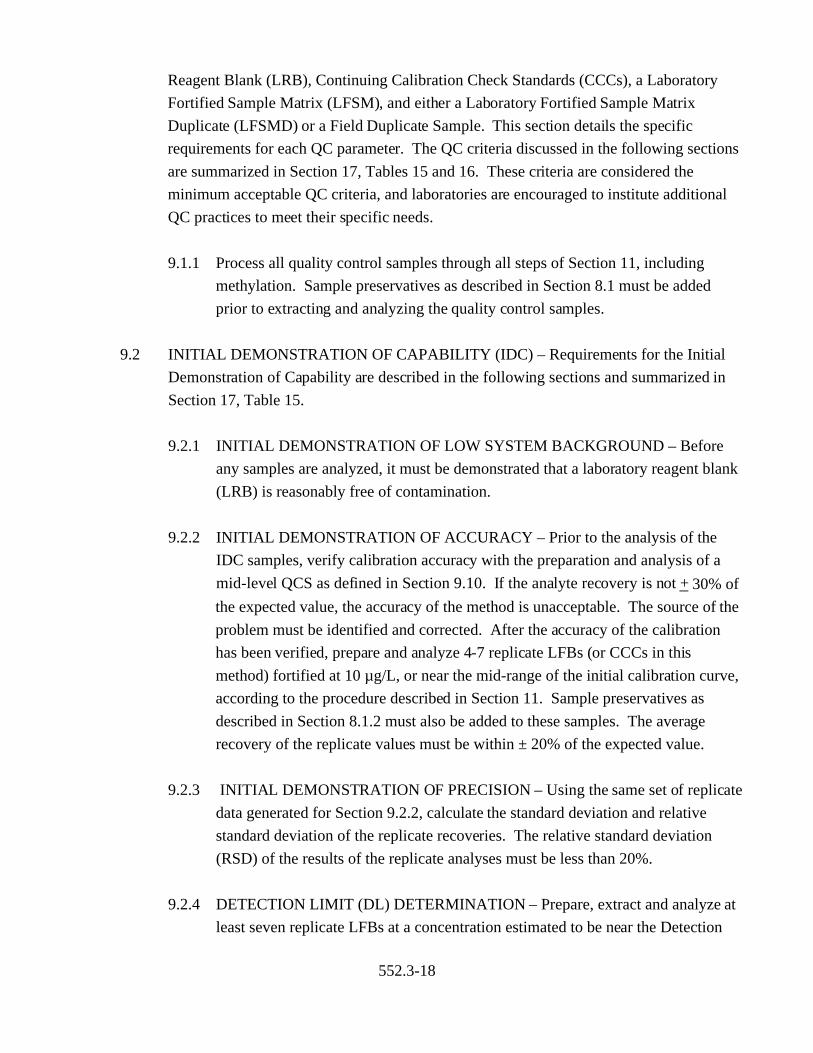
Reagent Blank (LRB), Continuing Calibration Check Standards (CCCs), a Laboratory
Fortified Sample Matrix (LFSM), and either a Laboratory Fortified Sample Matrix
Duplicate (LFSMD) or a Field Duplicate Sample. This section details the specific
requirements for each QC parameter. The QC criteria discussed in the following sections
are summarized in Section 17, Tables 15 and 16. These criteria are considered the
minimum acceptable QC criteria, and laboratories are encouraged to institute additional
QC practices to meet their specific needs.
9.1.1 Process all quality control samples through all steps of Section 11, including
methylation. Sample preservatives as described in Section 8.1 must be added
prior to extracting and analyzing the quality control samples.
9.2 INITIAL DEMONSTRATION OF CAPABILITY (IDC) – Requirements for the Initial
Demonstration of Capability are described in the following sections and summarized in
Section 17, Table 15.
9.2.1 INITIAL DEMONSTRATION OF LOW SYSTEM BACKGROUND – Before
any samples are analyzed, it must be demonstrated that a laboratory reagent blank
(LRB) is reasonably free of contamination.
9.2.2 INITIAL DEMONSTRATION OF ACCURACY – Prior to the analysis of the
IDC samples, verify calibration accuracy with the preparation and analysis of a
mid-level QCS as defined in Section 9.10. If the analyte recovery is not + 30% of
the expected value, the accuracy of the method is unacceptable. The source of the
problem must be identified and corrected. After the accuracy of the calibration
has been verified, prepare and analyze 4-7 replicate LFBs (or CCCs in this
method) fortified at 10 µg/L, or near the mid-range of the initial calibration curve,
according to the procedure described in Section 11. Sample preservatives as
described in Section 8.1.2 must also be added to these samples. The average
recovery of the replicate values must be within ± 20% of the expected value.
9.2.3 INITIAL DEMONSTRATION OF PRECISION – Using the same set of replicate
data generated for Section 9.2.2, calculate the standard deviation and relative
standard deviation of the replicate recoveries. The relative standard deviation
(RSD) of the results of the replicate analyses must be less than 20%.
9.2.4 DETECTION LIMIT (DL) DETERMINATION – Prepare, extract and analyze at
least seven replicate LFBs at a concentration estimated to be near the Detection
552.3-18

Limit over a period of at least three days (both extraction and analysis should be
conducted over at least three days) using the procedure described in Section 11.
The fortification level may be estimated by selecting a concentration with a signal
of 2 to 5 times the noise level. The appropriate concentration will be dependent
upon the sensitivity of the GC/ECD system being used. Sample preservatives as
described in Section 8.1.2 must be added to these samples. Calculate the
Detection Limit using the equation
DL = St(n - 1, 1 -" = 0.99)
where
t(n - 1, 1 - " = 0.99) = Students t value for the 99% confidence level with n-1
degrees of freedom ( 3.143 for 7 replicates)
n = number of replicates, and
S = standard deviation of the replicate analyses.
NOTE: Do not subtract blank values when performing DL calculations. The DL
is a statistical determination of precision only.(1) If the DL replicates are fortified
at a low enough concentration, it is likely that they will not meet precision and
accuracy criteria, and may result in a calculated DL that is higher than the fortified
concentration. Therefore no precision and accuracy criteria are specified for the
DL.
9.2.5 Minimum Reporting Level (MRL) – The MRL is the threshold concentration of
an analyte that a laboratory can expect to accurately quantitate in an unknown
sample. The MRL should be established at an analyte concentration that is at
least 3 times the DL or at a concentration which would yield a signal-to-noise
(S/N) ratio of greater than or equal to five. Depending upon the study’s data
quality objectives it may be set at a higher concentration. The concentration of
the lowest calibration standard must be at or below the MRL.
9.2.6 METHOD MODIFICATIONS – The analyst is permitted to modify GC columns,
GC conditions (see Tables 1-4), and internal standards (see Sect. 7.2.2) or
surrogate standards (see Sect. 7.2.3). Other detectors (see Sect. 6.14) may be used
if they have equivalent or better selectivity and have sufficient sensitivity. Each
time such method modifications are made, the analyst must repeat the procedures
of the IDC (Sect. 9.2).
552.3-19

9.3 LABORATORY REAGENT BLANK (LRB) – An LRB is required with each extraction
batch (Sect. 3.1) of samples to determine the background system contamination. If the
LRB produces a peak within the retention time window of any analyte that would prevent
the determination of that analyte, determine the source of contamination and eliminate the
interference before processing samples. Background contamination must be reduced to
an acceptable level before proceeding. Background from method analytes or
contaminants that interfere with the measurement of method analytes must be below 1/3
of the MRL. If the target analytes are detected in the LRB at concentrations equal to or
greater than this level, then all data for the problem analyte(s) must be considered invalid
for all samples in the extraction batch.
9.4 CONTINUING CALIBRATION CHECK (CCC) – CCC Standards are prepared in the
same extraction batch as the samples of interest. They must contain all compounds of
interest, and they are extracted in the same manner as the Field Samples and calibration
solutions used to prepare the initial calibration curve. Calibration checks, prepared with
the samples being analyzed, are required at the beginning of each analysis batch, after
every ten samples, and at the end of the analysis batch. See Section 10.3 for
concentration requirements, frequency requirements, and acceptance criteria.
9.5 LABORATORY FORTIFIED BLANK (LFB) – Since this method utilizes procedural
calibration standards, which are fortified reagent waters, there is no difference between
the LFB and the continuing calibration check standard. Consequently, the analysis of an
LFB is not required; however, the acronym LFB is used for clarity in the IDC.
9.6 INTERNAL STANDARDS (IS) – The analyst must monitor the peak area of each
internal standard in all injections during each analysis day. The IS response (as indicated
by peak area) for any chromatographic run must not deviate by more than ± 50% from the
average area measured during the initial calibration for that IS. A poor injection could
cause the IS area to exceed these criteria. Inject a second aliquot of the suspect extract to
determine whether the failure is due to poor injection or instrument response drift.
9.6.1 If the reinjected aliquot produces an acceptable internal standard response, report
results for that aliquot.
9.6.2 If the internal standard area for the reinjected extract deviates greater than 50%
from the initial calibration average, the analyst should check the continuing
calibration check standards that ran before and after the sample. If the continuing
calibration check fails the criteria of Section 10.3, recalibration is in order per
552.3-20

Section 10. If the calibration standard is acceptable, extraction of the sample
should be repeated provided the sample is still within holding time. Otherwise,
report results obtained from the reinjected extract, but annotate as suspect.
9.7 SURROGATE RECOVERY – The surrogate standard is fortified into the aqueous
portion of all samples, LRBs, CCCs, LFSMs, and LFSMDs prior to extraction. It is also
added to the calibration standards. The surrogate is a means of assessing method
performance from extraction to final chromatographic measurement. Calculate the
recovery (R) for the surrogate using the equation
where
A = calculated surrogate concentration for the QC or Field Sample, and
B = fortified concentration of the surrogate.
9.7.1 When surrogate recovery from a sample, blank, or CCC is less than 70% or
greater than 130%, check (1) calculations to locate possible errors, (2) standard
solutions for degradation, (3) contamination, and (4) instrument performance.
Correct the problem and reanalyze the extract.
9.7.2 If the extract reanalysis meets the surrogate recovery criterion, report only data for
the reanalyzed extract.
9.7.3 If the extract reanalysis fails the 70-130% recovery criterion, the analyst should
check the calibration by injecting the last calibration standard that passed. If the
calibration standard fails the criteria of Section 9.7.1, recalibration is in order per
Section 10.2. If the calibration standard is acceptable, extraction of the sample
should be repeated provided the sample is still within the holding time. If the re-
extracted sample also fails the recovery criterion, report all data for that sample as
suspect/surrogate recovery to inform the data user that the results are suspect due
to surrogate recovery.
9.8 LABORATORY FORTIFIED SAMPLE MATRIX (LFSM) – Analysis of an LFSM
(Sect. 3.7) is required in each extraction batch and is used to determine that the sample
matrix does not adversely affect method accuracy. If the occurrence of target analytes in
the samples is infrequent, or if historical trends are unavailable, a second LFSM or
552.3-21

LFSMD must be prepared, extracted, and analyzed from a duplicate field sample used to
prepare the LFSM to assess method precision. Extraction batches that contain LFSMDs
do not require the analysis of a Field Duplicate (Sect. 9.9). If a variety of different
sample matrices are analyzed regularly, for example, drinking water from groundwater
and surface water sources, method performance should be established for each. Over
time, LFSM data should be documented for all routine sample sources for the laboratory.
9.8.1 Within each extraction batch, a minimum of one Field Sample is fortified as an
LFSM for every 20 samples extracted. The LFSM is prepared by spiking a
sample with an appropriate amount of Analyte PDS (Sect. 7.2.4.2). Select a
spiking concentration that is greater than or equal to the matrix background
concentration, if known. Use historical data and rotate through the designated
concentrations when selecting a fortifying concentration.
9.8.2 Calculate the recovery (R) for each analyte using the equation
where
A = measured concentration in the fortified sample,
B = measured concentration in the unfortified sample, and
C = fortification concentration.
9.8.3 Analyte recoveries may exhibit matrix bias. For samples fortified at or above
their native concentration, recoveries should range between 70 and 130%, except
for low-level fortification near or at the MRL (within a factor of 2-times the MRL
concentration) where 50 to 150% recoveries are acceptable. If the accuracy of any
analyte falls outside the designated range, and the laboratory performance for that
analyte is shown to be in control in the CCCs, the recovery is judged to be matrix
biased. The result for that analyte in the unfortified sample is labeled
suspect/matrix to inform the data user that the results are suspect due to matrix
effects.
9.8.3.1 Because HAAs are disinfection by-products, many Field Samples will
contain a number of HAAs at varying concentrations. Field Samples that
have native HAA concentrations above the DL but below the MRL and
are fortified at concentrations at or near the MRL should be corrected for
552.3-22

the native levels in order to obtain meaningful R values. This is the only
permitted use of analyte results below the MRL.
9.9 FIELD DUPLICATE OR LABORATORY FORTIFIED SAMPLE MATRIX
DUPLICATE (FD or LFSMD) – Within each extraction batch, a minimum of one Field
Duplicate (FD) or Laboratory Fortified Sample Matrix Duplicate (LFSMD) must be
analyzed. Duplicates check the precision associated with sample collection, preservation,
storage, and laboratory procedures. HAAs are typically found in waters disinfected with
chlorine; however, if target analytes are not routinely observed in Field Samples, an
LFSMD should be periodically analyzed rather than an FD.
9.9.1 Calculate the relative percent difference (RPD) for duplicate measurements (FD1
and FD2) using the equation
9.9.1.1 RPDs for Field Duplicates should fall in the range of ± 30%. Greater
variability may be observed when Field Duplicates have analyte
concentrations that are within a factor of 2 of the MRL. At these
concentrations Field Duplicates should have RPDs that fall in the range of
± 50%. If the RPD of any analyte falls outside the designated range, and
the laboratory performance for that analyte is shown to be in control in the
CCC, the recovery is judged to be matrix biased. The result for that
analyte in the unfortified sample is labeled suspect/matrix to inform the
data user that the results are suspect due to matrix effects.
9.9.2 If an LFSMD is analyzed instead of a Field Duplicate, calculate the relative
percent difference (RPD) for duplicate LFSMs (LFSM and LFSMD) using the
equation
9.9.2.1 RPDs for duplicate LFSMs should fall in the range of ± 30% for samples
fortified at or above their native concentration. Greater variability may be
observed when LFSMs are fortified at analyte concentrations that are
within a factor of 2 of the MRL. LFSMs fortified at these concentrations
552.3-23

should have RPDs that fall in the range of ± 50% for samples fortified at
or above their native concentration. If the RPD of any analyte falls outside
the designated range, and the laboratory performance for that analyte is
shown to be in control in the CCC, the recovery is judged to be matrix
biased. The result for that analyte in the unfortified sample is labeled
suspect/matrix to inform the data user that the results are suspect due to
matrix effects.
9.10 QUALITY CONTROL SAMPLES (QCS) – As part of the IDC (Sect. 9.2), each time a
new Analyte PDS (Sect. 7.2.4.2) is prepared, and at least quarterly, analyze a QCS
sample from a source different from the source of the calibration standards. If a second
vendor is not available then a different lot of the standard should be used. The QCS
should be prepared and analyzed just like a CCC. Acceptance criteria for the QCS is
identical to the CCCs; the calculated amount for each analyte must be + 30% of the
expected value. If measured analyte concentrations are not of acceptable accuracy, check
the entire analytical procedure to locate and correct the problem.
10. CALIBRATION AND STANDARDIZATION
10.1 An acceptable initial calibration must be established during the IDC and prior to
analyzing Field or QC Samples. After initial calibration is successful, a Continuing
Calibration Check (CCC) is required at the beginning and the end of each analysis batch,
and after every tenth sample (Sect. 10.3). Because this is a procedural standard method,
the analyst will need to make a decision to include either an appropriate number of CCCs
or an entire initial calibration curve with each extraction batch. Initial calibration must be
repeated each time a major instrument modification is made or maintenance is performed.
Failure to meet CCC criteria may also require recalibration.
10.2 INITIAL CALIBRATION – This method uses the procedural calibration technique to
compensate for incomplete methylation of some of the target compounds. This is most
pronounced for the brominated trihaloacetic acids. Many of the QC criteria throughout
this method are expressed in terms of percent recovery. It should be noted that these
recoveries are relative to the initial procedural curve rather than absolute recoveries.
10.2.1 Establish GC operating parameters equivalent to the suggested specifications in
Section 17, Table 1 (or Table 2). The GC system must be calibrated using the
552.3-24

internal standard (IS) technique. Other columns or conditions may be used if
equivalent or better performance can be demonstrated.
10.2.2 Prepare a set of at least 5 calibration standards as described in Section 7.2.5. The
lowest concentration calibration standard must be at or below the MRL, which
will depend on system sensitivity. It is recommended that at least four of the
calibration standards be at concentrations greater than the MRL.
10.2.3 CALIBRATION – Use the GC data system software to generate a linear
regression or quadratic calibration curve using the internal standard. The analyst
may choose whether or not to force zero to obtain a curve that best fits the data.
Examples of common GC system calibration curve options are: 1) Ax /Ais versus
Qx /Qis; and 2) RRF versus Ax /Ais. Establish a relative response factor by using
the equation
where
Ax = integrated peak area of the analyte,
Ais = integrated peak area of the internal standard,
Qx = quantity of analyte injected in ng or concentration units,
Qis = quantity of internal standard injected in ng or concentration
units, and
RRF = relative response factor.
10.2.4 Acceptance criteria for the calibration of each analyte is determined by calculating
the concentration of each analyte and surrogate in each of the analyses used to
generate the calibration curve. Each calibration point, except the lowest point, for
each analyte should calculate to be 70-130% of its expected value. The lowest
point should calculate to be 50-150% of its expected value. Laboratories that
have difficulty achieving these criteria will have trouble meeting the QC
requirements summarized in Section 10.3.2. These laboratories should reanalyze
the calibration standards, restrict the range of calibration, or select an alternate
method of calibration.
552.3-25

10.3 CONTINUING CALIBRATION CHECK (CCC) – An appropriate number of CCCs
must be prepared with each extraction batch. The CCC verifies the initial calibration at
the beginning and the end of each analysis batch, and after every 10th sample during
analyses. In this context, a “sample” is considered to be a Field Sample. LFSMs,
LFSMDs, FSDs, and CCCs are not counted as samples. The beginning CCC for each
analysis batch must be at or below the MRL in order to verify instrument sensitivity prior
to any analyses. If standards have been prepared such that all analytes are not in the same
Calibration Standard, it may be necessary to analyze two Calibration Standard solutions
to meet this requirement. Subsequent CCCs should alternate between a medium and a
high concentration standard.
10.3.1 Inject an aliquot of the appropriate concentration calibration check standard
solution prepared with the extraction batch and analyze using the same conditions
used during the initial calibration.
10.3.2 Calculate the concentration of each analyte and surrogate in the check standard.
The calculated amount for each analyte for medium and high level CCCs must be
± 30% of the expected value. The calculated amount for the lowest calibration
level for each analyte must be within ± 50% of the expected value. If these
conditions do not exist, then all data for the problem analyte must be considered
invalid, and remedial action should be taken which may require recalibration.
Any Field Sample extracts that have been analyzed since the last acceptable
calibration verification should be reanalyzed after adequate calibration has been
restored. For Extraction Batches with more than 10 Field Samples the analyst
may either extract and analyze a third CCC or reanalyze the mid-level or high-
level CCC as the final CCC.
11. PROCEDURE
11.1 SAMPLE EXTRACTION
11.1.1 Remove the samples from storage (Sect. 8.3) and allow them to equilibrate to
room temperature.
11.1.2 Place 40 mL of the water sample into a precleaned 60-mL glass vial with a PTFE-
lined screw cap using a clean, graduated cylinder for each sample.
552.3-26

11.1.3 Add 20 µL of surrogate standard (20 µg/mL of 2-bromobutanoic acid in MTBE
per Section 7.2.3.2) to the aqueous sample.
NOTE: When fortifying an aqueous sample with components that are contained in
MTBE solution, be sure that the needle of the syringe is well below the surface of
the water. After injection, cap the sample and invert once. This will insure that
the standard solution is mixed well.
11.1.4 Adjust the pH to less than or equal to 0.5 by adding up to 2 mL of concentrated
sulfuric acid. Cap, mix and then check the pH with narrow range pH paper (Sect.
6.11). Substitution of other acids is not allowed.
11.1.5 Add approximately 18 g of muffled sodium sulfate (Sect. 7.1.4) and immediately
shake until almost all is dissolved. Substitution of other salts for sodium
sulfate is not allowed. Sodium sulfate is added to increase the ionic strength of
the aqueous phase and thus further drive the haloacetic acids into the organic
phase. The addition of salt also decreases the solubility of MTBE or TAME in
the aqueous phase and allows greater volumetric recovery of the extraction
solvent. The addition of this salt should be done immediately after the addition of
the sulfuric acid so that the heat generated from the addition of the acid (Sect.
11.1.4) will help dissolve the salt.
11.1.6 Add exactly 4.0 mL MTBE with IS or TAME with IS (Sect. 7.2.2.3) and shake
vigorously for three minutes by hand. This may be accomplished for a entire
Extraction Batch using a test tube rack.
11.1.7 Allow the phases to separate for approximately 5 minutes.
11.2 SAMPLE METHYLATION WITH ACIDIC METHANOL
11.2.1 Using a pasteur pipet, transfer 3 mL of the upper MTBE or TAME layer to a
15-mL graduated conical centrifuge tube.
11.2.2 Add 3 mL of 10% sulfuric acid in methanol (Sect. 7.1.12) to each centrifuge tube.
Cap the tube.
11.2.3 Methylation of the method analytes is accomplished during this step. Careful
control of both reaction time and reaction temperature are critical to method
552.3-27

precision and accuracy.(9) Place the tubes in a heating block (or sand bath) at
50 ± 2 °C (for MTBE) or 60 ± 2 °C (for TAME) and heat for 2 hours (± 10 min).
The tubes should fit snugly into the heating block to ensure proper heat transfer.
Verify the reaction temperature by placing a thermometer into a tube containing
water rather than inserting it into the block to ensure an accurate reading. Placing
the thermometer directly in the heating block well or sand bath will give a higher
temperature reading than the actual sample temperature. The MTBE reaction
temperature is set at its highest practical limit (50 °C), since MTBE boils at 55 °C.
Similarly, the TAME reaction temperature has been set at 60 °C, since methanol
boils at 65 °C. This helps prevent solvent loss from the reaction tubes.
11.2.3.1 Even at 2 hours, methylation for some of the more sterically hindered
compounds like TBAA, CDBAA and BDCAA is not complete.
Shortening reaction time will decrease methylation efficiencies for
compounds and result in lower precision.
11.2.3.2 Methylation efficiencies are increased with increasing temperature (and
time). The TAME procedure has higher methylation efficiencies than
MTBE procedure for the sterically hindered HAAs like the brominated
trihaloacetic acids (Sect. 11.2.3.1) and is more precise for these targets.
Methylation temperature, however, should not be increased above
the recommended reaction temperatures (Sect. 11.2.3).
11.2.3.3 Lower reaction temperatures or times are not allowed. Care should
be taken to ensure that the calibration standards are heated identically to
Field Samples in the extraction batch.
11.2.3.4 Methylation may be accomplished by heating the reaction tubes with a
water bath, provided the water bath is not covered in a way as to cause
the entire tube to be heated. If tube walls are heated, the tubes can lose
some of their contents leading to higher variability in analytical results.
A water bath that is covered with a layer of small, floating plastic
spheres may be used (Sect. 6.10).
11.2.4 Remove the centrifuge tubes from the heating source and allow them to cool
before removing their caps.
552.3-28

11.2.5 Add 7 mL of a 150 g/L sodium sulfate solution (Sect. 7.1.10) to each centrifuge
tube. Vortex each tube to ensure full equilibration between the phases. Allow the
two phases to settle fully, but do not allow the tubes to sit more than a few
minutes. Adding the sodium sulfate solution may cause some loss of the formed
HAA-esters through acid-catalyzed hydrolysis over prolonged periods.
11.2.6 Remove and discard the lower (acidic aqueous methanol) phase from each tube
with a long pasteur pipet. Leave no more than 0.3 mL of aqueous phase to ensure
complete neutralization in the following step.
11.2.7 Add 1 mL of saturated sodium bicarbonate solution (Sect. 7.1.11). Vortex each
centrifuge tube for several seconds at least four times to complete the
neutralization reaction. Loosen the tube caps after the first agitation to release the
evolved CO2.
11.2.8 Transfer 1 mL of the upper ether layer to an auto-sampler vial. A duplicate vial
should be filled using the excess extract.
11.2.9 Analyze the samples as soon as possible. Store the extracts at #-10 °C (Sect. 8.4).
11.3 GAS CHROMATOGRAPHY
11.3.1 The instrument used in the development of this method was equipped with a low
volume (150 µL) micro electron capture detector (ECD). Other configurations are
allowed as described in Section 6.14.
11.3.2 COLUMN SELECTION AND INSTALLATION – Strict attention should be paid
to established column installation guidelines with regard to the proper cutting and
placement of the capillary columns within the instrument. The brominated
trihaloacetic acids are particularly sensitive to the condition of the injection port
and GC column. If the response for these or other method analytes diminish,
trimming approximately 0.5 m from the head of the column and replacing the GC
inlet liner often restores the response for these analytes. Quartz inlet liners and
inlet liners with standard deactivation were found to require less frequent
maintenance than those with SiltekTM deactivation for this method. If conditions
in the laboratory necessitate frequent column trimming, a guard column is
recommended.
552.3-29
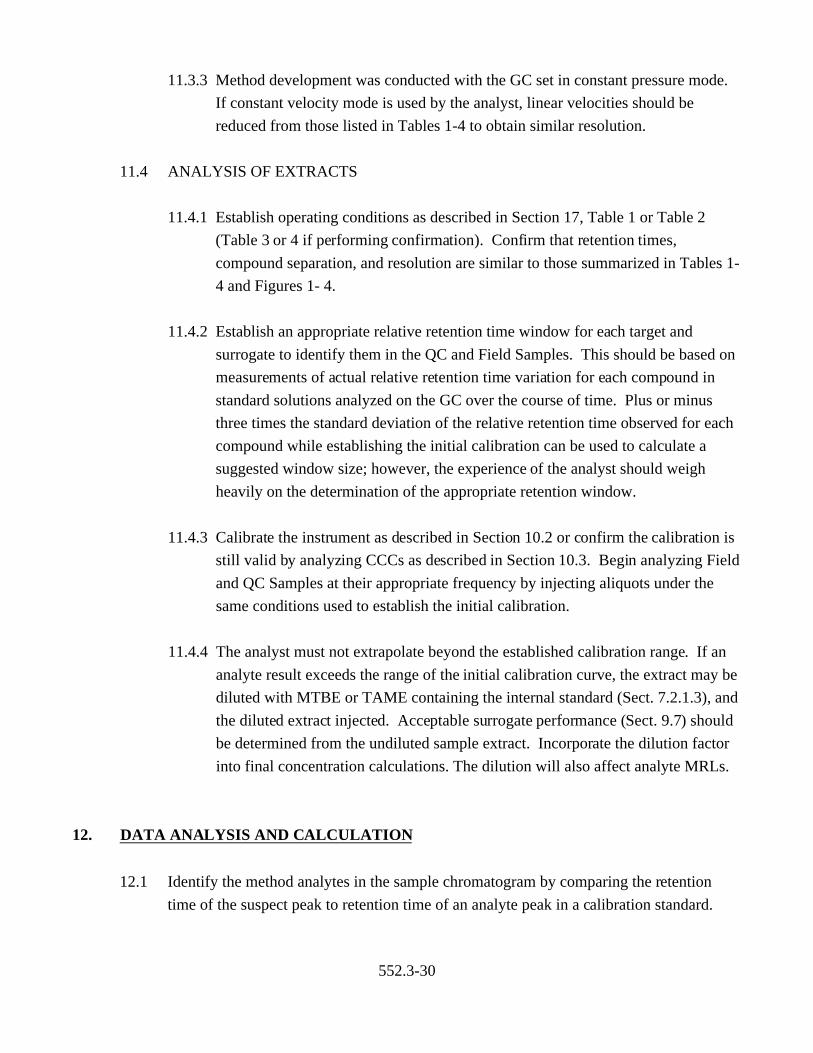
11.3.3 Method development was conducted with the GC set in constant pressure mode.
If constant velocity mode is used by the analyst, linear velocities should be
reduced from those listed in Tables 1-4 to obtain similar resolution.
11.4 ANALYSIS OF EXTRACTS
11.4.1 Establish operating conditions as described in Section 17, Table 1 or Table 2
(Table 3 or 4 if performing confirmation). Confirm that retention times,
compound separation, and resolution are similar to those summarized in Tables 1-
4 and Figures 1- 4.
11.4.2 Establish an appropriate relative retention time window for each target and
surrogate to identify them in the QC and Field Samples. This should be based on
measurements of actual relative retention time variation for each compound in
standard solutions analyzed on the GC over the course of time. Plus or minus
three times the standard deviation of the relative retention time observed for each
compound while establishing the initial calibration can be used to calculate a
suggested window size; however, the experience of the analyst should weigh
heavily on the determination of the appropriate retention window.
11.4.3 Calibrate the instrument as described in Section 10.2 or confirm the calibration is
still valid by analyzing CCCs as described in Section 10.3. Begin analyzing Field
and QC Samples at their appropriate frequency by injecting aliquots under the
same conditions used to establish the initial calibration.
11.4.4 The analyst must not extrapolate beyond the established calibration range. If an
analyte result exceeds the range of the initial calibration curve, the extract may be
diluted with MTBE or TAME containing the internal standard (Sect. 7.2.1.3), and
the diluted extract injected. Acceptable surrogate performance (Sect. 9.7) should
be determined from the undiluted sample extract. Incorporate the dilution factor
into final concentration calculations. The dilution will also affect analyte MRLs.
12. DATA ANALYSIS AND CALCULATION
12.1 Identify the method analytes in the sample chromatogram by comparing the retention
time of the suspect peak to retention time of an analyte peak in a calibration standard.
552.3-30

Surrogate retention times should be confirmed to be within acceptance limits (Sect.
11.4.2) even if no target compounds are detected.
12.2 Calculate the analyte concentrations using the initial calibration curve generated as
described in Section 10.2. Quantitate only those values that fall between the MRL and
the highest calibration standard. Samples with target analyte responses that exceed the
highest standard require dilution and reanalysis (Sect. 11.4.4).
12.3 Analyte identifications should be confirmed using the confirmation column specified in
Table 3 (or Table 4) or another column that is dissimilar to the primary column. GC/MS
confirmation is acceptable if the analyte concentrations are sufficient.
12.4 Adjust the calculated concentrations of the detected analytes to reflect the initial sample
volume and any dilutions performed.
12.5 Analyte concentrations are reported in µg/L as the total free acid (usually to 2 significant
figures); however, calculations should use all available digits of precision.
13. METHOD PERFORMANCE
13.1 PRECISION, ACCURACY, AND DETECTION LIMITS – Tables for these data are
presented in Section 17. Detection Limits are presented in Table 5 and were calculated
using the formula presented in Section 9.2.4. Single laboratory precision and accuracy
data are presented in Tables 6-11.
13.2 SAMPLE STORAGE STABILITY STUDIES – An analyte storage stability study was
conducted by fortifying the analytes (10 µg/L of each analyte) into a chlorinated surface
water that was collected, preserved, and stored as described in Section 8. The average of
triplicate analyses, conducted on days 0, 3, 7, and 14 are presented in Table 12.
13.3 EXTRACT STORAGE STABILITY STUDIES – Extract storage stability studies were
conducted on TAME and MTBE extracts obtained from a chlorinated surface water
fortified at 10 µg/L. The average of triplicate injections are reported in Tables 13 and 14.
Extract storage stability can decline in the presence of peroxides. This is discussed in
Section 8.4.
552.3-31

14. POLLUTION PREVENTION
14.1 This method utilizes liquid-liquid microextraction to extract analytes from water. It
requires the use of very small volumes of organic solvent and very small quantities of
pure analytes, thereby minimizing the potential hazards to both the analyst and the
environment as compared to the use of large volumes of organic solvents in conventional
liquid-liquid extractions.
14.2 For information about pollution prevention that may be applicable to laboratory
operations, consult “Less is Better: Laboratory Chemical Management for Waste
Reduction” available from the American Chemical Society’s Department of Government
Relations and Science Policy, 1155 16th Street N.W., Washington, D.C., 20036.
15. WASTE MANAGEMENT
15.1 The analytical procedures described in this method generate relatively small amounts of
waste since only small amounts of reagents and solvents are used. The matrices of
concern are finished drinking water or source water. However, the Agency requires that
laboratory waste management practices be conducted consistent with all applicable rules
and regulations, and that laboratories protect the air, water, and land by minimizing and
controlling all releases from fume hoods and bench operations. Also, compliance is
required with any sewage discharge permits and regulations, particularly the hazardous
waste identification rules and land disposal restrictions. For further information on waste
management, consult “The Waste Management Manual for Laboratory Personnel” also
available from the American Chemical Society at the address in Section 14.2.
16. REFERENCES
1. Glaser, J.A., Foerst, D.L., McKee, G.D., Quave, S.A., and Budde, W.L., “Trace Analyses
for Wastewaters,” Environ. Sci. Technol., 15 (1981) 1426-1435.
2. Giam, C.S., Chan, H.S., and Nef, G.S., "Sensitive Method for Determination of Phthalate
Ester Plasticizers in Open-Ocean Biota Samples," Analytical Chemistry, 47, 2225 (1975).
552.3-32

3. Giam, C.S., and Chan, H.S., "Control of Blanks in the Analysis of Phthalates in Air and
Ocean Biota Samples," U.S. National Bureau of Standards, Special Publication 442,
701-708, (1976).
4. "OSHA Safety and Health Standards, General Industry," (29CRF1910). Occupational
Safety and Health Administration, OSHA 2206, (Revised, Jan. 1976).
5. “Carcinogens-Working with Carcinogens,” Publication No. 77-206, Department of
Health, Education, and Welfare, Public Health Service, Center for Disease Control,
National Institute of Occupational Safety and Health, Atlanta, Georgia, August 1977.
6. “Safety In Academic Chemistry Laboratories,” 3rd Edition, American Chemical Society
Publication, Committee on Chemical Safety, Washington, D.C., (1979).
7. ASTM Annual Book of Standards, Part II, Volume 11.01, D3370-82, "Standard Practice
for Sampling Water," American Society for Testing and Materials, Philadelphia, PA,
1986.
8. Pepich, B.V., Domino, M.M., Munch, D.J. and Fair, P.S. “Validating Sample
Preservation Techniques and Holding Times for the Approved Compliance Monitoring
Methods for Haloacetic Acids Under the U.S. EPA’s Stage 1 D/DBP Rule,” Submitted to
Wat. Res., Sept. 2002.
9. Xie, Y., Rashid, I., Zhou, H., and Gammie, L. “Acidic Methanol Methylation for HAA
Analysis: Limitations and Possible Solutions” JAWWA, 94:11, 115-122 (Nov. 2002).
552.3-33

17. TABLES, DIAGRAMS, FLOWCHARTS, AND VALIDATION DATA
TABLE 1: CHROMATOGRAPHIC CONDITIONS AND AVERAGE RETENTION TIME
DATA FOR THE PRIMARY COLUMN (DB-1701) USING MTBE
Compound
Average Tr
(min)*
RSD
(% )
Monochloroacetic acid (MCAA) 9.29 0.03
Monobromoacetic acid (MBAA) 14.19 0.02
Dalapon 14.69 0.02
Dichloroacetic acid (DCAA) 15.07 0.02
Bromoform** 17.12 0.01
Trichloroacetic acid (TCAA) 18.89 0.01
1,2,3 Trichloropropane (IS) 20.69 0.01
Bromochloroacetic acid (BCAA) 21.22 0.01
2-bromobutanoic acid (SUR) 21.63 0.01
Bromodichloroacetic acid (BDCAA) 23.60 0.01
Dibromoacetic acid (DBAA) 24.01 0.005
Chlorodibromoacetic acid (CDBAA) 25.55 0.004
Tribromoacetic acid (TBAA) 26.88 0.003
*The average retention time represents the average of 8 injections of fortified reagent water extracts that had been fortified at10 µg/L of each analyte. **Bromoform is not a target analyte. RT value is provided for information only .
Primary Column: DB-1701, 30 m x 0.25 mm i.d., 0.25 µm film thickness.
Injector: Injector temperature, 210 ºC; 2-mm straight quartz liner; injection volume 1 µL; splitless injection hold for
45 sec then purge @ 30 mL/min.
GC Program: (for MTBE) 40 ºC initial held for 10 minutes, program at 2.5 ºC/min to 65 ºC, then 10 ºC/min to 85 ºC, then
20 ºC/min to 205 ºC, hold for 7 min.
Detector: Agilent Micro ECD (150 µL volume); detector temperature, 290 ºC; detector make up gas 95% Ar/5% CH4
at 20 mL/min.
Carrier Gas: Helium (UHP), set at constant pressure. Initial carrier gas velocity (at 40 ºC) 33 cm/sec.
Data Collection: Agilent GC Chemstation with a digitization rate of 20 Hz.
552.3-34

TABLE 2: CHROMATOGRAPHIC CONDITIONS AND AVERAGE RETENTION TIMEDATA FOR THE PRIMARY COLUMN (DB-1701) USING TAME
Compound Average Tr
(min)* RSD (%)
Monochloroacetic acid (MCAA) 5.94 0.08
Monobromoacetic acid (MBAA) 8.76 0.04
Dalapon 9.17 0.04
Dichloroacetic acid (DCAA) 9.34 0.04
Bromoform** 11.06 0.02
Trichloroacetic acid (TCAA) 12.28 0.02
1,2,3 Trichloropropane (IS) 13.56 0.01
Bromochloroacetic acid (BCAA) 13.87 0.01
2-bromobutanoic acid (SUR) 14.20 0.01
Bromodichloroacetic acid (BDCAA) 15.78 0.004
Dibromoacetic acid (DBAA) 16.14 0.003
Chlorodibromoacetic acid (CDBAA) 17.58 0.002
Tribromoacetic acid (TBAA) 18.89 0.02
*The average retention time represents the average of 8 injections of fortified reagent water extracts that had been fortified at10 µg/L of each analyte. **Bromoform is not a target analyte. RT value is provided for information only.
Primary Column: DB-1701, 30 m x 0.25 mm i.d., 0.25 µm film thickness.
Injector: Injector temperature, 210 ºC; 2-mm straight quartz liner; injection volume 1 µL; splitless injection hold for
45 sec then purge @ 30 mL/min.
GC Program: (for TAME) 55 ºC initial hold 8 minutes, program at 2.5 ºC/min to 65 ºC, then 10 ºC/min to 85 ºC, then 20 ºC/min to 205 ºC, hold for 7 min.
Detector: Agilent Micro ECD (150 µL volume); detector temperature, 290 ºC; detector make up gas 95% Ar/5% CH4
at 20 mL/min.
Carrier Gas: Helium (UHP), set at constant pressure. Initial carrier gas velocity (at 55 ºC) 32 cm/sec.
Data Collection: Agilent GC Chemstation with a digitization rate of 20 Hz.
552.3-35

TABLE 3: CHROMATOGRAPHIC CONDITIONS AND AVERAGE RETENTION TIME DATA FOR THE CONFIRMATION COLUMN (DB-5.625) USING MTBE
Compound Average Tr
(min)* RSD (%)
Monochloroacetic acid (MCAA) 5.28 0.04
Monobromoacetic acid (MBAA) 8.31 0.01
Dichloroacetic acid (DCAA) 9.05 0.01
Dalapon 10.63 0.02
Bromoform** 12.74 0.02
Trichloroacetic acid (TCAA) 14.73 0.02
Bromochloroacetic acid (BCAA) 15.25 0.02
1,2,3 Trichloropropane (IS) 15.65 0.01
2-bromobutanoic acid (SUR) 17.41 0.02
Dibromoacetic acid (DBAA) 21.08 0.01
Bromodichloroacetic acid (BDCAA) 21.39 0.01
Chlorodibromoacetic acid (CDBAA) 24.35 0.002
Tribromoacetic acid (TBAA) 25.94 0.000
*The average retention time represents the average of 8 injections of fortified reagent water extracts that had been fortified at10 µg/L of each analyte. **Bromoform is not a target analyte. RT value is provided for information only .
Confirmation Column: DB-5.625 , 30 m x 0.25 mm i.d., 0.25 µm film thickness.
Injector: Injector temperature, 210 ºC; 2-mm straight quartz liner; injection volume 1 µL ; splitless injection hold for
45 sec then purge @ 30 mL/min.
GC Program: (for MTBE) 40 ºC initial held for 10 minutes, program at 2.5 ºC/min to 65 ºC, then 10 ºC/min to 85 ºC, then
20 ºC/min to 205 ºC,. Post run 210 ºC hold for 7 min.
Detector: Agilent Micro ECD (150 µL volume); detector temperature, 290 ºC; detector make up gas 95% Ar/5% CH4
at 20 mL/min.
Carrier Gas: Helium (UHP), set at constant pressure. Initial carrier gas velocity (at 40 ºC) 32 cm/sec.
Data Collection: Agilent GC Chemstation with a digitization rate of 20 Hz.
552.3-36
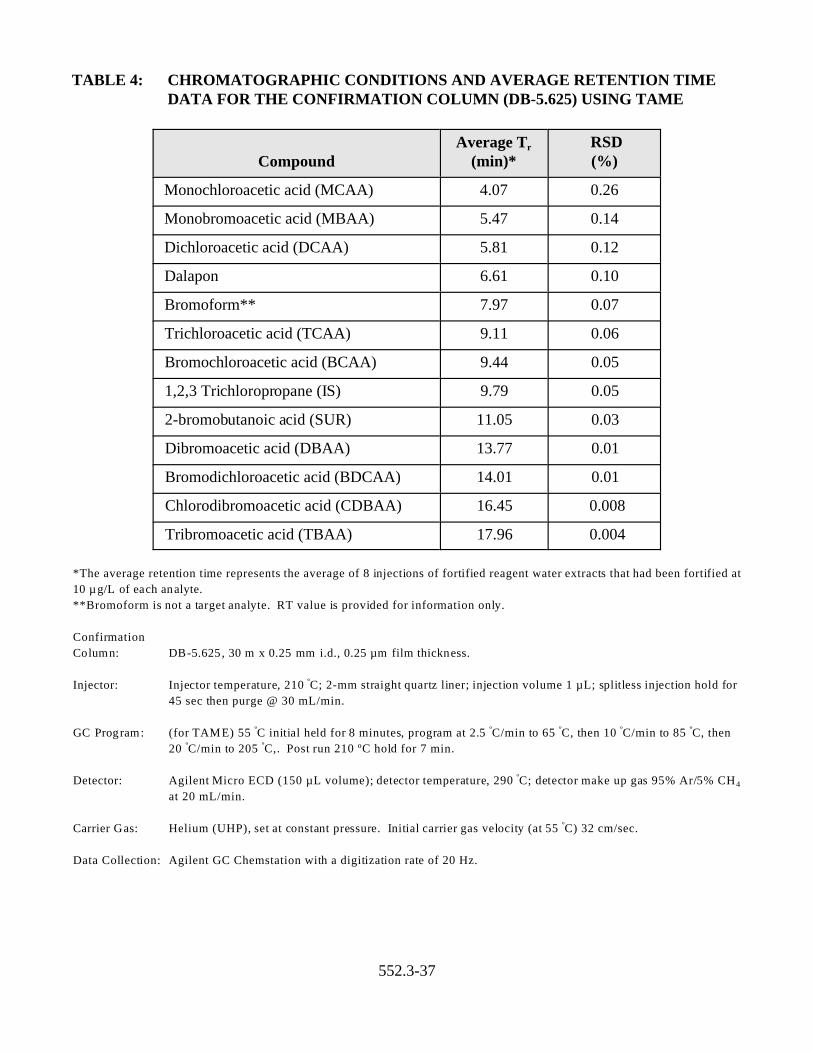
TABLE 4: CHROMATOGRAPHIC CONDITIONS AND AVERAGE RETENTION TIME DATA FOR THE CONFIRMATION COLUMN (DB-5.625) USING TAME
Compound Average Tr
(min)* RSD (%)
Monochloroacetic acid (MCAA) 4.07 0.26
Monobromoacetic acid (MBAA) 5.47 0.14
Dichloroacetic acid (DCAA) 5.81 0.12
Dalapon 6.61 0.10
Bromoform** 7.97 0.07
Trichloroacetic acid (TCAA) 9.11 0.06
Bromochloroacetic acid (BCAA) 9.44 0.05
1,2,3 Trichloropropane (IS) 9.79 0.05
2-bromobutanoic acid (SUR) 11.05 0.03
Dibromoacetic acid (DBAA) 13.77 0.01
Bromodichloroacetic acid (BDCAA) 14.01 0.01
Chlorodibromoacetic acid (CDBAA) 16.45 0.008
Tribromoacetic acid (TBAA) 17.96 0.004
*The average retention time represents the average of 8 injections of fortified reagent water extracts that had been fortified at10 µg/L of each analyte. **Bromoform is not a target analyte. RT value is provided for information only.
Confirmation Column: DB-5.625 , 30 m x 0.25 mm i.d., 0.25 µm film thickness.
Injector: Injector temperature, 210 ºC; 2-mm straight quartz liner; injection volume 1 µL; splitless injection hold for
45 sec then purge @ 30 mL/min.
GC Program: (for TAME) 55 ºC initial held for 8 minutes, program at 2.5 ºC/min to 65 ºC, then 10 ºC/min to 85 ºC, then
20 ºC/min to 205 ºC,. Post run 210 ºC hold for 7 min.
Detector: Agilent Micro ECD (150 µL volume); detector temperature, 290 ºC; detector make up gas 95% Ar/5% CH4
at 20 mL/min.
Carrier Gas: Helium (UHP), set at constant pressure. Initial carrier gas velocity (at 55 ºC) 32 cm/sec.
Data Collection: Agilent GC Chemstation with a digitization rate of 20 Hz.
552.3-37

TABLE 5: DETECTION LIMITS IN REAGENT WATER USING THE MTBE AND TAME PROCEDURES
Compound
MTBE TAME
Fortification Level (µg/L)
Detection Limita
(µg/L)
Fortification Level (µg/L)
Detection Limita
(µg/L)
Monochloroacetic acid (MCAA) 1.00 0.17 1.00 0.20
Monobromoacetic acid (MBAA) 0.50 0.027 0.50 0.13
Dalapon 0.50 0.024 0.50 0.14
Dichloroacetic acid (DCAA) 0.50 0.020 0.50 0.084
Trichloroacetic acid (TCAA) 0.50 0.019 0.50 0.024
Bromochloroacetic acid (BCAA) 0.50 0.016 0.50 0.029
Bromodichloroacetic acid (BDCAA) 0.50 0.034 0.50 0.031
Dibromoacetic acid (DBAA) 0.50 0.012 0.50 0.021
Chlorodibromoacetic acid (CDBAA) 0.50 0.054 0.50 0.035
Tribromoacetic acid (TBAA) 0.50 0.11 0.50 0.097
aFortified reagent waters were extracted and analyzed over 3 days for 7-9 replicates following the procedure outlined in Section 9. MTBE detection limits were determined with 9 replicates. TAME detection limits were determined with 7 replicates.
552.3-38

TABLE 6: PRECISION AND ACCURACY IN REAGENT WATER FORTIFIED AT 1.0 µg/L
Compound
MTBE TAME
Mean Recovery (%)
RSD (%)
(n=8)
S/N Ratioa
Mean Recovery
(%)
RSD (%)
(n=8)
S/N Ratioa
Monochloroacetic acid (MCAA) 95.8 4.0 12 81.4 5.1 17
Monobromoacetic acid (MBAA) 92.2 1.8 81 90.7 3.7 92
Dalapon 97.5 1.6 110 92.8 2.1 150
Dichloroacetic acid (DCAA) 93.8 1.6 190 97.8 2.2 190
Trichloroacetic acid (TCAA) 105 0.52 580 107 0.90 520
Bromochloroacetic acid (BCAA) 102 0.36 580 103 0.94 740
Bromodichloroacetic acid (BDCAA) 117 1.2 1400 113 1.1 1800
Dibromoacetic acid (DBAA) 105 0.63 1300 105 0.86 1800
Chlorodibromoacetic Acid (CDBAA) 125 2.3 650 112 1.5 1600
Tribromoacetic acid (TBAA) 128 4.1 970 109 1.8 1100
aSignal-to-noise ratios were calculated for each target compound peak by dividing the peak height for each compound by the peak-to-peak noise, which was determined for each component from the method blank over a period of time equal to the full peak width in the target analyte’s retention time window.
552.3-39

TABLE 7: PRECISION AND ACCURACY IN REAGENT WATER FORTIFIED AT 10 µg/L
Compound
MTBE TAME
Mean Recoverya
(%)
RSD (%)
(n=8)
Mean Recoverya
(%)
RSD (%)
(n=8)
Monochloroacetic acid (MCAA) 101 3.5 102 2.5
Monobromoacetic acid (MBAA) 101 2.2 101 1.6
Dalapon 99.8 0.88 99.9 0.50
Dichloroacetic acid (DCAA) 98.2 0.73 100 0.33
Trichloroacetic acid (TCAA) 102 1.2 101 1.1
Bromochloroacetic acid (BCAA) 101 0.72 101 0.65
Bromodichloroacetic acid (BDCAA) 107 2.4 103 1.2
Dibromoacetic acid (DBAA) 102 0.52 101 0.59
Chlorodibromoacetic acid (CDBAA) 111 3.8 104 1.6
Tribromoacetic acid (TBAA) 113 4.7 104 2.0
552.3-40

TABLE 8: PRECISION AND ACCURACY IN CHLORINATED SURFACE WATER FORTIFIED AT 1.0 µg/L
Compound
MTBE TAME
Mean Recoverya
(%)
RSD (%)
(n=8)
Mean Recoveryb
(%)
RSD (%)
(n=8)
Monochloroacetic acid (MCAA) 112 6.2 131 6.2
Monobromoacetic acid (MBAA) 99.5 2.3 98.6 4.2
Dalapon 107 2.2 103 3.5
Dichloroacetic acid (DCAA) 103 1.5 106 3.8
Trichloroacetic acid (TCAA) 89.2 1.4 89.0 1.1
Bromochloroacetic acid (BCAA) 99.5 1.6 102 2.2
Bromodichloroacetic acid (BDCAA) 91.7 4.0 87.5 1.8
Dibromoacetic acid (DBAA) 103 2.8 103 4.5
Chlorodibromoacetic acid (CDBAA) 95.5 7.1 94.4 3.3
Tribromoacetic acid (TBAA) 110 8.1 111 4.3
aRecoveries were corrected for haloacetic acid (HAA) concentrations in the unfortified matrix, based on an average value of three measurements. HAAs detected in the unfortified matrix included MBAA (0.14 µg/L), DCAA (0.56 µg/L), TCAA (0.32 µg/L), BCAA (1.1 µg/L), BDCAA (0.68 µg/L), DBAA (2.2 µg/L), CDBAA (0.91 µg/L), and TBAA (1.0 µg/L).
bRecoveries were corrected for haloacetic acid (HAA) concentrations in the unfortified matrix, based on an average value of three measurements. HAAs detected in the unfortified matrix included MBAA (0.22 µg/L), DCAA (0.78 µg/L), TCAA (0.36 µg/L), BCAA (2.0 µg/L), BDCAA (0.62 µg/L), DBAA (4.0 µg/L), CDBAA (0.82 µg/L), and TBAA (0.79 µg/L).
552.3-41

TABLE 9: PRECISION AND ACCURACY IN CHLORINATED SURFACE WATER FORTIFIED AT 10 µg/L
Compound
MTBE TAME
Mean Recoverya
(%)
RSD (%)
(n=8)
Mean Recoveryb
(%)
RSD (%)
(n=8)
Monochloroacetic acid (MCAA) 97.8 3.1 97.1 3.8
Monobromoacetic acid (MBAA) 98.8 2.0 98.8 2.0
Dalapon 99.6 0.90 97.7 0.42
Dichloroacetic acid (DCAA) 98.0 1.1 97.6 0.42
Trichloroacetic acid (TCAA) 99.8 0.80 100 1.4
Bromochloroacetic acid (BCAA) 101 1.4 101 0.93
Bromodichloroacetic acid (BDCAA) 103 4.3 104 2.3
Dibromoacetic acid (DBAA) 102 1.4 101 0.93
Chlorodibromoacetic acid (CDBAA) 105 5.5 105 3.2
Tribromoacetic acid (TBAA) 108 6.3 106 3.4
aRecoveries were corrected for haloacetic acid (HAA) concentrations in the unfortified matrix, based on an average value of three measurements. HAAs detected in the unfortified matrix included MBAA (0.14 µg/L), DCAA (0.56 µg/L), TCAA (0.32 µg/L), BCAA (1.1 µg/L), BDCAA (0.68 µg/L), DBAA (2.2 µg/L), CDBAA (0.91 µg/L), and TBAA (1.0 µg/L).
bRecoveries were corrected for haloacetic acid (HAA) concentrations in the unfortified matrix, based on an average value of three measurements. HAAs detected in the unfortified matrix included MBAA (0.22 µg/L), DCAA (0.78 µg/L), TCAA (0.36 µg/L), BCAA (2.0 µg/L), BDCAA (0.62 µg/L), DBAA (4.0 µg/L), CDBAA (0.82 µg/L), and TBAA (0.79 µg/L).
552.3-42

TABLE 10: PRECISION AND ACCURACY IN CHLORINATED GROUND WATER FORTIFIED AT 1.0 µg/L
Compound
MTBE TAME
Mean Recoverya
(%)
RSD (%)
(n=8)
Mean Recoveryb
(%)
RSD (%)
(n=8)
Monochloroacetic acid (MCAA) 126 4.5 124 9.5
Monobromoacetic acid (MBAA) 113 3.8 98.9 2.6
Dalapon 112 1.1 87.3 2.7
Dichloroacetic acid (DCAA) 102 3.7 107 3.2
Trichloroacetic acid (TCAA) 92.2 1.2 103 2.1
Bromochloroacetic acid (BCAA) 106 3.8 104 2.4
Bromodichloroacetic acid (BDCAA) 105 6.1 106 4.0
Dibromoacetic acid (DBAA) 111 5.3 105 1.7
Chlorodibromoacetic acid (CDBAA) 103 8.8 103 4.5
Tribromoacetic acid (TBAA) 99.2 7.3 103 3.2
aRecoveries were corrected for haloacetic acid (HAA) concentrations in the unfortified matrix, based on an average value of three measurements. HAAs detected in the unfortified matrix included MBAA (0.07 µg/L), Dalapon (0.19 µg/L), DCAA (2.6 µg/L), TCAA (1.1 µg/L), BCAA (3.0 µg/L), BDCAA (1.8 µg/L), DBAA (3.3 µg/L), CDBAA (1.8 µg/L), and TBAA (1.1 µg/L).
bRecoveries were corrected for haloacetic acid (HAA) concentrations in the unfortified matrix, based on an average value of three measurements. HAAs detected in the unfortified matrix included MBAA (0.28 µg/L), Dalapon (0.35 µg/L) DCAA (2.7 µg/L), TCAA (1.6 µg/L), BCAA (3.2 µg/L), BDCAA (2.4 µg/L), DBAA (2.5 µg/L), CDBAA (1.7 µg/L), and TBAA (0.54 µg/L).
552.3-43

TABLE 11: PRECISION AND ACCURACY IN CHLORINATED GROUND WATER FORTIFIED AT 10 µg/L
Compound
MTBE TAME
Mean Recoverya
(%)
RSD (%)
(n=8)
Mean Recoveryb
(%)
RSD (%)
(n=8)
Monochloroacetic acid (MCAA) 104 1.8 99.7 1.7
Monobromoacetic acid (MBAA) 100 1.4 98.7 1.1
Dalapon 97.8 1.1 97.9 0.63
Dichloroacetic acid (DCAA) 95.9 1.0 97.1 0.83
Trichloroacetic acid (TCAA) 98.2 0.81 101 1.4
Bromochloroacetic acid (BCAA) 100 0.53 99.8 1.4
Bromodichloroacetic acid (BDCAA) 106 1.8 106 2.3
Dibromoacetic acid (DBAA) 101 0.89 101 1.6
Chlorodibromoacetic acid (CDBAA) 110 2.8 106 2.8
Tribromoacetic acid (TBAA) 116 3.4 105 2.6
aRecoveries were corrected for haloacetic acid (HAA) concentrations in the unfortified matrix, based on an average value of three measurements. HAAs detected in the unfortified matrix included MBAA (0.07 µg/L), Dalapon (0.19 µg/L), DCAA (2.6 µg/L), TCAA (1.1 µg/L), BCAA (3.0 µg/L), BDCAA (1.8 µg/L), DBAA (3.3 µg/L), CDBAA (1.8 µg/L), and TBAA (1.1 µg/L).
bRecoveries were corrected for haloacetic acid (HAA) concentrations in the unfortified matrix, based on an average value of three measurements. HAAs detected in the unfortified matrix included MBAA (0.28 µg/L), Dalapon (0.35 µg/L) DCAA (2.7 µg/L), TCAA (1.6 µg/L), BCAA (3.2 µg/L), BDCAA (2.4 µg/L), DBAA (2.5 µg/L), CDBAA (1.7 µg/L), and TBAA (0.54 µg/L).
552.3-44

TABLE 12: SAMPLE HOLDING TIME DATA FOR SAMPLES FROM A CHLORINATED SURFACE WATER FORTIFIED WITH METHOD ANALYTESa
Compound
Day 0 Rb
(%)
Day 3 Rb
(%)
Day 7 Rb
(%)
Day 14 Rb
(%)
Monochloroacetic Acid (MCAA) 97.9 96.8 98.5 104
Monobromoacetic Acid (MBAA) 107 99.6 105 109
Dalapon 104 104 103 99.7
Dichloroacetic Acid (DCAA) 101 99.0 102 98.8
Trichloroacetic Acid (TCAA) 101 102 98.8 96.2
Bromochloroacetic Acid (BCAA) 101 99.3 100 97.8
Bromodichloroacetic Acid (BDCAA) 112 111 113 110
Dibromoacetic Acid (DBAA) 102 99.1 100 96.9
Chlorodibromoacetic Acid (CDBAA) 117 115 119 116
Tribromoacetic Acid (TBAA) 123 118 124 121
a All samples were fortified at 10 µg/L. All samples were stored at 10 ºC for 48 hours, and at 6 ºC thereafter.
bRecoveries were corrected for haloacetic acid (HAA) concentrations in the unfortified matrix, based on an average value of three measurements. HAAs detected in the unfortified matrix included MBAA (0.30 µg/L), DCAA (0.73 µg/L), TCAA (0.33 µg/L), BCAA (2.0 µg/L), BDCAA (0.67 µg/L), DBAA (4.3 µg/L), CDBAA (0.91 µg/L), and TBAA (1.1 µg/L).
552.3-45

TABLE 13: MTBE EXTRACT HOLDING TIME DATA FOR SAMPLES FROM A CHLORINATED SURFACE WATER FORTIFIED WITH METHOD ANALYTESa
Compound Initial
R (%)
Day 7 R
(%)
Day 14 R
(%)
Day 21 R
(%)
Monochloroacetic Acid (MCAA) 99.0 98.6 100 99.3
Monobromoacetic Acid (MBAA) 99.7 98.2 98.1 99.0
Dalapon 99.0 96.7 98.1 97.8
Dichloroacetic Acid (DCAA) 97.9 96.3 97.5 97.3
Trichloroacetic Acid (TCAA) 99.3 99.6 98.5 99.1
Bromochloroacetic Acid (BCAA) 100 101 100 101
Bromodichloroacetic Acid (BDCAA) 99.3 106 102 103
Dibromoacetic Acid (DBAA) 101 102 101 102
Chlorodibromoacetic Acid (CDBAA) 99.7 107 102 103
Tribromoacetic Acid (TBAA) 102 110 102 106
aExtract storage stability was conducted on three of the eight extracts from the precision and accuracy study conducted in chlorinated surface water (fortified at 10 µg/L) reported in Table 9. Sample storage stability is expressed as a recovery value (%) calculated as described in Section 9.8.2. All values have been corrected for background levels in the unfortified sample based on triplicate measurements as described in Table 9. Extracts were stored at < -10 °C.
552.3-46

TABLE 14: TAME EXTRACT HOLDING TIME DATA FOR SAMPLES FROM A CHLORINATED SURFACE WATER FORTIFIED WITH METHOD ANALYTESa
Compound Initial
R (%)
Day 7 R
(%)
Day 14 R
(%)
Day 21 R
(%)
Day 28 R
(%)
Monochloroacetic Acid (MCAA) 98.2 95.8 99.2 98.3 98.3
Monobromoacetic Acid (MBAA) 98.9 98.7 99.3 98.8 98.8
Dalapon 100 101 101 100 101
Dichloroacetic Acid (DCAA) 97.5 96.4 97.3 97.4 97.0
Trichloroacetic Acid (TCAA) 99.6 101 100 102 102
Bromochloroacetic Acid (BCAA) 101 102 101 102 102
Bromodichloroacetic Acid (BDCAA) 103 104 102 108 108
Dibromoacetic Acid (DBAA) 100 101 100 102 102
Chlorodibromoacetic Acid (CDBAA) 103 106 102 110 110
Tribromoacetic Acid (TBAA) 104 108 103 110 111
aExtract storage stability was conducted on three of the eight extracts from the precision and accuracy study conducted in chlorinated surface water (fortified at 10 µg/L) reported in Table 9. Sample storage stability is expressed as a recovery value (%) calculated as described in Section 9.8.2. All values have been corrected for background levels in the unfortified sample based on triplicate measurements as described in Table 9. Extracts were stored at < -10 °C.
552.3-47

TABLE 15: INITIAL DEMONSTRATION OF CAPABILITY (IDC) REQUIREMENTS
Method Reference
Requirement Specification and Frequency
Acceptance Criteria
Section 9.2.1
Section 9.2.2
Section 9.2.3
Initial Demonstration of Low Method Background
Initial Demonstration of Accuracy
Initial Demonstration of Precision
Analyze LRB prior to any other IDC steps
Analyze QCS
Analyze 4-7 replicate LFBs fortified at midrange concentration.
Calculate standard deviation and RSD for replicates used in the Initial Demonstration of Accuracy (Sect. 9.2.2)
Over a period of three days, prepare a minimum of 7 replicate LFBs fortified at a concentration estimated to be near the Detection Limit. Analyze the replicates through all steps of the analysis. Calculate the Detection Limit using the equation in Section 9.2.4.
Demonstrate that LRB is reasonably free of contamination.
Recovery for analytes must be ± 30% of expected value. Mean recovery must be within ± 20% of expected value.
RSD must be # 20%.
Note: Data from DL replicates are not required to meet method precision and accuracy criteria. If the DL replicates are fortified at a low enough concentration, it is likely that they will not meet precision and accuracy criteria.
Section 9.2.4
Detection Limit Determination
Section 9.2.5
Minimum Reporting Limit
Estimate after determining DL and prior to analysis of Field Samples
At least 3 times the DL or at a concentration which yields a signal-to-noise ratio of at least 5.
552.3-48

TABLE 16: QUALITY CONTROL REQUIREMENTS (SUMMARY)
Method Reference
Requirement Specification and Frequency
Acceptance Criteria
Section 8.3 Sample Shipment and Storage
Section 8.4 Sample Holding Time
Section 8.4 Extract Holding Time
Sample results are valid only if extracts are properly stored and analyzed within extract hold time.
Section 9.3 Laboratory Reagent Blank (LRB)
With each extraction batch of up to 20 samples
Demonstrate that all target analytes in LRB are below 1/3
the MRL and that interferences do not prevent the identification and quantification of method analytes. 1/3
the MRL, results for all problem analytes in extraction batch are invalid.
If targets exceed
Samples must not exceed 10 °C within 48 hours after collection. in laboratory must not exceed 6 °C.
14 days with appropriate preservation and storage
21 days at # -10 °C protected from light (MTBE) 28 days at # -10 °C protected from light (TAME)
Samples stored
Sample results are valid only if samples are properly collected, preserved, and stored.
Sample results are valid only if samples are extracted within sample hold time.
552.3-49

TABLE 16: QUALITY CONTROL REQUIREMENTS (SUMMARY)
Method Reference
Requirement Specification and Frequency
Acceptance Criteria
Sections 9.4 and 10.3
Continuing Calibration Check (CCC)
Verify initial calibration by analyzing a calibration standard at the beginning of each analysis batch, after every 10 samples, and after the last sample.
Low CCC - # MRL Mid CCC - near midpoint in initial calibration curve High CCC - near highest calibration standard
1) The result for each analyte must be 70-130% of the expected value for all but the lowest standard. lowest standard must be 50-150% of the expected value. 2) The peak area of internal standards must be 50-150% of the average peak area calculated during the initial calibration. Results for analytes that do not meet IS criteria or are not bracketed by acceptable CCCs are invalid.
The
Section 9.6 Internal Standard (IS)
Section 9.7 Surrogate Standard (SUR)
Section 9.8 Laboratory Fortified Sample Matrix (LFSM) and Laboratory Fortified Matrix Duplicate (LFSMD)
1,2,3 Trichloropropane is added to the extraction solvent.
2-bromobutanoic acid [80-58-0] is added to all calibration standards and samples, including QC samples.
Analyze one LFSM per analysis batch (20 samples or less) fortified with method analytes at a concentration greater than the native concentration. LFSMD should be used in place of Field Duplicate if frequency of detects for target analytes is low.
Peak area counts for the IS in all injections must be within 50-150% of the average peak area calculated during the initial calibration. does not meet criteria, corresponding target results are invalid.
Surrogate recovery must be 70-130% of the expected value. If surrogate fails this criterion, report all results for sample as suspect/surrogate recovery.
Recoveries at mid and high levels not within 70-130% or low-level recoveries not within 50-150% of the fortified amount may indicate a matrix effect. Target analyte RPDs for LFSMD not within ± 30% at mid and high levels of fortification and within ± 50% near MRL may indicate a matrix effect.
If the IS
552.3-50
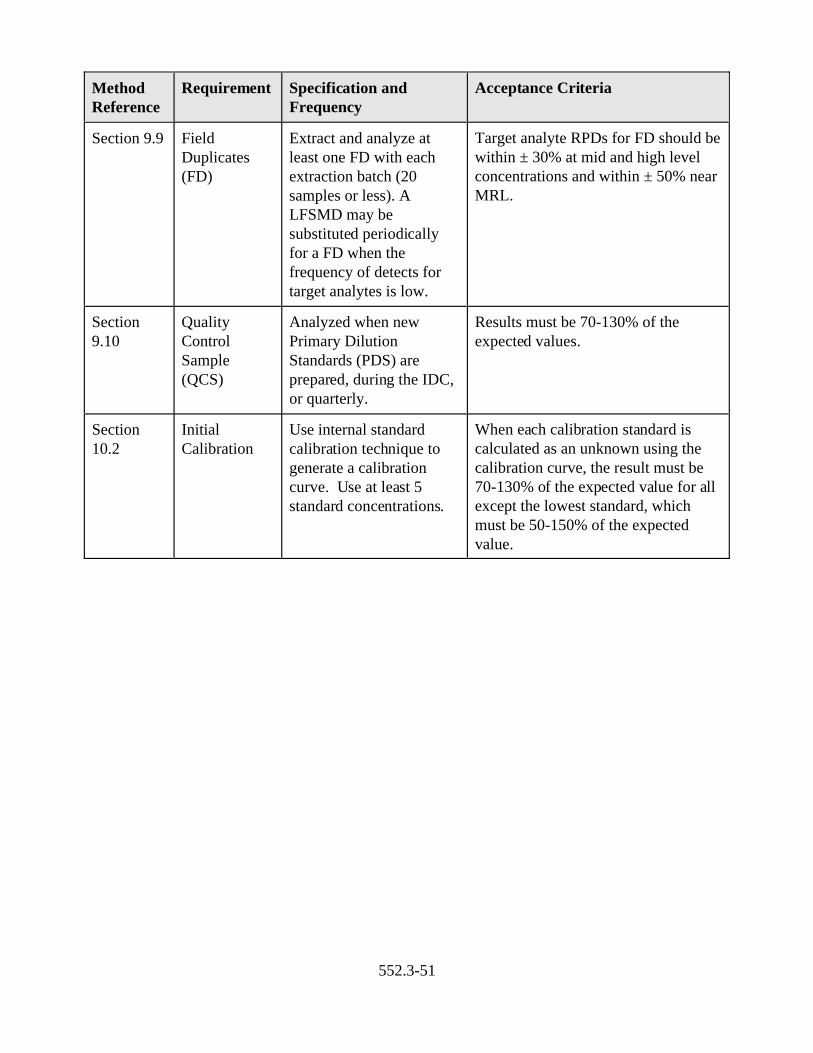
Method Reference
Requirement Specification and Frequency
Acceptance Criteria
Section 9.9 Field Duplicates (FD)
Extract and analyze at least one FD with each extraction batch (20 samples or less). A LFSMD may be substituted periodically for a FD when the frequency of detects for target analytes is low.
Target analyte RPDs for FD should be within ± 30% at mid and high level concentrations and within ± 50% near MRL.
Section 9.10
Quality Control Sample (QCS)
Analyzed when new Primary Dilution Standards (PDS) are prepared, during the IDC, or quarterly.
Results must be 70-130% of the expected values.
Section 10.2
Initial Calibration
Use internal standard calibration technique to generate a calibration curve. se at least 5 standard concentrations.
When each calibration standard is calculated as an unknown using the calibration curve, the result must be 70-130% of the expected value for all except the lowest standard, which must be 50-150% of the expected value.
U
552.3-51

FIGURE 1: CHROMATOGRAM OF THE HALOACETIC ACIDS ON A DB-1701 COLUMN USING THE CHROMATOGRAPHIC CONDITIONS GIVEN IN TABLE 1 USING THE MTBE PROCEDURE
552.3-52
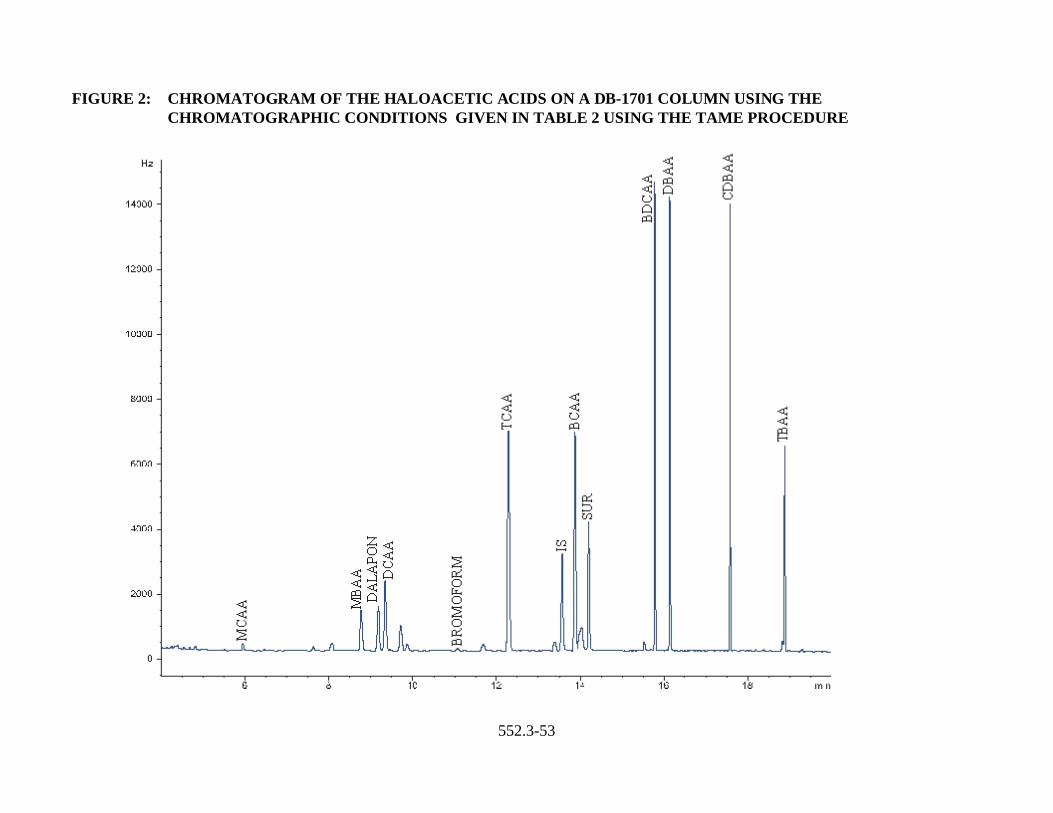
FIGURE 2: CHROMATOGRAM OF THE HALOACETIC ACIDS ON A DB-1701 COLUMN USING THE CHROMATOGRAPHIC CONDITIONS GIVEN IN TABLE 2 USING THE TAME PROCEDURE
552.3-53

FIGURE 3: CHROMATOGRAM OF THE HALOACETIC ACIDS ON A DB-5.625 COLUMN USING THE CHROMATOGRAPHIC CONDITIONS GIVEN IN TABLE 3 USING THE MTBE PROCEDURE
552.3-54

FIGURE 4: CHROMATOGRAM OF THE HALOACETIC ACIDS ON A DB-5.625 COLUMN USING THE CHROMATOGRAPHIC CONDITIONS GIVEN IN TABLE 4 USING THE TAME PROCEDURE
552.3-55