reaching global nutrition targets: improving commitments and accountability in the african context
Upload: african-regional-strategic-analysis-and-knowledge-support-system-resakss
Post on 23-Jan-2018
321 views
TRANSCRIPT

From Promise to Impact
ATOR, Accra, October 18,
2016

The Global Nutrition Report
• Independent
• Global
• All Forms of Nutrition
• Data Driven
• Encourages Accountability
Outline
• Key Findings
• Calls to Action
• Takeaways
• What you can do

Key Findings

1. Malnutrition creates ripples of individual and societal challenges & opportunities

Akin AdesinaPresident of the African Development Bank 2016
“We need to invest in gray matter infrastructure.”
“Neuronal infrastructure is quite possibly going to be the most important infrastructure.”
Jim Kim
President, World Bank 2016
We couldn’t have said it better ourselves..

16.5
11.510.3
7.7
6.35.6
3.1
Ethiopia Rwanda Malawi BurkinaFaso
Ghana Uganda Swaziland
(% of GDP)
Annual cost of undernutrition in 7 African countries
AUC/WFP Cost of Hunger Studies

2. Africa is off track to reach global targets—but there is hope.

9Stunting children under 5
Wastingchildren under 5
Overweightchildren under 5
Anemiawomen aged 15-49 years
Exclusive Breastfeeding, <6 months
Adult Overweight + Obesity (BMI≥ 25)
Adult Obesity (BMI≥ 30)
Adult Diabetes(Raised blood glucose)
3465
3
7
1
16
17
23
1
23
34
987
52
312
54
54
53 1
Global Target
Missing data Off course, little/no progress Off course, some progress On courseOn course, at risk
Number of African countries at various stages of progress against global targets on nutrition

3. Nutrition is central to the SDGs

Nutrition feeds into 12 of the 17 SDGs — and dozens of the indicators used to track the SDGs
1
1
2
2
3
3
3
3
7
7
12
12
Goal 12: Sustainable cons &…
Goal 17: Global Partnerships
Goal 8: Growth & Employment
Goal 16: Peace and Justice
Goal 4: Education
Goal 6: WASH
Goal 10: Reduce Inequality
Goal 11: Cities
Goal 1: Poverty
Goal 2: Hunger and Nutrition
Goal 3: Healthy Lives
Goal 5: Gender Equality
Number of indicators highly relevant to nutrition
Number of indicators not highly relelvant to nutrition

4. There is a gap between current commitments and need

There are not enough SMART targets in African nutrition country plans
75 73
55
45
35
10
Stunting Exclusivebreastfeeding
Wasting Anaemia inwomen
Low birthweight
Under 5overweight
Percent of 40 African Nutrition Plans with SMART Targets for…

Few African Countries have Targets for Diet Related NCDs
Source: Unpublished self-reported data from the NCD Country Capacity Survey, provided by the WHO
Surveillance and Population-based Prevention Unit, Department for Prevention of NCDs. Printed with permission.
%
Percent of 40 countries with targets for…
40
35
15
Obesity Diabetes Salt Reduction

5. SMART Commitments and Targets Matter

Commitment and Impact go hand in hand
• Countries: Nutrition targets & rate of stunting reduction
• Companies: Targets & performance
• Donors: Public commitment & spending on nutrition
Commitment and Impact go hand in
hand

6. We must move beyond talk to action

Coverage of nutrition-specific interventions remains highly variable across African countries
0
10
20
30
40
50
60
70
80
90
100
Exclusivebreastfeeding <6
months
Minimum dietarydiversity (6-23
months)
Zinc treatmentfor diarrhoea (U5)
Iron-Folic acidsuppl. 90+ days
(pregnant women)
Iron suppl. (U5) Vitamin A suppl.(U5)
Salt iodization(household)

7. Today’s nutrition data are not sufficient to maximize investment

Stunting prevalence by region within 34 African countries
0
10
20
30
40
50
60
70
80
Stu
nti
ng
(%)
Lowest stunting region Highest stunting region

Map of stunting rates in Cambodia

Calls to Action

1. Make the political choice to end all
forms of malnutrition

Reject current trends
continuation of current trends
WHA goal
15% by 2025
15% by 2084
Anemia in Women

The ingredients for success are well known… ...and can
lead to rapid improvements in nutrition.Political leadership
& SMART
commitment
Brazil
Ethiopia
Maharashtra
Nutrition-
oriented
development
Bangladesh
Colombia
Ghana
Tanzania
Data
Systems
Guatemala
Indonesia
Peru
Strong
implementation
Argentina
Burkina Faso
Chile

2. Invest more and allocate better

To meet WHA targets by 2025 nutrition specific
funding will have to multiply
Governments x 2
Donors x 3.5
Total x 3
Funding gaps: Substantial but bridgeable

Source: OPM and SUN SMS
More general government expenditure could be directed towards nutrition-
sensitive actions
Budget allocations to nutrition sensitive actions in these countries are relatively low
4.8
2.1
1.5 1.4 1.2 1.2 1.1 1 0.8 0.6 0.6 0.50.1
% o
f G
en
era
l Go
vern
me
nt
Exp
en
dit
ure
s

3. Invest in proven solutions & find new ones

agriculture and food
systems
social protection
women’s
empowerment
WASH
education
There are many ways to support nutrition

Look outside nutrition to affect
nutrition status, e.g. mothers’ age at birth
0
10
20
30
40
50
60
Stu
nti
ng
(%)
Mothers aged <18 at the time of the birth ≥18

4. Tackle malnutrition in all its
forms
25%A quarter of all African countries have serious levels of undernutrition and adult overweight/obesity

Under 5 Stunting
Women’s Anemia
Adult Overweight (BMI ≥ 25)Ethiopia, Rwanda
Ghana, Senegal
Angola, Benin, Burkina Faso, Burundi, Cameroon, Central African Republic, Chad, Comoros, Congo (Republic of The), Côte d’Ivoire, Democratic Republic of the Congo, Djibouti, Eritrea, Gambia, Guinea, Guinea-Bissau, Kenya, Liberia, Madagascar, Malawi, Mali, Mauritania, Mozambique, Niger, Nigeria, Sao Tome and Principe, Sierra Leone, Somalia, Sudan, Togo, Uganda, Tanzania, Zambia, Zimbabwe
Algeria, Gabon, Morocco, Seychelles, Tunisia
Botswana, Egypt, Equatorial Guinea, Lesotho, Libya, Namibia, South Africa, Swaziland
Countries with Multiple
Burdens of Malnutrition

• Develop political strategies for an enabling environment for nutrition improvement
• Build food environments for diverse diets
• Implement interventions before and during first 1000 days
Find “Double Duty” Actions to address multiple forms of malnutrition
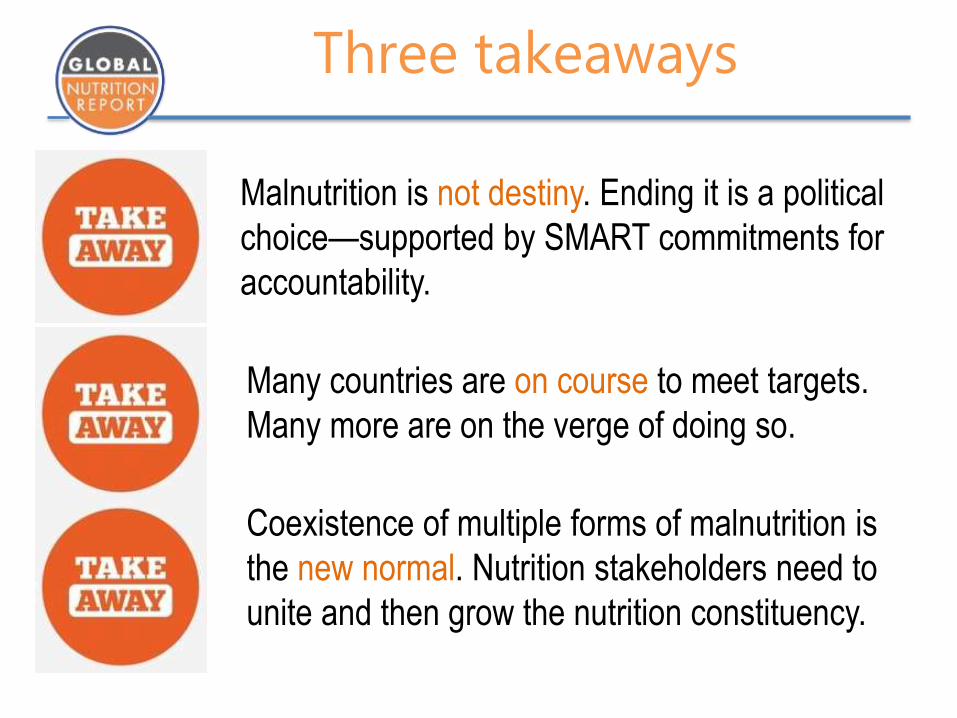
Malnutrition is not destiny. Ending it is a political
choice—supported by SMART commitments for
accountability.
Many countries are on course to meet targets.
Many more are on the verge of doing so.
Coexistence of multiple forms of malnutrition is
the new normal. Nutrition stakeholders need to
unite and then grow the nutrition constituency.
Three takeaways

Three things you can do
• Challenge decision makers with evidence onthe slow pace of malnutrition reduction
• Make those essential but challenging alliances for nutrition with those outside your immediate circle
• Make SMART commitments for nutrition and ask others to do the same

Thank you