radiological benchmarks for screening contaminants of potential
TRANSCRIPT

BJC/OR-80
Radiological Benchmarks for ScreeningContaminants of Potential Concern
for Effects on Aquatic Biotaat Oak Ridge National Laboratory,
Oak Ridge, Tennessee
This document has been approvedfor release to the public. Date: 7/30/98

BJC/OR-80
Radiological Benchmarks for Screening Contaminants of Potential Concern
for Effects on Aquatic Biotaat Oak Ridge National Laboratory,
Oak Ridge, Tennessee
Date Issued—July 1998
Prepared for theU.S. Department of Energy
Office of Environmental Management
BECHTEL JACOBS COMPANY LLCmanaging the
Environmental Management Activities at theEast Tennessee Technology Park
Oak Ridge Y-12 Plant Oak Ridge National LaboratoryPaducah Gaseous Diffusion Plant Portsmouth Gaseous Diffusion Plant
under contract DE-AC05-9822700for the
U.S. DEPARTMENT OF ENERGY

iii
CONTENTS
TABLES . . . . . . . . . . . . . . . . . . . . . . . . . . . . . . . . . . . . . . . . . . . . . . . . . . . . . . . . . . . . . . . . . . v
FIGURES . . . . . . . . . . . . . . . . . . . . . . . . . . . . . . . . . . . . . . . . . . . . . . . . . . . . . . . . . . . . . . . . . v
ABBREVIATIONS . . . . . . . . . . . . . . . . . . . . . . . . . . . . . . . . . . . . . . . . . . . . . . . . . . . . . . . . . vii
EXECUTIVE SUMMARY . . . . . . . . . . . . . . . . . . . . . . . . . . . . . . . . . . . . . . . . . . . . . . . . . . . ix
1. INTRODUCTION . . . . . . . . . . . . . . . . . . . . . . . . . . . . . . . . . . . . . . . . . . . . . . . . . . . . . . . . . 1
2. BENCHMARK DEVELOPMENT APPROACH AND ASSUMPTIONS . . . . . . . . . . . . . . . 22.1 ORIGINAL FORMULAS . . . . . . . . . . . . . . . . . . . . . . . . . . . . . . . . . . . . . . . . . . . . . . . 22.2 CONVERTED FORMULAS . . . . . . . . . . . . . . . . . . . . . . . . . . . . . . . . . . . . . . . . . . . . . 32.3 PARAMETER VALUES AND EXPOSURE ASSUMPTIONS . . . . . . . . . . . . . . . . . . . 4
2.3.1 Adsorbed Dose . . . . . . . . . . . . . . . . . . . . . . . . . . . . . . . . . . . . . . . . . . . . . . . . . . . 42.3.2 Uptake . . . . . . . . . . . . . . . . . . . . . . . . . . . . . . . . . . . . . . . . . . . . . . . . . . . . . . . . . 42.3.3 Radioactive Decay Chains . . . . . . . . . . . . . . . . . . . . . . . . . . . . . . . . . . . . . . . . . 14
2.4 BENCHMARK VALUES . . . . . . . . . . . . . . . . . . . . . . . . . . . . . . . . . . . . . . . . . . . . . . 14
3. BENCHMARK USE IN ECOLOGICAL RISK ASSESSMENTS . . . . . . . . . . . . . . . . . . . . 193.1 GENERAL CONSIDERATIONS . . . . . . . . . . . . . . . . . . . . . . . . . . . . . . . . . . . . . . . . 193.2 APPLICATION OF THE BENCHMARKS . . . . . . . . . . . . . . . . . . . . . . . . . . . . . . . . . 203.3 EXAMPLE APPLICATION . . . . . . . . . . . . . . . . . . . . . . . . . . . . . . . . . . . . . . . . . . . . 21
4. REFERENCES . . . . . . . . . . . . . . . . . . . . . . . . . . . . . . . . . . . . . . . . . . . . . . . . . . . . . . . . . . 24

v
TABLES
1. Dimensions of organisms representing different size categories used in the Point Source Dose Distribution methodology for estimating radiation doses . . . . . . . . . . . . . . . . . . 2
2. Emission energies (E) and absorbed fractions (M) for selected radionuclides . . . . . . . . . . . . . 53. Distribution co-efficients (Kds) and biological concentration factors (BCFs)
for selected radionuclides . . . . . . . . . . . . . . . . . . . . . . . . . . . . . . . . . . . . . . . . . . . . . . . . . . . 94. Single-media benchmarks for selected radionuclides in water and sediment . . . . . . . . . . . . . 155. Multimedia benchmarks for selected radionuclides in water and sediment . . . . . . . . . . . . . . 176. Example 1: Use of single-media benchmarks for the calculation
of hazard quotients (HQs) and hazard indices (HIs) . . . . . . . . . . . . . . . . . . . . . . . . . . . . . . . 227. Example 2: Use of multimedia benchmarks for the calculation
of hazard quotients (HQs) and hazard indices (HIs) . . . . . . . . . . . . . . . . . . . . . . . . . . . . . . . 23
FIGURES
1. Derived absorbed fractions as a function of gamma energy for small fish,large insects and molluscs, and small insects and larvae . . . . . . . . . . . . . . . . . . . . . . . . . . . 10
2. Derived absorbed fractions as a function of gamma energy for large fish . . . . . . . . . . . . . . . 113. Derived absorbed fractions as a function of beta energy for small fish, large insects
and molluscs, and small insects and larvae . . . . . . . . . . . . . . . . . . . . . . . . . . . . . . . . . . . . . 12
vii
ABBREVIATIONS
BCF biological concentration factorDOE U.S. Department of EnergyHI hazard index HQ hazard quotientIAEA International Atomic Energy AgencyICRP International Commission on Radiological ProtectionNCRP National Council on Radiation Protection and Measurements

ix
EXECUTIVE SUMMARY
A hazardous waste site may contain hundreds of contaminants; therefore, it is important to screencontaminants of potential concern for the ecological risk assessment. Often this screening is done aspart of a screening assessment, the purpose of which is to evaluate the available data, identify datagaps, and screen contaminants of potential concern (Suter 1995). Screening may be accomplished byusing a set of toxicological benchmarks. These benchmarks are helpful in determining whethercontaminants warrant further assessment or are at a level that requires no further attention.
Blaylock, Frank, and O’Neal (1993) provide formulas and exposure factors for estimating thedose rates to representative aquatic organisms. Those formulas were used herein to calculate the waterand sediment concentrations that result in a total dose rate to fish from selected radionuclides of 1 radd-1, which is the recommended acceptable dose rate to natural populations of aquatic biota (NCRP1991). Unlike exposures to chemicals, which are expressed as the concentration in water or sediment,exposures to radionuclides are expressed as the dose rate received by the organism. Dose rates thataccount for the biological effects to the organism are additive. That is, the total dose rate is the sumof the normalized dose rates for each radionuclide. The screening values presented in this documentinclude internal and external exposures from parent isotopes and all short-lived daughter products.They also include exposures from all major alpha, beta, and gamma emissions for each isotope. If thetotal dose rate from all radionuclides and exposure pathways exceeds a recommended threshold,further analysis is needed to determine the hazards posed by radionuclides. If, however, the total doserate falls below an acceptable threshold, radionuclides may be eliminated from further study.
The radiological benchmarks in this report are to be used at the U.S. Department of Energy’s OakRidge Reservation and at the Portsmouth and Paducah gaseous diffusion plants as screening valuesonly to show the nature and extent of contamination and identify the need for additional site-specificinvestigation (e.g., biological and chemical testing and realistic exposure modeling). The basis forestimating acceptable dose rates to aquatic biota are presented in Blaylock, Frank, and O’Neal (1993)and not repeated herein. Hence, this document is intended to supplement, rather than replace, Blaylock,Frank, and O’Neal (1993).
The benchmark development approach presented in this document constitutes a significantexpansion and improvement over that used in a previous version of this document (Jones 1997). First,sediment screening benchmarks for benthic invertebrates were replaced with sediment screening valuesfor fish because vertebrates are more radiosensitive than invertebrates (NCRP 1991). Second, thereare now two suites of benchmarks for water and sediment: those that consider exposures from only onemedium and those that incorporate exposures from multiple media. And third, several radionuclideswere added.

1
1. INTRODUCTION
A hazardous waste site may contain hundreds of contaminants; therefore, it is important to screencontaminants of potential concern for the ecological risk assessment. Often this screening is done aspart of a screening assessment, the purpose of which is to evaluate the available data, identify datagaps, and screen contaminants of potential concern (Suter 1995). Screening may be accomplished byusing a set of toxicological benchmarks. These benchmarks are helpful in determining whethercontaminants warrant further assessment or are at a level that requires no further attention.
Unlike exposures to chemicals, which are expressed as the concentration in water or sediment,exposures to radionuclides are expressed as the dose rate received by the organism. Dose rates thataccount for the biological effects to the organism are additive. That is, the total dose rate is the sumof the normalized dose rates for each radionuclide. If the total dose rate exceeds a recommendedacceptable dose rate, further analysis is needed to determine the hazards posed by radionuclides. If,however, the total dose rate falls below an accepted dose rate limit, radionuclides may be eliminatedfrom further study.
The recommended acceptable dose rate to natural populations of aquatic biota is 1 rad d-1 (NCRP1991). Blaylock, Frank, and O’Neal (1993) provide formulas and exposure factors for estimating thedose rates to representative aquatic organisms. Those formulas were used herein to calculate the waterand sediment concentrations that result in a total dose rate of 1 rad d-1 to fish for selectedradionuclides. These radiological benchmarks are intended for use at the U.S. Department of Energy’s(DOE’s) Oak Ridge Reservation and at the Portsmouth and Paducah gaseous diffusion plants asscreening values only to show the nature and extent of contamination and identify the need foradditional site-specific investigation (e.g., biological surveys and realistic exposure modeling). Thebases for estimating acceptable dose rates to aquatic biota are discussed in Blaylock, Frank, andO’Neal (1993) and are not repeated herein. Hence, this document is intended to supplement, ratherthan replace, Blaylock, Frank, and O’Neal (1993).
The benchmark development approach presented in this document constitutes a significantexpansion and improvement over that used in a previous version of this document (Jones 1997). First,sediment screening benchmarks for benthic invertebrates were replaced with sediment screening valuesfor fish, because vertebrates are more radiosensitive than invertebrates (NCRP 1991). Second, thereare now two suites of benchmarks for water and sediment: those that consider exposures from only onemedium and those that incorporate exposures from multiple media. And third, several radionuclideswere added.
It should be noted that the DOE Office of Environmental Policy and Assistance is currentlydeveloping a screening methodology and associated guidance that could be used in demonstratingcompliance with DOE and internationally recommended dose limits for aquatic and terrestrial biota.The methodology is being designed to be prudently conservative to allow for DOE-wide applicationThe methodology will be extensively reviewed within DOE and by other federal (e.g., NuclearRegulatory Commission and U.S. Environmental Protection Agency) and international (e.g.,International Atomic Energy Agency) agencies, consistent with the DOE technical standards reviewprocess. It is not yet known how the final national screening values and associated guidance will relateto site-specific screening values already developed or under development. However, the approach takenherein is conceptually consistent with the methodology currently being developed at the national level.

2
2. BENCHMARK DEVELOPMENT APPROACH AND ASSUMPTIONS
The methodology for estimating radiation dose rates presented in Blaylock, Frank, and O’Neal(1993) is the “Point Source Dose Distribution” approach (IAEA 1976, 1979). This approach usesempirically derived dose rate formulas for selected size categories of organisms, which are representedby ellipsoid geometries of the dimensions presented in Table 1. These geometries are used to estimatethe fraction of the energy emitted from a radionuclide that is absorbed by the organism. That is,gamma rays and beta particles with sufficiently high energies can pass all the way through anorganism, and large organisms will absorb more of the emitted energy than will small organisms.
Table 1. Dimensions of organisms representing different size categories used in the Point Source Dose Distribution methodology
for estimating radiation doses
Organism Mass (kg) Length of the major axes of the ellipsoid (cm)
Small fish 2.0 × 10⁻³ 3.1 × 1.6 × 0.78
Large fish 1.0 45 × 8.7 × 4.9
Exposures to radionuclides are expressed as the total dose rate received by the organism. Thedose rate from an individual radionuclide is the sum of the internal and external dose rates, which area function of exposure to the radionuclide and the characteristics of the radiation. The internal doserate is based on the concentration of the radionuclide in the organism. The external dose rate is basedon the concentration of the radionuclide in the surrounding water or sediment.
2.1 ORIGINAL FORMULAS
Blaylock, Frank, and O’Neal (1993) gave the dose rate (µGy h-1) from internal contamination asthe following:
D = 5.76 × 10⁻⁴ E n M Co , (1)
where5.76 × 10-4 = the conversion factor from MeV dis-1 to µGy h-1,E = the average emitted energy for alpha, beta, or gamma radiations (MeV dis-1),n = the proportion of transitions producing an emission of energy E,M = the fraction of the emitted energy absorbed by the organism, andCo = the concentration of the radionuclide in the organism (Bq kg-1 wet weight).
The external dose rate (µGy h-1) from radionuclides in water was given as follows:
D = 5.76 × 10⁻⁴ E n (1 - M) Cw , (2)
where Cw is the concentration of the radionuclide in water (Bq L-1).

3
The external dose rate (µGy h-1) to organisms at the sediment-water interface from radionuclidesin sediment was given as follows:
D = 2.88 × 10⁻⁴ E n (1 - M) Cs , (3)
where Cs is the concentration of the radionuclide in sediment (Bq kg-1 wet weight) and 2.88 × 10⁻⁴
is one half of the MeV dis-1 to µGy h-1 conversion factor used for organisms immersed in contaminatedmedia.
2.2 CONVERTED FORMULAS
The formulas in Blaylock, Frank, and O’Neal (1993) properly used Standard International units(i.e., becquerels and grays). Those units were converted to curies and rads for convenience; these arethe units typically used on the Oak Ridge Reservation for reporting radionuclide activities andevaluating exposures. Specifically, the converted dose rates (Rad d-1) from an individual radioactiveisotope in the organism (D internal), in the water (D external, w), and in the surface sediment (D external, s) aregiven by:
D internal = 5.11 × 10⁻⁸ E n M Co , (4)
D external, w = 5.11 × 10⁻⁸ E n (1 - M) Cw , (5)
D external, s = 1.92 × 10⁻⁵ E n (1 - M) Cs , (6)
whereCo = the concentration of the radionuclide in the organism (pCi kg-1 wet weight),Cw = the concentration of the radionuclide in water (pCi L-1), andCs = the concentration of the radionuclide in sediment (pCi g-1 dry weight).
The formulas were derived using 0.01 Gy per rad and 2.703 × 10⁻¹¹ Ci per Bq as the unit conversionfactors. The sediment conversion factor of 1.92 × 10⁻⁵ includes the default wet weight-dry weightconversion factor of 0.75 presented in NCRP (1991).
It is important to note that these formulas are the same for each type of radiation (i.e., alpha, beta,and gamma), but the dose from each must be calculated separately. That is, the emission energy (E)is specific to the isotope and type of radiation. For any given isotope, the total dose rate from eachpathway is the sum of the dose rates from each type of radiation. For example:
D internal, total = D internal, alpha + D internal, beta + D internal, gamma (7)
Then, for each isotope, the total dose rate (D Total) is the sum of the total internal dose (D internal, total), thetotal external dose from water (D external, w, total), and the total external dose from surface sediment (Dexternal, s, total).

4
2.3 PARAMETER VALUES AND EXPOSURE ASSUMPTIONS
2.3.1 Adsorbed Dose
The absorbed dose is a function of the emission energy (E) and the absorbed fraction (M) of theradiation. Emission energies (E) of selected radionuclides are presented in Table 2. As in Blaylock,Frank, and O’Neal (1993), the average energies were obtained from the International Commission onRadiological Protection Report No. 38 (ICRP 1983) and can be used in place of E and n inEqs. (4)–(6). The average energies include all radiations that contribute at least 0.1% of the energy pertransformation (ICRP 1983). Average beta energies include beta particles, conversion electrons, andAuger radiations. Average gamma energies include x-rays, gamma-rays, and photon radiations.Average alpha energies include alpha particles and recoil nuclei. The maximum beta energies presentedin Table 2 are from The Health Physics and Radiological Health Handbook and the 1986 supplementthereof (Shleien and Terpilak 1984, 1986), except as noted.
The absorbed fraction (M) of a beta or gamma radiation is a function of the energy of thatradiation and the size of the target organism. Figures 1–3 present empirically derived absorbedfractions as a function of beta and gamma emission energies for the organism sizes used herein. Table2 presents the estimated absorbed fractions for small and large fish based on these figures. Figure 3was derived for maximum beta energies, which were not found for all of the beta-emitters listed inTable 2. In the absence of maximum beta energies, the absorbed fractions were based on average betaenergies. This will tend to overestimate the internal dose rate and under estimate the external dose rate.Essentially all of the energy from alpha particles emitted from internal contamination is absorbedwithin organisms of the sizes listed in Table 1. It is therefore assumed that the absorbed fraction (M)is 1 for all alpha emissions and that external alpha radiation from water and sediment is insignificantfor these organisms. This also is true for beta emissions into large fish.
The absorbed dose, as calculated in Eqs. (4)–(6), does not account for the relative biologicaleffectiveness of the different types of radiation. A quality factor is normally used to account for therelative effects of the different radiation types (NCRP 1987; Blaylock, Frank, and O’Neal 1993). Thestandard quality factors for exposure of humans are 1 for gamma and beta radiations and 20 for alpharadiations. However, those factors account for the potential to cause cancer, which is not an endpointof concern for natural populations of aquatic biota. Similar values might be expected for aquaticorganisms because the soft tissue composition of non-human vertebrates is generally similar to humansin water content and basic cell structure (NCRP 1991). In the absence of standard quality factors fornon-human biota, the default values for humans were used herein, as recommended by Blaylock,Frank, and O’Neal (1993). That is, the absorbed dose from alpha emissions was multiplied by 20 sothat the total dose rate is normalized for the biological effectiveness of the absorbed dose rates of eachtype of radiation.
2.3.2 Uptake
Radionuclide uptake from water was estimated using the biological concentration factors (BCFs)for freshwater fish presented in IAEA Report No. 364 (IAEA 1994), except as noted (Table 3). TheBCF is the ratio of the radionuclide concentration in the organism and the radionuclide concentrationin water. Therefore, the internal concentration (Co) equals the concentration in water times the BCF.The available BCFs were based on analyses of fish muscle, rather than whole fish. These uptakefactors will under estimate Co for radionuclides that are preferentially sequestered in other tissues (e.g.,bone, liver, and the gastrointestinal tract). However, the assumption of uniform contamination isunlikely to grossly underestimate the actual dose to the tissues of concern (i.e., reproductive organs),given two conditions. First, the isotope of concern is

5
Table 2. Emission energies (E) and absorbed fractions (MM) for selected radionuclidesa
Absorbed Fractionsc
Emission Energies (MeV) Beta Gamma
Radionuclide (yield) Half-lifeAverageAlpha
MaximumBetab
AverageBeta
AverageGamma
SmallFish Small Fish Large Fish
Antimony-125 2.77y 6.12e-01 9.93e-02 4.30e-01 1 0.012 0.09
Barium-140 12.74d 1.01e+00 3.11e-01 1.82e-01 1 0.01 0.1
Lanthanum-140 40.27h 2.20e+00 5.33e-01 2.31e+00 0.91 0.0095 0.07
Cerium-141 32.501d 5.80e-01 1.70e-01 7.61e-02 1 0.01 0.06
Cerium-144 284.3d 3.18e-01 9.10e-02 2.07e-02 1 0.17 0.6
Praseodymium-144m (98.22% of Ce-144) 7.2m 4.72e-02 1.27e-02 1 0.4 0.81
Praseodymium-144 (1.78% of Ce-144) 17.28m 3.00e+00 1.21e+00 3.18e-02 0.81 0.053 0.35
Cesium134 2.062y 6.58e-01 1.63e-01 1.55e+00 1 0.01 0.08
Cesium-137 30y 1.17e+00 1.87e-01 0.99
Barium-137m (94.6% of Cs-137) 2.55m 6.51e-02 5.96e-01 1 0.012 0.12
Chromium-51 27.704d 3.86e-03 3.26e-02 1 0.04 0.33
Cobalt-60 5.271y 3.18e-01 9.65e-02 2.50e+00 1 0.0095 0.07
Europium-154 8.8y 1.85e+00 2.88e-01 1.22e+00 0.95 0.01 0.1
Europium-155 4.96y 2.47e-01 6.26e-02 6.05e-02 1 0.013 0.09
Hydrogen-3 12.35y 1.86e-02 5.68e-03 1
Iodine-131 8.04d 8.07e-01 1.90e-01 3.80e-01 1 0.012 0.09
Xenon-131m (1.11% of I-131) 11.9d 1.44e-01 2.00e-02 1 0.17 0.62
Niobium-95 35.15d 1.60e-01 4.44e-02 7.66e-01 1 0.012 0.12
Phosphorous-32 14.29d 1.71e+00 6.95e-01 0.96
Potassium-40 1.28e+09y 1.32e+00 5.23e-01 1.56e-01 0.98 0.01 0.1
Ruthenium-103 39.28d 7.10e-01 7.45e-02 4.68e-01 1 0.012 0.1
Rhodium-103m (99.7% of Ru-103) 56.12m 3.80e-02 1.75e-03 1 0.7 0.94
Ruthenium-106 368.2d 3.90e-02 1.00e-02 1

6
Table 2 (continued)
Absorbed Fractionsc
Emission Energies (MeV) Beta Gamma
Radionuclide (yield) Half-lifeAverageAlpha
MaximumBetab
AverageBeta
AverageGamma
SmallFish Small Fish Large Fish
Rhodium-106 29.9s 3.54e+00 1.41e+00 2.01e-01 0.71 0.012 0.1
Sodium-24 15h 1.39e+00 5.53e-01 4.12e+00 0.98 0.005 0.08
Strontium-90 29.12y 5.46e-01 1.96e-01 1
Yttrium-90 64h 2.28e+00 9.35e-01 1.69e-06 0.9 1 1
Techetium-99 213000y 2.95e-01 1.01e-01 1
Uranium-237 6.75d 2.48e-01 1.94e-01 1.42e-01 1 0.01 0.11
Zinc-65 243.9d 3.30e-01 6.87e-03 5.84e-01 1 0.012 0.12
Zirconium-95 63.98d 1.23e+00 1.16e-01 7.39e-01 0.99 0.012 0.12
Plutonium-239 24065y 5.23e+00 6.65e-03 7.96e-04 1 1 1
Plutonium-240 6537y 5.24e+00 1.06e-02 1.73e-03 1 0.7 0.94
Thorium-232 1.405e+10y 4.07e+00 1.25e-02 1.33e-03 1 0.7 0.94
Radium-228 5.75y 5.50e-02 1.69e-02 4.14e-09 1 1 1
Actinium-228 6.13h 2.08e+00 4.60e-01 9.30e-01 0.93 0.012 0.11
Thorium-228 1.9131y 5.49e+00 2.05e-02 3.30e-03 1 0.7 0.94
Radium-224 3.66d 5.78e+00 2.21e-03 9.89e-03 1 0.7 0.94
Radon-220 55.6s 6.40e+00 8.91e-06 3.85e-04 1 1 1
Polonium-216 0.15s 6.91e+00 1.61e-07 1.69e-05 1 1 1
Lead-212 10.64h 5.86e-01 1.75e-01 1.48e-01 1 0.01 0.1
Bismuth-212 60.55m 2.22e+00 2.26e+00 4.69e-01 1.85e-01 0.91 0.01 0.1
Polonium-212 (64.07% of Bi-212) 0.305us 8.95e+00
Thallium-208 (35.93% of Bi-212) 3.07m 2.38e+00 5.91e-01 3.36e+00 1 0.0085 0.08
Americium-241 432.2y 5.57e+00 5.19e-02 3.24e-02 1 0.04 0.34
Neptunium-237 2.14e+06y 4.84e+00 6.85e-02 3.43e-02 1 0.034 0.3
Protactinium-233 27d 5.68e-01 1.95e-01 2.03e-01 1 0.012 0.1

7
Table 2 (continued)
Absorbed Fractionsc
Emission Energies (MeV) Beta Gamma
Radionuclide (yield) Half-lifeAverageAlpha
MaximumBetab
AverageBeta
AverageGamma
SmallFish Small Fish Large Fish
Uranium-233 158500y 4.89e+00 6.08e-03 1.31e-03 1 0.7 0.94
Thorium-229 7340y 4.95e+00 1.14e-01 9.54e-02 1 0.01 0.08
Radium-225 14.8d 3.20e-01 1.07e-01 1.37e-02 1 0.32 0.78
Actinium-225 10d 5.86e+00 2.17e-02 1.79e-02 1 0.2 0.67
Francium-221 4.8m 6.41e+00 9.81e-03 3.10e-02 1 0.053 0.37
Astatine-217 0.0323s 7.19e+00 3.66e-05 3.08e-04 1 1 1
Bismuth-213 45.65m 1.29e-01 1.42e+00 4.40e-01 1.33e-01 0.98 0.01 0.11
Polonium-213 (97.84% of Bi-213) 4.2us 8.54e+00
Lead-209 (2.16% of Bi-213) 3.253h 6.37e-01 1.98e-01 1
Uranium-238 4.468e+09y 4.26e+00 1.00e-02 1.36e-03 1 0.7 0.94
Thorium-234 24.1d 1.93e-01 5.92e-02 9.34e-03 1 0.7 0.94
Protactinium-234m 1.17m 1.50e+00 8.20e-01 1.13e-02 0.98 0.4 0.88
Protactinium-234 6.7h 1.40e+00 4.22e-01 1.75e+00 0.98 0.01 0.08
Uranium-234 2.445e+05y 4.84e+00 1.32e-02 1.73e-03 1 0.7 0.94
Thorium-230 7.7e+4y 4.74e+00 1.46e-02 1.55e-03 1 0.7 0.94
Radium-226 1600y 4.86e+00 3.59e-03 6.74e-03 1 0.7 0.94
Radon-222 3.8235d 5.59e+00 1.09e-05 3.98e-04 1 1 1
Polonium-218 3.05m 6.11e+00 1.42e-05 9.12e-06 1 1 1
Lead-214 (99.98% of Po-218) 26.8m 9.80e-01 2.91e-01 2.48e-01 1 0.012 0.09
Astatine-218 (0.02% of Po-218) 2s 6.82e+00 4.00e-02 6.72e-03 1 0.7 0.94
Bismuth-214 (100% of Pb-214 and At-218) 19.9m 3.27e+00 6.48e-01 1.46e+00 0.76 0.01 0.08
Polonium-214 164.3us 7.83e+00 8.19e-07 8.33e-05 1 1 1
Lead-210 22.3y 6.30e-02 3.80e-02 4.81e-03 1 0.7 0.94
Bismuth-210 5.012d 1.16e+00 3.89e-01 0.99

8
Table 2 (continued)
Absorbed Fractionsc
Emission Energies (MeV) Beta Gamma
Radionuclide (yield) Half-lifeAverageAlpha
MaximumBetab
AverageBeta
AverageGamma
SmallFish Small Fish Large Fish
Polonium-210 138.38d 5.40e+00 8.18e-08 8.50e-06 1 1 1
Uranium-235 7.038e+08y 4.47e+00 4.80e-02 1.54e-01 1 0.01 0.1
Thorium-231 25.52h 3.05e-01 1.63e-01 2.55e-02 1 0.08 0.45
Protactinium-231 3.276e+04y 5.04e+00 6.28e-02 4.76e-02 1 0.018 0.18
Actinium-227 21.773y 6.91e-02 4.30e-02 1.56e-02 2.31e-04 1 1 1
Thorium-227 (98.62% of At-227) 18.718d 5.95e+00 4.57e-02 1.06e-01 1 0.01 0.1
Francium-223 (1.38% of At-227) 21.8m 1.15e+00 3.91e-01 5.88e-02 0.99 0.013 0.1
Radium-223 (100% of Th-227 and Fr-223) 11.434d 5.75e+00 7.46e-02 1.33e-01 1 0.01 0.11
Radon-219 3.96s 6.88e+00 6.30e-03 5.58e-02 1 0.014 0.11
Polonium-215 0.178e-02s 7.52e+00 6.30e-06 1.76e-04 1 1 1
Lead-211 36.1m 1.39e+00 4.54e-01 5.03e-02 0.98 0.017 0.16
Bismuth-211 2.14m 6.68e+00 6.00e-01 9.78e-03 4.66e-02 1 0.019 0.19
Thallium-207 (99.72% of Bi-211) 4.77m 1.44e+00 4.93e-01 2.21e-03 0.98 0.7 0.94
Polonium-211 (0.28% of Bi-211) 0.516s 7.59e+00 1.69e-04 7.79e-03 1 0.7 0.94
Curium-244 18.11y 5.89e+00 8.59e-03 1.70e-03 1 0.7 0.94
Plutonium-238 87.74y 5.58e+00 1.06e-02 1.81e-03 1 0.7 0.94
aSelected isotopes are those presented in Blaylock, Frank, and O’Neal (1993) plus several minor daughter products and Cm-244 and Pu-238. Indented radionuclides are thedaughter products of the preceding long-lived radionuclide, as presented in Blaylock, Frank, and O’Neal (1993). Yields, half-lives, and average energies are from ICRP (1983).bMaximum beta energies presented are from The Health Physics and Radiological Health Handbook and the 1986 supplement thereof (Shleien and Terpilak 1984, 1986). Theexception is actinium-228, which is from Kocher (1981).cThe estimated absorbed fractions for small and large fish are based on Figs. 1–3. The absorbed fraction for all alpha emissions and for beta emissions into large fish are assumedto be 1. Absorbed fractions of beta energies are based on the maximum beta energies for each radionuclide except where maximum energies were unavailable, when they werebased on average beta energies.

9
Table 3. Distribution co-efficients (Kds) and biological concentration factors (BCFs) for selected radionuclidesa
Kd (L kg-1) BCF (L kg-1)Radionuclide Originalb Correctedc Originald Correctede
Actinium 450f 337.5 15g 75
Americium 5000 3750 30 150
Antimony 45f 33.75 100 500
Barium 60h 45 4 20
Cerium 10000 7500 30 150
Cesium 1000 750 2000 10000
Chromium 30f 22.5 200 1000
Cobalt 5000 3750 300 1500
Curium 5000 3750 30 150
Europium 500 375 50 250
Hydrogen 1 1
Iodine 10 7.5 40 200
Lead 270f 202.5 300 1500
Neptunium 10 7.5 30 150
Niobium 160f 120 300 1500
Phosphorous 9 6.75 50000 250000
Plutonium 100000 75000 30 150
Polonium 150f 112.5 50 250
Potassium 5.5h 4.125 10000g 50000
Protactinium 540h 405 10 50
Radium 500 375 50 250
Ruthenium 55f 41.25 10 50
Sodium 100h 75 20 100
Strontium 1000 750 60 300
Techetium 5 3.75 20 100
Thorium 10000 7500 100 500
Uranium 50 37.5 10 50
Zinc 500 375 1000 5000
Zirconium 1000 750 300 1500
aIncludes all radionuclides presented in Blaylock, Frank, and O’Neal (1993) that were not minor progeny plus 244Cmand 238Pu. Kds and BCFs are the same for different isotopes of the same element.bKds are the expected values for freshwater sediment Kd from IAEA (1994), except as noted.cKds were multiplied by a default wet weight-dry weight conversion factor of 0.75, which assumes that the freshweight of sediment is 25% water (NCRP 1991).dBCFs are the expected values for freshwater fish muscle from IAEA (1994), except as noted.eBCFs were divided by a default wet weight-dry weight conversion factor of 0.2, which assumes that the fresh weightof fish is 80% water (NCRP 1991).fThe lowest expected soil-water Kd from IAEA (1994). gBCF is from the CRITR2 code (Baker and Soldat 1992).hThe default soil Kd from Baes et al. (1984).

10
Fig. 1. Derived absorbed fractions as a function of gamma energy for small fish, large insects andmolluscs, and small insects and larvae. Source: NCRP (1991). Figures were enhanced by adding grid lines.

11
Fig. 2. Derived absorbed fractions as a function of gamma energy for large fish. Source: NCRP(1991). Figures were enhanced by adding grid lines.

12
Fig. 3. Derived absorbed fractions as a function of beta energy for small fish, large insects andmolluscs, and small insects and larvae. Source: NCRP (1991). Figures were enhanced by adding grid lines.

13
not preferentially sequestered in or near the reproductive tissues. Some elements are known to bepreferentially deposited in bone (e.g., strontium). However, reproductive tissues are not generallyexpected to be hyper-accumulators of radionuclides, based on the available human and animal data(Garten 1981, Garten et al. 1987, and Kaye and Dunaway 1962). The second condition is that theacceptable dose rate to the reproductive tissues are comparable to the acceptable whole-body doserates. This should be a reasonable assumption if the data used to derive the acceptable limits are basedprimarily on studies of exposure to high-energy photons (e.g., 137Cs or 60Co), which is generally thecase for non-human biota (NCRP 1991). That is, the reproductive organs would not be shielded byother tissues (e.g., muscle, bone, or skin) because high-energy photons would penetrate the organismcompletely.
The BCF for potassium is from IAEA (1982) because it was excluded from IAEA (1994) withoutexplanation. It is included here because K-40 is a naturally occurring isotope commonly reported ingamma spectral analyses. However, caution is advised in evaluating this and other biologically well-regulated elements (e.g., phosphorous, sodium, and zinc). The use of uptake factors depends on theassumption that the concentration of chemicals in organisms is a linear no-threshold function of theconcentration in water. This will not be the case for essential nutrients or toxicants for which theorganism has inducible mechanisms for metabolism or excretion. Well-regulated chemicals will havenearly constant concentrations regardless of water concentrations, at least within the effectiveconcentration range for the regulating mechanism. Hence, the reliability of the BCFs (and,consequently, the benchmarks) for such chemicals should be questioned if the screening indicates thatthey pose an unacceptable risk.
Radiation exposures to fish at the sediment/water interface are likely to be driven by externalexposures to contaminated sediments. The exception is for alpha-emitters, such as 234U and 230Th, forwhich internal exposure is the pathway of concern. Internal concentrations must be estimated from thesediment concentrations if collocated water samples were not collected (see Sect. 2.4). Standardsediment-to-fish transfer factors are not available. Therefore, the concentration in fish was estimatedby dividing the sediment concentration (Cs) by the sediment-water partition coefficient (Kd) presentedin Table 3 to give the water concentration (Cw). The internal concentration (Co) was then estimated asthe concentration in water times the BCF. This assumes that concentrations in the water near thesediment surface (e.g., the bottom 2–5 cm) are equal to that of undisturbed sediment interstitial water.This is conservative, especially for lotic systems.
The corollary is that the sediment concentration must be estimated from the water concentrationif collocated sediment samples were not collected. This was done by multiplying the waterconcentration (Cw) by the sediment-water partition coefficient (Kd). The resulting sedimentconcentration was then used to estimate the external dose from sediment. The preferred partitioncoefficient was the freshwater sediment Kd presented in IAEA Report No. 364 (IAEA 1994). Thelowest expected soil-water Kd was used in the absence of a sediment Kd (IAEA 1994). The defaultsoil Kd from Baes et al. (1984) was used only for radionuclides not included in IAEA (1994).
The BCFs and Kds were converted from a wet weight to dry weight basis (Table 3), because theyare not clearly defined regarding the use of wet or dry weight tissue and sediment concentrations intheir derivation (Baes 1984, IAEA 1982, IAEA 1994, Baker and Soldat 1992). The BCFs weredivided by a default wet weight/dry weight conversion factor of 0.2, which assumes that the freshweight of fish is 80% water (NCRP 1991). This will be conservative for BCFs based on wet weighttissue concentrations (i.e., it will overestimate internal concentrations). The BCF of 1 for tritium wasnot increased to 5 because 3H is predominantly stored in body water, rather than being organicallybound in tissues (NCRP 1979).

14
The Kds were multiplied by a default wet weight/dry weight conversion factor of 0.75, whichassumes that the fresh weight of sediment is 25% water (NCRP 1991). The corrected Kds were usedto estimate sediment concentrations from water concentrations (Table 3). This will be conservative forKds based on dry weight concentrations (i.e., the sediment concentration will be overestimated by afactor of 1.33). However, the uncorrected (original) Kds were used to estimate water concentrationsfrom sediment concentrations. This assumption is conservative because the exposure model assumesthat the Kds are based on dry weight concentrations. The use of wet weight sediment concentrationsto derive the Kds would result in a smaller Kd values, which would overestimate the concentrationsin water.
It is important to note that the BCFs and the Kds used herein are the “expected” values. A moreconservative approach would have been to use the most extreme values. As an example, using thehighest BCF and the lowest Kd would maximize the estimated transfer from sediment to water andfrom water to fish. This was not done because many of the extreme values did not appear to becredible (e.g., the maximum BCF for thorium was 10,000), but re-evaluating the original studies wasbeyond the scope of this effort. Rather, it was presumed that the expected values were not (necessarily)the average but were chosen based on a critical evaluation of the data. This is supported by aninspection of the range of values. For example, the “expected” BCF and sediment Kd values forzirconium were the highest and lowest reported values, respectively (IAEA 1994).
2.3.3 Radioactive Decay Chains
Many radionuclides decay to produce radioactive isotopes (i.e., daughter products) that arerelatively short-lived. These progeny may contribute as much or more dose to the target organism thandoes the parent isotope. For example, 137Cs decays to 137mBa, which has a half-life of 2.55 minutes andis the sole source of the gamma signature commonly associated with 137Cs. Models of humanexposures typically consider isotopes with half-lives less than 180 days to be short-lived (Yu 1993).Uptake of these progeny is not explicitly considered. Instead, the fate of the long-lived parent ismodeled, and the short-lived progeny are assumed to be in secular equilibrium with the parent isotope.For example, the internal activity of 90Y is taken to be the same as that of its parent isotope, 90Sr, givensufficient time for in-growth of the daughter. The activity of the daughter may be less than that of theparent if that parent decays to more than one daughter product. For example, 218Po decays to 214Pb99.98% of the time and to 218At 0.02% of the time. The activity of the short-lived progeny is estimatedas the parent activity times the yield of the progeny (e.g., 218At = 218Po * 0.0002). In this example, bothdaughter products yield 100% Bi-214, producing an activity of 214Bi equal to the activity of 218Po.
The isotopes considered in this manual are, at minimum, those presented in Blaylock, Frank, andO’Neal (1993). Several minor daughter products were added (as were 244Cm and 238Pu). However, thedecay chains are fundamentally unchanged, such that progeny with half-lives less than approximately30 days are considered short-lived and are incorporated into the benchmarks for the parent isotope.
Progeny that account for less than 0.1% of the immediate parent were not considered, with theexception of 218At, which was explicitly included in Blaylock, Frank, and O’Neal (1993).
2.4 BENCHMARK VALUES
The recommended acceptable dose rate to natural populations of aquatic biota is 1 rad d-1
(0.4 mGy h-1), based on results of the reviews summarized in NCRP Report No. 109 (NCRP 1991).That recommended limit was intended to apply to the most radiosensitive populations of aquaticorganisms. Invertebrates are much more radioresistant than are vertebrates (e.g., fish). For example,
15
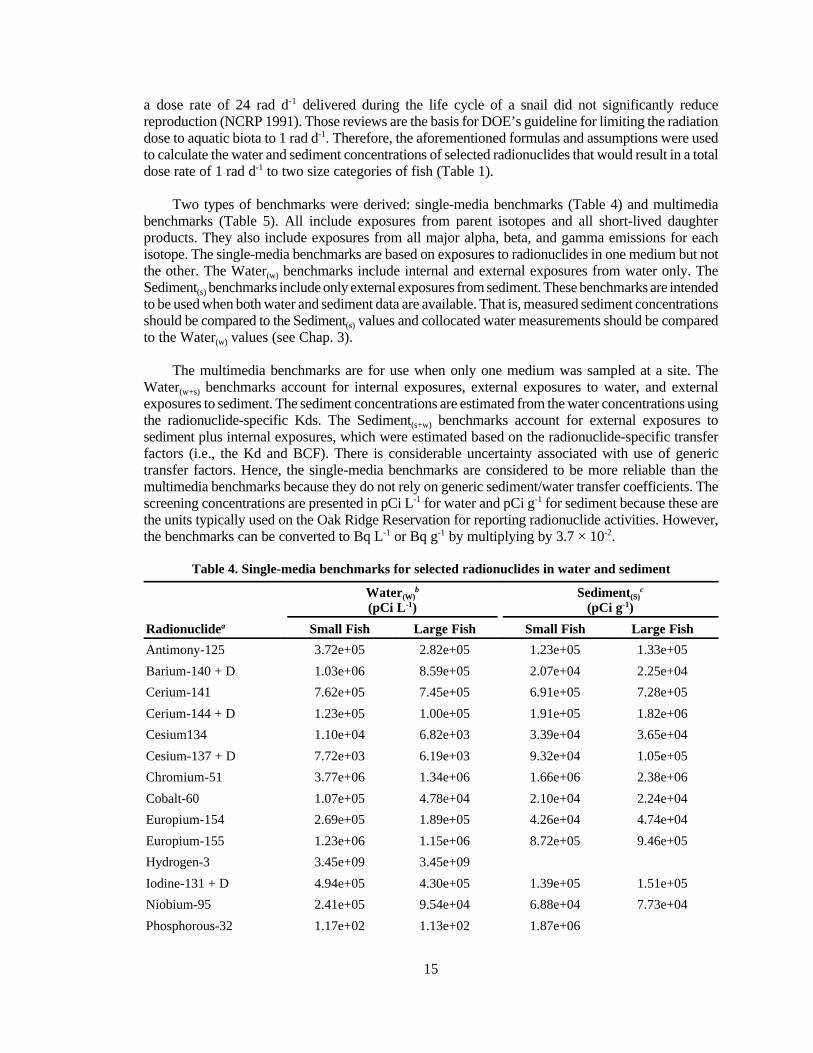
a dose rate of 24 rad d-1 delivered during the life cycle of a snail did not significantly reducereproduction (NCRP 1991). Those reviews are the basis for DOE’s guideline for limiting the radiationdose to aquatic biota to 1 rad d-1. Therefore, the aforementioned formulas and assumptions were usedto calculate the water and sediment concentrations of selected radionuclides that would result in a totaldose rate of 1 rad d-1 to two size categories of fish (Table 1).
Two types of benchmarks were derived: single-media benchmarks (Table 4) and multimediabenchmarks (Table 5). All include exposures from parent isotopes and all short-lived daughterproducts. They also include exposures from all major alpha, beta, and gamma emissions for eachisotope. The single-media benchmarks are based on exposures to radionuclides in one medium but notthe other. The Water(w) benchmarks include internal and external exposures from water only. TheSediment(s) benchmarks include only external exposures from sediment. These benchmarks are intendedto be used when both water and sediment data are available. That is, measured sediment concentrationsshould be compared to the Sediment(s) values and collocated water measurements should be comparedto the Water(w) values (see Chap. 3).
The multimedia benchmarks are for use when only one medium was sampled at a site. TheWater(w+s) benchmarks account for internal exposures, external exposures to water, and externalexposures to sediment. The sediment concentrations are estimated from the water concentrations usingthe radionuclide-specific Kds. The Sediment(s+w) benchmarks account for external exposures tosediment plus internal exposures, which were estimated based on the radionuclide-specific transferfactors (i.e., the Kd and BCF). There is considerable uncertainty associated with use of generictransfer factors. Hence, the single-media benchmarks are considered to be more reliable than themultimedia benchmarks because they do not rely on generic sediment/water transfer coefficients. Thescreening concentrations are presented in pCi L-1 for water and pCi g-1 for sediment because these arethe units typically used on the Oak Ridge Reservation for reporting radionuclide activities. However,the benchmarks can be converted to Bq L-1 or Bq g-1 by multiplying by 3.7 × 10⁻².
Table 4. Single-media benchmarks for selected radionuclides in water and sediment
Water(W)b
(pCi L-1)Sediment(S)
c
(pCi g-1)
Radionuclidea Small Fish Large Fish Small Fish Large Fish
Antimony-125 3.72e+05 2.82e+05 1.23e+05 1.33e+05
Barium-140 + D 1.03e+06 8.59e+05 2.07e+04 2.25e+04
Cerium-141 7.62e+05 7.45e+05 6.91e+05 7.28e+05
Cerium-144 + D 1.23e+05 1.00e+05 1.91e+05 1.82e+06
Cesium134 1.10e+04 6.82e+03 3.39e+04 3.65e+04
Cesium-137 + D 7.72e+03 6.19e+03 9.32e+04 1.05e+05
Chromium-51 3.77e+06 1.34e+06 1.66e+06 2.38e+06
Cobalt-60 1.07e+05 4.78e+04 2.10e+04 2.24e+04
Europium-154 2.69e+05 1.89e+05 4.26e+04 4.74e+04
Europium-155 1.23e+06 1.15e+06 8.72e+05 9.46e+05
Hydrogen-3 3.45e+09 3.45e+09
Iodine-131 + D 4.94e+05 4.30e+05 1.39e+05 1.51e+05
Niobium-95 2.41e+05 9.54e+04 6.88e+04 7.73e+04
Phosphorous-32 1.17e+02 1.13e+02 1.87e+06
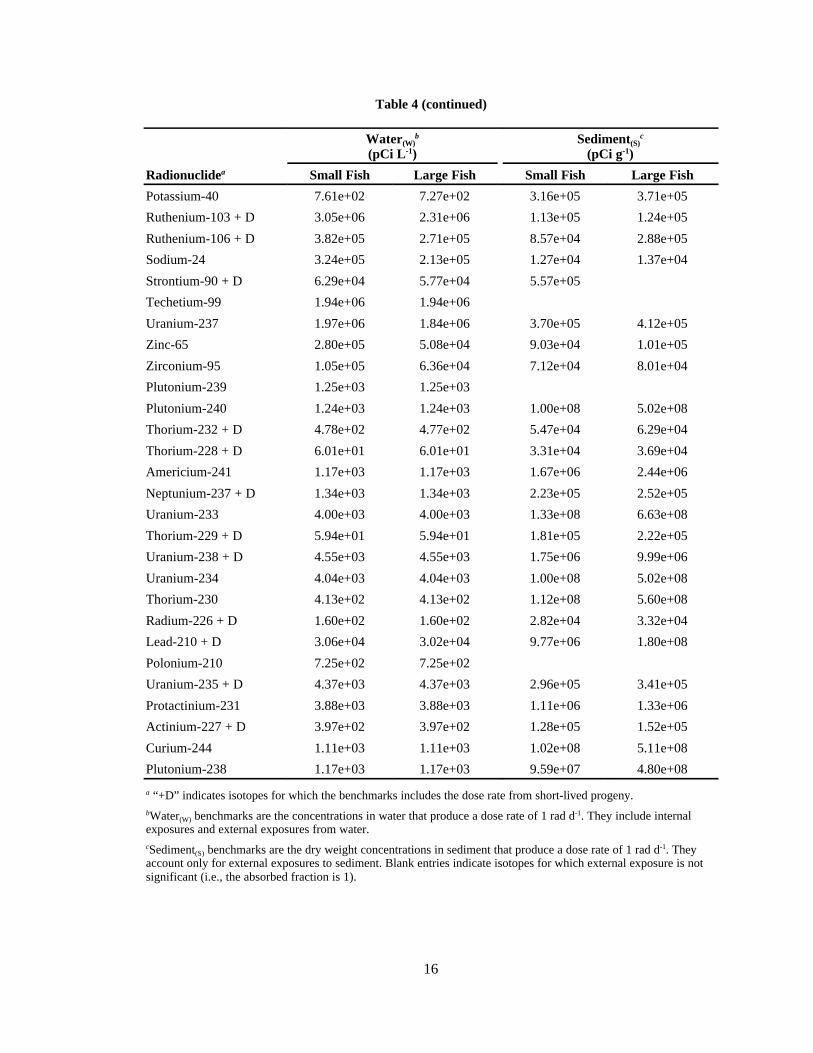
Table 4 (continued)
Water(W)b
(pCi L-1)Sediment(S)
c
(pCi g-1)
Radionuclidea Small Fish Large Fish Small Fish Large Fish
16
Potassium-40 7.61e+02 7.27e+02 3.16e+05 3.71e+05
Ruthenium-103 + D 3.05e+06 2.31e+06 1.13e+05 1.24e+05
Ruthenium-106 + D 3.82e+05 2.71e+05 8.57e+04 2.88e+05
Sodium-24 3.24e+05 2.13e+05 1.27e+04 1.37e+04
Strontium-90 + D 6.29e+04 5.77e+04 5.57e+05
Techetium-99 1.94e+06 1.94e+06
Uranium-237 1.97e+06 1.84e+06 3.70e+05 4.12e+05
Zinc-65 2.80e+05 5.08e+04 9.03e+04 1.01e+05
Zirconium-95 1.05e+05 6.36e+04 7.12e+04 8.01e+04
Plutonium-239 1.25e+03 1.25e+03
Plutonium-240 1.24e+03 1.24e+03 1.00e+08 5.02e+08
Thorium-232 + D 4.78e+02 4.77e+02 5.47e+04 6.29e+04
Thorium-228 + D 6.01e+01 6.01e+01 3.31e+04 3.69e+04
Americium-241 1.17e+03 1.17e+03 1.67e+06 2.44e+06
Neptunium-237 + D 1.34e+03 1.34e+03 2.23e+05 2.52e+05
Uranium-233 4.00e+03 4.00e+03 1.33e+08 6.63e+08
Thorium-229 + D 5.94e+01 5.94e+01 1.81e+05 2.22e+05
Uranium-238 + D 4.55e+03 4.55e+03 1.75e+06 9.99e+06
Uranium-234 4.04e+03 4.04e+03 1.00e+08 5.02e+08
Thorium-230 4.13e+02 4.13e+02 1.12e+08 5.60e+08
Radium-226 + D 1.60e+02 1.60e+02 2.82e+04 3.32e+04
Lead-210 + D 3.06e+04 3.02e+04 9.77e+06 1.80e+08
Polonium-210 7.25e+02 7.25e+02
Uranium-235 + D 4.37e+03 4.37e+03 2.96e+05 3.41e+05
Protactinium-231 3.88e+03 3.88e+03 1.11e+06 1.33e+06
Actinium-227 + D 3.97e+02 3.97e+02 1.28e+05 1.52e+05
Curium-244 1.11e+03 1.11e+03 1.02e+08 5.11e+08
Plutonium-238 1.17e+03 1.17e+03 9.59e+07 4.80e+08
a “+D” indicates isotopes for which the benchmarks includes the dose rate from short-lived progeny.bWater(W) benchmarks are the concentrations in water that produce a dose rate of 1 rad d-1. They include internalexposures and external exposures from water.cSediment(S) benchmarks are the dry weight concentrations in sediment that produce a dose rate of 1 rad d-1. Theyaccount only for external exposures to sediment. Blank entries indicate isotopes for which external exposure is notsignificant (i.e., the absorbed fraction is 1).

17
Table 5. Multimedia benchmarks for selected radionuclides in water and sediment
Water(W+S)b
(pCi L-1)Sediment(S+W)
c
(pCi g-1)
Radionuclidea Small Fish Large Fish Small Fish Large Fish
Antimony-125 3.37e+05 2.63e+05 1.48e+04 1.16e+04
Barium-140 + D 3.18e+05 3.16e+05 1.61e+04 1.62e+04
Cerium-141 8.22e+04 8.59e+04 6.34e+05 6.63e+05
Cerium-144 + D 2.11e+04 7.08e+04 1.65e+05 6.46e+05
Cesium134 8.82e+03 5.98e+03 8.29e+03 5.75e+03
Cesium-137 + D 7.27e+03 5.93e+03 7.13e+03 5.84e+03
Chromium-51 3.58e+06 1.32e+06 1.06e+05 3.95e+04
Cobalt-60 5.33e+03 5.31e+03 2.02e+04 2.05e+04
Europium-154 7.99e+04 7.58e+04 3.25e+04 3.17e+04
Europium-155 8.05e+05 7.88e+05 3.62e+05 3.58e+05
Hydrogen-3 3.45e+09 3.45e+09
Iodine-131 + D 4.81e+05 4.21e+05 4.81e+03 4.21e+03
Niobium-95 1.70e+05 8.31e+04 2.49e+04 1.28e+04
Phosphorous-32 1.17e+02 1.13e+02 1.06e+00 1.01e+00
Potassium-40 7.61e+02 7.27e+02 4.19e+00 4.00e+00
Ruthenium-103 + D 1.44e+06 1.31e+06 6.93e+04 6.43e+04
Ruthenium-106 + D 3.22e+05 2.61e+05 1.70e+04 1.42e+04
Sodium-24 1.11e+05 9.84e+04 9.29e+03 8.48e+03
Strontium-90 + D 5.80e+04 5.77e+04 5.65e+04 5.77e+04
Techetium-99 1.94e+06 1.94e+06 9.69e+03 9.69e+03
Uranium-237 1.65e+06 1.58e+06 7.88e+04 7.61e+04
Zinc-65 1.29e+05 4.28e+04 5.50e+04 2.03e+04
Zirconium-95 4.99e+04 3.99e+04 4.25e+04 3.55e+04
Plutonium-239 1.25e+03 1.25e+03 1.25e+05 1.25e+05
Plutonium-240 1.24e+03 1.24e+03 1.24e+05 1.24e+05
Thorium-232 + D 4.49e+02 4.52e+02 4.40e+03 4.44e+03
Thorium-228 + D 5.93e+01 5.93e+01 5.90e+02 5.91e+02
Americium-241 1.17e+03 1.17e+03 5.83e+03 5.84e+03
Neptunium-237 + D 1.34e+03 1.34e+03 1.34e+01 1.01e+01
Uranium-233 4.00e+03 4.00e+03 2.00e+02 1.50e+02
Thorium-229 + D 5.93e+01 5.93e+01 5.92e+02 5.93e+02
Uranium-238 + D 4.55e+03 4.55e+03 2.27e+02 2.27e+02
Uranium-234 4.04e+03 4.04e+03 2.02e+02 2.02e+02
Thorium-230 4.13e+02 4.13e+02 4.13e+03 4.13e+03
Radium-226 + D 1.60e+02 1.60e+02 7.99e+01 7.99e+01
Lead-210 + D 3.06e+04 3.02e+04 8.25e+03 8.16e+03

Table 5 (continued)
Water(W+S)b
(pCi L-1)Sediment(S+W)
c
(pCi g-1)
Radionuclidea Small Fish Large Fish Small Fish Large Fish
18
Polonium-210 7.25e+02 7.25e+02 1.09e+02 1.09e+02
Uranium-235 + D 4.36e+03 4.36e+03 2.18e+02 2.18e+02
Protactinium-231 3.87e+03 3.88e+03 2.09e+03 2.09e+03
Actinium-227 + D 3.97e+02 3.97e+02 1.79e+02 1.79e+02
Curium-244 1.11e+03 1.11e+03 5.54e+03 5.54e+03
Plutonium-238 1.17e+03 1.17e+03 1.17e+05 1.17e+05
a“+D” indicates isotopes for which the benchmarks includes the dose rate from short-lived progeny.bWater(W+S) benchmarks are the concentrations in water that produce a dose rate of 1 rad d-1. They account forinternal exposures, external exposures from water, and external exposures from sediment.cSediment(S+W) benchmarks are the dry weight concentrations in sediment that produce a dose rate of 1 rad d-1. Theyaccount for internal exposures and external exposures from sediment. Hydrogen-3 is blank because a Kd was notavailable (or appropriate).

1 The final version indicated that the limit was 0.1 rad d-1 for aquatic biota. Discussions with panelmember J. R. Trabalka determined that this was a misstatement of the findings.
19
3. BENCHMARK USE IN ECOLOGICAL RISK ASSESSMENTS
3.1 GENERAL CONSIDERATIONS
These benchmarks are to be used as screening values only. They are for use in ecological riskassessments of natural populations of aquatic biota. The recommended limit of 1 rad d-1 is notconsidered appropriate for the assessment of risks to individual organisms, e.g., threatened andendangered species (NCRP 1991). Although these benchmarks can be used in the screening phase ofa baseline ecological risk assessment, they must not be used as the sole measure of water or sedimenttoxicity. Field studies and media toxicity tests will be the primary indicators of toxicity; benchmarksmay be used to determine which, if any, radionuclides measured in the ambient water or sediment arelikely to contribute (along with other stressors and modifying factors) to the observed effects. Thisintegrative approach allows a more accurate evaluation of adverse ecological impacts, which isnecessary in a baseline risk assessment. These benchmarks also do not represent remediation goals.Remediation goals must consider other issues, including adverse effects on habitat and remobilizationof contaminants caused by removal or remediation of sediments.
Proper application and interpretation of the benchmarks requires an understanding of the conceptsupon which the recommended dose rate limit is based. To wit, it is worth reviewing the conclusionsof two critical evaluations of the available data. First, NCRP Report No. 109 (1991) presents thefollowing conclusions:
“Adoption of a reference level of 0.4 mGy h-1 [1 rad d-1] appears to represent areasonable compromise based on current information, i.e., considering both thenature of the effects observed at this dose rate and the limited amount ofinformation on effects of ionizing radiation in natural populations, includinginteractions between ionizing radiation and ecological conditions. Populationsexposed to dose rates approaching 0.4 mGy h-1 may also be at risk from otherfactors such as overexploitation and environmental stressors which might, incombination, result in an undesirable impact. In such circumstances, it wouldseem highly desirable to conduct a comprehensive ecological evaluation of theradiation exposure regime along with other factors in order to determine theradiological consequences. Thus, it is suggested that where the results ofradiological modeling and/or dosimetric measurements indicate that a radiationdose of 0.1 mGy h-1 [0.25 rad d-1] will be exceeded, such an evaluation beconducted.”
It is based on this statement that some have suggested using 0.25 rad d-1 to derive the benchmarkconcentrations. This was not done because the consideration of “...other factors such asoverexploitation and environmental stressors...” is more appropriately a component of thecharacterization of risks. The use of an arbitrary safety factor might be warranted, but it should notbe embedded in the benchmarks, to the extent practical. Second, an expert panel has subsequentlyconcluded that “the existing data support the application of the [1 rad d-1]1 limit for populations of...aquatic fauna to representative rather than maximally exposed individuals” (Barnthouse 1995).

20
These somewhat contradictory conclusions are reflective of the considerable uncertainty associatedwith the effects of low-level radiation on natural systems.
3.2 APPLICATION OF THE BENCHMARKS
The concentrations of radionuclides detected in water or sediment at a site should be screenedagainst radiological benchmarks by calculating a hazard quotient (HQ) for each radionuclide (Suter1995). The HQ is the ambient radionuclide concentration divided by the screening value. The dose ratefrom an individual radionuclide exceeds the acceptable dose rate limit if the HQ is >1. The radiologicalbenchmarks are normalized in an attempt to account for the biological effectiveness of the differenttypes of radiation (i.e., alpha dose rates are multiplied by 20). This allows for the calculation of ahazard index (HI), which is the sum of the HQs for the individual radionuclides in the ambient media.The HI is a measure of the total dose rate to the organism and should account for all three exposurepathways: the total internal dose, the total external dose from water, and the total external dose fromsediment.
As mentioned previously, two types of benchmarks have been derived. Single-media benchmarksinclude the Water(w) and the Sediment(s) benchmarks, which are for use when collocated water andsediment samples are available (Table 4). The HI for an organism (e.g., small fish) at a location iscalculated as the sum of the HQs for the isotopes in water (e.g., the concentration in water divided bythe small fish Water(w) benchmark) and the HQs for the isotopes in sediment (e.g., the concentrationin sediment divided by the small fish Sediment(s) benchmark). If the HI exceeds 1, then the total doserate to a small fish is estimated to exceed the recommended limit. The Water(w) benchmark includesthe external dose from immersion in contaminated water. Use of this benchmark in conjunction withthe Sediment(s) benchmark is conservative: the fish would not be exposed to water from below becausethe use of Sediment(s) benchmark assumes that the fish resides at the sediment surface. This could beaccounted for by dividing the external dose from water by two, which is comparable to what is doneto estimate the sediment exposure (i.e., use one half of the MeV dis-1 to rad d-1 conversion factor).However, this is considered to be a relatively minor source of error. The expected Kds for all of theselected radionuclides are greater than two, and most are more than an order of magnitude greater thantwo. Hence, radiation from the sediment will dominate the external dose rates.
Multimedia benchmarks include the Water(w+s) and Sediment(s+w) benchmarks, which are for usewhen only one of the media was sampled (Table 5). In this case, the HI for an organism is simply thesum of the HQs for the isotopes measured in that medium (see Sect. 2.4). The Water(w+s) benchmarkassumes that the fish resides at the sediment surface and it includes external exposure from waterunder the fish, which is comparable to using the Water(w) and Sediment(s) benchmarks together. TheSediment(s+w) benchmarks do not include the external dose from water. As noted above, this isconsidered a minor source of error relative to the external radiation from the sediment.
The collection of collocated sediment and water samples is strongly recommended, so that single-media benchmarks can be used instead of multimedia benchmarks. The Water(w+s) and Sediment(s+w)
benchmarks are calculated using default sediment/water partition coefficients. There is considerableuncertainty associated with these factors, which make the multimedia benchmarks inherently lessreliable than the single-media benchmarks.
Given the uncertainties mentioned in Sect. 3.1, a compromise approach to screening isrecommended. Specifically, the maximum exposure concentration (e.g., the upper 95% confidencelimit on the mean water concentration or the maximum sediment concentration) should be comparedwith a threshold of 0.25 rad d-1 as an initial screening tool. If the threshold is exceeded (i.e., the HI is>0.25), further evaluation could include comparing representative exposures (e.g., mean water and

21
median sediment concentrations) to the 0.25 rad d-1 threshold. Of course, any screening approachpresumes that the media were sufficiently sampled to provide reliable estimates of exposure, an issuewhich is beyond the scope of this document. Other modifying factors and site-specific data also shouldbe considered if the potential for radiological risks is indicated by the screening.
3.3 EXAMPLE APPLICATION
Two screening examples are worked below to aid interpretation of these benchmarks. The waterand sediment data are taken from the Remedial Investigation of Bear Creek Valley at the Oak RidgeY-12 Plant (DOE 1997). The concentrations in water are the upper 95% confidence limit on the meanfor Reach 1, which is the headwaters of Bear Creek. The concentrations in sediment are from the singlesediment sample collected at station SD02, which is in Reach 1.
In Example 1, the water and sediment data are treated as collocated samples (Table 6). The waterconcentrations are screened against the Water(w) benchmarks for small fish, and the sedimentconcentrations are screened against the Sediment(s) benchmarks for small fish. The HI-Water is the sumof the HQs for water, and the HI-Sediment is the sum of the HQs for sediment. The HI-Total is thesum of all HQs for small fish. The HI-Total of 0.03 suggests that the radionuclides measured at thislocation pose a negligible risk to aquatic biota.
In Example 2, the water and sediment data are evaluated separately, i.e., as if one or the otherwere available but not both (Table 7). The water concentrations are screened against the Water(w+s)
benchmarks for small fish, and the sediment concentrations are screened against the Sediment(s+w)
benchmarks. The HI-Total is the sum of all HQs for a medium. In this example, the HI based on waterdata only (0.0314) is equal to the HI-Total based on the collocated water and sediment samples (Table6). The HI based on sediment data only (0.211) is nearly an order of magnitude higher than the HI-Total in Example 1. This is because the dose rates from most of these isotopes are dominated byinternal exposures. The need to estimate the internal concentration in the organism from the sedimentconcentration using the Kd adds a level of conservatism for such radionuclides. Conversely, the doserate from isotopes that are primarily sources of external radiation (e.g., 137Cs and 60Co) would likelybe conservatively estimated when using the Water(w+s) benchmarks. As in Example 1, the screeningsagainst multimedia benchmarks also suggests that the radionuclides measured at this location pose anegligible risk to aquatic biota, though somewhat less convincingly than the single-media values.Again, both screenings presume that the media were sufficiently sampled to provide reliable estimatesof exposure.

22
Table 6. Example 1: Use of single-media benchmarks for the calculation of hazard quotients (HQs) and hazard indices (HIs)
Radionuclide Concentrationa Benchmarkb HQc
Water (pCi L-1)
Strontium-90 1.33 6.29e+04 2.11e-05
Technetium-99 327 1.94e+06 1.69e-04
Thorium-228 0.144 6.01e+01 2.40e-03
Thorium-230 0.117 4.13e+02 2.83e-04
Thorium-232 0.081 4.78e+02 1.69e-04
Uranium-233/234 37.9 4.00e+03 9.48e-03
Uranium-235 2.33 4.37e+03 5.33e-04
Uranium-238 83.1 4.55e+03 1.83e-02
HI - Water 3.13e-02
Sediment (pCi g-1)
Americium-241 0.06 1.67e+06 3.59e-08
Cesium-137 0.18 9.32e+04 1.93e-06
Technetium-99d 8.74 N/A N/A
Thorium-228 1.45 3.31e+04 4.38e-05
Thorium-230 1.03 1.12e+08 9.20e-09
Thorium-232 0.99 5.47e+04 1.81e-05
Uranium-234 16.77 1.00e+08 1.68e-07
Uranium-235 0.73 2.96e+05 2.47e-06
Uranium-238 27.38 1.75e+06 1.56e-05
HI - Sediment 8.22e-05
HI - Total 3.14e-02
aWater and sediment concentrations are from DOE (1997).bBenchmarks are the Water(W) and Sediment(S) values for small fish.cThe hazard quotient is the media concentration divided by the benchmark value.The hazard index is the sum of the hazard quotients.dTechnetium-99 does not have a Sediment(S) benchmark because external exposure isnot a significant pathway.

23
Table 7. Example 2: Use of multimedia benchmarks for the calculation of hazard quotients (HQs) and hazard indices (HIs)
Radionuclide Concentrationa Benchmarka HQc
Water (pCi L-1)
Strontium-90 1.33 5.80e+04 2.29e-05
Technetium-99 327 1.94e+06 1.69e-04
Thorium-228 0.144 5.93e+01 2.43e-03
Thorium-230 0.117 4.13e+02 2.83e-04
Thorium-232 0.081 4.49e+02 1.80e-04
Uranium-233/234 37.9 4.00e+03 9.48e-03
Uranium-235 2.33 4.36e+03 5.34e-04
Uranium-238 83.1 4.55e+03 1.83e-02
HI - Total 3.14e-02
Sediment (pCi g-1)
Americium-241 0.06 5.83e+03 1.03e-05
Cesium-137 0.18 7.13e+03 2.52e-05
Technetium-99 8.74 9.69e+03 9.02e-04
Thorium-228 1.45 5.90e+02 2.46e-03
Thorium-230 1.03 4.13e+03 2.49e-04
Thorium-232 0.99 4.40e+03 2.25e-04
Uranium-234 16.77 2.02e+02 8.30e-02
Uranium-235 0.73 2.18e+02 3.35e-03
Uranium-238 27.38 2.27e+02 1.21e-01
HI - Total 2.11e-01
aWater and sediment concentrations are from DOE (1997).bBenchmarks are the Water(W+S) and Sediment(S+W) values for small fish.cThe hazard quotient is the media concentration divided by the benchmark value.The hazard index is the sum of the hazard quotients.

24
4. REFERENCES
Baes, C. F., III, R. D. Sharp, A. L. Sjoreen, and R. W. Shor. 1984. A Review and Analysis ofParameters for Assessing Transport of Environmentally Released Radionuclides ThroughAgriculture, ORNL-5786, Health and Safety Research Division, Oak Ridge Natl. Lab.,Oak Ridge, Tenn.
Baker, D. A., and J. K. Soldat. 1992. Methods for Estimating Doses to Organisms from RadioactiveMaterials Released into the Aquatic Environment, PNL-8150, Pacific Northwest Laboratory,Richland, Wash.
Barnthouse, L. W. 1995. Effects of Ionizing Radiation on Terrestrial Plants and Animals: AWorkshop Report, ORNL/TM-13141, Oak Ridge Natl. Lab., Oak Ridge, Tenn.
Blaylock, B. G., M. L. Frank, and B. R. O’Neal. 1993. Methodology for Estimating Radiation DoseRates to Freshwater Biota Exposed to Radionuclides in the Environment, ES/ER/TM-78,Oak Ridge Natl. Lab., Oak Ridge, Tenn.
DOE (U.S. Department of Energy). 1997. Report on the Remedial Investigation of Bear Creek Valleyat the Oak Ridge Y-12 Plant, Oak Ridge, Tennessee, DOE/OR/01-1455/V3&D2, LockheedMartin Energy Systems, Inc., Oak Ridge, Tenn.
Garten, C. T., Jr. 1981. Comparative uptake of actinides by plants and rats from the shoreline ofa radioactive pond, J. Environ. Qual., 10:487–91.
Garten, C. T., Jr., E. A. Bondietti, J. R. Trabalka, R. L. Walker, and T. G. Scott. 1987. Fieldstudies on the terrestrial behavior of actinide elements in East Tennessee, Pages 109–19 in:Environmental Research on Actinide Elements (eds. J. E. Pinder III, J. J. Alberts, K. W. McLeod,and R. G. Schreckhise), CONF-841142, U.S. Department of Energy, Washington, D.C.
IAEA (International Atomic Energy Agency). 1976. Effects of Ionizing Radiation on AquaticOrganisms and Ecosystems, IAEA Technical Report Series 172, Vienna, Austria.
IAEA (International Atomic Energy Agency). 1979. Methodology for Assessing Impacts ofRadioactivity on Aquatic Ecosystems, IAEA Technical Report Series 190, Vienna, Austria.
IAEA (International Atomic Energy Agency). 1982. Generic Models and Parameters for Assessingthe Environmental Transfer of Radionuclides from Routine Releases: Exposures of CriticalGroups, IAEA Safety Series 57, Vienna, Austria.
IAEA (International Atomic Energy Agency). 1994. Handbook of Parameter Values for thePrediction of Radionuclide Transfer in Temperate Environments, IAEA Technical Report SeriesNo. 364, Vienna, Austria.
ICRP (International Commission on Radiological Protection). 1983. Radionuclide Transformations:Energy and Intensity of Emissions, ICRP Publication No. 38, Vienna, Austria.
Jones, D. S. 1997. Radiological Benchmarks for Screening Contaminants of Potential Concern forEffects on Aquatic Biota, ES/ER/TM-226, Oak Ridge Natl. Lab., Oak Ridge, Tenn.

25
Kaye, S. V., and P. B. Dunaway. 1962. Bioaccumulation of radioactive isotopes by herbivoroussmall mammals, Health Phys., 7:205–17.
Kocher, D. C. 1981. Radioactive Decay Data Tables: A Handbook of Decay Data for Applicationto Radiation Dosimetry and Radiological Assessments, DOE/TIC-11026.
NCRP (National Council on Radiation Protection and Measurements). 1979. Tritium in theEnvironment, NCRP Report No. 62, National Council on Radiation Protection andMeasurements, Bethesda, Md.
NCRP (National Council on Radiation Protection and Measurements). 1987. Recommendations onLimits for Exposure to Ionizing Radiation, NCRP Report No. 91, National Council on RadiationProtection and Measurements, Bethesda, Md.
NCRP (National Council on Radiation Protection and Measurements). 1991. Effects of IonizingRadiation on Aquatic Organisms, NCRP Report No. 109, National Council on RadiationProtection and Measurements, Bethesda, Md.
Shleien, B., and M. S. Terpilak. 1984. The Health Physics and Radiological Health Handbook,Nucleon Lectern Associates, Olney, Md.
Shleien, B., and M. S. Terpilak. 1986. The Health Physics and Radiological Health Handbook:Supplement 1 (1986), Nucleon Lectern Associates, Olney, Md.
Suter, G. W., II. 1995. Guide for Performing Screening Ecological Risk Assessments at DOEFacilities, ES/ER/TM-153, Oak Ridge Natl. Lab., Oak Ridge, Tenn.
Yu, C., C. Loureiro, J. J. Cheng, L. G. Jones, Y. Y. Wang, Y. P. Chia, and E. Faillace. 1993. DataCollection Handbook to Support Modeling Impacts of Radioactive Material in Soil, ArgonneNational Laboratory, Argonne, Ill.

BJC/OR-80
RECORD COPY DISTRIBUTION
File—EMEF DMC—RC