toxicological benchmarks for contaminants of potential ... · for effects on soil and litter...
TRANSCRIPT
ES/ER/TM-126/R2
Toxicological Benchmarksfor Contaminants of Potential Concern
for Effects on Soil and Litter Invertebratesand Heterotrophic Process:
1997 Revision
This document has been approvedby the East Tennessee Technology ParkTechnical Information Officefor release to the public. Date:
ES/ER/TM-126/R2
Toxicological Benchmarks for Contaminants of Potential Concern
for Effects on Soil and Litter Invertebrates and Heterotrophic Process:
1997 Revision
R. A. EfroymsonM. E. Will
G. W. Suter II
Date Issued—November 1997
Prepared for theU.S. Department of Energy
Office of Environmental Managementunder budget and reporting code EW 20
LOCKHEED MARTIN ENERGY SYSTEMS, INC.managing the
Environmental Management Activities at theEast Tennessee Technology Park
Oak Ridge Y-12 Plant Oak Ridge National LaboratoryPaducah Gaseous Diffusion Plant Portsmouth Gaseous Diffusion Plant
under contract DE-AC05-84OR21400for the
U.S. DEPARTMENT OF ENERGY

iii
PREFACE
This report presents a standard method for deriving benchmarks for the purpose of “contaminantscreening,” performed by comparing measured ambient concentrations of chemicals. The work wasperformed under Work Breakdown Structure 1.4.12.2.3.04.07.02 (Activity Data Sheet 8304). Inaddition, this report presents sets of data concerning the effects of chemicals in soil on invertebrates andsoil microbial processes, benchmarks for chemicals potentially associated with United States Departmentof Energy sites, and literature describing the experiments from which data were drawn for benchmarkderivation.
v
ACKNOWLEDGMENTS
The authors would like to thank Carla Gunderson and Art Stewart for their helpful reviews of thedocument. In addition, the authors would like to thank Christopher Evans and Alexander Wooten forconducting part of the literature review.
vii
CONTENTS
PREFACE . . . . . . . . . . . . . . . . . . . . . . . . . . . . . . . . . . . . . . . . . . . . . . . . . . . . . . . . . . . . . . . . . . . . . . iii
ACKNOWLEDGMENTS . . . . . . . . . . . . . . . . . . . . . . . . . . . . . . . . . . . . . . . . . . . . . . . . . . . . . . . . . . v
TABLES . . . . . . . . . . . . . . . . . . . . . . . . . . . . . . . . . . . . . . . . . . . . . . . . . . . . . . . . . . . . . . . . . . . . . . . ix
ABBREVIATIONS . . . . . . . . . . . . . . . . . . . . . . . . . . . . . . . . . . . . . . . . . . . . . . . . . . . . . . . . . . . . . . . xi
EXECUTIVE SUMMARY . . . . . . . . . . . . . . . . . . . . . . . . . . . . . . . . . . . . . . . . . . . . . . . . . . . . . . . xiii
1. SCREENING BENCHMARKS IN ECOLOGICAL RISK ASSESSMENT . . . . . . . . . . . . . . . 1-1
2. METHODS . . . . . . . . . . . . . . . . . . . . . . . . . . . . . . . . . . . . . . . . . . . . . . . . . . . . . . . . . . . . . . . . . . 2-12.1 DATA . . . . . . . . . . . . . . . . . . . . . . . . . . . . . . . . . . . . . . . . . . . . . . . . . . . . . . . . . . . . . . . . . . 2-12.2 SELECTION OF LEVELS OF EFFECTS . . . . . . . . . . . . . . . . . . . . . . . . . . . . . . . . . . . . . . 2-22.3 DERIVATION OF BENCHMARKS . . . . . . . . . . . . . . . . . . . . . . . . . . . . . . . . . . . . . . . . . . 2-2
3. EARTHWORMS . . . . . . . . . . . . . . . . . . . . . . . . . . . . . . . . . . . . . . . . . . . . . . . . . . . . . . . . . . . . . 3-13.1 INTRODUCTION . . . . . . . . . . . . . . . . . . . . . . . . . . . . . . . . . . . . . . . . . . . . . . . . . . . . . . . . . 3-13.2 EARTHWORM DATA SELECTION . . . . . . . . . . . . . . . . . . . . . . . . . . . . . . . . . . . . . . . . . 3-13.3 EARTHWORM TEST SPECIES . . . . . . . . . . . . . . . . . . . . . . . . . . . . . . . . . . . . . . . . . . . . . 3-23.4 EARTHWORM DATA AND BENCHMARK DERIVATION . . . . . . . . . . . . . . . . . . . . . 3-3
3.4.1 Inorganic Compounds . . . . . . . . . . . . . . . . . . . . . . . . . . . . . . . . . . . . . . . . . . . . . . . . . 3-33.4.2 Organic Compounds . . . . . . . . . . . . . . . . . . . . . . . . . . . . . . . . . . . . . . . . . . . . . . . . 3-10
4. MICROBIAL HETEROTROPHS AND PROCESSES . . . . . . . . . . . . . . . . . . . . . . . . . . . . . . . 4-14.1 INTRODUCTION . . . . . . . . . . . . . . . . . . . . . . . . . . . . . . . . . . . . . . . . . . . . . . . . . . . . . . . . . 4-14.2 MICROBE DATA SELECTION . . . . . . . . . . . . . . . . . . . . . . . . . . . . . . . . . . . . . . . . . . . . . 4-14.3 MICROBE DATA AND BENCHMARK DERIVATION . . . . . . . . . . . . . . . . . . . . . . . . . 4-2
4.3.1 Inorganic Chemicals . . . . . . . . . . . . . . . . . . . . . . . . . . . . . . . . . . . . . . . . . . . . . . . . . . 4-24.3.2 Organic Chemicals . . . . . . . . . . . . . . . . . . . . . . . . . . . . . . . . . . . . . . . . . . . . . . . . . 4-17
5. INVERTEBRATES OTHER THAN EARTHWORMS AND MICROBIAL HETEROTROPHS . . . . . . . . . . . . . . . . . . . . . . . . . . . . . . . . . . . . . . . . . . . . . . . . . . . . . . . . . . . . 5-15.1 INTRODUCTION . . . . . . . . . . . . . . . . . . . . . . . . . . . . . . . . . . . . . . . . . . . . . . . . . . . . . . . . . 5-15.2 INVERTEBRATE DATA SELECTION . . . . . . . . . . . . . . . . . . . . . . . . . . . . . . . . . . . . . . . 5-15.3 INVERTEBRATE TEST SPECIES . . . . . . . . . . . . . . . . . . . . . . . . . . . . . . . . . . . . . . . . . . . 5-25.4 OTHER INVERTEBRATES LITERATURE REVIEW . . . . . . . . . . . . . . . . . . . . . . . . . . . 5-3
6. RELATIONSHIP BETWEEN SOIL TOXICITY BENCHMARKS AND OTHER ECOTOXICOLOGICAL CRITERIA . . . . . . . . . . . . . . . . . . . . . . . . . . . . . . . . . 6-16.1 COMPARISON OF TOXICITY BENCHMARKS FOR CONTAMINANTS
IN SOIL TO CANADIAN ENVIRONMENTAL QUALITY CRITERIA FOR CONTAMINATED SITES . . . . . . . . . . . . . . . . . . . . . . . . . . . . . . . . . . . . . . . . . . . . . 6-1
viii
6.2 COMPARISON OF TOXICITY BENCHMARKS FOR CONTAMINANTS IN SOIL TO RIVM (NETHERLANDS) ECOTOXICOLOGICAL INTERVENTION VALUES FOR CONTAMINANTS IN SOILS . . . . . . . . . . . . . . . . . . . 6-1
7. COMPARISON OF TOXICITY BENCHMARKS FOR CONTAMINANTS IN SOIL TO CONCENTRATIONS OF CHEMICALS IN UNPOLLUTED SOILS . . . . . . . . 7-17.1 COMPARISON TO USGS ELEMENT CONCENTRATIONS IN SOILS
AND OTHER SURFICIAL MATERIALS OF THE EASTERN UNITED STATES . . . . 7-17.2 COMPARISON TO DOE OAK RIDGE RESERVATION BACKGROUND
SOIL CHARACTERIZATION ELEMENT CONCENTRATIONS IN SOILS . . . . . . . . . 7-1
8. RECOMMENDATIONS AND CONCLUSIONS . . . . . . . . . . . . . . . . . . . . . . . . . . . . . . . . . . . 8-1
9. REFERENCES . . . . . . . . . . . . . . . . . . . . . . . . . . . . . . . . . . . . . . . . . . . . . . . . . . . . . . . . . . . . . . . 9-1
APPENDIX A. TOXICITY DATA FOR EARTHWORMS . . . . . . . . . . . . . . . . . . . . . . . . . . . . . A-1
APPENDIX B. TOXICITY DATA FOR MICROORGANISMS . . . . . . . . . . . . . . . . . . . . . . . . . B-1
APPENDIX C. TOXICITY DATA FOR OTHER SOIL AND LITTER INVERTEBRATES . . . . . . . . . . . . . . . . . . . . . . . . . . . . . . . . . . . . . . . . . . . . . . . C-1
ix
TABLES
1 Screening benchmark concentrations for the toxicity of chemicals to earthworms . . . . . . . . . . . 2-42 Screening benchmark concentrations for the toxicity of chemicals to soil
microorganisms and microbial processes . . . . . . . . . . . . . . . . . . . . . . . . . . . . . . . . . . . . . . . . . . . 2-53 Comparison of screening benchmark concentrations for the toxicity to earthworms
and soil microbes of chemicals in soil to CCME remediation criteria (RC), RIVM ecotoxicological intervention values (EIV's), arithmetic means of elements in uncontaminated soils of the Oak Ridge Reservation (ORR), and geometric means of elements in soils and surficial materials of the eastern United States . . . . . . . . . . . . . . . . . . . 6-3
xi
ABBREVIATIONS
CCME Canadian Council of Ministers of the EnvironmentCEC Cation Exchange CapacityCERCLA Comprehensive Environmental Response, Compensation, and Liability ActDOE United States Department of EnergyEIV Ecotoxicological Intervention ValueEPA United States Environmental Protection AgencyER-L Effects Range LowHCl Hydrochloric AcidLCT Lowest Concentration TestedLOEC Lowest Observed Effect ConcentrationNOEC No Observed Effect ConcentrationOECD Organization for Economic Cooperation and DevelopmentORR Oak Ridge ReservationPAH Polycyclic Aromatic HydrocarbonPCB Polychlorinated BiphenylRC Remediation CriteriaRIVM National Institute of Public Health and Environmental ProtectionUSGS United States Geological Survey
xiii
EXECUTIVE SUMMARY
One of the initial stages in ecological risk assessments for hazardous waste sites is the screeningof contaminants to determine which of them are worthy of further consideration as "contaminants ofpotential concern." This process is termed "contaminant screening." It is performed by comparingmeasured ambient concentrations of chemicals to benchmark concentrations. Currently, no standardbenchmark concentrations exist for assessing contaminants in soil with respect to their toxicity to soil-and litter-dwelling invertebrates, including earthworms, other micro- and macroinvertebrates, orheterotrophic bacteria and fungi. This report presents a standard method for deriving benchmarks forthis purpose, sets of data concerning effects of chemicals in soil on invertebrates and soil microbialprocesses, and benchmarks for chemicals potentially associated with United States Department of Energysites. In addition, literature describing the experiments from which data were drawn for benchmarkderivation. Chemicals that are found in soil at concentrations exceeding both the benchmarks and thebackground concentration for the soil type should be considered contaminants of potential concern.
1-1
1. SCREENING BENCHMARKS IN ECOLOGICAL RISKASSESSMENT
An important step in ecological risk assessments is screening the chemicals occurring on a site forcontaminants of potential concern. Screening may be accomplished by comparing reported ambientconcentrations to a set of toxicological benchmarks. Multiple endpoints for assessing risks posed by soil-borne contaminants to organisms directly impacted by them have been established. Benchmarks for toxiceffects of contaminants on terrestrial plants are presented in a companion manuscript (Efroymson et al.1997). This report presents benchmarks for soil invertebrates and microbial processes and addressesonly chemicals found at United States Department of Energy (DOE) sites. The benchmarks for microbialprocesses have not been updated since 1995. No benchmarks for pesticides are presented.
If a chemical's concentration or reported detection limit exceeds the screening benchmark, additionalanalysis may be needed to determine the hazards posed by that chemical (i.e., it is a contaminant ofpotential concern). However, if the chemical's concentration or detection limit falls below the proposedbenchmark, the chemical may be ignored during further study unless public concern or ancillary evidencesuggest that it should be retained.
Soil benchmarks are based on data provided by toxicity studies in the field or, more commonly, inlaboratory settings. Most of the soil concentrations of metals reported from waste sites are fromextractions with hydrochloric acid (HCl) or other mineral acids which are intended to provide estimatesof total concentrations. Similarly, concentrations of organic contaminants in waste site soils are totalconcentrations derived from rigorous extractions by solvents. In some cases, toxicity tests reportcontaminant concentrations extracted from soils, but various extractants are used that may not yield totalconcentrations. More commonly, the concentrations reported are nominal concentrations of a solubleform (i.e., a highly bioavailable form) of the chemical added to soil. We have chosen to use nominalconcentrations from the literature to compare to the "total" extracted quantities of a chemical reportedfor waste sites.
These benchmarks are appropriate for contaminant screening purposes only. An assessor mustrealize that soil and invertebrate characteristics play a large part in toxicity and incorporate these site-specific considerations in the evaluation of the potential hazards of a chemical. If chemicalconcentrations reported in soils supporting many earthworms exceed one or more of the benchmarkspresented in this report, or if a benchmark is exceeded by background soil concentrations, it is generallysafe to assume that the benchmark is a poor measure of risk to earthworms at that site.
After discussing methods, this report presents the results of the literature reviews and benchmarkderivation for toxicity to earthworms (Sect. 3), heterotrophic microbes and their processes (Sect. 4), andother invertebrates (Sect. 5). The final sections compare the benchmarks to other criteria and backgroundconcentrations of chemicals and draw conclusions concerning the utility of the benchmarks.

2-1
2. METHODS
2.1 DATA
References on the toxicity of selected chemicals to soil and litter dwelling invertebrates, microbes,and microbial processes were obtained from searches of bibliographic data bases (BIOSIS, POL TOXI, current contents), review articles, and conventional literature searching. Reports of toxicity tests ofindividual chemicals in laboratory, greenhouse, or field settings were obtained. Data presented in thisreport were derived mainly from primary sources. More specific information on the types of effects dataavailable for each group of organisms is given in the appropriate section of this report. The generalcriteria for inclusion of a study in the data set used to derive toxicity benchmarks follow.
1. Methodology was clearly stated (especially concentrations of applied chemicals) and followed inthe experiment.
2. Results were quantified as measures of survivorship, growth, respiration, reproduction, substratetransformation, or enzyme activity.
3. Results were presented in numeric form, or graphical presentations of data were clearlyinterpretable.
4. An unambiguous reduction existed in the measured parameter within the range of appliedconcentrations of the chemical of interest.
The data selected for soil benchmarks using these criteria appear in Appendix A through AppendixC. Data were collected in the following categories for analysis:
1. Chemical—The effects of individual chemicals of interest were analyzed. In the case of metals, themetal is listed in the "Chemical" field. For organics, the compound is listed in the "Chemical" field.
2. Chemical Form—The form in which the chemical was added to the experimental medium (e.g.,soluble salt, organic).
3. Growth Medium—Substrate in which organisms were kept during the experiment. The mediaincluded natural and artificial soil, manure, soil/litter microcosms, and other experimentalsubstrates.
4. Cation exchange capacity is the sum of the exchangeable cations that a soil can adsorb, expressedas milliequivalents per 100 g of soil. Soil organic and inorganic constituents contain negativelycharged sites that are the location of important interactions with positively charged ions in soilsolution. These interactions affect the toxicity of many contaminants.
5. Organic matter—Soil organic matter is important in reactions of many contaminants in the soil.Percentage organic matter, if given, was converted to percentage organic carbon by the equation(Nelson and Sommers, 1982):
%organic matter / 2 = %organic carbon
2-2
6. Soil pH—The pH of the soil exerts control over chemical reactions that affect speciation andbioavailability of chemicals
7. Species—The species of earthworm, other invertebrate, or microorganism is necessary whenprovided. However, most microbiological experiments were conducted with an undefined, mixednative microflora.
8. Exposure duration—How long the organisms were exposed to the test chemical.
9. NOEC Applied—The no observed effect concentration (NOEC) is defined as the highest appliedconcentration of the chemical of interest causing a reduction of 20% or less in a measured response.
10. LOEC Applied—The lowest observed effect concentration (LOEC) is defined as the lowest appliedconcentration of the chemical of interest causing a greater than 20% reduction in a measuredresponse. In some cases, the LOEC for the test was the lowest concentration tested (LCT) or theonly concentration reported, as when the EC (or ED ) was reported.50 50
11. Growth parameter—Response varied with the type of organism and experiment.
12. Percent decrease—Percent decrease in measured parameter compared to control organism.
2.2 SELECTION OF LEVELS OF EFFECTS
Twenty percent reduction in growth, reproduction, or activity was used as the threshold forsignificant effects to be consistent with other screening benchmarks for ecological risk assessment andwith current regulatory practice (Suter et al. 1995). In brief, most regulatory criteria are based onconcentrations in toxicity tests that cause effects which are statistically significantly different fromcontrols. On average, these concentrations correspond to greater than a 20% difference in effects. Inaddition, regulatory actions may be based on comparisons of biological parameters measured oncontaminated sites to those from reference sites. Differences between parameters at sites generally mustbe greater than 20% to be reliably detected in such studies. Therefore, the 20% effects level is treatedas a conservative approximation of the threshold for regulatory concern.
2.3 DERIVATION OF BENCHMARKS
Because of the diversity of soils, species, chemical forms, and test procedures, it is impossible toestimate concentrations that would constitute thresholds for toxic effects on the invertebrate communitiesat particular sites from published toxicity data. This situation is analogous to the problem of derivingbenchmarks for sediments. In this report, the method used for deriving soil benchmarks is based on theNational Oceanographic and Atmospheric Administration's method for deriving the Effects Range Low(ER-L) (Long and Morgan, 1990), which has been recommended as a sediment screening benchmarkby the U.S. Environmental Protection Agency (EPA) Region IV. The ER-L is the tenth percentile of thedistribution of various toxic effects thresholds for various organisms in sediments.
This approach can be justified by assuming that the toxicity of a chemical in soil is a randomvariate, the toxicity of contaminated soil at a particular site is drawn from the same distribution, and theassessor should be 90% certain of protecting organisms growing in the site soil. Any bias in the data setwould mitigate against that assumption. In this implementation of the approach, the bias most likely to
2-3
be significant is the use of soluble salts of metals in the toxicity tests. These salts are likely to be moretoxic than the mixture of forms encountered in field soils. That bias would result in conservativebenchmark values. Other possible sources of bias include the exclusion of synergistic and antagonisticeffects resulting from interactions between chemicals, use of a limited number of test species that maynot be representative of those in the field, use of artificial soils that may not be representative of soilsin general, and other laboratory test conditions that may not be representative of field conditions. Thedirection and magnitude of these potential biases is unknown.
The toxicity benchmarks were derived by rank-ordering the LOEC values and then picking anumber that approximated the 10th percentile. As with the ER-Ls, statistical fitting was not used becausethere were seldom sufficient data and because these benchmarks are to be used as screening values anddo not require the consistency and precision of regulatory criteria. If there were 10 or fewer values fora chemical, the lowest LOEC was used. If there were more than 10 values, the 10th percentile LOECvalue was used. If the 10th percentile fell between LOEC values, a value was chosen by interpolation.Since these benchmarks are intended to be thresholds for significant effects on growth and production,test endpoints that indicate a high frequency of lethality are not appropriate. Therefore, when abenchmark is based on an LC or on some other endpoint that includes a 50% or greater reduction in50
survivorship, the value is divided by a factor of 5; this factor is based on the authors' expert judgment.Although no data exist for comparison of lethal and sublethal effects concentrations in tests conductedwith the same species and soils, it is assumed that a factor of 5 can be used to approximate the ratioLC /EC . 50 20
In all cases, benchmark values were rounded down to one significant figure. This rounding was donefor two reasons. First, it is not appropriate to ascribe greater precision to a number than it actuallypossesses; these benchmarks are very imprecise. Second, the rounding serves to emphasize the fact thatthe benchmarks are conceptually distinct from the test endpoint values from which they were derived.That is, an LOEC may be a precise estimate of the lowest toxic concentration for a particular plantvariety in a particular test system, but when an LOEC is used as a benchmark for all plants in field soils,it is a qualitatively different and much more poorly defined value.
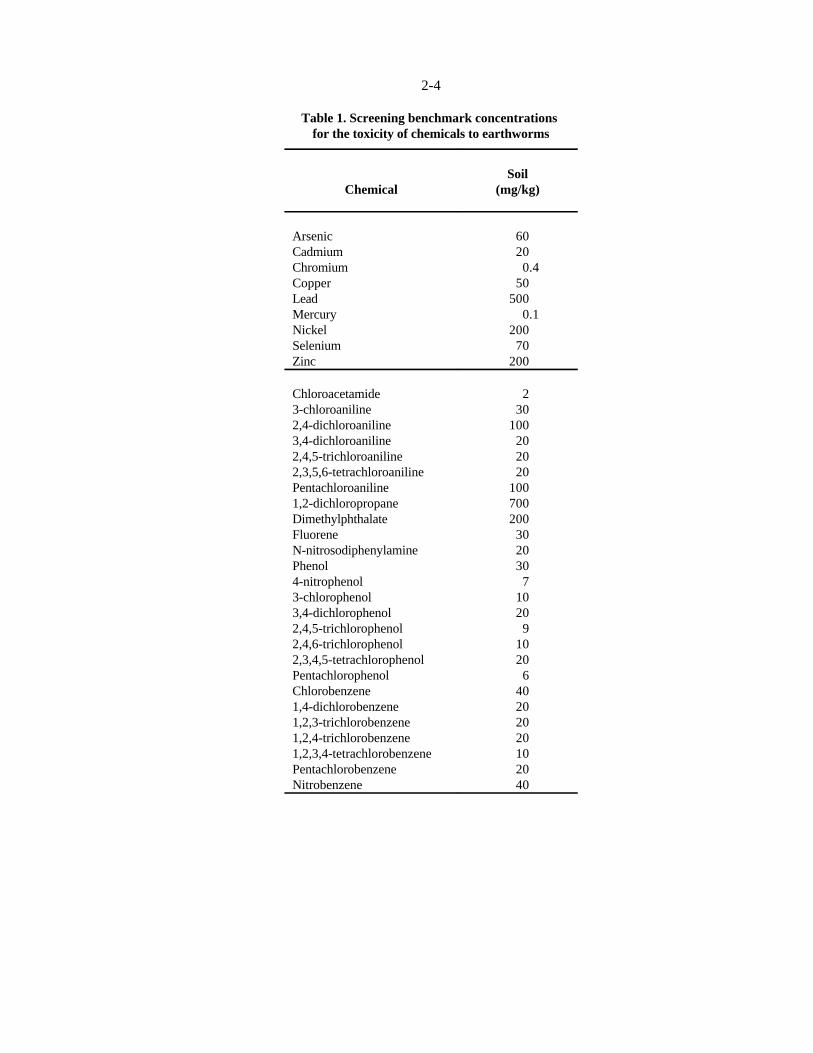
Benchmarks were derived in the previously described manner for earthworms and microbialheterotrophs. Insufficient information was available for establishing benchmarks for other invertebrates,as discussed in the appropriate section of this report. Proposed screening benchmarks for toxic effectsof contaminants in soils are presented in Table 1 (earthworms) and Table 2 (microbial populations).
2-4
Table 1. Screening benchmark concentrations for the toxicity of chemicals to earthworms
Chemical (mg/kg)Soil
Arsenic 60Cadmium 20Chromium 0.4Copper 50Lead 500Mercury 0.1Nickel 200Selenium 70Zinc 200
Chloroacetamide 23-chloroaniline 302,4-dichloroaniline 1003,4-dichloroaniline 202,4,5-trichloroaniline 202,3,5,6-tetrachloroaniline 20Pentachloroaniline 1001,2-dichloropropane 700Dimethylphthalate 200Fluorene 30N-nitrosodiphenylamine 20Phenol 304-nitrophenol 73-chlorophenol 103,4-dichlorophenol 202,4,5-trichlorophenol 92,4,6-trichlorophenol 102,3,4,5-tetrachlorophenol 20Pentachlorophenol 6Chlorobenzene 401,4-dichlorobenzene 201,2,3-trichlorobenzene 201,2,4-trichlorobenzene 201,2,3,4-tetrachlorobenzene 10Pentachlorobenzene 20Nitrobenzene 40
2-5
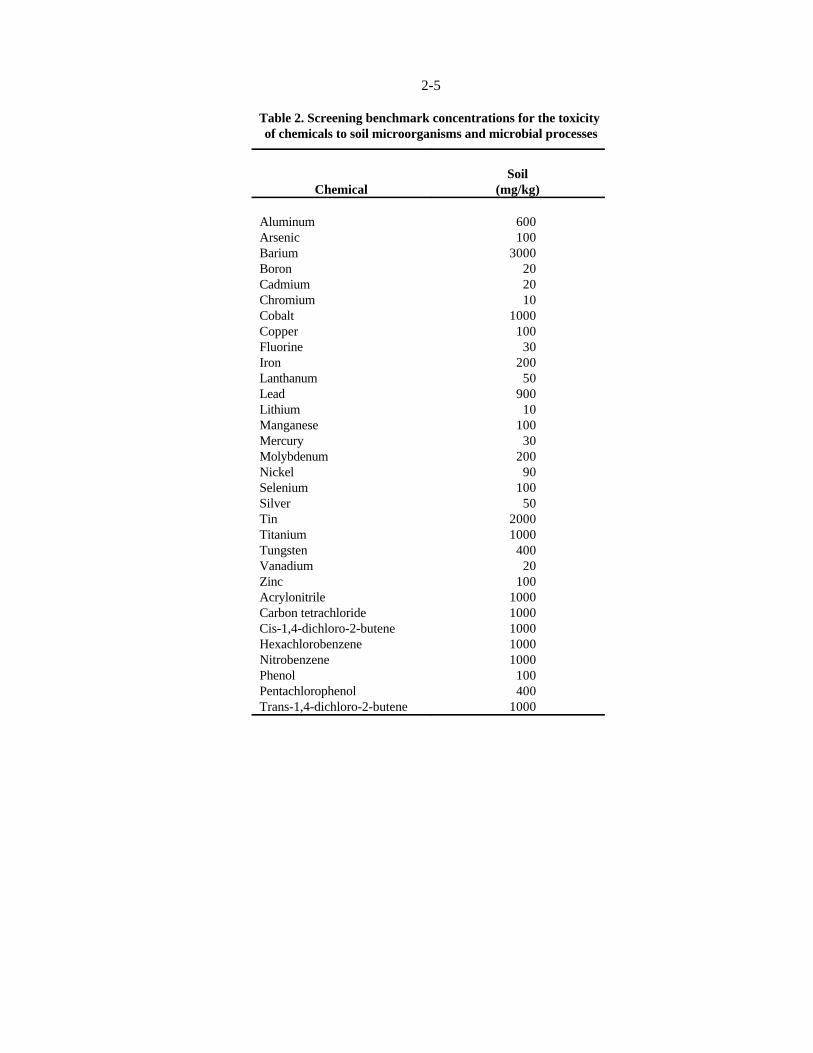
Table 2. Screening benchmark concentrations for the toxicity of chemicals to soil microorganisms and microbial processes
Chemical (mg/kg)Soil
Aluminum 600Arsenic 100Barium 3000Boron 20Cadmium 20Chromium 10Cobalt 1000Copper 100Fluorine 30Iron 200Lanthanum 50Lead 900Lithium 10Manganese 100Mercury 30Molybdenum 200Nickel 90Selenium 100Silver 50Tin 2000Titanium 1000Tungsten 400Vanadium 20Zinc 100Acrylonitrile 1000Carbon tetrachloride 1000Cis-1,4-dichloro-2-butene 1000Hexachlorobenzene 1000Nitrobenzene 1000Phenol 100Pentachlorophenol 400Trans-1,4-dichloro-2-butene 1000
2-6
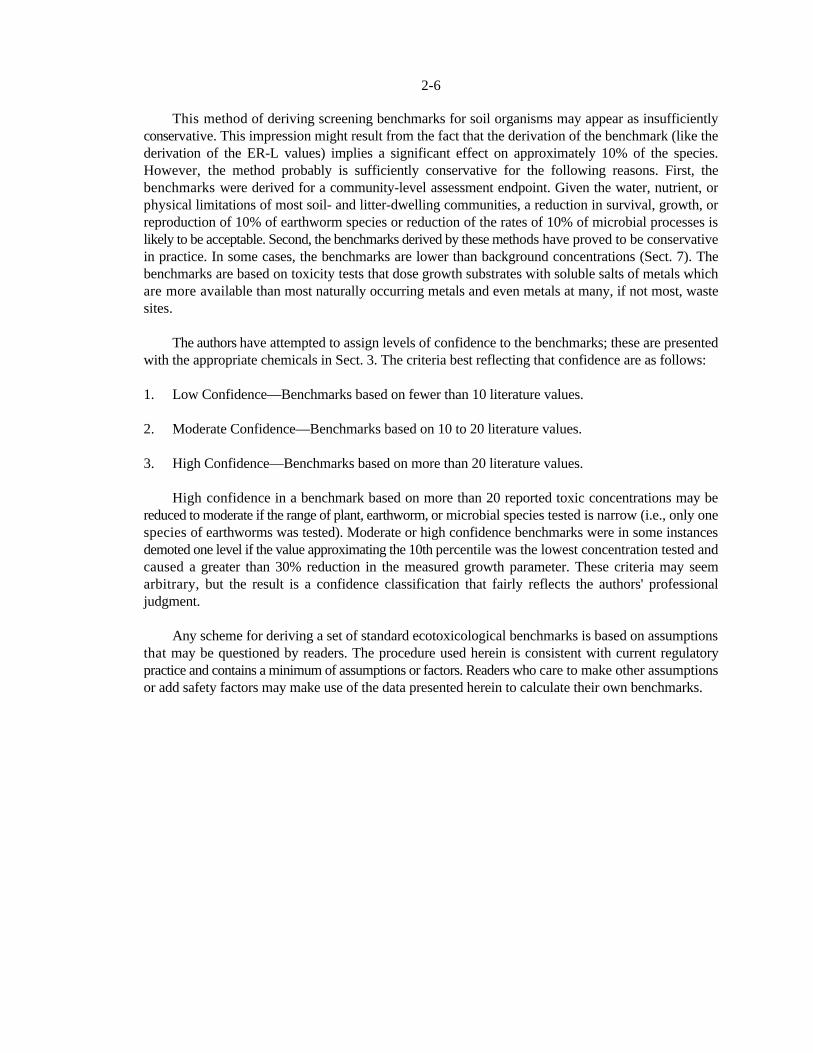
This method of deriving screening benchmarks for soil organisms may appear as insufficientlyconservative. This impression might result from the fact that the derivation of the benchmark (like thederivation of the ER-L values) implies a significant effect on approximately 10% of the species.However, the method probably is sufficiently conservative for the following reasons. First, thebenchmarks were derived for a community-level assessment endpoint. Given the water, nutrient, orphysical limitations of most soil- and litter-dwelling communities, a reduction in survival, growth, orreproduction of 10% of earthworm species or reduction of the rates of 10% of microbial processes islikely to be acceptable. Second, the benchmarks derived by these methods have proved to be conservativein practice. In some cases, the benchmarks are lower than background concentrations (Sect. 7). Thebenchmarks are based on toxicity tests that dose growth substrates with soluble salts of metals whichare more available than most naturally occurring metals and even metals at many, if not most, wastesites.
The authors have attempted to assign levels of confidence to the benchmarks; these are presentedwith the appropriate chemicals in Sect. 3. The criteria best reflecting that confidence are as follows:
1. Low Confidence—Benchmarks based on fewer than 10 literature values.
2. Moderate Confidence—Benchmarks based on 10 to 20 literature values.
3. High Confidence—Benchmarks based on more than 20 literature values.
High confidence in a benchmark based on more than 20 reported toxic concentrations may bereduced to moderate if the range of plant, earthworm, or microbial species tested is narrow (i.e., only onespecies of earthworms was tested). Moderate or high confidence benchmarks were in some instancesdemoted one level if the value approximating the 10th percentile was the lowest concentration tested andcaused a greater than 30% reduction in the measured growth parameter. These criteria may seemarbitrary, but the result is a confidence classification that fairly reflects the authors' professionaljudgment.
Any scheme for deriving a set of standard ecotoxicological benchmarks is based on assumptionsthat may be questioned by readers. The procedure used herein is consistent with current regulatorypractice and contains a minimum of assumptions or factors. Readers who care to make other assumptionsor add safety factors may make use of the data presented herein to calculate their own benchmarks.
3-1
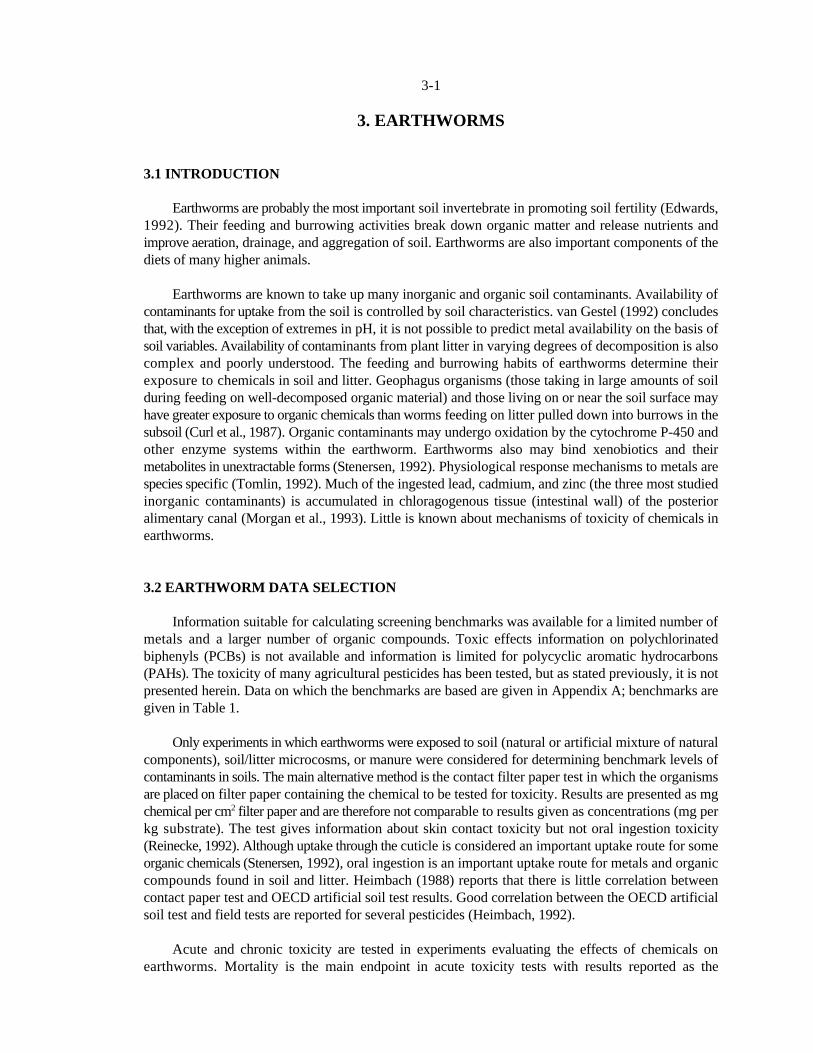
3. EARTHWORMS
3.1 INTRODUCTION
Earthworms are probably the most important soil invertebrate in promoting soil fertility (Edwards,1992). Their feeding and burrowing activities break down organic matter and release nutrients andimprove aeration, drainage, and aggregation of soil. Earthworms are also important components of thediets of many higher animals.
Earthworms are known to take up many inorganic and organic soil contaminants. Availability ofcontaminants for uptake from the soil is controlled by soil characteristics. van Gestel (1992) concludesthat, with the exception of extremes in pH, it is not possible to predict metal availability on the basis ofsoil variables. Availability of contaminants from plant litter in varying degrees of decomposition is alsocomplex and poorly understood. The feeding and burrowing habits of earthworms determine theirexposure to chemicals in soil and litter. Geophagus organisms (those taking in large amounts of soilduring feeding on well-decomposed organic material) and those living on or near the soil surface mayhave greater exposure to organic chemicals than worms feeding on litter pulled down into burrows in thesubsoil (Curl et al., 1987). Organic contaminants may undergo oxidation by the cytochrome P-450 andother enzyme systems within the earthworm. Earthworms also may bind xenobiotics and theirmetabolites in unextractable forms (Stenersen, 1992). Physiological response mechanisms to metals arespecies specific (Tomlin, 1992). Much of the ingested lead, cadmium, and zinc (the three most studiedinorganic contaminants) is accumulated in chloragogenous tissue (intestinal wall) of the posterioralimentary canal (Morgan et al., 1993). Little is known about mechanisms of toxicity of chemicals inearthworms.
3.2 EARTHWORM DATA SELECTION
Information suitable for calculating screening benchmarks was available for a limited number ofmetals and a larger number of organic compounds. Toxic effects information on polychlorinatedbiphenyls (PCBs) is not available and information is limited for polycyclic aromatic hydrocarbons(PAHs). The toxicity of many agricultural pesticides has been tested, but as stated previously, it is notpresented herein. Data on which the benchmarks are based are given in Appendix A; benchmarks aregiven in Table 1.
Only experiments in which earthworms were exposed to soil (natural or artificial mixture of naturalcomponents), soil/litter microcosms, or manure were considered for determining benchmark levels ofcontaminants in soils. The main alternative method is the contact filter paper test in which the organismsare placed on filter paper containing the chemical to be tested for toxicity. Results are presented as mgchemical per cm filter paper and are therefore not comparable to results given as concentrations (mg per2
kg substrate). The test gives information about skin contact toxicity but not oral ingestion toxicity(Reinecke, 1992). Although uptake through the cuticle is considered an important uptake route for someorganic chemicals (Stenersen, 1992), oral ingestion is an important uptake route for metals and organiccompounds found in soil and litter. Heimbach (1988) reports that there is little correlation betweencontact paper test and OECD artificial soil test results. Good correlation between the OECD artificialsoil test and field tests are reported for several pesticides (Heimbach, 1992).
Acute and chronic toxicity are tested in experiments evaluating the effects of chemicals onearthworms. Mortality is the main endpoint in acute toxicity tests with results reported as the
3-2
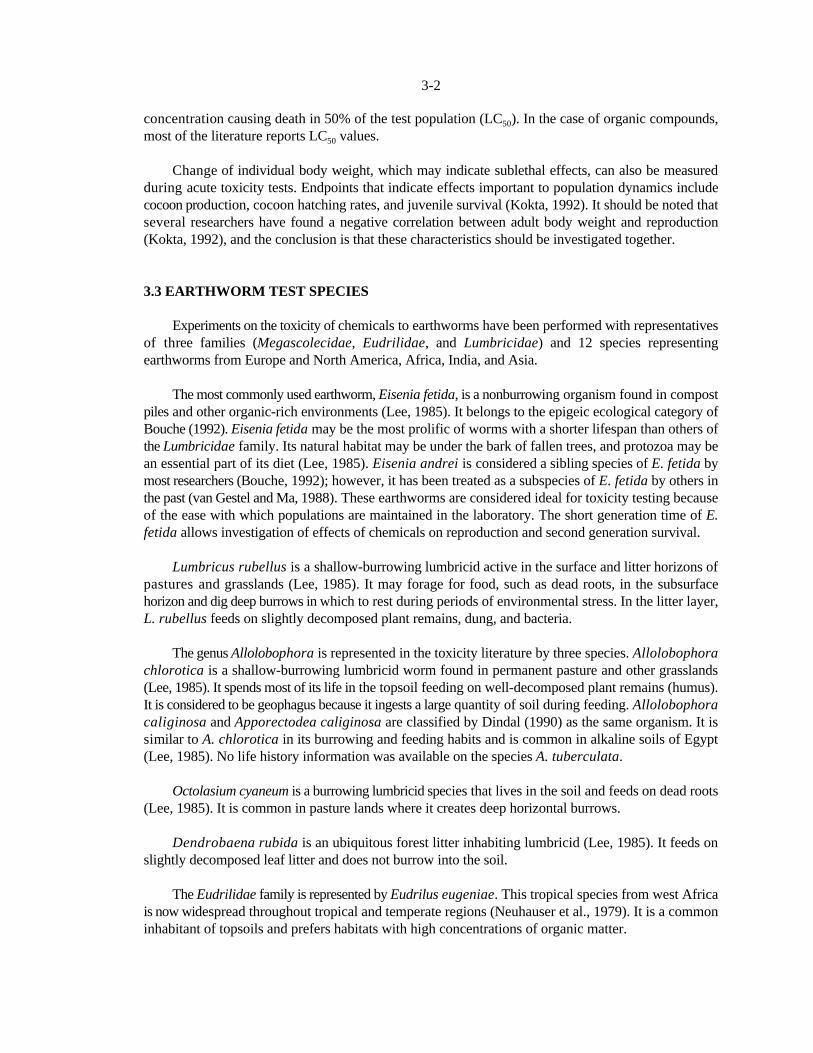
concentration causing death in 50% of the test population (LC ). In the case of organic compounds,50
most of the literature reports LC values.50
Change of individual body weight, which may indicate sublethal effects, can also be measuredduring acute toxicity tests. Endpoints that indicate effects important to population dynamics includecocoon production, cocoon hatching rates, and juvenile survival (Kokta, 1992). It should be noted thatseveral researchers have found a negative correlation between adult body weight and reproduction(Kokta, 1992), and the conclusion is that these characteristics should be investigated together.
3.3 EARTHWORM TEST SPECIES
Experiments on the toxicity of chemicals to earthworms have been performed with representativesof three families (Megascolecidae, Eudrilidae, and Lumbricidae) and 12 species representingearthworms from Europe and North America, Africa, India, and Asia.
The most commonly used earthworm, Eisenia fetida, is a nonburrowing organism found in compostpiles and other organic-rich environments (Lee, 1985). It belongs to the epigeic ecological category ofBouche (1992). Eisenia fetida may be the most prolific of worms with a shorter lifespan than others ofthe Lumbricidae family. Its natural habitat may be under the bark of fallen trees, and protozoa may bean essential part of its diet (Lee, 1985). Eisenia andrei is considered a sibling species of E. fetida bymost researchers (Bouche, 1992); however, it has been treated as a subspecies of E. fetida by others inthe past (van Gestel and Ma, 1988). These earthworms are considered ideal for toxicity testing becauseof the ease with which populations are maintained in the laboratory. The short generation time of E.fetida allows investigation of effects of chemicals on reproduction and second generation survival.
Lumbricus rubellus is a shallow-burrowing lumbricid active in the surface and litter horizons ofpastures and grasslands (Lee, 1985). It may forage for food, such as dead roots, in the subsurfacehorizon and dig deep burrows in which to rest during periods of environmental stress. In the litter layer,L. rubellus feeds on slightly decomposed plant remains, dung, and bacteria.
The genus Allolobophora is represented in the toxicity literature by three species. Allolobophorachlorotica is a shallow-burrowing lumbricid worm found in permanent pasture and other grasslands(Lee, 1985). It spends most of its life in the topsoil feeding on well-decomposed plant remains (humus).It is considered to be geophagus because it ingests a large quantity of soil during feeding. Allolobophoracaliginosa and Apporectodea caliginosa are classified by Dindal (1990) as the same organism. It issimilar to A. chlorotica in its burrowing and feeding habits and is common in alkaline soils of Egypt(Lee, 1985). No life history information was available on the species A. tuberculata.
Octolasium cyaneum is a burrowing lumbricid species that lives in the soil and feeds on dead roots(Lee, 1985). It is common in pasture lands where it creates deep horizontal burrows.
Dendrobaena rubida is an ubiquitous forest litter inhabiting lumbricid (Lee, 1985). It feeds onslightly decomposed leaf litter and does not burrow into the soil.
The Eudrilidae family is represented by Eudrilus eugeniae. This tropical species from west Africais now widespread throughout tropical and temperate regions (Neuhauser et al., 1979). It is a commoninhabitant of topsoils and prefers habitats with high concentrations of organic matter.
3-3
The Megascolecidae family is represented by three organisms for which little information isavailable. Perionyx excavatus is the Indian subcontinent equivalent of Eisenia fetida, preferringcompost heaps and other accumulations of organic material (Lee, 1985). It is known to feed on animaldung. Pheretima posthuma is originally from east and southeast Asia. No life history information wasfound on Octochaetus pattoni; however, other members of the genus occur in New Zealand (Lee, 1985).
3.4 EARTHWORM DATA AND BENCHMARK DERIVATION
3.4.1 Inorganic Compounds
Arsenic. Fischer and Koszorus (1992) tested the effects of 68 ppm of arsenic (as potassiumarsenate) on growth and reproduction of Eisenia fetida (average initial age of 5 weeks) when added toa combination of peaty marshland soil and horse manure (1:1). The number of survivors and their livemass and the number of cocoons produced were measured. The number of cocoons produced per wormshowed the highest sensitivity to arsenic with a 56% reduction at the test concentration.
The benchmark of 60 ppm arsenic is based on this study only. Because of the lack of data,confidence in this benchmark is low.
Cadmium. van Gestel and his colleagues in the Netherlands have established a fairly standardprocedure for testing the toxicity of chemicals to earthworms in an artificial soil mixture made up of (bydry weight) 10% sphagnum peat, 20% kaolin clay, and 69% fine sand and CaCO to adjust the pH to3
approximately 6 (OECD soil) (van Gestel et al., 1992). The work in this citation evaluated the effectsof Cd, added to the soil as CdCl , on growth and reproduction (cocoons/worm/week, percent fertility of2
cocoons, juveniles/fertile cocoon, juveniles/worm/week) of Eisenia andrei after 21 days. The Cd wasadded in aqueous form and the resultant substrate added to 1 L glass jars. Approximately 5 g finelyground cow dung was added to a shallow hole in the middle of the substrate to serve as a food source forthe 10 worms. A concentration of 18 ppm Cd was required to reduce the number of cocoonsproduced/week and the number of juveniles/worm (23 and 22%). Growth and reproduction were notaffected at 10 ppm Cd. In other experiments by van Gestel et al. (1991a) using the same system butcomparing the results from putting the food source in a hole with those from mixing it in with substrate,growth was reduced 44% by 100 ppm (32 ppm had no effect) in the former case and 40% by 32 ppm(10 ppm had no effect), in the latter. The EC for clitella development (indicating sexual maturity) was50
108 ppm Cd for dung placed in a center hole in the substrate, and 27 ppm for dung mixed in withsubstrate.
Khalil et al. (1996) measured the mortality and cocoon production of Aporrectodea caliginosawhen exposed to various concentrations of cadmium, copper and zinc sulfate in an Egyptian soil. Aftereight weeks of exposure to 10 mg/kg of cadmium, the lowest concentration tested, cocoon productionwas reduced 25%. Toxicity tests with mixtures of the contaminants were also conducted, and it wasconcluded that the three metals act antagonistically at the concentrations tested.
Spurgeon and Hopkin (1995) investigated the effect of cadmium (as nitrate) on survival, growth,cocoon production, and cocoon viability of Eisenia fetida in an OECD artificial soil. The lowest EC50,215 ppm, was for growth. The investigators also studied the toxicity of metal-contaminated field soilsand an artificial soil contaminated with multiple metals.
Spurgeon et al. (1994) kept adult E. fetida in contaminated OECD artificial soil (pH 6.3) for8 weeks to test the effects of Cd [as Cd(NO ) ] on survival and growth of the earthworms. Results were3 2
3-4
reported as LC s for mortality and EC s for effects on cocoon production. After 56 days, the calculated50 50
LC was greater than 300 ppm Cd. The EC for cocoon production was 46.3 ppm.50 50
The effects of Cd added to horse manure (as Cd acetate) on E. fetida (initially less than 2 weeksold) was investigated by Malecki et al. (1982). Two growth periods were used, 8 and 20 weeks, andsurvival, weight gain, and cocoon production were measured. The most sensitive parameter was cocoonproduction. In the 8-week test, the lowest concentration tested, 25 ppm Cd, caused a 52% decrease incocoon production. In the 20-week test, the lowest concentration tested, 50 ppm Cd, caused a 24%decrease in cocoon production.
The previously described system (horse manure) was used by Neuhauser et al. (1984) to look at theeffects of Cd added as various soluble salts on growth and reproduction of E. fetida. The authors reporttheir results with pooled data from all forms of a metal. After 6 weeks, both growth (weight) and cocoonproduction were decreased (25 and 100%) by 100 ppm Cd, the lowest concentration tested.
Bengtsson et al. (1986) report the effects of Cd on reproduction in the earthworm Dendrobaenarubida when grown in substrate at varying acidity. The metal was added to a 1:2 (volume) combinationof sandy soil and well-decomposed cattle dung with a resulting organic carbon of about 6%. After 4months at pH 4.5, the number of cocoons produced per worm was reduced 62% by 100 ppm Cd, while10 ppm had no effect. The percent hatched cocoons, hatchlings/cocoon, and total number of hatchlingswere not affected. At pH 5.5, the number of cocoons produced per worm, hatchlings/cocoon, and totalnumber of hatchlings were reduced 78, 71, and 74%, respectively, by 100 ppm Cd, while 10 ppm hadno effect. The percent hatched cocoons was not affected. At pH 6.5, the percent hatched cocoons,hatchlings/cocoon, and total number of hatchlings were reduced 47, 38, and 30%, respectively, by 100ppm Cd, while 10 ppm had no effect. The number of cocoons/worm was not affected.
van Gestel and van Dis (1988) conducted a series of experiments in a sandy soil (1.7% organicmatter, CEC 5.5 meq/100 g soil) to investigate the effects of acidity on acute toxicity of Cd (CdCl ) to2
adult E. andrei. The LC was between 320 and 560 ppm Cd after 14 days at pH 4.1 and >1000 (no50
effect) at pH 7. The LC50 concentration in OECD soil, with 10% organic matter at pH 7, was also>1000 (no effect).
Neuhauser et al. (1985) used OECD artificial soil (pH 6) to determine LC of Cd (added as Cd50
nitrate) for adult E. fetida. After 14 days, the LC was calculated to be 1843 ppm Cd.50
In a study examining the effects of soil factors on Cd toxicity and uptake, Ma (1982) used a sandyloam soil (pH 7.3, 8% organic matter) spiked with CdCl to determine the effects of Cd on survival of2
adult Lumbricus rubellus. After 12 weeks, 1000 ppm Cd caused an 82% decrease in survival while 150ppm had no effect.
A benchmark of 20 ppm has been computed for Cd on the basis of the 18 available concentrationscausing toxicity. Confidence in this benchmark is moderate.
Chromium. Abbasi and Soni (1983) worked with a system in which the earthworm Octochaetuspattoni was kept in concrete tanks containing a mixture of soil and animal dung for 60 days to assessthe effect of Cr(VI), added as K Cr O , on survival and reproduction. Survival was the most sensitive2 2 7
measure with a 75% decrease resulting from 2 ppm Cr, the lowest concentration tested. The number ofcocoons produced was not diminished until the concentration reached 20 ppm Cr (highest concentrationtested); the number of juveniles produced was not affected.
3-5
These same researchers (Soni and Abbasi, 1981) found no survival of Pheretima posthuma after61 days in a paddy soil to which 10 ppm Cr(VI) (lowest concentration tested) was added.
van Gestel et al. (1992), in the system described previously for Cd, also found growth of E. andreito be more sensitive to Cr than reproduction. In this case, Cr(III) was added as chromic nitrate to OECDsoil. A concentration of 32 ppm Cr reduced growth by 30% while cocoons/worm/week, percent fertilecocoons, and juveniles/worm/week were reduced 28, 22, and 51%, respectively, by 100 ppm Cr.
Molnar et al. (1989) examined the effects of Cr(III) and Cr(VI) on growth and reproduction ofEisenia fetida in an undefined substrate. Chromium (VI) was added as K Cr O and Cr(III) as2 2 7
KCr(SO ) . Reproduction after 8 weeks was the measure most sensitive to Cr(III) with a 55% decrease4 2
in the number of cocoons and hatchlings at 625 ppm Cr(III). The authors indicate that reproduction wasalso sensitive to Cr(VI) but no data were given. After 2 weeks, mass gain of juveniles was decreased34% by 2,500 ppm Cr(III) (625 ppm had no effect) and 43% by 625 ppm Cr(VI) (lowest concentrationtested). After 4 weeks, mass gain of juveniles was decreased 39% by 2,500 ppm Cr(III) (625 ppm hadno effect), and Cr(VI) had no effect. Chromium(VI) at 1,250 ppm was ineffective when worms wereintroduced after the soil had equilibrated for 2 weeks, regardless of the length of exposure.
It is difficult to set a benchmark concentration for toxicity of Cr to earthworms. Survival may bemore sensitive than reproduction to the metal when it is added to the earthworm substrate as a solublesalt. The relative toxicity of Cr(III) and Cr(VI) is not clear from these studies. Cr(VI) ions can passthrough cell membranes with much greater ease than Cr(III) ions. However, it is thought that Cr(VI) isreduced to Cr(III) inside the cell (Molnar et al., 1989); this latter may be the final active form. Withouta better understanding of Cr transformations in the soil, transport across earthworm cell membranes, andreactions within the cell, it is difficult to separate the effects of the two different forms.
The 0.4 ppm benchmark for Cr is based on the work of Abbasi and Soni (1983). A safety factorof 5 was applied to the 2 ppm LOEC because it caused a 75% reduction in earthworm survival.
Confidence in this benchmark is low because it is based on only five reported concentrationscausing toxicity to earthworms.
Copper. Neuhauser et al. (1984) evaluated the effects of soluble forms of copper on growth andreproduction E. fetida as described for Cd. The authors report their results with pooled data from allforms of a metal. After 6 weeks, both growth (weight) and cocoon production were decreased (75 and85%) by 2000 ppm Cu, while 1000 ppm had no effect.
Khalil et al. (1996) measured the mortality and cocoon production of Aporrectodea caliginosawhen exposed to various concentrations of cadmium, copper and zinc sulfate in an Egyptian soil. Eightweeks of exposure to 100 ppm of copper led to a 36% decrease in cocoon production (NOEC = 50 ppm).Toxicity tests with mixtures of the contaminants were also conducted, and it was concluded that the threemetals act antagonistically at the concentrations tested.
Spurgeon and Hopkin (1995) investigated the effect of copper (as nitrate) on survival, growth,cocoon production, and cocoon viability of Eisenia fetida in an OECD artificial soil. The lowest EC50,601 ppm, was for growth. The investigators also studied the toxicity of metal-contaminated field soilsand an artificial soil contaminated with multiple metals.
Neuhauser et al. (1985) used the OECD artificial soil (pH 6) to estimate LC of Cu (added as Cu50
nitrate) for adult E. fetida. After 14 days, the LC was 643 ppm Cu.50
3-6
Spurgeon et al. (1994) kept adult E. fetida in contaminated OECD artificial soil (pH 6.3) for8 weeks to test the effects of Cu (as Cu(NO ) ) on survival and growth of the earthworms, as described3 2
for Cd. After 56 days, the calculated LC was 555 ppm, and the EC for cocoon production was 53.350 50
ppm.
The effects of Cu added to horse manure (as copper acetate) on E. fetida (initially less than 2 weeksold) was investigated by Malecki et al. (1982). Two growth periods were used, 8 and 20 weeks, andsurvival, weight gain, and cocoon production were measured. The most sensitive parameter was cocoonproduction. In the 8-week test, 500 ppm Cu caused a 24% decrease in cocoon production, while 300 ppmhad no effect. In the 20-week test, 1000 ppm Cu caused a 24% decrease in cocoon production, while 500ppm had no effect.
Bengtsson et al. (1986) looked at the effects of copper on Dendrobaena rubida at different aciditiesin the same type of experiments described for Cd. After 4 months at pH 4.5, the number of cocoonsproduced per worm, hatchlings/cocoon, and total number of hatchlings were reduced 70, 64, and 74%,respectively, by 100 ppm Cu, the lowest concentration tested. The percent hatched cocoons was notaffected. At pH 5.5, the number of cocoons produced per worm, hatchlings/cocoon, and percent hatchedcocoons were reduced 96, 100, and 100%, respectively, by 500 ppm Cu, while 100 ppm had no effect.The total number of hatchlings was not affected. At pH 6.5, the number of cocoons produced per worm,hatchlings/cocoon, and percent hatched cocoons were reduced 90, 100, and 100%, respectively, by 500ppm Cu, while 100 ppm had no effect. The total number of hatchlings was not affected.
In experiments by van Gestel et al. (1991b) using the same system described previously but withCu (CuCl ) mixed homogeneously with the OECD substrate, growth of E. fetida was reduced 32% by2
100 ppm (32 ppm had no effect). The EC for clitella development (sexual development) was >100 ppm50
Cu.
In a study examining the effects of soil factors on Cu toxicity and uptake, Ma (1982) used a sandyloam soil (pH 7.3, 8% organic matter) spiked with CuCl to determine the effects of Cu on survival of2
adult Lumbricus rubellus. After 12 weeks, 1000 ppm Cu caused an 82% decrease in survival while 150ppm had no effect.
The effect of soil organic carbon on toxicity of Cu (CuSO ) to the earthworm Octolasium cyaneum4
was evaluated by Streit and Jaggy (1983). They determined the 14-day LC in a Brown soil, a Rendzina50
soil, and a peat soil containing 3.2, 14, and 43% organic carbon, respectively. LC concentrations were50
180, 850, and 2500 ppm, respectively.
van Rhee (1975) tested the effects of a single concentration of Cu added to a polder soil on bodyweight, number of cocoons produced per week, mortality and sexual development of Allolobophoracaliginosa. After 60 days, number of cocoons produced was the only measure affected; it decreased by27% in the presence of 110 ppm Cu.
Using the OECD artificial soil (pH 6) and 21-day test procedure, van Gestel et al. (1989) lookedat the effects of Cu (as CuCl ) on reproductive parameters of adult E. andrei. After 21 days, cocoon2
production was decreased 36% by the addition of 180 ppm Cu to the substrate, while 120 ppm had noeffect. Cocoon hatchability and number of juveniles per cocoon were not affected.
The sublethal effects of Cu on L. rubellus were investigated with respect to mortality, growth,cocoon production, and litter breakdown activity (Ma, 1984). Loamy sand field soil (5.7% organicmatter, pH 4.8), with Cu added as CuCl , was placed in bags with leaf litter added to the top. In an2
3-7
experiment lasting 6 weeks, the number of cocoons produced was decreased 42% by 131 ppm(HNO :H SO extractable), while 54 ppm had no effect. In another study using this soil with the pH3 2 4
adjusted to between 4.8 and 7.1, Ma investigated at the effect of acidity on toxicity of Cu (CuSO ) to4
L. rubellus growth and reproduction. At pH 4.8, 148 ppm Cu resulted in a 26% decrease in production(83 ppm had no effect). At pH 6, a 33% reduction in cocoon production resulted from 278 ppm Cu,while 148 ppm had no effect. In a 6-week experiment using a calcareous sandy loam soil (pH 7.3,organic matter 3.4%), the number of cocoons produced was diminished 41% in cultures to which 63 ppmCu were added as CuCl (13 ppm had no effect).2
The relative sensitivity of several lumbricid earthworms to Cu (CuCl ) added to a sandy soil (pH2
5, organic matter 5%) was investigated by Ma (1988). EC s for cocoon production of L. rubellus,50
Aporrectodea caliginosa, and Allolobophora chlorotica were 122, 68, and 51 ppm Cu.
The work of Streit and Jaggy (1983) and others shows that the organic carbon content of the soilis a strong determinant of the bioavailability and toxicity of copper. From the studies cited, it appearsthat low pH has a compounding effect, with an increase in Cu availability resulting from more acidconditions. Overall, reproduction is more sensitive than mortality, and there is no consistent evidencethat one genus of earthworms is any less tolerant to Cu under a given set of conditions than anothergenus.
The benchmark for Cu was established at 60 ppm. Confidence in this benchmark is moderate.
Lead. Bengtsson et al. (1986) examined the effects of lead on Dendrobaena rubida at differentacidities in the same type of experiments as those described for Cd. After 4 months at pH 4.5, thenumber of cocoons produced per worm, hatchlings/cocoon, and percent hatched cocoons were reduced75, 100, and 100%, respectively, by 500 ppm Pb, while 100 ppm had no effect. At pH 5.5 and 6.5, Pbhad no effect at any level on any of the measures.
Spurgeon and Hopkin (1995) investigated the effect of lead (as nitrate) on survival, growth, cocoonproduction, and cocoon viability of Eisenia fetida in an OECD artificial soil. The lowest EC50, 1629ppm, was that for cocoon production. The investigators also studied the toxicity of metal-contaminatedfield soils and an artificial soil contaminated with multiple metals.
Spurgeon et al. (1994) kept adult E. fetida in contaminated OECD artificial soil (pH 6.3) for8 weeks to examine the effects of Pb (as Pb(NO ) ) on survival and growth of the earthworms as3 2
described for Cd. After 56 days, the calculated LC was 3760 ppm, and the EC for cocoon production50 50
was 1940 ppm.
The effects of Pb added to horse manure (as lead acetate) on E. fetida was investigated by Maleckiet al. (1982), as described above for Cd. The most sensitive parameter was cocoon production. In the 8-week test, 4000 ppm Pb caused a 50% decrease in cocoon production, while 2000 ppm had no effect.In the 20-week test, 5000 ppm Pb caused a 28% decrease in cocoon production, while 1000 ppm hadno effect.
Neuhauser et al. (1985) used the OECD artificial soil (pH 6) to determine LC of Pb [added as Pb50
(NO )] for adult E. fetida. After 14 days, the LC was calculated to be 5941 ppm Pb.3 50
Neuhauser et al. (1984) evaluated the effects of soluble forms of lead on growth and reproductionof E. fetida as described for Cd. The authors report their results with pooled data from all forms of a
3-8
metal. After 6 weeks, cocoon production was decreased 80% by 5000 ppm Pb, the lowest concentrationtested. Growth was not affected until 40,000 ppm was added to the substrate.
A benchmark of 500 ppm has been established for Pb based on the work of Bengtsson et al. (1986)which showed inhibition of reproduction at this concentration. Confidence in this benchmark is lowbecause of the limited amount of data.
Mercury. Abbasi and Soni (1983) worked with Octochaetus pattoni in a system describedpreviously for Cd. They assessed the effect of Hg(II), added as HgCl , on survival and reproduction.2
Survival and cocoon production were reduced 65 and 40% at 0.5 ppm Hg, the lowest concentrationtested. The number of juveniles produced was not affected.
The effect of methyl mercury on survival and segment regeneration of E. fetida was investigatedby Beyer et al. (1985). Methyl mercury chloride was added to an undefined potting soil in which theearthworms were cultured for 84 days. A concentration of 12.5 ppm Hg reduced survival by 21%, andthe ability to regenerate excised segments was reduced by 69%. Methyl mercury at 2.5 ppm had noeffect.
It is not possible to evaluate the relative toxicity of forms of Hg based on these two studies whichused different systems and evaluated two different families of earthworms.
A benchmark of 0.1 ppm was established for Hg based on the work of Abbasi and Soni (1983). A safety factor of 5 was applied to the 0.5 ppm LOEC because it caused a 65% reduction inearthworm survival. Confidence in this benchmark is low because of the limited amount of data.
Nickel. The effects of Ni (added to horse manure as Ni acetate) on E. fetida were investigated byMalecki et al. (1982), as described for Cd. The most sensitive parameter was cocoon production. In the8-week test, 300 ppm Ni caused a 41% decrease in cocoon production, while 200 ppm had no effect. Inthe 20-week test, 200 ppm Ni caused a 23% decrease in cocoon production, while 100 ppm had noeffect.
Neuhauser et al. (1985) used the OECD artificial soil (pH 6) to determine LC of Ni (added as Ni50
nitrate) for adult E. fetida. After 14 days, the LC was calculated to be 757 ppm Ni.50
Neuhauser et al. (1984) evaluated the effects of soluble forms of nickel on growth and reproductionE. fetida as described for Cd. The authors report their results with pooled data from all forms of a metal.After 6 weeks, cocoon production was decreased 33% by 250 ppm Ni, the lowest concentration tested.Growth was not affected until 500 ppm was added to the substrate.
In a study examining the effects of soil factors on Ni toxicity and uptake, Ma (1982) used a sandyloam soil (pH 7.3, 8% organic matter) spiked with NiCl to determine the effects of Ni on survival of2
adult Lumbricus rubellus. After 12 weeks, 1000 ppm Cd caused a 31% decrease in survival while 150ppm had no effect.
A benchmark of 200 ppm has been established for Ni based on the work of Malecki et al. (1982)which showed inhibition of reproduction at this concentration. Confidence in this benchmark is lowbecause of the limited amount of data.
Selenium. Fischer and Koszorus (1992) tested the effects of 77 ppm of selenium (as sodiumarsenite) on growth and reproduction of Eisenia fetida when added to a combination of peaty marshland
3-9
soil and horse manure (1:1). Number of survivors and their live mass and number of cocoons producedwere measured. The number of cocoons produced per worm showed the highest sensitivity to seleniumwith a 69% reduction at the test concentration.
The benchmark of 70 ppm is based on this study. Confidence in this benchmark is low.
Zinc. van Gestel et al. (1993) evaluated the effect of zinc added as ZnCl to OECD artificial soil2
(pH 6.2), on the growth and reproduction of E. andrei. The numbers of cocoons and juveniles producedwere reduced 31 and 42% by 560 ppm, while 320 ppm had no effect. The percent fertile cocoons andnumber of juveniles per fertile cocoon were not affected until Zn was added to a concentration of 1000ppm Zn, and percent growth of individuals increased with increasing Zn concentration.
Khalil et al. (1996) measured the mortality and cocoon production of Aporrectodea caliginosawhen exposed to various concentrations of cadmium, copper and zinc sulfate in an Egyptian soil.Exposure to 300 ppm of zinc, the lowest concentration tested, led to a 20% reduction in cocoonproduction. Toxicity tests with mixtures of the contaminants were also conducted, and it was concludedthat the three metals act antagonistically at the concentrations tested.
Spurgeon and Hopkin (1995) investigated the effect of zinc (as nitrate) on survival, growth, cocoonproduction, and cocoon viability of Eisenia fetida in an OECD artificial soil. The lowest EC50, 1078ppm, was for mortality. For the derivation of the benchmark, the LC50 was divided by 5 to give aconcentration of 216 ppm. The EC50 for a growth effect was greater than 400 ppm. The investigatorsalso studied the toxicity of metal-contaminated field soils and an artificial soil contaminated withmultiple metals.
Spurgeon and Hopkin (1996a) conducted toxicity tests with zinc (as nitrate) and three earthwormspecies to determine whether the earthworm population distribution near a smelter could be related tospecies sensitivity to metals. Tests were conducted in OECD artificial soil. The growth rates of Eiseniafetida and Aporrectodea rosea were reduced by 69% and 48%, respectively, following exposure to 190ppm for 21 days, the lowest concentration tested. The same concentration led to a 32% decrease in therate of cocoon production by Lumbricus rubellus. Effects on other endpoints tested, such as survival,percentage of fertile cocoons, and rate of production of juveniles, occurred at higher concentrations.
Spurgeon and Hopkin (1996b) used a range of artificial soils with differing organic matter contentand soil pH for tests of the toxicity of zinc to Eisenia fetida. The EC50 concentrations for cocoonproduction in soils with of pH 6.0 and 5%, 10% and 15% organic matter were 136, 462, and 592 ppm,respectively. The EC50 concentrations for cocoon production in soils of pH 6.0 and 5%, 10% and 15%organic matter were 199, 343, and 548 ppm, respectively. The EC50 concentrations for cocoonproduction in soils of pH 6.0 and 5%, 10% and 15% organic matter were 142, 189, and 230 ppm,respectively. Mortality was observed at higher concentrations. In the range of pH and organic matter inthe soils tested, a decrease in pH and/or organic matter content of soils led to a lower toxic concentrationof zinc.
Spurgeon et al. (1994) kept adult E. fetida in contaminated OECD artificial soil (pH 6.3) for8 weeks to test the effects of Zn (as Zn(NO ) ) on survival and growth of the earthworms as described3 2
for Cd. After 56 days, the calculated LC was 745 ppm, and the EC for cocoon production was 27650 50
ppm.
3-10
Neuhauser et al. (1985) used the OECD artificial soil (pH 6) to determine LC of Zn [added as Zn50
(NO )] for adult E. fetida. After 14 days, the LC was calculated to be 662 ppm Zn. To derive the3 50
benchmark, a concentration of 132 ppm (662/5) was used.
van Rhee (1975) tested the effects of one concentration of Zn (1100 ppm) added to a polder soilon body weight, number of cocoons produced per week, mortality and sexual development ofAllolobophora caliginosa. After 60 days, there was a 53% loss of body weight and a 22% increase inmortality; clitellum development and cocoon production were completely inhibited.
Neuhauser et al. (1984) evaluated the effects of soluble forms of zinc on growth and reproductionE. fetida as described for Cd. The authors report their results with data pooled from all forms of a metal.After 6 weeks, cocoon production was decreased 50% by 2500 ppm Zn, while 1000 ppm had no effect.Growth was not affected until 5000 ppm was added to the substrate.
The effects of Zn added to horse manure (as zinc acetate) on E. fetida was investigated by Maleckiet al. (1982), as described for Cd. The most sensitive parameter was cocoon production. In the 8-weektest, 2000 ppm Zn caused a 36% decrease in cocoon production, while 1000 ppm had no effect. In the20-week test, 5000 ppm Zn caused a 53% decrease in cocoon production, while 2500 ppm had no effect.
A benchmark of 100 ppm is established for zinc. The benchmark is somewhat lower thanconcentrations at which effects have been observed. The low concentrations include: measures of cocoonproduction of Eisenia fetida in two artificial soils (136 ppm, 142 ppm) (Spurgeon and Hopkin 1996b)and 132 ppm, which is the LC50 for Eisenia fetida divided by 5 (Neuhauser et al. 1985). The authorshave moderate confidence in this benchmark.
3.4.2 Organic Compounds
A small number of research groups have been conducting experiments on the toxicity of organiccompounds and pesticides to earthworms. As a result, there are a limited number of experimental designsin use, and data are mainly in the form of LC s. The following review describes the experimental designs50
of the various groups; the reader is directed to Appendix A for complete data.
Chloroacetamide. van Gestel and van Dis (1988) evaluated the effects of soil pH and organicmatter content on toxicity of chloroacetamide to survival of adult E. andrei. The LC (14 d) in a sandy50
soil (1.7% organic matter) at pH 4.1 and 7 was determined. Clearly, pH had an effect in this soil withhigher LC values at pH 7. In the OECD artificial soil (7.7% organic matter) at pH 7, the LC was50 50
similar to that in the sandy soil at the same pH. It appears that differences in the organic matter contentin this range were not determining the toxicity of this compound.
Heimbach (1984) also used the OECD artificial soil (pH 7) to evaluate the effects of this compoundon the survival of E. fetida after 28 days. He found an LC of 24 ppm.50
The effect of chloroacetamide on growth and reproduction of E. fetida after 56 days of growth inhorse manure was assessed by Neuhauser and Callahan (1990). A concentration of 500 ppm had noeffect on the earthworms, but 1000 ppm caused 100% mortality.
The LC value between 10 and 18 (van Gestel and van Dis, 1988) was the lowest toxic50
concentration of the five reported. A safety factor of 5 was applied to the lower bound on the LC to50
obtain the benchmark of 2 ppm chloroacetamide. Confidence in this benchmark is low because of thelimited amount of data.
3-11
3-Chloroaniline. van Gestel and Ma (1993) investigated the effects of soil pH and organic mattercontent on the toxicity of this compound to two earthworms, E. andrei and L. rubellus. In a sandy soilwith pH 4.8 and 3.7% organic matter, LC values were lower for both earthworm species than it was50
in the OECD artificial soil with pH 5.9 and 8.1% organic matter. The authors conclude that, with thisnarrow a range of pH values, it is likely that the difference in organic matter is responsible for the results.
The LC value of 195 (van Gestel and Ma, 1993) was the lowest toxic concentration of the four50
reported. A safety factor of 5 was applied to this LC to obtain the benchmark of 30 ppm 3-50
chloroaniline. Confidence in this benchmark is low.
2,4-Dichloroaniline. van Gestel et al. (1989) used the OECD artificial soil (pH 6) to determine theeffects of this compound on growth and reproduction of E. andrei. After 21 days, cocoon production wasreduced 23% by 100 ppm, while 56 ppm had no effect. Cocoon fertility and number of juveniles percocoon were not affected by concentrations up to 180 ppm, the highest concentration tested.
van Gestel and Ma (1990) investigated the effects of soil pH and organic matter content on thetoxicity of this compound to two earthworms, E. andrei and L. rubellus. Two sandy soils had similarpH values (5.3 and 5.6) but different organic matter levels (3.7 and 6.1%). The OECD artificial soil hada pH of 5.9 and 8.1% organic matter. A peaty soil also used had a pH of 4 and organic matter contentof 15.6%. The LC values for 2-4-dichloroaniline ranged from 145 to 824 ppm, with organic matter50
being the more important determinant of bioavailability of this compound within the narrow pH rangeof soils used.
The 100 ppm benchmark is based on the work of van Gestel et al. (1989) which showed inhibitionof reproduction at this concentration. This test endpoint is chosen as more appropriate than lethality(LC ). Confidence in the benchmark is low because of the few data available.50
3,4-Dichloroaniline. van Gestel and van Dis (1988) investigated the effects of soil pH and organicmatter content on the toxicity of this compound to E. fetida. A sandy soil (1.7% organic matter) wastested at pH 4.1 and 7. The OECD artificial soil had a pH of 7 and 7.7% organic matter. The LC values50
ranged from 140 to 250 ppm increased with increasing organic matter content. No difference related topH was seen in the sandy soil.
The LC value of 140 (van Gestel and van Dis, 1988) was the lowest toxic concentration of the50
three reported. A safety factor of 5 was applied to this LC to obtain the benchmark of 20 ppm 3,4-50
dichloroaniline. Confidence in this benchmark is low.
2,4,5-Trichloroaniline. van Gestel and Ma (1993) evaluated the effects of this compound on theearthworms E. andrei and L. rubellus as described for 3-chloroaniline. As was the case for thatcompound, it is likely that the difference in organic matter is responsible for the results.
The lowest LC value of 134 derives from this work. A safety factor of 5 was applied to this LC50 50
to obtain the benchmark of 20 ppm 2,4,5-trichloroaniline. Confidence in this benchmark is low.
2,3,5,6-Tetrachloroaniline. van Gestel and Ma (1993) evaluated the effects of this compound onthe earthworms E. andrei and L. rubellus as described for 3-chloroaniline. There is not much differencein the results under different pH and organic matter conditions, and it is not clear that organic matteraffecting the bioavailability as in the case of 3-chloroaniline and 2,4,5-trichloroaniline.
3-12
The lowest LC value of 116 ppm derives from this work. A safety factor of 5 was applied to this50
LC to obtain the benchmark of 20 ppm 2,3,5,6-tetrachloroaniline. Confidence in this benchmark is low.50
Pentachloroaniline. van Gestel and Ma (1993) evaluated the effects of this compound on theearthworms E. andrei and L. rubellus as described previously. There is considerable difference in theLC s but no discernible pattern was evident based on soil characteristics or species of earthworm tested.50
The lowest LC value of 825 derives from this work. A safety factor of 5 was applied to this LC50 50
to obtain the benchmark of 100 ppm pentachloroaniline. Confidence in this benchmark is low.
1,2-Dichloropropane. Neuhauser et al. (1986) used the OECD artificial soil (pH 6) to assess theeffects of this compound on survival of adults of four earthworms, Perionyx excavatus, Eudriluseugeniae, Eisenia fetida, and Allolobophora tuberculata. They determined the LC after 14 days and50
found less than two-fold difference in sensitivity among the worms; sensitivity decreased in the orderP. excavatus>E. fetida>A. tuberculata>E. eugeniae.
Neuhauser and Callahan (1990) investigated the effect of this compound on growth andreproduction of E. fetida after 56 days of growth in horse manure. A concentration of 80,800 ppm hadno effect on the earthworms, but 92,300 ppm caused 100% mortality.
The LC value of 3880 (Neuhauser et al., 1986) was the lowest toxic concentration of the five50
reported. A safety factor of 5 was applied to this LC to obtain the benchmark of 700 ppm 1,2-50
dichloropropane. Confidence in this benchmark is low.
Dimethylphthalate. Neuhauser et al. (1986) used the OECD artificial soil (pH 6) to assess theeffects of this compound on survival of adults of four species of earthworms, as described previously.The LC s after 14 days showed a three-fold difference in sensitivity among the worms; sensitivity50
decreased in the order P. excavatus>E. eugeniae>E. fetida>A. tuberculata.
Neuhauser and Callahan (1990) evaluated the effect of this compound on growth and reproductionof E. fetida after 56 days of growth in horse manure. A concentration of 47,200 ppm had no effect onthe earthworms, but 70,800 ppm caused a 62% reduction in cocoon production.
The LC value of 1064 (Neuhauser et al., 1986) was the lowest toxic concentration of the three50
reported. A safety factor of 5 was applied to this LC to obtain the benchmark of 200 ppm50
dimethylphthalate. Confidence in this benchmark is low.
Fluorene. Neuhauser et al. (1986) used the OECD artificial soil (pH 6) to assess the effects of thiscompound on survival of adults of four earthworms, as described previously. The LC s after 14 days50
showed little difference in sensitivity among the worms; sensitivity decreased in the orderP. excavatus>E. fetida>E. eugeniae>A. tuberculata.
Neuhauser and Callahan (1990) investigated the effect of this compound on growth andreproduction of E. fetida after 56 days of growth in horse manure. A concentration of 500 ppm had noeffect on the earthworms, but 750 ppm caused a 49% reduction in cocoon production.
The LC value of 170 (Neuhauser et al., 1986) was the lowest toxic concentration of the five50
reported. A safety factor of 5 was applied to this LC to obtain the benchmark of 30 ppm fluorene.50
Confidence in this benchmark is low.
3-13
N-nitrosodiphenylamine. Neuhauser et al. (1986) used the OECD artificial soil (pH 6) to assessthe effects of this compound on survival of adults of four earthworms, as described previously. TheLC s after 14 days showed little difference in sensitivity among the worms; sensitivity decreased in the50
order E. eugeniae>P. excavatus>E. fetida>A. tuberculata.
Neuhauser and Callahan (1990) looked at the effect of this compound on growth and reproductionof E. fetida after 56 days of growth in horse manure. A concentration of 1400 ppm (lowest concentrationtested) caused a 37% reduction in cocoon production.
The LC value of 109 (Neuhauser et al., 1986) was the lowest toxic concentration of the five50
reported. A safety factor of 5 was applied to this LC to obtain the benchmark of 20 ppm50
N-nitrosodiphenylamine. Confidence in this benchmark is low.
Phenol. Neuhauser et al. (1986) used OECD artificial soil (pH 6) to assess the effects of thiscompound on survival of adults of four species of earthworms, as described previously. The LC s after50
14 days showed a less than three-fold difference in sensitivity among the worms; sensitivity decreasedin the order E. eugeniae>P. excavatus>E. fetida>A. tuberculata.
Neuhauser and Callahan (1990) assessed the effect of this compound on growth and reproductionof E. fetida after 56 days of growth in horse manure. A concentration of 3900 ppm had no effect on theearthworms, but 4900 ppm caused a 26% reduction in cocoon production.
The LC value of 188 (Neuhauser et al., 1986) was the lowest toxic concentration of the five50
reported. A safety factor of 5 was applied to this LC to obtain the benchmark of 30 ppm phenol.50
Confidence in this benchmark is low.
4-Nitrophenol. Neuhauser et al. (1986) used the OECD artificial soil (pH 6) to assess the effectsof this compound on survival of adults of four species of earthworms, as described previously. The LC s50
after 14 days showed little difference in sensitivity among the worms; sensitivity decreased in the orderE. fetida>E. eugeniae>P. excavatus>A. tuberculata.
Neuhauser and Callahan (1990) looked at the effect of this compound on growth and reproductionof E. fetida after 56 days of growth in horse manure. A concentration of 600 ppm (the lowestconcentration tested) caused a 39% reduction in cocoon production.
The LC value of 38 (Neuhauser et al., 1986) was the lowest toxic concentration of the five50
reported. A safety factor of 5 was applied to this LC to obtain the benchmark of 7 ppm 4-nitrophenol.50
Confidence in this benchmark is low.
3-Chlorophenol. van Gestel and Ma (1990) investigated the effects of soil pH and organic mattercontent on the toxicity of this compound to two earthworms, E. andrei and L. rubellus. Two sandy soilshad similar pH values (5.3 and 5.6) but different organic matter levels (3.7 and 6.1%). The OECDartificial soil had a pH of 5.9 and 8.1% organic matter. A peaty soil also used had a pH of 4 and organicmatter content of 15.6%. The LC values ranged from 75 to 633 ppm, with organic matter being the50
more important determinant of bioavailability of this compound within the narrow pH range of soilsused.
van Gestel and Ma (1988) looked at the effects of this compound on survival of L. rubellus and E.andrei in two humic sand soils of differing organic matter content ( 3.7 and 6.1%) but similar pH (5 and

3-14
5.6). These investigators found a three-fold difference between the highest and lowest values with nostrong trend in relation to earthworm species or soil factors.
The benchmark for this compound has been established at 10 ppm. The LC of 75 from the work50
of van Gestel and Ma (1990) approximates the 10th percentile. A safety factor of 5 was applied to thisvalue to obtain the benchmark. Confidence in this benchmark is low because all 12 values of the dataset are LC s.50
3,4-Dichlorophenol. van Gestel and Ma (1990) investigated the effects of soil pH and organicmatter content on the toxicity of this compound to two earthworms, E. andrei and L. rubellus, asdescribed previously. The LC values ranged from 134 to 680 ppm, with a trend of organic matter being50
more important than pH as a determinant of bioavailability for this compound.
van Gestel and Ma (1988) assessed at the effects of this compound on survival of L. rubellus andE. andrei in two humic sand soils of differing organic matter content but similar with respect to pH, asdescribed previously. There was about a three-fold difference between the highest and lowest values withno strong trend in relation to earthworm species or soil factors.
The benchmark for this compound was established at 20 ppm. The LC of 134 from the work of50
van Gestel and Ma (1990) approximates the 10th percentile. A safety factor of 5 was applied to thisvalue to obtain the benchmark. Confidence in this benchmark is low because all 12 values of the dataset are LC s.50
2,4,5-Trichlorophenol. van Gestel and Ma (1990) investigated the effects of soil pH and organicmatter content on the toxicity of this compound to two earthworm species, E. andrei and L. rubellus,as described previously. The LC values ranged from 46 to 875 ppm, with a trend of organic matter50
being more important than pH as a determinant of bioavailability within earthworm type. E. andreiappears to be more sensitive than L. rubellus to this compound.
van Gestel and Ma (1988) assessed the effects of this compound on survival of L. rubellus and E.andrei in two humic sand soils of differing organic matter content but similar pH, as describedpreviously. The LC values ranged from 52 to 290 ppm, with a trend of organic matter being the more50
important determinant of bioavailability within earthworm type. E. andrei again appears to be moresensitive to this compound than L. rubellus.
The benchmark for this compound was established at 9 ppm. The LC of 46 from the work of van50
Gestel and Ma (1990) approximates the 10th percentile. A safety factor of 5 was applied to this valueto obtain the benchmark. Confidence in this benchmark is low because all 12 values of the data set areLC s.50
2,4,6-Trichlorophenol. Neuhauser et al. (1986) used the OECD artificial soil (pH 6) to assess theeffects of this compound on survival of adults of four earthworms, as described previously. The LC s50
after 14 days showed little difference in sensitivity among the worms; sensitivity decreased in the orderE. fetida>P. excavatus>E. eugeniae>A. tuberculata.
Neuhauser and Callahan (1990) assessed the effect of this compound on growth and reproductionof E. fetida after 56 days of growth in horse manure. A concentration of 100 ppm (lowest concentrationtested) caused a 28% reduction in cocoon production.

3-15
The LC value of 58 (Neuhauser et al., 1986) was the lowest toxic concentration of the five50
reported. A safety factor of 5 was applied to this LC to obtain the benchmark of 10 ppm for 2,4,6-50
trichlorophenol. Confidence in this benchmark is low.
2,3,4,5-Tetrachlorophenol. van Gestel and Ma (1990) investigated the effects of soil pH andorganic matter content on the toxicity of this compound to two earthworms, E. andrei and L. rubellus,as described previously. The LC values ranged from 117 to 875 ppm, with a trend of organic matter50
being more important that pH as a determinant of bioavailability within earthworm species. E. andreiappears to be more sensitive than L. rubellus to this compound.
van Gestel and Ma (1988) looked at the effects of this compound on survival of L. rubellus and E.andrei in two humic sand soils of differing organic matter content but similar pH, as describedpreviously. The LC values ranged from 116 to 828 ppm, with a trend of organic matter being the more50
important determinant of bioavailability within earthworm type. E. andrei again appears to be moresensitive to this compound than L. rubellus.
The LC value of 116 (van Gestel and Ma, 1990) was the lowest toxic concentration of the eight50
reported. A safety factor of 5 was applied to this LC to obtain the benchmark of 20 ppm 2,3,4,5-50
tetrachlorophenol. Confidence in this benchmark is low.
Pentachlorophenol. van Gestel and van Dis (1988) investigated the effects of soil pH and organicmatter content on the toxicity of this compound to E. fetida. A sandy soil (1.7% organic matter) wastested at pH 4.1 and 7. The OECD artificial soil had a pH of 7 and 7.7% organic matter. There was nostrong trend related to organic matter, but the highest LC occurred in the more acid soil.50
Fitzgerald et al. (1996) investigated the role of species, temperature, and soil type on toxicity ofpentachlorophenol to earthworms. The researchers estimated incipient lethal levels (ILLs), which theydefined as a time-independent LC50, i. e., an LC50 that does not change if the test is run for a longerperiod of time. The ILLs for Eisenia fetida grown for 14 days in an artificial soil at 24°C or 15°C were37 ppm and 27 ppm, respectively. The ILL for Eisenia fetida grown for 14 days in a clay soil at 24°Cwas 72 ppm. The ILL for Eisenia eugeniae at 24°C was 168 ppm. Lumbricus terrestris grown at 15°Chad an ILL of 191 ppm.
van Gestel et al. (1989) used the OECD artificial soil (pH 6) to determine the effects of thiscompound on the growth and reproduction of E. andrei. After 21 days, percent cocoon hatching successwas reduced 50% by 32 ppm, while 10 ppm had no effect. Cocoon production and number of juvenilesper cocoon were not affected until 100 ppm was added.
Heimbach (1984) used the OECD artificial soil (pH 7) to evaluate the effects of this compound onsurvival of E. fetida after 28 days. He found an LC of 87 ppm.50
van Gestel and Ma (1990) investigated the effects of soil pH and organic matter content on thetoxicity of this compound to two earthworms, E. andrei and L. rubellus, as described previously. TheLC values ranged from 83 to 2298 ppm, with the highest value occurring in soil with the highest50
organic matter content for each earthworm species. E. andrei appears to be more sensitive than L.rubellus to this compound.
van Gestel and Ma (1988) investigated the effects of this compound on survival of L. rubellus andE. andrei in two humic sand soils of differing organic matter content but similar pH, as described
3-16
previously. The LC values ranged from 94 to 1094 ppm, with no strong trend related to organic matter.50
E. andrei again appears to be more sensitive to this compound than L. rubellus.
The 10th percentile of the data is about 30 ppm. A safety factor of 5 is applied to the value toobtain the benchmark of 6 ppm pentachlorophenol. Confidence in this benchmark is low because all butone of the 22 values in the data set are LC s.50
Chlorobenzene. van Gestel et al. (1991b) investigated the effects of soil pH and organic mattercontent on the toxicity of this compound to two earthworms species, E. andrei and L. rubellus. In asandy soil with pH 4.8 and 3.7% organic matter and OECD artificial soil (pH 5.9 and 8.1% organicmatter), LC values were lower for E. fetida than for L. rubellus. Values ranged from 240 to 1107 ppm.50
The LC value of 240 (van Gestel et al., 1991b) was the lowest toxic concentration of the four50
reported. A safety factor of 5 was applied to this LC to obtain the benchmark of 40 ppm50
chlorobenzene. Confidence in this benchmark is low.
1,4-Dichlorobenzene. van Gestel et al. (1991b) investigated the effects of soil pH and organicmatter content on the toxicity of this compound to two earthworms species, E. andrei and L. rubellus.In a sandy soil with pH 4.8 and 3.7% organic matter and the OECD artificial soil (pH 5.9 and 8.1%organic matter), LC values were lower in the soil with a lower percentage of organic matter. LC50 50
values ranged from 128 to 615 ppm.
The LC value of 128 (van Gestel et al., 1991b) was the lowest toxic concentration of the four50
reported. A safety factor of 5 was applied to this LC to obtain the benchmark of 20 ppm 1,4-50
dichlorobenzene. Confidence in this benchmark is low.
1,2,3-Trichlorobenzene. van Gestel and Ma (1990) investigated the effects of soil pH and organicmatter content on the toxicity of this compound to two earthworms species, E. andrei and L. rubellus,as described previously. The LC values ranged from 115 to 563 ppm, with the highest LC occurring50 50
in soil with the highest organic matter content. No trend in sensitivity of earthworm species was evident.
The LC value of 115 (van Gestel and Ma, 1990) was the lowest toxic concentration of the eight50
reported. A safety factor of 5 was applied to this LC to obtain the benchmark of 20 ppm 1,2,3-50
trichlorobenzene. Confidence in this benchmark is low because of the limited amount of data.
1,2,4-Trichlorobenzene. Neuhauser et al. (1986) used the OECD artificial soil (pH 6) to assessthe effects of this compound on survival of adults of four earthworms species, as described previously.The LC s after 14 days showed little difference in sensitivity among the worms; sensitivity decreased50
in the order E. eugeniae>P. excavatus>E. fetida>A. tuberculata.
The LC value of 127 ppm (Neuhauser et al., 1986) was the lowest toxic concentration of the four50
reported. A safety factor of 5 was applied to this LC to obtain the benchmark of 20 ppm 1,2,4-50
trichlorobenzene. Confidence in this benchmark is low.
1,2,3,4-Tetrachlorobenzene. van Gestel et al. (1991b) investigated the effects of soil pH andorganic matter content on the toxicity of this compound to two earthworms species, E. andrei andL. rubellus. In a sandy soil with pH 4.8 and 3.7% organic matter and the OECD artificial soil (pH 5.9and 8.1% organic matter), LC values were lower in the soil with less organic matter. The LC values50 50
ranged from 75 to 223 ppm.
The LC value of 75 (van Gestel et al., 1991b) was the lowest toxic concentration of the five50
reported. A safety factor of 5 was applied to this LC to obtain the benchmark of 10 ppm 1,2,3,4-50
tetrachlorobenzene. Confidence in this benchmark is low.
Pentachlorobenzene. van Gestel et al. (1991a) investigated the effects of soil pH and organicmatter content on the toxicity of this compound to two earthworms species, E. andrei and L. rubellus,as described previously. In a sandy soil and the OECD artificial soil, LC values were lower in the soil50
with a lower percentage of organic matter. LC values ranged from 72 to 223 ppm.50
The LC value of 115 (van Gestel et al., 1991b) was the lowest toxic concentration of the four50
reported. A safety factor of 5 was applied to this LC to obtain the benchmark of 20 ppm50
pentachlorobenzene. Confidence in this benchmark is low.
Nitrobenzene. Neuhauser et al. (1986) used the OECD artificial soil (pH 6) to assess the effectsof this compound on survival of adults of four earthworms species, as described previously. The LC s50
after 14 days showed little difference in sensitivity among the worms; sensitivity decreased in the orderE. eugeniae>E. fetida>P. excavatus>A. tuberculata.
The LC value of 226 (Neuhauser et al., 1986) was the lowest toxic concentration of the four50
reported. A safety factor of 5 was applied to this LC to obtain the benchmark of 40 ppm nitrobenzene.50
Confidence in this benchmark is low.
4-1
4. MICROBIAL HETEROTROPHS AND PROCESSES
4.1 INTRODUCTION
Soil microorganisms play a critical role in nutrient cycling. As primary consumers of soil organicmatter, soil microbes convert nutrients to plant-available forms and serve as a food source for highertrophic levels. The soil microbiota is a heterogeneous collection of highly adaptable organisms exploitingthe many micro-niches in the soil. The effect of contaminants may be to change the microbial communitystructure without overall changes in the functional ability of the community. The authors' assessmentendpoint, however, is microflora community functioning. This is measured as effects on Cmineralization, N transformation, and enzyme activities.
Little information is available on the mechanisms of toxicity of contaminants to soilmicroorganisms. Some metal ions may inhibit enzyme reactions by complexing with enzyme substrates,combining with the protein active group of the enzyme, or reacting with the enzyme-substrate complex(Juma and Tabatabai, 1977).
As with the others benchmarks, much of the variance is due to the variance in soil characteristicsthat influence toxicity. These characteristics control bioavailability to all soil-dwelling organisms, withpH and organic matter content being among those that are very important.
4.2 MICROBE DATA SELECTION
Toxic response data were collected for inorganic elements and organic compounds. Measures ofeffects of soil-borne chemicals on microorganisms include growth, respiration, nitrogen transformationreactions (denitrification, mineralization, and nitrification), C mineralization, P mineralization,cellulolytic activity, oxidation of hydrogen gas, alpha-glucosidase synthesis, and other enzyme activities.
Many enzymes that are produced by plants and microbes can exist and function extracellularly inthe soil for varying periods of time, depending on soil micro-environmental factors (Tabatabai, 1982).For this reason, it may not be appropriate to interpret measured effects of chemicals on soil enzymeactivities as representing effects on soil microbial populations. Soil enzymes do, however, give valuableinformation about the functioning of the soil in organic matter degradation. These enzymes includeurease which catalyzes the hydrolysis of urea to CO and NH ; phosphatases which catalyze the2 3
hydrolysis of phospho esters and anhydrides; arylsulfatase which catalyzes the hydrolysis of thearylsulfate ion; amidase, which catalyzes the hydrolysis of acid amides with the release of NH ;3
amylases, enzymes which catalyze the hydrolysis of starch and glycogen; and dehydrogenases, a groupof enzymes which catalyze the dehydrogenation of many organic compounds. Dehydrogenase activityis considered by some to provide an overall estimate of microbial activity. None of these activities isaccepted as adequate for characterizing the response of the soil microbial community to toxic stressbecause of the many soil and microbial factors affecting them at the micro-environment level. However,it is often the case that benchmarks are based on the effects of a chemical on a single activity (e.g.,reduction of phosphatase activity) because of lack of other data.
Most of the research used to establish benchmarks was conducted in the laboratory with native soilmicroflora in small samples of soil or soil/litter microcosms. Exposure durations ranged from one andone-half hours to one and one-half years. The chemicals tested were mixed into the soil in the form of
4-2
salts. Bacteria, actinomycetes, and fungi are included and evaluated together. Tests conducted in culturemedia are not included because they are not directly relevant to the soil environment.
4.3 MICROBE DATA AND BENCHMARK DERIVATION
A short review of the available literature is discussed in the following text. Data are summarizedin Appendix B, and benchmarks are given in Table 2.
4.3.1 Inorganic Chemicals
Aluminum. The effects of soil characteristics on effects of Al (as AlCl ) on arylsulfatase activity3
was evaluated by Al-Khafaji and Tabatabai (1979). Soils were chosen with a range in pH, organicmatter, and clay contents (6.2 to 7.6; 5.4 to 10.6%; 26 to 34%). Air-dried, sieved soil samples wereplaced in flasks with the test chemical added in solution. The samples were incubated for 90 minutesbefore microbial activity was stopped and arylsulfatase activity measured. In all soils, a concentrationof 675 ppm Al reduced the enzyme activity between 24 and 43%. The least inhibition occurred in thesoil with the highest contents of organic matter and clay.
Juma and Tabatabai (1977) used essentially the same system and three of the same soils to evaluatethe effects of several metals on soil acid and alkaline phosphatase activities. Three soils were used to testeffects and acid phosphatase activity with pH, organic matter, and clay ranging from 5.8 to 7.8, 5.2 to11%, and 23 to 30%. Alkaline phosphatase activity was not tested in the most acid soil. For Al in a loamsoil (pH 5.8; percent organic matter 5.2) acid phosphatase activity was reduced, and alkalinephosphatase activity was reduced in another loam soil (pH 7.4, percent organic matter 11) by aconcentration of 675 ppm Al. Aluminum had no effect on the activity of either enzyme in an alkaline soil(pH 7.8, percent organic matter 7.4).
The benchmark of 600 ppm of Al was derived from the previously described studies. Confidencein the benchmark is low because of the limited amount and type of data available.
Arsenic. Juma and Tabatabai (1977) used the system described for Al to evaluate the effects of twoforms of As on soil acid and alkaline phosphatase activities. Arsenic (III) had no effect on acidphosphatase activity in any of the three soils. At a concentration of 1875 ppm As (lowest concentrationtested), acid phosphatase activity was reduced in a loam soil (pH 7.8; percent organic matter 7.4).Arsenic (V) was more toxic than As(III) to both enzyme complexes. Alkaline and acid phosphataseactivities were reduced by as little as 187.5 ppm As(V) (lowest concentration tested) in soils of pH 5.8to 7.4 and percent organic matter 5.2 to 11.
Frankenberger and Tabatabai (1981) investigated the effect of As(III) on amidase activity in threesoils in shaker flask assays as described previously. After 2 1/2 hrs, amidase activity was reduced in allthree soils. Activity was almost totally inhibited in the soil with the soils tested with a lowestconcentration of 1873 ppm.
The effective concentration of 187 ppm (Frankenberger and Tabatabai, 1981) is the lowest of theeight reported. Confidence in the benchmark of 100 ppm is low because of the limited amount and typeof data available.
Barium. The influence of soil characteristics on effects of Ba on arylsulfatase activity wasevaluated by Al-Khafaji and Tabatabai (1979) using methods described for Al. A reduction in activity
4-3
was measured in only one of the four soils, having the lowest pH and organic matter content. A 22%reduction in activity was caused by 3433 ppm Ba (only concentration tested).
The benchmark of 3000 ppm is based on this study. Confidence in the benchmark is low becauseof the limited amount of data available.
Boron. The influence of soil characteristics on effects of B on arylsulfatase activity was evaluatedby Al-Khafaji and Tabatabai (1979) using methods described for Al. Approximately the same degreeof reduction in activity was measured in all soils at 270 ppm, and at 27 ppm in a loam (pH 6.5, percentorganic matter 5.8) There was no clear relationship between magnitude of reduction in activity and soilpH and organic matter.
Juma and Tabatabai (1977) used the system described for Al to evaluate the effects of B on soilacid and alkaline phosphatase activities. Acid phosphatase activity was not affected in the soil with thehighest pH. It was reduced in the other two soils at a concentration of 270 ppm. Alkaline phosphataseactivity was not affected by B in the soils tested.
The effective concentration of 27 ppm (Al-Khafaji and Tabatabai, 1979) is the lowest of the sixreported. Confidence in the benchmark of 20 ppm is low because of the limited amount and type of dataavailable.
Cadmium. The influence of soil characteristics on effects of Cd on arylsulfatase activity wasevaluated by Al-Khafaji and Tabatabai (1979) using methods described for Al. A reduction in activitywas measured in all four soils (23 to 55%) at 2810 ppm Cd, with the greatest reduction in the soil withthe lowest clay content.
Juma and Tabatabai (1977) used the system described for Al to evaluate the effects of Cd on soilacid and alkaline phosphatase activities. Acid phosphatase activity was reduced in all three of the soils(44 to 51%) at 2810 ppm. Alkaline phosphatase activity was reduced 27% in the loam soil at aconcentration of 281 ppm and 78% at 2810 ppm in a clay loam soil in which this was the onlyconcentration tested.
Haanstra and Doelman (1991) investigated short- and long-term effects of metals on arylsulfataseactivity, urease activity (Doelman and Haanstra, 1986), and total phosphatase activity (Doelman andHaanstra, 1989) by native soil microflora in five soils (sand, sandy loam, silt loam, clay, and sandy peat)of varying characteristics. Soil pH ranged from 7.7 to 4, organic matter content from 1.6 to 12.8%, andclay from 2 to 60%. Metals were added as salts to the sieved soils in flasks, and enzyme activity wasmeasured after a 6-week or 18-month study. Results were reported as EC . In the 6-week incubation50
study on the effects of Cd, data from the sandy loam soil were not available. Data for the effects onphosphatase activity were also not available for sandy peat. For all three enzyme systems, the highestEC s were found in the soil with the highest clay content (9520, 9779, and 4460 ppm for arylsulfatase,50
phosphatase, and urease activities, respectively). The lowest EC s were 1888 ppm for arylsulfatase, and50
840 and 340 ppm in the sand for phosphatase and urease activities. In the 18-month study, data fromthe sandy peat soil were not available for arylsulfatase and phosphatase. The highest EC s were 23050
ppm in the soil with the highest pH for phosphatase, 30 ppm Cd in the sandy loam soil for urease, and121 ppm in the sand (lowest pH, organic matter, and clay) for arylsulfatase.
The effects of several elements on dehydrogenase activity of the native soil microflora in acomposite soil sample from the Rocky Mountain Arsenal was assessed by Rogers and Li (1985). Soilwas amended with glucose and alfalfa, with the metal salts added in solution. After 6 days, a
4-4
concentration of 30 ppm Cd (lowest concentration tested), added as cadmium nitrate, reduceddehydrogenase activity by 47%.
Lighthart and Bond (1976) investigated the effects of Cd (as CdCl ) added to a small (600 ml) soil2
and litter microcosm. Soil was homogenized and sieved and the overlying plant litter layer was sieved.The Cd (0.006 or 6.1 ppm Cd) was introduced into the microcosm by injecting an aqueous solution intothe soil and litter with a syringe. After 24 days, the native soil and litter microflora exhibited a 43%reduction in respiration (O uptake) in microcosms inoculated with 6.1 ppm Cd.2
Threshold levels of Cd (as cadmium acetate) for soil respiration of native microflora in three soilswere determined by Reber (1989). The soils ranged in pH from 5.6 to 7, percent organic matter 1.7 to2.6, and percent clay 3.2 to 21.3. There was no clear relationship between these soil characteristics andthe magnitude of reduction in soil respiration at the concentrations tested. The highest LOECconcentration (56.3 ppm) for Cd was associated with the soil containing the lowest percentage of organicmatter and the lowest pH.
Liang and Tabatabai (1977) investigated the effects of various metals on N mineralization by nativesoil microflora in four soils varying in pH from 6 to 7.8, clay from 23 to 34%, and organic matter contentfrom 6 to 11%. Only one concentration of each metal was tested and was added to the soil as a saltsolution. Cadmium reduced N mineralization in two soils at 562 ppm but no relationship between soilcharacteristics and effects of Cd could be discerned.
Bollag and Barabasz (1979) evaluated the effects of several metals on denitrification in autoclavedsoil by three species of soil-dwelling Pseudomonas species of bacteria andon denitrification in soil bynative soil microflora. The silt loam soil was autoclaved to kill the majority of its microflora, inoculatedwith individual metals and bacterial populations, and incubated 4 days under anaerobic conditions. Thesame soil was used to determine the effects of metals on denitrification by the native soil microflora after21-day incubation under anaerobic conditions. In the autoclaved soil, two of the three Pseudomonasspecies had reductions in activity at 50 ppm Cd, while the third was more sensitive to the toxic effectsof this metal (and Cu and Zn) on denitrification. The native soil population in unautoclaved soil wasmore tolerant of the Cd, with reductions in activity at 100 ppm Cd. It is not clear whether this differenceis due to changes in the chemical and physical nature of the soil during autoclaving or to other organismsin the natural soil being more tolerant to Cd.
Khan and Frankland (1984) used a dyed cellophane film technique to evaluate the effects of Cd oncellulolytic activity of native soil microflora in a Brown earth soil (pH 4.6). The film was encased innylon mesh, buried in the potted soils containing Cd added as CdCl , and allowed to equilibrate for 152
days. After a further 30 days past the equilibrium period, the film was retrieved and analyzed for dyerelease. A 35% reduction in percent cellulose decomposition was measured in pots containing 100 ppmCd, while 50 ppm had no effect.
Lighthart et al. (1977) evaluated the effects of a number of metals at single concentrations onrespiration of native soil microflora in small coniferous forest soil/litter microcosms. Metals in solutionform were mixed into the soil and litter which were then layered in the microcosm. Cadmium at 920 ppmreduced respiration 61%.
In a study on the effects of Cd on N mineralization and nitrification by native soil microflora in amoderately acid soil, Bewley and Stotzky (1983) found N mineralization to be unaffected by Cd levelsup to 1000 ppm, the highest concentration tested. Nitrification was reduced 62% by 1000 ppm.
4-5
The effects of Cd as CdCl on carbon and nitrogen mineralization and nitrogen transformations in2
alfalfa-amended sieved soil were determined by Suter and Sharples (1984). The silt loam soil had a pHof 4.7. At 3 days, respiration was reduced by 20% at 500 ppm, but at later dates no significant reductionoccurred. Ammonia levels were increased (by as much as a factor of 12) on days 22 to 53 at 50 ppm Cdand higher. Nitrate levels were reduced by >21% on days 25, 32, and 39 at 50 ppm Cd and higher, buton days 46 and 53 significant effects occurred at only 100 ppm and higher. These results suggest thatnitrification is highly sensitive to Cd relative to C mineralization and may be chronically reduced at 50ppm.
A benchmark of 20 ppm Cd was established as the 10th percentile of the 47 reported effectivevalues. Confidence in this benchmark is high because of the relatively large amount of data available fora variety of functional measures.
Chromium. Liang and Tabatabai (1977) investigated the effects of various metals on Nmineralization by native soil microflora in four soils, as described for Cd. Chromium(III) at 260 ppmreduced N mineralization in the soil containing the highest organic matter content. This same soil showedan effect of added Cu.
The effects of Cr(III) on dehydrogenase activity of the native soil microflora in soil from the RockyMountain Arsenal was assessed by Rogers and Li (1985) as described previously for Cd. After 6 days,a concentration of 30 ppm Cr (the lowest concentration tested) reduced dehydrogenase activity by 54%.
Juma and Tabatabai (1977) used the system described for Al to evaluate the effect of Cr on soil acidand alkaline phosphatase activities. Acid and alkaline phosphatase activities were affected at 1635 ppmin all three soils to about the same degree, but greater inhibition of alkaline phosphatase activity occurredin the soil with the greatest content of organic matter and clay.
Ross et al. (1981) evaluated the relative toxicities of forms of Cr to respiration of native soilmicroflora in a loam and a sandy loam soil. After 22 days, Cr (III), tested at only 100 ppm, causedreductions in both soils of 41 and 48%. A concentration of 10 ppm (the lowest concentration tested) Cr(VI) caused reductions in both soils (27 and 33%). In this experiment, Cr(VI) was more toxic thanCr(III) to soil respiration.
Premi and Cornfield (1969, 1969/1970) investigated the effects of Cr added to a sandy loam soilon nitrogen transformations by native soil microflora. In a 21-day experiment (1969), nitrification wasseverely inhibited at 1000 ppm Cr (added as sulfate salt), but was unaffected at 100 ppm. In an 8-weekexperiment (1969/1970) with sucrose and ammonium nitrate added to the soil, nitrification was notaffected by 10,000 ppm Cr, the highest concentration tested. Possible reasons for the differences inresults for the two sets of experiments are differences in exposure duration and effects of amendments.
Bhuiya and Cornfield (1976) investigated the effects of several metals on N mineralization andnitrification by native soil microflora in a sandy soil at different pH levels. Metals were added to the soilas oxides to achieve a concentration of 1000 ppm, and the pH was adjusted to 7 (or left at the naturalpH 6) before a 2-month equilibration period. After an additional 6 or 12 weeks past the equilibriumperiod, N transformation measures were made. After 6 weeks, both mineralization and nitrification werereduced by 1000 ppm Cr at pH 7, but not at pH 6. After 12 weeks, neither mineralization nornitrification was affected by Cr at either pH.
4-6
The effects of soil characteristics on toxicity of Cr to arylsulfatase activity was evaluated by Al-Khafaji and Tabatabai (1979) using methods described for Al. Activity was reduced in all soils at 1300ppm Cr. Magnitude of reduction was inversely related to soil organic C content.
Haanstra and Doelman (1991) investigated short- and long-term effects of Cr on arylsulfataseactivity, urease activity (Doelman and Haanstra, 1986), and total phosphatase activity (Doelman andHaanstra, 1989) by native soil microflora in five soils, as described for Cd. In the 6-week incubationstudy on the effects of Cr, data from the silt loam soil were not available for arylsulfatase activity andnot available from the sandy loam soil for urease. The highest EC s were 3203, 5512, and 4470 ppm,50
respectively, for arylsulfatase, phosphatase, and urease activities found in different soils. The lowest was17 ppm in the sand for arylsulfatase and 1170 and 490 ppm in the clay for phosphatase and urease. Inan 18-month study, the highest EC s were 1798, 20020, and 1110 ppm Cr, respectively, for50
arylsulfatase, phosphatase, and urease activities found in different soils. The lowest were 12 and <1 ppmin the clay for arylsulfatase and urease activities and 2692 ppm in the sandy loam for phosphataseactivity.
The benchmark for Cr was established at 10 ppm because the 10th percentile lies between the EC50
values of 12 and 15 ppm from the work of Haanstra and Doelman (1991). Confidence in this benchmarkis high because of the relatively large amount of data available for a variety of functional measures.
Cobalt. Lighthart et al. (1977) evaluated the effects of Co at a single concentration on respirationof native soil microflora in soil/litter microcosms, as described for Cd. Co at 1362 ppm reducedrespiration 23%.
The benchmark of 1000 ppm comes from this study. Confidence in the benchmark is low becauseof the limited amount of data available.
Copper. Liang and Tabatabai (1977) investigated the effects of various metals on N mineralizationby native soil microflora in four soils, as described for Cd. Copper at 320 ppm severely reduced Nmineralization in one soil. This same soil showed an effect of added Cr(III).
The effects of Cu on dehydrogenase activity of the native soil microflora in soil from the RockyMountain Arsenal was assessed by Rogers and Li (1985) using methods described for Cd. Aconcentration of 30 ppm Cu (the lowest concentration tested) Cu reduced dehydrogenase activity by28%.
Bollag and Barabasz (1979) evaluated the effects of Cu on denitrification by three species of soil-dwelling Pseudomonas species of bacteria in autoclaved soil and by native soil microflora, as describedfor Cd. In the autoclaved soil, there was a range of sensitivities of the Pseudomonas species to Cu.LOECs ranged from 10 (lowest concentration tested) to 250 ppm (highest concentration tested). Theorganism most sensitive to the effects of Cd and Zn was also more sensitive to the toxic effects of Cuon denitrification. Denitrification by the native soil population was reduced 44% by 250 ppm Cu.
The effects of adding Cu, as CuSO , to a sandy loam adjusted to three pH levels on N4
mineralization during a 21-day incubation was assessed by Quraishi and Cornfield (1973).Mineralization was decreased by 1000 ppm Cu at all three pH levels (5.1, 5.9, and 7.3) with inhibitoryeffect increasing with decreasing pH from 39% to 100%.
Premi and Cornfield (1969, 1969/1970) investigated the effects of several metals added to a sandyloam soil on nitrogen transformations by native soil microflora. In a 21-day experiment (1969),

4-7
nitrification was severely inhibited at 10,000 ppm Cu, added as CuSO , but unaffected at 1000 ppm.4
Copper added in carbonate form was ineffective at 10,000 ppm (highest concentration tested), probablybecause of the increase in soil pH caused by addition of this form. In an 8-week experiment (1969/1970)with sucrose and ammonium nitrate added to the soil, nitrification was decreased at 1000 ppm Cu butunaffected at 100 ppm. Possible reasons for the differences in results between the two experiments aredifferences in exposure duration and effects of amendments.
Bhuiya and Cornfield (1972) assessed the effects of several metals on C mineralization by nativemicroflora in a sandy soil, with or without added organic matter. Metals were added to the soil as oxidesto achieve a concentration of 1000 ppm and a small amount of ground oat straw was added to part ofthe soil before a 2-month equilibration period. After a further 12 weeks, soil respiration was reduced inthe Cu-treated soil with amendment but not in the unamended soil.
The influence of soil characteristics on effects of Cu on arylsulfatase activity was evaluated by Al-Khafaji and Tabatabai (1979) using methods described previously for Al. In the soil with the highest pH(7.6), Cu had no effect. Arylsulfatase activity in the other three soils was reduced by Cu at aconcentration of 1590 ppm. Reductions were the least severe in the soil having the highest organiccarbon and clay content.
Juma and Tabatabai (1977) used the system described for Al to evaluate the effects of two formsof Cu on soil acid and alkaline phosphatase activities. Acid phosphatase activity was affected by Cu(I)and Cu(II) in all three soils about equally at a concentration of 1590 Cu (lowest concentration tested).The greatest reduction occurred in the soil with the lowest pH and the lowest contents of organic matterand clay. Alkaline phosphatase activity was more sensitive to Cu(I) than Cu(II).
Haanstra and Doelman (1991) investigated short- and long-term effects of Cu on arylsulfataseactivity, urease activity (Doelman and Haanstra, 1986), and total phosphatase activity (Doelman andHaanstra, 1989) for native soil microflora in five soils, as described for Cd. In the 6-week study, datawere not available for phosphatase activity in the sandy loam or for urease activity in the silt loam. Thehighest EC s for arylsulfatase and phosphatase activities (14,946 and 6424 ppm) was found in the soil50
with the highest pH (silt loam). The highest EC for urease activity (4200 ppm) was found in the soil50
with the greatest content of organic matter and the lowest pH (sandy peat). The lowest EC s, all found50
in the sand, were 390, 140, and 260 ppm for arylsulfatase, phosphatase, and urease. In the 18-monthincubation study, the highest EC s were 6996 and 4200 ppm Cu in the soil with the greatest percentage50
organic matter for arylsulfatase and urease activities and 2773 ppm for phosphatase in the clay soil.Lowest EC s were 203, 170, and 680 ppm in the sand for arylsulfatase, phosphatase, and urease50
activities, respectively.
The effects of Cu (as CuCl ) on carbon and nitrogen mineralization and nitrogen transformations2
in alfalfa-amended sieved soil were determined by Suter and Sharples (1984). The silt loam soil had apH of 4.7. At 10 days, respiration was reduced by 24% at 100 ppm, but significant reductions occurredat 500 ppm on days 3 and 14 and at 1000 ppm on all dates. Ammonia concentration was decreasedsignificantly by 58% on days 4 and 11 at 10 ppm, but there was no increase of effects with concentrationon those dates, and ammonia concentrations were unchanged or increased at those concentrations on laterdates. Ammonia concentrations were significantly increased at 500 and 1000 ppm from day 18 to 53,and after day 18 there were regular patterns of increasing ammonia at increasing Cu levels. Nitrate levelswere reduced by 21% on day 4 at a concentration of 10 ppm, but not on later dates. On day 11, nitrateconcentrations were significantly reduced to 50–1000 ppm (but increased at 10 ppm), and on days 18to 53, they were significantly reduced only at 500 and 1000 ppm Cu. These results suggest that
4-8
nitrification is highly sensitive to Cu, relative to C and N mineralization. If the chronic response is usedas the basis for the benchmark, the threshold for significant effects in this test is 500 ppm Cu.
The benchmark for Cu has been established at 100 ppm. Confidence in this benchmark is high.
Fluoride. The effects of fluoride, added as potassium fluoride to poplar litter, on nitrogen andphosphorus mineralization by native microflora was investigated by van Wensem and Adema (1991).The newly fallen (2 months old) litter was air-dried, cut into small pieces, and rewetted with KF solutionsof varying concentrations. After 9 weeks, K mineralization was reduced 22% in litter treated with 32.3ppm F, the lowest concentration tested. Nitrogen mineralization was reduced 26% by 100.7 ppm, while32.3 ppm had no effect.
The effects of F on dehydrogenase activity of the native soil microflora in soil from the RockyMountain Arsenal was assessed by Rogers and Li (1985) as described previously for Cd. Aconcentration of 5000 ppm F reduced dehydrogenase activity by 30% (3000 ppm had no effect).
The toxic concentration of 32 ppm (van Wensem and Adema, 1991) is the lowest of the tworeported. Confidence in the benchmark of 30 ppm is low because of the limited amount and type of dataavailable.
Iron. Liang and Tabatabai (1977) investigated the effects of Fe on N mineralization by native soilmicroflora in four soils, as described for Cd. Iron(III) reduced N mineralization in one soil at 280 ppm.This same soil showed an effect of added Cd.
The influence of soil characteristics on effects of Fe(III) on arylsulfatase activity was evaluated byAl-Khafaji and Tabatabai (1979) as described previously for Al. In the soil with the highest pH (7.6),Fe(III) had no effect. Activity was reduced in all other soils at 1398 ppm Fe. The magnitude of reductiongenerally was inversely related to soil pH.
Juma and Tabatabai (1977) used the system described for Al to evaluate the effects of Fe(II) andFe(III) on soil acid and alkaline phosphatase activities. Iron(II) reduced acid phosphatase activity at 1398ppm in only the soil with the lowest pH and organic matter and clay contents. Iron(III) reduced activityto a greater degree in this soil and also in the soil with the second lowest pH (but highest organic matterand clay contents). Iron(II) inhibited alkaline phosphatase activity in one of the soils tested and Fe(III)in the soil in which both forms of Fe inhibited acid phosphatase activity.
The effective concentration of 280 ppm (Liang and Tabatabai, 1977) is the lowest of the ninereported. Confidence in the benchmark of 200 ppm is low because of the limited amount and type of dataavailable.
Lanthanum. Lighthart et al. (1977) evaluated the effects of La (as LaCl ) at a single concentration2
on respiration of native soil microflora in soil/litter microcosms, as described for Cd. After 23 days,lanthanum at 57 ppm reduced respiration by 22%.
The benchmark of 50 ppm (Al-Khafaji and Tabatabai, 1979) is based on this work. Confidence inthe benchmark is low because of the limited amount of data available.
Lead. Khan and Frankland (1984) used a dyed cellophane film technique to evaluate the effects ofPb on cellulolytic activity of native soil microflora in a Brown earth soil (pH 4.6), as described
4-9
previously for Cd. A 23% reduction in percent cellulose decomposition was measured in pots containing1000 ppm Pb, while 500 ppm had no effect.
The mediating influence of clay on effects of lead on soil respiration was assessed by Debosz et al.(1985). The sandy loam soil (9% clay) was amended with glucose and Pb acetate in solution. After 15days, respiration was reduced 29% by 10,000 ppm Pb (1000 ppm had no effect). In the same soilamended with either 9% by weight kaolinite or montmorillonite, Pb up to 10,000 ppm had no effect.
Cole (1977) assessed the effects of various carbohydrate additions and Pb compounds on amylasesynthesis and activity by native soil microflora in a silt loam soil. Carbohydrates were added to the soilin solution and Pb in dry salt form. With the addition of glucose and lead acetate, amylase activity wasmore sensitive than synthesis, with a 74% reduction at the lowest concentration tested (2000 ppm). Withthe addition of starch, amylase activity was reduced less by PbCl than with lead acetate and lead sulfate.2
With the addition of lead acetate, amylase activity was more sensitive with the addition of starch thanwith glucose. Cole also investigated the effect of Pb acetate on alpha-glucosidase synthesis and bacterialpopulation size. Both were reduced by the addition of 2000 ppm Pb (lowest concentration tested).
Liang and Tabatabai (1977) investigated the effects of Pb on N mineralization by native soilmicroflora in four soils, as described for Cd. Lead reduced N mineralization in one soil at 1035 ppm.This same soil showed an effect of added Cd.
Bhuiya and Cornfield (1972) assessed the toxic effects of Pb on C mineralization by nativemicroflora in a sandy soil, with or without added organic matter, as described for Cu. After 12 weeks,soil respiration was reduced in the Pb-treated soil without oat straw, but not in the straw-amended soil.
Juma and Tabatabai (1977) used the system described for Al to evaluate the effects of two formsof Pb (acetate and nitrate) to soil acid and alkaline phosphatase activities. The two forms had equal effecton acid phosphatase activity at 5175 ppm and that only in the soil with the lowest pH and organic matterand clay contents. They had equal effects on alkaline phosphatase activity at this concentration in oneof the soils tested, and only Pb acetate was inhibitory in the soil with the highest organic matter and claycontents.
Haanstra and Doelman (1991) investigated short- and long-term effects of Pb on arylsulfataseactivity, urease activity (Doelman and Haanstra, 1986), and total phosphatase activity (Doelman andHaanstra, 1989) by native soil microflora in five soils, as described for Cd. In the 6-week study on theeffects of Pb, data from the sandy loam, clay, and sandy peat soils were not available for arylsulfatase,the sand, sandy loam and peat for phosphatase, and the sand for urease. The highest EC s for50
arylsulfatase and phosphatase activities (9138 and 1168 ppm) were found in the clay soil. The highestEC for urease activity (7190 ppm) was found in the silt loam (highest pH). The lowest were 8288,50
8184, and 50 60 ppm Pb for arylsulfatase, phosphatase, and urease activities. In the 18-month study,data from the sandy peat soil were not available for arylsulfatase and phosphatase and from the clay andsandy loam for phosphatase. The highest EC s were 12,411 ppm in the soil with the highest clay for50
arylsulfatase, 78,943 ppm for phosphatase in the sand, and 8130 in the silt loam for urease. The lowestEC s were 3004, 7604, and 1340 ppm, in different soils.50
Doelman and Haanstra (1979) evaluated the effects of Pb on soil respiration and dehydrogenaseactivity in several soils. After 24 hours, respiration in a sand (pH 5.7, percent organic matter 3) wasreduced by 750 ppm Pb, the lowest concentration tested. Dehydrogenase activity was not affected at thisconcentration. After 40 months, respiration in this soil was reduced to approximately the same degreeat 1500 ppm, the lowest concentration tested. Dehydrogenase activity was not evaluated. In another
4-10
sandy soil, (pH 5.4, percent organic matter 6.7), dehydrogenase activity was severely inhibited by 1500ppm, but not at 750 ppm Pb after 24 hours. Respiration was not affected at this concentration. In a claysoil, dehydrogenase activity was inhibited by 375 ppm, the lowest concentration tested. Respiration wasnot evaluated.
The benchmark of 900 ppm Pb is the 10th percentile of the 36 reported effective values. Confidencein this benchmark is high because of the relatively large amount of data available for a variety offunctional measures.
Lithium. Lighthart et al. (1977) evaluated the effects of Li at a single concentration on respirationof native soil microflora in soil/litter microcosms, as described for Cd. Lithium at 17 ppm reducedrespiration 43%.
The effective concentration of 10 ppm was derived from this study. Confidence in the benchmarkis low because of the limited amount of data available.
Manganese. Liang and Tabatabai (1977) investigated the effects of Mn on N mineralization bynative soil microflora in four soils, as described for Cd. Manganese at 275 ppm reduced N mineralizationin one soil. This same soil showed an effect of added Cd.
Premi and Cornfield (1969) investigated the effects of Mn added to a sandy loam soil on nitrogentransformations by native soil microflora. In a 21-day experiment, nitrification was severely inhibitedat 100 ppm, added as sulfate salt, the lowest concentration tested.
Juma and Tabatabai (1977) used the system described for Al to evaluate the effect of Mn on soilacid and alkaline phosphatase activities. Acid phosphatase activity was affected at 1375 ppm only in thesoil with the lowest pH and organic matter and clay contents. Alkaline phosphatase activity was reducedin one of the soils tested by this same concentration.
The effective concentration of 100 ppm (Premi and Cornfield, 1969) the lowest of the four reported.Confidence in the benchmark of 100 ppm is low because of the limited amount and type of dataavailable.
Mercury. van Fanssen (1973) investigated the effects of an inorganic and an organic mercurycompound on N mineralization and nitrification by native soil microflora in two alkaline soils: a dunesand with 2% organic matter and a mix of two clay soils with 6% organic matter. Little information wasprovided concerning the experimental design. In the clay soil, both HgCl and phenylmercury acetate2
reduced nitrification at 100 ppm Hg (10 ppm had no effect), but the organic form was more inhibitorythan the inorganic form. Mineralization was not affected by the inorganic form but was decreased byphenylmercury acetate. In the dune sand, HgCl severely reduced nitrification at 100 ppm (10 ppm had2
no effect) and phenylmercury acetate reduced nitrification at 10 ppm Hg (lowest concentration tested).Mineralization was not affected by the organic form but was decreased by HgCl at 100 ppm Hg. This2
work indicates that the relative toxicity of various forms of Hg can be influenced by soil characteristics.
Landa and Fang (1978) investigated the effects of mercuric chloride (up to 100 ppm Hg) on carbonmineralization by native soil microflora in five agricultural topsoils varying in pH and organic mattercontent. The magnitude of effects varied greatly among the soils and were not related to those two soilcharacteristics. Effects ranged from an 87% reduction at 0.1 ppm (the lowest concentration tested) in oneof the soils to no effect at 100 ppm in another soil.
4-11
Bremner and Douglas (1971) evaluated the effects of several metals on urease activity in two soilswith similar pH, organic matter, and clay content characteristics. Metals were added individually insolution at a concentration of 50 ppm, and urease activity was determined after 5 hours. Mercury, addedeither as the chloride or sulfate salt, decreased urease activity by 36 to 42% in both soils.
Liang and Tabatabai (1977) investigated the effects of Hg on N mineralization by native soilmicroflora in four soils, as described for Cd. Mercury reduced N mineralization in all soils at 1003 ppm.The greatest magnitude of the toxic effect was seen in the soil having the lowest pH and organic matterand clay contents.
The influence of soil characteristics on effects of Hg on arylsulfatase activity was evaluated by Al-Khafaji and Tabatabai (1979) as described previously for Al. In two soils tested with a lowestconcentration of 502 ppm, arylsulfatase activity was greatly reduced. In the two soils tested with a lowestconcentration of 5015 ppm, arylsulfatase activity was inhibited almost totally. No clear differencesbetween the soils with regard to effects on toxicity of Hg could be discerned.
Frankenberger and Tabatabai (1981) investigated the effect of Hg on amidase activity in three soilsin shaker flask assays as described previously. After 2 1/2 hours, amidase activity was reduced in allthree soils at 5015 ppm. The greatest reduction occurred in the soil with the lowest pH and organicmatter and clay contents.
Juma and Tabatabai (1977) used the system described for Al to evaluate the effect of Hg on soilacid and alkaline phosphatase activities. Acid and alkaline phosphatase activities were affected at 5015ppm in all three soils to about the same degree.
The benchmark of 30 ppm Hg is the 10th percentile of the 27 reported effective values. Confidencein this benchmark is high because of the relatively large amount of data available for a variety offunctional measures.
Molybdenum. Liang and Tabatabai (1977) investigated the effects of Mo on N mineralization bynative soil microflora in four soils, as described for Cd. Molybdenum reduced N mineralization in threeof the soils at 480 ppm. No toxic effect was seen in the soil having the lowest pH and organic matter andclay contents. No clear relationship between soil characteristics and magnitude of effects of Mo couldbe discerned.
The influence of soil characteristics on effects of Mo on arylsulfatase activity was evaluated by Al-Khafaji and Tabatabai (1979) as described previously for Al. In the soil with the highest clay and organicmatter contents, Mo had no effect. Activity was severely reduced at 2398 ppm (lowest concentrationtested) in the soil with the lowest pH and organic matter content. It is possible that activity in this soilwould have been inhibited to a somewhat lesser degree by 240 ppm Mo, as it was in the two remainingsoils.
Juma and Tabatabai (1977) used the system described for Al to evaluate the effect of Mo on soilacid and alkaline phosphatase activities. Acid phosphatase activity in all three soils was reduced at 2398ppm. In the soil with the lowest pH, and organic matter and clay contents, it was also inhibited at 240ppm Mo. Alkaline phosphatase activity in both soils tested was reduced about the same degree at thisconcentration.
The benchmark for Mo was established at 200 ppm based on the work of Al-Khafaji and Tabatabai(1979). Confidence in this benchmark is moderate.

4-12
Nickel. The effects of Ni, as nickel sulfate, on dehydrogenase activity of the native soil microflorain soil from the Rocky Mountain Arsenal was assessed by Rogers and Li (1985) as described previouslyfor Cd. After 6 days, a concentration of 30 ppm (lowest concentration tested) Ni reduced dehydrogenaseactivity by 39%.
Babich and Stotzky (1982) evaluated the effects of two forms of Ni on mycelial growth rate of anumber of soil-dwelling fungi inoculated individually into autoclaved sandy loam soil. Theconcentrations at which growth was reduced ranged from 50 to 750 ppm for Ni (added in chloride orsulfate form).
Giashuddin and Cornfield assessed the effect of Ni added in oxide (1979) and sulfate (1978) formson N and C mineralization by native soil microflora in a sandy soil. The metal salts were mixed into thesoil in dry form. After 42 days incubation, soil respiration (C mineralization) was reduced in soilcontaining 10 ppm Ni from Ni sulfate (lowest concentration tested), and N mineralization was affectedat 100 ppm. Soil respiration was reduced in soil containing 50 ppm Ni from Ni oxide (lowestconcentration tested), and N mineralization was affected at 1000 ppm. Because of the test concentrationsused, it is difficult to assess the relative toxicity of these two forms of Ni to C mineralization. When thesoil pH was raised to 6.9 (from its normal 5.9), soil respiration was reduced in soil containing 250 ppmNi from Ni oxide (lowest concentration tested), and N mineralization was affected at 1000 ppm. Theeffect of Ni from Ni sulfate was not tested at the higher pH. Raising the pH appeared to affect soilrespiration but not N mineralization.
Bhuiya and Cornfield (1974) assessed the effects of Ni on C mineralization by native microflorain a sandy soil, with or without added organic matter, as described for Cu. After 12 weeks, soilrespiration was reduced in the Ni-treated soil with or without oat straw, but to a greater degree in thestraw-amended soil.
The influence of soil characteristics on effects of Ni on arylsulfatase activity was evaluated by Al-Khafaji and Tabatabai (1979) as described previously for Al. In only one soil was the highestconcentration tested, 1468 ppm, found to reduce arylsulfatase activity. This soil had the lowest pH andorganic matter content of the four soils tested.
Juma and Tabatabai (1977) used the system described for Al to evaluate the effect of Ni on soil acidand alkaline phosphatase activities. Acid phosphatase activity was not affected at 1468 ppm only in thesoil with the highest pH. Alkaline phosphatase activity was reduced in one of the soils tested by thissame concentration.
Haanstra and Doelman (1991) investigated short- and long-term effects of Ni on arylsulfataseactivity, urease activity (Doelman and Haanstra, 1986), and total phosphatase activity (Doelman andHaanstra, 1989) by native soil microflora in five soils, as described for Cd. In the 6-week study on theeffects of Ni, data from the sandy peat soil were not available for arylsulfatase and phosphataseactivities. The highest EC s (5659, 6516, and 3380 ppm for arylsulfatase, phosphatase, and urease50
activities) were found in the soil with the highest clay content. The lowest were 2119, 1109, and 100ppm, for arylsulfatase, phosphatase, and urease activities found in the sand. In the 18-month study, datafrom the sandy loam soil were not available for arylsulfatase activity nor from clay and sandy peat forphosphatase activities. The highest EC s were 8101, 8042, and 2790 ppm Ni for arylsulfatase,50
phosphatase, and urease activities in different soils. The lowest LC s, 92, 769, and 370 ppm, were found50
in the sand.
4-13
A benchmark of 90 ppm Ni was established based on the 56 reported effective values. Confidencein this benchmark is high because of the relatively large amount of data available for a variety offunctional measures.
Selenium. Lighthart et al. (1977) evaluated the effects of using methods at a single concentrationon respiration of native soil microflora in soil/litter microcosms, as described for Cd. Selenium at 484ppm reduced respiration 43%.
The influence of soil characteristics on effects of Se on arylsulfatase activity was evaluated by Al-Khafaji and Tabatabai (1979) as described previously for Al. In the soil with the lowest clay content,activity was reduced by 198 ppm. In the other soils, arylsulfatase activity was reduced by 1975 ppm withthe greatest reduction in the soil with the lowest pH and organic matter content.
Frankenberger and Tabatabai (1981) investigated the effect of Se on amidase activity in three soilsin shaker-flask assays as described previously. After 2 1/2 hours, amidase activity was reduced in onlyone soil at 1975 ppm. This soil had the lowest pH and organic matter and clay contents of the soilstested.
Juma and Tabatabai (1977) used the system described for Al to evaluate the effect of Se(IV) to soilacid and alkaline phosphatase activities. Acid phosphatase activity in all three soils was reduced at 1975ppm. Alkaline phosphatase activity in both soils tested was reduced about the same degree at thisconcentration.
The effective concentration of 198 ppm (Al-Khafaji and Tabatabai, 1979) is the lowest of the 10reported. Confidence in the benchmark of 100 ppm is moderate.
Silver. Bremner and Douglas (1971) evaluated the effects of Ag on urease activity in two soils, asdescribed for Hg. After 5 hours, silver, added as either nitrate or sulfate salt, decreased urease activityby 60 to 65% in both soils.
Liang and Tabatabai (1977) investigated the effects of Ag on N mineralization by native soilmicroflora in four soils, as described for Cd. Silver at 540 ppm reduced N mineralization in all soils. Thegreatest magnitude of the inhibitory effect was seen in the soil having the lowest pH and organic matterand clay contents.
The influence of soil characteristics on effect of Ag on arylsulfatase activity was evaluated by Al-Khafaji and Tabatabai (1979) as described previously for Al. In two soils tested with a lowestconcentration of 270 ppm, arylsulfatase activity was greatly reduced. In the two soils tested with a lowestconcentration of 2698 ppm, arylsulfatase activity was almost totally inhibited.
Frankenberger and Tabatabai (1981) investigated the effect of Ag on amidase activity in three soilsin shaker-flask assays as described previously. After 2 1/2 hours, amidase activity was severely reducedin all three soils at 2698 ppm. The greatest reduction occurred in the soil with the lowest pH and organicmatter and clay contents.
Juma and Tabatabai (1977) used the system described for Al to evaluate the effect of silver on soilacid and alkaline phosphatase activities. Acid phosphatase activity was affected at 2698 ppm only in thesoil with the highest pH (7.8). Alkaline phosphatase activity was reduced 28% in the loam soil at an Agconcentration of 270 ppm and 93% at 2698 ppm in a clay loam soil.
4-14
A benchmark of 50 ppm Ag was established based on the 17 reported effective values. Confidencein this benchmark is moderate.
Tin. The influence of soil characteristics on effect of Sn on arylsulfatase activity was evaluated byAl-Khafaji and Tabatabai (1979) as described previously for Al. In the soil with the highest pH (7.6),Sn had no effect. Arylsulfatase activity in the other three soils was reduced by 2968 ppm Sn. Thereductions were the least severe in the soil having the highest organic C and clay content.
Juma and Tabatabai (1977) used the system described for Al to evaluate the effect of Sn on soilacid and alkaline phosphatase activities. Acid phosphatase activity was affected at 2968 ppm only in thesoil with the lowest pH and organic matter and clay contents. Alkaline phosphatase activity was reducedin both soils tested by this same concentration.
The effective concentration of 2968 ppm (Al-Khafaji and Tabatabai, 1979) is the lowest of theseven reported. Confidence in the benchmark of 2000 ppm is low because of the limited amount and typeof data available.
Titanium. The influence of soil characteristics on effect of Ti (as TiSO ) to arylsulfatase activity4
was evaluated by Al-Khafaji and Tabatabai (1979) as described previously for Al. In two soils testedwith a lowest concentration, arylsulfatase activity was reduced by 1198 ppm. These two soils had thelowest pH and organic matter and clay contents of the four tested.
The effective concentration of 1198 ppm (Al-Khafaji and Tabatabai, 1979) is the lowest of the tworeported. Confidence in the benchmark of 1000 ppm is low because of the limited amount and type ofdata available.
Tungsten. The influence of soil characteristics on effects of tungsten (W) (Na WO ) on2 4
arylsulfatase activity was evaluated by Al-Khafaji and Tabatabai (1979) as described previously for Al.In the soil with the highest clay and organic matter contents, W had no effect. Activity was reduced inall other soils at 4598 ppm, with the greatest reduction in the soil with the lowest clay content.
Juma and Tabatabai (1977) used the system described for Al to evaluate the effect of tungsten onsoil acid and alkaline phosphatase activities. Acid phosphatase activity in all three soils was reduced at4598 ppm. In the soil with the lowest pH and organic matter and clay content, it was also inhibited at460 ppm W. Alkaline phosphatase activity in both soils tested was reduced about the same amount atthis concentration.
The effective concentration of 460 ppm (Juma and Tabatabai, 1977) is the lowest of the sevenreported. Confidence in the benchmark of 400 ppm is low because of the limited amount and type of dataavailable.
Vanadium. Tyler (1976) evaluated the effect of V, added in a solution of sodium vanadate to freshneedles from a white pine stand, on acid phosphatase activity of the native microflora. After 3 hours ofexposure, activity was reduced 40% by 50 ppm V, while 30 ppm had no effect.
The influence of soil characteristics on effect of V on arylsulfatase activity was evaluated by Al-Khafaji and Tabatabai (1979) as described previously for Al. In two soils tested with a lowestconcentration of 127 ppm, arylsulfatase activity was reduced with the greatest reduction in the soil withthe lowest clay content. In the two soils tested with a lowest concentration of 1273 ppm, arylsulfataseactivity was severely inhibited.
4-15
Juma and Tabatabai (1977) used the system described for Al to evaluate the effect of V on soil acidand alkaline phosphatase activities. Acid phosphatase activity in all three soils was reduced about thesame degree at 1273 ppm. In the soil with the lowest pH and organic matter and clay contents, it was alsoinhibited at 127.3 ppm V. Alkaline phosphatase activity in both soils tested was reduced about the samedegree at 1273 ppm. In the soil with the highest organic matter and clay contents, it was also inhibitedat 127.3 ppm V.
Lighthart et al. (1977) evaluated the effects of V at a single concentration on respiration of nativesoil microflora in soil/litter microcosms, as described for Cd. Vanadium at 23 ppm reduced respiration21%.
The effective concentration of 23 ppm (Lighthart et al., 1977) is the lowest of the 10 reported.Confidence in the benchmark of 20 ppm is moderate.
Zinc. Wilson (1977) evaluated the effect of Zn, as zinc sulfate solution, on nitrification by nativesoil microflora in three soils. The soils ranged in pH from 5.1 to 6.2, percent organic matter from 1.1 to2.4, and percent clay from 2 to 28. After 49 days, nitrification was severely inhibited in all three soils(98 to 100%) by 1000 ppm Zn, while Zn at 100 ppm had no effect.
Haanstra and Doelman (1991) investigated short- and long-term effects of Zn on arylsulfataseactivity, urease activity (Doelman and Haanstra, 1986), and total phosphatase activity (Doelman andHaanstra, 1989) by native soil microflora in five soils, described for Cd. In the 6-week study on theeffects of Zn, data from the sandy peat soil were not available for any of the enzymes. The highest EC s50
were 5559, 3623, and 1780 ppm for arylsulfatase, phosphatase, and urease activities, all in the soil withthe greatest content of clay. The lowest EC s of 909, 220, and 420 ppm Zn were all found in the sand.50
In the 18-month study, data were not available from the sandy peat for phosphatase or the silt loam forurease. The highest EC s were 9679, 4872, and 290 ppm Zn in different soils. The lowest EC s were50 50
375, 170, and 70 ppm in different soils.
Juma and Tabatabai (1977) used the system described for Al to evaluate the toxicity of Zn to soilacid and alkaline phosphatase activities. Acid and alkaline phosphatase activities were affected at 1635ppm in all three soils to about the same degree, except increased inhibition of alkaline phosphataseactivity in the soil with the highest pH.
The influence of soil characteristics on effects of Zn on arylsulfatase activity was evaluated by Al-Khafaji and Tabatabai (1979) as described previously for Al. A reduction in activity was measured intwo soils tested at a concentration of 1635 ppm. No clear differences between the soils with regard toinfluence on effects of Zn could be discerned.
Bhuiya and Cornfield (1974) investigated the effects of Zn on N mineralization and nitrificationby native soil microflora in a sandy soil at different pH levels, as described for Cr. After 12 weeks, bothmineralization and nitrification were reduced by 1000 ppm Zn at pH 7, but not at pH 6. After 6 weeks,neither mineralization nor nitrification was affected by Zn at either pH.
Bhuiya and Cornfield (1974) investigated the effects of 1000 ppm Zn added as Zn oxide to a sandysoil at three pH levels on nitrogen mineralization by native soil microflora. After 42 days, Nmineralization was reduced in the pH 7.7 soil but not in soils at pH 6 and 7.

4-16
The effects of Zn on dehydrogenase activity of the native soil microflora in soil from the RockyMountain Arsenal was assessed by Rogers and Li (1985) as described previously for Cd. Aconcentration of 300 ppm Zn reduced dehydrogenase activity by 30%; Zn at 150 ppm had no effect.
Laskowski et al. (1994) looked at the effects of several metals at low to moderate levels on therespiration rate of acid-mixed forest litter. The fresh litter was treated with solutions of CdCl (up to 2502
ppm Cd), Pb(NO ) (up to 2500 ppm Pb), or ZnCl . Only zinc had an effect at the concentrations tested.3 2 2
A concentration of 1000 ppm Zn reduced respiration by 26%; Zn at 200 ppm had no effect.
The effect of Cd and Zn on respiration of soil microflora in field-collected black oak forest soil/littermicrocosms was evaluated by Chaney et al. (1978). The metals, in solutions of chloride salts, weresprinkled over the litter layer of the chamber. After 23 days, Cd at a concentration up to 6 ppm had noeffect. Respiration was decreased 21% by Zn at 479 ppm; Zn at 47 ppm had no effect.
Bollag and Barabasz (1979) evaluated the effects of Zn on denitrification by three soil-dwellingPseudomonas (bacteria) in autoclaved soil and by native soil microflora, as described for Cd. In theautoclaved soil, two of the three species had reductions in activity at 250 ppm Cd, while the organismmost sensitive to the effects of Cd and Cu was also more sensitive to the toxic effects of Zn ondenitrification. Denitrification by the native soil population was reduced 31% by 250 ppm Zn.
Lighthart et al. (1977) evaluated the effects of Zn at a single concentration on respiration of nativesoil microflora in soil/litter microcosms, as described for Cd. Zinc at 3600 ppm reduced respiration66%.
Premi and Cornfield (1969, 1969/1970) investigated the effects of Zn added to a sandy loam soilon nitrogen transformations by native soil microflora. In a 21-day experiment (1969), nitrification wasseverely inhibited at 100 ppm Zn, added as sulfate salt, the lowest concentration tested. Zinc added incarbonate form was ineffective at 10,000 ppm (highest concentration tested), probably because of theincrease in soil pH caused by addition of this form. In the 8-week experiment (1969/1970) with sucroseand ammonium nitrate added to the soil, nitrification was decreased only slightly less at 100 ppm Zn thanit was in the 21-day study.
The benchmark of 100 ppm Zn is the 10th percentile of the 46 reported effective values. Confidencein this benchmark is high because of the relatively large amount of data available for a variety offunctional response factors.
4.3.2 Organic Chemicals
Acrylonitrile. The effects of several organic compounds on respiration of native soil microflorain a sandy loam and a silt loam soil were evaluated by Walton et al. (1989). Both soils were acid (pH 4.9and 5.3) and low in organic matter (1.4 and 3%) but differed with respect to amounts of clay (5% vs and30%). Respiration was measured after 6-day exposure to 1000 ppm of each chemical. Chemicals testedat 1000 ppm had no effect and include methyl ethyl ketone, benzene, toluene, p-xylene, chlorobenzene,chloroform, and other chlorinated benzenes. Acrylonitrile reduced respiration by 59% in the sandy loamsoil and 41% in the silt loam. Clay appeared to have an ameliorating influence on the effects ofacrylonitrile.
The benchmark of 1000 ppm is based on this work. Confidence in the benchmark is low becauseof the limited amount and type of data available.
4-17
Carbon tetrachloride. The effects of 1000 ppm carbon tetrachloride on respiration of native soilmicroflora in a sandy loam and a silt loam soil was evaluated by Walton et al. (1989) as described foracrylonitrile. Carbon tetrachloride reduced respiration by 21% in the sandy loam but did not lowerrespiration in the silt loam soil. Clay may have had an ameliorating influence on the effects of thiscompound.
The benchmark of 1000 ppm is based on this work. Confidence in the benchmark is low becauseof the limited amount and type of data available.
Cis-1,4-dichloro-2-butene. The effects of cis-1,4-dichloro-2-butene on respiration of native soilmicroflora in a sandy loam and a silt loam soil was evaluated by Walton et al. (1989) as described foracrylonitrile. Cis-1,4-dichloro-2-butene reduced respiration by 48% in the sandy loam soil and 44% inthe silt loam by 1000 ppm. Clay did not appear not to have an ameliorating influence on the effects ofthis compound.
The benchmark of 1000 ppm is based on this work. Confidence in the benchmark is low becauseof the limited amount and type of data available.
Hexachlorobenzene. The effects of 1000 ppm hexachlorobenzene on respiration of native soilmicroflora in a sandy loam and a silt loam soil was evaluated by Walton et al. (1989) as described foracrylonitrile. Hexachlorobenzene reduced respiration by 37% in the silt loam but did not lowerrespiration in the sandy loam soil. Clay did not appear to have an ameliorating effect on the toxicity ofthis compound.
The benchmark of 1000 ppm is based on this work. Confidence in the benchmark is low becauseof the limited amount and type of data available.
Nitrobenzene. The effects of 1000 ppm nitrobenzene on respiration of native soil microflora in asandy loam and a silt loam soil was evaluated by Walton et al. (1989) as described for acrylonitrile.Nitrobenzene reduced respiration by 61% in the sandy loam soil and by 22% in the silt loam. Clayappears to have an ameliorating influence on the effect of nitrobenzene.
The benchmark of 1000 ppm is based on this work. Confidence in the benchmark is low becauseof the limited amount and type of data available.
Pentachlorophenol. van Beelen and Fleuren-Kemila (1993) evaluated the effect ofpentachlorophenol (PCP) on mineralization of added acetate by native soil microflora in an acidagricultural soil and an acid dune sand. After 1.8 days, CO evolved was reduced 50% (EC ) by 4602 50
ppm in the agricultural soil (percent organic matter, 10.4; percent clay, 5) and by 1500 ppm in the dunesand (percent organic matter, 1.2; percent clay, 0.4).
The benchmark of 400 ppm for PCP is based on this work. Confidence in the benchmark is lowbecause of the limited amount and type of data available.
Phenol. Effects of phenol on carbon and nitrogen mineralization and nitrogen transformations inalfalfa-amended, sieved soil were determined by Suter and Sharples (1984). The silt loam soil had a pHof 4.7. Carbon dioxide production was increased at 10 ppm and 100 ppm on days 1 and 7 but not onlater dates or at higher concentrations. CO production was decreased at 1000 ppm phenol on day 1, but2
not thereafter, and at 5000 ppm phenol on days 1 through 55. On all dates (days 7 through 42), ammoniaconcentrations were significantly increased and nitrate significantly decreased by 1000 and 5000 ppm
4-18
phenol. At 10 and 100 ppm on day 7 and at 100 ppm on day 42, but not on intermediate dates, ammoniawas significantly increased and nitrate decreased. If the lowest chronic response is used as the basis forthe benchmark, the threshold for significant effects in this test is 100 ppm phenol.
The benchmark of 100 ppm is based on this work. Confidence in the benchmark is low because ofthe limited amount and type of data available.
Trans-1,4-dichloro-2-butene. The effects of 1000 ppm trans-1,4-dichloro-2-butene on respirationof native soil microflora in a sandy loam and a silt loam soil was evaluated by Walton et al. (1989) asdescribed for acrylonitrile. Trans-1,4-dichloro-2-butene reduced respiration by 44% in the sandy loamsoil and 58% in the silt loam. Clay did not appear not to have an ameliorating influence on the effect ofthis compound.
The benchmark of 1000 ppm is based on this work. Confidence in the benchmark is low becauseof the limited amount and type of data available.
5-1
5. INVERTEBRATES OTHER THAN EARTHWORMS AND MICROBIAL HETEROTROPHS
5.1 INTRODUCTION
Interest in the toxic effects of soil pollutants on soil and litter dwelling invertebrates other thanearthworms and microorganisms stems from concern for negative effects on nutrient cycling andavailability and quality of food for animals feeding on soil and litter dwelling invertebrates. In general,the most important route for assimilation of metals by soil invertebrates is through the digestive tract(Beeby, 1991). Assimilation of toxic metals depends on diet and the animal's essential metal demand.In general, invertebrates with a high calcium demand tend to accumulate higher concentrations of toxicmetals. The metals are often bound in intracellular granules, structural tissues, and membrane-boundvesicles. There is no clear relationship between the bioconcentration potential of a species and itssusceptibility to metal intoxication (van Straalen, 1991).
Toxic effects of metals on invertebrates result in part from their interactions with nutritionallysignificant metals. van Straalen et al. (1989) suggest that the negative impact of cadmium on mite(Platynothrus peltifer) egg production results from disruption of the role of zinc in reproductivemetabolism. Cadmium also blocks the calcium current of Helix neurons (Akaike et al., 1978), possiblyleading to tissue damage and reduced reproduction (Russell et al., 1981). The interrelationships betweenmetals, both essential and nonessential, appear to be quite complex and variable among species ofinvertebrates. Other effects may result from the binding of metals to proteins and enzymes withconsequent functional disruption.
5.2 INVERTEBRATE DATA SELECTION
The experimental approaches are too diverse and the data too meager to allow for the establishmentof benchmarks for the toxicity of contaminants in soil to soil-dwelling invertebrates other thanearthworms. Most experiments evaluating the effects on nematodes are conducted in solution becausethese organisms inhabit the water films around soil particles and roots. The experiments usingCollembola and mites are often conducted by feeding the organisms on algae that were reared oncontaminated media. Perhaps the most common method for other organisms is to surface apply asolution, or soluble powder, of the chemical to the organic substrate on which it is to feed during theexperiment. At most contaminated sites, concentrations of chemicals in soil are measured whileconcentrations in soil algae, litter, and pore water are not. Surface-applied chemicals are only appropriatewhen evaluating sites where deposition of air-borne contaminants onto vegetation and litter is the onlyroute by which these food sources become contaminated. The bioavailability of chemicals introduced tofood by these methods is not directly comparable to that of chemicals bound in organic form inside plantmaterial or microflora. Furthermore, it would be difficult to assess the food preferences of these diverseand opportunistic organisms in any specific field situation (Hopkin, 1989) to allow appropriate samplingand analysis.
For the previously described reasons, no benchmarks have been established for these organisms.The information in this part of the document is provided as reference and support material. Experimental data are given in Appendix C.
5-2
5.3 INVERTEBRATE TEST SPECIES
The literature on toxicity of chemicals to soil and litter-dwelling invertebrates presents experimentalresults using microarthropods, macroarthropods, nematodes, and terrestrial gastropods and crustaceans.These organisms represent diverse morphological, physiological, and behavioral groups. The followinggeneral information is derived mainly from works edited by Dindal (1990) and Dickinson and Pugh(1974).
Collembola (springtails) are small, wingless microarthropods that live mainly in the soil litter layer.With the mites, springtails make up the majority of the soil litter arthropod fauna. Most soil forms liveon partially decomposed vegetation or microflora, especially fungi. The importance of Collembola to soilorganic matter breakdown and nutrient cycling results from the comminution of organic matterfragments, feeding on humus and feces in the litter, and on decaying roots. Collembola commonly usedas test species are Folsomia candida, Onychiurus armatus, and Orchesella cincta. Folsomia candidais considered well-suited for the study of effects of contaminants on population parameters because itis easy to culture and has a relatively short generation time. This allows the study of individual andpopulation parameters in the same experiment (Crommentuijn et al., 1993).
The Acarina (mites) are a diverse group of arthropods in the suborders Prostigmata, Mesostigmata,Astigmata, and Oribatida. Each suborder contains representatives living in a wide range of habitats. Inthe soil and litter, mites may be detritivores eating dead plant material, predatory, orfungivores/algivores. Oribatid mites are found in large numbers in organic horizons of soils. They arerepresented in toxicity tests by Platynothrus peltifer. Like the springtails, mites act to increase the rateof organic matter decomposition by reducing the size of organic matter fragments and feeding onmicroflora involved in decomposition. Mites, especially oribatids, are considered suitable for the studyof effects of contaminants on population parameters because they are easy to culture and have arelatively short generation time (1 per year), although it is longer than that of the Collembola (2 peryear).
Terrestrial crustaceans are represented in the toxicity literature by woodlice, also known as pill bugs(Isopoda, Porcellio scaber and Oniscus asellus). They are common in deciduous woodland, living inthe litter layer and on decaying wood. Woodlice are omnivorous, feeding mainly on dead and decayingplants. They increase organic matter decomposition by comminuting the fragments and feeding onmicroflora involved in primary decomposition. As leaf litter feeders, isopods are considered goodcandidates for standard organisms in ecotoxicological testing (van Wensem, 1989). Porcellio scaberis common in many countries and is easy to maintain in the laboratory.
The snail Helix aspersa and the slug Arion ater represent terrestrial gastropods. They aregeneralized feeders (living and dead plant materials) inhabiting the soil surface, the litter layer, andstanding vegetation. Their use in ecotoxicological testing stems from their potential importance foraccumulation of contaminants in the food chain (Russell et al., 1981).
Nematodes (roundworms) are significantly different from other soil and litter-dwelling organismsdiscussed herein because they require a continuous water film for survival. They feed on a wide varietyof foods although some are specialized parasites. The effects of chemicals on fungivores, bactivores,herbivores, and omnivores/predators have been evaluated. Caenorhabditis elegans used in experimentsis a widespread free-living, soil-dwelling nematode. Nematodes have been used in ecotoxicological workfor a number of reasons. They are abundant, easily retrieved from soil, and reared in the laboratory.Nematodes live in the interstitial water of the soil so experiments can be conducted in water. They maybe exposed to higher concentrations of contaminants by this route than earthworms and other
5-3
invertebrates not constantly in contact with the soil solution. Uptake of chemicals is mainly through thecuticle, and differences in cuticle permeability are thought to be the primary source of variability inresponse of various nematodes to toxic chemicals (Kammenga et al., 1994).
5.4 OTHER INVERTEBRATES LITERATURE REVIEW
Cadmium. Kammenga et al. (1994) compared the acute toxicity of Cd (CdCl ) to seven terrestrial2
nematode species belonging to different taxonomic and ecological groups. The nematodes were extractedfrom the surface horizon of an arable soil and a forest floor and identified and selected on the basis ofdifferent trophic levels: Rhabditis species and Diplogasteritus species; Cephalobus persegnis,Acrobeloides buetschlii, and Caenorhabditis elegans, bacteria feeders; Aphelenchus avenae, fungusfeeder; and Tylenchus elegans, plant feeder. Solutions were mixed to mimic the mineral concentrationsof soil solution in a sandy forest surface soil plus Cd at different concentrations. LC values were50
determined after 72 hours. The nematodes T. elegans and A. avenae had LC values of greater than 9050
ppm after 96 hours (termination of experiment); that is, they were essentially unaffected by theexperimental treatment. Among the bacterial feeders the LC ranged from approximately 3 to 60 ppm50
Cd after 72 hours.
The nematode C. elegans was used by van Kessel et al. (1989) to test the effects of Cd (as CdCl )2
on growth (length) and reproduction (number of juveniles per adult) of this soil-dwelling group. Juvenile(J-1) nematodes were cultured for 168 hours in microtiter plates containing solutions with different levelsof Cd. Reproduction, the more sensitive parameter, was reduced 36% by 3.6 ppm.
The influence of Cd (as CdCl ) on life-history characteristics of the collembolan Folsomia candida2
was investigated by Crommentuijn et al. (1993). One-week old animals were placed on OECD artificialsoil (containing, in percent dry weight, 10 sphagnum peat, 20 kaolin clay, 70 quartz sand; pH 6)containing a series of concentrations of Cd and fed baker's yeast. Number and weight of adults andnumber of offspring were determined. A soil concentration (HCl+HNO extractable) of 326 ppm Cd3
reduced the number of offspring produced by 21% after 42 days. Weight of the individual animals wasnot affected at this concentration.
Representatives of Collembola and mites were used by van Straalen et al. (1989) to assess the effectof Cd in diets of soil microarthropods on population growth rates. Three-day old Orchesella cincta(Collembola) were fed green algae containing Cd (CdSO ). A concentration of 15 ppm Cd caused an4
approximate 56% reduction in calculated population growth rate after 61 days, while 4.7 ppm had noeffect. Adult mites (P. peltifer) fed the same diet for 84 days experienced a 23% reduction in populationgrowth rate at a concentration of 9 ppm Cd, while 3 ppm had no effect.
Hopkin and Hames (1994) investigated the effects of Cd (as CdNO ) in food on survival and3
reproduction of the terrestrial isopod Porcellio scaber. Leaves of field maple (Acer campestre) weresprayed with solutions containing Cd and placed in plastic containers with juvenile woodlice. After 360days, the number of surviving isopods and the number of juveniles were determined. The number ofjuveniles produced was decreased 47% by 10 ppm Cd (lowest concentration tested) while 50 ppm wasrequired to reduce total survival.
The effects of Cd on individual weight, new shell growth, and reproductive behavior of the snailHelix aspersa was evaluated by Russell et al. (1981). The diet fed to the sub-adult (4-month- old) snailsfor 30 days was ground Purina Lab Chow (for rats, mice, and hamsters) with Cd (as CdCl ) added. Snails2
were raised in plastic containers with sand bottoms. Reproductive activity, as measured by the number
5-4
of individuals mating or with spermatophores in place, was reduced 28% by 25 ppm Cd while 10 ppmhad no effect. New shell growth and weight were not affected at this concentration.
The experimental approaches described in the previous paragraphs are too diverse to allowcomparison of results, as discussed in the Introduction. There is agreement between the two studies onthe effects of Cd on nematodes in that approximately 3 ppm in solution is detrimental to the organisms.This number may be useful when soil solution concentration values for Cd are available.
The one study conducted in soil yielded a toxic concentration of 326 ppm, which is higher than theearthworm and microbe benchmarks for soil (Tables 1 and 2).
Copper. The acute toxicity of Cu to the nematode C. elegans in four soils and in solution wasevaluated by Donkin and Dusenbery (1993). The soils included two silt loams, a loam, and a clay loam.Adult nematodes were placed in the soil with Cu added as CuCl and native soil organic matter as food.2
After 24 hours, surviving animals were counted, and an LC concentration calculated. Toxicity was also50
tested in solutions containing Cu. A concentration of 105 ppm Cu in solution caused 50% mortalitywhile at least 400 ppm (sandy loam soil) was required in soil. The highest LC (1061 ppm) was50
associated with the highest percentage organic matter in the loam soil.
Parmalee et al. (1993) used a soil microcosm to test the effects of Cu on survival of nematodes andmicroarthropods feeding on native soil organic matter. Cu was added as CuSO to the A horizon of an4
acid sandy forest soil where native soil nematode and microarthropod populations were exposed for 7days. There was an average reduction of approximately 70% in number of individuals of most categoriesof nematodes (fungivores, bactivores, herbivores, hatchlings) at 400 ppm total Cu, while 185 ppm hadno effect. The number of individuals of the omnivores/predators category was reduced 85% by the lowestconcentration of Cu tested, 72 ppm. Total microarthropod numbers were reduced about 50% by 400ppm. The oribatid and Mesostigmata mites appeared to be more sensitive, and the Collembolapopulation was too small to evaluate.
Streit (1984) exposed microarthropod communities for six weeks to copper sulfate in 27-Lmicrocosms containing a loess-derived brown earth soil with local gley horizons from a forest site innorthern Switzerland. From 40 to 150 ppm Cu, no significant effects on the mite community wereobserved. At 200 ppm, a reduction in juvenile mites was observed. The effect was primarily due to adecrease in the species Platynothrus peltifer. The authors concluded that 200 ppm did not conclusivelycause adverse effects at the community level, since only one of seven species was affected. The miteswere less sensitive than earthworms to the copper concentrations in soil.
Korthals et al. (1996) investigated the effects of copper on the nematode community in anagroecosystem in the Netherlands after 10 years of exposure. The mean total number of nematodes wasreduced at least 20% in soil containing 100 ppm of Cu (pH adjusted to 4.0), 104 ppm of Cu (pH adjustedto 4.7), and 160 ppm of Cu (pH adjusted to 5.4). The abundance of different species and trophic groupswas more sensitive a parameter than the total number of nematodes. Copper was extracted from the top10 cm of soil with 0.43 M nitric acid; thus, total concentrations of the metal may be higher than thosereported.
Hopkin and Hames (1994) investigated the effects of Cu (as CuNO ) in food on survival and3
reproduction of the terrestrial isopod Porcellio scaber. The experimental design used by the authors isdescribed in the discussion of the effects of Cd on this animal. After 360 days, the number of survivingisopods and the number of juveniles were determined. The number of juveniles produced was decreased53% by 50 ppm Cu while 100 ppm of Cu was required to reduce total survival.
5-5
The slug, Arion ater, was used as the test organism by Marigomez et al. (1986) to determine theeffects of several pollutants on terrestrial mollusks. Slugs collected from the field were reared in plasticboxes and fed a diet of a pulverized mixture of lettuce, apple, carrot, and pumpkin mixed with CuSO .4
After 27 days on this diet, the animals experienced a 55% decrease in growth at 1000 ppm Cu, while 300ppm had no effect.
The studies of Donkin and Dusenbery (1993) and Parmalee et al. (1993) taken together show ahigher concentration in soil than in solution is required to affect the survival of nematodes. Differencesamong groups of nematodes in sensitivity to Cu is shown by Parmalee et al. (1993). The application ofsoluble form of Cu to food material by Hopkin and Hames (1994) and Marigomez et al. (1986) showvery distinct sensitivities of woodlice and slugs to Cu.
The lowest toxic concentration reported in these two studies (72 ppm Cu) is higher than thebenchmarks for earthworms (50 ppm) and microbes (30 ppm).
Iron. The effect of iron on the Collembola Orchesella cincta was investigated by Nottrot et al.(1987). The springtails were grown in plastic dishes and fed green algae (Pleurococcus spp.) containingvarious concentrations of Fe for 21 days. Percent growth, feeding activity, and molting were determined.Growth of the springtails was reduced 42% by a diet of 7533 ppm, while 3515 ppm had no effect.
Lead. Bengtsson et al. (1983) evaluated the effects of lead, in the fungus Verticillium bulbillosum,on growth rate of a fungus-feeding collembolan, O. armatus. Adult springtails were fed the fungus for125 days and their lengths were recorded for calculation of growth rate. Lead at 3089 ppm in the funguscaused a 25% reduction in O. armatus growth rate. fungus.
Hopkin and Hames (1994) investigated the effects of Pb (as PbNO ) in food on survival and3
reproduction of the terrestrial isopod Porcellio scaber. The experimental design used by the authors isdescribed in the discussion of the effects of Cd on this animal. After 360 days, the number of survivingisopods and the number of juveniles were determined. Survival and the number of juveniles producedwere decreased 100% by 2000 ppm Pb while 1000 ppm had no effect.
Beyer and Anderson (1985) also used Porcellio scaber in experiments to determine the effect ofPb, added as PbO to ground deciduous leaf litter, on several population parameters. The woodlice werereared in plastic containers and fed this diet for 448 days. During this time, the following were measured:lifespan of generation 1, maximum number of individuals in generation 2, and survival of generation 2.These parameters were decreased 27, 68, and 84%, respectively, by 12,800 ppm Pb in the diet, while6400 ppm had no effect.
The slug, Arion ater, was used as the test organism by Marigomez et al. (1986) to determine theeffect of lead on terrestrial mollusks. Field collected slugs were reared in plastic boxes and fed a diet ofa pulverized mixture of lettuce, apple, carrot, and pumpkin mixed with PbNO . After 27 days on this3
diet, the animals experienced a 51% decrease in growth at 1000 ppm Pb, while 300 ppm had no effect.
The studies indicate a high tolerance to Pb in the diets of the tested woodlouse, springtail, and slugspecies. The discrepancy between the Hopkin and Hames (1994) and Beyer and Anderson (1985) levelsof Pb required to affect the woodlouse may be due to differences in bioavailability of the added Pbcompounds.
Mercury. The slug, Arion ater, was used as the test organism by Marigomez et al. (1986) todetermine the effect of mercury (as HgCl ) on terrestrial mollusks, as described for Pb. After 27 days2

5-6
on this diet, the animals experienced a 26% decrease in growth at 1000 ppm Hg, while Hg at 300 ppmhad no effect.
Zinc. Hopkin and Hames (1994) investigated the effects of Zn (as ZnNO ) in food on survival and3
reproduction of the terrestrial isopod Porcellio scaber. The experimental design used by the authors isdescribed in the discussion of the effects of Cd on this animal. After 360 days, the number of survivingisopods and number of juveniles were determined. Survival and number of juveniles produced weredecreased 100% by 1000 ppm Zn while 500 ppm had no effect.
Smit and van Gestel (1996) investigated the toxicity of zinc chloride to the springtail Folsomiacandida in two soils and compared the results to results from contaminated soils near a zinc smelter.EC50s for the effect of zinc on the population size of springtails were 185 and 348 ppm for the two soilsafter 4 weeks of exposure and 210 and 363 ppm for the soils after 6 weeks of exposure. The EC50 forgrowth in one of the soils (pH corrected from 3.46 to 6.0 with CaCO , 3% organic matter, 1.38% clay)3
was 462 ppm, and an EC50 for growth could not be calculated for the other soil. In the field soil, norelationship was observed between zinc concentrations and either growth or reproduction.
Zinc (as ZnO) was added to litter from the O2 layer under woodlands to evaluate the effects of thatmetal on Porcellio scaber (Beyer et al. 1984). Adult animals kept in plastic boxes were fed this diet for56 days before survival was determined. The only concentration tested, 5000 ppm, caused a 26%decrease in survival.
Beyer and Anderson (1985) also used Porcellio scaber in experiments to determine the effect ofZn, added ZnO to ground deciduous leaf litter, on several population parameters. The woodlice werereared in plastic containers and fed this diet for 448 days. During this time the following were measured:lifespan of generation 1, maximum number of individuals in generation 2, and survival of generation 2.The maximum number of individuals in generation 2 and the survival rate for generation 2 weredecreased 22 and 27% by 1600 ppm Zn in the diet, while 800 ppm had no effect.
The slug, Arion ater, was used as the test organism by Marigomez et al. (1986) to determine theeffect of Zn (as ZnCl ) on terrestrial mollusks, as described previously. After 27 days on this diet the2
animals experienced a 38% decrease in growth at 10 ppm Zn, the lowest concentration tested.
The experiments evaluating the toxicity of Zn to the woodlouse Porcellio scaber show a hightolerance to the metal when it is added to the food in soluble form. The work with Arion ater(Marigomez et al., 1986) indicates that this organism is more sensitive than P. scaber to Zn. On theother hand, growth of individual woodlice was not evaluated and may be more sensitive than survivaland reproduction.
Benzo(a)pyrene (BaP). The woodlouse P. scaber was chosen by van Straalen and Verweij (1991)to determine the effects of this PAH on the soil invertebrate community. Polynuclear aromatichydrocarbons are strongly sorbed onto soil organic matter which serves as the main food for many ofthese organisms. Adult woodlice were reared in plastic boxes for 28 days and fed ground poplar leaflitter mixed with benzo(a)pyrene. Growth efficiency was determined as dry weight increase divided bynet food consumption (consumption minus defecation). Respiration, food consumption, and foodassimilation were also measured. Growth efficiency of the males of the group was reduced 82% by 125ppm BaP in the food, while 25 ppm had no effect. Growth efficiency of the females, respiration, foodconsumption, and food assimilation were not affected.
5-7
Two isopods, Porcellio scaber and Oniscus asellus, were used by van Brummelen and Stuijfzand(1993) to determine the effects of BaP on litter layer-dwelling soil invertebrates. Weight and lengthchanges and energy reserves were measured in individuals reared in plastic boxes and fed a combinationof ground poplar leaves and ground dog food spiked with BaP for 63 days. Dry weight of P. scaber wasreduced 30% with a diet containing 100 ppm BaP, while 32 ppm had no effect. Length and energyreserves (lipids+glycogen+protein) were not affected. Dry weight and length of O. asellus were reduced58 and 48% with a diet containing 316 ppm BaP, while 100 ppm had no effect. Energy reserves werenot affected.
These experiments with woodlice indicate that growth may be affected by BaP at concentrationsof about 100 ppm applied to food.
p-nitrophenol (PNP). Parmalee et al. (1993) tested the effects of PNP on survival of nematodesand microarthropods in soil microcosms, as described for Cu. There was an average reduction ofapproximately 55% in number of individuals of most categories of nematodes (fungivores, herbivores,herbivores/predators, and hatchlings) at 40 ppm total PNP, while 20 ppm had no effect. The number ofindividuals of the bacterivore category was reduced 40% by the lowest concentration of PNP tested, 20ppm. Total microarthropod numbers were reduced about 35% by 176 ppm, mainly as the result ofreductions in oribatids. P-nitrophenol up to 176 ppm had no effect on numbers of Mesostigmata orunclassified microarthropods, and there were no Collembola were present.
Pentachlorophenol. Kammenga et al. (1994) compared the acute toxicity of PCP in solutionculture to seven terrestrial nematode species belonging to different taxonomic and ecological groups. Thenematodes and experimental design are the same as described previously for Cd. Aphelenchus avenae,Caenorhabditis elegans, and Acrobeloides beutschlii had LC values greater than 9 ppm after 96 hours50
(that is, experimental concentrations killed fewer than half of the nematodes). LC values for the50
remaining nematodes ranged from approximately 1 to 7 ppm PCP.
Trinitrotoluene (TNT). Parmalee et al. (1993) used a soil microcosm to test the effects of TNTon survival of nematodes and microarthropods in soil microcosms, as described previously for Cu.Trinitrotoluene additions up to 200 ppm had no effect on numbers of nematodes. Total microarthropodnumbers were reduced about 58% by 200 ppm, while 100 ppm had no effect. Trinitrotoluene up to 200ppm had no effect on numbers of Mesostigmata, Collembola, or unclassified microarthropods.
6-1
6. RELATIONSHIP BETWEEN SOIL TOXICITY BENCHMARKSAND OTHER ECOTOXICOLOGICAL CRITERIA
6.1 COMPARISON OF TOXICITY BENCHMARKS FOR CONTAMINANTS IN SOIL TOCANADIAN ENVIRONMENTAL QUALITY CRITERIA FOR CONTAMINATED SITES
The Canadian Council of Ministers of the Environment has developed Environmental QualityCriteria for contaminated sites. These are "numerical limits for contaminants in soil and water intendedto maintain, improve, or protect environmental quality and human health at contaminated sites ingeneral" (CCME, 1991). Remediation criteria are presented for comparison to the toxicity benchmarkspresented herein because they represent levels considered generally protective of human health and theenvironment for specified uses of soil (in this case the most conservative use—which is agriculture—hasbeen chosen) without taking into account site-specific conditions. If contaminant concentrations exceedthe remediation criteria for a current or future land use, further investigation or remediation is needed.These criteria have an interim status, and final criteria will be included in future revisions of thisdocument. They have been adopted from several Canadian jurisdictions and many lack supportingrationale (CCME, 1991). The remediation criteria are not strictly comparable to the toxicity benchmarksdeveloped herein because they also take into account human health and, presumably, plants and the entirefood web dependent upon the soil. A comparison of the toxicity benchmarks presented in this report withthe CCME Remediation Criteria is given in Table 3.
For 7 of 18 chemicals, one or both of the soil toxicity benchmarks derived by the method used inthis report is lower than the CCME criterion. There is no indication in the source publication as to thelevel of protection being afforded by the CCME Remediation Criteria. However, because human healthis considered in the conservative agriculture land-use scenario, one would expect it to be high. This levelof protection is seen in the organic chemicals which are known to be toxic to mammals at relatively lowlevels.
6.2 COMPARISON OF TOXICITY BENCHMARKS FOR CONTAMINANTS IN SOIL TORIVM (NETHERLANDS) ECOTOXICOLOGICAL INTERVENTION VALUES FORCONTAMINANTS IN SOILS
The Dutch National Institute of Public Health and Environmental Protection (RIVM) developedEcotoxicological Intervention Values (EIVs) that represent concentrations of contaminants in soilcausing 50% of the species potentially present in an ecosystem to experience adverse effects (van denBerg et al., 1993). The EIVs take into account plants, soil fauna, and microorganisms. The method forderiving the EIVs is described by Denneman and van Gestel in several RIVM publications in Dutch. Totake the influence of soil characteristics on the bioavailability of compounds, data were adjusted fororganic matter and clay content as described by van den Berg et al. (1993). Risks resulting frombiomagnification were included.
Although these EIVs are based on purely "ecological" endpoints, they take into account many moretypes of organisms than the authors' earthworm and microbe toxicity benchmarks. For metals, benchmarks presented herein are more conservative than the RIVM EIVs in about half of thecases. For organic chemicals, most of benchmarks presented herein for earthworms are in fairly goodagreement with the RIVM values. Differences here may stem from the RIVM report of values forundefined compounds of particular classes rather than for particular compounds.
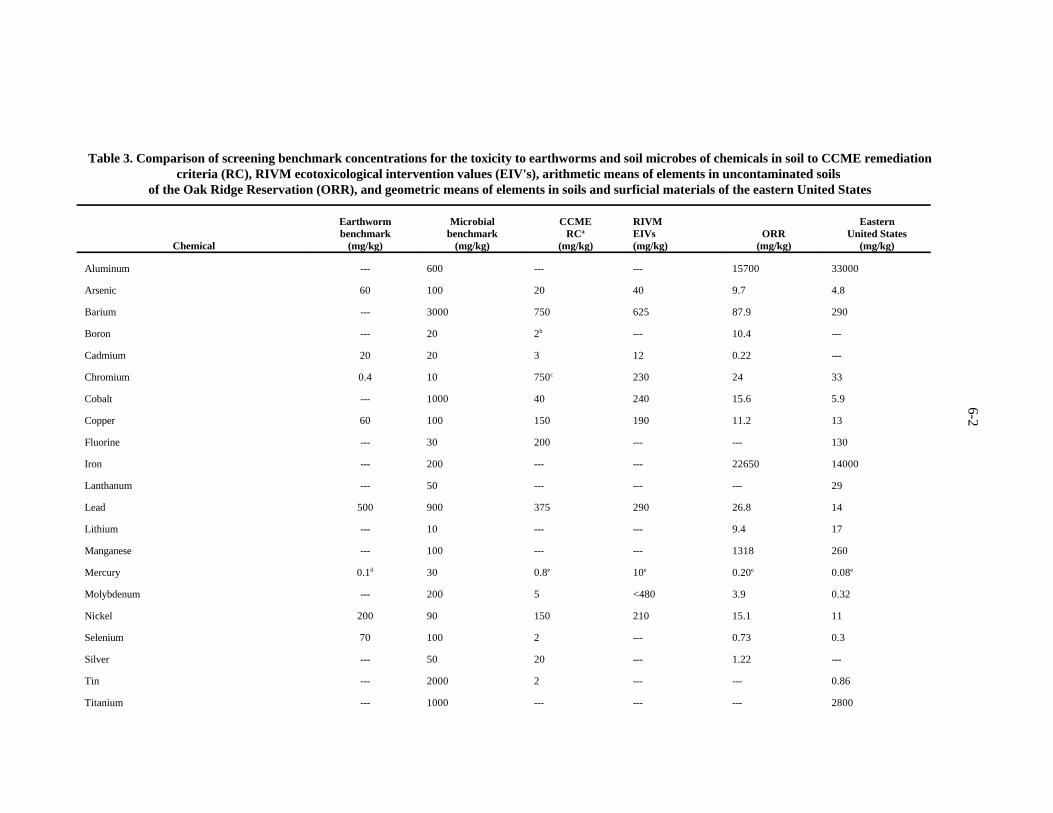
6-2
Table 3. Comparison of screening benchmark concentrations for the toxicity to earthworms and soil microbes of chemicals in soil to CCME remediationcriteria (RC), RIVM ecotoxicological intervention values (EIV's), arithmetic means of elements in uncontaminated soils
of the Oak Ridge Reservation (ORR), and geometric means of elements in soils and surficial materials of the eastern United States
Chemical (mg/kg) (mg/kg) (mg/kg) (mg/kg) (mg/kg) (mg/kg)
Earthworm Microbial CCME RIVM Easternbenchmark benchmark RC EIVs ORR United Statesa
Aluminum --- 600 --- --- 15700 33000
Arsenic 60 100 20 40 9.7 4.8
Barium --- 3000 750 625 87.9 290
Boron --- 20 2 --- 10.4 ---b
Cadmium 20 20 3 12 0.22 ---
Chromium 0.4 10 750 230 24 33c
Cobalt --- 1000 40 240 15.6 5.9
Copper 60 100 150 190 11.2 13
Fluorine --- 30 200 --- --- 130
Iron --- 200 --- --- 22650 14000
Lanthanum --- 50 --- --- --- 29
Lead 500 900 375 290 26.8 14
Lithium --- 10 --- --- 9.4 17
Manganese --- 100 --- --- 1318 260
Mercury 0.1 30 0.8 10 0.20 0.08d e e e e
Molybdenum --- 200 5 <480 3.9 0.32
Nickel 200 90 150 210 15.1 11
Selenium 70 100 2 --- 0.73 0.3
Silver --- 50 20 --- 1.22 ---
Tin --- 2000 2 --- --- 0.86
Titanium --- 1000 --- --- --- 2800
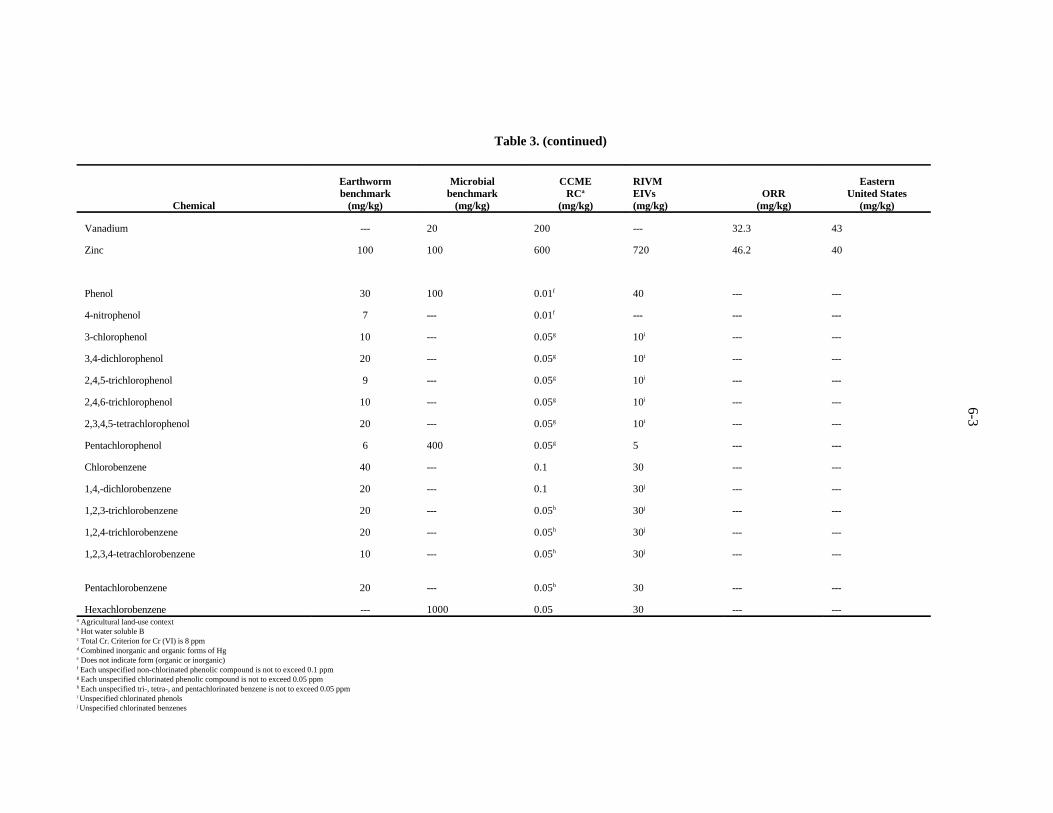
6-3
Table 3. (continued)
Chemical (mg/kg) (mg/kg) (mg/kg) (mg/kg) (mg/kg) (mg/kg)
Earthworm Microbial CCME RIVM Easternbenchmark benchmark RC EIVs ORR United Statesa
Vanadium --- 20 200 --- 32.3 43
Zinc 100 100 600 720 46.2 40
Phenol 30 100 0.01 40 --- ---f
4-nitrophenol 7 --- 0.01 --- --- ---f
3-chlorophenol 10 --- 0.05 10 --- ---g i
3,4-dichlorophenol 20 --- 0.05 10 --- ---g i
2,4,5-trichlorophenol 9 --- 0.05 10 --- ---g i
2,4,6-trichlorophenol 10 --- 0.05 10 --- ---g i
2,3,4,5-tetrachlorophenol 20 --- 0.05 10 --- ---g i
Pentachlorophenol 6 400 0.05 5 --- ---g
Chlorobenzene 40 --- 0.1 30 --- ---
1,4,-dichlorobenzene 20 --- 0.1 30 --- ---j
1,2,3-trichlorobenzene 20 --- 0.05 30 --- ---h j
1,2,4-trichlorobenzene 20 --- 0.05 30 --- ---h j
1,2,3,4-tetrachlorobenzene 10 --- 0.05 30 --- ---h j
Pentachlorobenzene 20 --- 0.05 30 --- ---h
Hexachlorobenzene --- 1000 0.05 30 --- --- Agricultural land-use contexta
Hot water soluble Bb
Total Cr. Criterion for Cr (VI) is 8 ppmc
Combined inorganic and organic forms of Hg d
Does not indicate form (organic or inorganic)e
Each unspecified non-chlorinated phenolic compound is not to exceed 0.1 ppmf
Each unspecified chlorinated phenolic compound is not to exceed 0.05 ppmg
Each unspecified tri-, tetra-, and pentachlorinated benzene is not to exceed 0.05 ppmh
Unspecified chlorinated phenolsi
Unspecified chlorinated benzenesj

7-1
7. COMPARISON OF TOXICITY BENCHMARKS FORCONTAMINANTS IN SOIL TO CONCENTRATIONS
OF CHEMICALS IN UNPOLLUTED SOILS
7.1 COMPARISON TO USGS ELEMENT CONCENTRATIONS IN SOILS AND OTHERSURFICIAL MATERIALS OF THE EASTERN UNITED STATES
To place the four sets of critical values into a broader perspective, soil chemical concentrations arepresented herein as reported by the United States Geological Survey (USGS) in a survey of soils of theeastern United States (Shacklette and Boerngen, 1984) (Table 3). These samples were collected andanalyzed by the USGS to represent, as closely as possible, soils that supported native plants and whichwere altered very little from their natural condition.
It is interesting to compare the levels of elements cited in the literature as toxic againstconcentrations of the same elements found in natural (i.e., not known to be polluted) soils. Thiscomparison is reasonable in most cases because benchmarks generally were based on nominal soilconcentrations (i.e., those added to the soil by the experimenter) as opposed to a measure of either totalconcentration or of the bioavailable quantity of the element in the soil. Seldom was the background levelof the "contaminant" element in the soil measured, the assumption being that very little of the elementexisted naturally in the soil compared to treatment levels added. This is often, but not always, areasonable assumption. The USGS compilation contains concentrations of elements derived mainly fromstrong-acid extractions, although in the case of uranium, neutron activation was used to measure a truetotal concentration. Values for the eastern United States were used because surficial deposits of thewestern United States, especially in arid and mountainous regions, may contain unusually highconcentrations of naturally-occurring trace elements.
For several of the metals, our toxicity benchmarks were below (Al, Cr, F, Fe, Mn, Ti, and V) orabout equal to (Li) the geometric mean for the element in soils and surficial deposits in the easternUnited States. The large difference between the USGS soil Fe and Al values and the low microbialbenchmark based on a quantity of Fe or Al added to soil is likely due to the strong extractant used in theUSGS study. The form of the element added or some other aspect of the experimental design mayaccount for other low benchmark concentrations as compared to mean levels in soils.
7.2 COMPARISON TO DOE OAK RIDGE RESERVATION BACKGROUND SOILCHARACTERIZATION ELEMENT CONCENTRATIONS IN SOILS
The Background Soil Characterization Project (BSCP) at the ORR was established to determinethe background concentrations of organics, metals, and radionuclides in natural soils that are importantto environmental restoration projects (Watkins et al., 1993). Soils were sampled, field classified, andanalyzed for chemicals using several methods. The data presented in Table 3 show the arithmetic meansof elements from 46 sampling sites. The elements were extracted from the soil samples using nitric acidand hydrogen peroxide (EPA, 1986). This standard EPA acid digestion for sediments, sludges, and soilsis not explicitly meant to extract total elements from a sample. A comparison with total soilconcentrations of elements measured by neutron activation analysis (NAA) shows that for many elements(e.g., Sb, As, Cr, Co, Mn, Si, V, Zn) the HNO -H O extraction method was adequate for most of the3 2 2
elements in question (Watkins et al., 1993). Unfortunately, not all elements are amenable tomeasurement by NAA.

7-2
A large discrepancy was found between the BSCP soil Fe and Al values and the low soil toxicitybenchmarks, based on a quantity of Fe or Al added to soil. At least one of our benchmarks is lower thanbackground soil concentrations in the case of Cr, Mn, and V, and about equal for Li and Hg. The formof the element added or some other aspect of the experimental design may account for these differences.
8-1
8. RECOMMENDATIONS AND CONCLUSIONS
The values presented in Tables 1 and 2 are intended for use in contaminant screening during thehazard identification (problem formulation) phase of ecological risk assessments. Chemicals with soilconcentrations that exceed both the toxicity benchmarks for soil and the background soil concentrationfor the soil type are contaminants of potential concern. Background soil concentrations have been derivedfor the ORR and should be generated for other Comprehensive Environmental Response, Compensationand Liability Act (CERCLA) sites as well.
For baseline ecological risk assessments, and other assessments that may lead to regulatory actions,assessors should consult the primary sources of toxicity data and then determine the applicability of thedata to their specific sites. In addition, assessments should not rely on laboratory toxicity data only.Where toxicity to soil invertebrates is suspected, toxicity tests should be performed with thecontaminated soil. In addition, the abundance of earthworms in the soil of a particular site, determinedduring collection of earthworms for chemical analysis, may provide a rough indication of the likelihoodof soil toxicity.
9-1
9. REFERENCES
Abbasi, S.A., and R. Soni. 1983. "Stress-induced enhancement of reproduction in earthwormOctochaetus pattoni exposed to chromium (VI) and mercury (II) - Implications in environmentalmanagement." Intern. J. Environ. Stud. 22:43-47.
Akaike, N., K.S. Lee, and A.M. Brown. 1978. "The calcium current of Helix neuron." J. Gen. Physiol.71:509-531.
Al-Khafaji, A.A., and M.A. Tabatabai. 1979. "Effects of trace elements on arylsulfatase activity insoils." Soil Sci. 127(3):129-133.
Babich, H., and G. Stotzky. 1982. "Toxicity of nickel to microorganisms in soil: Influence of somephysicochemical characteristics." Environ. Pollut. 29A:303-315.
Beeby, A. 1991. "Toxic metal uptake and essential metal regulation in terrestrial invertebrates: Areview." In Metal Ecotoxicology, Concepts & Applications. M.C. Newman and A.W. McIntosh(eds). Lewis Publishers, Boca Raton. pp. 65-89.
Bengtsson, G., T. Gunnarsson, and S. Rundgren. 1983. "Growth changes caused by metal uptake in apopulation of Onychiurus armatus (Collembola) feeding on metal polluted fungi." OIKOS 40:216-225.
Bengtsson, G., T. Gunnarsson, and S. Rundgren. 1986. "Effects of metal pollution on the earthwormDendrobaena rubida (Sav.) in acidified soils." Water Soil Air Pollut. 28:361-383.
Bewley, R.J.F., and G. Stotzky. 1983. "Effects of cadmium and simulated acid rain on ammonificationand nitrification in soil." Arch. Environ. Contam. Toxicol. 12:285-291.
Beyer, W.N., and A. Anderson. 1985. "Toxicity to woodlice of zinc and lead oxides added to soil litter."Ambio 14(3):173-174.
Beyer, W.N., E. Cromartie, and G.B. Moment. 1985. "Accumulation of methylmercury in the earthwormEisenia foetida, and its effect on regeneration." Bull. Environ. Contam. Toxicol. 35:157-162.
Beyer, W.N., G.W. Miller, and E.J. Cromartie. 1984. "Contamination of the O2 soil horizon by zincsmelting and its effect on woodlouse survival." J. Environ. Qual. 13(2):247-251.
Bhuiya, M.R.H., and A.H. Cornfield. 1976. "Effect of addition of Cu, Cr, Pb and Zn on nitrogenmineralisation and nitrification during incubation of sandy soils." Bangladesh J. Biol. Sci. 5(1):18-20.
Bhuiya, M.R.H., and A.H. Cornfield. 1974. "Incubation study on effect of pH on nitrogen mineralisationand nitrification in soils treated with 1000 ppm lead and zinc, as oxides." Environ. Pollut. 7:161-164.
Bhuiya, M.R.H., and A.H. Cornfield. 1972. "Effects of addition of 1000 ppm Cu, Ni, Pb and Zn oncarbon dioxide release during incubation of soil alone and after treatment with straw." Environ.Pollut. 3:173-177.

9-2
Bollag, J.-M., and W.Barabasz. 1979. "Effect of heavy metals on the denitrification process in soil." J.Environ. Qual. 8(2):196-201.
Bouche, M.B. 1992. "Earthworm species and ecotoxicological studies." In Ecotoxicology ofEarthworms. P.W. Greig-Smith et al. (eds). Intercept Ltd., U.K. pp. 20-35.
Bremner, J.M., and L.A. Douglas. 1971. "Inhibition of urease activity in soils." Soil Biol. Biochem.3:297-307.
Canadian Council of Ministers of the Environment (CCME). 1991. Interim Canadian EnvironmentalQuality Criteria for Contaminated Sites. CCME EPC-CS34. Winnipeg, Manitoba.
Chaney, W.R., J.M. Kelly, and R.C. Strickland. 1978. "Influence of cadmium and zinc on carbondioxide evolution from litter and soil from a Black Oak forest." J. Environ. Qual. 7(1):115-119.
Cole, M.A. 1977. "Lead inhibition of enzyme synthesis in soil." Appl. Environ. Microbiol. 33(2):262-268.
Crommentuijr, T., J. Brils, and N.M. van Straaler. 1993. "Influence of cadmium on life-historycharacteristics of Folsomia candida (Willem) in an artificial soil substrate." Ecotoxicol. Environ.Sat. 26:216-227.
Curl, E.A., P.J. Edwards, C. Elliott, and J.P. Leahey. 1987. "The conjugation and accumulation ofmetabolites of cypermethrin by earthworms." Pesticide Sci. 20:207-222.
Debosz, K., H. Babich, and G. Stotzky. 1985. "Toxicity of lead to soil respiration: Mediation by clayminerals, humic acids, and compost." Bull. Environ. Contam. Toxicol. 35:517-524.
Dickinson, C.H., and G.J.F. Pugh. (ed). 1974. Biology of Plant Litter Decomposition. Vols 1 & 2.Academic Press, New York.
Dindal, D.L. 1990. Soil Biology Guide. John Wiley and Sons, New York.
Doelman, P., and L. Haanstra. 1989. "Short- and long-term effects of heavy metals on phosphataseactivity in soils: An ecological dose-response model approach." Biol. Fertil. Soils 8:235-241.
Doelman, P., and L. Haanstra. 1986. "Short- and long-term effects of heavy metals on urease activity."Biol. Fertil. Soils 2:213-218.
Doelman, P., and L. Haanstra. 1979. "Effect of lead on soil respiration and dehydrogenase activity." SoilBiol. Biochem. 11:475-479.
Donkin, S.G., and D.B. Dusenbery. 1993. "A soil toxicity test using the nematode Caenorhabditiselegans and an effective method of recovery." Arch. Environ. Contam. Toxicol. 25:145-151.
Edwards, C.A. 1992. "Testing the effects of chemicals on earthworms: The advantages and limitationsof field tests." In Ecotoxicology of Earthworms. P.W. Greig-Smith et al. (eds). Intercept Ltd. pp.75-84.
9-3
Efroymson, R. A., M. E. Will, and G. W. Suter II. 1997. Toxicological Benchmarks for ScreeningContaminants of Potential Concern for Effects on Terrestrial Plants. ES/ER/TM-85/R3, OakRidge National Laboratory, Environmental Sciences Division.
Environmental Protection Agency (EPA). 1986. Test Methods for Evaluating Solid Waste. Vol. 1:Laboratory Manual Physical/Chemical Methods. SW 846. Office of Solid Waste and EmergencyResponse. Washington, D.C.
Fischer, E., and L. Koszorus. 1992. "Sublethal effects, accumulation capacities and elimination rates ofAs, Hg and Se in the manure worm, Eisenia fetida (Oligochaeta, Lumbricidae)." Pedobiologia36:172-178.
Fitzgerald, D. G., K. A. Warner, R. P. Lanno, and D. G. Dixon. 1996. Assessing the effects of modifyingfactors on pentachlorophenol toxicity to earthworms: applications of body residues. Environ.Toxicol. Chem. 15:2299-2304.
Frankenberger, W.T., and M.A. Tabatabai. 1981. "Amidase activity in soils: IV. Effects of traceelements and pesticides." Soil Sci. Soc. Am. J. 45:1120-1125.
Giashuddin, M., and A.H. Cornfield. 1979. "Effects of adding nickel (as oxide) to soil on nitrogen andcarbon mineralisation at different pH values." Environ. Pollut. 19:67-70.
Giashuddin, M., and A.H. Cornfield. 1978. "ncubation study on effects of adding varying levels of nickel(as sulphate) on nitrogen mineralisation in soil." Environ. Pollut. 15:231-234.
Haanstra, L., and P. Doelman. 1991. "An ecological dose-response model approach to short- and long-term effects of heavy metals on arylsulfatse activity." Biol. Fertil. Soils 11:18-23.
Heimbach, F. 1992. "Effects of pesticides on earthworm populations: Comparison of results fromlaboratory and field tests." In Ecotoxicology of Earthworms. P.W. Greig-Smith et al. (eds).Intercept Ltd., U.K. pp. 100-106.
Heimbach, F. 1988. "A comparison of laboratory methods for toxicity testing with earthworms." InEarthworms in Waste and Environmental Management. C.A. Edwards and E.F. Neuhauser (eds).SPB Academic Pub., Netherlands. pp. 329-335.
Heimbach, F. 1984. "Correlations between three methods for determining the toxicity of chemicals toearthworms." Pestic Sci. 15:605-611.
Hopkin, S.P. 1989. Ecophysiology of Metals in Terrestrial Invertebrates. Elsevier Applied Science,New York.
Hopkin, S.P. and C.A.C. Hames. 1994. "Zinc, among a `cocktail' of metal pollutants, is responsible forthe absence of the terrestrial isopod Porcellia scaber from the vicinity of a primary smeltingworks." Ecotox. 2:68-78.
Juma, N.G., and M.A. Tabatabai. 1977. "Effects of trace elements on phosphatase activity in soils." SoilSci. Soc. Am. J. 41:343-346.
9-4
Kammenga, J.E., C.A.M. van Gestel, and J. Bakker. 1994. "Patterns of Sensitivity to Cadmium andPentachlorophenol (among nematode species from different taxonomic and ecological groups."Arch. Environ. Contam. Toxicol. 27:88-94.
Khalil, M. A., H. M. Abdel-Lateif, B. M. Bayoumi, N. M. van Straalen, and C. A. M. van Gestel. 1996.Effects of metals and metal mixtures on survival and cocoon production of the earthwormAporrectodea caliginosa. Pedobiologia 40:548-556.
Khan, D.H., and B. Frankland. 1984. "Cellulolytic activity and root biomass production in some metal-contaminated soils." Environ. Pollut. 33A:63-74.
Kokta, C. 1992. "Measuring effects of chemicals in the laboratory: Effect criteria and endpoints." InEcotoxicology of Earthworms. P.W. Greig-Smith et al. (eds). Intercept Ltd., U.K. pp. 55-62.
Korthals, G. W., A. D. Alexiev, T. M. Lexmond, J. E. Kammenga, and T. Bongers. 1996. Long-termeffects of copper and pH on the nematode community in an agroecosystem. Environ. Toxicol.Chem. 15:979–985.
Landa, E.R., and S.C. Fang. 1978. "Effect of mercuric chloride on carbon mineralization in soils." PlantSoil 49:179-183.
Laskowski, R., M. Maryanski, and M. Niklinska. 1994. "Effect of heavy metals and mineral nutrientson forest litter respiration rate." Environ. Pollut. 84:97-102.
Lee, K.E. 1985. Earthworms, Their Ecology and Relationships with Soils and Land Use. AcademicPress, New York.
Liang, C.N., and M.A. Tabatabai. 1977. "Effects of trace elements on nitrogen mineralisation in soils."Environ. Pollut. 12:141-147.
Lighthart, B., and H. Bond. 1976. "Design and preliminary results from soil/litter microcosms." Intern.J. Environ. Stud. 10:51-58.
Lighthart, B., H. Bond, and M. Ricard. 1977. Trace Elements Research Using Coniferous ForestSoil/Litter Microcosms. USEPA-600/3-77-091.
Long, R. E. and L. G. Morgan. 1990. The potential for biological effects of sediment-sorbedcontaminants tested in the national status and trends program. NOAA Technical MemorandumNOS OMA 52.
Ma, W.-C. 1982. "The influence of soil properties and worm-related factors on the concentration ofheavy metals in earthworms." Pedobiologia 24:109-119.
Ma, W.-C. 1984. "Sublethal toxic effects of copper on growth, reproduction and litter breakdownactivity in the earthworm Lumbricus rubellus, with observations on the influence of temperatureand soil pH." Environ. Pollut. Ser. A 33:207-219.
Ma, W.-C. 1988. "Toxicity of copper to lumbricid earthworms in sandy agricultural soils amended withCu-enriched organic waste materials." Ecol. Bull. 39:53-56.

9-5
Malecki, M.R., E.F. Neuhauser, and R.C. Loehr. 1982. "The effect of metals on the growth andreproduction of Eisenia foetida (Oligochaeta, Lumbricidae)." Pedobiologia 24:129-137.
Marigomez, J.A., E. Angulo, and V. Saez. 1986. "Feeding and growth responses to copper, zinc,mercury, and lead in the terrestrial gastropod Arion ater (Linne)." J. Moll. Stud. 52:68-78.
Molnar, L., E. Fischer, and M. Kallay. 1989. "Laboratory studies on the effect, uptake and distributionof chromium in Eisenia foetida (Annelida, Oligochaeta)." Zool. Anz. 223(1/2):57-66.
Morgan, A.J., J.E. Morgan, M. Turner, C. Winters, and A. Yarwood. 1993. "Metal relationships ofearthworms." In Ecotoxicology of Metals in Invertebrates. R. Dallinger and P.S. Rainbow (eds).Lewis Publishers, Boca Raton. pp. 333-358.
Nelson, D. W., and L. E. Sommers. 1982. "Total carbon, organic carbon, and organic matter." InMethods of Soil Analysis, Part 2. p. 574. ASA/SSSA. Madison, WI.
Newhauser, E.F. and C.A. Callahan. 1990. "Growth and Reproduction of the earthworm Eisenia fetidaexposed to sublethal concentrations of organic chemicals." Soil Biol. Biochem. 22(2):175-179.
Neuhauser, F., D.L. Kaplan, and R. Hartenstein. 1979. "Life history of the earthworm Eudriluseugeniae." Rev. Ecol. Biol. Sol. 16:525-534.
Neuhauser, E.F., M.R. Malecki, and R.C. Loehr. 1984. "Growth and reproduction of the earthwormEisenia fetida after exposure to sublethal concentrations of metals." Pedobiologia 27:89-97.
Neuhauser, E.F., R.C. Loehr, D.L. Milligan, and M.R. Malecki. 1985. "Toxicity of metals to theearthworm Eisenia fetida. Biol. Fertil. Soils 1:149-152.
Neuhauser, E.F., P.R. Durkin, M.R. Malecki, and M. Anatra. 1986. "Comparative toxicity of ten organicchemicals to four earthworm species." Comp. Biochem. Physiol. 83C(1):197-200.
Nottrot, F., E.N.G. Joosse, and N.M. van Straalen. 1987. "Sublethal effects of iron and manganese soilpollution on Orchesella cincta (Collembola)." Pedobiologia 30:45-53.
Parmalee, R.W., R.S. Wentsel, C.T. Phillips, M. Simini, and R.T. Checkai. 1993. "Soil microcosm fortesting the effects of chemical pollutants on soil fauna communities and trophic structure." Environ.Toxicol. Chem. 12:1477-1486.
Premi, P.R., and A.H. Cornfield. 1969. "Effects of addition of copper, manganese, zinc and chromiumcompounds on ammonification and nitrification during incubation of soil." Plant Soil 31(2):345-352.
Premi, P.R., and A.H. Cornfield. 1969/1970. "Effects of copper, zinc and chromium on immobilizationand subsequent re-mobilization of nitrogen during incubation of soil treated with sucrose.:Geoderma 3:233-237.
Quraishi, M.S.I., and A.H. Cornfield. 1973. "Incubation study of nitrogen mineralisation and nitrificationin relation to soil pH and level of copper addition." Environ. Pollut. 4:159-163.
9-6
Reber, H.H. 1989. "Threshold levels of cadmium for soil respiration and growth of spring wheat(Triticum aestivum L.) and difficulties with their determination." Biol. Fertil. Soils 7:152-157.
Reinecke, A.J. 1992. "A review of ecotoxicological test methods using earthworms." In Ecotoxicologyof Earthworms. P.W. Greig-Smith et al. (eds). Intercept Ltd., U.K. pp. 7-19.
Rogers, J.E., and S.W. Li. 1985. "Effect of metals and other inorganic ions on soil microbial activity:Soil dehydrogenase assay as a simple toxicity test." Bull. Environ. Contam. Toxicol. 34:858-865.
Ross, D.S., R.E. Sjogren, and R.J. Bartlett. 1981. "Behavior of chromium in soils: IV. Toxicity tomicroorganisms." J. Environ. Qual. 10(2):145-148.
Russell, L.K., J.I. De Haven, and R.P. Botts. 1981. "Toxic effects of cadmium on the garden snail (Helixaspersa)." Bull. Environ. Contam. Toxico.l 26:634-640.
Shacklette, H.T., and J.G. Boerngen. 1984. Element Concentrations in Soils and Other Surficial
Materials of the Coterminous United States. USGS Prof. Paper 1270. US Govt Printing Office,Washington.
Smit, C. E., and C. A. M. van Gestel. 1996. Comparison of the toxicity of zinc for the springtailFolsomia candida in artificially contaminated and polluted field soils. Appl. Soil Ecol. 3:127-136.
Soni, R., and S.A. Abbasi. 1981. "Mortality and reproduction in earthworms Pheretima posthumaexposed to chromium (VI)." Intern.J Environ. Stud. 17:147-149.
Spurgeon, D. J., and S. P. Hopkin. 1995. Extrapolation of the laboratory-based OECD earthwormtoxicity test to metal-contaminated field sites. Ecotoxicology 4:190-205.
Spurgeon, D. J., and S. P. Hopkin. 1996a. The effects of metal contamination on earthworm populationsaround a smelting works: quantifying species effects. Appl. Soil Ecol. 4:147-160.
Spurgeon, D. J., and S. P. Hopkin. 1996b. Effects of variations in organic matter content and pH of soilson the availability and toxicity of zinc to the earthworm Eisenia fetida. Pedobiologia 40:80-96.
Spurgeon, D.J., S.P. Hopkin, and D.T. Jones. 1994. "Effects of Cadmium, Copper, Lead, and Zinc onGrowth, Reproduction, and Survival of the Earthworm Eisenia fetida (Savigny): Assessing theEnvironmental Impact of Point-source Metal Contamination in Terrestrial Ecosystems." Environ.Pollut. 84:123-130.
Stenersen, J. 1992. "Uptake and metabolism of xenobiotics by earthworms." In Ecotoxicology ofEarthworms. P.W. Greig-Smith et al. (eds). Intercept Ltd., U.K. pp. 129-138.
Streit, B. 1984. Effects of high copper concentrations on soil invertebrates (earthworms and oribatidmites): Experimental results and a model. Oecologia 64:381-388.
Streit, B, and A. Jaggy. 1983. "Effect of soil type on copper toxicity and copper uptake in Octolasiumcyaneum (Lumbricidae)." In New Trends in Soil Biology. Ph. Lebrun et al. (eds). pp. 569-575.Ottignies-Louvain-la-Neuve.
9-7
Suter, G. W., II, and F.E. Sharples. 1984. "Examination of a proposed test for effects of toxicants on soilmicrobial processe"s. In Toxicity Screening Procedures Using Bacterial Systems. Marcel Dekker,Inc., New York. pp. 327-344.
Suter, G. W., II, B. E. Sample, D. S. Jones, T. L. Ashwood, and J. M. Loar. 1995. Approach andStrategy for Performing Ecological Risk Assessments for the U. S. Department of Energy’s OakRidge Reservation: 1995 Revision. ES/ER/TM-33/R2. Oak Ridge National Laboratory,Environmental Sciences Division.
Tabatabai, M.A. 1982. "Soil enzymes." In Methods of Soil Analysis, Part 2. Chemical andMicrobiological Properties. pp. 903-948. ASA/SSSA, Madison, WI.
Tomlin, A.D. 1992. "Behavior as a source of earthworm susceptibility to ecotoxicants." InEcotoxicology of Earthworms. P.W. Greig-Smith et al. (eds). Intercept Ltd., U.K. pp. 116-125.
Tyler, G. 1976. "Influence of vanadium on soil phosphatase activity." J. Environ. Qual. 5(2):216-217.
van Beelen, P., and A.K. Fleuren-Kemila. 1993. "Toxic effects of pentachlorophenol and other pollutantson the mineralization of acetate in several soils." Ecotoxicol. Environ. Saf. 26:10-17.
van Brummelen, T.C., and S.C. Stuijfzand. 1993. "Effects of benzo(a)pyrene on survival, growth andenergy reserves in terrestrial isopods Oniscus asellus and Porcellio scaber." Sci. Total. Environ.Suppl:921-930.
van den Berg, R., C.A.J. Denneman, and J.M. Roels. 1993. "Risk assessment of contaminated soil:Proposal for adjusted, toxicologically based Dutch soil clean-up criteria." In F.Arendt, G.J.Annokkee, R. Bosman, and W.J. van den Brink (eds) Contaminated Soil '93. Kluwer AcademicPub., Netherlands.
van Faassen, H.G. 1973. "Effects of mercury compounds on soil microbes." Plant Soil 38:485-487.
van Gestel, C.A.M. 1992. "The influence of soil characteristics on the toxicity of chemicals forearthworms: A review." In Ecotoxicology of Earthworms. P.W. Greig-Smith et al. (eds). InterceptLtd., U.K. pp. 44-54.
van Gestel, C.A.M. and W.-C. Ma. 1993. "Development of QSAR's in soil ecotoxicology: Earthwormtoxicity and soil sorption of chlorophenols, chlorobenzenes and dichloroaniline." Water Air SoilPollut. 69:265-276.
van Gestel, C.A.M. and W.-C. Ma. 1988. "Toxicity and bioaccumulation of chlorophenols inearthworms, in relation to bioavailability in soil." Ecotoxicol. Environ. Saf. 15:289-297.
van Gestel, C.A.M. and W.-C. Ma. 1990. "An approach to quantitative structure-activity relationships(QSARs) in earthworm toxicity." Chemosphere 21(8):1023-1033.
van Gestel, C.A.M., and W.A. van Dis. 1988. "The influence of soil characteristics on the toxicity offour chemicals to the earthworm Eisenia fetida andrei (Oligochaeta)." Biol. Fertil. Soils 6:262-265.
9-8
van Gestel, C.A.M., W.A. van Dis, E.M. van Breemen, and P.M. Sparenburg. 1989. "Development ofa standardized reproduction toxicity test with the earthworm species Eisenia fetida andrei usingcopper, pentachlorophenol, and 2,4-dichloroaniline." Ecotoxicol. Environ. Saf. 18:305-312.
van Gestel, C.A.M., W.A. van Dis, E.M. Dirven-van Breemen, P.M. Sparenburg, and R. Baerselman.1991a. "Influence of cadmium, copper, and pentachlorophenol on growth and sexual developmentof Eisenia andrei (Oligochaeta; Annelida)." Biol. Fertil. Soils 12:117-121.
van Gestel, C.A.M., W.-C. Ma, and C.E. Smit. 1991b. "Development of QSAR's in terrestrialecotoxicology: Earthworm toxicity and soil sorption of chlorophenols, chlorobenzenes anddichloroaniline." Sci. Total. Environ. 109/110:589-604.
van Gestel, C.A.M., E.M. Dirven-van Breemen, and R. Baerselman. 1993. "Accumulation andelimination of cadmium, chromium and zinc and effects on growth and reproduction in Eiseniaandrei (Oligochaeta; Annelida)." Sci. Total Environ. Suppl.:585-597.
van Gestel, C.A.M., E.M. Dirven-van Breemen, R. Baerselman, H.J.B. Emans, J.A.M. Janssen, R.Postuma, and P.J.M. van Vliet. 1992. "Comparison of sublethal and lethal criteria for nine differentchemicals in standardized toxicity tests using the earthworm Eisenia andrei." Ecotoxicol. Environ.Saf. 23:206-220.
van Kessel, W.H.M., R.W.B. Zaalberg, and W. Seinen. 1989. "Testing environmental pollutants on soilorganisms: A simple assay to investigate the toxicity of environmental pollutants on soil organisms,using CdCl and nematodes." Ecotoxicol. Environ. Sat. 18:181-190.2
van Rhee, J.A. 1975. "Copper contamination effects on earthworms by disposal of pig waste inpastures." Progress in Soil Zoology 1975:451-457.
van Straalen, N.M. 1991. "Soil and sediment quality criteria derived from invertebrate toxicity data." InMetal Ecotoxicology, Concepts & Applications. M.C. Newman and A.W. McIntosh (eds). LewisPublishers, Boca Raton. pp. 427-440.
van Straalen, N.M., and R.A. Verweij. 1991. "Effects of benzo(a)pyrene on food assimilation andgrowth efficiency in Porcellio scaber (Isopoda)." Bull. Environ. Contam. Toxicol. 46:134-140.
van Straalen, N.M., J.H.M. Schobben, and R.G.M. de Goede. 1989. "Population consequences ofcadmium toxicity in soil microarthropods." Ecotoxicol. Environ. Saf. 17:190-204.
van Wensem, J. 1989. "A terrestrial micro-ecosystem for measuring effects of pollutants on isopod-mediated litter decomposition." Hydrobiologia 188/189:507-516.
van Wensem, J., and T. Adema. 1991. "Effects of fluoride on soil fauna mediated litter decomposition."Environ. Pollut. 72:239-251.
Walton, B.T., T.A. Anderson, M.S. Hendricks, and S.S. Talmage. 1989. Physiochemical properties aspredictors of organic chemical effects on soil microbial respiration. Environ Toxicol Chem 8:53-63.
Watkins, D.R., J.T. Ammons, J.L. Branson, B.B. Burgoa, et al. 1993. Final Report on the BackgroundSoil Characterization Project at the Oak Ridge Reservation, Oak Ridge Tennessee, Vols. 1 and2. EE/ER/TM-84. Oak Ridge National Laboratory, Environmental Restoration Division.

9-9
Wilson, D.O. 1977. "Nitrification in three soils amended with zinc sulfate." Soil Biol. Biochem. 9:277-280.
APPENDIX A
TOXICITY DATA FOR EARTHWORMS
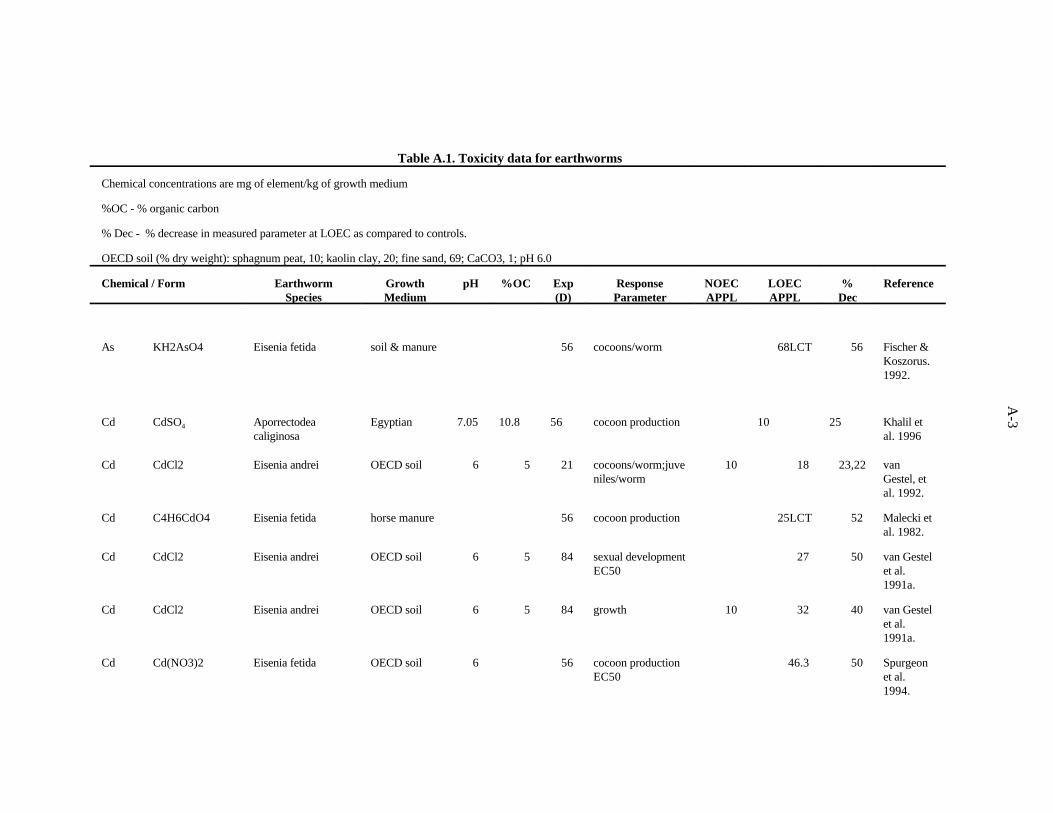
A-3
Table A.1. Toxicity data for earthworms
Chemical concentrations are mg of element/kg of growth medium
%OC - % organic carbon
% Dec - % decrease in measured parameter at LOEC as compared to controls.
OECD soil (% dry weight): sphagnum peat, 10; kaolin clay, 20; fine sand, 69; CaCO3, 1; pH 6.0
Chemical / Form Earthworm Growth pH %OC Exp Response NOEC LOEC % ReferenceSpecies Medium (D) Parameter APPL APPL Dec
As KH2AsO4 Eisenia fetida soil & manure 56 cocoons/worm 68LCT 56 Fischer &Koszorus.1992.
Cd CdSO Aporrectodea Egyptian 7.05 10.8 56 cocoon production 10 25 Khalil et4
caliginosa al. 1996
Cd CdCl2 Eisenia andrei OECD soil 6 5 21 cocoons/worm;juve 10 18 23,22 vanniles/worm Gestel, et
al. 1992.
Cd C4H6CdO4 Eisenia fetida horse manure 56 cocoon production 25LCT 52 Malecki etal. 1982.
Cd CdCl2 Eisenia andrei OECD soil 6 5 84 sexual development 27 50 van GestelEC50 et al.
1991a.
Cd CdCl2 Eisenia andrei OECD soil 6 5 84 growth 10 32 40 van Gestelet al.1991a.
Cd Cd(NO3)2 Eisenia fetida OECD soil 6 56 cocoon production 46.3 50 SpurgeonEC50 et al.
1994.
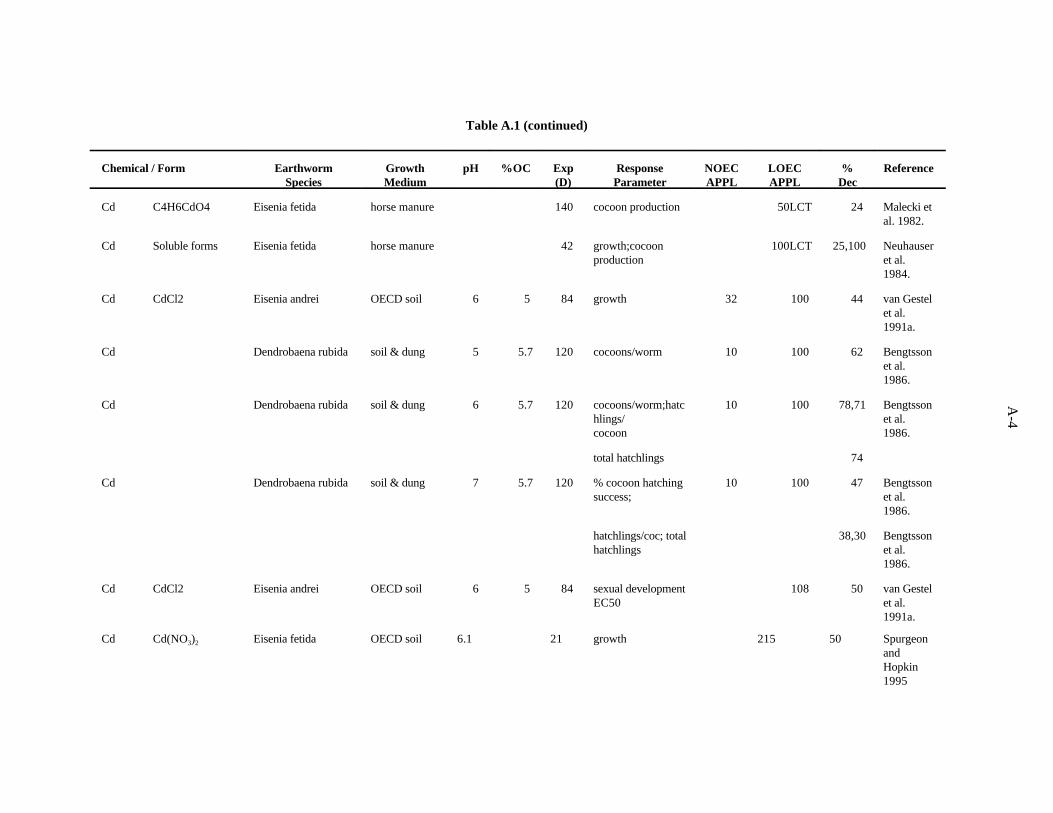
A-4
Table A.1 (continued)
Chemical / Form Earthworm Growth pH %OC Exp Response NOEC LOEC % ReferenceSpecies Medium (D) Parameter APPL APPL Dec
Cd C4H6CdO4 Eisenia fetida horse manure 140 cocoon production 50LCT 24 Malecki etal. 1982.
Cd Soluble forms Eisenia fetida horse manure 42 growth;cocoon 100LCT 25,100 Neuhauserproduction et al.
1984.
Cd CdCl2 Eisenia andrei OECD soil 6 5 84 growth 32 100 44 van Gestelet al.1991a.
Cd Dendrobaena rubida soil & dung 5 5.7 120 cocoons/worm 10 100 62 Bengtssonet al.1986.
Cd Dendrobaena rubida soil & dung 6 5.7 120 cocoons/worm;hatc 10 100 78,71 Bengtssonhlings/ et al.cocoon 1986.
total hatchlings 74
Cd Dendrobaena rubida soil & dung 7 5.7 120 % cocoon hatching 10 100 47 Bengtssonsuccess; et al.
1986.
hatchlings/coc; total 38,30 Bengtssonhatchlings et al.
1986.
Cd CdCl2 Eisenia andrei OECD soil 6 5 84 sexual development 108 50 van GestelEC50 et al.
1991a.
Cd Cd(NO ) Eisenia fetida OECD soil 6.1 21 growth 215 50 Spurgeon3 2
andHopkin1995
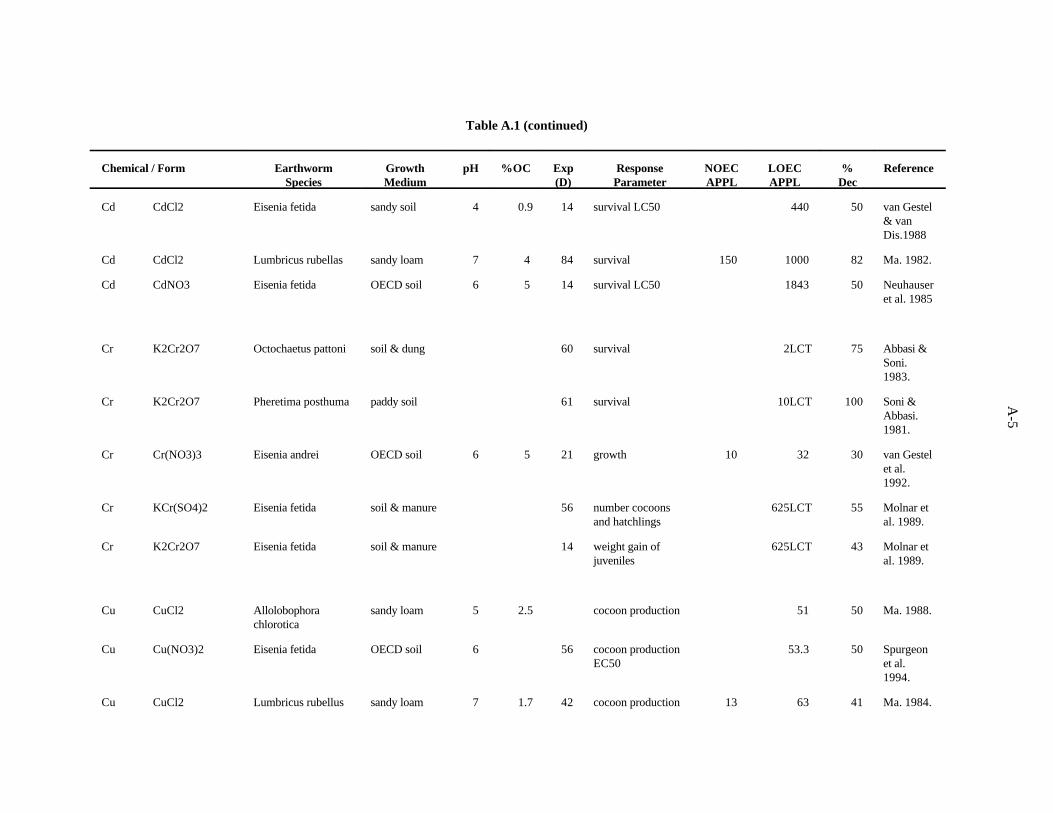
A-5
Table A.1 (continued)
Chemical / Form Earthworm Growth pH %OC Exp Response NOEC LOEC % ReferenceSpecies Medium (D) Parameter APPL APPL Dec
Cd CdCl2 Eisenia fetida sandy soil 4 0.9 14 survival LC50 440 50 van Gestel& vanDis.1988
Cd CdCl2 Lumbricus rubellas sandy loam 7 4 84 survival 150 1000 82 Ma. 1982.
Cd CdNO3 Eisenia fetida OECD soil 6 5 14 survival LC50 1843 50 Neuhauseret al. 1985
Cr K2Cr2O7 Octochaetus pattoni soil & dung 60 survival 2LCT 75 Abbasi &Soni.1983.
Cr K2Cr2O7 Pheretima posthuma paddy soil 61 survival 10LCT 100 Soni &Abbasi.1981.
Cr Cr(NO3)3 Eisenia andrei OECD soil 6 5 21 growth 10 32 30 van Gestelet al.1992.
Cr KCr(SO4)2 Eisenia fetida soil & manure 56 number cocoons 625LCT 55 Molnar etand hatchlings al. 1989.
Cr K2Cr2O7 Eisenia fetida soil & manure 14 weight gain of 625LCT 43 Molnar etjuveniles al. 1989.
Cu CuCl2 Allolobophora sandy loam 5 2.5 cocoon production 51 50 Ma. 1988.chlorotica
Cu Cu(NO3)2 Eisenia fetida OECD soil 6 56 cocoon production 53.3 50 SpurgeonEC50 et al.
1994.
Cu CuCl2 Lumbricus rubellus sandy loam 7 1.7 42 cocoon production 13 63 41 Ma. 1984.
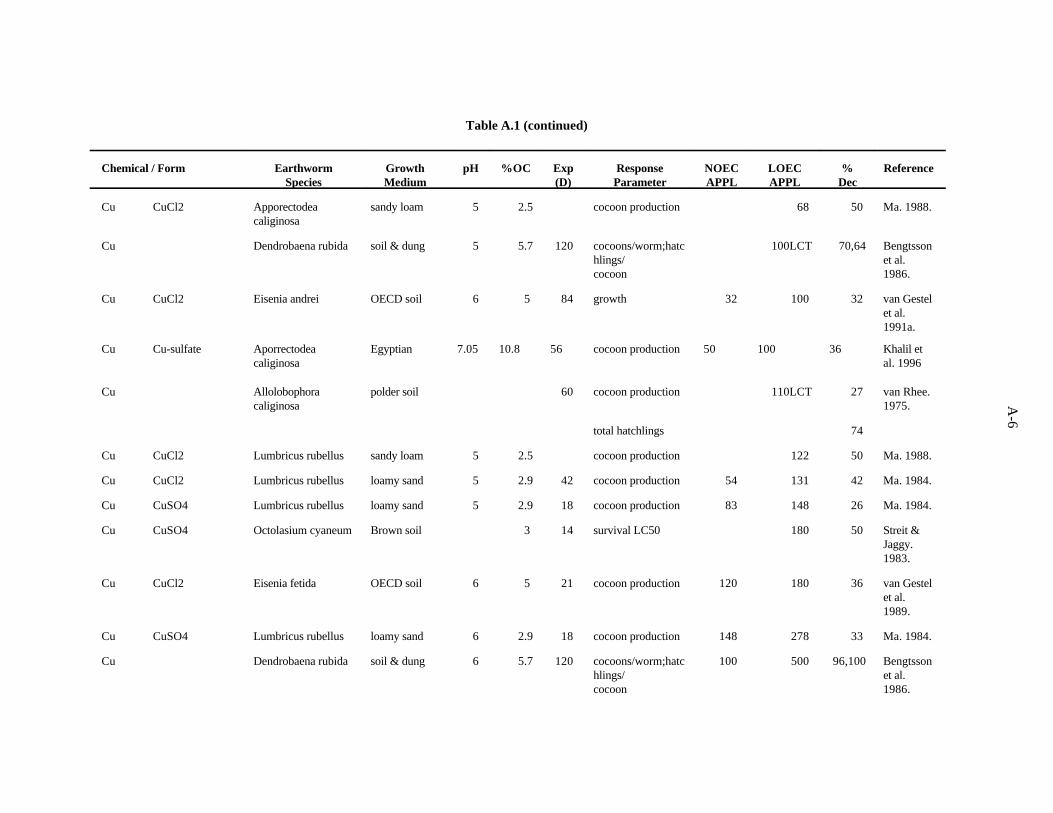
A-6
Table A.1 (continued)
Chemical / Form Earthworm Growth pH %OC Exp Response NOEC LOEC % ReferenceSpecies Medium (D) Parameter APPL APPL Dec
Cu CuCl2 Apporectodea sandy loam 5 2.5 cocoon production 68 50 Ma. 1988.caliginosa
Cu Dendrobaena rubida soil & dung 5 5.7 120 cocoons/worm;hatc 100LCT 70,64 Bengtssonhlings/ et al.cocoon 1986.
Cu CuCl2 Eisenia andrei OECD soil 6 5 84 growth 32 100 32 van Gestelet al.1991a.
Cu Cu-sulfate Aporrectodea Egyptian 7.05 10.8 56 cocoon production 50 100 36 Khalil etcaliginosa al. 1996
Cu Allolobophora polder soil 60 cocoon production 110LCT 27 van Rhee.caliginosa 1975.
total hatchlings 74
Cu CuCl2 Lumbricus rubellus sandy loam 5 2.5 cocoon production 122 50 Ma. 1988.
Cu CuCl2 Lumbricus rubellus loamy sand 5 2.9 42 cocoon production 54 131 42 Ma. 1984.
Cu CuSO4 Lumbricus rubellus loamy sand 5 2.9 18 cocoon production 83 148 26 Ma. 1984.
Cu CuSO4 Octolasium cyaneum Brown soil 3 14 survival LC50 180 50 Streit &Jaggy.1983.
Cu CuCl2 Eisenia fetida OECD soil 6 5 21 cocoon production 120 180 36 van Gestelet al.1989.
Cu CuSO4 Lumbricus rubellus loamy sand 6 2.9 18 cocoon production 148 278 33 Ma. 1984.
Cu Dendrobaena rubida soil & dung 6 5.7 120 cocoons/worm;hatc 100 500 96,100 Bengtssonhlings/ et al.cocoon 1986.
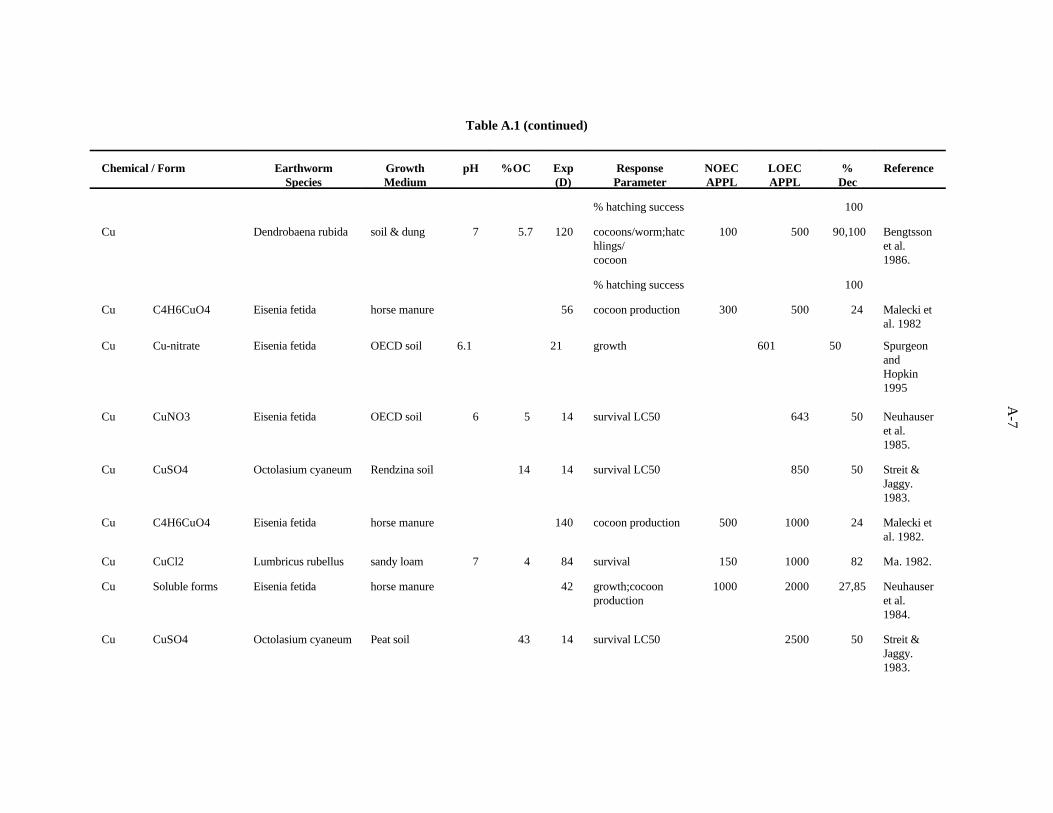
A-7
Table A.1 (continued)
Chemical / Form Earthworm Growth pH %OC Exp Response NOEC LOEC % ReferenceSpecies Medium (D) Parameter APPL APPL Dec
% hatching success 100
Cu Dendrobaena rubida soil & dung 7 5.7 120 cocoons/worm;hatc 100 500 90,100 Bengtssonhlings/ et al.cocoon 1986.
% hatching success 100
Cu C4H6CuO4 Eisenia fetida horse manure 56 cocoon production 300 500 24 Malecki etal. 1982
Cu Cu-nitrate Eisenia fetida OECD soil 6.1 21 growth 601 50 SpurgeonandHopkin1995
Cu CuNO3 Eisenia fetida OECD soil 6 5 14 survival LC50 643 50 Neuhauseret al.1985.
Cu CuSO4 Octolasium cyaneum Rendzina soil 14 14 survival LC50 850 50 Streit &Jaggy.1983.
Cu C4H6CuO4 Eisenia fetida horse manure 140 cocoon production 500 1000 24 Malecki etal. 1982.
Cu CuCl2 Lumbricus rubellus sandy loam 7 4 84 survival 150 1000 82 Ma. 1982.
Cu Soluble forms Eisenia fetida horse manure 42 growth;cocoon 1000 2000 27,85 Neuhauserproduction et al.
1984.
Cu CuSO4 Octolasium cyaneum Peat soil 43 14 survival LC50 2500 50 Streit &Jaggy.1983.
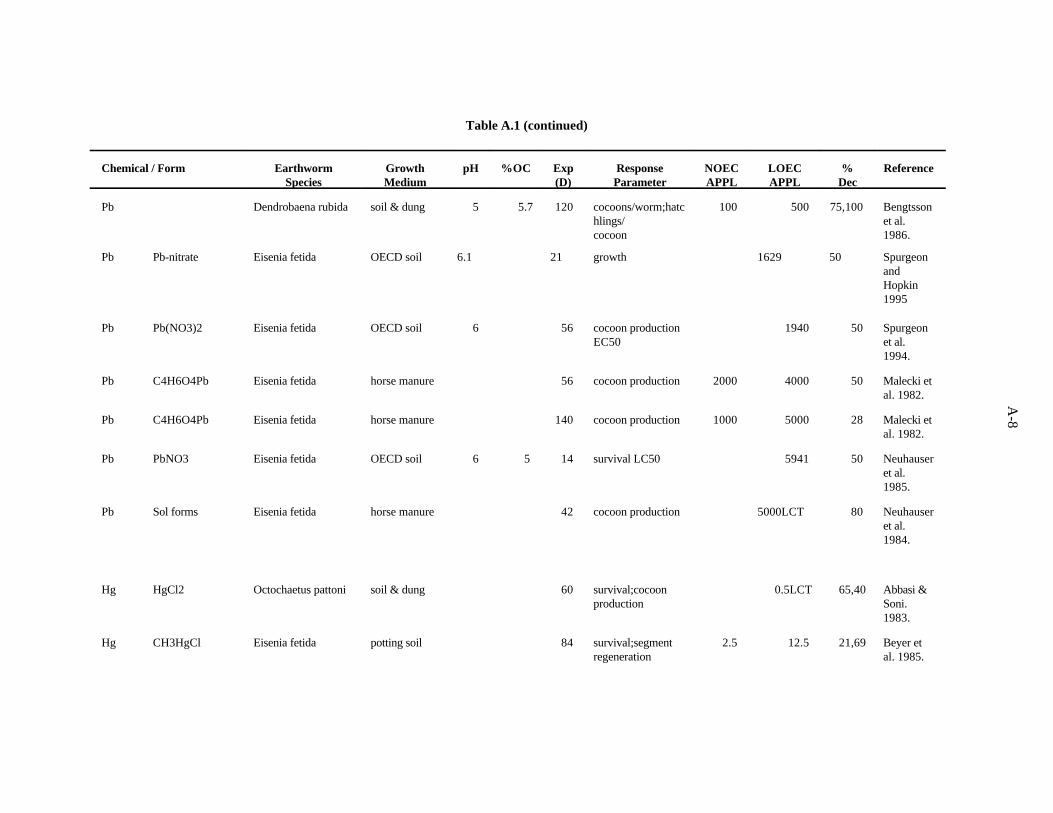
A-8
Table A.1 (continued)
Chemical / Form Earthworm Growth pH %OC Exp Response NOEC LOEC % ReferenceSpecies Medium (D) Parameter APPL APPL Dec
Pb Dendrobaena rubida soil & dung 5 5.7 120 cocoons/worm;hatc 100 500 75,100 Bengtssonhlings/ et al.cocoon 1986.
Pb Pb-nitrate Eisenia fetida OECD soil 6.1 21 growth 1629 50 SpurgeonandHopkin1995
Pb Pb(NO3)2 Eisenia fetida OECD soil 6 56 cocoon production 1940 50 SpurgeonEC50 et al.
1994.
Pb C4H6O4Pb Eisenia fetida horse manure 56 cocoon production 2000 4000 50 Malecki etal. 1982.
Pb C4H6O4Pb Eisenia fetida horse manure 140 cocoon production 1000 5000 28 Malecki etal. 1982.
Pb PbNO3 Eisenia fetida OECD soil 6 5 14 survival LC50 5941 50 Neuhauseret al.1985.
Pb Sol forms Eisenia fetida horse manure 42 cocoon production 5000LCT 80 Neuhauseret al.1984.
Hg HgCl2 Octochaetus pattoni soil & dung 60 survival;cocoon 0.5LCT 65,40 Abbasi &production Soni.
1983.
Hg CH3HgCl Eisenia fetida potting soil 84 survival;segment 2.5 12.5 21,69 Beyer etregeneration al. 1985.
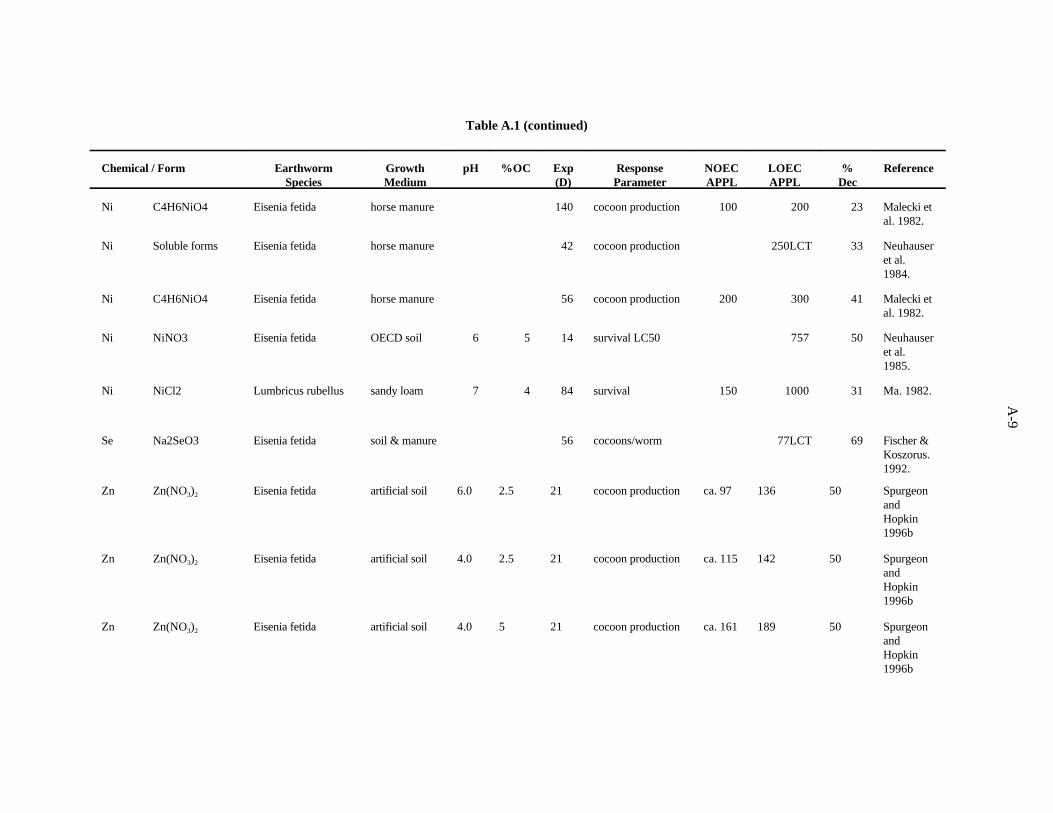
A-9
Table A.1 (continued)
Chemical / Form Earthworm Growth pH %OC Exp Response NOEC LOEC % ReferenceSpecies Medium (D) Parameter APPL APPL Dec
Ni C4H6NiO4 Eisenia fetida horse manure 140 cocoon production 100 200 23 Malecki etal. 1982.
Ni Soluble forms Eisenia fetida horse manure 42 cocoon production 250LCT 33 Neuhauseret al.1984.
Ni C4H6NiO4 Eisenia fetida horse manure 56 cocoon production 200 300 41 Malecki etal. 1982.
Ni NiNO3 Eisenia fetida OECD soil 6 5 14 survival LC50 757 50 Neuhauseret al.1985.
Ni NiCl2 Lumbricus rubellus sandy loam 7 4 84 survival 150 1000 31 Ma. 1982.
Se Na2SeO3 Eisenia fetida soil & manure 56 cocoons/worm 77LCT 69 Fischer &Koszorus.1992.
Zn Zn(NO ) Eisenia fetida artificial soil 6.0 2.5 21 cocoon production ca. 97 136 50 Spurgeon3 2
andHopkin1996b
Zn Zn(NO ) Eisenia fetida artificial soil 4.0 2.5 21 cocoon production ca. 115 142 50 Spurgeon3 2
andHopkin1996b
Zn Zn(NO ) Eisenia fetida artificial soil 4.0 5 21 cocoon production ca. 161 189 50 Spurgeon3 2
andHopkin1996b
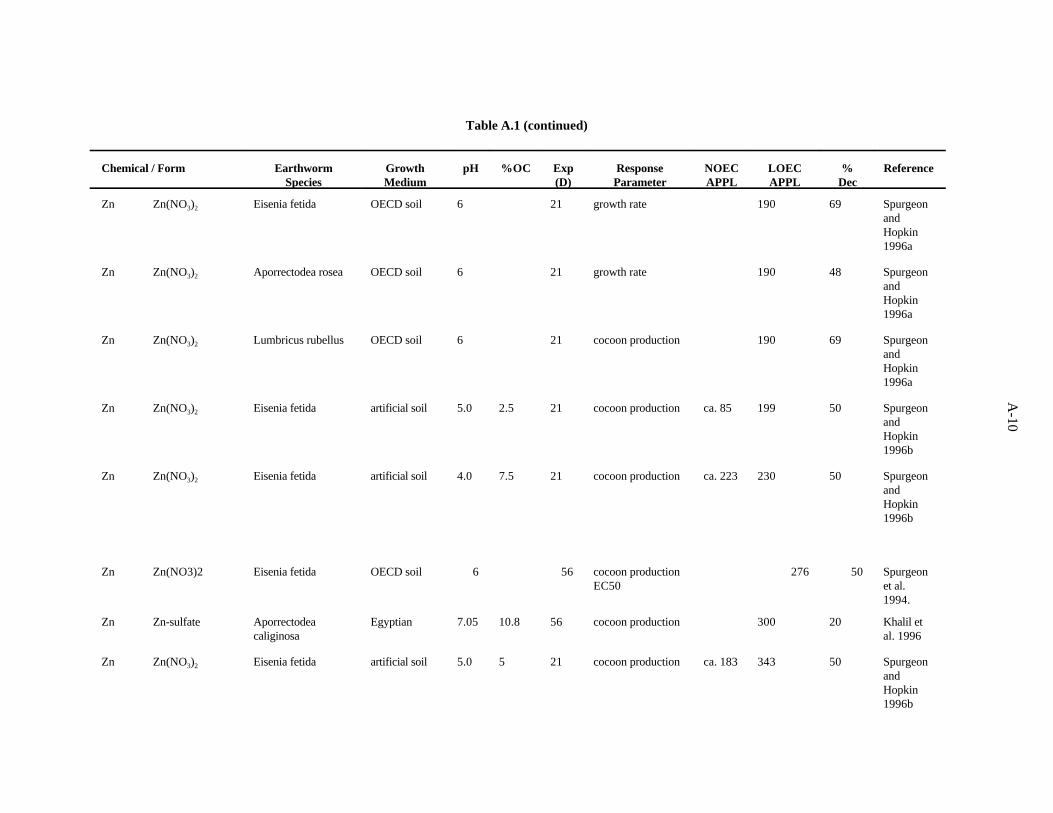
A-10
Table A.1 (continued)
Chemical / Form Earthworm Growth pH %OC Exp Response NOEC LOEC % ReferenceSpecies Medium (D) Parameter APPL APPL Dec
Zn Zn(NO ) Eisenia fetida OECD soil 6 21 growth rate 190 69 Spurgeon3 2
andHopkin1996a
Zn Zn(NO ) Aporrectodea rosea OECD soil 6 21 growth rate 190 48 Spurgeon3 2
andHopkin1996a
Zn Zn(NO ) Lumbricus rubellus OECD soil 6 21 cocoon production 190 69 Spurgeon3 2
andHopkin1996a
Zn Zn(NO ) Eisenia fetida artificial soil 5.0 2.5 21 cocoon production ca. 85 199 50 Spurgeon3 2
andHopkin1996b
Zn Zn(NO ) Eisenia fetida artificial soil 4.0 7.5 21 cocoon production ca. 223 230 50 Spurgeon3 2
andHopkin1996b
Zn Zn(NO3)2 Eisenia fetida OECD soil 6 56 cocoon production 276 50 SpurgeonEC50 et al.
1994.
Zn Zn-sulfate Aporrectodea Egyptian 7.05 10.8 56 cocoon production 300 20 Khalil etcaliginosa al. 1996
Zn Zn(NO ) Eisenia fetida artificial soil 5.0 5 21 cocoon production ca. 183 343 50 Spurgeon3 2
andHopkin1996b

A-11
Table A.1 (continued)
Chemical / Form Earthworm Growth pH %OC Exp Response NOEC LOEC % ReferenceSpecies Medium (D) Parameter APPL APPL Dec
Zn Zn(NO ) Eisenia fetida artificial soil 6.0 5 21 cocoon production 462 50 Spurgeon3 2
andHopkin1996b
Zn Zn(NO ) Eisenia fetida artificial soil 5.0 7.5 21 cocoon production ca. 414 548 50 Spurgeon3 2
andHopkin1996b
Zn ZnCl2 Eisenia andrei OECD soil 6 5 21 cocoons/worm; 320 560 31,42 van Gesteljuveniles/worm et al.
1993.
Zn Zn(NO ) Eisenia fetida artificial soil 6.0 7.5 21 cocoon production ca. 484 592 50 Spurgeon3 2
andHopkin1996b
Zn ZnNO3 Eisenia fetida OECD soil 14 survival LC50 662 50 Neuhauseret al.1985.
Zn Zn(NO ) Eisenia fetida OECD soil 6.1 21 growth 1078 50 Spurgeon3 2
andHopkin1995a
Zn Allolobophora polder soil body weight; cocoon 1100LCT 53,100, van Rhee.caliginosa production; mortality; 22, 100 1975.
sexual development
Zn C4H6O4Zn Eisenia fetida horse manure 56 cocoon production 1000 2000 36 Malecki etal. 1982.
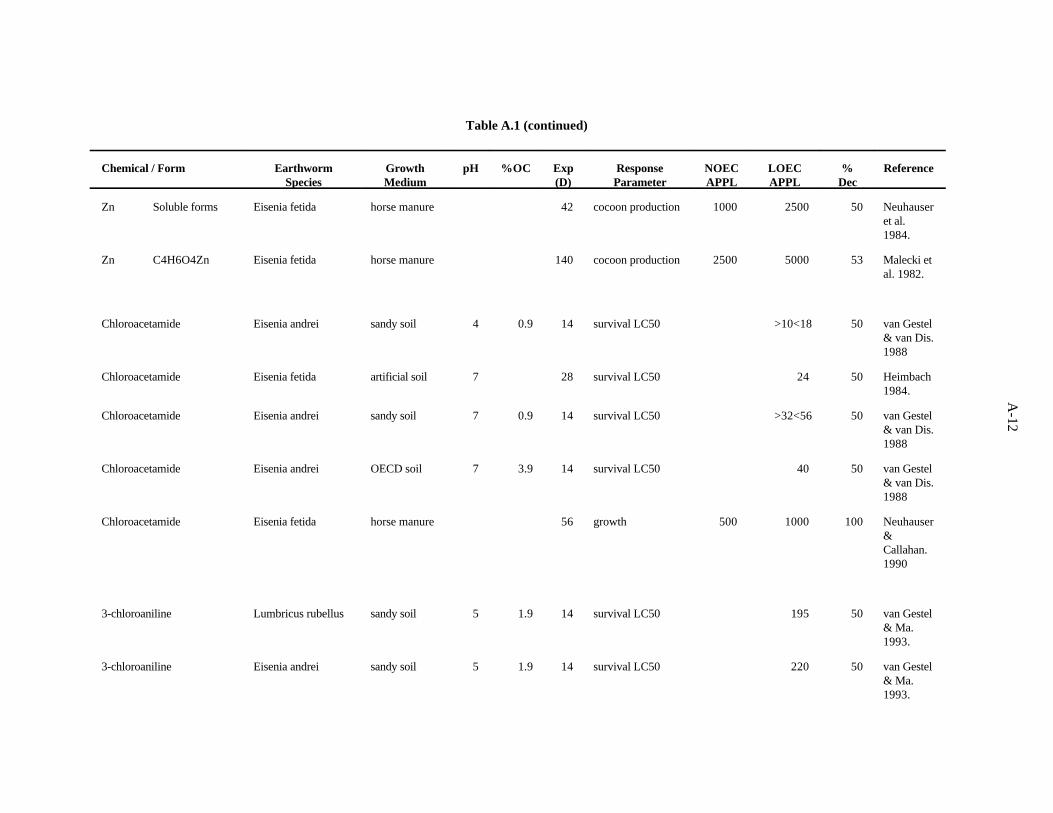
A-12
Table A.1 (continued)
Chemical / Form Earthworm Growth pH %OC Exp Response NOEC LOEC % ReferenceSpecies Medium (D) Parameter APPL APPL Dec
Zn Soluble forms Eisenia fetida horse manure 42 cocoon production 1000 2500 50 Neuhauseret al.1984.
Zn C4H6O4Zn Eisenia fetida horse manure 140 cocoon production 2500 5000 53 Malecki etal. 1982.
Chloroacetamide Eisenia andrei sandy soil 4 0.9 14 survival LC50 >10<18 50 van Gestel& van Dis.1988
Chloroacetamide Eisenia fetida artificial soil 7 28 survival LC50 24 50 Heimbach1984.
Chloroacetamide Eisenia andrei sandy soil 7 0.9 14 survival LC50 >32<56 50 van Gestel& van Dis.1988
Chloroacetamide Eisenia andrei OECD soil 7 3.9 14 survival LC50 40 50 van Gestel& van Dis.1988
Chloroacetamide Eisenia fetida horse manure 56 growth 500 1000 100 Neuhauser&Callahan.1990
3-chloroaniline Lumbricus rubellus sandy soil 5 1.9 14 survival LC50 195 50 van Gestel& Ma.1993.
3-chloroaniline Eisenia andrei sandy soil 5 1.9 14 survival LC50 220 50 van Gestel& Ma.1993.
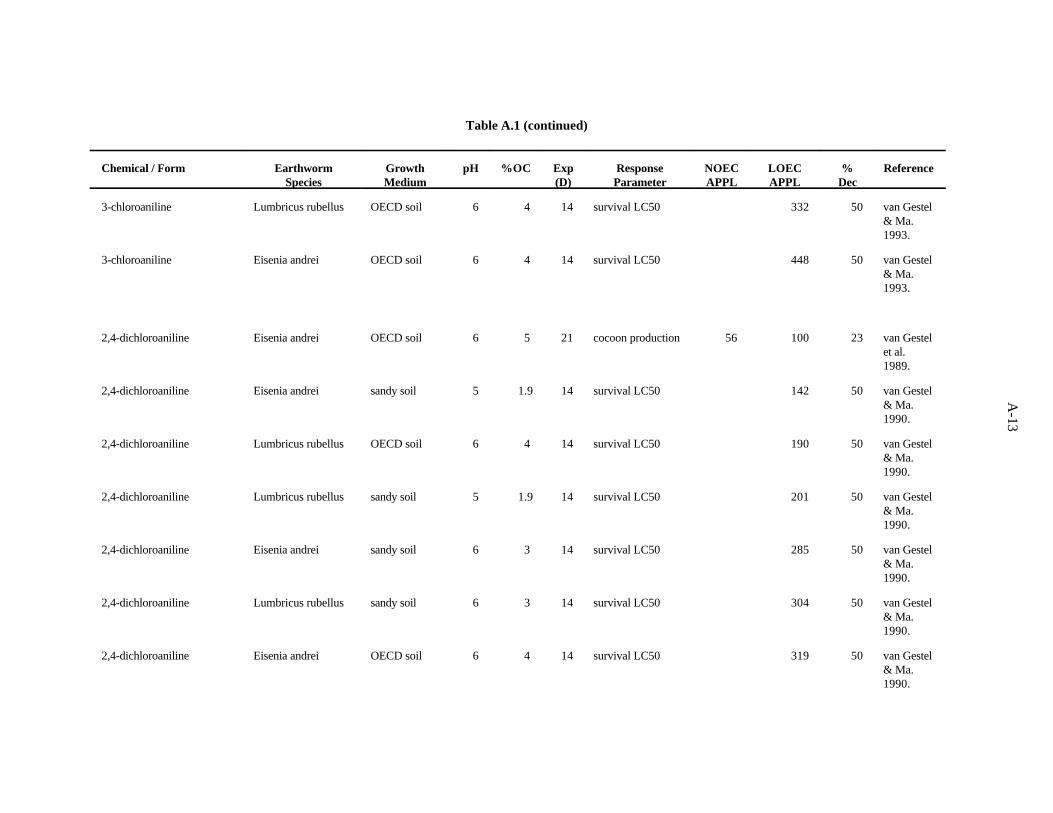
A-13
Table A.1 (continued)
Chemical / Form Earthworm Growth pH %OC Exp Response NOEC LOEC % ReferenceSpecies Medium (D) Parameter APPL APPL Dec
3-chloroaniline Lumbricus rubellus OECD soil 6 4 14 survival LC50 332 50 van Gestel& Ma.1993.
3-chloroaniline Eisenia andrei OECD soil 6 4 14 survival LC50 448 50 van Gestel& Ma.1993.
2,4-dichloroaniline Eisenia andrei OECD soil 6 5 21 cocoon production 56 100 23 van Gestelet al.1989.
2,4-dichloroaniline Eisenia andrei sandy soil 5 1.9 14 survival LC50 142 50 van Gestel& Ma.1990.
2,4-dichloroaniline Lumbricus rubellus OECD soil 6 4 14 survival LC50 190 50 van Gestel& Ma.1990.
2,4-dichloroaniline Lumbricus rubellus sandy soil 5 1.9 14 survival LC50 201 50 van Gestel& Ma.1990.
2,4-dichloroaniline Eisenia andrei sandy soil 6 3 14 survival LC50 285 50 van Gestel& Ma.1990.
2,4-dichloroaniline Lumbricus rubellus sandy soil 6 3 14 survival LC50 304 50 van Gestel& Ma.1990.
2,4-dichloroaniline Eisenia andrei OECD soil 6 4 14 survival LC50 319 50 van Gestel& Ma.1990.
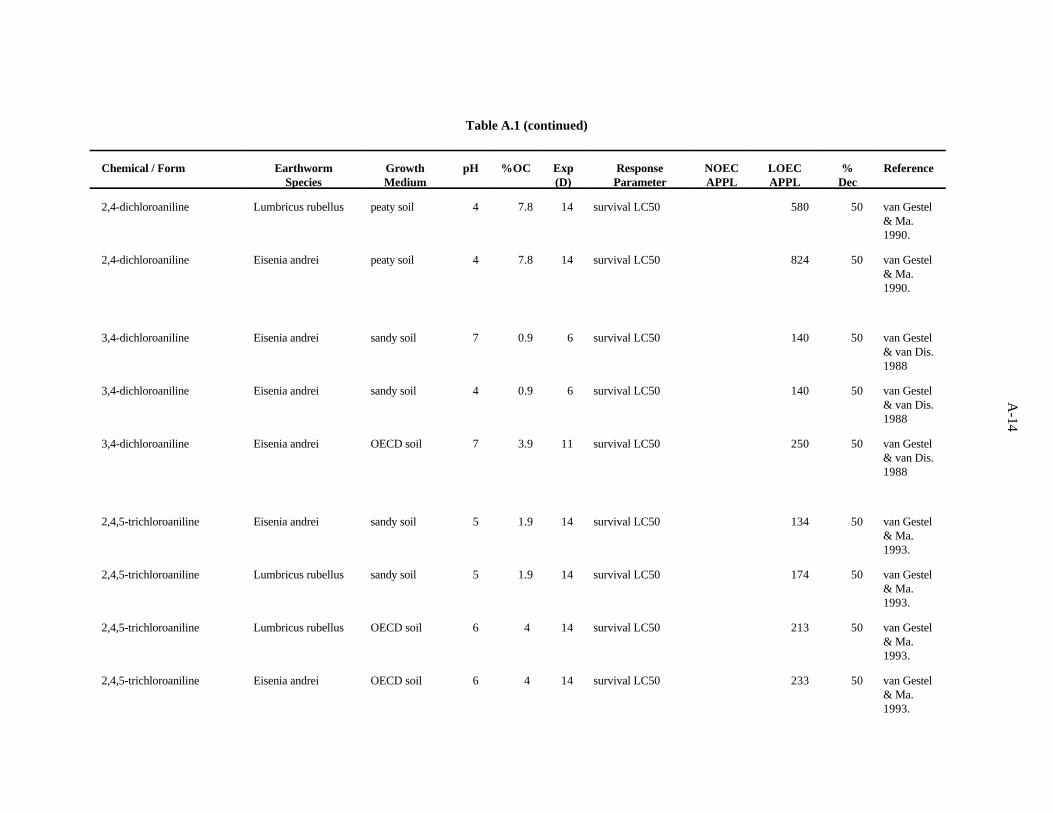
A-14
Table A.1 (continued)
Chemical / Form Earthworm Growth pH %OC Exp Response NOEC LOEC % ReferenceSpecies Medium (D) Parameter APPL APPL Dec
2,4-dichloroaniline Lumbricus rubellus peaty soil 4 7.8 14 survival LC50 580 50 van Gestel& Ma.1990.
2,4-dichloroaniline Eisenia andrei peaty soil 4 7.8 14 survival LC50 824 50 van Gestel& Ma.1990.
3,4-dichloroaniline Eisenia andrei sandy soil 7 0.9 6 survival LC50 140 50 van Gestel& van Dis.1988
3,4-dichloroaniline Eisenia andrei sandy soil 4 0.9 6 survival LC50 140 50 van Gestel& van Dis.1988
3,4-dichloroaniline Eisenia andrei OECD soil 7 3.9 11 survival LC50 250 50 van Gestel& van Dis.1988
2,4,5-trichloroaniline Eisenia andrei sandy soil 5 1.9 14 survival LC50 134 50 van Gestel& Ma.1993.
2,4,5-trichloroaniline Lumbricus rubellus sandy soil 5 1.9 14 survival LC50 174 50 van Gestel& Ma.1993.
2,4,5-trichloroaniline Lumbricus rubellus OECD soil 6 4 14 survival LC50 213 50 van Gestel& Ma.1993.
2,4,5-trichloroaniline Eisenia andrei OECD soil 6 4 14 survival LC50 233 50 van Gestel& Ma.1993.
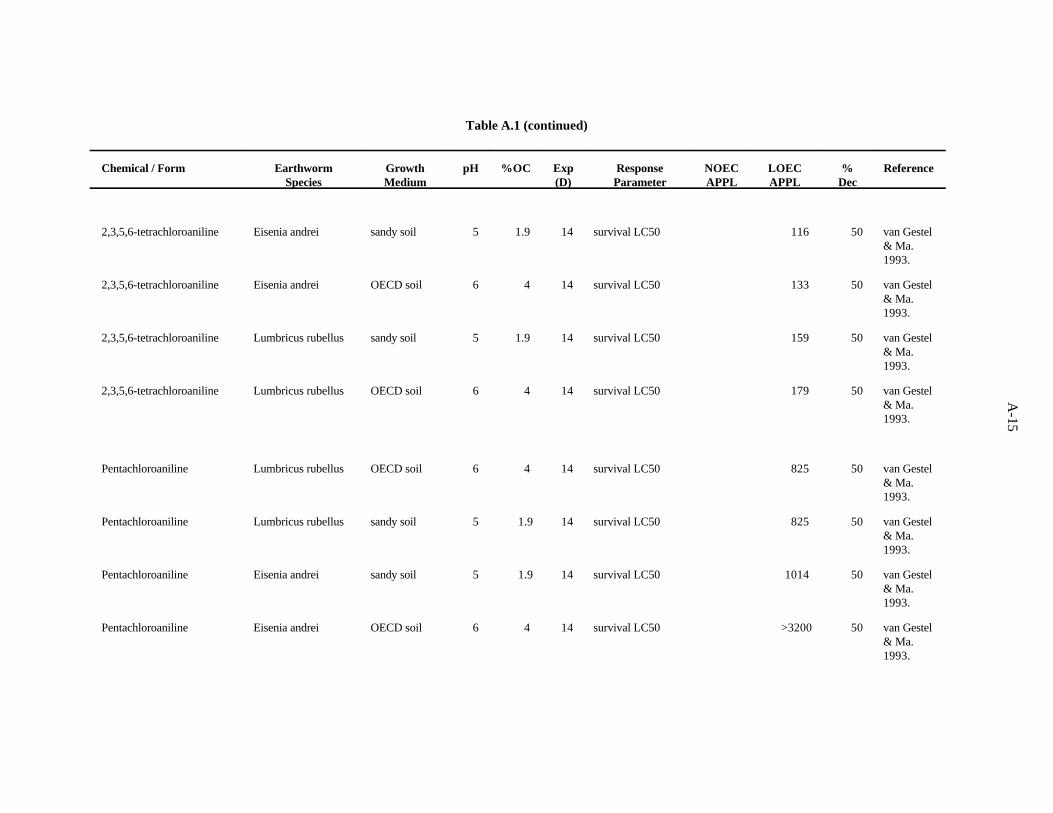
A-15
Table A.1 (continued)
Chemical / Form Earthworm Growth pH %OC Exp Response NOEC LOEC % ReferenceSpecies Medium (D) Parameter APPL APPL Dec
2,3,5,6-tetrachloroaniline Eisenia andrei sandy soil 5 1.9 14 survival LC50 116 50 van Gestel& Ma.1993.
2,3,5,6-tetrachloroaniline Eisenia andrei OECD soil 6 4 14 survival LC50 133 50 van Gestel& Ma.1993.
2,3,5,6-tetrachloroaniline Lumbricus rubellus sandy soil 5 1.9 14 survival LC50 159 50 van Gestel& Ma.1993.
2,3,5,6-tetrachloroaniline Lumbricus rubellus OECD soil 6 4 14 survival LC50 179 50 van Gestel& Ma.1993.
Pentachloroaniline Lumbricus rubellus OECD soil 6 4 14 survival LC50 825 50 van Gestel& Ma.1993.
Pentachloroaniline Lumbricus rubellus sandy soil 5 1.9 14 survival LC50 825 50 van Gestel& Ma.1993.
Pentachloroaniline Eisenia andrei sandy soil 5 1.9 14 survival LC50 1014 50 van Gestel& Ma.1993.
Pentachloroaniline Eisenia andrei OECD soil 6 4 14 survival LC50 >3200 50 van Gestel& Ma.1993.

A-16
Table A.1 (continued)
Chemical / Form Earthworm Growth pH %OC Exp Response NOEC LOEC % ReferenceSpecies Medium (D) Parameter APPL APPL Dec
1,2-dichloropropane Perionyx excavatus OECD soil 6 5 14 survival LC50 3880 50 Neuhauseret al.1986.
1,2-dichloropropane Eisenia fetida OECD soil 6 5 14 survival LC50 4240 50 Neuhauseret al.1986.
1,2-dichloropropane Allolobophora OECD soil 6 5 14 survival LC50 4272 50 Neuhausertuberculata et al.
1986.
1,2-dichloropropane Eudrilus eugeniae OECD soil 6 5 14 survival LC50 5300 50 Neuhauseret al.1986.
1,2-dichloropropane Eisenia fetida horse manure 56 growth 80800 92300 death Neuhauser&Callahan.1990
Dimethylphthalate Perionyx excavatus OECD soil 6 5 14 survival LC50 1064 50 Neuhauseret al.1986.
Dimethylphthalate Eudrilus eugeniae OECD soil 6 5 14 survival LC50 2000 50 Neuhauseret al.1986.
Dimethylphthalate Eisenia fetida OECD soil 6 5 14 survival LC50 3160 50 Neuhauseret al.1986.
Dimethylphthalate Allolobophora OECD soil 6 5 14 survival LC50 3335 50 Neuhausertuberculata et al.
1986.
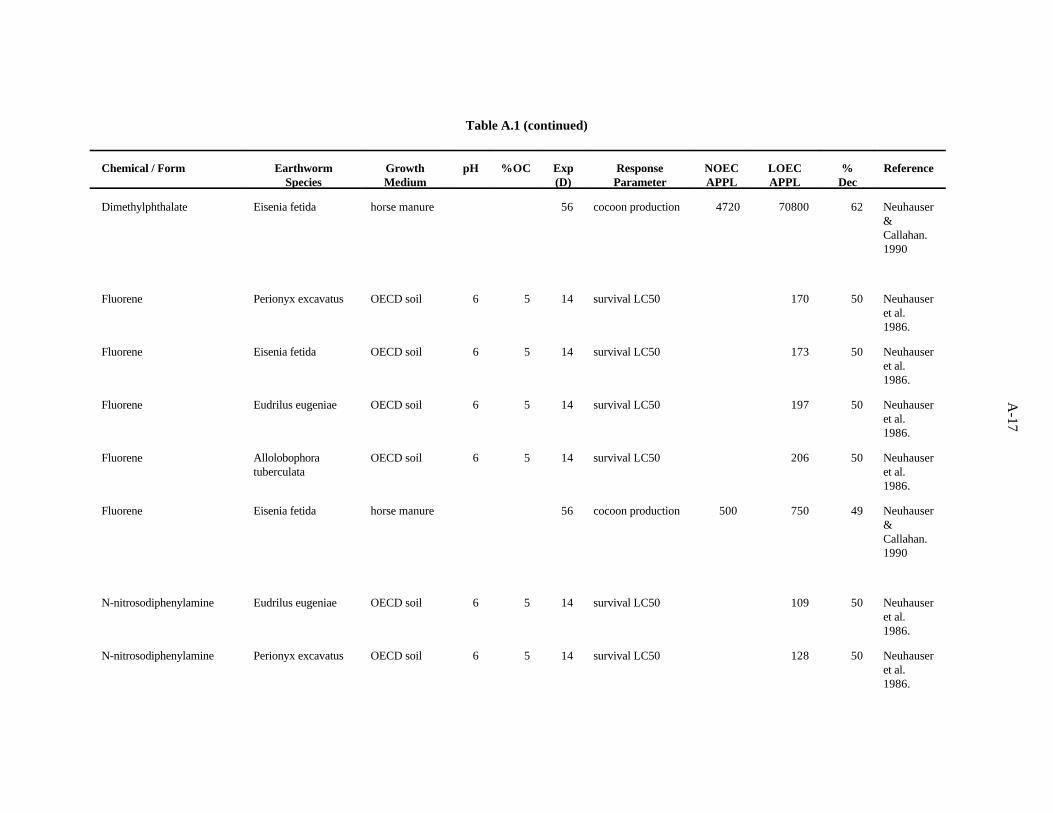
A-17
Table A.1 (continued)
Chemical / Form Earthworm Growth pH %OC Exp Response NOEC LOEC % ReferenceSpecies Medium (D) Parameter APPL APPL Dec
Dimethylphthalate Eisenia fetida horse manure 56 cocoon production 4720 70800 62 Neuhauser&Callahan.1990
Fluorene Perionyx excavatus OECD soil 6 5 14 survival LC50 170 50 Neuhauseret al.1986.
Fluorene Eisenia fetida OECD soil 6 5 14 survival LC50 173 50 Neuhauseret al.1986.
Fluorene Eudrilus eugeniae OECD soil 6 5 14 survival LC50 197 50 Neuhauseret al.1986.
Fluorene Allolobophora OECD soil 6 5 14 survival LC50 206 50 Neuhausertuberculata et al.
1986.
Fluorene Eisenia fetida horse manure 56 cocoon production 500 750 49 Neuhauser&Callahan.1990
N-nitrosodiphenylamine Eudrilus eugeniae OECD soil 6 5 14 survival LC50 109 50 Neuhauseret al.1986.
N-nitrosodiphenylamine Perionyx excavatus OECD soil 6 5 14 survival LC50 128 50 Neuhauseret al.1986.
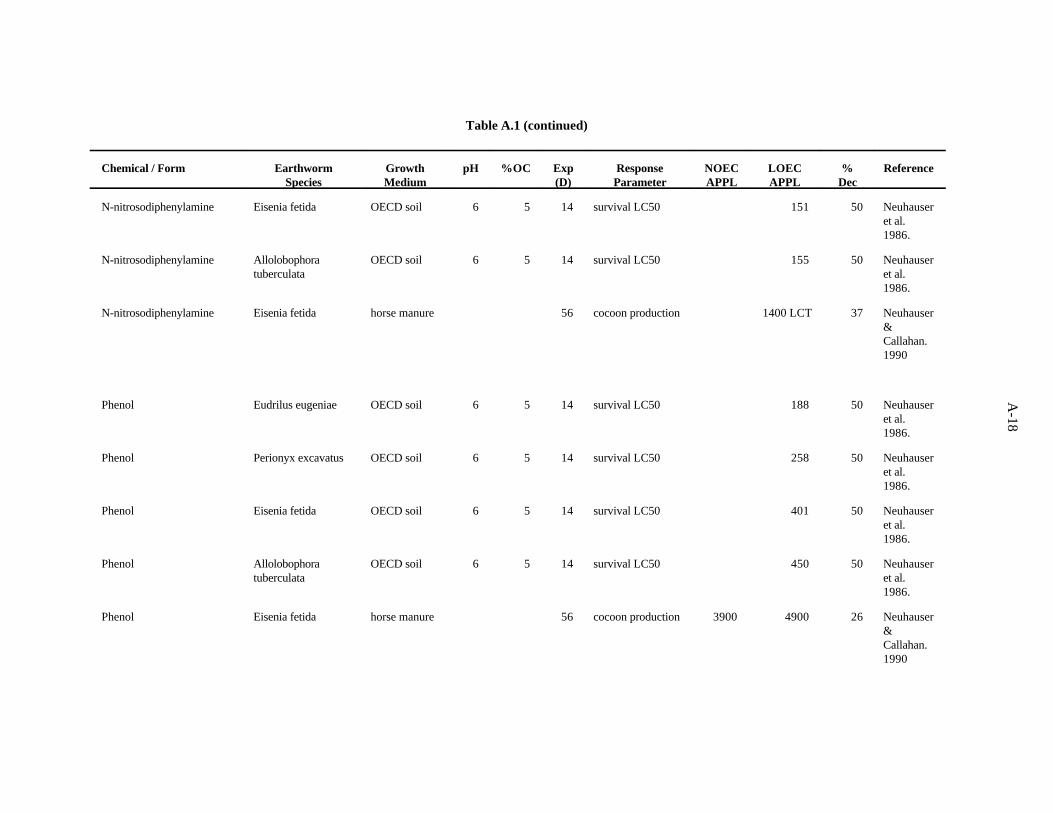
A-18
Table A.1 (continued)
Chemical / Form Earthworm Growth pH %OC Exp Response NOEC LOEC % ReferenceSpecies Medium (D) Parameter APPL APPL Dec
N-nitrosodiphenylamine Eisenia fetida OECD soil 6 5 14 survival LC50 151 50 Neuhauseret al.1986.
N-nitrosodiphenylamine Allolobophora OECD soil 6 5 14 survival LC50 155 50 Neuhausertuberculata et al.
1986.
N-nitrosodiphenylamine Eisenia fetida horse manure 56 cocoon production 1400 LCT 37 Neuhauser&Callahan.1990
Phenol Eudrilus eugeniae OECD soil 6 5 14 survival LC50 188 50 Neuhauseret al.1986.
Phenol Perionyx excavatus OECD soil 6 5 14 survival LC50 258 50 Neuhauseret al.1986.
Phenol Eisenia fetida OECD soil 6 5 14 survival LC50 401 50 Neuhauseret al.1986.
Phenol Allolobophora OECD soil 6 5 14 survival LC50 450 50 Neuhausertuberculata et al.
1986.
Phenol Eisenia fetida horse manure 56 cocoon production 3900 4900 26 Neuhauser&Callahan.1990
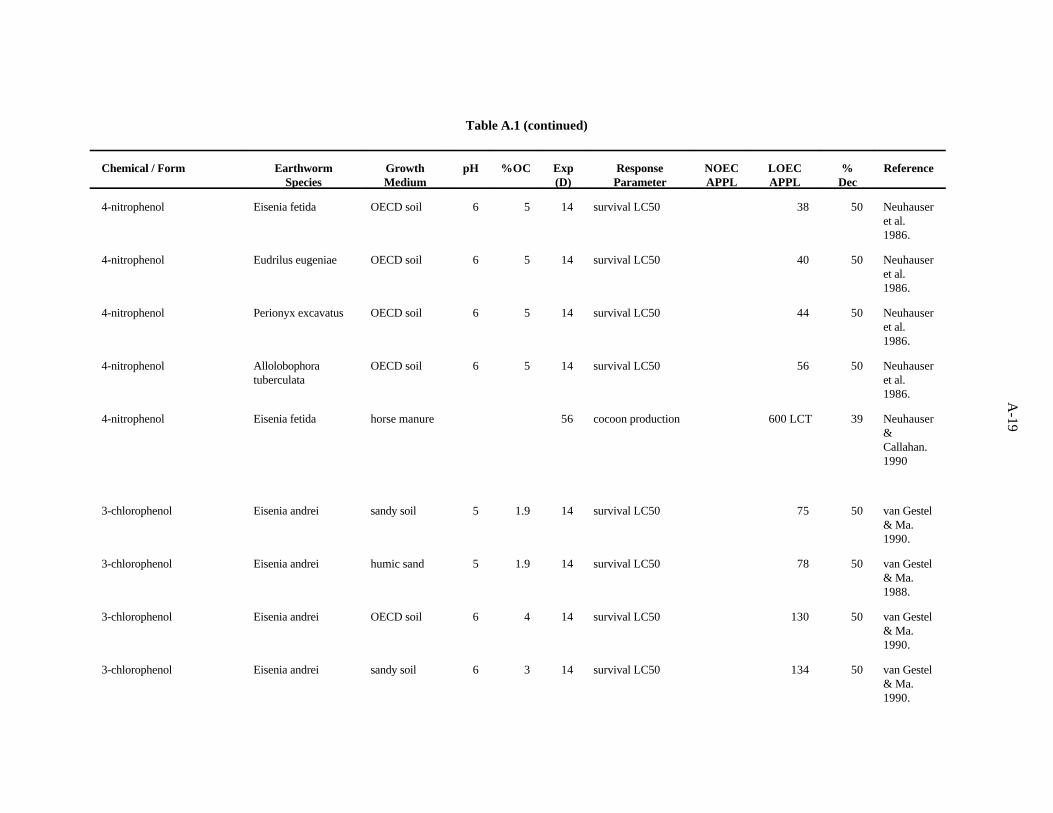
A-19
Table A.1 (continued)
Chemical / Form Earthworm Growth pH %OC Exp Response NOEC LOEC % ReferenceSpecies Medium (D) Parameter APPL APPL Dec
4-nitrophenol Eisenia fetida OECD soil 6 5 14 survival LC50 38 50 Neuhauseret al.1986.
4-nitrophenol Eudrilus eugeniae OECD soil 6 5 14 survival LC50 40 50 Neuhauseret al.1986.
4-nitrophenol Perionyx excavatus OECD soil 6 5 14 survival LC50 44 50 Neuhauseret al.1986.
4-nitrophenol Allolobophora OECD soil 6 5 14 survival LC50 56 50 Neuhausertuberculata et al.
1986.
4-nitrophenol Eisenia fetida horse manure 56 cocoon production 600 LCT 39 Neuhauser&Callahan.1990
3-chlorophenol Eisenia andrei sandy soil 5 1.9 14 survival LC50 75 50 van Gestel& Ma.1990.
3-chlorophenol Eisenia andrei humic sand 5 1.9 14 survival LC50 78 50 van Gestel& Ma.1988.
3-chlorophenol Eisenia andrei OECD soil 6 4 14 survival LC50 130 50 van Gestel& Ma.1990.
3-chlorophenol Eisenia andrei sandy soil 6 3 14 survival LC50 134 50 van Gestel& Ma.1990.
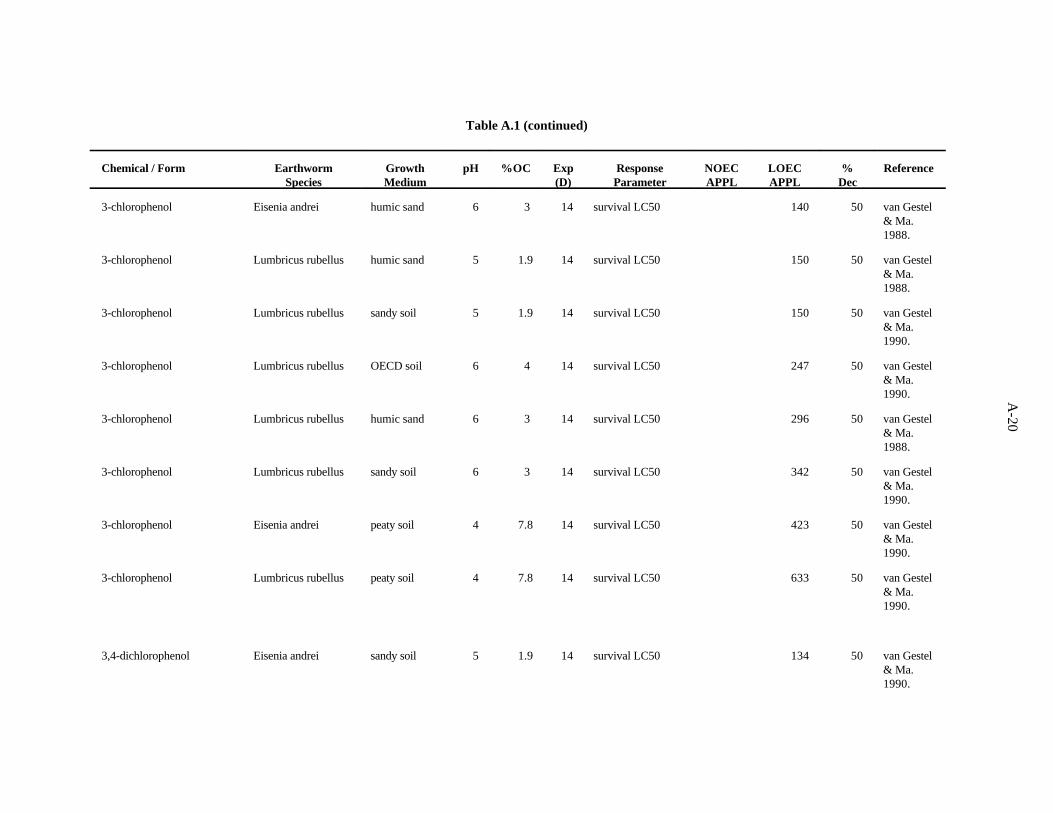
A-20
Table A.1 (continued)
Chemical / Form Earthworm Growth pH %OC Exp Response NOEC LOEC % ReferenceSpecies Medium (D) Parameter APPL APPL Dec
3-chlorophenol Eisenia andrei humic sand 6 3 14 survival LC50 140 50 van Gestel& Ma.1988.
3-chlorophenol Lumbricus rubellus humic sand 5 1.9 14 survival LC50 150 50 van Gestel& Ma.1988.
3-chlorophenol Lumbricus rubellus sandy soil 5 1.9 14 survival LC50 150 50 van Gestel& Ma.1990.
3-chlorophenol Lumbricus rubellus OECD soil 6 4 14 survival LC50 247 50 van Gestel& Ma.1990.
3-chlorophenol Lumbricus rubellus humic sand 6 3 14 survival LC50 296 50 van Gestel& Ma.1988.
3-chlorophenol Lumbricus rubellus sandy soil 6 3 14 survival LC50 342 50 van Gestel& Ma.1990.
3-chlorophenol Eisenia andrei peaty soil 4 7.8 14 survival LC50 423 50 van Gestel& Ma.1990.
3-chlorophenol Lumbricus rubellus peaty soil 4 7.8 14 survival LC50 633 50 van Gestel& Ma.1990.
3,4-dichlorophenol Eisenia andrei sandy soil 5 1.9 14 survival LC50 134 50 van Gestel& Ma.1990.
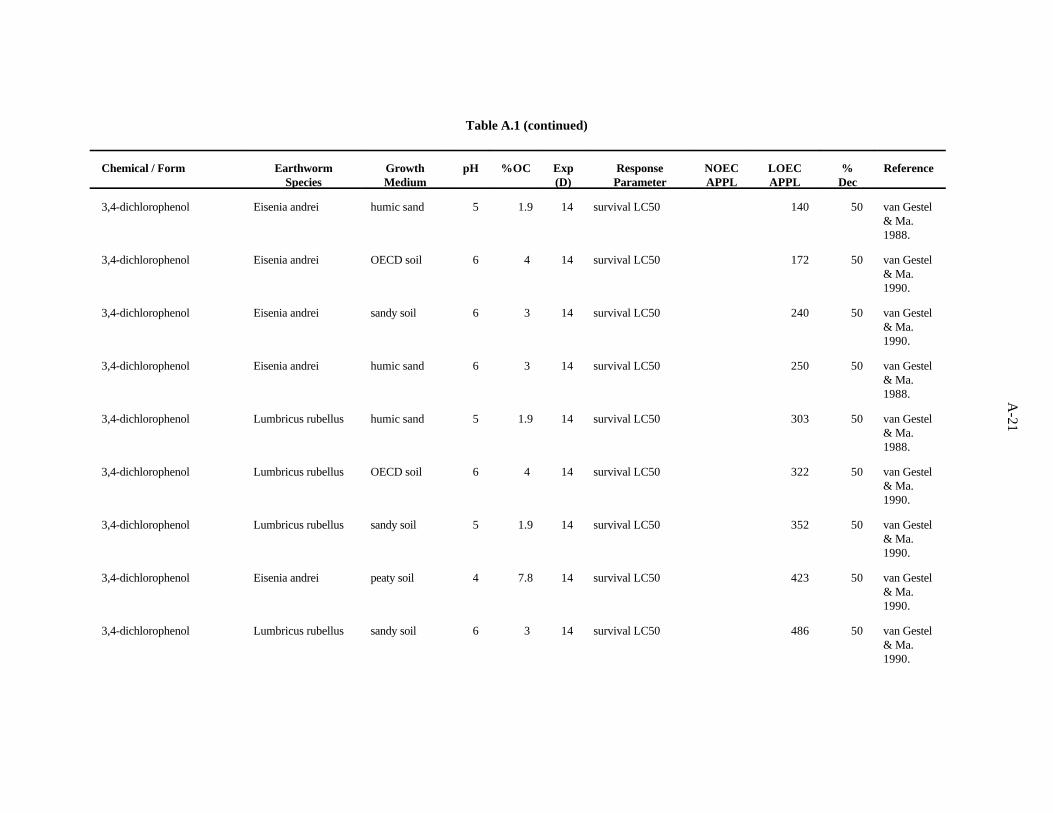
A-21
Table A.1 (continued)
Chemical / Form Earthworm Growth pH %OC Exp Response NOEC LOEC % ReferenceSpecies Medium (D) Parameter APPL APPL Dec
3,4-dichlorophenol Eisenia andrei humic sand 5 1.9 14 survival LC50 140 50 van Gestel& Ma.1988.
3,4-dichlorophenol Eisenia andrei OECD soil 6 4 14 survival LC50 172 50 van Gestel& Ma.1990.
3,4-dichlorophenol Eisenia andrei sandy soil 6 3 14 survival LC50 240 50 van Gestel& Ma.1990.
3,4-dichlorophenol Eisenia andrei humic sand 6 3 14 survival LC50 250 50 van Gestel& Ma.1988.
3,4-dichlorophenol Lumbricus rubellus humic sand 5 1.9 14 survival LC50 303 50 van Gestel& Ma.1988.
3,4-dichlorophenol Lumbricus rubellus OECD soil 6 4 14 survival LC50 322 50 van Gestel& Ma.1990.
3,4-dichlorophenol Lumbricus rubellus sandy soil 5 1.9 14 survival LC50 352 50 van Gestel& Ma.1990.
3,4-dichlorophenol Eisenia andrei peaty soil 4 7.8 14 survival LC50 423 50 van Gestel& Ma.1990.
3,4-dichlorophenol Lumbricus rubellus sandy soil 6 3 14 survival LC50 486 50 van Gestel& Ma.1990.
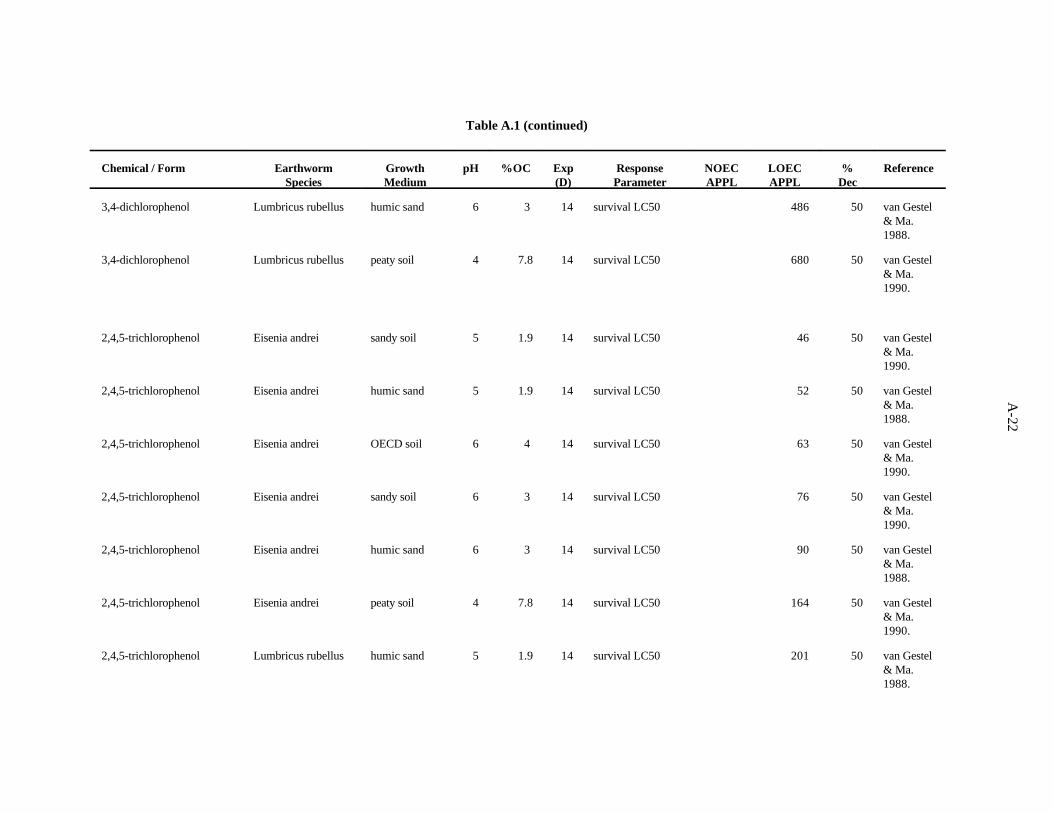
A-22
Table A.1 (continued)
Chemical / Form Earthworm Growth pH %OC Exp Response NOEC LOEC % ReferenceSpecies Medium (D) Parameter APPL APPL Dec
3,4-dichlorophenol Lumbricus rubellus humic sand 6 3 14 survival LC50 486 50 van Gestel& Ma.1988.
3,4-dichlorophenol Lumbricus rubellus peaty soil 4 7.8 14 survival LC50 680 50 van Gestel& Ma.1990.
2,4,5-trichlorophenol Eisenia andrei sandy soil 5 1.9 14 survival LC50 46 50 van Gestel& Ma.1990.
2,4,5-trichlorophenol Eisenia andrei humic sand 5 1.9 14 survival LC50 52 50 van Gestel& Ma.1988.
2,4,5-trichlorophenol Eisenia andrei OECD soil 6 4 14 survival LC50 63 50 van Gestel& Ma.1990.
2,4,5-trichlorophenol Eisenia andrei sandy soil 6 3 14 survival LC50 76 50 van Gestel& Ma.1990.
2,4,5-trichlorophenol Eisenia andrei humic sand 6 3 14 survival LC50 90 50 van Gestel& Ma.1988.
2,4,5-trichlorophenol Eisenia andrei peaty soil 4 7.8 14 survival LC50 164 50 van Gestel& Ma.1990.
2,4,5-trichlorophenol Lumbricus rubellus humic sand 5 1.9 14 survival LC50 201 50 van Gestel& Ma.1988.
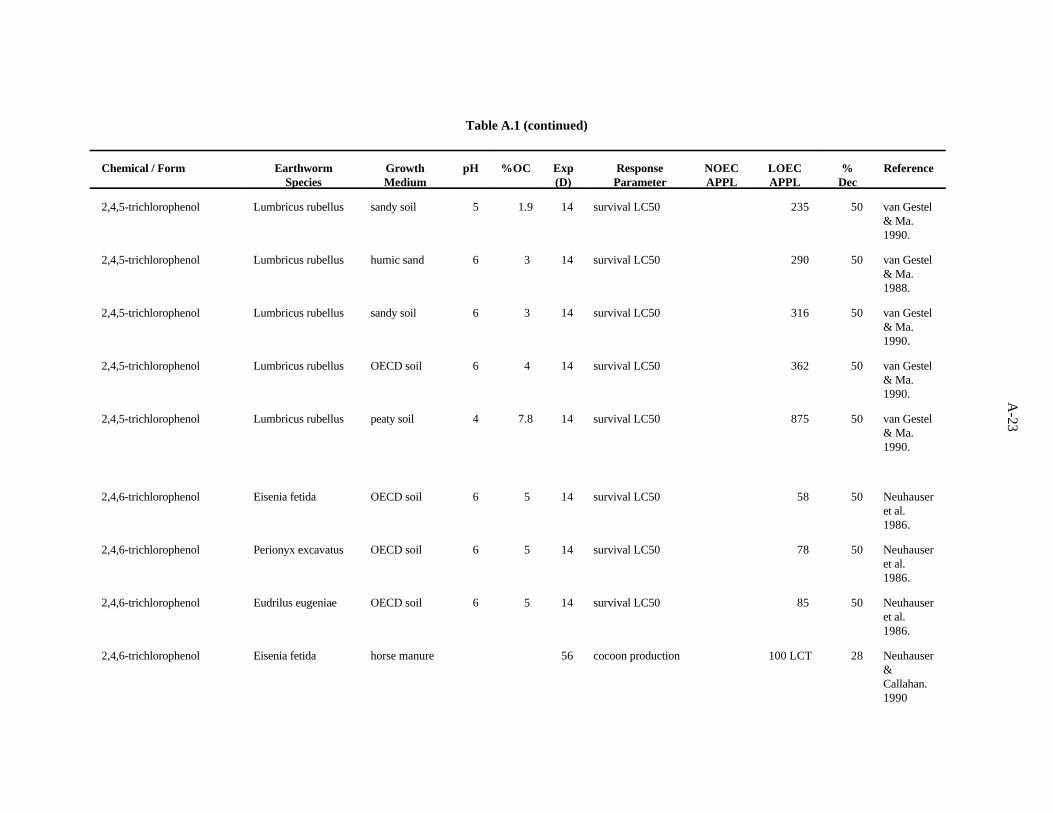
A-23
Table A.1 (continued)
Chemical / Form Earthworm Growth pH %OC Exp Response NOEC LOEC % ReferenceSpecies Medium (D) Parameter APPL APPL Dec
2,4,5-trichlorophenol Lumbricus rubellus sandy soil 5 1.9 14 survival LC50 235 50 van Gestel& Ma.1990.
2,4,5-trichlorophenol Lumbricus rubellus humic sand 6 3 14 survival LC50 290 50 van Gestel& Ma.1988.
2,4,5-trichlorophenol Lumbricus rubellus sandy soil 6 3 14 survival LC50 316 50 van Gestel& Ma.1990.
2,4,5-trichlorophenol Lumbricus rubellus OECD soil 6 4 14 survival LC50 362 50 van Gestel& Ma.1990.
2,4,5-trichlorophenol Lumbricus rubellus peaty soil 4 7.8 14 survival LC50 875 50 van Gestel& Ma.1990.
2,4,6-trichlorophenol Eisenia fetida OECD soil 6 5 14 survival LC50 58 50 Neuhauseret al.1986.
2,4,6-trichlorophenol Perionyx excavatus OECD soil 6 5 14 survival LC50 78 50 Neuhauseret al.1986.
2,4,6-trichlorophenol Eudrilus eugeniae OECD soil 6 5 14 survival LC50 85 50 Neuhauseret al.1986.
2,4,6-trichlorophenol Eisenia fetida horse manure 56 cocoon production 100 LCT 28 Neuhauser&Callahan.1990
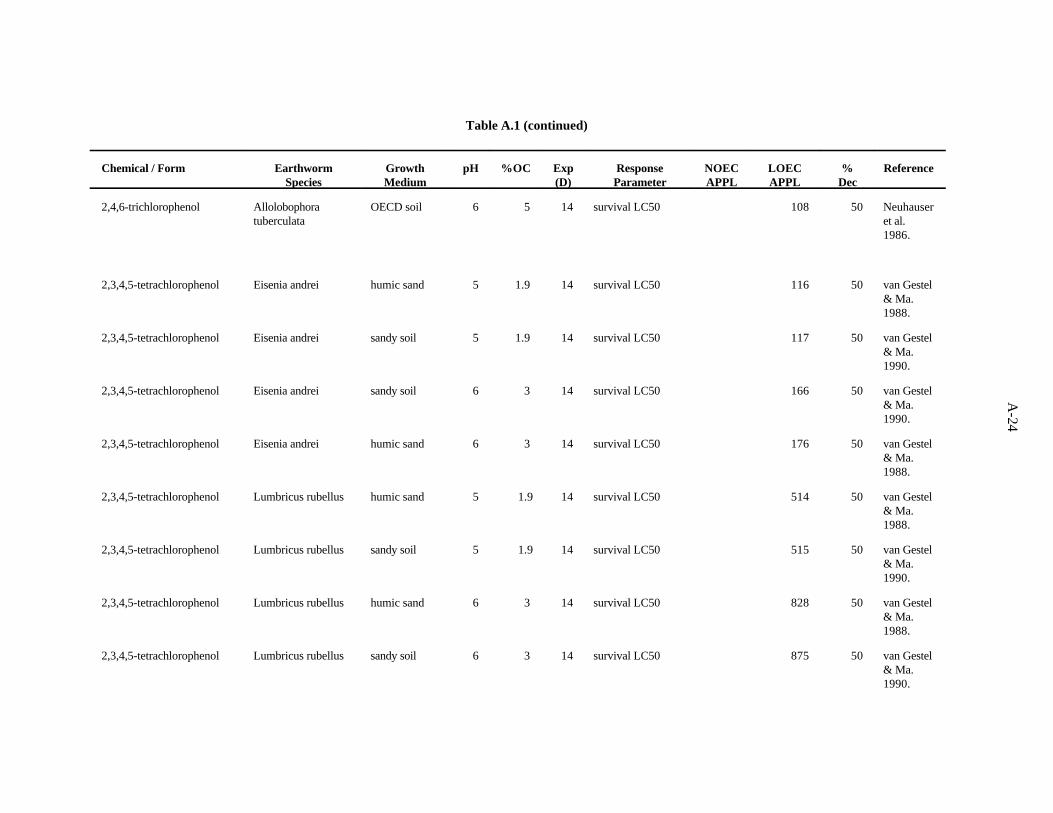
A-24
Table A.1 (continued)
Chemical / Form Earthworm Growth pH %OC Exp Response NOEC LOEC % ReferenceSpecies Medium (D) Parameter APPL APPL Dec
2,4,6-trichlorophenol Allolobophora OECD soil 6 5 14 survival LC50 108 50 Neuhausertuberculata et al.
1986.
2,3,4,5-tetrachlorophenol Eisenia andrei humic sand 5 1.9 14 survival LC50 116 50 van Gestel& Ma.1988.
2,3,4,5-tetrachlorophenol Eisenia andrei sandy soil 5 1.9 14 survival LC50 117 50 van Gestel& Ma.1990.
2,3,4,5-tetrachlorophenol Eisenia andrei sandy soil 6 3 14 survival LC50 166 50 van Gestel& Ma.1990.
2,3,4,5-tetrachlorophenol Eisenia andrei humic sand 6 3 14 survival LC50 176 50 van Gestel& Ma.1988.
2,3,4,5-tetrachlorophenol Lumbricus rubellus humic sand 5 1.9 14 survival LC50 514 50 van Gestel& Ma.1988.
2,3,4,5-tetrachlorophenol Lumbricus rubellus sandy soil 5 1.9 14 survival LC50 515 50 van Gestel& Ma.1990.
2,3,4,5-tetrachlorophenol Lumbricus rubellus humic sand 6 3 14 survival LC50 828 50 van Gestel& Ma.1988.
2,3,4,5-tetrachlorophenol Lumbricus rubellus sandy soil 6 3 14 survival LC50 875 50 van Gestel& Ma.1990.
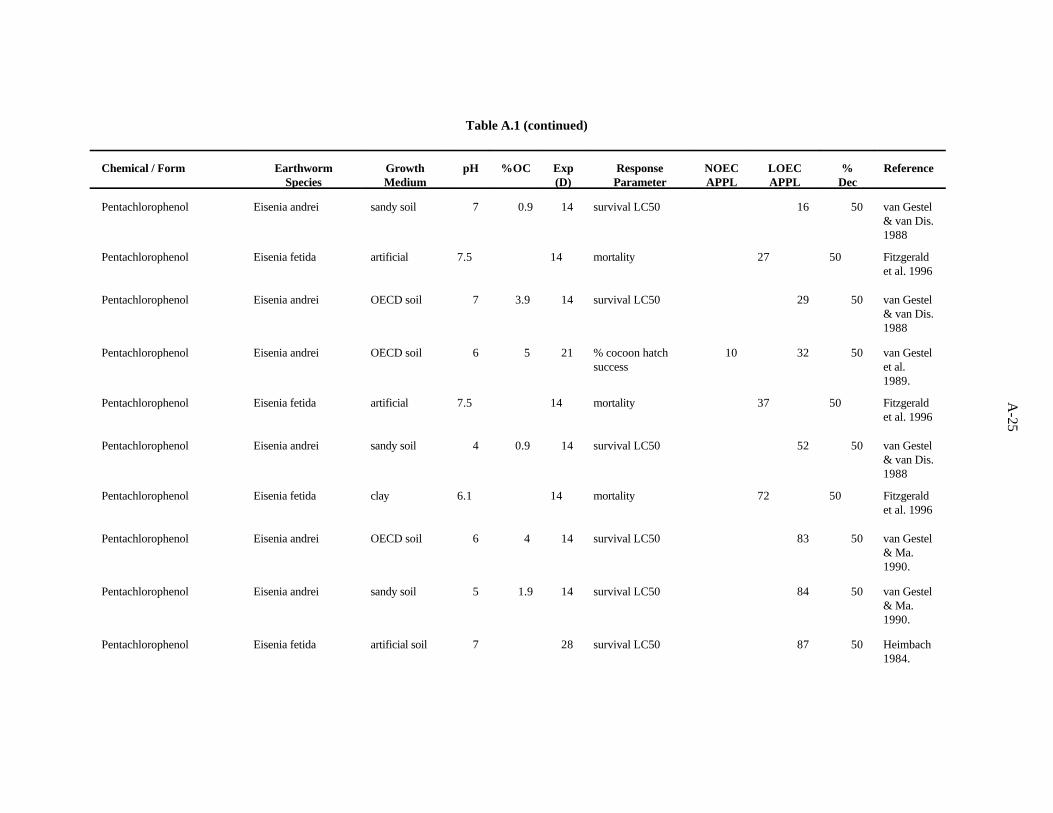
A-25
Table A.1 (continued)
Chemical / Form Earthworm Growth pH %OC Exp Response NOEC LOEC % ReferenceSpecies Medium (D) Parameter APPL APPL Dec
Pentachlorophenol Eisenia andrei sandy soil 7 0.9 14 survival LC50 16 50 van Gestel& van Dis.1988
Pentachlorophenol Eisenia fetida artificial 7.5 14 mortality 27 50 Fitzgeraldet al. 1996
Pentachlorophenol Eisenia andrei OECD soil 7 3.9 14 survival LC50 29 50 van Gestel& van Dis.1988
Pentachlorophenol Eisenia andrei OECD soil 6 5 21 % cocoon hatch 10 32 50 van Gestelsuccess et al.
1989.
Pentachlorophenol Eisenia fetida artificial 7.5 14 mortality 37 50 Fitzgeraldet al. 1996
Pentachlorophenol Eisenia andrei sandy soil 4 0.9 14 survival LC50 52 50 van Gestel& van Dis.1988
Pentachlorophenol Eisenia fetida clay 6.1 14 mortality 72 50 Fitzgeraldet al. 1996
Pentachlorophenol Eisenia andrei OECD soil 6 4 14 survival LC50 83 50 van Gestel& Ma.1990.
Pentachlorophenol Eisenia andrei sandy soil 5 1.9 14 survival LC50 84 50 van Gestel& Ma.1990.
Pentachlorophenol Eisenia fetida artificial soil 7 28 survival LC50 87 50 Heimbach1984.
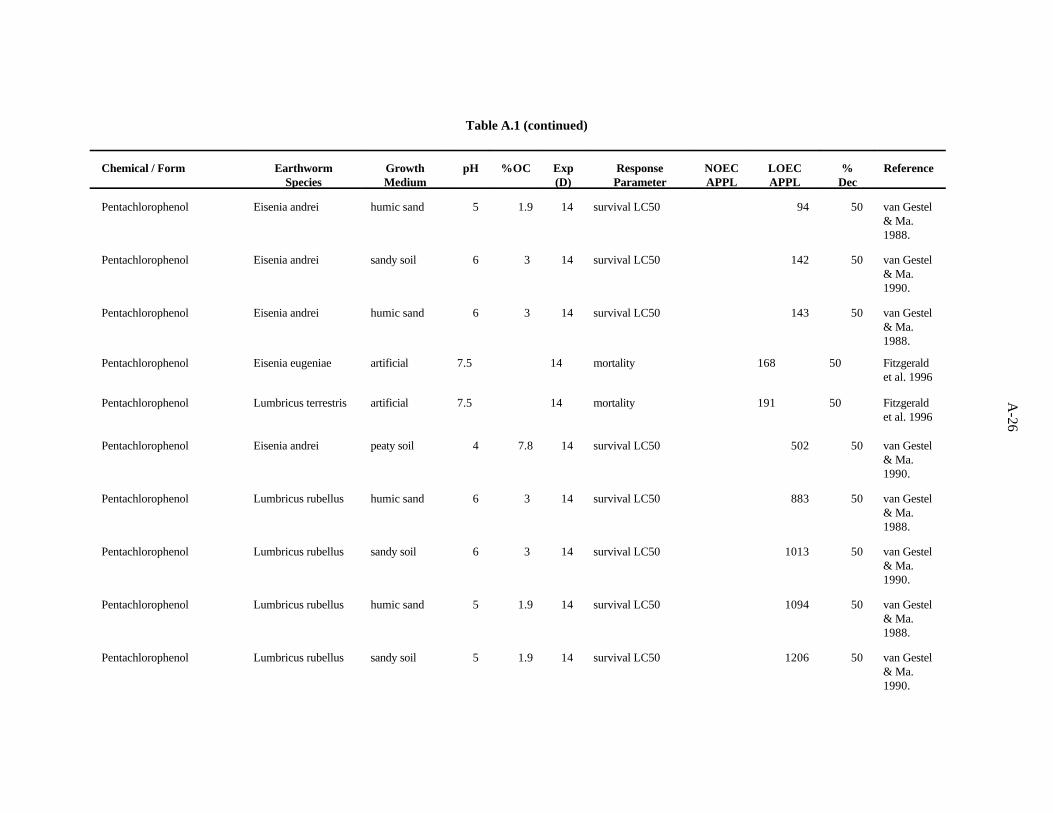
A-26
Table A.1 (continued)
Chemical / Form Earthworm Growth pH %OC Exp Response NOEC LOEC % ReferenceSpecies Medium (D) Parameter APPL APPL Dec
Pentachlorophenol Eisenia andrei humic sand 5 1.9 14 survival LC50 94 50 van Gestel& Ma.1988.
Pentachlorophenol Eisenia andrei sandy soil 6 3 14 survival LC50 142 50 van Gestel& Ma.1990.
Pentachlorophenol Eisenia andrei humic sand 6 3 14 survival LC50 143 50 van Gestel& Ma.1988.
Pentachlorophenol Eisenia eugeniae artificial 7.5 14 mortality 168 50 Fitzgeraldet al. 1996
Pentachlorophenol Lumbricus terrestris artificial 7.5 14 mortality 191 50 Fitzgeraldet al. 1996
Pentachlorophenol Eisenia andrei peaty soil 4 7.8 14 survival LC50 502 50 van Gestel& Ma.1990.
Pentachlorophenol Lumbricus rubellus humic sand 6 3 14 survival LC50 883 50 van Gestel& Ma.1988.
Pentachlorophenol Lumbricus rubellus sandy soil 6 3 14 survival LC50 1013 50 van Gestel& Ma.1990.
Pentachlorophenol Lumbricus rubellus humic sand 5 1.9 14 survival LC50 1094 50 van Gestel& Ma.1988.
Pentachlorophenol Lumbricus rubellus sandy soil 5 1.9 14 survival LC50 1206 50 van Gestel& Ma.1990.
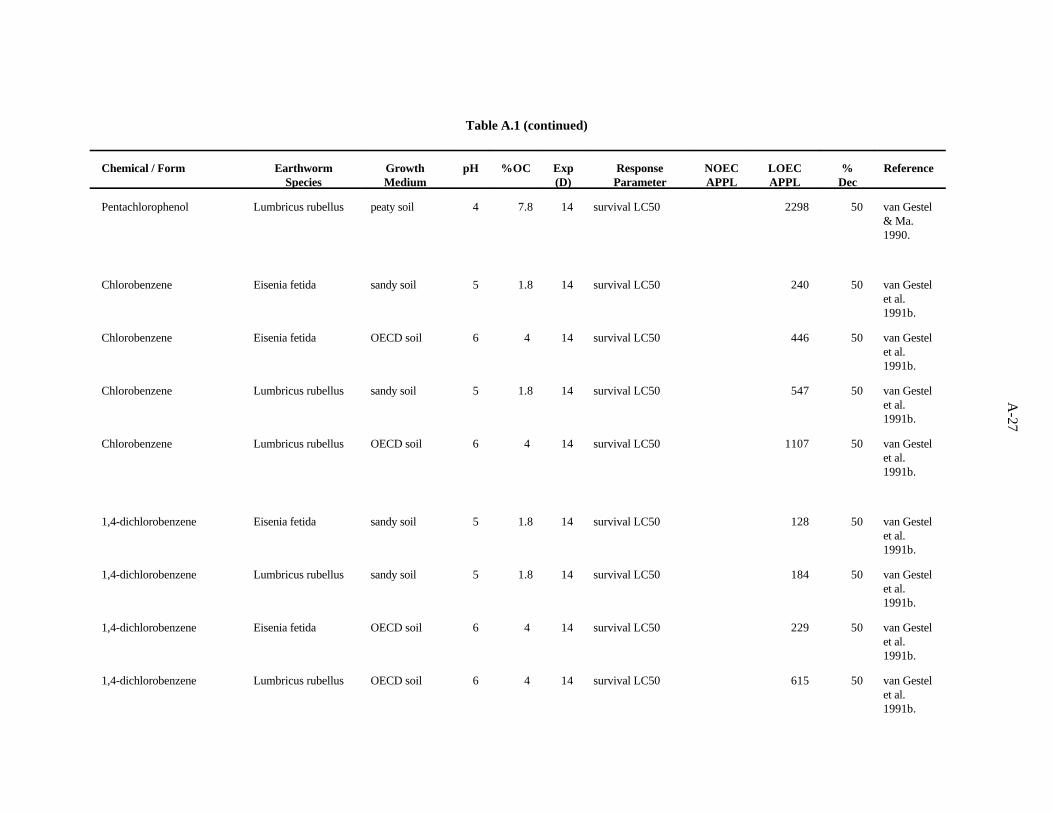
A-27
Table A.1 (continued)
Chemical / Form Earthworm Growth pH %OC Exp Response NOEC LOEC % ReferenceSpecies Medium (D) Parameter APPL APPL Dec
Pentachlorophenol Lumbricus rubellus peaty soil 4 7.8 14 survival LC50 2298 50 van Gestel& Ma.1990.
Chlorobenzene Eisenia fetida sandy soil 5 1.8 14 survival LC50 240 50 van Gestelet al.1991b.
Chlorobenzene Eisenia fetida OECD soil 6 4 14 survival LC50 446 50 van Gestelet al.1991b.
Chlorobenzene Lumbricus rubellus sandy soil 5 1.8 14 survival LC50 547 50 van Gestelet al.1991b.
Chlorobenzene Lumbricus rubellus OECD soil 6 4 14 survival LC50 1107 50 van Gestelet al.1991b.
1,4-dichlorobenzene Eisenia fetida sandy soil 5 1.8 14 survival LC50 128 50 van Gestelet al.1991b.
1,4-dichlorobenzene Lumbricus rubellus sandy soil 5 1.8 14 survival LC50 184 50 van Gestelet al.1991b.
1,4-dichlorobenzene Eisenia fetida OECD soil 6 4 14 survival LC50 229 50 van Gestelet al.1991b.
1,4-dichlorobenzene Lumbricus rubellus OECD soil 6 4 14 survival LC50 615 50 van Gestelet al.1991b.

A-28
Table A.1 (continued)
Chemical / Form Earthworm Growth pH %OC Exp Response NOEC LOEC % ReferenceSpecies Medium (D) Parameter APPL APPL Dec
1,2,3-trichlorobenzene Lumbricus rubellus sandy soil 5 1.9 14 survival LC50 115 50 van Gestel& Ma.1990.
1,2,3-trichlorobenzene Eisenia andrei OECD soil 6 4 14 survival LC50 133 50 van Gestel& Ma.1990.
1,2,3-trichlorobenzene Eisenia andrei sandy soil 5 1.9 14 survival LC50 134 50 van Gestel& Ma.1990.
1,2,3-trichlorobenzene Lumbricus rubellus OECD soil 6 4 14 survival LC50 195 50 van Gestel& Ma.1990.
1,2,3-trichlorobenzene Lumbricus rubellus sandy soil 6 3 14 survival LC50 200 50 van Gestel& Ma.1990.
1,2,3-trichlorobenzene Eisenia andrei sandy soil 6 3 14 survival LC50 240 50 van Gestel& Ma.1990.
1,2,3-trichlorobenzene Eisenia andrei peaty soil 4 7.8 14 survival LC50 547 50 van Gestel& Ma.1990.
1,2,3-trichlorobenzene Lumbricus rubellus peaty soil 4 7.8 14 survival LC50 563 50 van Gestel& Ma.1990.
1,2,4-trichlorobenzene Eudrilus eugeniae OECD soil 6 5 14 survival LC50 127 50 Neuhauseret al.1986.
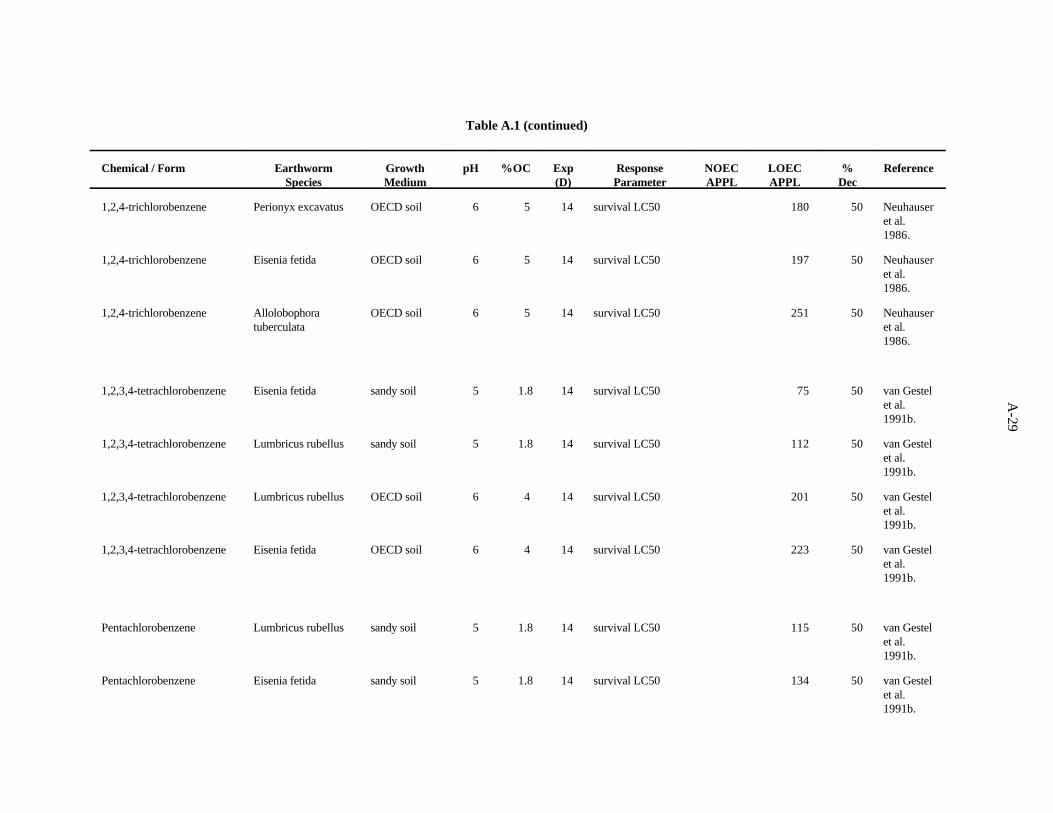
A-29
Table A.1 (continued)
Chemical / Form Earthworm Growth pH %OC Exp Response NOEC LOEC % ReferenceSpecies Medium (D) Parameter APPL APPL Dec
1,2,4-trichlorobenzene Perionyx excavatus OECD soil 6 5 14 survival LC50 180 50 Neuhauseret al.1986.
1,2,4-trichlorobenzene Eisenia fetida OECD soil 6 5 14 survival LC50 197 50 Neuhauseret al.1986.
1,2,4-trichlorobenzene Allolobophora OECD soil 6 5 14 survival LC50 251 50 Neuhausertuberculata et al.
1986.
1,2,3,4-tetrachlorobenzene Eisenia fetida sandy soil 5 1.8 14 survival LC50 75 50 van Gestelet al.1991b.
1,2,3,4-tetrachlorobenzene Lumbricus rubellus sandy soil 5 1.8 14 survival LC50 112 50 van Gestelet al.1991b.
1,2,3,4-tetrachlorobenzene Lumbricus rubellus OECD soil 6 4 14 survival LC50 201 50 van Gestelet al.1991b.
1,2,3,4-tetrachlorobenzene Eisenia fetida OECD soil 6 4 14 survival LC50 223 50 van Gestelet al.1991b.
Pentachlorobenzene Lumbricus rubellus sandy soil 5 1.8 14 survival LC50 115 50 van Gestelet al.1991b.
Pentachlorobenzene Eisenia fetida sandy soil 5 1.8 14 survival LC50 134 50 van Gestelet al.1991b.
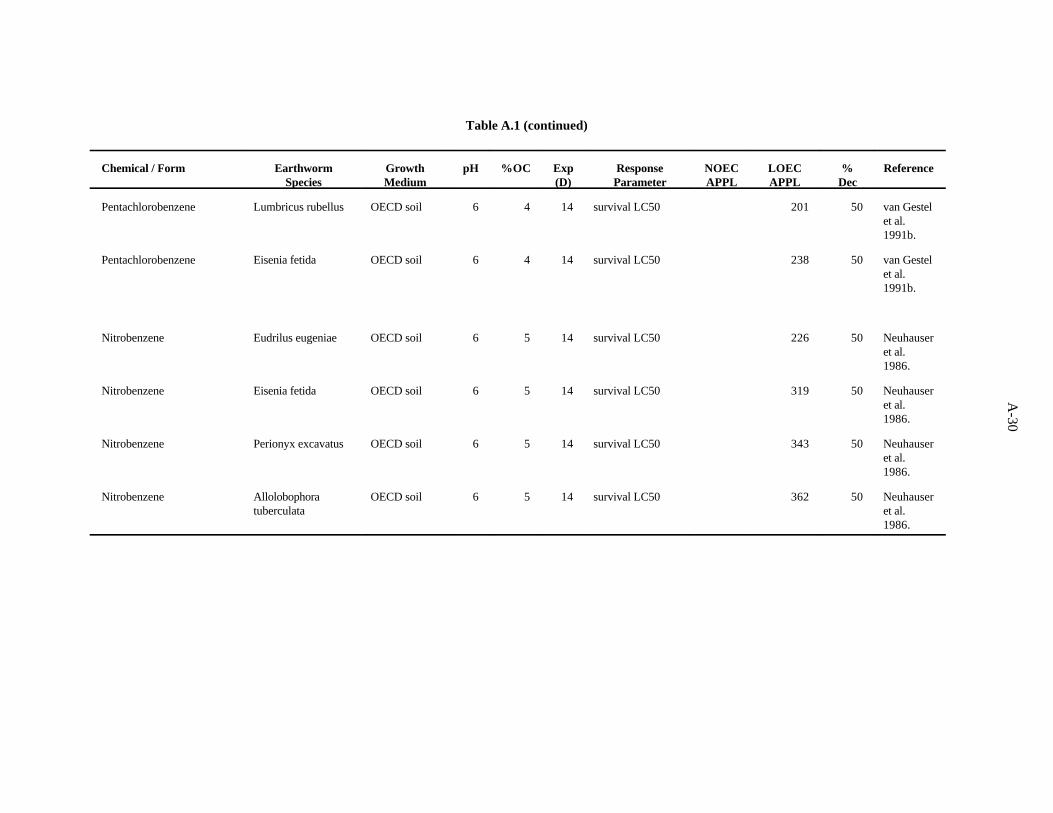
A-30
Table A.1 (continued)
Chemical / Form Earthworm Growth pH %OC Exp Response NOEC LOEC % ReferenceSpecies Medium (D) Parameter APPL APPL Dec
Pentachlorobenzene Lumbricus rubellus OECD soil 6 4 14 survival LC50 201 50 van Gestelet al.1991b.
Pentachlorobenzene Eisenia fetida OECD soil 6 4 14 survival LC50 238 50 van Gestelet al.1991b.
Nitrobenzene Eudrilus eugeniae OECD soil 6 5 14 survival LC50 226 50 Neuhauseret al.1986.
Nitrobenzene Eisenia fetida OECD soil 6 5 14 survival LC50 319 50 Neuhauseret al.1986.
Nitrobenzene Perionyx excavatus OECD soil 6 5 14 survival LC50 343 50 Neuhauseret al.1986.
Nitrobenzene Allolobophora OECD soil 6 5 14 survival LC50 362 50 Neuhausertuberculata et al.
1986.

APPENDIX B
TOXICITY DATA FOR MICROORGANISMS
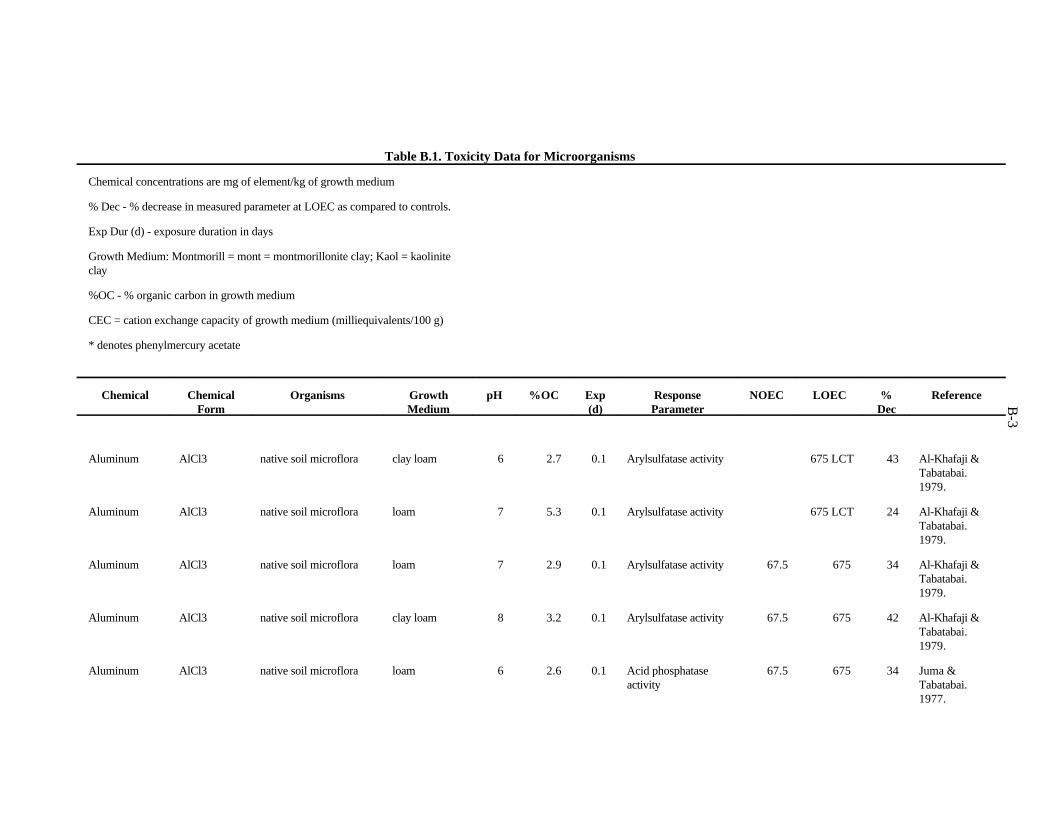
B-3
Table B.1. Toxicity Data for Microorganisms
Chemical concentrations are mg of element/kg of growth medium
% Dec - % decrease in measured parameter at LOEC as compared to controls.
Exp Dur (d) - exposure duration in days
Growth Medium: Montmorill = mont = montmorillonite clay; Kaol = kaoliniteclay
%OC - % organic carbon in growth medium
CEC = cation exchange capacity of growth medium (milliequivalents/100 g)
* denotes phenylmercury acetate
Chemical Chemical Organisms Growth pH %OC Exp Response NOEC LOEC % ReferenceForm Medium (d) Parameter Dec
Aluminum AlCl3 native soil microflora clay loam 6 2.7 0.1 Arylsulfatase activity 675 LCT 43 Al-Khafaji &Tabatabai.1979.
Aluminum AlCl3 native soil microflora loam 7 5.3 0.1 Arylsulfatase activity 675 LCT 24 Al-Khafaji &Tabatabai.1979.
Aluminum AlCl3 native soil microflora loam 7 2.9 0.1 Arylsulfatase activity 67.5 675 34 Al-Khafaji &Tabatabai.1979.
Aluminum AlCl3 native soil microflora clay loam 8 3.2 0.1 Arylsulfatase activity 67.5 675 42 Al-Khafaji &Tabatabai.1979.
Aluminum AlCl3 native soil microflora loam 6 2.6 0.1 Acid phosphatase 67.5 675 34 Juma &activity Tabatabai.
1977.
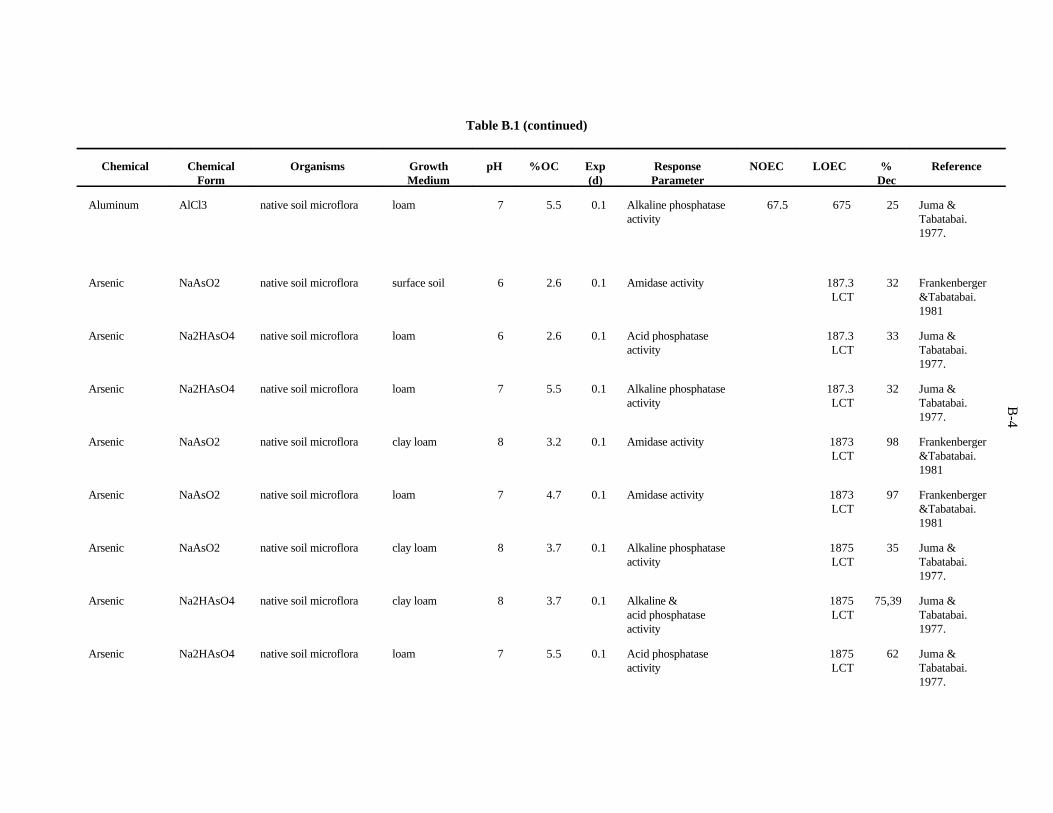
B-4
Table B.1 (continued)
Chemical Chemical Organisms Growth pH %OC Exp Response NOEC LOEC % ReferenceForm Medium (d) Parameter Dec
Aluminum AlCl3 native soil microflora loam 7 5.5 0.1 Alkaline phosphatase 67.5 675 25 Juma &activity Tabatabai.
1977.
Arsenic NaAsO2 native soil microflora surface soil 6 2.6 0.1 Amidase activity 187.3 32 FrankenbergerLCT &Tabatabai.
1981
Arsenic Na2HAsO4 native soil microflora loam 6 2.6 0.1 Acid phosphatase 187.3 33 Juma &activity LCT Tabatabai.
1977.
Arsenic Na2HAsO4 native soil microflora loam 7 5.5 0.1 Alkaline phosphatase 187.3 32 Juma &activity LCT Tabatabai.
1977.
Arsenic NaAsO2 native soil microflora clay loam 8 3.2 0.1 Amidase activity 1873 98 FrankenbergerLCT &Tabatabai.
1981
Arsenic NaAsO2 native soil microflora loam 7 4.7 0.1 Amidase activity 1873 97 FrankenbergerLCT &Tabatabai.
1981
Arsenic NaAsO2 native soil microflora clay loam 8 3.7 0.1 Alkaline phosphatase 1875 35 Juma &activity LCT Tabatabai.
1977.
Arsenic Na2HAsO4 native soil microflora clay loam 8 3.7 0.1 Alkaline & 1875 75,39 Juma &acid phosphatase LCT Tabatabai.activity 1977.
Arsenic Na2HAsO4 native soil microflora loam 7 5.5 0.1 Acid phosphatase 1875 62 Juma &activity LCT Tabatabai.
1977.

B-5
Table B.1 (continued)
Chemical Chemical Organisms Growth pH %OC Exp Response NOEC LOEC % ReferenceForm Medium (d) Parameter Dec
Barium BaCl2 native soil microflora clay loam 6 2.7 0.1 Arylsulfatase activity 3433 24 Al-Khafaji &LCT Tabatabai.
1979.
Boron Na2B4O7 native soil microflora loam 7 2.9 0.1 Arylsulfatase activity 27 LCT 31 Al-Khafaji &Tabatabai.1979.
Boron Na2B4O7 native soil microflora loam 7 5.5 0.1 Acid phosphatase 270 LCT 22 Juma &activity Tabatabai.
1977.
Boron Na2B4O7 native soil microflora clay loam 6 2.7 0.1 Arylsulfatase activity 270 LCT 70 Al-Khafaji &Tabatabai.1979.
Boron Na2B4O7 native soil microflora loam 7 5.3 0.1 Arylsulfatase activity 270 LCT 60 Al-Khafaji &Tabatabai.1979.
Boron Na2B4O7 native soil microflora clay loam 8 3.2 0.1 Arylsulfatase activity 27 270 65 Al-Khafaji &Tabatabai.1979.
Boron Na2B4O7 native soil microflora loam 6 2.6 0.1 Acid phosphatase 27 270 33 Juma &activity Tabatabai.
1977.
Cadmium CdCl2 native soil microflora soil/litter 24 Respiration .006 6.1 43 Lighthart µcosm Bond. 1976.
Cadmium Cd(NO3)2 Pseudomonas sp. silt loam 7 2 4 Denitrification 10 LCT 23 Bollag &Barabasz.1979.
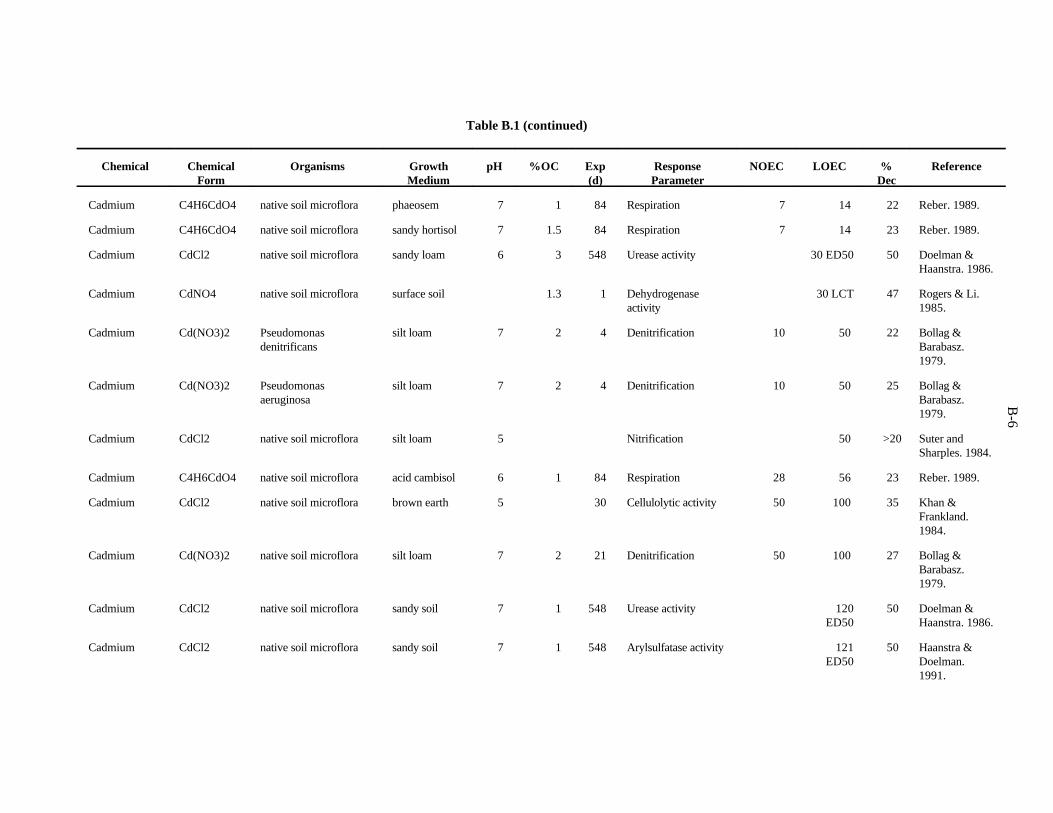
B-6
Table B.1 (continued)
Chemical Chemical Organisms Growth pH %OC Exp Response NOEC LOEC % ReferenceForm Medium (d) Parameter Dec
Cadmium C4H6CdO4 native soil microflora phaeosem 7 1 84 Respiration 7 14 22 Reber. 1989.
Cadmium C4H6CdO4 native soil microflora sandy hortisol 7 1.5 84 Respiration 7 14 23 Reber. 1989.
Cadmium CdCl2 native soil microflora sandy loam 6 3 548 Urease activity 30 ED50 50 Doelman &Haanstra. 1986.
Cadmium CdNO4 native soil microflora surface soil 1.3 1 Dehydrogenase 30 LCT 47 Rogers & Li.activity 1985.
Cadmium Cd(NO3)2 Pseudomonas silt loam 7 2 4 Denitrification 10 50 22 Bollag &denitrificans Barabasz.
1979.
Cadmium Cd(NO3)2 Pseudomonas silt loam 7 2 4 Denitrification 10 50 25 Bollag &aeruginosa Barabasz.
1979.
Cadmium CdCl2 native soil microflora silt loam 5 Nitrification 50 >20 Suter andSharples. 1984.
Cadmium C4H6CdO4 native soil microflora acid cambisol 6 1 84 Respiration 28 56 23 Reber. 1989.
Cadmium CdCl2 native soil microflora brown earth 5 30 Cellulolytic activity 50 100 35 Khan &Frankland.1984.
Cadmium Cd(NO3)2 native soil microflora silt loam 7 2 21 Denitrification 50 100 27 Bollag &Barabasz.1979.
Cadmium CdCl2 native soil microflora sandy soil 7 1 548 Urease activity 120 50 Doelman &ED50 Haanstra. 1986.
Cadmium CdCl2 native soil microflora sandy soil 7 1 548 Arylsulfatase activity 121 50 Haanstra &ED50 Doelman.
1991.
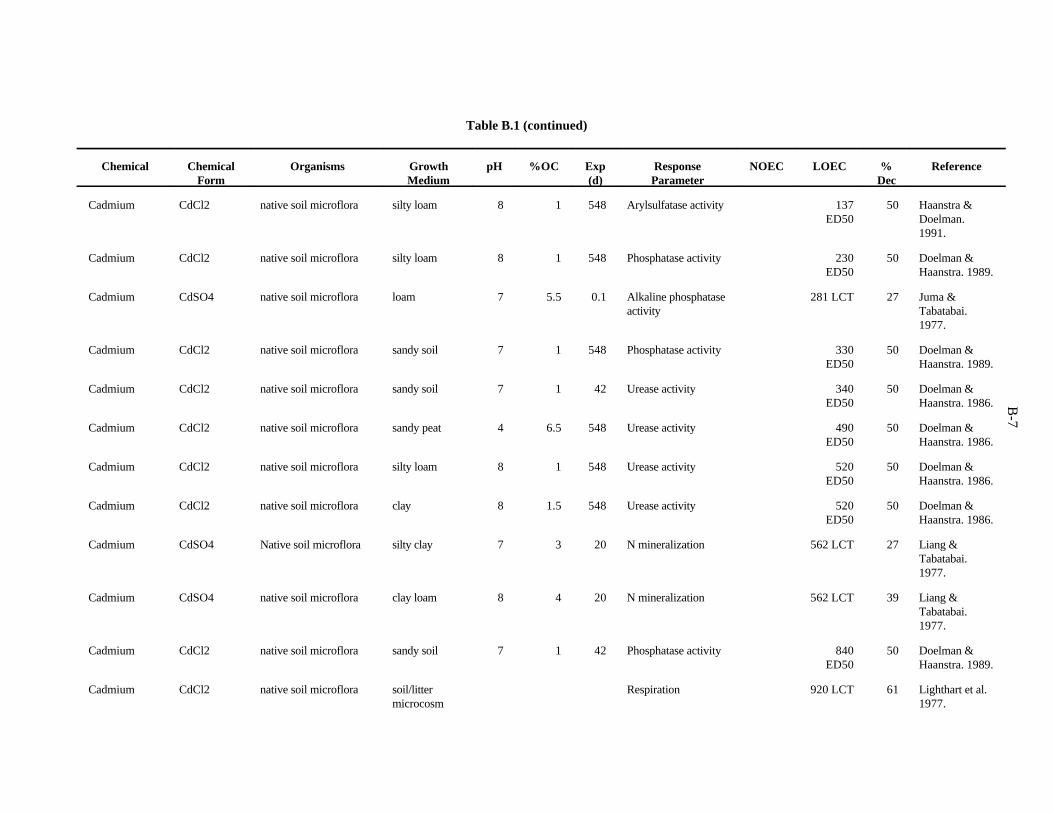
B-7
Table B.1 (continued)
Chemical Chemical Organisms Growth pH %OC Exp Response NOEC LOEC % ReferenceForm Medium (d) Parameter Dec
Cadmium CdCl2 native soil microflora silty loam 8 1 548 Arylsulfatase activity 137 50 Haanstra &ED50 Doelman.
1991.
Cadmium CdCl2 native soil microflora silty loam 8 1 548 Phosphatase activity 230 50 Doelman &ED50 Haanstra. 1989.
Cadmium CdSO4 native soil microflora loam 7 5.5 0.1 Alkaline phosphatase 281 LCT 27 Juma &activity Tabatabai.
1977.
Cadmium CdCl2 native soil microflora sandy soil 7 1 548 Phosphatase activity 330 50 Doelman &ED50 Haanstra. 1989.
Cadmium CdCl2 native soil microflora sandy soil 7 1 42 Urease activity 340 50 Doelman &ED50 Haanstra. 1986.
Cadmium CdCl2 native soil microflora sandy peat 4 6.5 548 Urease activity 490 50 Doelman &ED50 Haanstra. 1986.
Cadmium CdCl2 native soil microflora silty loam 8 1 548 Urease activity 520 50 Doelman &ED50 Haanstra. 1986.
Cadmium CdCl2 native soil microflora clay 8 1.5 548 Urease activity 520 50 Doelman &ED50 Haanstra. 1986.
Cadmium CdSO4 Native soil microflora silty clay 7 3 20 N mineralization 562 LCT 27 Liang &Tabatabai.1977.
Cadmium CdSO4 native soil microflora clay loam 8 4 20 N mineralization 562 LCT 39 Liang &Tabatabai.1977.
Cadmium CdCl2 native soil microflora sandy soil 7 1 42 Phosphatase activity 840 50 Doelman &ED50 Haanstra. 1989.
Cadmium CdCl2 native soil microflora soil/litter Respiration 920 LCT 61 Lighthart et al.microcosm 1977.

B-8
Table B.1 (continued)
Chemical Chemical Organisms Growth pH %OC Exp Response NOEC LOEC % ReferenceForm Medium (d) Parameter Dec
Cadmium CdCl2 native soil microflora silty loam 8 1 42 Urease activity 970 50 Doelman &ED50 Haanstra. 1986.
Cadmium CdSO4 native soil microflora surface soil 6 2.9 35 Nitrification 500 1000 62 Bewley &Stotzky. 1983.
Cadmium CdCl2 native soil microflora clay 8 1.5 548 Arylsulfatase activity 1016 50 Haanstra &ED50 Doelman.
1991.
Cadmium CdCl2 native soil microflora sandy loam 6 3 548 Arylsulfatase activity 1798 50 Haanstra &ED50 Doelman.
1991.
Cadmium CdCl2 native soil microflora silt loam 8 1 42 Arylsulfatase activity 1888 50 Haanstra &ED50 Doelman.
1991.
Cadmium CdCl2 native soil microflora sandy soil 7 1 42 Arylsulfatase activity 2214 50 Haanstra &ED50 Doelman.
1991.
Cadmium CdSO4 native soil microflora clay loam 8 3.7 0.1 Alkaline & 2810 78,51 Juma &acid phosphatase LCT Tabatabai.activity 1977.
Cadmium CdSO4 native soil microflora loam 7 5.5 0.1 Acid phosphatase 2810 48 Juma &activity LCT Tabatabai.
1977.
Cadmium CdSO4 native soil microflora clay loam 6 2.7 0.1 Arylsulfatase activity 2810 27 Al-Khafaji &LCT Tabatabai.
1979.
Cadmium CdSO4 native soil microflora loam 7 5.3 0.1 Arylsulfatase activity 2810 42 Al-Khafaji &LCT Tabatabai.
1979.
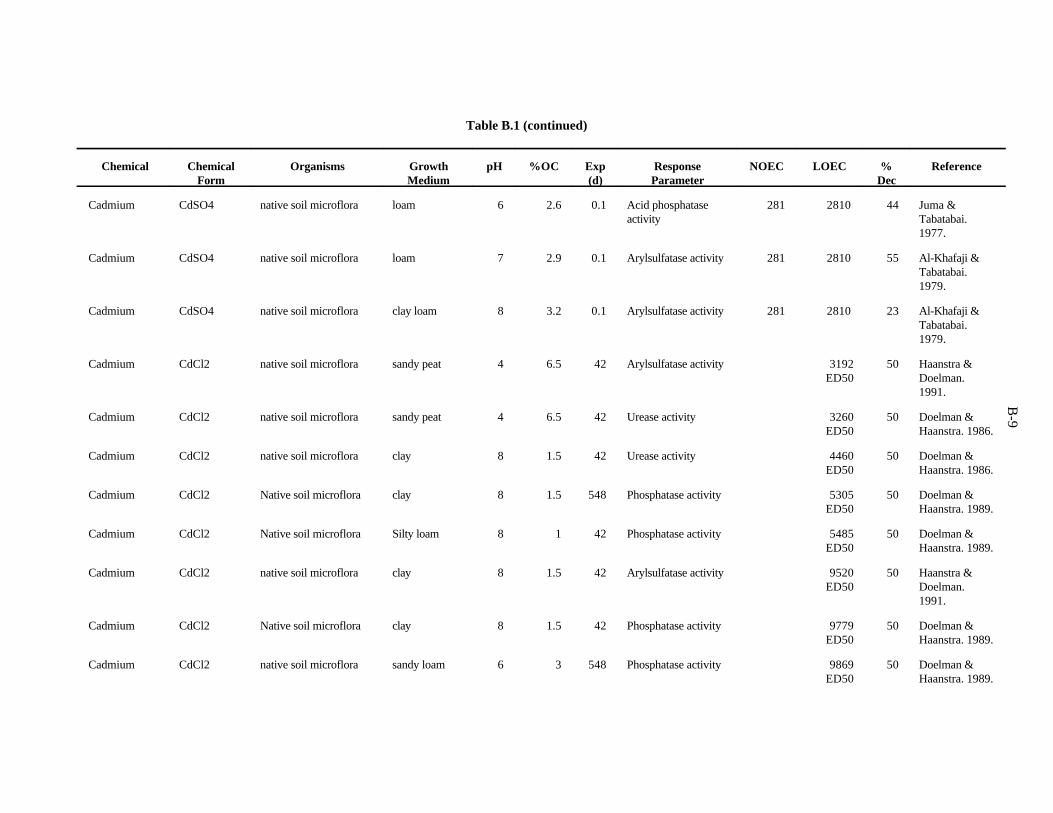
B-9
Table B.1 (continued)
Chemical Chemical Organisms Growth pH %OC Exp Response NOEC LOEC % ReferenceForm Medium (d) Parameter Dec
Cadmium CdSO4 native soil microflora loam 6 2.6 0.1 Acid phosphatase 281 2810 44 Juma &activity Tabatabai.
1977.
Cadmium CdSO4 native soil microflora loam 7 2.9 0.1 Arylsulfatase activity 281 2810 55 Al-Khafaji &Tabatabai.1979.
Cadmium CdSO4 native soil microflora clay loam 8 3.2 0.1 Arylsulfatase activity 281 2810 23 Al-Khafaji &Tabatabai.1979.
Cadmium CdCl2 native soil microflora sandy peat 4 6.5 42 Arylsulfatase activity 3192 50 Haanstra &ED50 Doelman.
1991.
Cadmium CdCl2 native soil microflora sandy peat 4 6.5 42 Urease activity 3260 50 Doelman &ED50 Haanstra. 1986.
Cadmium CdCl2 native soil microflora clay 8 1.5 42 Urease activity 4460 50 Doelman &ED50 Haanstra. 1986.
Cadmium CdCl2 Native soil microflora clay 8 1.5 548 Phosphatase activity 5305 50 Doelman &ED50 Haanstra. 1989.
Cadmium CdCl2 Native soil microflora Silty loam 8 1 42 Phosphatase activity 5485 50 Doelman &ED50 Haanstra. 1989.
Cadmium CdCl2 native soil microflora clay 8 1.5 42 Arylsulfatase activity 9520 50 Haanstra &ED50 Doelman.
1991.
Cadmium CdCl2 Native soil microflora clay 8 1.5 42 Phosphatase activity 9779 50 Doelman &ED50 Haanstra. 1989.
Cadmium CdCl2 native soil microflora sandy loam 6 3 548 Phosphatase activity 9869 50 Doelman &ED50 Haanstra. 1989.
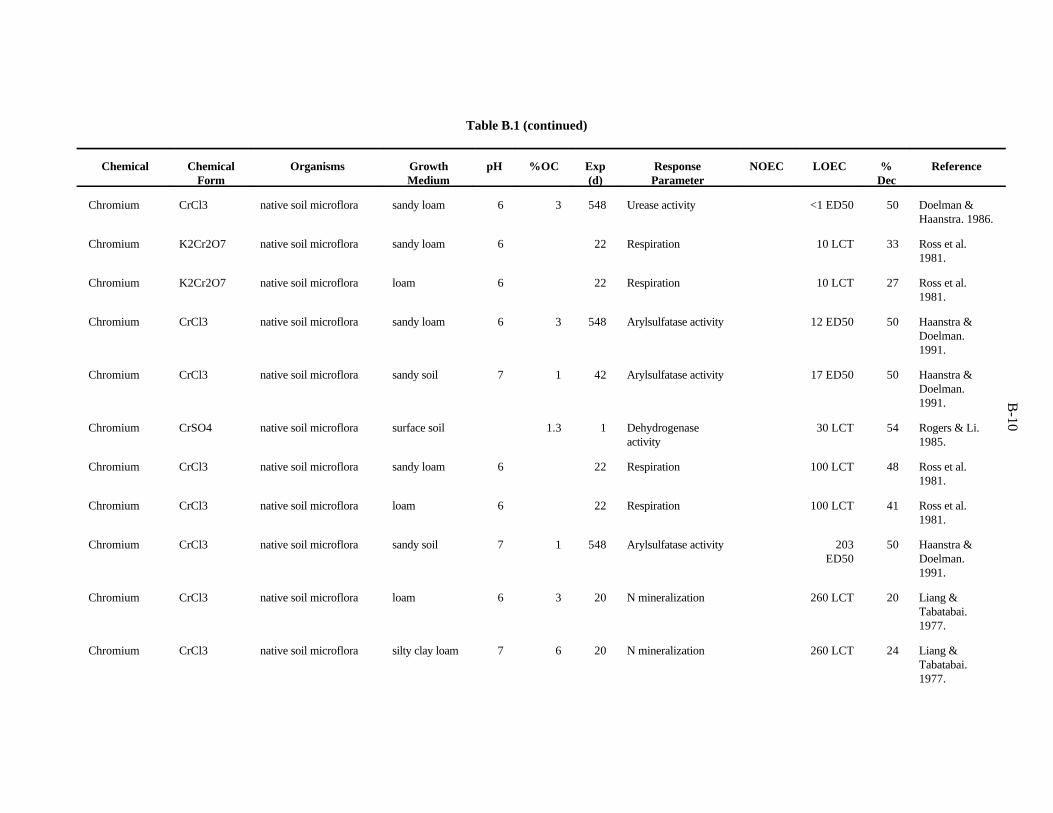
B-10
Table B.1 (continued)
Chemical Chemical Organisms Growth pH %OC Exp Response NOEC LOEC % ReferenceForm Medium (d) Parameter Dec
Chromium CrCl3 native soil microflora sandy loam 6 3 548 Urease activity <1 ED50 50 Doelman &Haanstra. 1986.
Chromium K2Cr2O7 native soil microflora sandy loam 6 22 Respiration 10 LCT 33 Ross et al.1981.
Chromium K2Cr2O7 native soil microflora loam 6 22 Respiration 10 LCT 27 Ross et al.1981.
Chromium CrCl3 native soil microflora sandy loam 6 3 548 Arylsulfatase activity 12 ED50 50 Haanstra &Doelman.1991.
Chromium CrCl3 native soil microflora sandy soil 7 1 42 Arylsulfatase activity 17 ED50 50 Haanstra &Doelman.1991.
Chromium CrSO4 native soil microflora surface soil 1.3 1 Dehydrogenase 30 LCT 54 Rogers & Li.activity 1985.
Chromium CrCl3 native soil microflora sandy loam 6 22 Respiration 100 LCT 48 Ross et al.1981.
Chromium CrCl3 native soil microflora loam 6 22 Respiration 100 LCT 41 Ross et al.1981.
Chromium CrCl3 native soil microflora sandy soil 7 1 548 Arylsulfatase activity 203 50 Haanstra &ED50 Doelman.
1991.
Chromium CrCl3 native soil microflora loam 6 3 20 N mineralization 260 LCT 20 Liang &Tabatabai.1977.
Chromium CrCl3 native soil microflora silty clay loam 7 6 20 N mineralization 260 LCT 24 Liang &Tabatabai.1977.
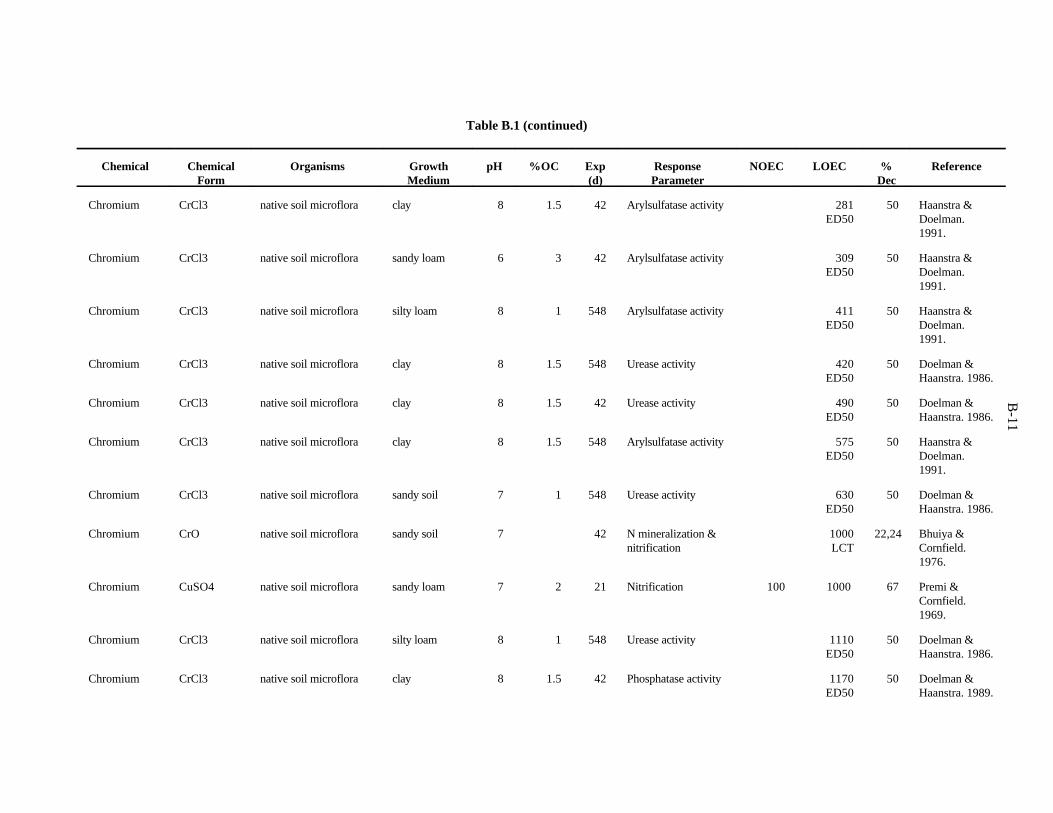
B-11
Table B.1 (continued)
Chemical Chemical Organisms Growth pH %OC Exp Response NOEC LOEC % ReferenceForm Medium (d) Parameter Dec
Chromium CrCl3 native soil microflora clay 8 1.5 42 Arylsulfatase activity 281 50 Haanstra &ED50 Doelman.
1991.
Chromium CrCl3 native soil microflora sandy loam 6 3 42 Arylsulfatase activity 309 50 Haanstra &ED50 Doelman.
1991.
Chromium CrCl3 native soil microflora silty loam 8 1 548 Arylsulfatase activity 411 50 Haanstra &ED50 Doelman.
1991.
Chromium CrCl3 native soil microflora clay 8 1.5 548 Urease activity 420 50 Doelman &ED50 Haanstra. 1986.
Chromium CrCl3 native soil microflora clay 8 1.5 42 Urease activity 490 50 Doelman &ED50 Haanstra. 1986.
Chromium CrCl3 native soil microflora clay 8 1.5 548 Arylsulfatase activity 575 50 Haanstra &ED50 Doelman.
1991.
Chromium CrCl3 native soil microflora sandy soil 7 1 548 Urease activity 630 50 Doelman &ED50 Haanstra. 1986.
Chromium CrO native soil microflora sandy soil 7 42 N mineralization & 1000 22,24 Bhuiya &nitrification LCT Cornfield.
1976.
Chromium CuSO4 native soil microflora sandy loam 7 2 21 Nitrification 100 1000 67 Premi &Cornfield.1969.
Chromium CrCl3 native soil microflora silty loam 8 1 548 Urease activity 1110 50 Doelman &ED50 Haanstra. 1986.
Chromium CrCl3 native soil microflora clay 8 1.5 42 Phosphatase activity 1170 50 Doelman &ED50 Haanstra. 1989.
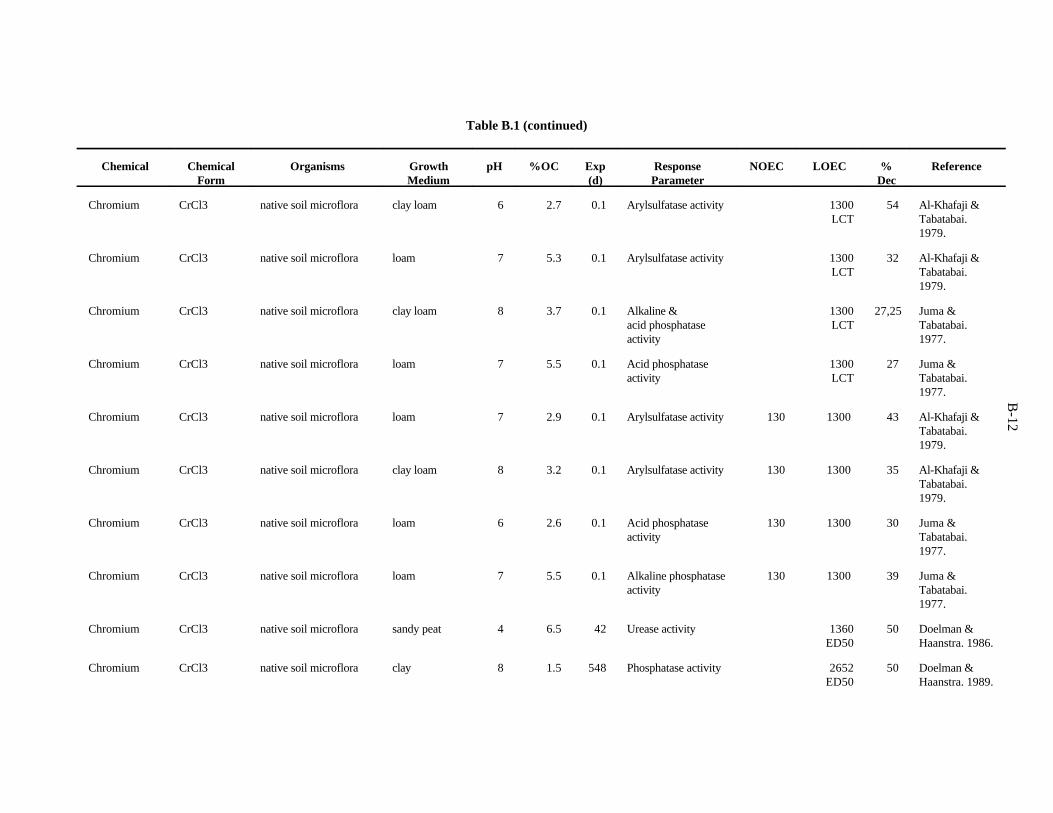
B-12
Table B.1 (continued)
Chemical Chemical Organisms Growth pH %OC Exp Response NOEC LOEC % ReferenceForm Medium (d) Parameter Dec
Chromium CrCl3 native soil microflora clay loam 6 2.7 0.1 Arylsulfatase activity 1300 54 Al-Khafaji &LCT Tabatabai.
1979.
Chromium CrCl3 native soil microflora loam 7 5.3 0.1 Arylsulfatase activity 1300 32 Al-Khafaji &LCT Tabatabai.
1979.
Chromium CrCl3 native soil microflora clay loam 8 3.7 0.1 Alkaline & 1300 27,25 Juma &acid phosphatase LCT Tabatabai.activity 1977.
Chromium CrCl3 native soil microflora loam 7 5.5 0.1 Acid phosphatase 1300 27 Juma &activity LCT Tabatabai.
1977.
Chromium CrCl3 native soil microflora loam 7 2.9 0.1 Arylsulfatase activity 130 1300 43 Al-Khafaji &Tabatabai.1979.
Chromium CrCl3 native soil microflora clay loam 8 3.2 0.1 Arylsulfatase activity 130 1300 35 Al-Khafaji &Tabatabai.1979.
Chromium CrCl3 native soil microflora loam 6 2.6 0.1 Acid phosphatase 130 1300 30 Juma &activity Tabatabai.
1977.
Chromium CrCl3 native soil microflora loam 7 5.5 0.1 Alkaline phosphatase 130 1300 39 Juma &activity Tabatabai.
1977.
Chromium CrCl3 native soil microflora sandy peat 4 6.5 42 Urease activity 1360 50 Doelman &ED50 Haanstra. 1986.
Chromium CrCl3 native soil microflora clay 8 1.5 548 Phosphatase activity 2652 50 Doelman &ED50 Haanstra. 1989.
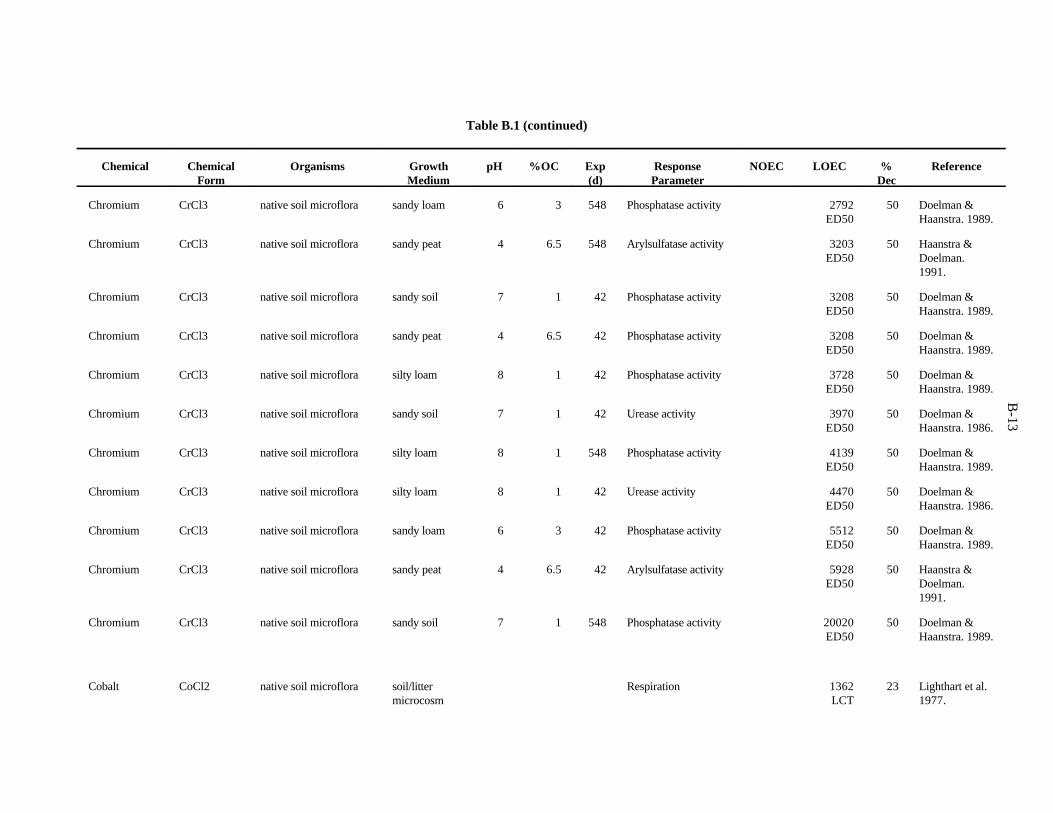
B-13
Table B.1 (continued)
Chemical Chemical Organisms Growth pH %OC Exp Response NOEC LOEC % ReferenceForm Medium (d) Parameter Dec
Chromium CrCl3 native soil microflora sandy loam 6 3 548 Phosphatase activity 2792 50 Doelman &ED50 Haanstra. 1989.
Chromium CrCl3 native soil microflora sandy peat 4 6.5 548 Arylsulfatase activity 3203 50 Haanstra &ED50 Doelman.
1991.
Chromium CrCl3 native soil microflora sandy soil 7 1 42 Phosphatase activity 3208 50 Doelman &ED50 Haanstra. 1989.
Chromium CrCl3 native soil microflora sandy peat 4 6.5 42 Phosphatase activity 3208 50 Doelman &ED50 Haanstra. 1989.
Chromium CrCl3 native soil microflora silty loam 8 1 42 Phosphatase activity 3728 50 Doelman &ED50 Haanstra. 1989.
Chromium CrCl3 native soil microflora sandy soil 7 1 42 Urease activity 3970 50 Doelman &ED50 Haanstra. 1986.
Chromium CrCl3 native soil microflora silty loam 8 1 548 Phosphatase activity 4139 50 Doelman &ED50 Haanstra. 1989.
Chromium CrCl3 native soil microflora silty loam 8 1 42 Urease activity 4470 50 Doelman &ED50 Haanstra. 1986.
Chromium CrCl3 native soil microflora sandy loam 6 3 42 Phosphatase activity 5512 50 Doelman &ED50 Haanstra. 1989.
Chromium CrCl3 native soil microflora sandy peat 4 6.5 42 Arylsulfatase activity 5928 50 Haanstra &ED50 Doelman.
1991.
Chromium CrCl3 native soil microflora sandy soil 7 1 548 Phosphatase activity 20020 50 Doelman &ED50 Haanstra. 1989.
Cobalt CoCl2 native soil microflora soil/litter Respiration 1362 23 Lighthart et al.microcosm LCT 1977.
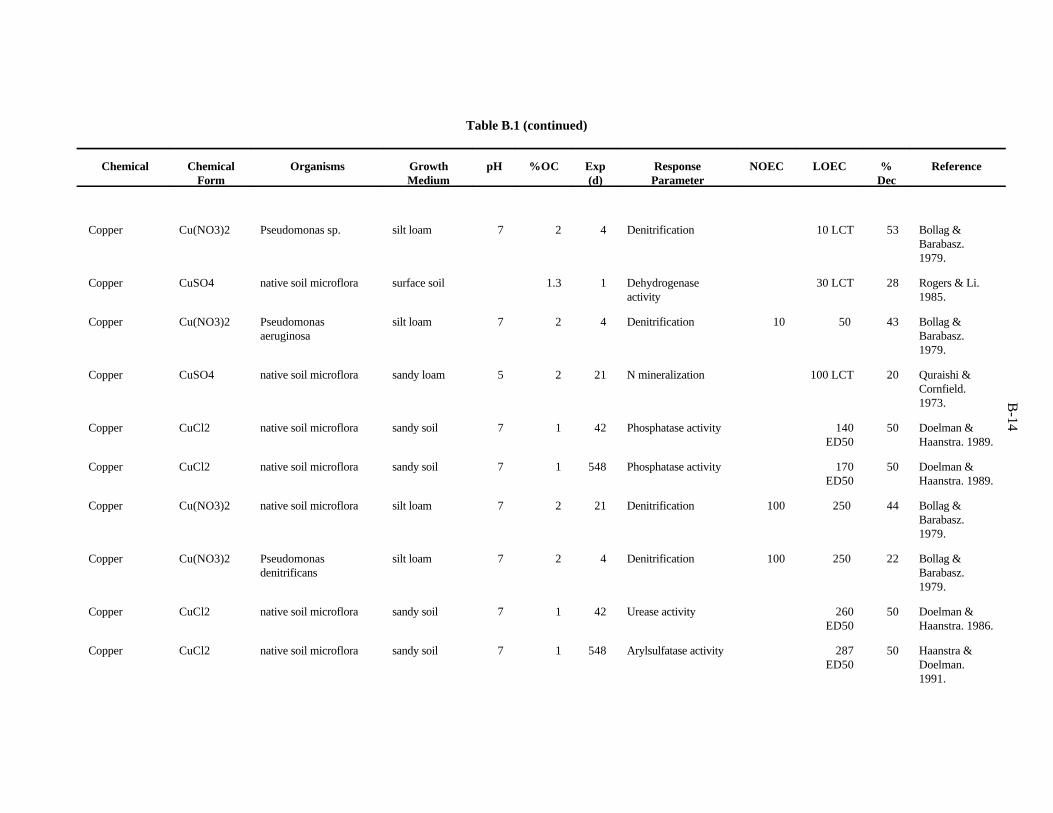
B-14
Table B.1 (continued)
Chemical Chemical Organisms Growth pH %OC Exp Response NOEC LOEC % ReferenceForm Medium (d) Parameter Dec
Copper Cu(NO3)2 Pseudomonas sp. silt loam 7 2 4 Denitrification 10 LCT 53 Bollag &Barabasz.1979.
Copper CuSO4 native soil microflora surface soil 1.3 1 Dehydrogenase 30 LCT 28 Rogers & Li.activity 1985.
Copper Cu(NO3)2 Pseudomonas silt loam 7 2 4 Denitrification 10 50 43 Bollag &aeruginosa Barabasz.
1979.
Copper CuSO4 native soil microflora sandy loam 5 2 21 N mineralization 100 LCT 20 Quraishi &Cornfield.1973.
Copper CuCl2 native soil microflora sandy soil 7 1 42 Phosphatase activity 140 50 Doelman &ED50 Haanstra. 1989.
Copper CuCl2 native soil microflora sandy soil 7 1 548 Phosphatase activity 170 50 Doelman &ED50 Haanstra. 1989.
Copper Cu(NO3)2 native soil microflora silt loam 7 2 21 Denitrification 100 250 44 Bollag &Barabasz.1979.
Copper Cu(NO3)2 Pseudomonas silt loam 7 2 4 Denitrification 100 250 22 Bollag &denitrificans Barabasz.
1979.
Copper CuCl2 native soil microflora sandy soil 7 1 42 Urease activity 260 50 Doelman &ED50 Haanstra. 1986.
Copper CuCl2 native soil microflora sandy soil 7 1 548 Arylsulfatase activity 287 50 Haanstra &ED50 Doelman.
1991.

B-15
Table B.1 (continued)
Chemical Chemical Organisms Growth pH %OC Exp Response NOEC LOEC % ReferenceForm Medium (d) Parameter Dec
Copper CuSO4 native soil microflora silty clay loam 7 6 20 N mineralization 320 LCT 82 Liang &Tabatabai.1977.
Copper CuCl2 native soil microflora sandy soil 7 1 42 Arylsulfatase activity 391 50 Haanstra &ED50 Doelman.
1991.
Copper CuCl2 native soil microflora silt loam 5 Nitrification 500 >2 Suter andSharples. 1984.
Copper CuCl2 native soil microflora sandy loam 6 3 548 Arylsulfatase activity 548 50 Haanstra &ED50 Doelman.
1991.
Copper CuCl2 native soil microflora sandy loam 6 3 42 Urease activity 570 50 Doelman &ED50 Haanstra. 1986.
Copper CuCl2 native soil microflora sandy soil 7 1 548 Urease activity 680 50 Doelman &ED50 Haanstra. 1986.
Copper CuCl2 native soil microflora silty loam 8 1 548 Phosphatase activity 744 50 Doelman &ED50 Haanstra. 1989.
Copper CuCl2 native soil microflora silty loam 8 1 548 Arylsulfatase activity 763 50 Haanstra &ED50 Doelman.
1991.
Copper CuCl2 native soil microflora sandy loam 6 3 42 Arylsulfatase activity 967 50 Haanstra &ED50 Doelman.
1991.
Copper CuO native soil microflora sandy soil 6 2 84 C mineralization 1000 33 Bhuiya &LCT Cornfield.
1972.
Copper CuSO4 native soil microflora sandy loam 8 2 56 Nitrification 100 1000 38 Premi &Cornfield.1969/1970.
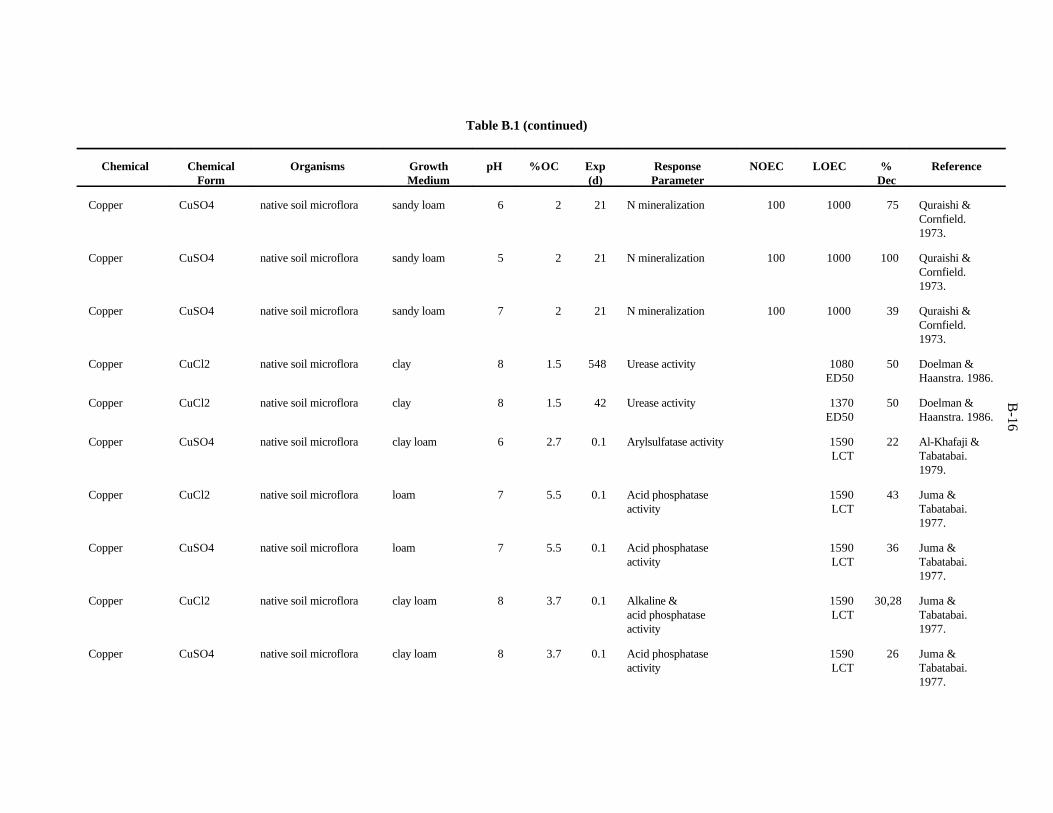
B-16
Table B.1 (continued)
Chemical Chemical Organisms Growth pH %OC Exp Response NOEC LOEC % ReferenceForm Medium (d) Parameter Dec
Copper CuSO4 native soil microflora sandy loam 6 2 21 N mineralization 100 1000 75 Quraishi &Cornfield.1973.
Copper CuSO4 native soil microflora sandy loam 5 2 21 N mineralization 100 1000 100 Quraishi &Cornfield.1973.
Copper CuSO4 native soil microflora sandy loam 7 2 21 N mineralization 100 1000 39 Quraishi &Cornfield.1973.
Copper CuCl2 native soil microflora clay 8 1.5 548 Urease activity 1080 50 Doelman &ED50 Haanstra. 1986.
Copper CuCl2 native soil microflora clay 8 1.5 42 Urease activity 1370 50 Doelman &ED50 Haanstra. 1986.
Copper CuSO4 native soil microflora clay loam 6 2.7 0.1 Arylsulfatase activity 1590 22 Al-Khafaji &LCT Tabatabai.
1979.
Copper CuCl2 native soil microflora loam 7 5.5 0.1 Acid phosphatase 1590 43 Juma &activity LCT Tabatabai.
1977.
Copper CuSO4 native soil microflora loam 7 5.5 0.1 Acid phosphatase 1590 36 Juma &activity LCT Tabatabai.
1977.
Copper CuCl2 native soil microflora clay loam 8 3.7 0.1 Alkaline & 1590 30,28 Juma &acid phosphatase LCT Tabatabai.activity 1977.
Copper CuSO4 native soil microflora clay loam 8 3.7 0.1 Acid phosphatase 1590 26 Juma &activity LCT Tabatabai.
1977.
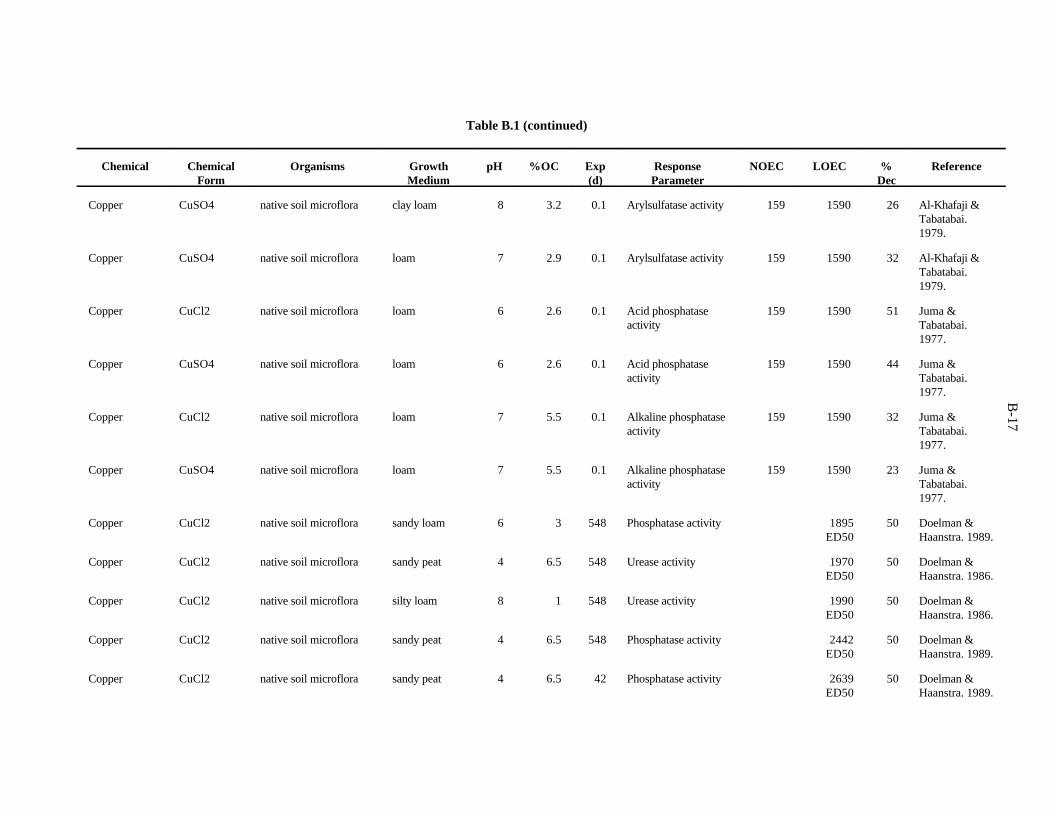
B-17
Table B.1 (continued)
Chemical Chemical Organisms Growth pH %OC Exp Response NOEC LOEC % ReferenceForm Medium (d) Parameter Dec
Copper CuSO4 native soil microflora clay loam 8 3.2 0.1 Arylsulfatase activity 159 1590 26 Al-Khafaji &Tabatabai.1979.
Copper CuSO4 native soil microflora loam 7 2.9 0.1 Arylsulfatase activity 159 1590 32 Al-Khafaji &Tabatabai.1979.
Copper CuCl2 native soil microflora loam 6 2.6 0.1 Acid phosphatase 159 1590 51 Juma &activity Tabatabai.
1977.
Copper CuSO4 native soil microflora loam 6 2.6 0.1 Acid phosphatase 159 1590 44 Juma &activity Tabatabai.
1977.
Copper CuCl2 native soil microflora loam 7 5.5 0.1 Alkaline phosphatase 159 1590 32 Juma &activity Tabatabai.
1977.
Copper CuSO4 native soil microflora loam 7 5.5 0.1 Alkaline phosphatase 159 1590 23 Juma &activity Tabatabai.
1977.
Copper CuCl2 native soil microflora sandy loam 6 3 548 Phosphatase activity 1895 50 Doelman &ED50 Haanstra. 1989.
Copper CuCl2 native soil microflora sandy peat 4 6.5 548 Urease activity 1970 50 Doelman &ED50 Haanstra. 1986.
Copper CuCl2 native soil microflora silty loam 8 1 548 Urease activity 1990 50 Doelman &ED50 Haanstra. 1986.
Copper CuCl2 native soil microflora sandy peat 4 6.5 548 Phosphatase activity 2442 50 Doelman &ED50 Haanstra. 1989.
Copper CuCl2 native soil microflora sandy peat 4 6.5 42 Phosphatase activity 2639 50 Doelman &ED50 Haanstra. 1989.
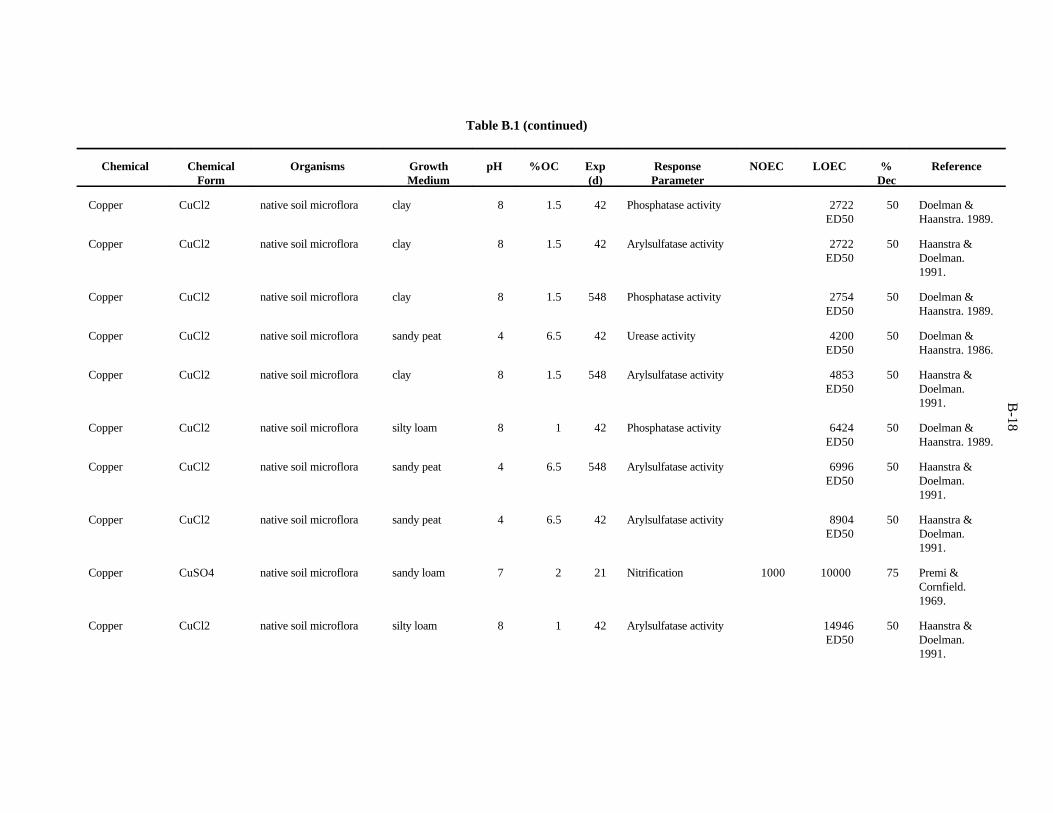
B-18
Table B.1 (continued)
Chemical Chemical Organisms Growth pH %OC Exp Response NOEC LOEC % ReferenceForm Medium (d) Parameter Dec
Copper CuCl2 native soil microflora clay 8 1.5 42 Phosphatase activity 2722 50 Doelman &ED50 Haanstra. 1989.
Copper CuCl2 native soil microflora clay 8 1.5 42 Arylsulfatase activity 2722 50 Haanstra &ED50 Doelman.
1991.
Copper CuCl2 native soil microflora clay 8 1.5 548 Phosphatase activity 2754 50 Doelman &ED50 Haanstra. 1989.
Copper CuCl2 native soil microflora sandy peat 4 6.5 42 Urease activity 4200 50 Doelman &ED50 Haanstra. 1986.
Copper CuCl2 native soil microflora clay 8 1.5 548 Arylsulfatase activity 4853 50 Haanstra &ED50 Doelman.
1991.
Copper CuCl2 native soil microflora silty loam 8 1 42 Phosphatase activity 6424 50 Doelman &ED50 Haanstra. 1989.
Copper CuCl2 native soil microflora sandy peat 4 6.5 548 Arylsulfatase activity 6996 50 Haanstra &ED50 Doelman.
1991.
Copper CuCl2 native soil microflora sandy peat 4 6.5 42 Arylsulfatase activity 8904 50 Haanstra &ED50 Doelman.
1991.
Copper CuSO4 native soil microflora sandy loam 7 2 21 Nitrification 1000 10000 75 Premi &Cornfield.1969.
Copper CuCl2 native soil microflora silty loam 8 1 42 Arylsulfatase activity 14946 50 Haanstra &ED50 Doelman.
1991.
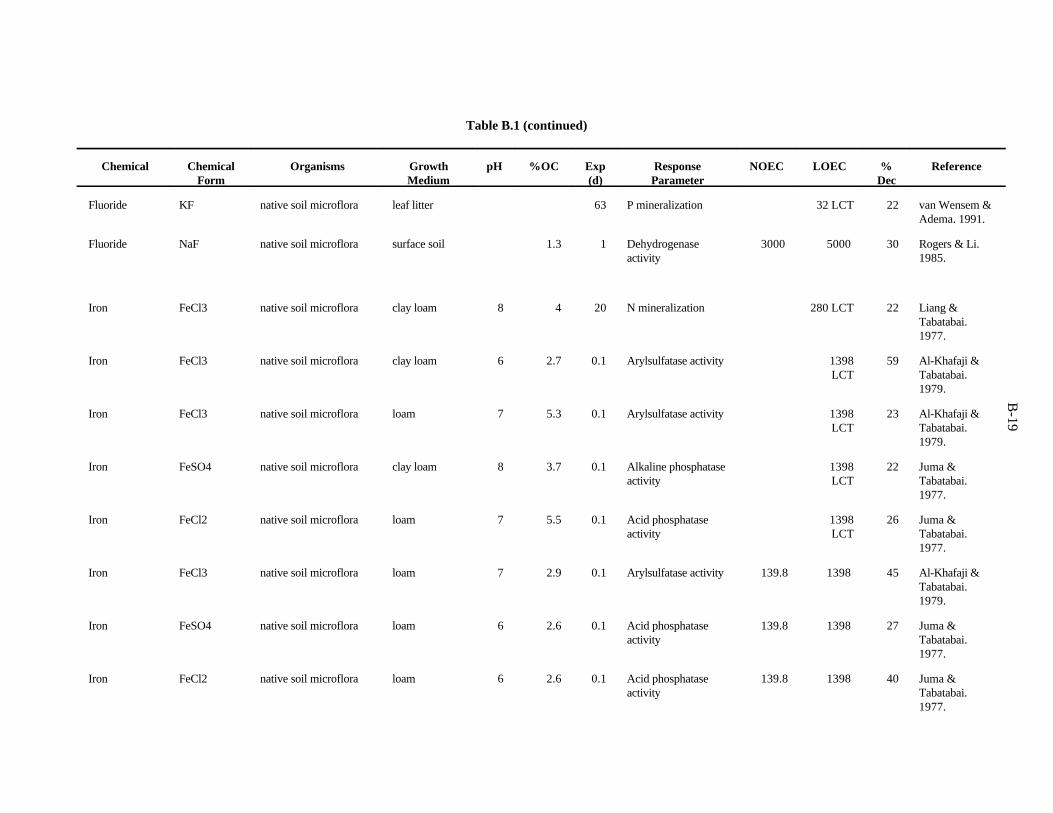
B-19
Table B.1 (continued)
Chemical Chemical Organisms Growth pH %OC Exp Response NOEC LOEC % ReferenceForm Medium (d) Parameter Dec
Fluoride KF native soil microflora leaf litter 63 P mineralization 32 LCT 22 van Wensem &Adema. 1991.
Fluoride NaF native soil microflora surface soil 1.3 1 Dehydrogenase 3000 5000 30 Rogers & Li.activity 1985.
Iron FeCl3 native soil microflora clay loam 8 4 20 N mineralization 280 LCT 22 Liang &Tabatabai.1977.
Iron FeCl3 native soil microflora clay loam 6 2.7 0.1 Arylsulfatase activity 1398 59 Al-Khafaji &LCT Tabatabai.
1979.
Iron FeCl3 native soil microflora loam 7 5.3 0.1 Arylsulfatase activity 1398 23 Al-Khafaji &LCT Tabatabai.
1979.
Iron FeSO4 native soil microflora clay loam 8 3.7 0.1 Alkaline phosphatase 1398 22 Juma &activity LCT Tabatabai.
1977.
Iron FeCl2 native soil microflora loam 7 5.5 0.1 Acid phosphatase 1398 26 Juma &activity LCT Tabatabai.
1977.
Iron FeCl3 native soil microflora loam 7 2.9 0.1 Arylsulfatase activity 139.8 1398 45 Al-Khafaji &Tabatabai.1979.
Iron FeSO4 native soil microflora loam 6 2.6 0.1 Acid phosphatase 139.8 1398 27 Juma &activity Tabatabai.
1977.
Iron FeCl2 native soil microflora loam 6 2.6 0.1 Acid phosphatase 139.8 1398 40 Juma &activity Tabatabai.
1977.
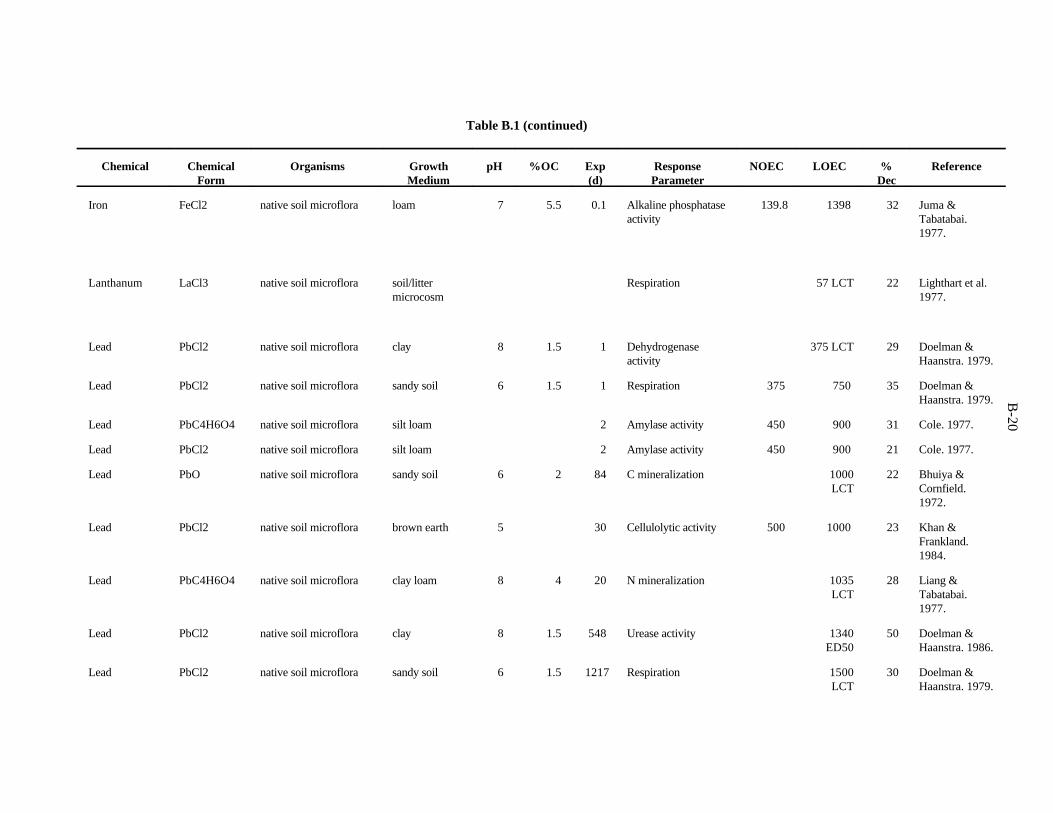
B-20
Table B.1 (continued)
Chemical Chemical Organisms Growth pH %OC Exp Response NOEC LOEC % ReferenceForm Medium (d) Parameter Dec
Iron FeCl2 native soil microflora loam 7 5.5 0.1 Alkaline phosphatase 139.8 1398 32 Juma &activity Tabatabai.
1977.
Lanthanum LaCl3 native soil microflora soil/litter Respiration 57 LCT 22 Lighthart et al.microcosm 1977.
Lead PbCl2 native soil microflora clay 8 1.5 1 Dehydrogenase 375 LCT 29 Doelman &activity Haanstra. 1979.
Lead PbCl2 native soil microflora sandy soil 6 1.5 1 Respiration 375 750 35 Doelman &Haanstra. 1979.
Lead PbC4H6O4 native soil microflora silt loam 2 Amylase activity 450 900 31 Cole. 1977.
Lead PbCl2 native soil microflora silt loam 2 Amylase activity 450 900 21 Cole. 1977.
Lead PbO native soil microflora sandy soil 6 2 84 C mineralization 1000 22 Bhuiya &LCT Cornfield.
1972.
Lead PbCl2 native soil microflora brown earth 5 30 Cellulolytic activity 500 1000 23 Khan &Frankland.1984.
Lead PbC4H6O4 native soil microflora clay loam 8 4 20 N mineralization 1035 28 Liang &LCT Tabatabai.
1977.
Lead PbCl2 native soil microflora clay 8 1.5 548 Urease activity 1340 50 Doelman &ED50 Haanstra. 1986.
Lead PbCl2 native soil microflora sandy soil 6 1.5 1217 Respiration 1500 30 Doelman &LCT Haanstra. 1979.

B-21
Table B.1 (continued)
Chemical Chemical Organisms Growth pH %OC Exp Response NOEC LOEC % ReferenceForm Medium (d) Parameter Dec
Lead PbCl2 native soil microflora sandy soil 5 3 1 Dehydrogenase 750 1500 78 Doelman &activity Haanstra. 1979.
Lead PbCl2 native soil microflora sandy soil 7 1 548 Urease activity 1590 50 Doelman &ED50 Haanstra. 1986.
Lead PbS native soil microflora silt loam 2 Amylase activity 900 1800 58 Cole. 1977.
Lead PbC4H6O4 native soil microflora silt loam 4 alpha-glucosidase 2000 38 Cole. 1977.synthesis LCT
Lead PbC4H6O4 native soil microflora silt loam 2 Amylase activity 2000 74 Cole. 1977.LCT
Lead PbC4H6O4 native soil microflora silt loam 5 Bacterial population 2000 37 Cole. 1977.size LCT
Lead PbCl2 native soil microflora sandy loam 6 3 548 Urease activity 2870 50 Doelman &ED50 Haanstra. 1986.
Lead PbCl2 native soil microflora sandy loam 6 3 548 Arylsulfatase activity 3004 50 Haanstra &ED50 Doelman.
1991.
Lead PbCl2 native soil microflora silty loam 8 1 548 Arylsulfatase activity 4538 50 Haanstra &ED50 Doelman.
1991.
Lead PbCl2 native soil microflora sandy loam 6 3 42 Urease activity 5060 50 Doelman &ED50 Haanstra. 1986.
Lead PbC4H6O4 native soil microflora clay loam 8 3.7 0.1 Alkaline phosphatase 5175 33 Juma &activity LCT Tabatabai.
1977.
Lead PbNO3 native soil microflora clay loam 8 3.7 0.1 Alkaline phosphatase 5175 38 Juma &activity LCT Tabatabai.
1977.
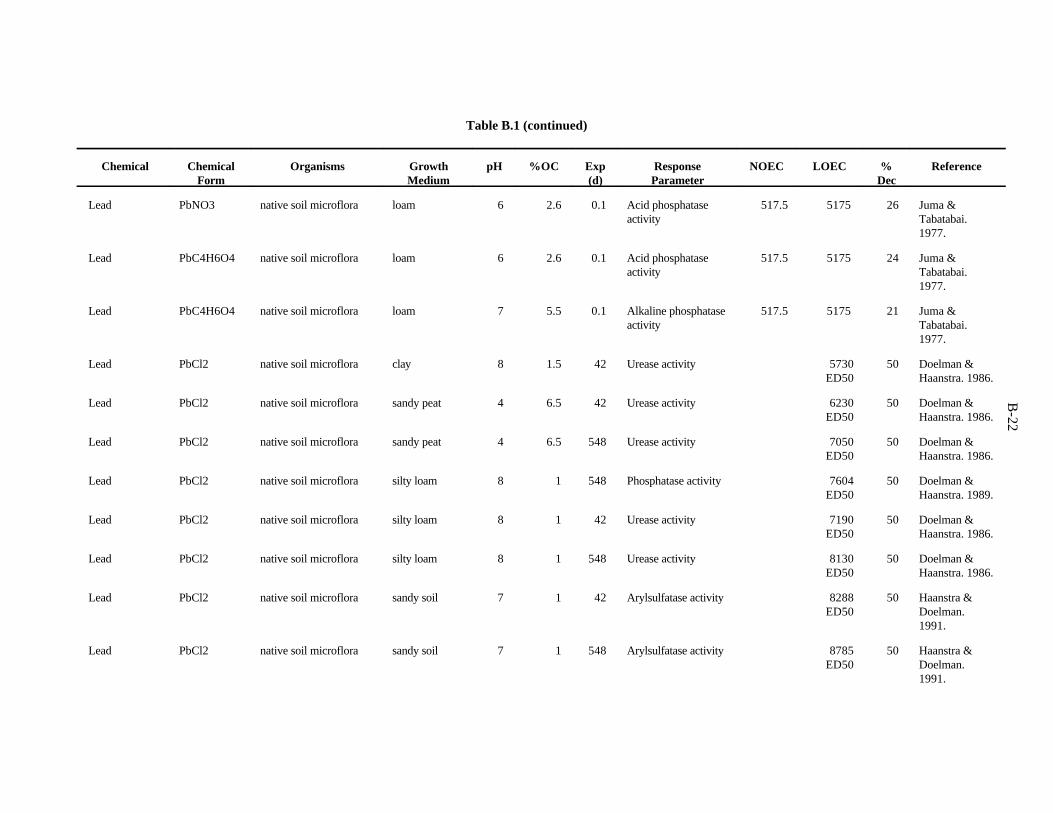
B-22
Table B.1 (continued)
Chemical Chemical Organisms Growth pH %OC Exp Response NOEC LOEC % ReferenceForm Medium (d) Parameter Dec
Lead PbNO3 native soil microflora loam 6 2.6 0.1 Acid phosphatase 517.5 5175 26 Juma &activity Tabatabai.
1977.
Lead PbC4H6O4 native soil microflora loam 6 2.6 0.1 Acid phosphatase 517.5 5175 24 Juma &activity Tabatabai.
1977.
Lead PbC4H6O4 native soil microflora loam 7 5.5 0.1 Alkaline phosphatase 517.5 5175 21 Juma &activity Tabatabai.
1977.
Lead PbCl2 native soil microflora clay 8 1.5 42 Urease activity 5730 50 Doelman &ED50 Haanstra. 1986.
Lead PbCl2 native soil microflora sandy peat 4 6.5 42 Urease activity 6230 50 Doelman &ED50 Haanstra. 1986.
Lead PbCl2 native soil microflora sandy peat 4 6.5 548 Urease activity 7050 50 Doelman &ED50 Haanstra. 1986.
Lead PbCl2 native soil microflora silty loam 8 1 548 Phosphatase activity 7604 50 Doelman &ED50 Haanstra. 1989.
Lead PbCl2 native soil microflora silty loam 8 1 42 Urease activity 7190 50 Doelman &ED50 Haanstra. 1986.
Lead PbCl2 native soil microflora silty loam 8 1 548 Urease activity 8130 50 Doelman &ED50 Haanstra. 1986.
Lead PbCl2 native soil microflora sandy soil 7 1 42 Arylsulfatase activity 8288 50 Haanstra &ED50 Doelman.
1991.
Lead PbCl2 native soil microflora sandy soil 7 1 548 Arylsulfatase activity 8785 50 Haanstra &ED50 Doelman.
1991.
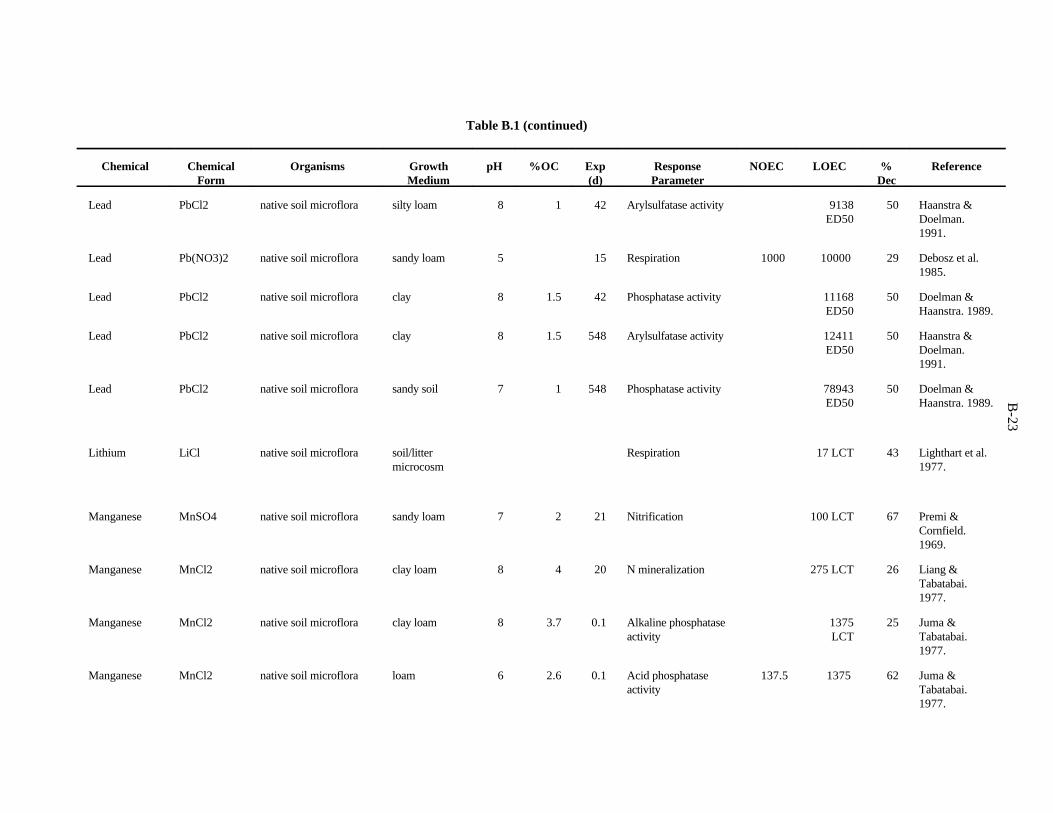
B-23
Table B.1 (continued)
Chemical Chemical Organisms Growth pH %OC Exp Response NOEC LOEC % ReferenceForm Medium (d) Parameter Dec
Lead PbCl2 native soil microflora silty loam 8 1 42 Arylsulfatase activity 9138 50 Haanstra &ED50 Doelman.
1991.
Lead Pb(NO3)2 native soil microflora sandy loam 5 15 Respiration 1000 10000 29 Debosz et al.1985.
Lead PbCl2 native soil microflora clay 8 1.5 42 Phosphatase activity 11168 50 Doelman &ED50 Haanstra. 1989.
Lead PbCl2 native soil microflora clay 8 1.5 548 Arylsulfatase activity 12411 50 Haanstra &ED50 Doelman.
1991.
Lead PbCl2 native soil microflora sandy soil 7 1 548 Phosphatase activity 78943 50 Doelman &ED50 Haanstra. 1989.
Lithium LiCl native soil microflora soil/litter Respiration 17 LCT 43 Lighthart et al.microcosm 1977.
Manganese MnSO4 native soil microflora sandy loam 7 2 21 Nitrification 100 LCT 67 Premi &Cornfield.1969.
Manganese MnCl2 native soil microflora clay loam 8 4 20 N mineralization 275 LCT 26 Liang &Tabatabai.1977.
Manganese MnCl2 native soil microflora clay loam 8 3.7 0.1 Alkaline phosphatase 1375 25 Juma &activity LCT Tabatabai.
1977.
Manganese MnCl2 native soil microflora loam 6 2.6 0.1 Acid phosphatase 137.5 1375 62 Juma &activity Tabatabai.
1977.
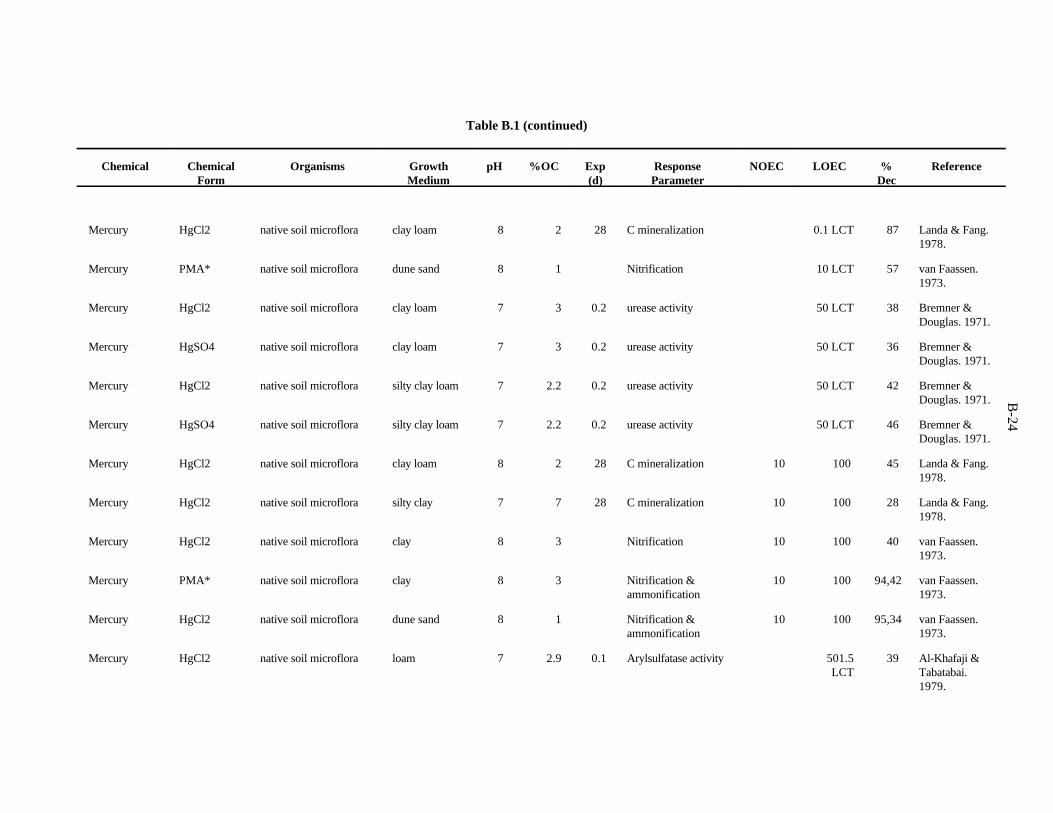
B-24
Table B.1 (continued)
Chemical Chemical Organisms Growth pH %OC Exp Response NOEC LOEC % ReferenceForm Medium (d) Parameter Dec
Mercury HgCl2 native soil microflora clay loam 8 2 28 C mineralization 0.1 LCT 87 Landa & Fang.1978.
Mercury PMA* native soil microflora dune sand 8 1 Nitrification 10 LCT 57 van Faassen.1973.
Mercury HgCl2 native soil microflora clay loam 7 3 0.2 urease activity 50 LCT 38 Bremner &Douglas. 1971.
Mercury HgSO4 native soil microflora clay loam 7 3 0.2 urease activity 50 LCT 36 Bremner &Douglas. 1971.
Mercury HgCl2 native soil microflora silty clay loam 7 2.2 0.2 urease activity 50 LCT 42 Bremner &Douglas. 1971.
Mercury HgSO4 native soil microflora silty clay loam 7 2.2 0.2 urease activity 50 LCT 46 Bremner &Douglas. 1971.
Mercury HgCl2 native soil microflora clay loam 8 2 28 C mineralization 10 100 45 Landa & Fang.1978.
Mercury HgCl2 native soil microflora silty clay 7 7 28 C mineralization 10 100 28 Landa & Fang.1978.
Mercury HgCl2 native soil microflora clay 8 3 Nitrification 10 100 40 van Faassen.1973.
Mercury PMA* native soil microflora clay 8 3 Nitrification & 10 100 94,42 van Faassen.ammonification 1973.
Mercury HgCl2 native soil microflora dune sand 8 1 Nitrification & 10 100 95,34 van Faassen.ammonification 1973.
Mercury HgCl2 native soil microflora loam 7 2.9 0.1 Arylsulfatase activity 501.5 39 Al-Khafaji &LCT Tabatabai.
1979.
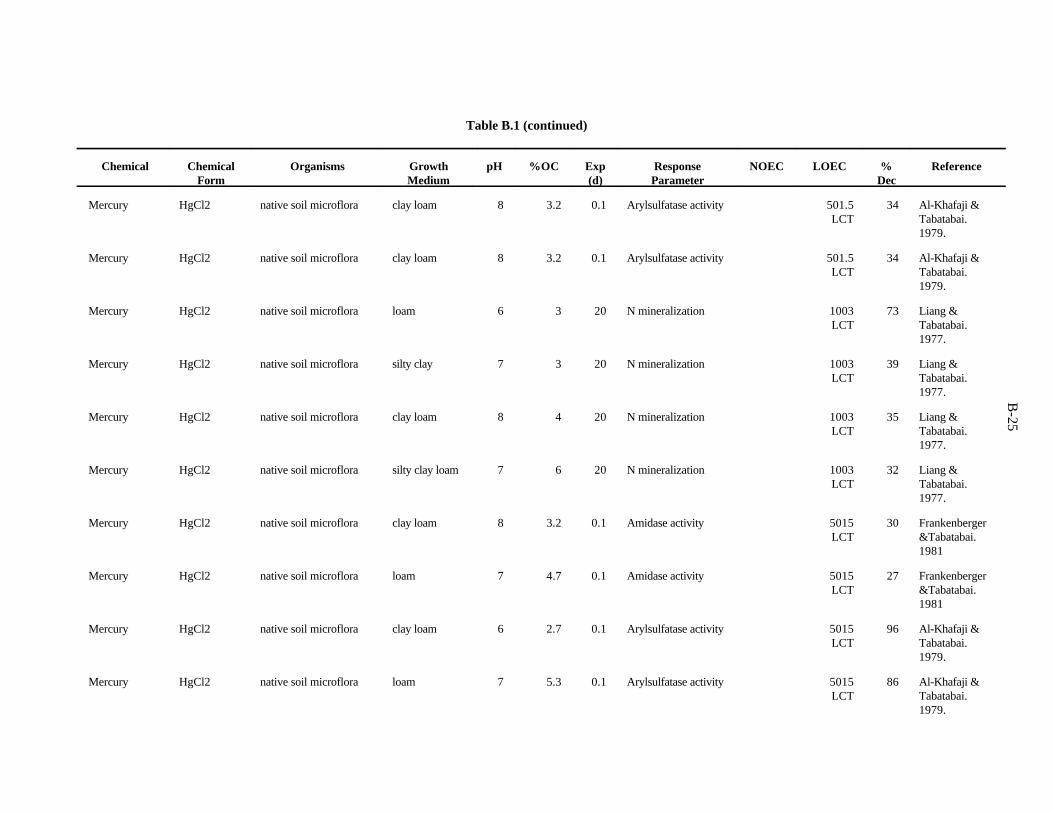
B-25
Table B.1 (continued)
Chemical Chemical Organisms Growth pH %OC Exp Response NOEC LOEC % ReferenceForm Medium (d) Parameter Dec
Mercury HgCl2 native soil microflora clay loam 8 3.2 0.1 Arylsulfatase activity 501.5 34 Al-Khafaji &LCT Tabatabai.
1979.
Mercury HgCl2 native soil microflora clay loam 8 3.2 0.1 Arylsulfatase activity 501.5 34 Al-Khafaji &LCT Tabatabai.
1979.
Mercury HgCl2 native soil microflora loam 6 3 20 N mineralization 1003 73 Liang &LCT Tabatabai.
1977.
Mercury HgCl2 native soil microflora silty clay 7 3 20 N mineralization 1003 39 Liang &LCT Tabatabai.
1977.
Mercury HgCl2 native soil microflora clay loam 8 4 20 N mineralization 1003 35 Liang &LCT Tabatabai.
1977.
Mercury HgCl2 native soil microflora silty clay loam 7 6 20 N mineralization 1003 32 Liang &LCT Tabatabai.
1977.
Mercury HgCl2 native soil microflora clay loam 8 3.2 0.1 Amidase activity 5015 30 FrankenbergerLCT &Tabatabai.
1981
Mercury HgCl2 native soil microflora loam 7 4.7 0.1 Amidase activity 5015 27 FrankenbergerLCT &Tabatabai.
1981
Mercury HgCl2 native soil microflora clay loam 6 2.7 0.1 Arylsulfatase activity 5015 96 Al-Khafaji &LCT Tabatabai.
1979.
Mercury HgCl2 native soil microflora loam 7 5.3 0.1 Arylsulfatase activity 5015 86 Al-Khafaji &LCT Tabatabai.
1979.
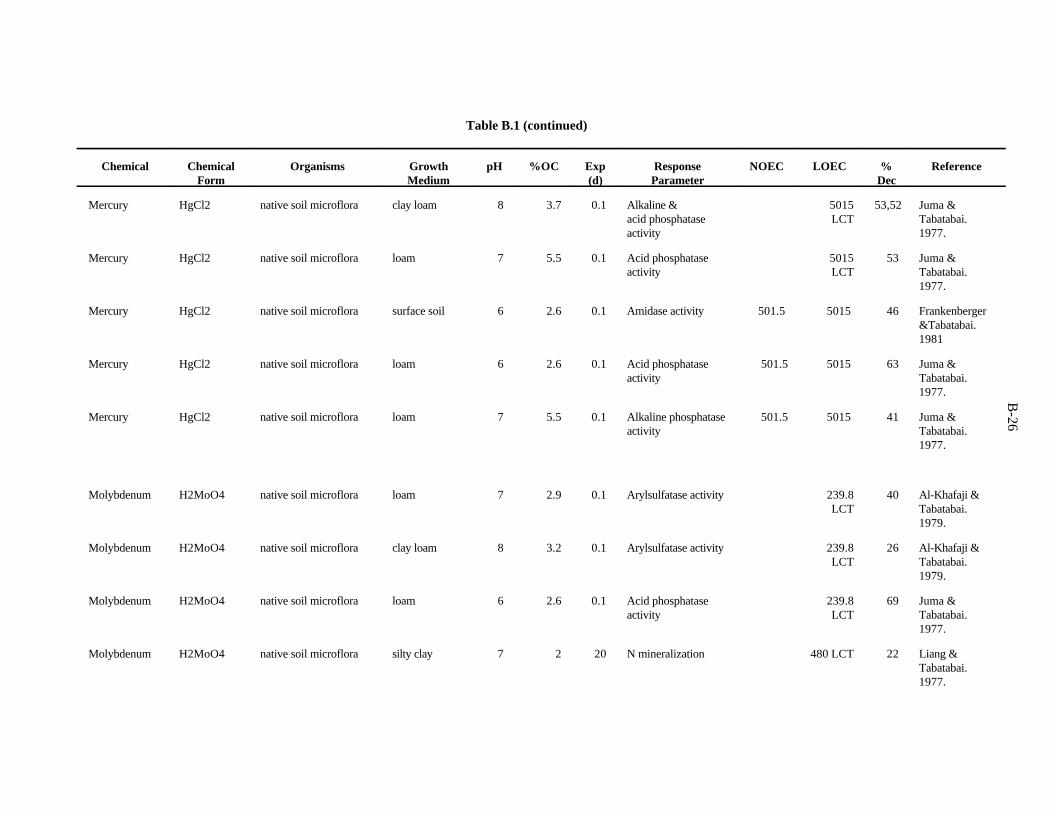
B-26
Table B.1 (continued)
Chemical Chemical Organisms Growth pH %OC Exp Response NOEC LOEC % ReferenceForm Medium (d) Parameter Dec
Mercury HgCl2 native soil microflora clay loam 8 3.7 0.1 Alkaline & 5015 53,52 Juma &acid phosphatase LCT Tabatabai.activity 1977.
Mercury HgCl2 native soil microflora loam 7 5.5 0.1 Acid phosphatase 5015 53 Juma &activity LCT Tabatabai.
1977.
Mercury HgCl2 native soil microflora surface soil 6 2.6 0.1 Amidase activity 501.5 5015 46 Frankenberger&Tabatabai.1981
Mercury HgCl2 native soil microflora loam 6 2.6 0.1 Acid phosphatase 501.5 5015 63 Juma &activity Tabatabai.
1977.
Mercury HgCl2 native soil microflora loam 7 5.5 0.1 Alkaline phosphatase 501.5 5015 41 Juma &activity Tabatabai.
1977.
Molybdenum H2MoO4 native soil microflora loam 7 2.9 0.1 Arylsulfatase activity 239.8 40 Al-Khafaji &LCT Tabatabai.
1979.
Molybdenum H2MoO4 native soil microflora clay loam 8 3.2 0.1 Arylsulfatase activity 239.8 26 Al-Khafaji &LCT Tabatabai.
1979.
Molybdenum H2MoO4 native soil microflora loam 6 2.6 0.1 Acid phosphatase 239.8 69 Juma &activity LCT Tabatabai.
1977.
Molybdenum H2MoO4 native soil microflora silty clay 7 2 20 N mineralization 480 LCT 22 Liang &Tabatabai.1977.
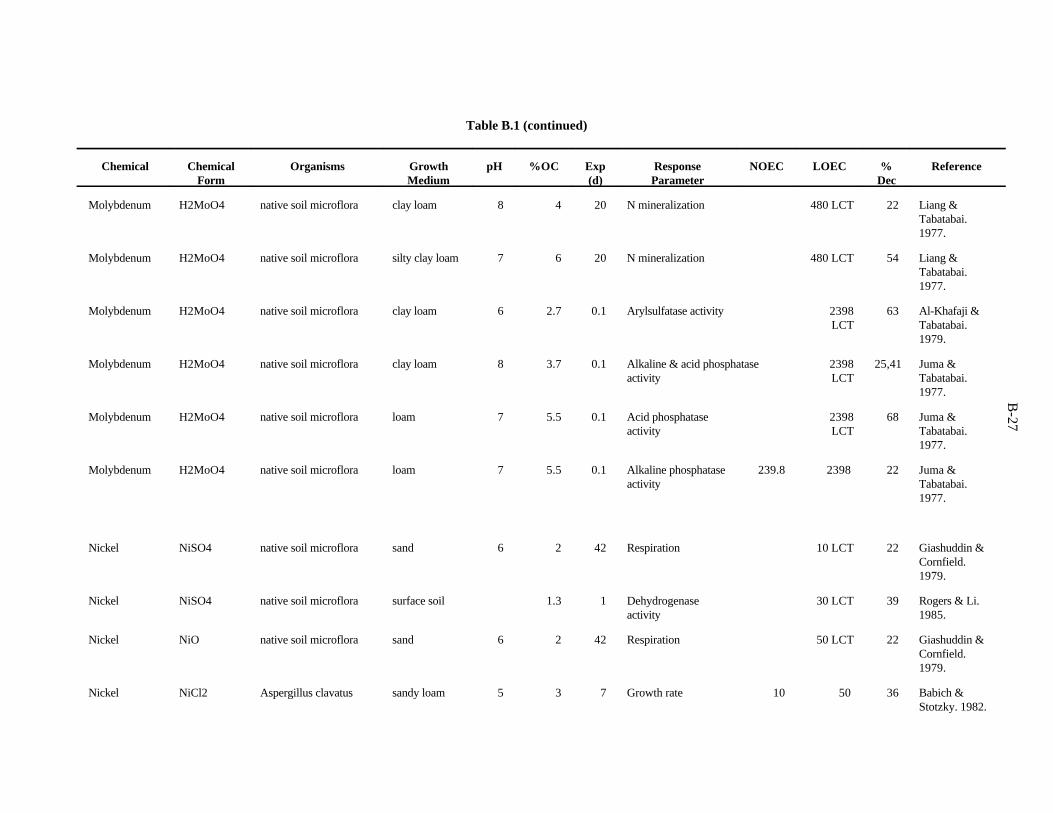
B-27
Table B.1 (continued)
Chemical Chemical Organisms Growth pH %OC Exp Response NOEC LOEC % ReferenceForm Medium (d) Parameter Dec
Molybdenum H2MoO4 native soil microflora clay loam 8 4 20 N mineralization 480 LCT 22 Liang &Tabatabai.1977.
Molybdenum H2MoO4 native soil microflora silty clay loam 7 6 20 N mineralization 480 LCT 54 Liang &Tabatabai.1977.
Molybdenum H2MoO4 native soil microflora clay loam 6 2.7 0.1 Arylsulfatase activity 2398 63 Al-Khafaji &LCT Tabatabai.
1979.
Molybdenum H2MoO4 native soil microflora clay loam 8 3.7 0.1 Alkaline & acid phosphatase 2398 25,41 Juma &activity LCT Tabatabai.
1977.
Molybdenum H2MoO4 native soil microflora loam 7 5.5 0.1 Acid phosphatase 2398 68 Juma &activity LCT Tabatabai.
1977.
Molybdenum H2MoO4 native soil microflora loam 7 5.5 0.1 Alkaline phosphatase 239.8 2398 22 Juma &activity Tabatabai.
1977.
Nickel NiSO4 native soil microflora sand 6 2 42 Respiration 10 LCT 22 Giashuddin &Cornfield.1979.
Nickel NiSO4 native soil microflora surface soil 1.3 1 Dehydrogenase 30 LCT 39 Rogers & Li.activity 1985.
Nickel NiO native soil microflora sand 6 2 42 Respiration 50 LCT 22 Giashuddin &Cornfield.1979.
Nickel NiCl2 Aspergillus clavatus sandy loam 5 3 7 Growth rate 10 50 36 Babich &Stotzky. 1982.
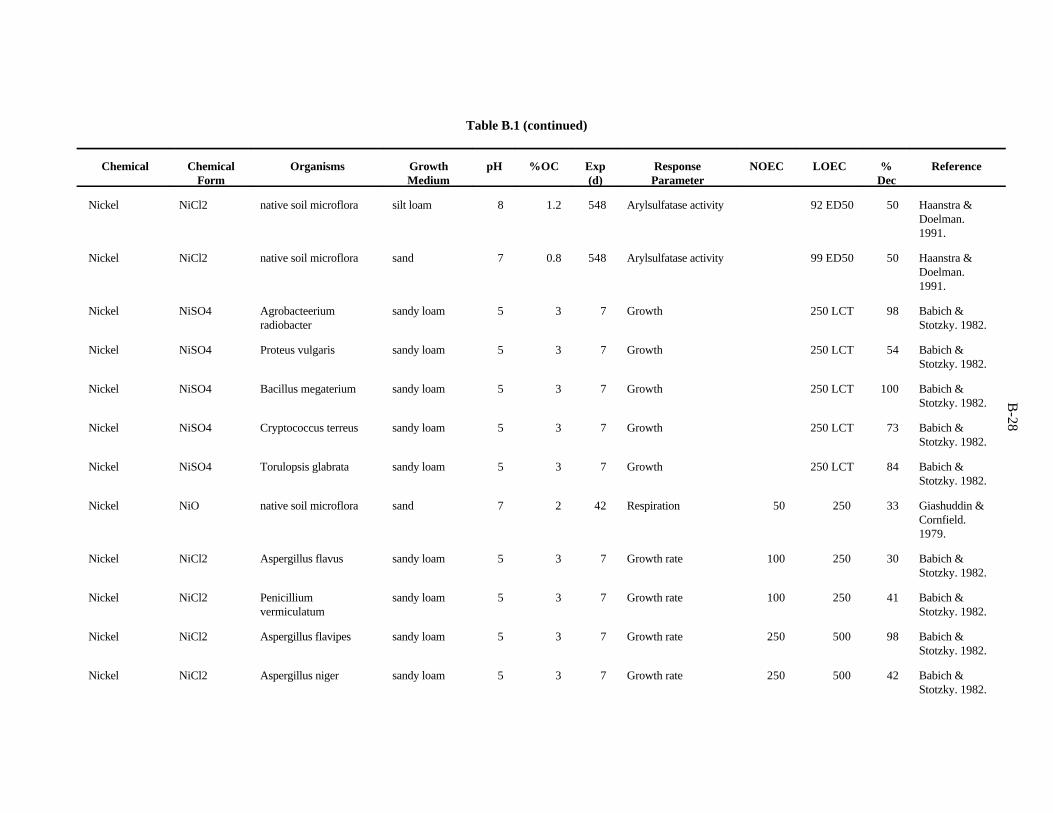
B-28
Table B.1 (continued)
Chemical Chemical Organisms Growth pH %OC Exp Response NOEC LOEC % ReferenceForm Medium (d) Parameter Dec
Nickel NiCl2 native soil microflora silt loam 8 1.2 548 Arylsulfatase activity 92 ED50 50 Haanstra &Doelman.1991.
Nickel NiCl2 native soil microflora sand 7 0.8 548 Arylsulfatase activity 99 ED50 50 Haanstra &Doelman.1991.
Nickel NiSO4 Agrobacteerium sandy loam 5 3 7 Growth 250 LCT 98 Babich &radiobacter Stotzky. 1982.
Nickel NiSO4 Proteus vulgaris sandy loam 5 3 7 Growth 250 LCT 54 Babich &Stotzky. 1982.
Nickel NiSO4 Bacillus megaterium sandy loam 5 3 7 Growth 250 LCT 100 Babich &Stotzky. 1982.
Nickel NiSO4 Cryptococcus terreus sandy loam 5 3 7 Growth 250 LCT 73 Babich &Stotzky. 1982.
Nickel NiSO4 Torulopsis glabrata sandy loam 5 3 7 Growth 250 LCT 84 Babich &Stotzky. 1982.
Nickel NiO native soil microflora sand 7 2 42 Respiration 50 250 33 Giashuddin &Cornfield.1979.
Nickel NiCl2 Aspergillus flavus sandy loam 5 3 7 Growth rate 100 250 30 Babich &Stotzky. 1982.
Nickel NiCl2 Penicillium sandy loam 5 3 7 Growth rate 100 250 41 Babich &vermiculatum Stotzky. 1982.
Nickel NiCl2 Aspergillus flavipes sandy loam 5 3 7 Growth rate 250 500 98 Babich &Stotzky. 1982.
Nickel NiCl2 Aspergillus niger sandy loam 5 3 7 Growth rate 250 500 42 Babich &Stotzky. 1982.
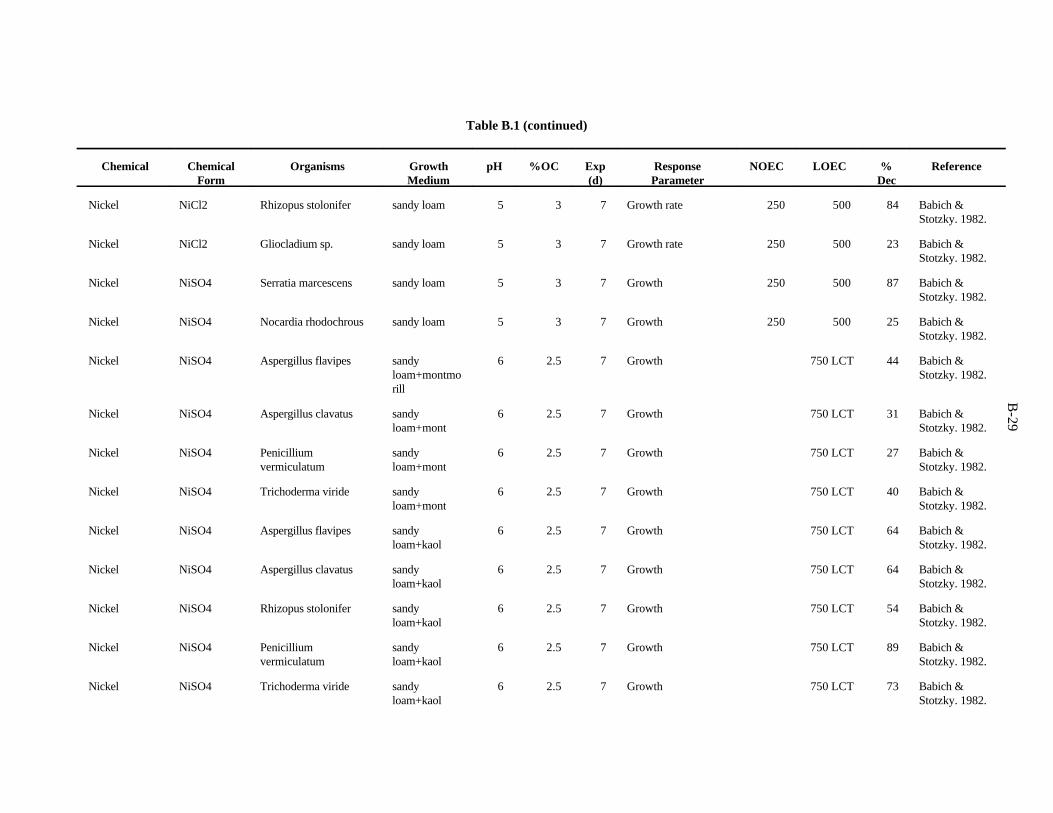
B-29
Table B.1 (continued)
Chemical Chemical Organisms Growth pH %OC Exp Response NOEC LOEC % ReferenceForm Medium (d) Parameter Dec
Nickel NiCl2 Rhizopus stolonifer sandy loam 5 3 7 Growth rate 250 500 84 Babich &Stotzky. 1982.
Nickel NiCl2 Gliocladium sp. sandy loam 5 3 7 Growth rate 250 500 23 Babich &Stotzky. 1982.
Nickel NiSO4 Serratia marcescens sandy loam 5 3 7 Growth 250 500 87 Babich &Stotzky. 1982.
Nickel NiSO4 Nocardia rhodochrous sandy loam 5 3 7 Growth 250 500 25 Babich &Stotzky. 1982.
Nickel NiSO4 Aspergillus flavipes sandy 6 2.5 7 Growth 750 LCT 44 Babich &loam+montmo Stotzky. 1982.rill
Nickel NiSO4 Aspergillus clavatus sandy 6 2.5 7 Growth 750 LCT 31 Babich &loam+mont Stotzky. 1982.
Nickel NiSO4 Penicillium sandy 6 2.5 7 Growth 750 LCT 27 Babich &vermiculatum loam+mont Stotzky. 1982.
Nickel NiSO4 Trichoderma viride sandy 6 2.5 7 Growth 750 LCT 40 Babich &loam+mont Stotzky. 1982.
Nickel NiSO4 Aspergillus flavipes sandy 6 2.5 7 Growth 750 LCT 64 Babich &loam+kaol Stotzky. 1982.
Nickel NiSO4 Aspergillus clavatus sandy 6 2.5 7 Growth 750 LCT 64 Babich &loam+kaol Stotzky. 1982.
Nickel NiSO4 Rhizopus stolonifer sandy 6 2.5 7 Growth 750 LCT 54 Babich &loam+kaol Stotzky. 1982.
Nickel NiSO4 Penicillium sandy 6 2.5 7 Growth 750 LCT 89 Babich &vermiculatum loam+kaol Stotzky. 1982.
Nickel NiSO4 Trichoderma viride sandy 6 2.5 7 Growth 750 LCT 73 Babich &loam+kaol Stotzky. 1982.
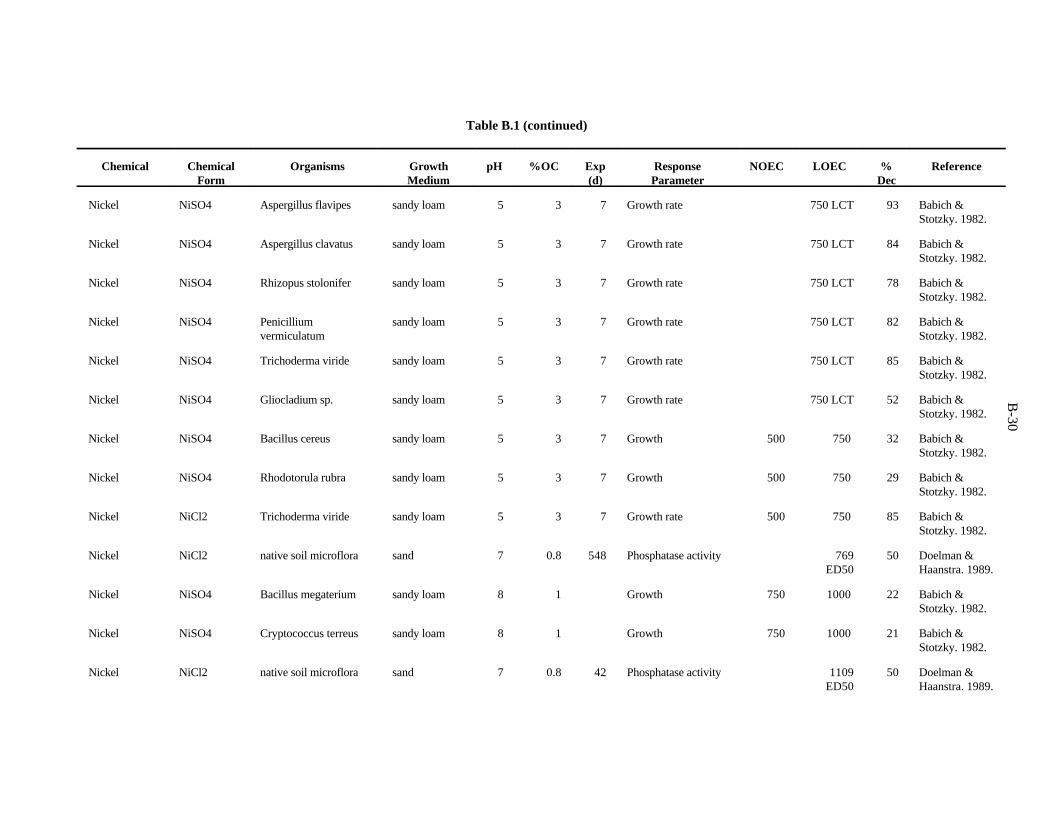
B-30
Table B.1 (continued)
Chemical Chemical Organisms Growth pH %OC Exp Response NOEC LOEC % ReferenceForm Medium (d) Parameter Dec
Nickel NiSO4 Aspergillus flavipes sandy loam 5 3 7 Growth rate 750 LCT 93 Babich &Stotzky. 1982.
Nickel NiSO4 Aspergillus clavatus sandy loam 5 3 7 Growth rate 750 LCT 84 Babich &Stotzky. 1982.
Nickel NiSO4 Rhizopus stolonifer sandy loam 5 3 7 Growth rate 750 LCT 78 Babich &Stotzky. 1982.
Nickel NiSO4 Penicillium sandy loam 5 3 7 Growth rate 750 LCT 82 Babich &vermiculatum Stotzky. 1982.
Nickel NiSO4 Trichoderma viride sandy loam 5 3 7 Growth rate 750 LCT 85 Babich &Stotzky. 1982.
Nickel NiSO4 Gliocladium sp. sandy loam 5 3 7 Growth rate 750 LCT 52 Babich &Stotzky. 1982.
Nickel NiSO4 Bacillus cereus sandy loam 5 3 7 Growth 500 750 32 Babich &Stotzky. 1982.
Nickel NiSO4 Rhodotorula rubra sandy loam 5 3 7 Growth 500 750 29 Babich &Stotzky. 1982.
Nickel NiCl2 Trichoderma viride sandy loam 5 3 7 Growth rate 500 750 85 Babich &Stotzky. 1982.
Nickel NiCl2 native soil microflora sand 7 0.8 548 Phosphatase activity 769 50 Doelman &ED50 Haanstra. 1989.
Nickel NiSO4 Bacillus megaterium sandy loam 8 1 Growth 750 1000 22 Babich &Stotzky. 1982.
Nickel NiSO4 Cryptococcus terreus sandy loam 8 1 Growth 750 1000 21 Babich &Stotzky. 1982.
Nickel NiCl2 native soil microflora sand 7 0.8 42 Phosphatase activity 1109 50 Doelman &ED50 Haanstra. 1989.
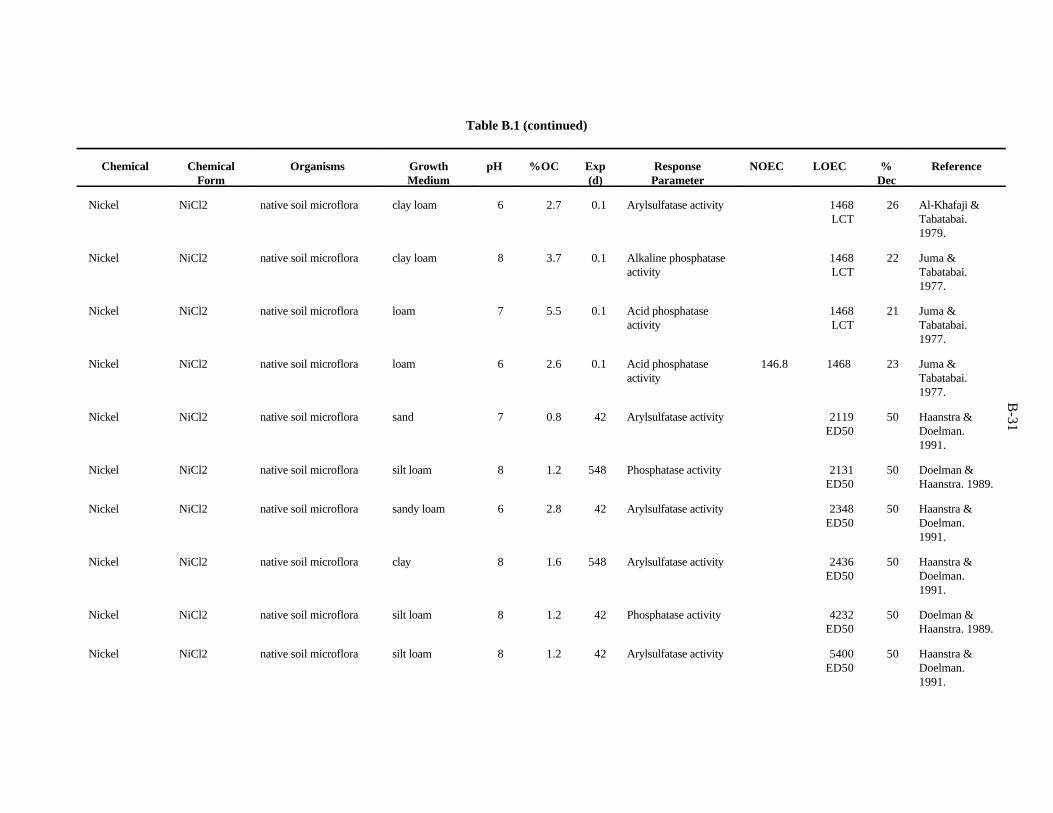
B-31
Table B.1 (continued)
Chemical Chemical Organisms Growth pH %OC Exp Response NOEC LOEC % ReferenceForm Medium (d) Parameter Dec
Nickel NiCl2 native soil microflora clay loam 6 2.7 0.1 Arylsulfatase activity 1468 26 Al-Khafaji &LCT Tabatabai.
1979.
Nickel NiCl2 native soil microflora clay loam 8 3.7 0.1 Alkaline phosphatase 1468 22 Juma &activity LCT Tabatabai.
1977.
Nickel NiCl2 native soil microflora loam 7 5.5 0.1 Acid phosphatase 1468 21 Juma &activity LCT Tabatabai.
1977.
Nickel NiCl2 native soil microflora loam 6 2.6 0.1 Acid phosphatase 146.8 1468 23 Juma &activity Tabatabai.
1977.
Nickel NiCl2 native soil microflora sand 7 0.8 42 Arylsulfatase activity 2119 50 Haanstra &ED50 Doelman.
1991.
Nickel NiCl2 native soil microflora silt loam 8 1.2 548 Phosphatase activity 2131 50 Doelman &ED50 Haanstra. 1989.
Nickel NiCl2 native soil microflora sandy loam 6 2.8 42 Arylsulfatase activity 2348 50 Haanstra &ED50 Doelman.
1991.
Nickel NiCl2 native soil microflora clay 8 1.6 548 Arylsulfatase activity 2436 50 Haanstra &ED50 Doelman.
1991.
Nickel NiCl2 native soil microflora silt loam 8 1.2 42 Phosphatase activity 4232 50 Doelman &ED50 Haanstra. 1989.
Nickel NiCl2 native soil microflora silt loam 8 1.2 42 Arylsulfatase activity 5400 50 Haanstra &ED50 Doelman.
1991.
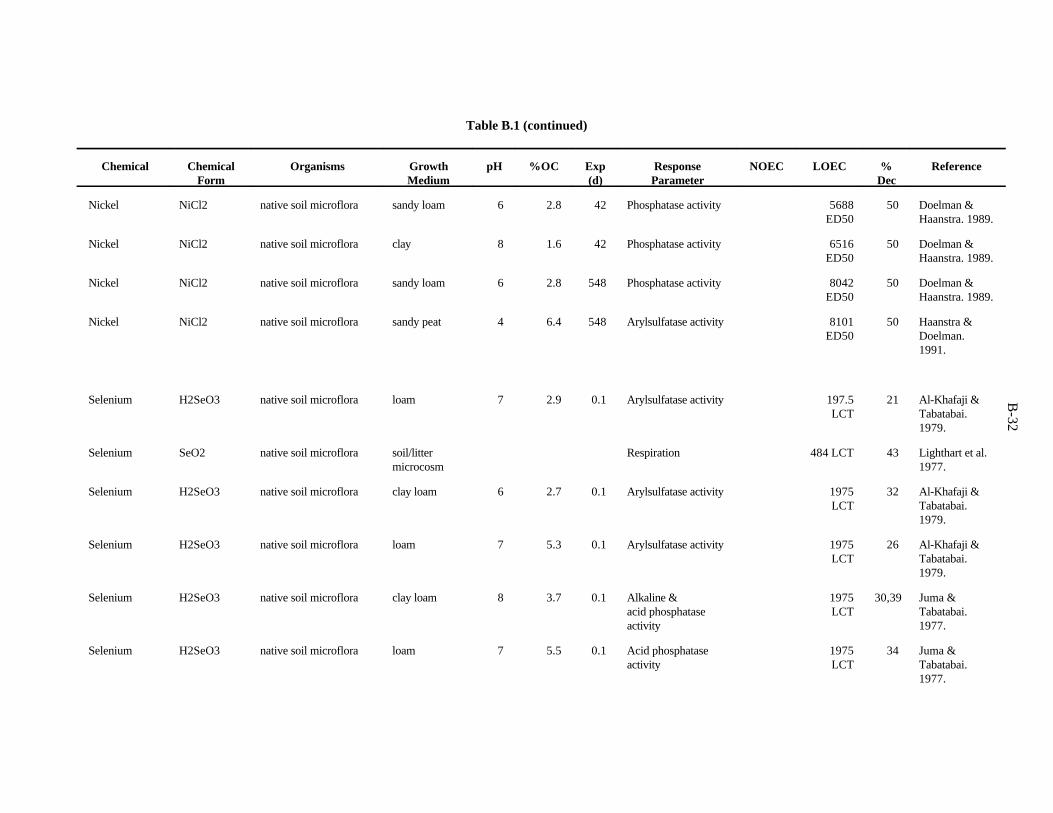
B-32
Table B.1 (continued)
Chemical Chemical Organisms Growth pH %OC Exp Response NOEC LOEC % ReferenceForm Medium (d) Parameter Dec
Nickel NiCl2 native soil microflora sandy loam 6 2.8 42 Phosphatase activity 5688 50 Doelman &ED50 Haanstra. 1989.
Nickel NiCl2 native soil microflora clay 8 1.6 42 Phosphatase activity 6516 50 Doelman &ED50 Haanstra. 1989.
Nickel NiCl2 native soil microflora sandy loam 6 2.8 548 Phosphatase activity 8042 50 Doelman &ED50 Haanstra. 1989.
Nickel NiCl2 native soil microflora sandy peat 4 6.4 548 Arylsulfatase activity 8101 50 Haanstra &ED50 Doelman.
1991.
Selenium H2SeO3 native soil microflora loam 7 2.9 0.1 Arylsulfatase activity 197.5 21 Al-Khafaji &LCT Tabatabai.
1979.
Selenium SeO2 native soil microflora soil/litter Respiration 484 LCT 43 Lighthart et al.microcosm 1977.
Selenium H2SeO3 native soil microflora clay loam 6 2.7 0.1 Arylsulfatase activity 1975 32 Al-Khafaji &LCT Tabatabai.
1979.
Selenium H2SeO3 native soil microflora loam 7 5.3 0.1 Arylsulfatase activity 1975 26 Al-Khafaji &LCT Tabatabai.
1979.
Selenium H2SeO3 native soil microflora clay loam 8 3.7 0.1 Alkaline & 1975 30,39 Juma &acid phosphatase LCT Tabatabai.activity 1977.
Selenium H2SeO3 native soil microflora loam 7 5.5 0.1 Acid phosphatase 1975 34 Juma &activity LCT Tabatabai.
1977.
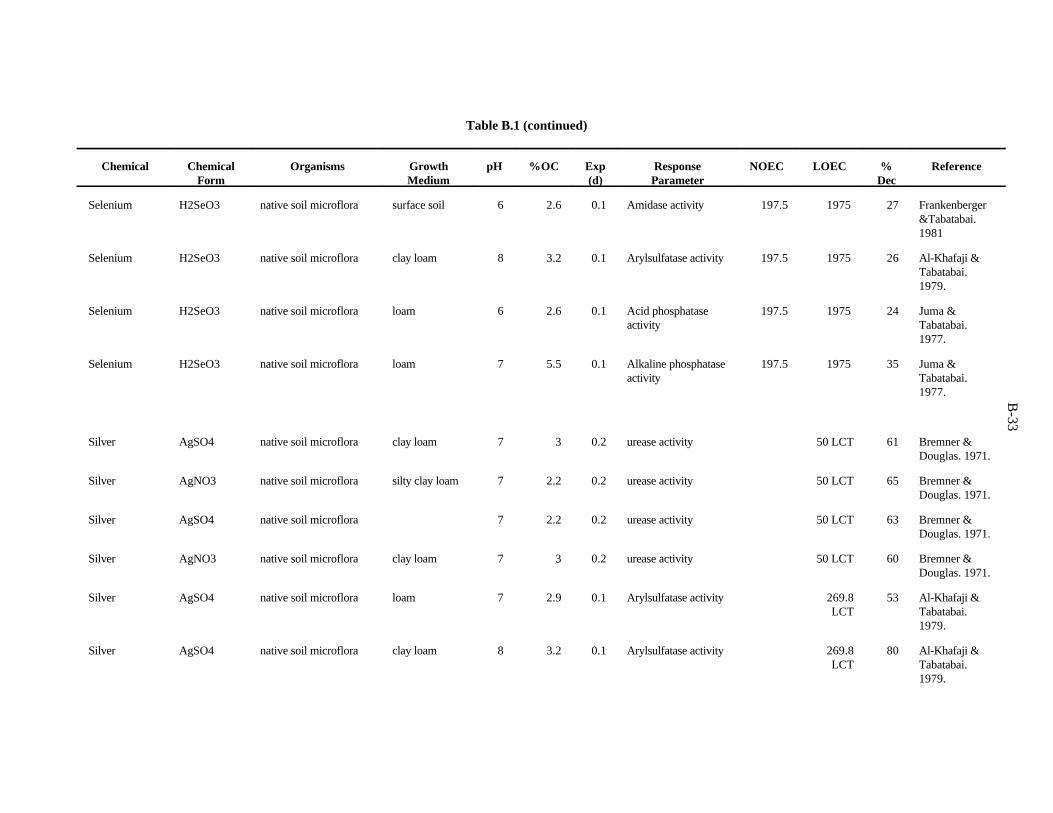
B-33
Table B.1 (continued)
Chemical Chemical Organisms Growth pH %OC Exp Response NOEC LOEC % ReferenceForm Medium (d) Parameter Dec
Selenium H2SeO3 native soil microflora surface soil 6 2.6 0.1 Amidase activity 197.5 1975 27 Frankenberger&Tabatabai.1981
Selenium H2SeO3 native soil microflora clay loam 8 3.2 0.1 Arylsulfatase activity 197.5 1975 26 Al-Khafaji &Tabatabai.1979.
Selenium H2SeO3 native soil microflora loam 6 2.6 0.1 Acid phosphatase 197.5 1975 24 Juma &activity Tabatabai.
1977.
Selenium H2SeO3 native soil microflora loam 7 5.5 0.1 Alkaline phosphatase 197.5 1975 35 Juma &activity Tabatabai.
1977.
Silver AgSO4 native soil microflora clay loam 7 3 0.2 urease activity 50 LCT 61 Bremner &Douglas. 1971.
Silver AgNO3 native soil microflora silty clay loam 7 2.2 0.2 urease activity 50 LCT 65 Bremner &Douglas. 1971.
Silver AgSO4 native soil microflora 7 2.2 0.2 urease activity 50 LCT 63 Bremner &Douglas. 1971.
Silver AgNO3 native soil microflora clay loam 7 3 0.2 urease activity 50 LCT 60 Bremner &Douglas. 1971.
Silver AgSO4 native soil microflora loam 7 2.9 0.1 Arylsulfatase activity 269.8 53 Al-Khafaji &LCT Tabatabai.
1979.
Silver AgSO4 native soil microflora clay loam 8 3.2 0.1 Arylsulfatase activity 269.8 80 Al-Khafaji &LCT Tabatabai.
1979.
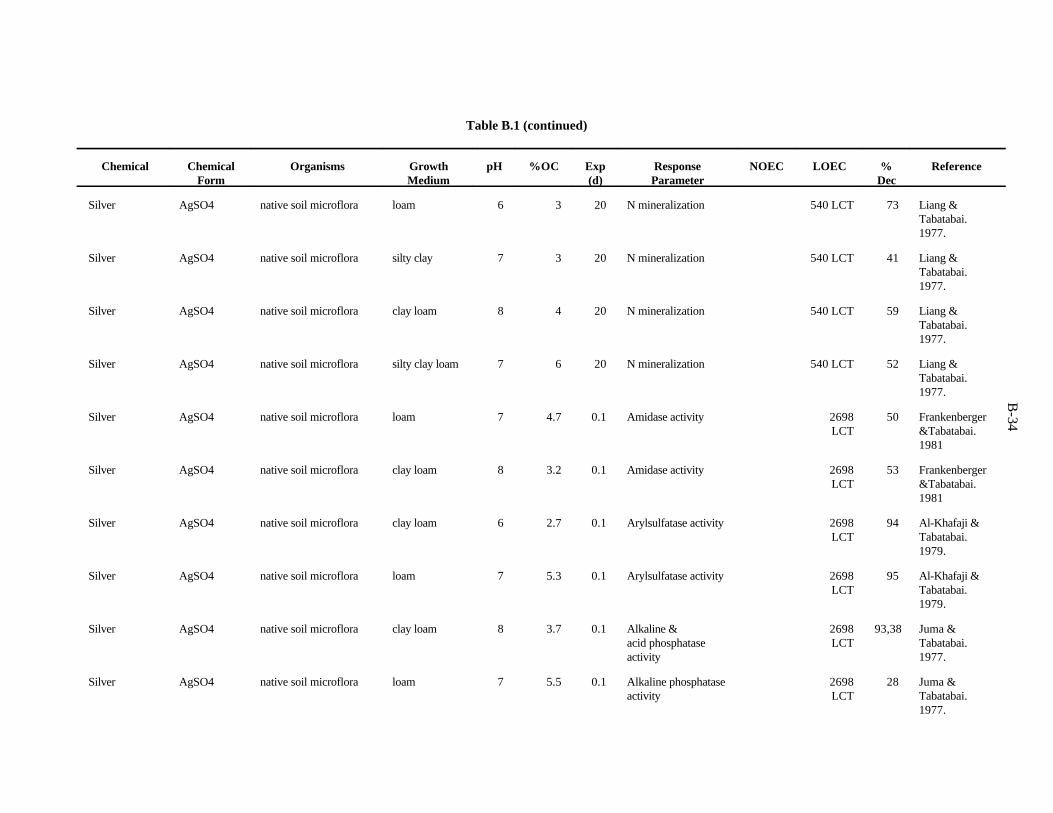
B-34
Table B.1 (continued)
Chemical Chemical Organisms Growth pH %OC Exp Response NOEC LOEC % ReferenceForm Medium (d) Parameter Dec
Silver AgSO4 native soil microflora loam 6 3 20 N mineralization 540 LCT 73 Liang &Tabatabai.1977.
Silver AgSO4 native soil microflora silty clay 7 3 20 N mineralization 540 LCT 41 Liang &Tabatabai.1977.
Silver AgSO4 native soil microflora clay loam 8 4 20 N mineralization 540 LCT 59 Liang &Tabatabai.1977.
Silver AgSO4 native soil microflora silty clay loam 7 6 20 N mineralization 540 LCT 52 Liang &Tabatabai.1977.
Silver AgSO4 native soil microflora loam 7 4.7 0.1 Amidase activity 2698 50 FrankenbergerLCT &Tabatabai.
1981
Silver AgSO4 native soil microflora clay loam 8 3.2 0.1 Amidase activity 2698 53 FrankenbergerLCT &Tabatabai.
1981
Silver AgSO4 native soil microflora clay loam 6 2.7 0.1 Arylsulfatase activity 2698 94 Al-Khafaji &LCT Tabatabai.
1979.
Silver AgSO4 native soil microflora loam 7 5.3 0.1 Arylsulfatase activity 2698 95 Al-Khafaji &LCT Tabatabai.
1979.
Silver AgSO4 native soil microflora clay loam 8 3.7 0.1 Alkaline & 2698 93,38 Juma &acid phosphatase LCT Tabatabai.activity 1977.
Silver AgSO4 native soil microflora loam 7 5.5 0.1 Alkaline phosphatase 2698 28 Juma &activity LCT Tabatabai.
1977.
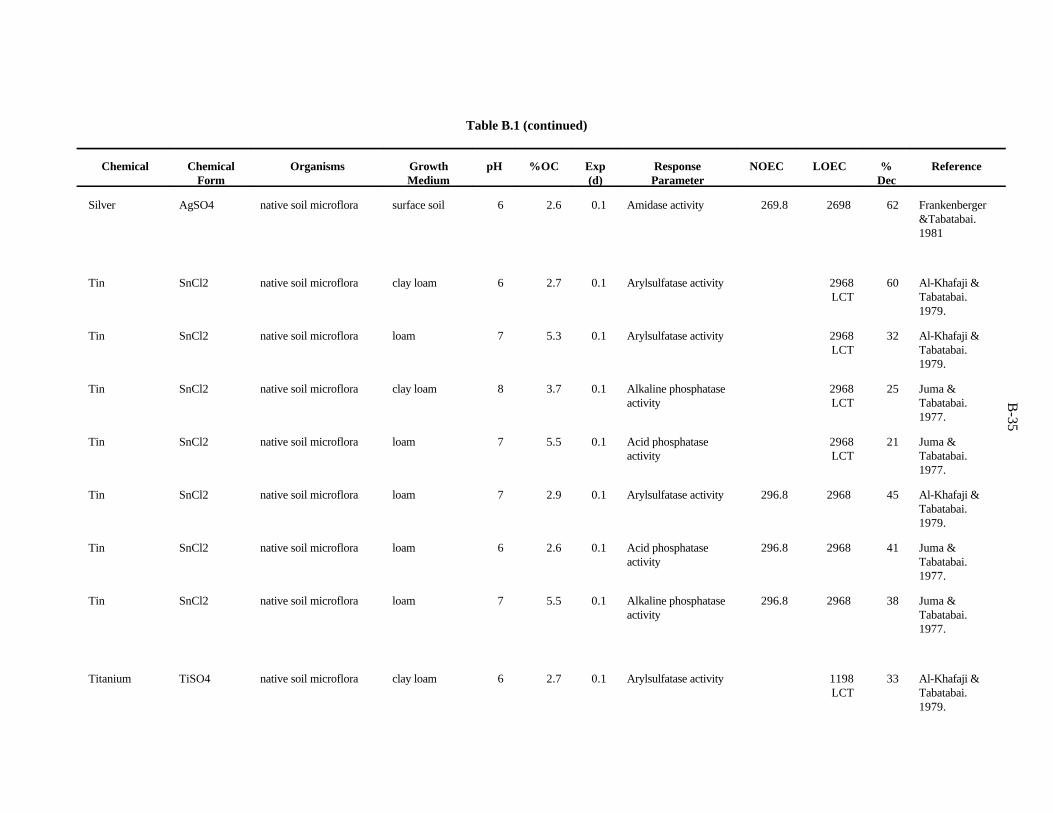
B-35
Table B.1 (continued)
Chemical Chemical Organisms Growth pH %OC Exp Response NOEC LOEC % ReferenceForm Medium (d) Parameter Dec
Silver AgSO4 native soil microflora surface soil 6 2.6 0.1 Amidase activity 269.8 2698 62 Frankenberger&Tabatabai.1981
Tin SnCl2 native soil microflora clay loam 6 2.7 0.1 Arylsulfatase activity 2968 60 Al-Khafaji &LCT Tabatabai.
1979.
Tin SnCl2 native soil microflora loam 7 5.3 0.1 Arylsulfatase activity 2968 32 Al-Khafaji &LCT Tabatabai.
1979.
Tin SnCl2 native soil microflora clay loam 8 3.7 0.1 Alkaline phosphatase 2968 25 Juma &activity LCT Tabatabai.
1977.
Tin SnCl2 native soil microflora loam 7 5.5 0.1 Acid phosphatase 2968 21 Juma &activity LCT Tabatabai.
1977.
Tin SnCl2 native soil microflora loam 7 2.9 0.1 Arylsulfatase activity 296.8 2968 45 Al-Khafaji &Tabatabai.1979.
Tin SnCl2 native soil microflora loam 6 2.6 0.1 Acid phosphatase 296.8 2968 41 Juma &activity Tabatabai.
1977.
Tin SnCl2 native soil microflora loam 7 5.5 0.1 Alkaline phosphatase 296.8 2968 38 Juma &activity Tabatabai.
1977.
Titanium TiSO4 native soil microflora clay loam 6 2.7 0.1 Arylsulfatase activity 1198 33 Al-Khafaji &LCT Tabatabai.
1979.
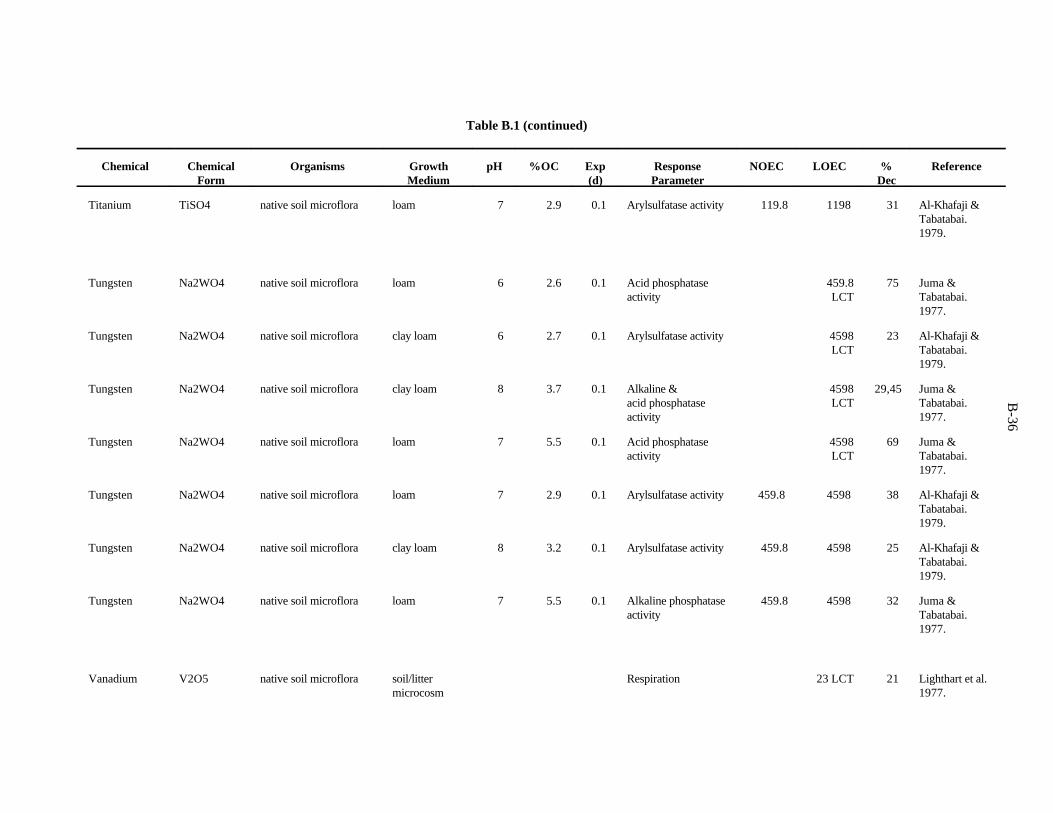
B-36
Table B.1 (continued)
Chemical Chemical Organisms Growth pH %OC Exp Response NOEC LOEC % ReferenceForm Medium (d) Parameter Dec
Titanium TiSO4 native soil microflora loam 7 2.9 0.1 Arylsulfatase activity 119.8 1198 31 Al-Khafaji &Tabatabai.1979.
Tungsten Na2WO4 native soil microflora loam 6 2.6 0.1 Acid phosphatase 459.8 75 Juma &activity LCT Tabatabai.
1977.
Tungsten Na2WO4 native soil microflora clay loam 6 2.7 0.1 Arylsulfatase activity 4598 23 Al-Khafaji &LCT Tabatabai.
1979.
Tungsten Na2WO4 native soil microflora clay loam 8 3.7 0.1 Alkaline & 4598 29,45 Juma &acid phosphatase LCT Tabatabai.activity 1977.
Tungsten Na2WO4 native soil microflora loam 7 5.5 0.1 Acid phosphatase 4598 69 Juma &activity LCT Tabatabai.
1977.
Tungsten Na2WO4 native soil microflora loam 7 2.9 0.1 Arylsulfatase activity 459.8 4598 38 Al-Khafaji &Tabatabai.1979.
Tungsten Na2WO4 native soil microflora clay loam 8 3.2 0.1 Arylsulfatase activity 459.8 4598 25 Al-Khafaji &Tabatabai.1979.
Tungsten Na2WO4 native soil microflora loam 7 5.5 0.1 Alkaline phosphatase 459.8 4598 32 Juma &activity Tabatabai.
1977.
Vanadium V2O5 native soil microflora soil/litter Respiration 23 LCT 21 Lighthart et al.microcosm 1977.
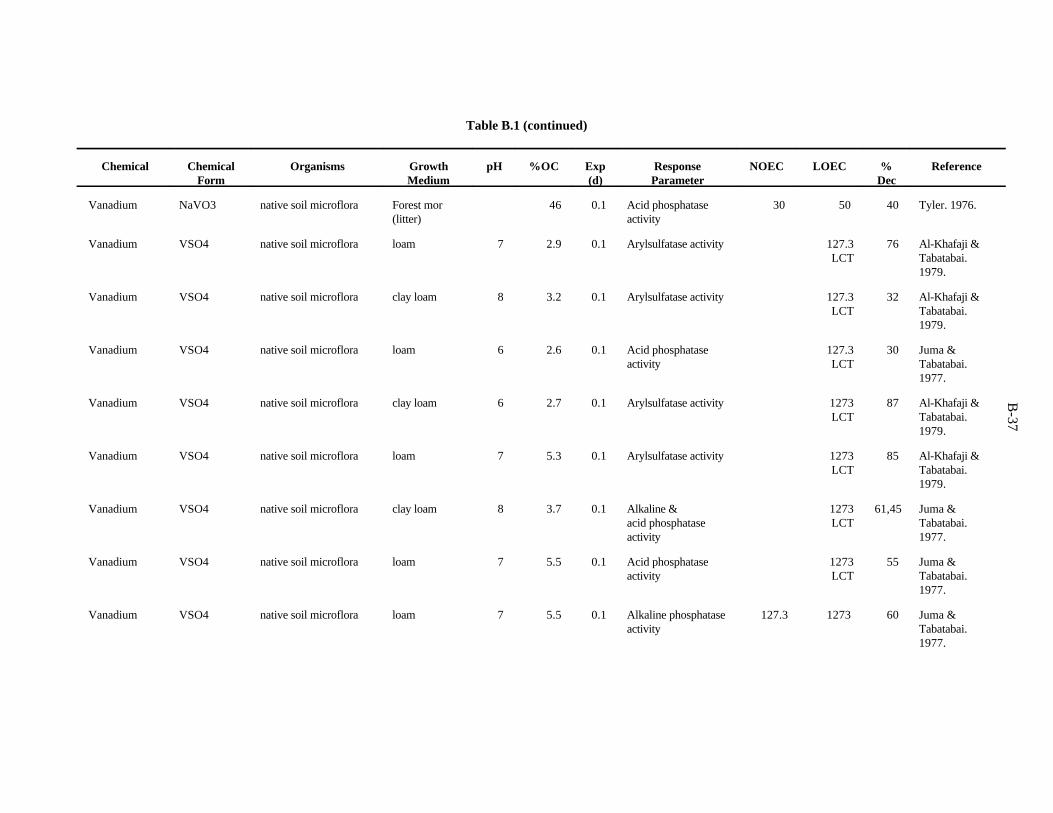
B-37
Table B.1 (continued)
Chemical Chemical Organisms Growth pH %OC Exp Response NOEC LOEC % ReferenceForm Medium (d) Parameter Dec
Vanadium NaVO3 native soil microflora Forest mor 46 0.1 Acid phosphatase 30 50 40 Tyler. 1976.(litter) activity
Vanadium VSO4 native soil microflora loam 7 2.9 0.1 Arylsulfatase activity 127.3 76 Al-Khafaji &LCT Tabatabai.
1979.
Vanadium VSO4 native soil microflora clay loam 8 3.2 0.1 Arylsulfatase activity 127.3 32 Al-Khafaji &LCT Tabatabai.
1979.
Vanadium VSO4 native soil microflora loam 6 2.6 0.1 Acid phosphatase 127.3 30 Juma &activity LCT Tabatabai.
1977.
Vanadium VSO4 native soil microflora clay loam 6 2.7 0.1 Arylsulfatase activity 1273 87 Al-Khafaji &LCT Tabatabai.
1979.
Vanadium VSO4 native soil microflora loam 7 5.3 0.1 Arylsulfatase activity 1273 85 Al-Khafaji &LCT Tabatabai.
1979.
Vanadium VSO4 native soil microflora clay loam 8 3.7 0.1 Alkaline & 1273 61,45 Juma &acid phosphatase LCT Tabatabai.activity 1977.
Vanadium VSO4 native soil microflora loam 7 5.5 0.1 Acid phosphatase 1273 55 Juma &activity LCT Tabatabai.
1977.
Vanadium VSO4 native soil microflora loam 7 5.5 0.1 Alkaline phosphatase 127.3 1273 60 Juma &activity Tabatabai.
1977.
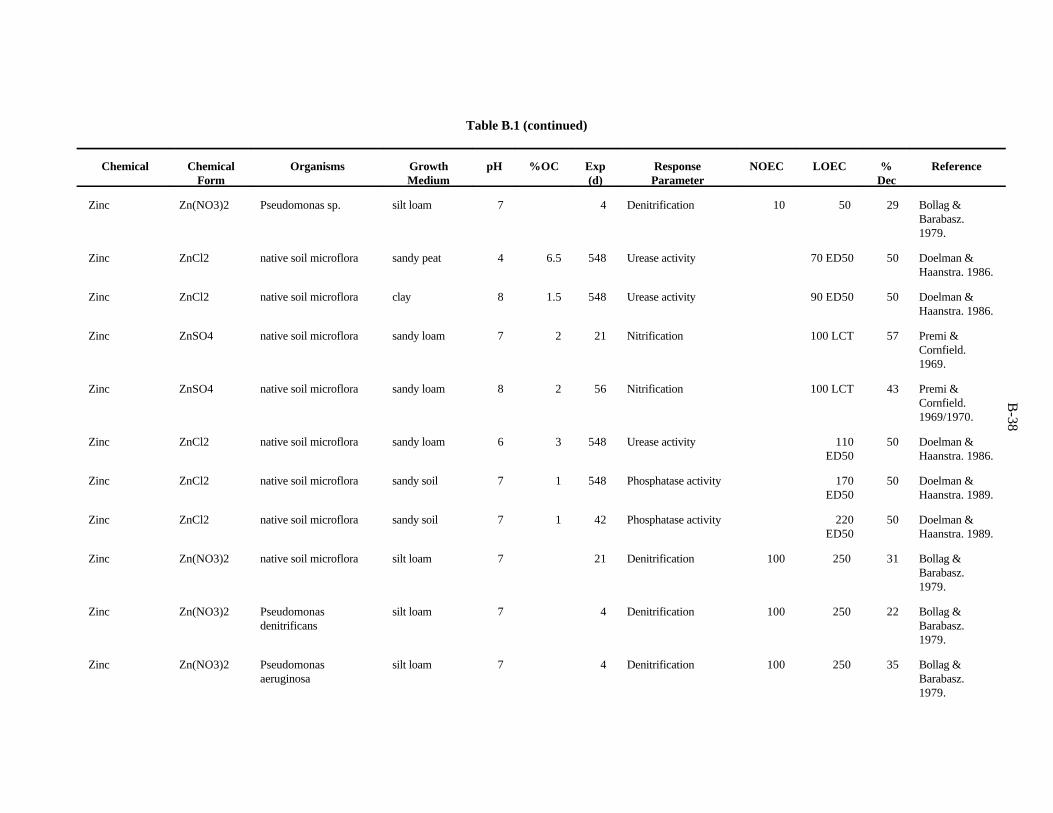
B-38
Table B.1 (continued)
Chemical Chemical Organisms Growth pH %OC Exp Response NOEC LOEC % ReferenceForm Medium (d) Parameter Dec
Zinc Zn(NO3)2 Pseudomonas sp. silt loam 7 4 Denitrification 10 50 29 Bollag &Barabasz.1979.
Zinc ZnCl2 native soil microflora sandy peat 4 6.5 548 Urease activity 70 ED50 50 Doelman &Haanstra. 1986.
Zinc ZnCl2 native soil microflora clay 8 1.5 548 Urease activity 90 ED50 50 Doelman &Haanstra. 1986.
Zinc ZnSO4 native soil microflora sandy loam 7 2 21 Nitrification 100 LCT 57 Premi &Cornfield.1969.
Zinc ZnSO4 native soil microflora sandy loam 8 2 56 Nitrification 100 LCT 43 Premi &Cornfield.1969/1970.
Zinc ZnCl2 native soil microflora sandy loam 6 3 548 Urease activity 110 50 Doelman &ED50 Haanstra. 1986.
Zinc ZnCl2 native soil microflora sandy soil 7 1 548 Phosphatase activity 170 50 Doelman &ED50 Haanstra. 1989.
Zinc ZnCl2 native soil microflora sandy soil 7 1 42 Phosphatase activity 220 50 Doelman &ED50 Haanstra. 1989.
Zinc Zn(NO3)2 native soil microflora silt loam 7 21 Denitrification 100 250 31 Bollag &Barabasz.1979.
Zinc Zn(NO3)2 Pseudomonas silt loam 7 4 Denitrification 100 250 22 Bollag &denitrificans Barabasz.
1979.
Zinc Zn(NO3)2 Pseudomonas silt loam 7 4 Denitrification 100 250 35 Bollag &aeruginosa Barabasz.
1979.
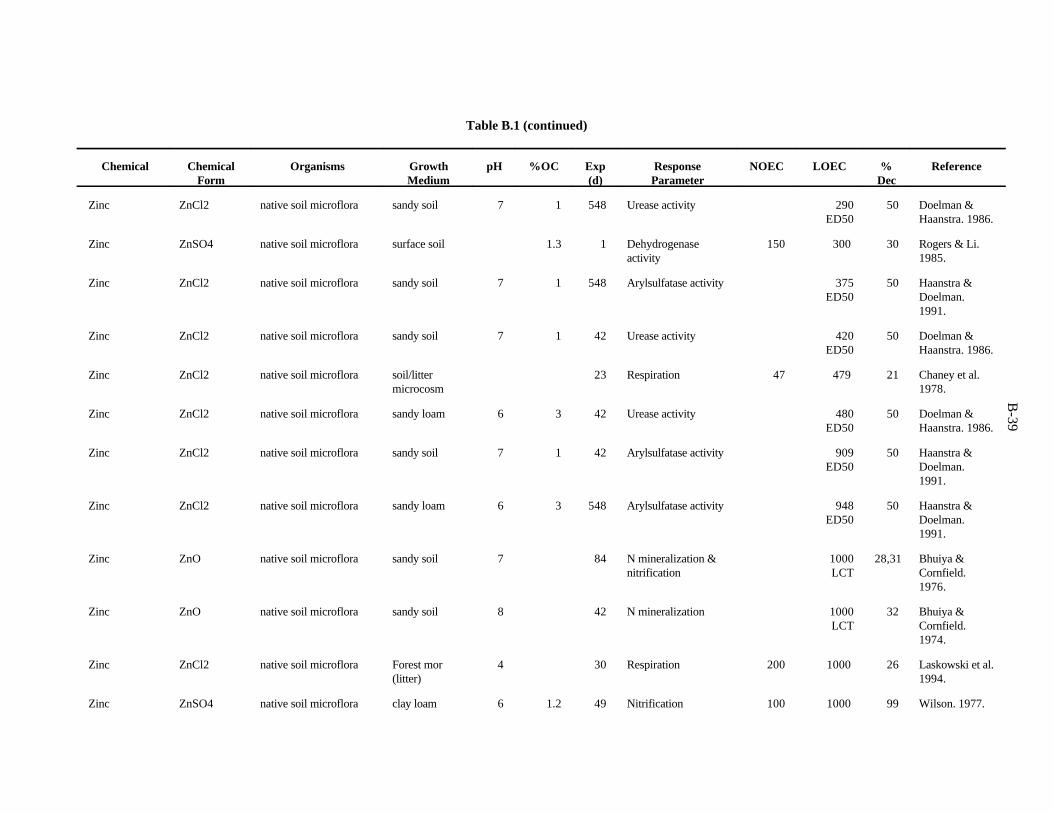
B-39
Table B.1 (continued)
Chemical Chemical Organisms Growth pH %OC Exp Response NOEC LOEC % ReferenceForm Medium (d) Parameter Dec
Zinc ZnCl2 native soil microflora sandy soil 7 1 548 Urease activity 290 50 Doelman &ED50 Haanstra. 1986.
Zinc ZnSO4 native soil microflora surface soil 1.3 1 Dehydrogenase 150 300 30 Rogers & Li.activity 1985.
Zinc ZnCl2 native soil microflora sandy soil 7 1 548 Arylsulfatase activity 375 50 Haanstra &ED50 Doelman.
1991.
Zinc ZnCl2 native soil microflora sandy soil 7 1 42 Urease activity 420 50 Doelman &ED50 Haanstra. 1986.
Zinc ZnCl2 native soil microflora soil/litter 23 Respiration 47 479 21 Chaney et al.microcosm 1978.
Zinc ZnCl2 native soil microflora sandy loam 6 3 42 Urease activity 480 50 Doelman &ED50 Haanstra. 1986.
Zinc ZnCl2 native soil microflora sandy soil 7 1 42 Arylsulfatase activity 909 50 Haanstra &ED50 Doelman.
1991.
Zinc ZnCl2 native soil microflora sandy loam 6 3 548 Arylsulfatase activity 948 50 Haanstra &ED50 Doelman.
1991.
Zinc ZnO native soil microflora sandy soil 7 84 N mineralization & 1000 28,31 Bhuiya &nitrification LCT Cornfield.
1976.
Zinc ZnO native soil microflora sandy soil 8 42 N mineralization 1000 32 Bhuiya &LCT Cornfield.
1974.
Zinc ZnCl2 native soil microflora Forest mor 4 30 Respiration 200 1000 26 Laskowski et al.(litter) 1994.
Zinc ZnSO4 native soil microflora clay loam 6 1.2 49 Nitrification 100 1000 99 Wilson. 1977.

B-40
Table B.1 (continued)
Chemical Chemical Organisms Growth pH %OC Exp Response NOEC LOEC % ReferenceForm Medium (d) Parameter Dec
Zinc ZnSO4 native soil microflora sandy loam 6 0.8 49 Nitrification 100 1000 98 Wilson. 1977.
Zinc ZnSO4 native soil microflora loamy sand 5 0.6 49 Nitrification 100 1000 100 Wilson. 1977.
Zinc ZnCl2 native soil microflora silty loam 8 1 42 Urease activity 1030 50 Doelman &ED50 Haanstra. 1986.
Zinc ZnCl2 native soil microflora silty loam 8 1 42 Arylsulfatase activity 1295 50 Haanstra &ED50 Doelman.
1991.
Zinc ZnSO4 native soil microflora clay loam 8 3.7 0.1 Alkaline & 1635 59,32 Juma &acid phosphatase LCT Tabatabai.activity 1977.
Zinc ZnSO4 native soil microflora loam 7 5.5 0.1 Acid phosphatase 1635 33 Juma &activity LCT Tabatabai.
1977.
Zinc ZnCl2 native soil microflora loam 7 2.9 0.1 Arylsulfatase activity 163.5 1635 33 Al-Khafaji &Tabatabai.1979.
Zinc ZnCl2 native soil microflora clay loam 8 3.2 0.1 Arylsulfatase activity 163.5 1635 36 Al-Khafaji &Tabatabai.1979.
Zinc ZnSO4 native soil microflora loam 6 2.6 0.1 Acid phosphatase 163.6 1635 30 Juma &activity Tabatabai.
1977.
Zinc ZnSO4 native soil microflora loam 7 5.5 0.1 Alkaline phosphatase 163.5 1635 28 Juma &activity Tabatabai.
1977.
Zinc ZnCl2 native soil microflora clay 8 1.5 42 Urease activity 1780 50 Doelman &ED50 Haanstra. 1986.
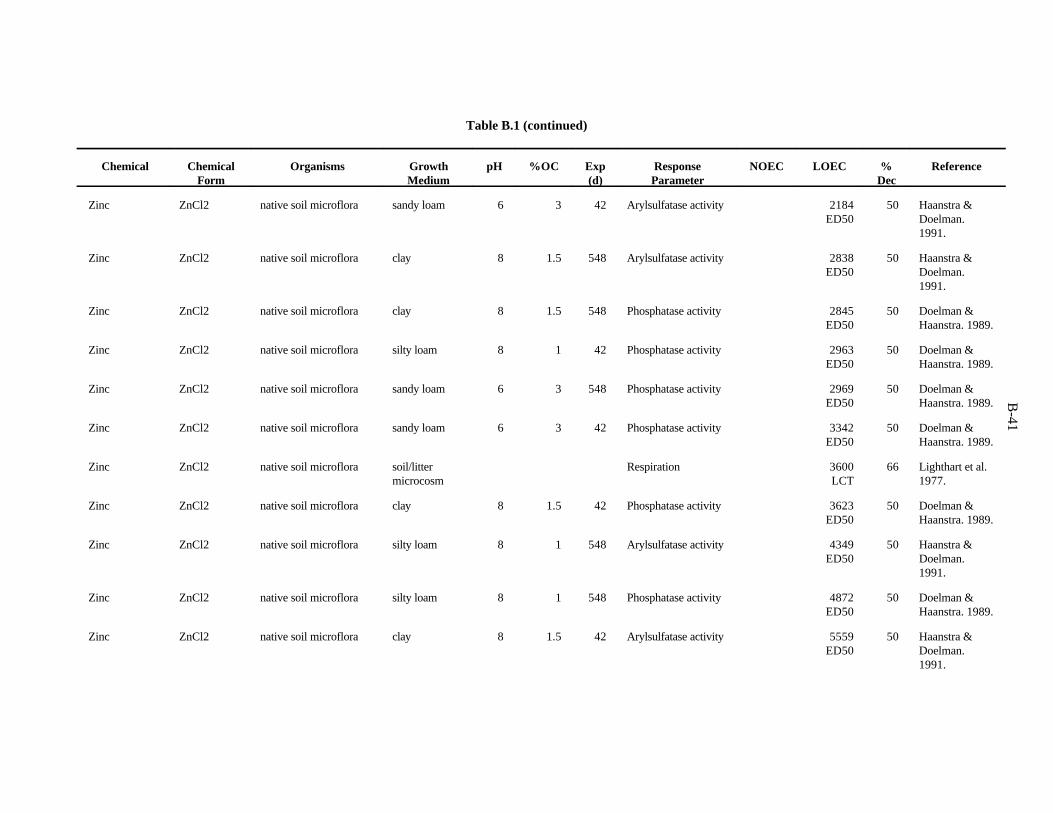
B-41
Table B.1 (continued)
Chemical Chemical Organisms Growth pH %OC Exp Response NOEC LOEC % ReferenceForm Medium (d) Parameter Dec
Zinc ZnCl2 native soil microflora sandy loam 6 3 42 Arylsulfatase activity 2184 50 Haanstra &ED50 Doelman.
1991.
Zinc ZnCl2 native soil microflora clay 8 1.5 548 Arylsulfatase activity 2838 50 Haanstra &ED50 Doelman.
1991.
Zinc ZnCl2 native soil microflora clay 8 1.5 548 Phosphatase activity 2845 50 Doelman &ED50 Haanstra. 1989.
Zinc ZnCl2 native soil microflora silty loam 8 1 42 Phosphatase activity 2963 50 Doelman &ED50 Haanstra. 1989.
Zinc ZnCl2 native soil microflora sandy loam 6 3 548 Phosphatase activity 2969 50 Doelman &ED50 Haanstra. 1989.
Zinc ZnCl2 native soil microflora sandy loam 6 3 42 Phosphatase activity 3342 50 Doelman &ED50 Haanstra. 1989.
Zinc ZnCl2 native soil microflora soil/litter Respiration 3600 66 Lighthart et al.microcosm LCT 1977.
Zinc ZnCl2 native soil microflora clay 8 1.5 42 Phosphatase activity 3623 50 Doelman &ED50 Haanstra. 1989.
Zinc ZnCl2 native soil microflora silty loam 8 1 548 Arylsulfatase activity 4349 50 Haanstra &ED50 Doelman.
1991.
Zinc ZnCl2 native soil microflora silty loam 8 1 548 Phosphatase activity 4872 50 Doelman &ED50 Haanstra. 1989.
Zinc ZnCl2 native soil microflora clay 8 1.5 42 Arylsulfatase activity 5559 50 Haanstra &ED50 Doelman.
1991.
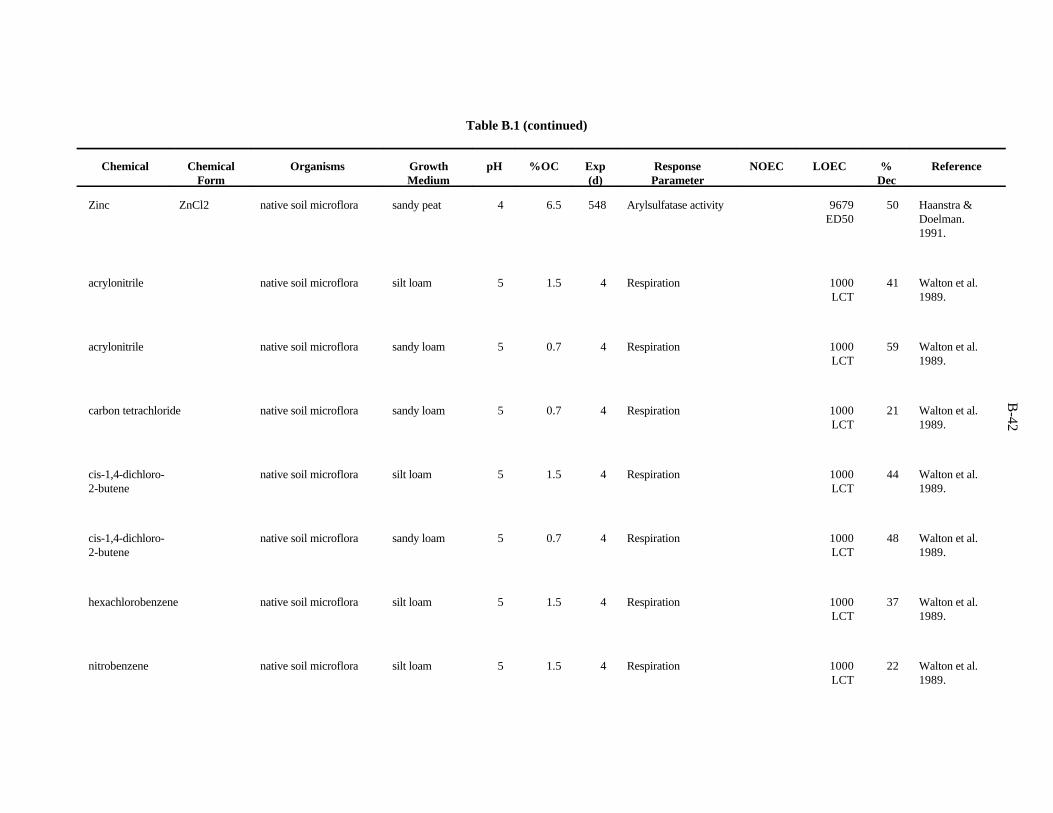
B-42
Table B.1 (continued)
Chemical Chemical Organisms Growth pH %OC Exp Response NOEC LOEC % ReferenceForm Medium (d) Parameter Dec
Zinc ZnCl2 native soil microflora sandy peat 4 6.5 548 Arylsulfatase activity 9679 50 Haanstra &ED50 Doelman.
1991.
acrylonitrile native soil microflora silt loam 5 1.5 4 Respiration 1000 41 Walton et al.LCT 1989.
acrylonitrile native soil microflora sandy loam 5 0.7 4 Respiration 1000 59 Walton et al.LCT 1989.
carbon tetrachloride native soil microflora sandy loam 5 0.7 4 Respiration 1000 21 Walton et al.LCT 1989.
cis-1,4-dichloro- native soil microflora silt loam 5 1.5 4 Respiration 1000 44 Walton et al.2-butene LCT 1989.
cis-1,4-dichloro- native soil microflora sandy loam 5 0.7 4 Respiration 1000 48 Walton et al.2-butene LCT 1989.
hexachlorobenzene native soil microflora silt loam 5 1.5 4 Respiration 1000 37 Walton et al.LCT 1989.
nitrobenzene native soil microflora silt loam 5 1.5 4 Respiration 1000 22 Walton et al.LCT 1989.
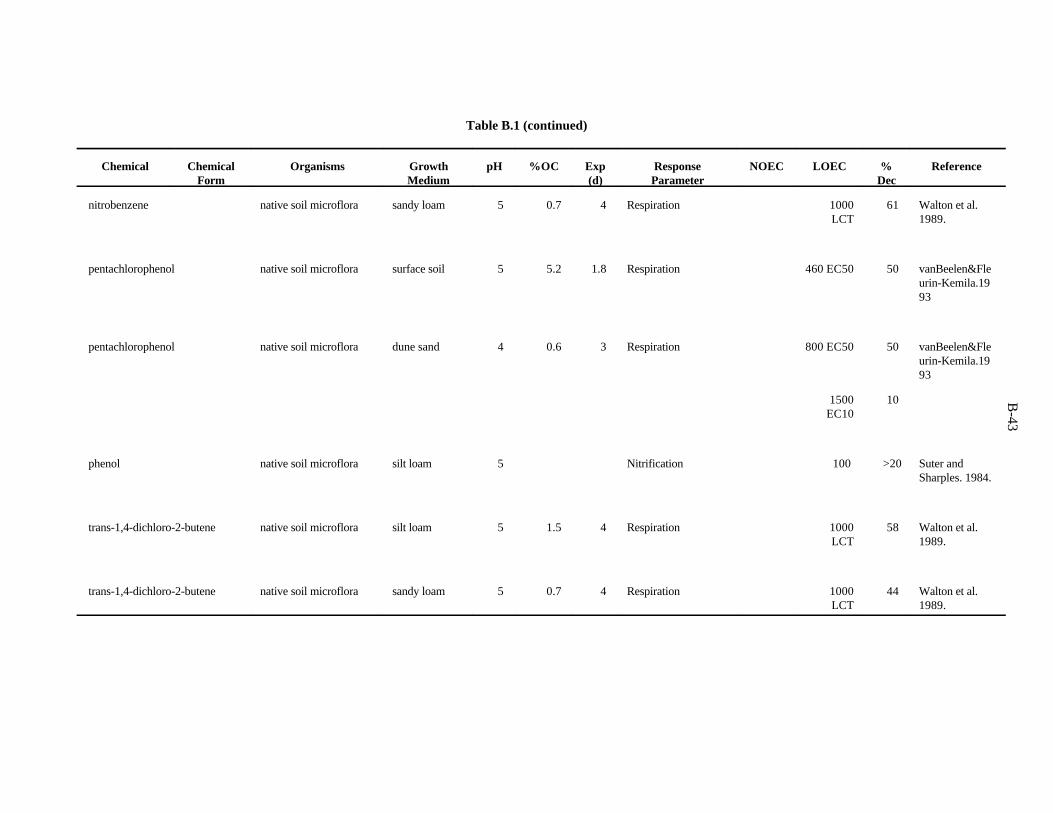
B-43
Table B.1 (continued)
Chemical Chemical Organisms Growth pH %OC Exp Response NOEC LOEC % ReferenceForm Medium (d) Parameter Dec
nitrobenzene native soil microflora sandy loam 5 0.7 4 Respiration 1000 61 Walton et al.LCT 1989.
pentachlorophenol native soil microflora surface soil 5 5.2 1.8 Respiration 460 EC50 50 vanBeelen&Fleurin-Kemila.1993
pentachlorophenol native soil microflora dune sand 4 0.6 3 Respiration 800 EC50 50 vanBeelen&Fleurin-Kemila.1993
1500 10 EC10
phenol native soil microflora silt loam 5 Nitrification 100 >20 Suter andSharples. 1984.
trans-1,4-dichloro-2-butene native soil microflora silt loam 5 1.5 4 Respiration 1000 58 Walton et al.LCT 1989.
trans-1,4-dichloro-2-butene native soil microflora sandy loam 5 0.7 4 Respiration 1000 44 Walton et al.LCT 1989.
APPENDIX C
TOXICITY DATA FOR OTHER SOIL AND LITTER INVERTEBRATES
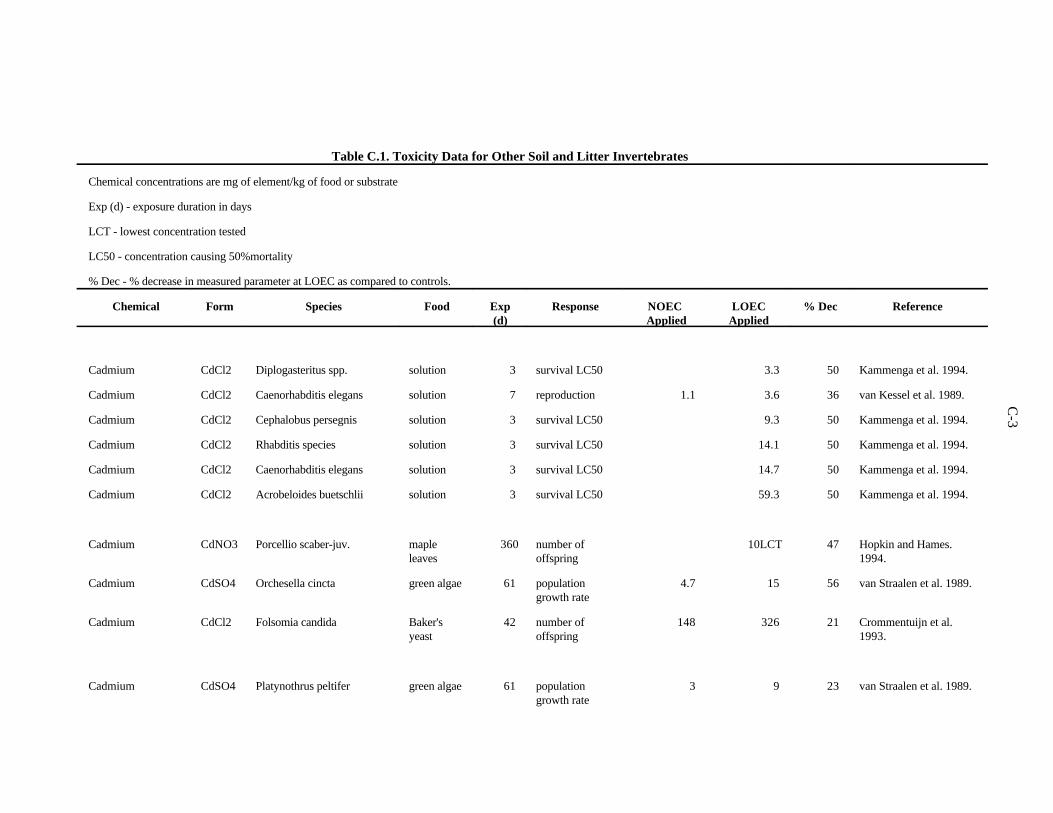
C-3
Table C.1. Toxicity Data for Other Soil and Litter Invertebrates
Chemical concentrations are mg of element/kg of food or substrate
Exp (d) - exposure duration in days
LCT - lowest concentration tested
LC50 - concentration causing 50%mortality
% Dec - % decrease in measured parameter at LOEC as compared to controls.
Chemical Form Species Food Exp Response NOEC LOEC % Dec Reference(d) Applied Applied
Cadmium CdCl2 Diplogasteritus spp. solution 3 survival LC50 3.3 50 Kammenga et al. 1994.
Cadmium CdCl2 Caenorhabditis elegans solution 7 reproduction 1.1 3.6 36 van Kessel et al. 1989.
Cadmium CdCl2 Cephalobus persegnis solution 3 survival LC50 9.3 50 Kammenga et al. 1994.
Cadmium CdCl2 Rhabditis species solution 3 survival LC50 14.1 50 Kammenga et al. 1994.
Cadmium CdCl2 Caenorhabditis elegans solution 3 survival LC50 14.7 50 Kammenga et al. 1994.
Cadmium CdCl2 Acrobeloides buetschlii solution 3 survival LC50 59.3 50 Kammenga et al. 1994.
Cadmium CdNO3 Porcellio scaber-juv. maple 360 number of 10LCT 47 Hopkin and Hames.leaves offspring 1994.
Cadmium CdSO4 Orchesella cincta green algae 61 population 4.7 15 56 van Straalen et al. 1989.growth rate
Cadmium CdCl2 Folsomia candida Baker's 42 number of 148 326 21 Crommentuijn et al.yeast offspring 1993.
Cadmium CdSO4 Platynothrus peltifer green algae 61 population 3 9 23 van Straalen et al. 1989.growth rate
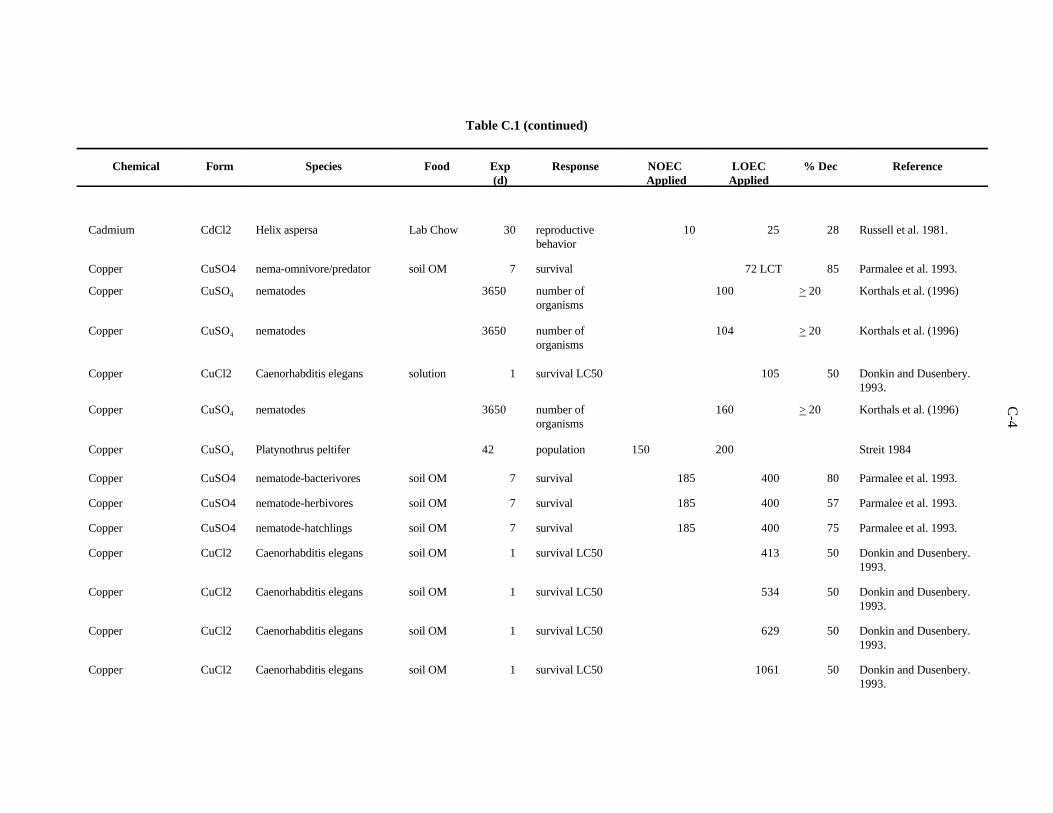
C-4
Table C.1 (continued)
Chemical Form Species Food Exp Response NOEC LOEC % Dec Reference(d) Applied Applied
Cadmium CdCl2 Helix aspersa Lab Chow 30 reproductive 10 25 28 Russell et al. 1981.behavior
Copper CuSO4 nema-omnivore/predator soil OM 7 survival 72 LCT 85 Parmalee et al. 1993.
Copper CuSO nematodes 3650 number of 100 > 20 Korthals et al. (1996)4
organisms
Copper CuSO nematodes 3650 number of 104 > 20 Korthals et al. (1996)4
organisms
Copper CuCl2 Caenorhabditis elegans solution 1 survival LC50 105 50 Donkin and Dusenbery.1993.
Copper CuSO nematodes 3650 number of 160 > 20 Korthals et al. (1996)4
organisms
Copper CuSO Platynothrus peltifer 42 population 150 200 Streit 19844
Copper CuSO4 nematode-bacterivores soil OM 7 survival 185 400 80 Parmalee et al. 1993.
Copper CuSO4 nematode-herbivores soil OM 7 survival 185 400 57 Parmalee et al. 1993.
Copper CuSO4 nematode-hatchlings soil OM 7 survival 185 400 75 Parmalee et al. 1993.
Copper CuCl2 Caenorhabditis elegans soil OM 1 survival LC50 413 50 Donkin and Dusenbery.1993.
Copper CuCl2 Caenorhabditis elegans soil OM 1 survival LC50 534 50 Donkin and Dusenbery.1993.
Copper CuCl2 Caenorhabditis elegans soil OM 1 survival LC50 629 50 Donkin and Dusenbery.1993.
Copper CuCl2 Caenorhabditis elegans soil OM 1 survival LC50 1061 50 Donkin and Dusenbery.1993.
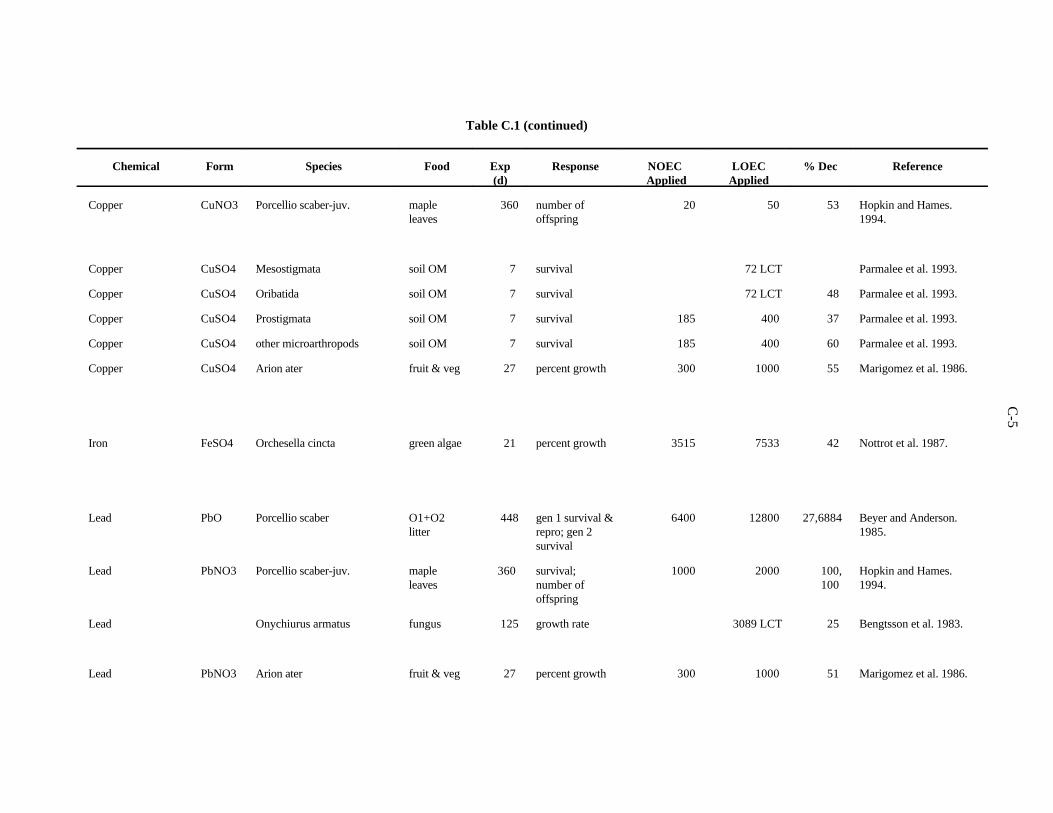
C-5
Table C.1 (continued)
Chemical Form Species Food Exp Response NOEC LOEC % Dec Reference(d) Applied Applied
Copper CuNO3 Porcellio scaber-juv. maple 360 number of 20 50 53 Hopkin and Hames.leaves offspring 1994.
Copper CuSO4 Mesostigmata soil OM 7 survival 72 LCT Parmalee et al. 1993.
Copper CuSO4 Oribatida soil OM 7 survival 72 LCT 48 Parmalee et al. 1993.
Copper CuSO4 Prostigmata soil OM 7 survival 185 400 37 Parmalee et al. 1993.
Copper CuSO4 other microarthropods soil OM 7 survival 185 400 60 Parmalee et al. 1993.
Copper CuSO4 Arion ater fruit & veg 27 percent growth 300 1000 55 Marigomez et al. 1986.
Iron FeSO4 Orchesella cincta green algae 21 percent growth 3515 7533 42 Nottrot et al. 1987.
Lead PbO Porcellio scaber O1+O2 448 gen 1 survival & 6400 12800 27,6884 Beyer and Anderson.litter repro; gen 2 1985.
survival
Lead PbNO3 Porcellio scaber-juv. maple 360 survival; 1000 2000 100, Hopkin and Hames.leaves number of 100 1994.
offspring
Lead Onychiurus armatus fungus 125 growth rate 3089 LCT 25 Bengtsson et al. 1983.
Lead PbNO3 Arion ater fruit & veg 27 percent growth 300 1000 51 Marigomez et al. 1986.
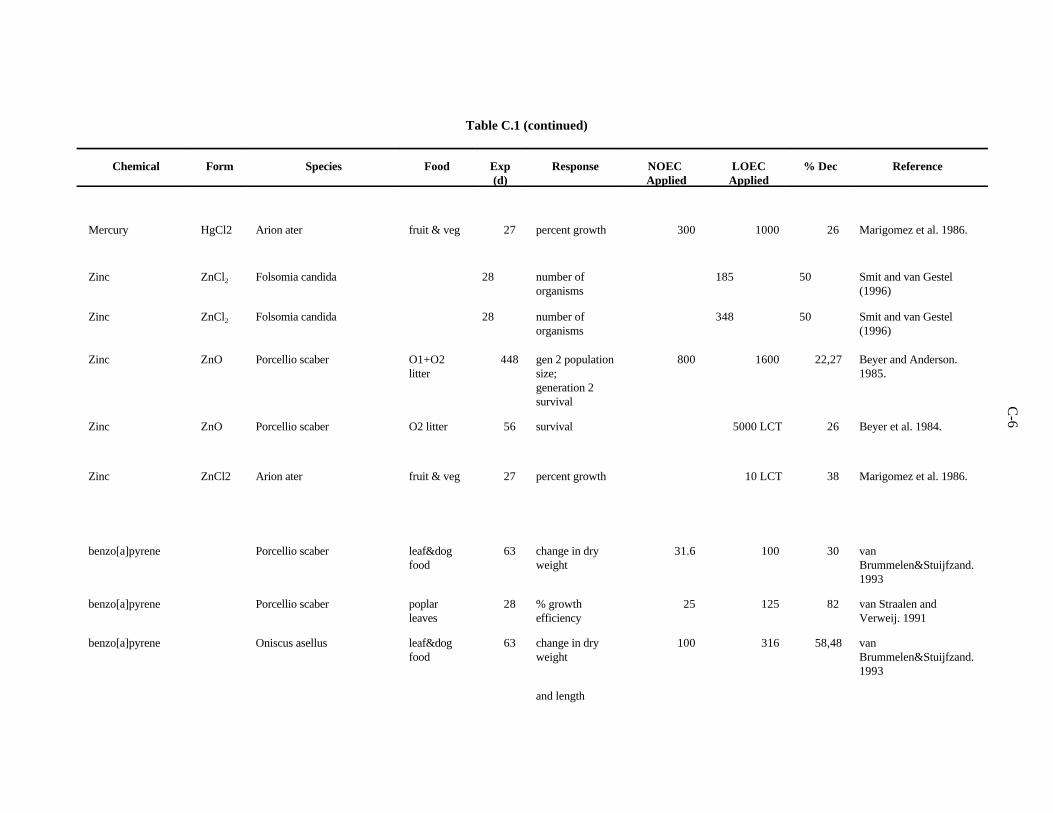
C-6
Table C.1 (continued)
Chemical Form Species Food Exp Response NOEC LOEC % Dec Reference(d) Applied Applied
Mercury HgCl2 Arion ater fruit & veg 27 percent growth 300 1000 26 Marigomez et al. 1986.
Zinc ZnCl Folsomia candida 28 number of 185 50 Smit and van Gestel2
organisms (1996)
Zinc ZnCl Folsomia candida 28 number of 348 50 Smit and van Gestel2
organisms (1996)
Zinc ZnO Porcellio scaber O1+O2 448 gen 2 population 800 1600 22,27 Beyer and Anderson.litter size; 1985.
generation 2survival
Zinc ZnO Porcellio scaber O2 litter 56 survival 5000 LCT 26 Beyer et al. 1984.
Zinc ZnCl2 Arion ater fruit & veg 27 percent growth 10 LCT 38 Marigomez et al. 1986.
benzo[a]pyrene Porcellio scaber leaf&dog 63 change in dry 31.6 100 30 vanfood weight Brummelen&Stuijfzand.
1993
benzo[a]pyrene Porcellio scaber poplar 28 % growth 25 125 82 van Straalen andleaves efficiency Verweij. 1991
benzo[a]pyrene Oniscus asellus leaf&dog 63 change in dry 100 316 58,48 vanfood weight Brummelen&Stuijfzand.
1993
and length
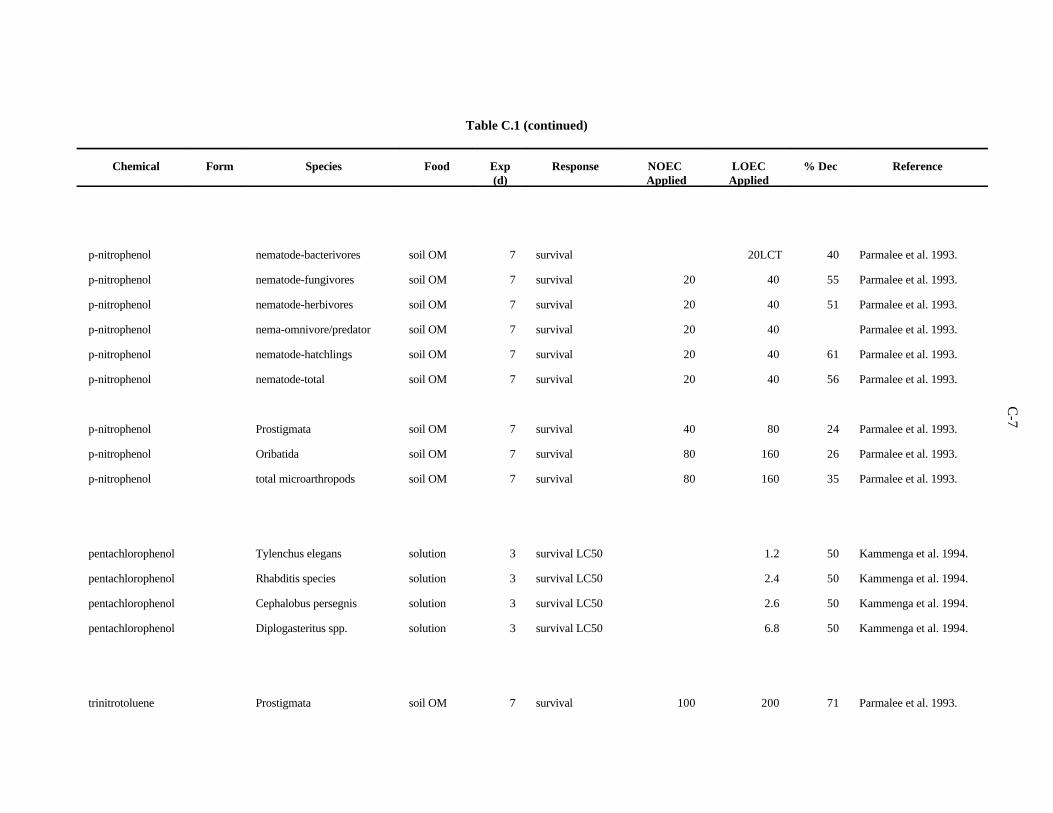
C-7
Table C.1 (continued)
Chemical Form Species Food Exp Response NOEC LOEC % Dec Reference(d) Applied Applied
p-nitrophenol nematode-bacterivores soil OM 7 survival 20LCT 40 Parmalee et al. 1993.
p-nitrophenol nematode-fungivores soil OM 7 survival 20 40 55 Parmalee et al. 1993.
p-nitrophenol nematode-herbivores soil OM 7 survival 20 40 51 Parmalee et al. 1993.
p-nitrophenol nema-omnivore/predator soil OM 7 survival 20 40 Parmalee et al. 1993.
p-nitrophenol nematode-hatchlings soil OM 7 survival 20 40 61 Parmalee et al. 1993.
p-nitrophenol nematode-total soil OM 7 survival 20 40 56 Parmalee et al. 1993.
p-nitrophenol Prostigmata soil OM 7 survival 40 80 24 Parmalee et al. 1993.
p-nitrophenol Oribatida soil OM 7 survival 80 160 26 Parmalee et al. 1993.
p-nitrophenol total microarthropods soil OM 7 survival 80 160 35 Parmalee et al. 1993.
pentachlorophenol Tylenchus elegans solution 3 survival LC50 1.2 50 Kammenga et al. 1994.
pentachlorophenol Rhabditis species solution 3 survival LC50 2.4 50 Kammenga et al. 1994.
pentachlorophenol Cephalobus persegnis solution 3 survival LC50 2.6 50 Kammenga et al. 1994.
pentachlorophenol Diplogasteritus spp. solution 3 survival LC50 6.8 50 Kammenga et al. 1994.
trinitrotoluene Prostigmata soil OM 7 survival 100 200 71 Parmalee et al. 1993.
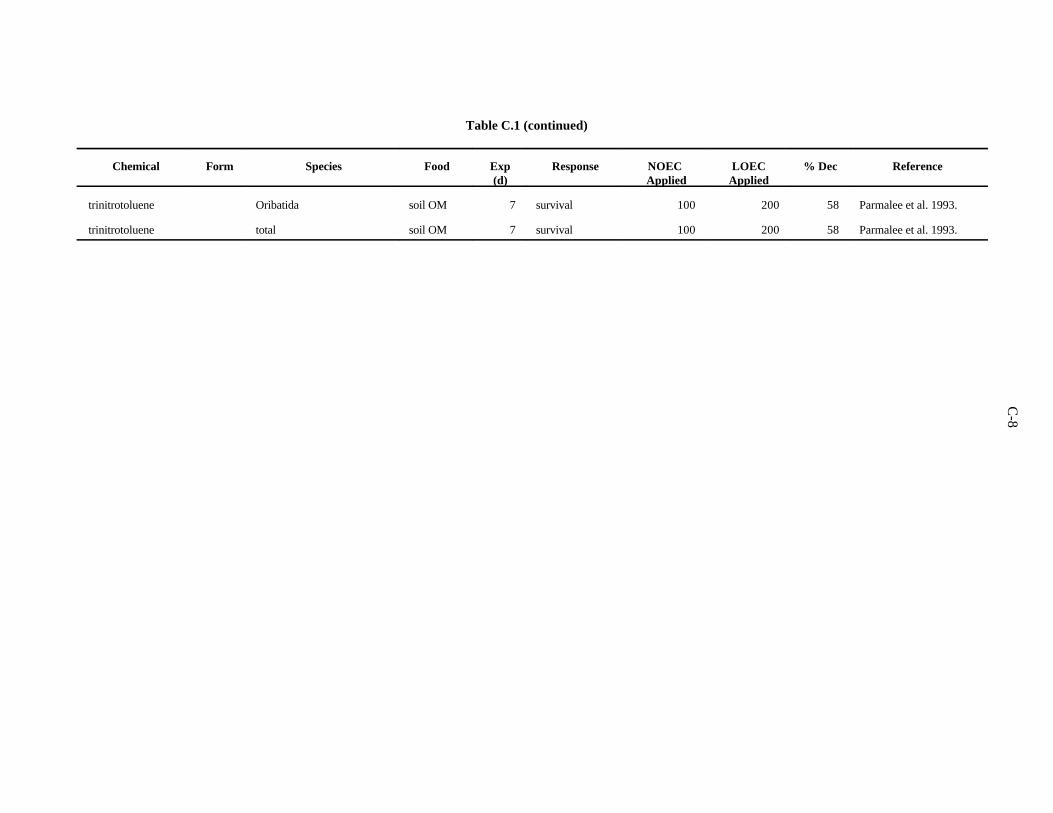
C-8
Table C.1 (continued)
Chemical Form Species Food Exp Response NOEC LOEC % Dec Reference(d) Applied Applied
trinitrotoluene Oribatida soil OM 7 survival 100 200 58 Parmalee et al. 1993.
trinitrotoluene total soil OM 7 survival 100 200 58 Parmalee et al. 1993.