quickstart guide to morningstar direct
TRANSCRIPT

Direct
QuickStart Guide toMorningstar Direct
Onboarding Guide

Morningstar Direct January 2020© 2020 Morningstar. All Rights Reserved.
Copyright © 2020 Morningstar, Inc. All rights reserved.
The information contained herein: (1) is proprietary to Morningstar and/or its content providers; (2) may not be copied or distributed; (3) is not warranted to be accurate, complete or timely; and (4) does not constitute advice of any kind. Neither Morningstar nor its content providers are responsible for any damages or losses arising from any use of this information. Any statements that are nonfactual in nature constitute opinions only, are subject to change without notice, and may not be consistent across Morningstar. Past performance is no guarantee of future results.
Morningstar Direct January 2020 3© 2020 Morningstar. All Rights Reserved.
Contents
Overview . . . . . . . . . . . . . . . . . . . . . . . . . . . . . . . . . . . . . . . . . . . . . . . . . . . . . . . . . . . . . . . . 5
Navigating in Morningstar Direct . . . . . . . . . . . . . . . . . . . . . . . . . . . . . . . . . . . . . . . . . . . . . . . . 6
Overview . . . . . . . . . . . . . . . . . . . . . . . . . . . . . . . . . . . . . . . . . . . . . . . . . . . . . . . . . . . . . . . . 6How is Morningstar Direct designed to be used? . . . . . . . . . . . . . . . . . . . . . . . . . . . . . . . . 6
Understanding the Home Module . . . . . . . . . . . . . . . . . . . . . . . . . . . . . . . . . . . . . . . . . . . . . . . . 8
Overview . . . . . . . . . . . . . . . . . . . . . . . . . . . . . . . . . . . . . . . . . . . . . . . . . . . . . . . . . . . . . . . . 8How is this module intended to be used? . . . . . . . . . . . . . . . . . . . . . . . . . . . . . . . . . . . . . . 8Where can updates to the application be found? . . . . . . . . . . . . . . . . . . . . . . . . . . . . . . . . 9Can the arrangement of the widgets on the Home page be changed? . . . . . . . . . . . . . . 10
Understanding the Equity/Credit Research Module . . . . . . . . . . . . . . . . . . . . . . . . . . . . . . . . . 11
Overview . . . . . . . . . . . . . . . . . . . . . . . . . . . . . . . . . . . . . . . . . . . . . . . . . . . . . . . . . . . . . . . 11How do I find Equity/Credit research data in the web-based version of Morningstar Direct?11
Understanding the Local and Global Databases Modules . . . . . . . . . . . . . . . . . . . . . . . . . . . . 13
Overview . . . . . . . . . . . . . . . . . . . . . . . . . . . . . . . . . . . . . . . . . . . . . . . . . . . . . . . . . . . . . . . 13How are these modules intended to be used?. . . . . . . . . . . . . . . . . . . . . . . . . . . . . . . . . . 13What are the differences between the Local/Global Databases modules and the Workspace module?13
Understanding the Performance Reporting Module . . . . . . . . . . . . . . . . . . . . . . . . . . . . . . . . . 14
Overview . . . . . . . . . . . . . . . . . . . . . . . . . . . . . . . . . . . . . . . . . . . . . . . . . . . . . . . . . . . . . . . 14How is this module intended to be used? . . . . . . . . . . . . . . . . . . . . . . . . . . . . . . . . . . . . . 14What are the basic steps involved in creating a performance report? . . . . . . . . . . . . . . . 14
Understanding the Asset Allocation Module . . . . . . . . . . . . . . . . . . . . . . . . . . . . . . . . . . . . . . 15
Overview . . . . . . . . . . . . . . . . . . . . . . . . . . . . . . . . . . . . . . . . . . . . . . . . . . . . . . . . . . . . . . . 15How is this module intended to be used? . . . . . . . . . . . . . . . . . . . . . . . . . . . . . . . . . . . . . 15
Understanding the Portfolio Management Module . . . . . . . . . . . . . . . . . . . . . . . . . . . . . . . . . 16
Overview . . . . . . . . . . . . . . . . . . . . . . . . . . . . . . . . . . . . . . . . . . . . . . . . . . . . . . . . . . . . . . . 16How is this module intended to be used? . . . . . . . . . . . . . . . . . . . . . . . . . . . . . . . . . . . . . 16
Understanding the Portfolio Analysis Module . . . . . . . . . . . . . . . . . . . . . . . . . . . . . . . . . . . . . 17
Overview . . . . . . . . . . . . . . . . . . . . . . . . . . . . . . . . . . . . . . . . . . . . . . . . . . . . . . . . . . . . . . . 17How is this module intended to be used? . . . . . . . . . . . . . . . . . . . . . . . . . . . . . . . . . . . . . 17
Understanding the Markets Module . . . . . . . . . . . . . . . . . . . . . . . . . . . . . . . . . . . . . . . . . . . . . 18
Overview . . . . . . . . . . . . . . . . . . . . . . . . . . . . . . . . . . . . . . . . . . . . . . . . . . . . . . . . . . . . . . . 18How is this module intended to be used? . . . . . . . . . . . . . . . . . . . . . . . . . . . . . . . . . . . . . 18
Understanding the Asset Flows Module . . . . . . . . . . . . . . . . . . . . . . . . . . . . . . . . . . . . . . . . . . 19
Overview . . . . . . . . . . . . . . . . . . . . . . . . . . . . . . . . . . . . . . . . . . . . . . . . . . . . . . . . . . . . . . . 19How is this module intended to be used? . . . . . . . . . . . . . . . . . . . . . . . . . . . . . . . . . . . . . 19
Contents
Morningstar Direct January 2020 4© 2020 Morningstar. All Rights Reserved.
Understanding the Presentation Studio Module. . . . . . . . . . . . . . . . . . . . . . . . . . . . . . . . . . . . 20
Overview . . . . . . . . . . . . . . . . . . . . . . . . . . . . . . . . . . . . . . . . . . . . . . . . . . . . . . . . . . . . . . . 20How is this module intended to be used? . . . . . . . . . . . . . . . . . . . . . . . . . . . . . . . . . . . . . 20
Understanding the Risk Model Analysis Module . . . . . . . . . . . . . . . . . . . . . . . . . . . . . . . . . . . 21
Overview . . . . . . . . . . . . . . . . . . . . . . . . . . . . . . . . . . . . . . . . . . . . . . . . . . . . . . . . . . . . . . . 21How is this module intended to be used? . . . . . . . . . . . . . . . . . . . . . . . . . . . . . . . . . . . . . 21
Understanding the Workspace Module. . . . . . . . . . . . . . . . . . . . . . . . . . . . . . . . . . . . . . . . . . . 22
Overview . . . . . . . . . . . . . . . . . . . . . . . . . . . . . . . . . . . . . . . . . . . . . . . . . . . . . . . . . . . . . . . 22How is this module intended to be used? . . . . . . . . . . . . . . . . . . . . . . . . . . . . . . . . . . . . . 22

Morningstar Direct January 2020 5© 2020 Morningstar. All Rights Reserved.
QuickStart Guide to Morningstar DirectSM
OverviewMorningstar DirectSM delivers investment vision. It’s a global investment analysis platform uniting all of Morningstar’s data and institutional research, private and third-party content, rigorous analytics, and productivity tools.
In this manual, you will learn some basic information about Morningstar Direct, including the following:
gBasic navigation of the application, andgWhat each module in Morningstar Direct does and why you would use it.
Morningstar Direct offers a wealth of research and presentation capabilities.
You can also check out our role-based library to select the training program that best describes your role.
Navigating in Morningstar Direct Overview
Morningstar Direct January 2020 6© 2020 Morningstar. All Rights Reserved.
Navigating in Morningstar Direct
OverviewThis section explains how Morningstar Direct is organized as an application, and how to move through the application.
How is Morningstar Direct designed to be used?
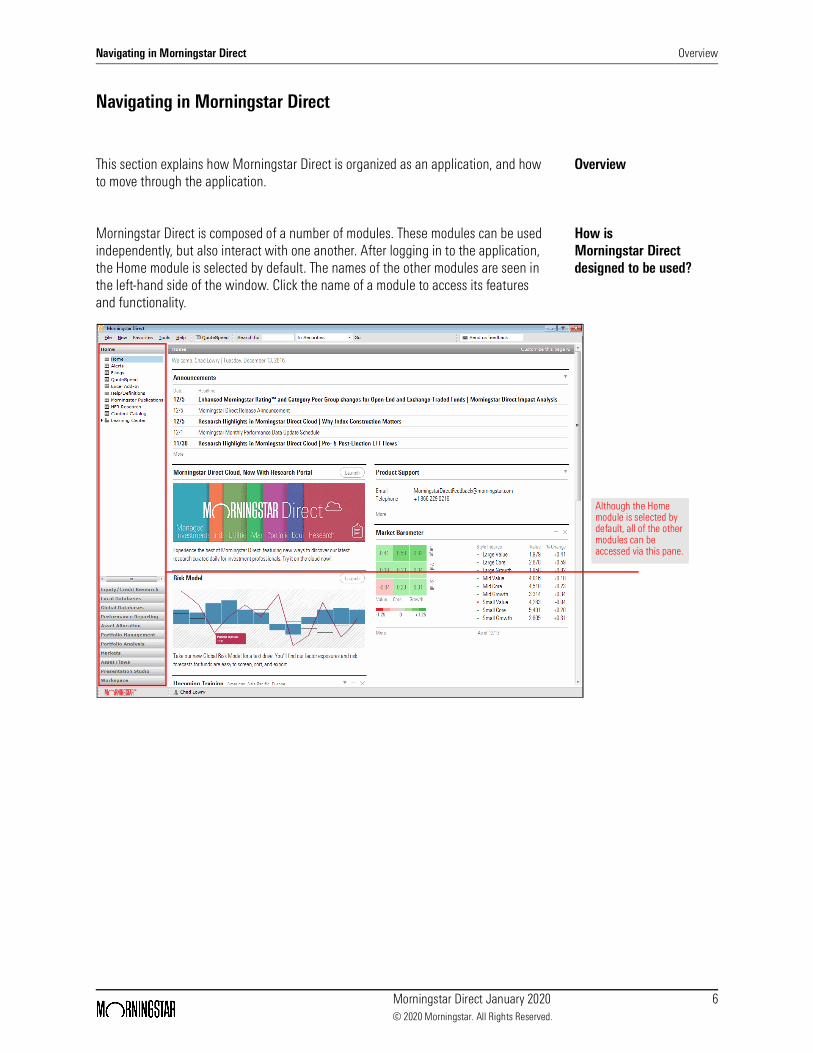
Morningstar Direct is composed of a number of modules. These modules can be used independently, but also interact with one another. After logging in to the application, the Home module is selected by default. The names of the other modules are seen in the left-hand side of the window. Click the name of a module to access its features and functionality.
Although the Home module is selected by default, all of the other modules can be accessed via this pane.
Navigating in Morningstar Direct How is Morningstar Direct designed to be used?
Morningstar Direct January 2020 7© 2020 Morningstar. All Rights Reserved.
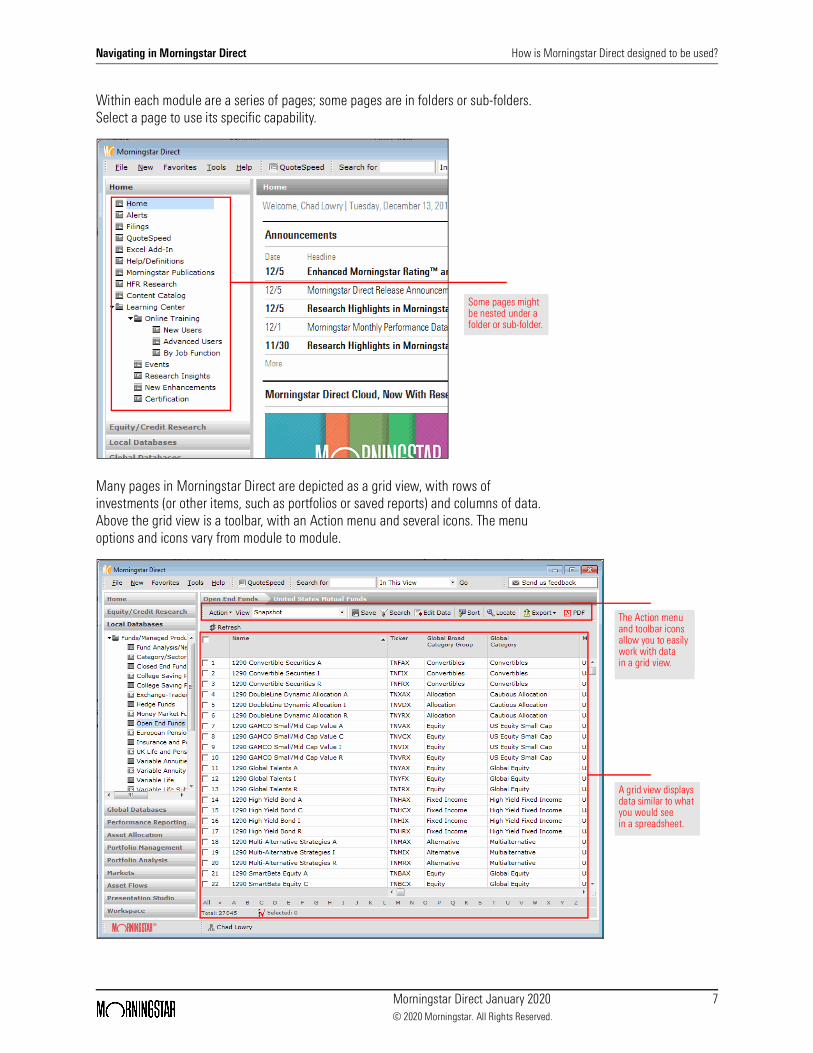
Within each module are a series of pages; some pages are in folders or sub-folders. Select a page to use its specific capability.
Many pages in Morningstar Direct are depicted as a grid view, with rows of investments (or other items, such as portfolios or saved reports) and columns of data. Above the grid view is a toolbar, with an Action menu and several icons. The menu options and icons vary from module to module.
Some pages might be nested under a folder or sub-folder.
A grid view displays data similar to what you would see in a spreadsheet.
The Action menu and toolbar icons allow you to easily work with data in a grid view.
Understanding the Home Module Overview
Morningstar Direct January 2020 8© 2020 Morningstar. All Rights Reserved.
Understanding the Home Module
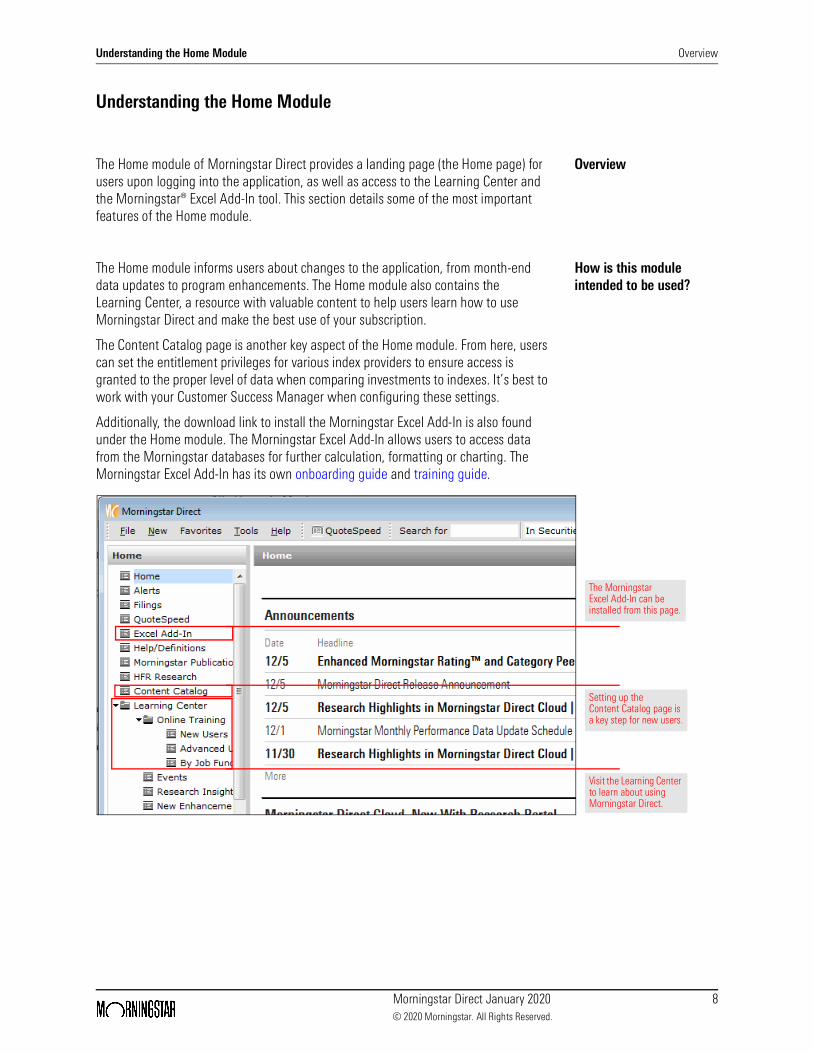
OverviewThe Home module of Morningstar Direct provides a landing page (the Home page) for users upon logging into the application, as well as access to the Learning Center and the Morningstar® Excel Add-In tool. This section details some of the most important features of the Home module.
How is this module intended to be used?
The Home module informs users about changes to the application, from month-end data updates to program enhancements. The Home module also contains the Learning Center, a resource with valuable content to help users learn how to use Morningstar Direct and make the best use of your subscription.
The Content Catalog page is another key aspect of the Home module. From here, users can set the entitlement privileges for various index providers to ensure access is granted to the proper level of data when comparing investments to indexes. It’s best to work with your Customer Success Manager when configuring these settings.
Additionally, the download link to install the Morningstar Excel Add-In is also found under the Home module. The Morningstar Excel Add-In allows users to access data from the Morningstar databases for further calculation, formatting or charting. The Morningstar Excel Add-In has its own onboarding guide and training guide.
The Morningstar Excel Add-In can be installed from this page.
Setting up the Content Catalog page is a key step for new users.
Visit the Learning Center to learn about using Morningstar Direct.
Understanding the Home Module Where can updates to the application be found?
Morningstar Direct January 2020 9© 2020 Morningstar. All Rights Reserved.
Where can updates to the application be found?
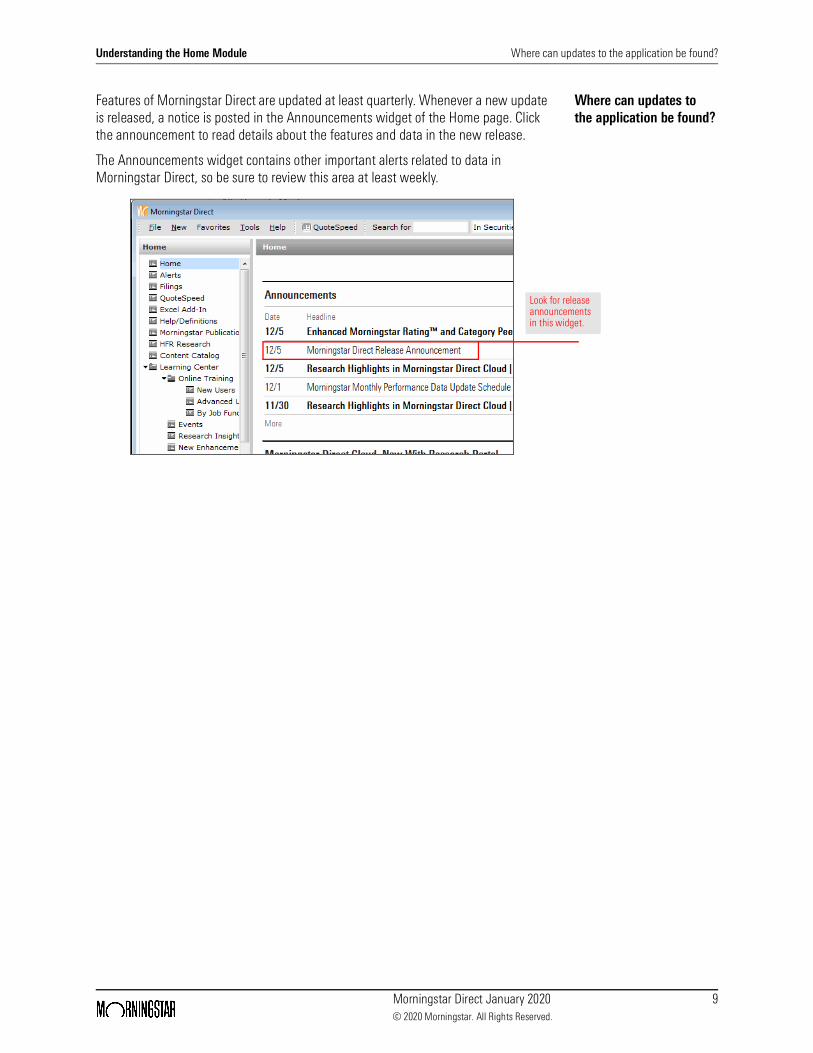
Features of Morningstar Direct are updated at least quarterly. Whenever a new update is released, a notice is posted in the Announcements widget of the Home page. Click the announcement to read details about the features and data in the new release.
The Announcements widget contains other important alerts related to data in Morningstar Direct, so be sure to review this area at least weekly.
Look for release announcements in this widget.

Understanding the Home Module Can the arrangement of the widgets on the Home page be changed?
Morningstar Direct January 2020 10© 2020 Morningstar. All Rights Reserved.
Can the arrangement of the widgets on the Home page be changed?
The position of some widgets (such as Announcements) are fixed on the Home page, and they cannot be removed or repositioned. Other widgets can be added, removed, and repositioned. To add or remove a widget, simply click the Customize this page button in the upper-right corner of the Home page. From the dialog box that opens, simply check or clear the checkbox next to the widget(s) to be shown or hidden.
To reposition a widget, simply move your mouse over the widget’s header, then drag-and-drop it into a new location.
Use this button and the accompanying dialog box to turn certain widgets on or off.
When this icon turns to a green checkmark, release the mouse button to place the widget in its new location.
Understanding the Equity/Credit Research Module Overview
Morningstar Direct January 2020 11© 2020 Morningstar. All Rights Reserved.
Understanding the Equity/Credit Research Module
OverviewThe Equity/Credit Research module surfaces insight from Morningstar on stocks, corporate fixed-income securities, earnings estimates, and more. Users looking for the latest Morningstar analyst research on specific investments, or insight on broader investment categories such as a stock sector, the Equity/Credit Research module is the place to locate this information. This content is available from the web-based version of Morningstar Direct.
How do I find Equity/Credit research data in the web-based version of Morningstar Direct?
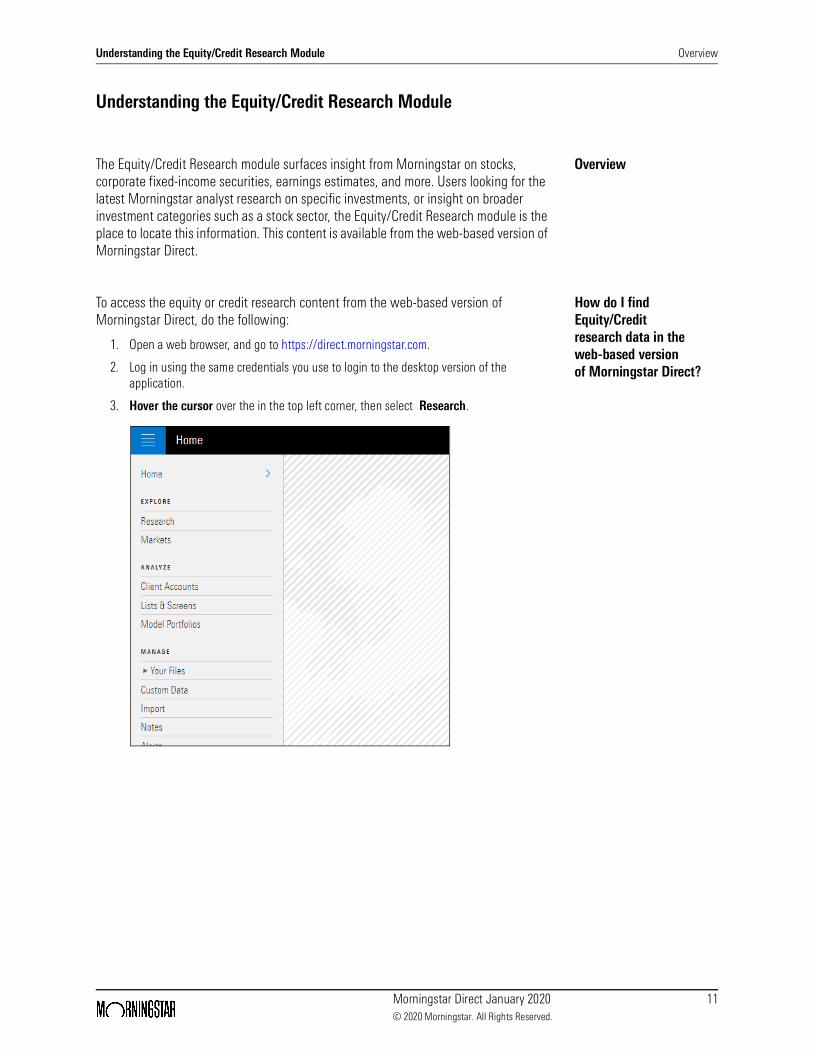
To access the equity or credit research content from the web-based version of Morningstar Direct, do the following:
1. Open a web browser, and go to https://direct.morningstar.com.
2. Log in using the same credentials you use to login to the desktop version of the application.
3. Hover the cursor over the in the top left corner, then select Research.

Understanding the Equity/Credit Research ModuleHow do I find Equity/Credit research data in the web-based version
of Morningstar Direct?
Morningstar Direct January 2020 12© 2020 Morningstar. All Rights Reserved.
4. In the left-hand navigation pane, select Publications.
5. On the Publications page, click a tile related to either equity or credit research.
6. Click an article to read it.
The Publications page offers a number of tiles related to equity and credit research.
Click the name of an article to read it.
Understanding the Local and Global Databases Modules Overview
Morningstar Direct January 2020 13© 2020 Morningstar. All Rights Reserved.
Understanding the Local and Global Databases Modules
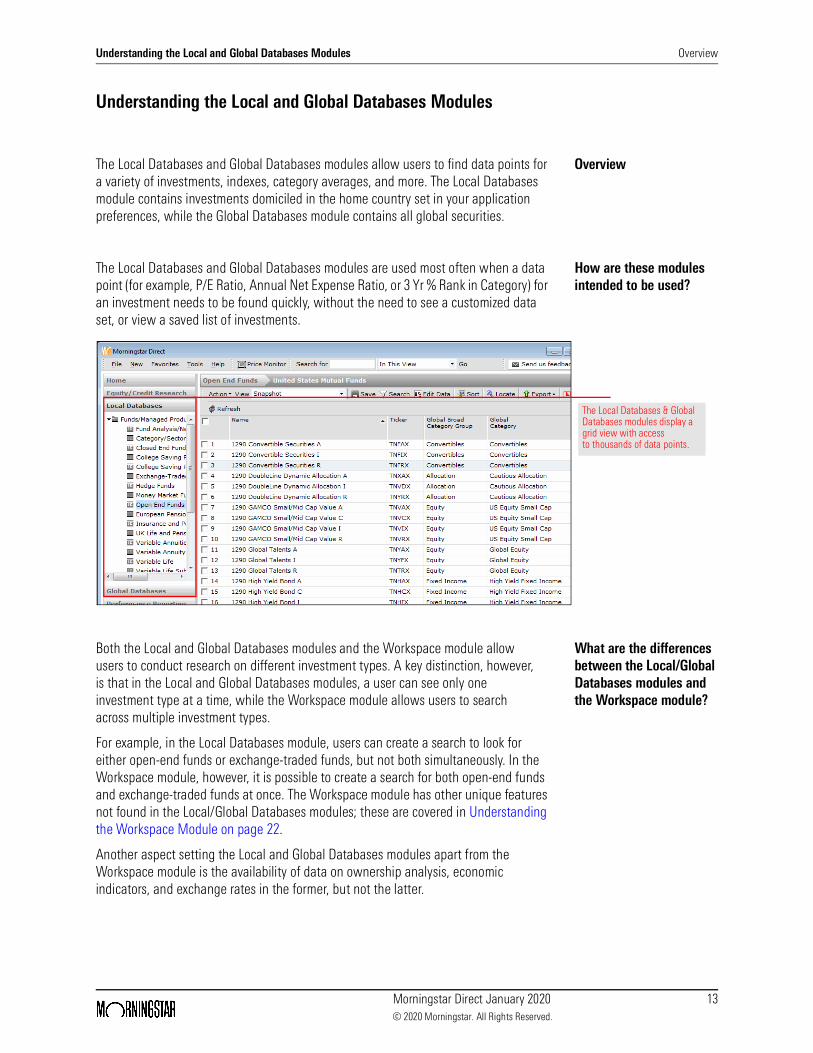
OverviewThe Local Databases and Global Databases modules allow users to find data points for a variety of investments, indexes, category averages, and more. The Local Databases module contains investments domiciled in the home country set in your application preferences, while the Global Databases module contains all global securities.
How are these modules intended to be used?
The Local Databases and Global Databases modules are used most often when a data point (for example, P/E Ratio, Annual Net Expense Ratio, or 3 Yr % Rank in Category) for an investment needs to be found quickly, without the need to see a customized data set, or view a saved list of investments.
What are the differences between the Local/Global Databases modules and the Workspace module?
Both the Local and Global Databases modules and the Workspace module allow users to conduct research on different investment types. A key distinction, however, is that in the Local and Global Databases modules, a user can see only one investment type at a time, while the Workspace module allows users to search across multiple investment types.
For example, in the Local Databases module, users can create a search to look for either open-end funds or exchange-traded funds, but not both simultaneously. In the Workspace module, however, it is possible to create a search for both open-end funds and exchange-traded funds at once. The Workspace module has other unique features not found in the Local/Global Databases modules; these are covered in Understanding the Workspace Module on page 22.
Another aspect setting the Local and Global Databases modules apart from the Workspace module is the availability of data on ownership analysis, economic indicators, and exchange rates in the former, but not the latter.
The Local Databases & Global Databases modules display a grid view with access to thousands of data points.

Understanding the Performance Reporting Module Overview
Morningstar Direct January 2020 14© 2020 Morningstar. All Rights Reserved.
Understanding the Performance Reporting Module
OverviewPerformance Reporting is specifically designed to monitor the performance of investments organized into groupings based on a user’s classifications. For example, a user may want to see funds grouped by Morningstar Category, or all large-cap funds could be grouped together. Users can assign benchmarks, define data points to display on the report, and perform ranking analysis. Both qualitative and quantitative factors can be applied to the report. Users can also implement a scorecard using standardized values or custom grades to further monitor investments.
How is this module intended to be used?
The Performance Reporting module allows users to build a custom report within Morningstar Direct where the rows of investments and columns of data points are defined. This might sound similar to using a search or list and then building a custom data set in the Workspace module, but the Performance Reporting module not only makes it easier to define time periods and allows custom grouping options for rows, but also enables users to add conditional formatting (that is., color) to rows or cells and includes a Scorecard feature to help analyze the information being displayed.
What are the basic steps involved in creating a performance report?
Creating a performance report in Morningstar Direct takes the following basic steps:
1. Select the investments to display on the report. This might involve the use of an existing list or search created in the Workspace module.
2. Choose the groupings and peer groups to use, as well as the benchmarks for the report.3. Set the time periods to depict on the report, and the performance or rank data points to
display in each time period. The time periods could be static windows, such as the trailing 1-, 3-, or 5-year periods, or you can create rolling windows, or more.
4. What supplementary data points should be included on the report? These might include an investment’s ticker symbol, Morningstar Analyst Rating, or any of the other thousands of data points available in Morningstar Direct.
5. Optionally, include conditional formatting to call out important information.6. Optionally, use a scorecard to help analyze the data displayed on the report.
Understanding the Asset Allocation Module Overview
Morningstar Direct January 2020 15© 2020 Morningstar. All Rights Reserved.
Understanding the Asset Allocation Module
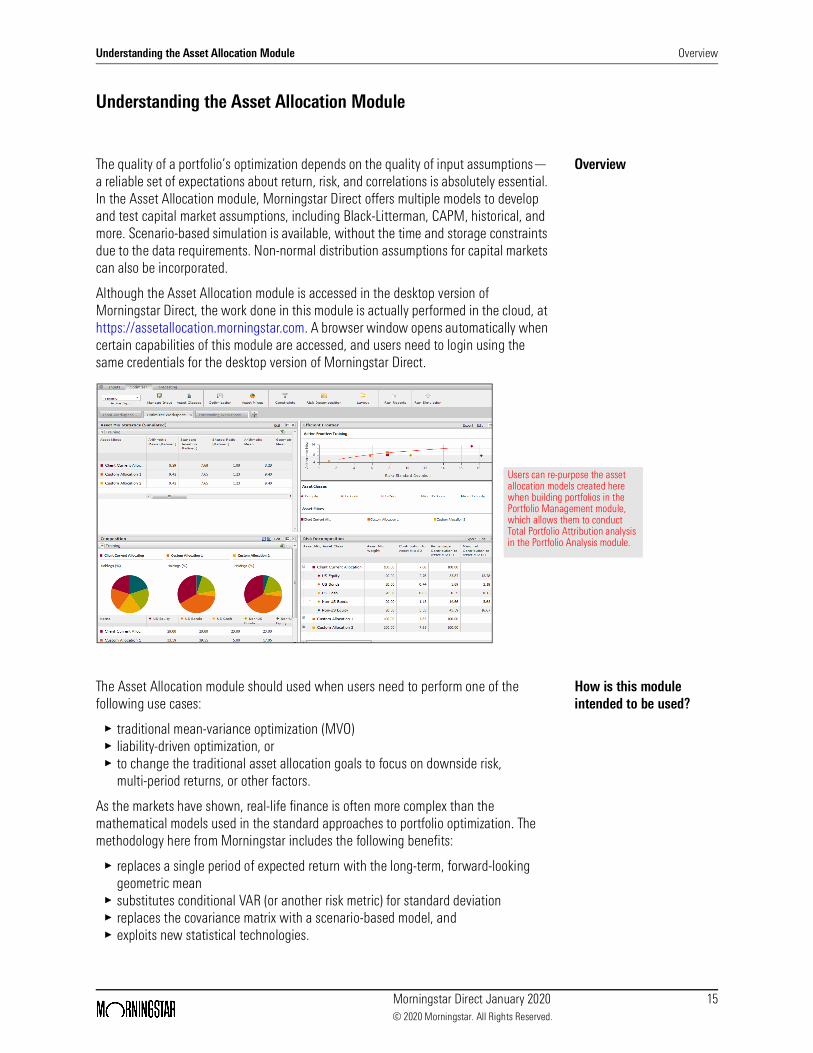
OverviewThe quality of a portfolio’s optimization depends on the quality of input assumptions— a reliable set of expectations about return, risk, and correlations is absolutely essential. In the Asset Allocation module, Morningstar Direct offers multiple models to develop and test capital market assumptions, including Black-Litterman, CAPM, historical, and more. Scenario-based simulation is available, without the time and storage constraints due to the data requirements. Non-normal distribution assumptions for capital markets can also be incorporated.
Although the Asset Allocation module is accessed in the desktop version of Morningstar Direct, the work done in this module is actually performed in the cloud, at https://assetallocation.morningstar.com. A browser window opens automatically when certain capabilities of this module are accessed, and users need to login using the same credentials for the desktop version of Morningstar Direct.
How is this module intended to be used?
The Asset Allocation module should used when users need to perform one of the following use cases:
g traditional mean-variance optimization (MVO)g liability-driven optimization, or g to change the traditional asset allocation goals to focus on downside risk,
multi-period returns, or other factors.
As the markets have shown, real-life finance is often more complex than the mathematical models used in the standard approaches to portfolio optimization. The methodology here from Morningstar includes the following benefits:
g replaces a single period of expected return with the long-term, forward-looking geometric meang substitutes conditional VAR (or another risk metric) for standard deviationg replaces the covariance matrix with a scenario-based model, and g exploits new statistical technologies.
Users can re-purpose the asset allocation models created here when building portfolios in the Portfolio Management module, which allows them to conduct Total Portfolio Attribution analysis in the Portfolio Analysis module.
Understanding the Portfolio Management Module Overview
Morningstar Direct January 2020 16© 2020 Morningstar. All Rights Reserved.
Understanding the Portfolio Management Module
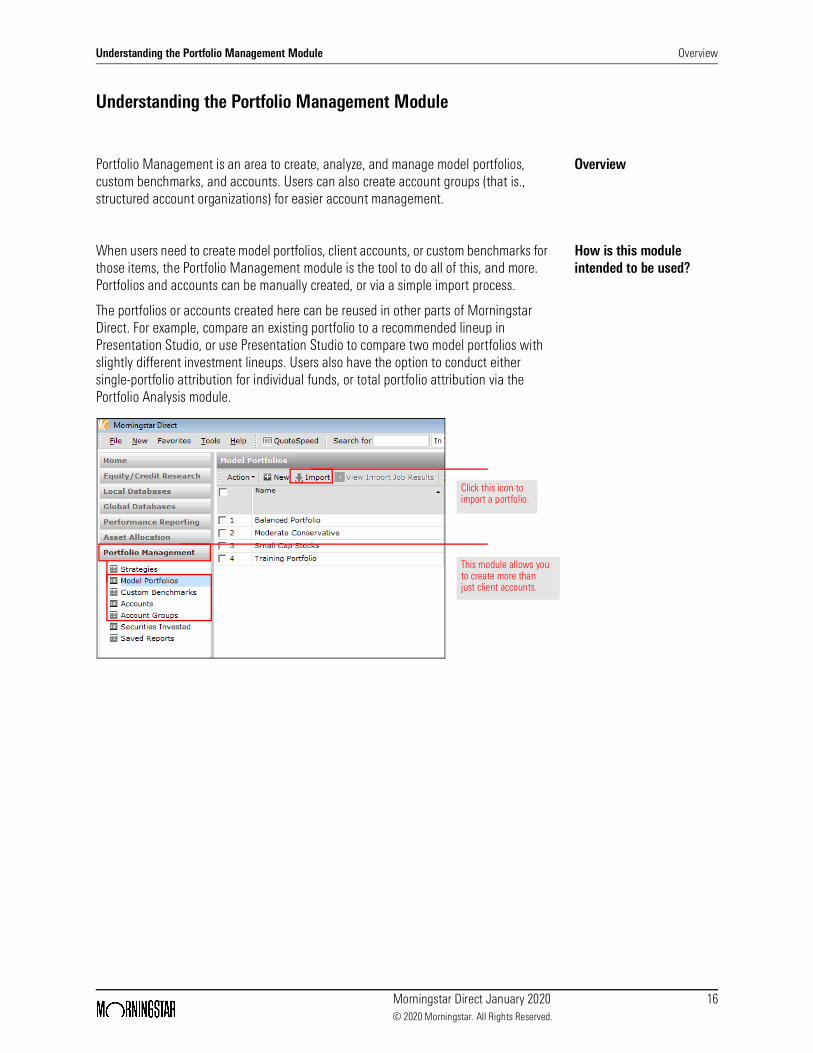
OverviewPortfolio Management is an area to create, analyze, and manage model portfolios, custom benchmarks, and accounts. Users can also create account groups (that is., structured account organizations) for easier account management.
How is this module intended to be used?
When users need to create model portfolios, client accounts, or custom benchmarks for those items, the Portfolio Management module is the tool to do all of this, and more. Portfolios and accounts can be manually created, or via a simple import process.
The portfolios or accounts created here can be reused in other parts of Morningstar Direct. For example, compare an existing portfolio to a recommended lineup in Presentation Studio, or use Presentation Studio to compare two model portfolios with slightly different investment lineups. Users also have the option to conduct either single-portfolio attribution for individual funds, or total portfolio attribution via the Portfolio Analysis module.
Click this icon to import a portfolio.
This module allows you to create more than just client accounts.

Understanding the Portfolio Analysis Module Overview
Morningstar Direct January 2020 17© 2020 Morningstar. All Rights Reserved.
Understanding the Portfolio Analysis Module
OverviewThe attribution analysis capabilities in the Portfolio Analysis module allow users to see how decisions contributed to investment results. Morningstar Direct supports sophisticated analysis at the manager or asset-class level, using a multi-decision hierarchy to model the portfolio decision-making process. Morningstar Direct combines the comprehensive methodologies needed to evaluate performance with rich graphics to allow users to quickly interpret the data.
How is this module intended to be used?
Performance attribution is a well-recognized, quantitative approach to identifying the impact of a portfolio manager’s sector bets, regional allocations, stock selection, and more. The Portfolio Analysis module allows users to conduct single-portfolio equity attribution. This is offered via a website which you can launch from Morningstar Direct. You can also visit it directly by going to https://portfolioanalysis.morningstar.com.
With Total Portfolio Attribution from Morningstar Direct, users can identify the performance impact attributable to a strategic asset allocation policy itself. Then, examine the outcome of deliberate deviations from policy weights done to take advantage of market conditions. Measure a manager's skill in picking investments in aggregate, or by asset class or investment style. Non-skill-based measures, such as fees, are isolated to preserve the purity of skill-based decisions, allowing users to measure the value delivered by consultants relative to the fees incurred.
The Portfolio Analysis module allows you to conduct equity attribution analysis on a single portfolio
Understanding the Markets Module Overview
Morningstar Direct January 2020 18© 2020 Morningstar. All Rights Reserved.
Understanding the Markets Module
OverviewSimilar to the Asset Allocation and Portfolio Analysis modules, the Markets module is located online. The overview content on the markets can be accessed from this link: https://portfolioanalysis.morningstar.com/markets?mode=tool&fromPage=DirectCloud
How is this module intended to be used?
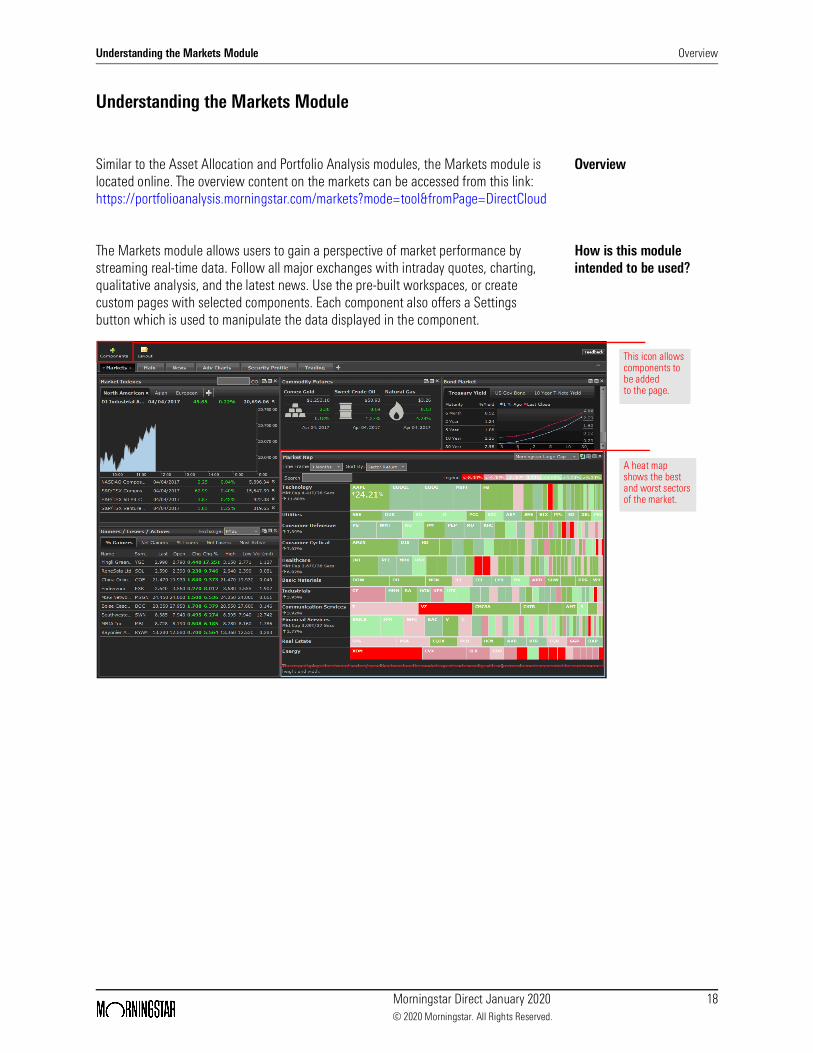
The Markets module allows users to gain a perspective of market performance by streaming real-time data. Follow all major exchanges with intraday quotes, charting, qualitative analysis, and the latest news. Use the pre-built workspaces, or create custom pages with selected components. Each component also offers a Settings button which is used to manipulate the data displayed in the component.
This icon allows components to be added to the page.
A heat map shows the best and worst sectors of the market.
Understanding the Asset Flows Module Overview
Morningstar Direct January 2020 19© 2020 Morningstar. All Rights Reserved.
Understanding the Asset Flows Module
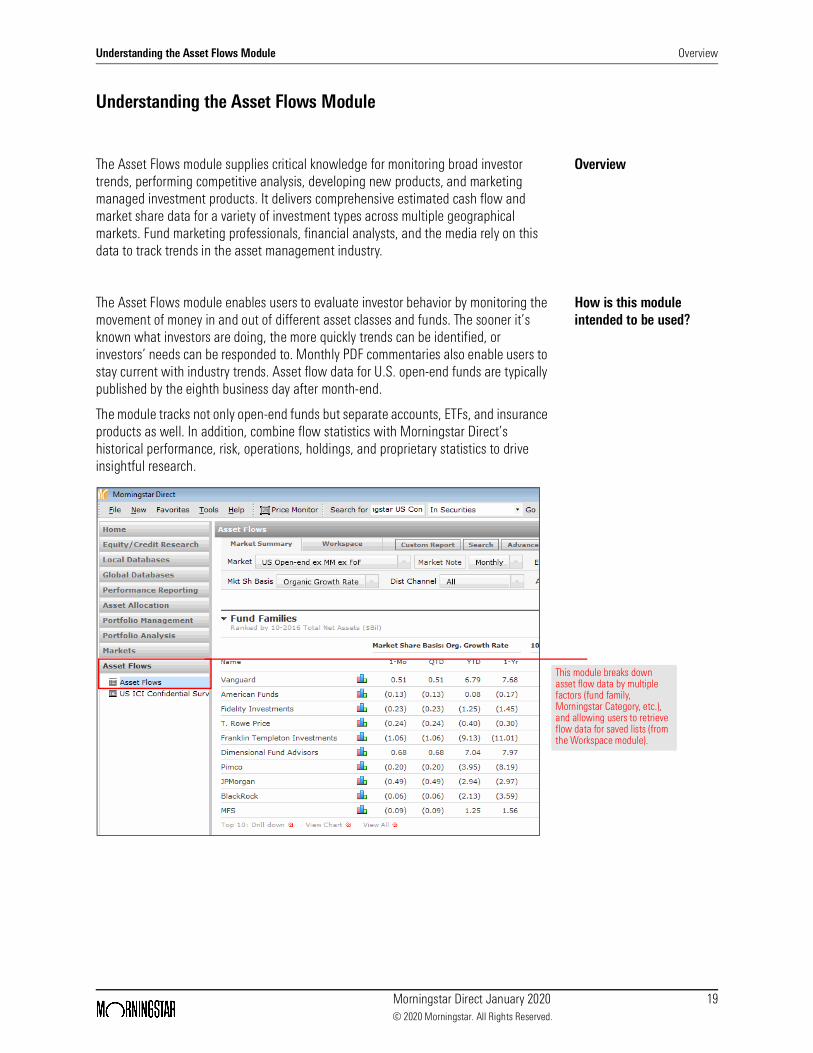
OverviewThe Asset Flows module supplies critical knowledge for monitoring broad investor trends, performing competitive analysis, developing new products, and marketing managed investment products. It delivers comprehensive estimated cash flow and market share data for a variety of investment types across multiple geographical markets. Fund marketing professionals, financial analysts, and the media rely on this data to track trends in the asset management industry.
How is this module intended to be used?
The Asset Flows module enables users to evaluate investor behavior by monitoring the movement of money in and out of different asset classes and funds. The sooner it’s known what investors are doing, the more quickly trends can be identified, or investors’ needs can be responded to. Monthly PDF commentaries also enable users to stay current with industry trends. Asset flow data for U.S. open-end funds are typically published by the eighth business day after month-end.
The module tracks not only open-end funds but separate accounts, ETFs, and insurance products as well. In addition, combine flow statistics with Morningstar Direct’s historical performance, risk, operations, holdings, and proprietary statistics to drive insightful research.
This module breaks down asset flow data by multiple factors (fund family, Morningstar Category, etc.), and allowing users to retrieve flow data for saved lists (from the Workspace module).
Understanding the Presentation Studio Module Overview
Morningstar Direct January 2020 20© 2020 Morningstar. All Rights Reserved.
Understanding the Presentation Studio Module
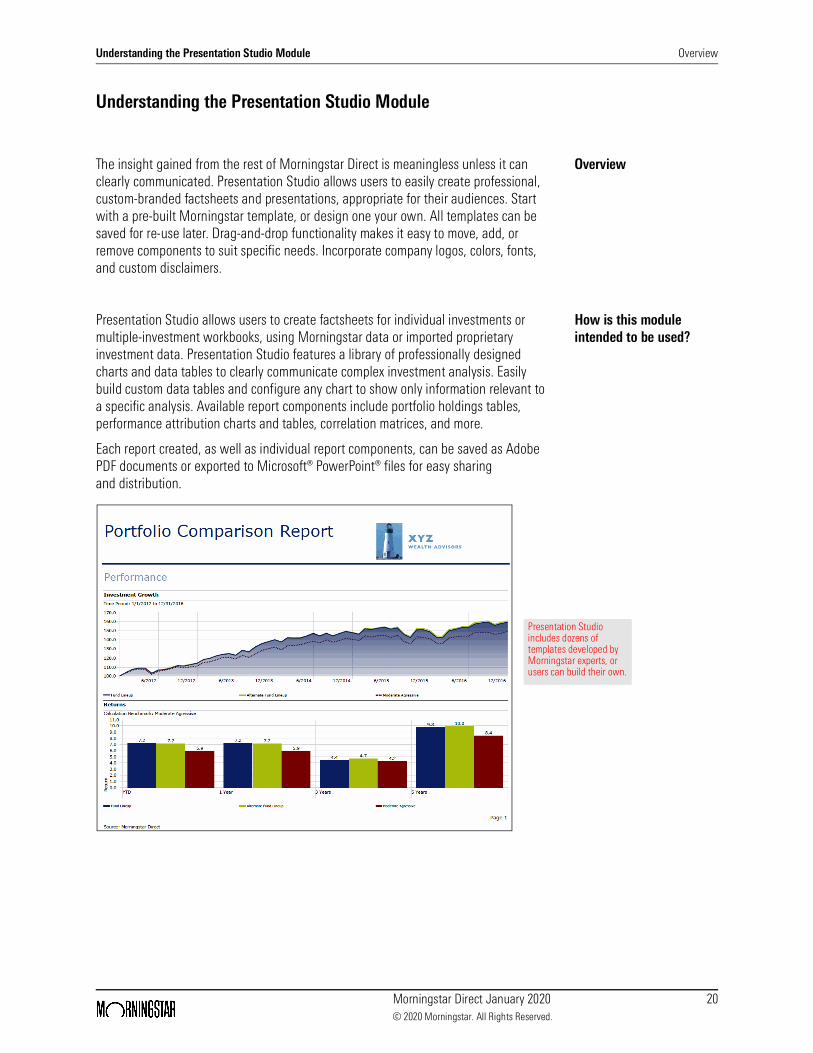
OverviewThe insight gained from the rest of Morningstar Direct is meaningless unless it can clearly communicated. Presentation Studio allows users to easily create professional, custom-branded factsheets and presentations, appropriate for their audiences. Start with a pre-built Morningstar template, or design one your own. All templates can be saved for re-use later. Drag-and-drop functionality makes it easy to move, add, or remove components to suit specific needs. Incorporate company logos, colors, fonts, and custom disclaimers.
How is this module intended to be used?
Presentation Studio allows users to create factsheets for individual investments or multiple-investment workbooks, using Morningstar data or imported proprietary investment data. Presentation Studio features a library of professionally designed charts and data tables to clearly communicate complex investment analysis. Easily build custom data tables and configure any chart to show only information relevant to a specific analysis. Available report components include portfolio holdings tables, performance attribution charts and tables, correlation matrices, and more.
Each report created, as well as individual report components, can be saved as Adobe PDF documents or exported to Microsoft® PowerPoint® files for easy sharing and distribution.
Presentation Studio includes dozens of templates developed by Morningstar experts, or users can build their own.
Understanding the Risk Model Analysis Module Overview
Morningstar Direct January 2020 21© 2020 Morningstar. All Rights Reserved.
Understanding the Risk Model Analysis Module
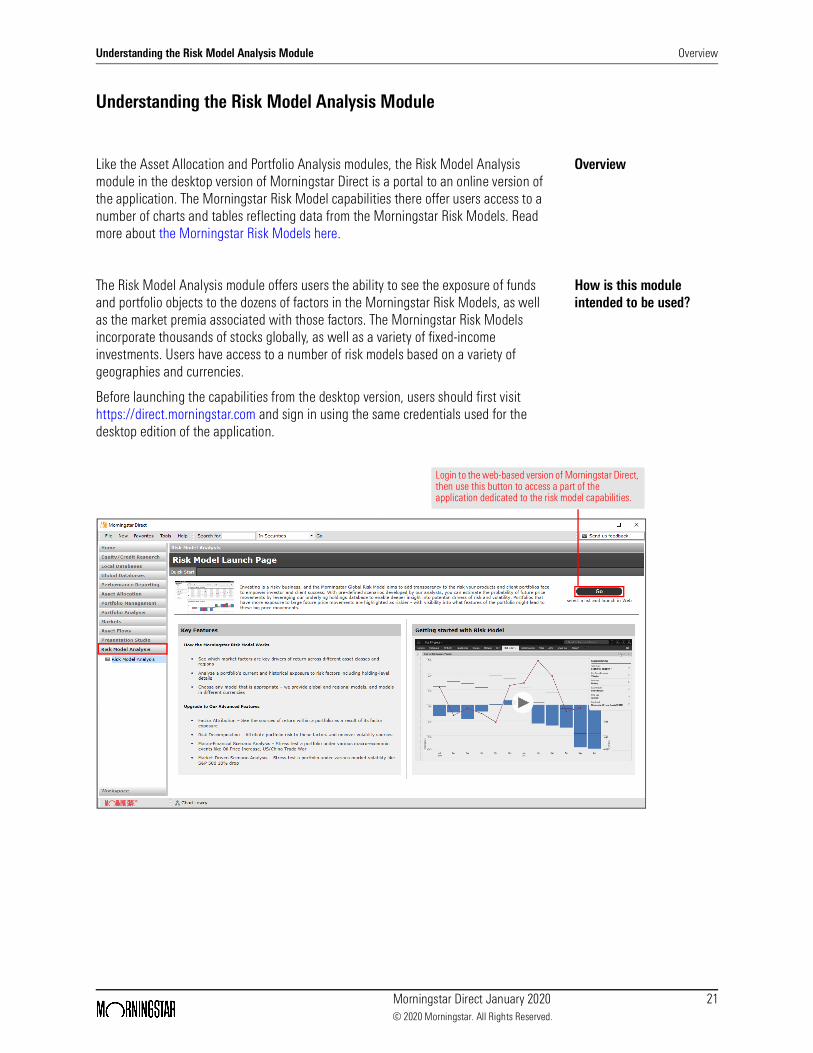
OverviewLike the Asset Allocation and Portfolio Analysis modules, the Risk Model Analysis module in the desktop version of Morningstar Direct is a portal to an online version of the application. The Morningstar Risk Model capabilities there offer users access to a number of charts and tables reflecting data from the Morningstar Risk Models. Read more about the Morningstar Risk Models here.
How is this module intended to be used?
The Risk Model Analysis module offers users the ability to see the exposure of funds and portfolio objects to the dozens of factors in the Morningstar Risk Models, as well as the market premia associated with those factors. The Morningstar Risk Models incorporate thousands of stocks globally, as well as a variety of fixed-income investments. Users have access to a number of risk models based on a variety of geographies and currencies.
Before launching the capabilities from the desktop version, users should first visit https://direct.morningstar.com and sign in using the same credentials used for the desktop edition of the application.
Login to the web-based version of Morningstar Direct, then use this button to access a part of the application dedicated to the risk model capabilities.

Understanding the Workspace Module Overview
Morningstar Direct January 2020 22© 2020 Morningstar. All Rights Reserved.
Understanding the Workspace Module
OverviewThe Workspace module contains the saved searches, lists, custom data sets, and notes users create in Morningstar Direct. This module is also used to create custom data points with values users define.
How is this module intended to be used?
When conducting investment research and creating lists, searches, and custom data sets in the Workspace module more than any other module. This is due, in part, to the convenience of saving all these files in the Workspace module. Additionally, the Workspace module offers a familiar grid view similar to those found in the Local Databases and Global Databases modules; in the Workspace module, however, users can search for investments across multiple data universes (open-end funds, ETFs, and so on) rather than in just one universe as is the case with the Local Databases and Global Databases modules.
The Workspace module allows users to see a variety of saved content.

Understanding the Workspace Module How is this module intended to be used?
Morningstar Direct January 2020 23© 2020 Morningstar. All Rights Reserved.
Be careful, however, not to use the Workspace module to the exclusion of other modules in Morningstar Direct. Avoiding the other modules, could result in creating more work for yourself and failing to take advantage of important features in those modules. For example, a list of funds is not a substitute for a portfolio of funds created in Portfolio Management. The list of funds cannot be weighted the way a portfolio can, and it cannot be associated with a custom benchmark. Similarly, the work to create a custom data set in Workspace could be exponentially more difficult than doing the same work in the Performance Reporting module. Finally, the Workspace module does not allow you to take advantage of the conditional formatting and Scorecard features found in Performance Reporting.