using the custom database in morningstar direct
TRANSCRIPT
Direct
Using the Custom Databasein Morningstar Direct
Onboarding Guide

Morningstar Direct January 2020© 2020 Morningstar. All Rights Reserved.
Copyright © 2020 Morningstar, Inc. All rights reserved.
The information contained herein: (1) is proprietary to Morningstar and/or its content providers; (2) may not be copied or distributed; (3) is not warranted to be accurate, complete or timely; and (4) does not constitute advice of any kind. Neither Morningstar nor its content providers are responsible for any damages or losses arising from any use of this information. Any statements that are nonfactual in nature constitute opinions only, are subject to change without notice, and may not be consistent across Morningstar. Past performance is no guarantee of future results.
Morningstar Direct January 2020 3© 2020 Morningstar. All Rights Reserved.
Contents
Overview . . . . . . . . . . . . . . . . . . . . . . . . . . . . . . . . . . . . . . . . . . . . . . . . . . . . . . . . . . . . . . . . 4
Understanding Basic Information about the Custom Database . . . . . . . . . . . . . . . . . . . . . . . . . 5
Overview . . . . . . . . . . . . . . . . . . . . . . . . . . . . . . . . . . . . . . . . . . . . . . . . . . . . . . . . . . . . . . . . 5Where is the Custom Database found? . . . . . . . . . . . . . . . . . . . . . . . . . . . . . . . . . . . . . . . . 5Where can custom data points be used in Morningstar Direct?. . . . . . . . . . . . . . . . . . . . . 5What types of custom data points can be created? . . . . . . . . . . . . . . . . . . . . . . . . . . . . . . 6
Creating and Assigning Values to Custom Data Points. . . . . . . . . . . . . . . . . . . . . . . . . . . . . . . . 7
Overview . . . . . . . . . . . . . . . . . . . . . . . . . . . . . . . . . . . . . . . . . . . . . . . . . . . . . . . . . . . . . . . . 7Exercise 1: Create discrete custom data. . . . . . . . . . . . . . . . . . . . . . . . . . . . . . . . . . . . . . . 8Exercise 2: Manually input values for custom data points . . . . . . . . . . . . . . . . . . . . . . . 10Exercise 3: Import data for discrete data points. . . . . . . . . . . . . . . . . . . . . . . . . . . . . . . . 12Exercise 4: Create custom time series data points. . . . . . . . . . . . . . . . . . . . . . . . . . . . . . 17Exercise 5: Input data for time series custom data points . . . . . . . . . . . . . . . . . . . . . . . . 19Exercise 6: Import data for custom time series data points. . . . . . . . . . . . . . . . . . . . . . . 21Exercise 7: Add a custom Composition data point . . . . . . . . . . . . . . . . . . . . . . . . . . . . . . 24Exercise 8: Enter data for a Composition custom data point . . . . . . . . . . . . . . . . . . . . . . 26
Leveraging Custom Data in Other Modules . . . . . . . . . . . . . . . . . . . . . . . . . . . . . . . . . . . . . . . 30
Overview . . . . . . . . . . . . . . . . . . . . . . . . . . . . . . . . . . . . . . . . . . . . . . . . . . . . . . . . . . . . . . . 30Exercise 9: View custom data in the Workspace module. . . . . . . . . . . . . . . . . . . . . . . . . 30Exercise 10: Adjust the general settings for
performance reporting to use custom data points . . . . . . . . . . . . . . . . . . . . 32Exercise 11: Use a custom data point as a benchmark . . . . . . . . . . . . . . . . . . . . . . . . . . . 34Exercise 12: Use a custom date data point in a performance report. . . . . . . . . . . . . . . . . 36Exercise 13: Add the discrete and historical
custom data points to the performance report . . . . . . . . . . . . . . . . . . . . . . . 38Exercise 14: Retrieve custom data using the Morningstar Excel Add-In. . . . . . . . . . . . . . 42Exercise 15: Use custom data in Presentation Studio . . . . . . . . . . . . . . . . . . . . . . . . . . . . 43Exercise 16: Include discrete custom data points on a template . . . . . . . . . . . . . . . . . . . 47Exercise 17: Use a composition custom data point in a template . . . . . . . . . . . . . . . . . . . 50Exercise 18: Use custom historical time series data points . . . . . . . . . . . . . . . . . . . . . . . . 52
Morningstar Direct January 2020 4© 2020 Morningstar. All Rights Reserved.
Using the Custom Database in Morningstar DirectSM
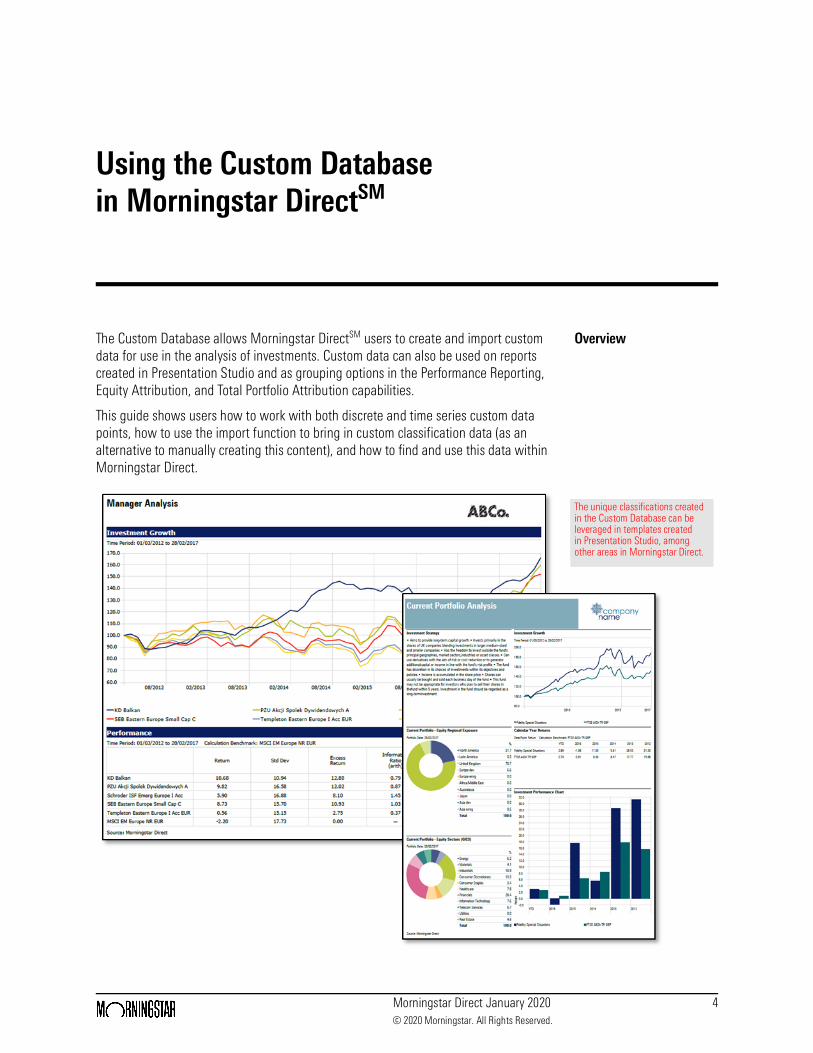
OverviewThe Custom Database allows Morningstar DirectSM users to create and import custom data for use in the analysis of investments. Custom data can also be used on reports created in Presentation Studio and as grouping options in the Performance Reporting, Equity Attribution, and Total Portfolio Attribution capabilities.
This guide shows users how to work with both discrete and time series custom data points, how to use the import function to bring in custom classification data (as an alternative to manually creating this content), and how to find and use this data within Morningstar Direct.
The unique classifications created in the Custom Database can be leveraged in templates created in Presentation Studio, among other areas in Morningstar Direct.
Understanding Basic Information about the Custom Database Overview
Morningstar Direct January 2020 5© 2020 Morningstar. All Rights Reserved.
Understanding Basic Information about the Custom Database
OverviewBefore beginning exercises where custom data will be created, it will help to cover some basic knowledge about this capability. This section covers the following topics to orient new users to this part of the application:
gwhere to find the Custom Database in Morningstar Direct (page 5)gwhere else in the application users can leverage the custom data points they
create (page 5), andg the types of data points users can create in the Custom Database (page 6).
Where is the Custom Database found?
The Custom Database is located in the Workspace module. It allows Morningstar Direct users to create custom data points and classifications for those data points to incorporate in their data sets, performance reports and Presentation Studio templates, amongst other areas. Data points can be created and then updated manually, or via an import function (for most data points).
The following levels are available for the Custom Database:
g Firm-Level database: a Morningstar Direct user can be granted read-write access to create and maintain custom data points which are available as read-only access to all other Morningstar Direct users within their company.gMy Database: a personal custom database only for the Morningstar user.
Where can custom data points be used in Morningstar Direct?
Custom data can be used in the following modules:
gWorkspacegPerformance ReportinggPresentation StudiogMorningstar Excel Add-In, and g Total Portfolio Attribution (for grouping options).
Understanding Basic Information about the Custom Database What types of custom data points can be created?
Morningstar Direct January 2020 6© 2020 Morningstar. All Rights Reserved.
What types of custom data points can be created?
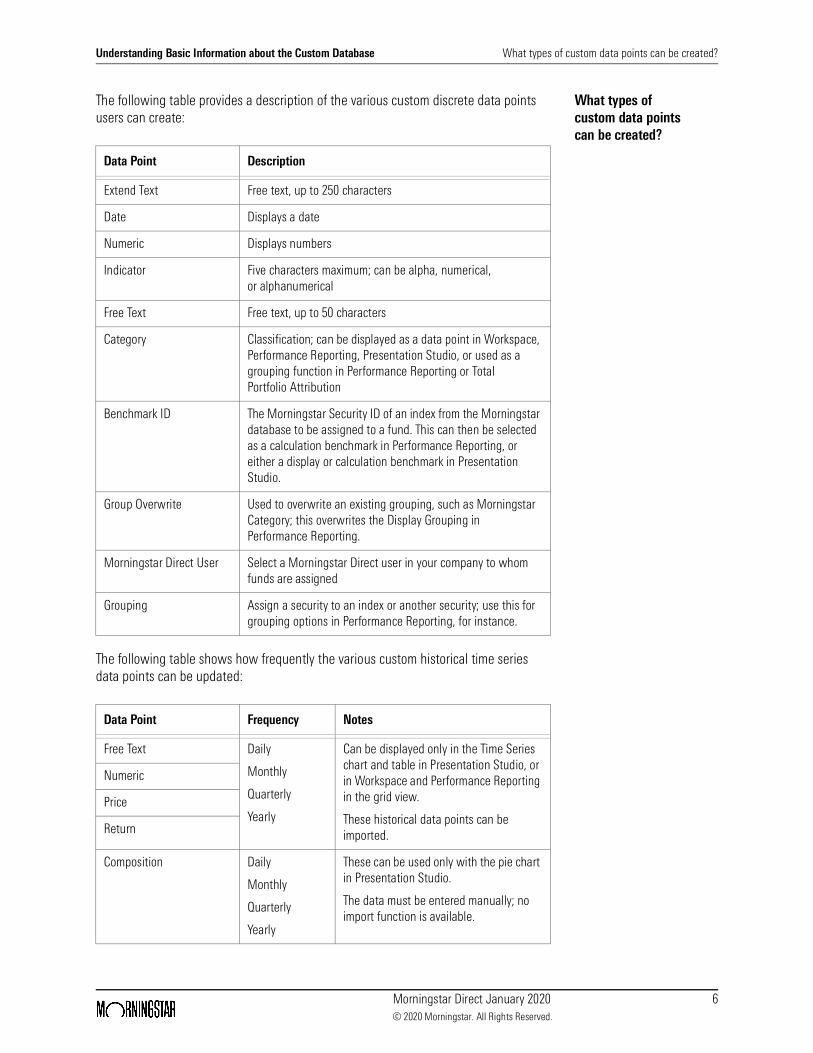
The following table provides a description of the various custom discrete data points users can create:
The following table shows how frequently the various custom historical time series data points can be updated:
Data Point Description
Extend Text Free text, up to 250 characters
Date Displays a date
Numeric Displays numbers
Indicator Five characters maximum; can be alpha, numerical, or alphanumerical
Free Text Free text, up to 50 characters
Category Classification; can be displayed as a data point in Workspace, Performance Reporting, Presentation Studio, or used as a grouping function in Performance Reporting or Total Portfolio Attribution
Benchmark ID The Morningstar Security ID of an index from the Morningstar database to be assigned to a fund. This can then be selected as a calculation benchmark in Performance Reporting, or either a display or calculation benchmark in Presentation Studio.
Group Overwrite Used to overwrite an existing grouping, such as Morningstar Category; this overwrites the Display Grouping in Performance Reporting.
Morningstar Direct User Select a Morningstar Direct user in your company to whom funds are assigned
Grouping Assign a security to an index or another security; use this for grouping options in Performance Reporting, for instance.
Data Point Frequency Notes
Free Text Daily
Monthly
Quarterly
Yearly
Can be displayed only in the Time Series chart and table in Presentation Studio, or in Workspace and Performance Reporting in the grid view.
These historical data points can be imported.
Numeric
Price
Return
Composition Daily
Monthly
Quarterly
Yearly
These can be used only with the pie chart in Presentation Studio.
The data must be entered manually; no import function is available.
Creating and Assigning Values to Custom Data Points Overview
Morningstar Direct January 2020 7© 2020 Morningstar. All Rights Reserved.
Creating and Assigning Values to Custom Data Points
OverviewWhen beginning to work with custom data in Morningstar Direct, users need to take the following steps:
1. Create the data points to be used within Morningstar Direct, and
2. Assign values to those custom data points for specific investments. Values can be manually assigned or via import (for most data points).
This section covers the following exercises:
gManually creating discrete custom data points (Exercise 1 on page 8)gManually assigning values for discrete custom data points (Exercise 2 on page 10)g Importing values for discrete custom data points (Exercise 3 on page 12)gManually creating time series custom data points (Exercise 4 on page 17)gManually assigning values for time series custom data points (Exercise 5 on
page 19)g Importing values for discrete custom data points (Exercise 6 on page 21), andgWorking with the Composition custom data point (Exercise 7 on page 24 and
Exercise 8 on page 26).
Creating and Assigning Values to Custom Data Points Exercise 1: Create discrete custom data
Morningstar Direct January 2020 8© 2020 Morningstar. All Rights Reserved.
Exercise 1: Create discrete custom data
This exercise demonstrates how to create a few custom discrete data points. A discrete data point displays only the most recent value for an investment, such as the latest rating, date, or classification a user assigns to a fund. In contrast, a time series data point can show multiple past values for an investment.
To create these custom data points, do the following:
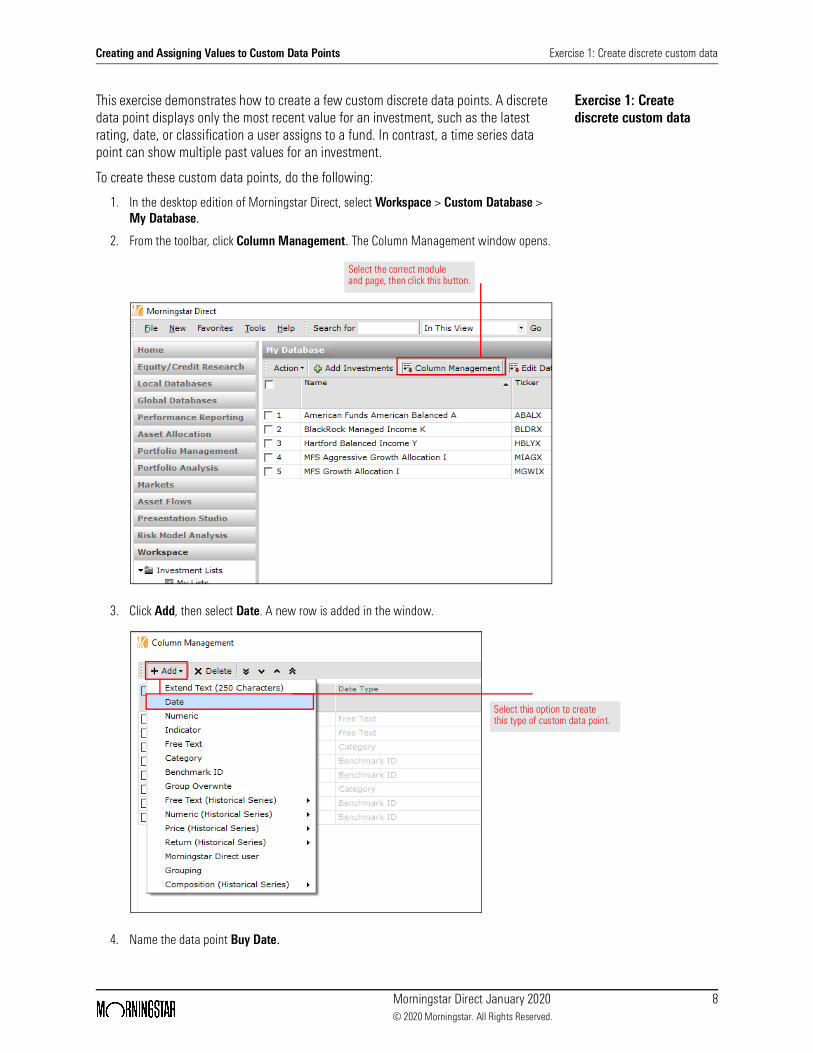
1. In the desktop edition of Morningstar Direct, select Workspace > Custom Database > My Database.
2. From the toolbar, click Column Management. The Column Management window opens.
3. Click Add, then select Date. A new row is added in the window.
4. Name the data point Buy Date.
Select the correct module and page, then click this button.
Select this option to create this type of custom data point.
Creating and Assigning Values to Custom Data Points Exercise 1: Create discrete custom data
Morningstar Direct January 2020 9© 2020 Morningstar. All Rights Reserved.
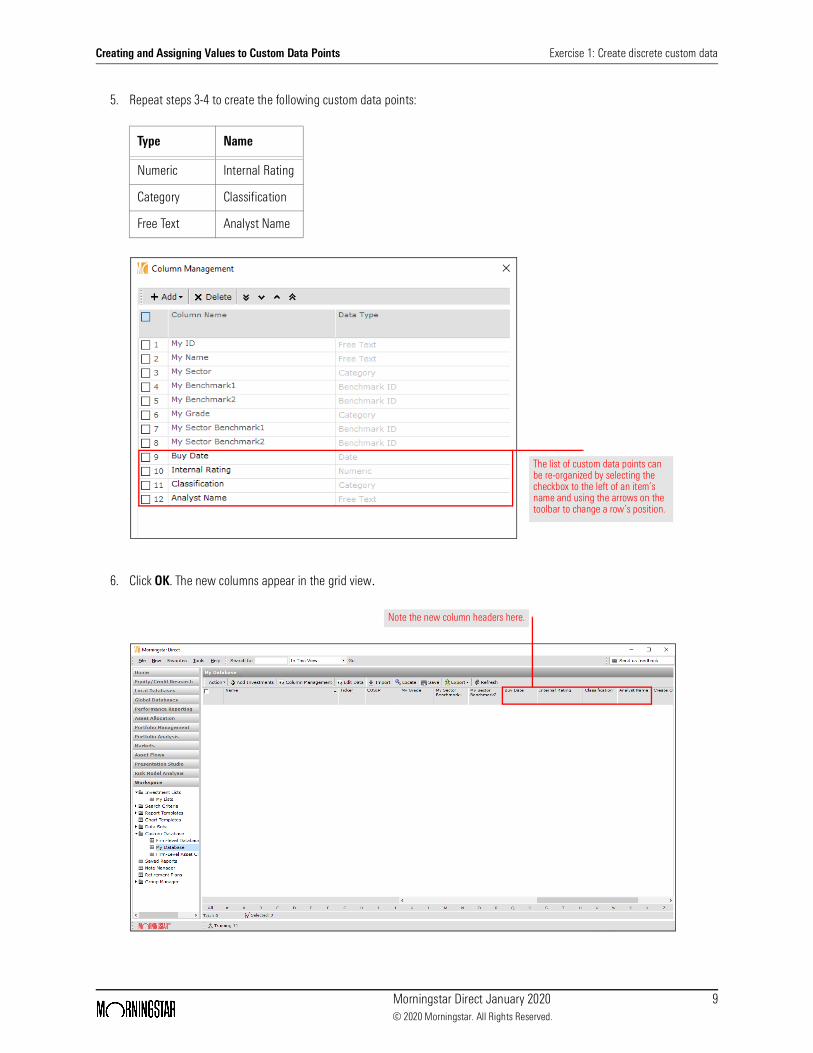
5. Repeat steps 3-4 to create the following custom data points:
6. Click OK. The new columns appear in the grid view.
Type Name
Numeric Internal Rating
Category Classification
Free Text Analyst Name
The list of custom data points can be re-organized by selecting the checkbox to the left of an item’s name and using the arrows on the toolbar to change a row’s position.
Note the new column headers here.
Creating and Assigning Values to Custom Data Points Exercise 2: Manually input values for custom data points
Morningstar Direct January 2020 10© 2020 Morningstar. All Rights Reserved.
Exercise 2: Manually input values for custom data points
Data can now be added to the newly created custom data points. The first step is to select the investments for which data should be entered. To add investments to the grid, do the following:
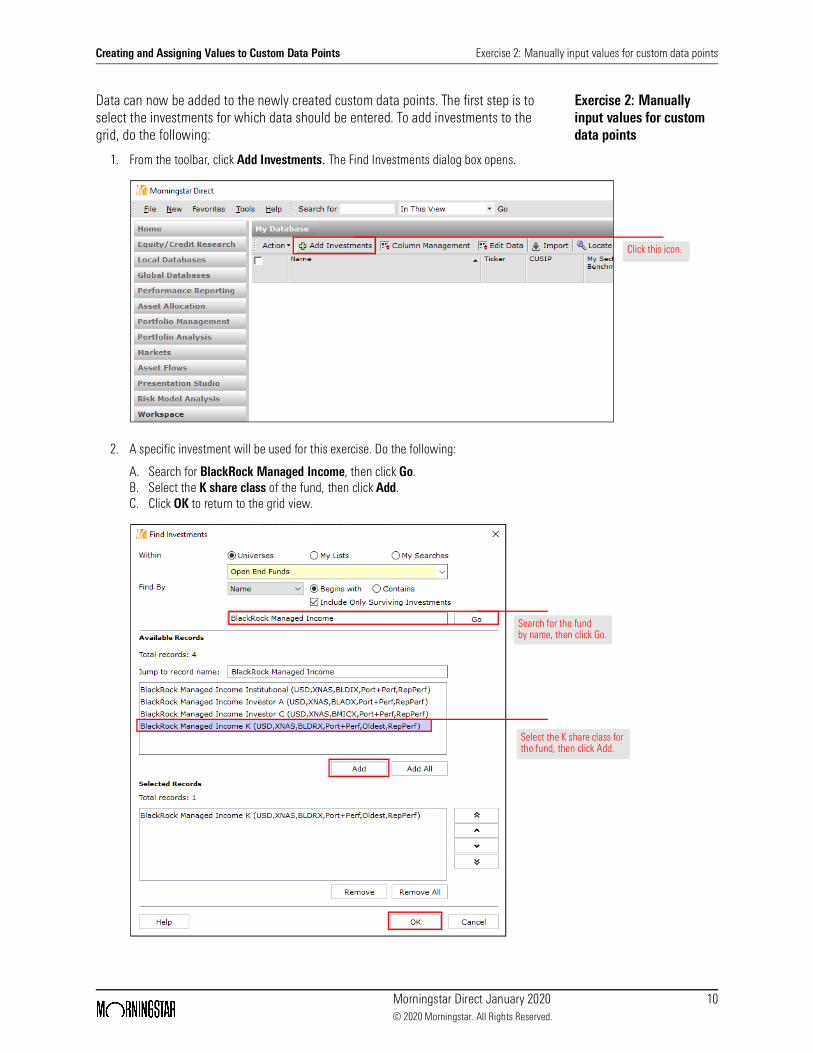
1. From the toolbar, click Add Investments. The Find Investments dialog box opens.
2. A specific investment will be used for this exercise. Do the following:
A. Search for BlackRock Managed Income, then click Go. B. Select the K share class of the fund, then click Add.C. Click OK to return to the grid view.
Click this icon.
Search for the fund by name, then click Go.
Select the K share class for the fund, then click Add.
Creating and Assigning Values to Custom Data Points Exercise 2: Manually input values for custom data points
Morningstar Direct January 2020 11© 2020 Morningstar. All Rights Reserved.
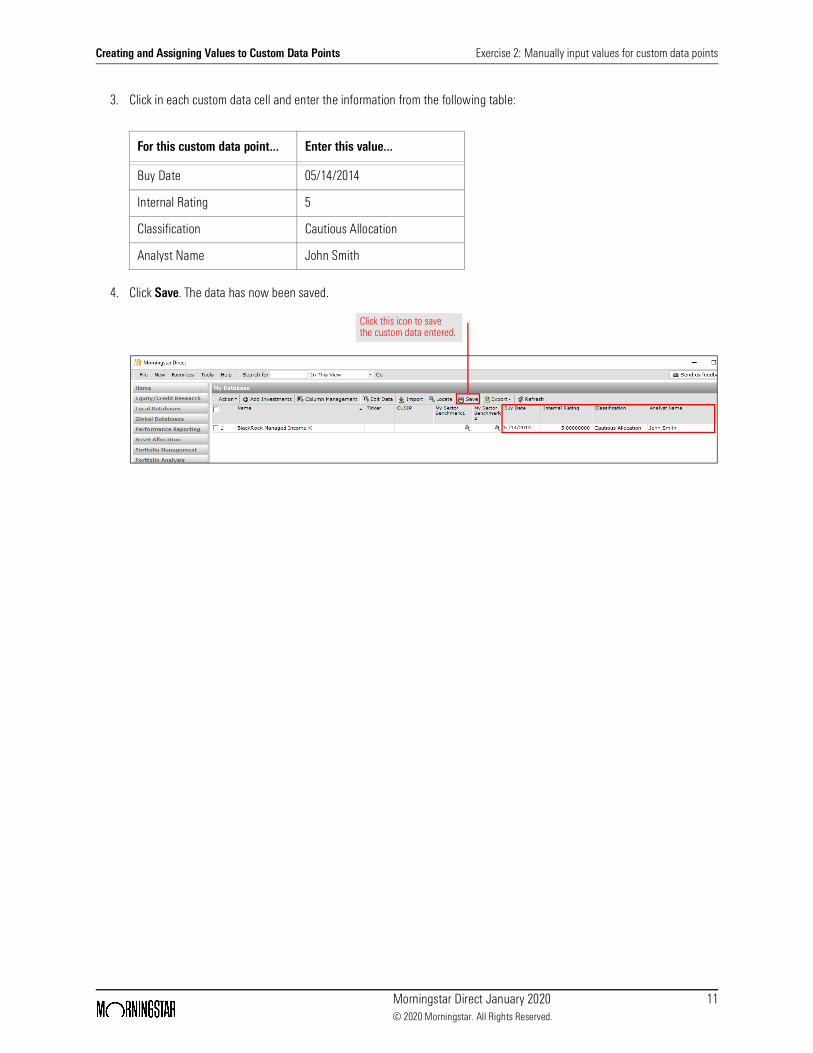
3. Click in each custom data cell and enter the information from the following table:
4. Click Save. The data has now been saved.
For this custom data point... Enter this value...
Buy Date 05/14/2014
Internal Rating 5
Classification Cautious Allocation
Analyst Name John Smith
Click this icon to save the custom data entered.
Creating and Assigning Values to Custom Data Points Exercise 3: Import data for discrete data points
Morningstar Direct January 2020 12© 2020 Morningstar. All Rights Reserved.
Exercise 3: Import data for discrete data points
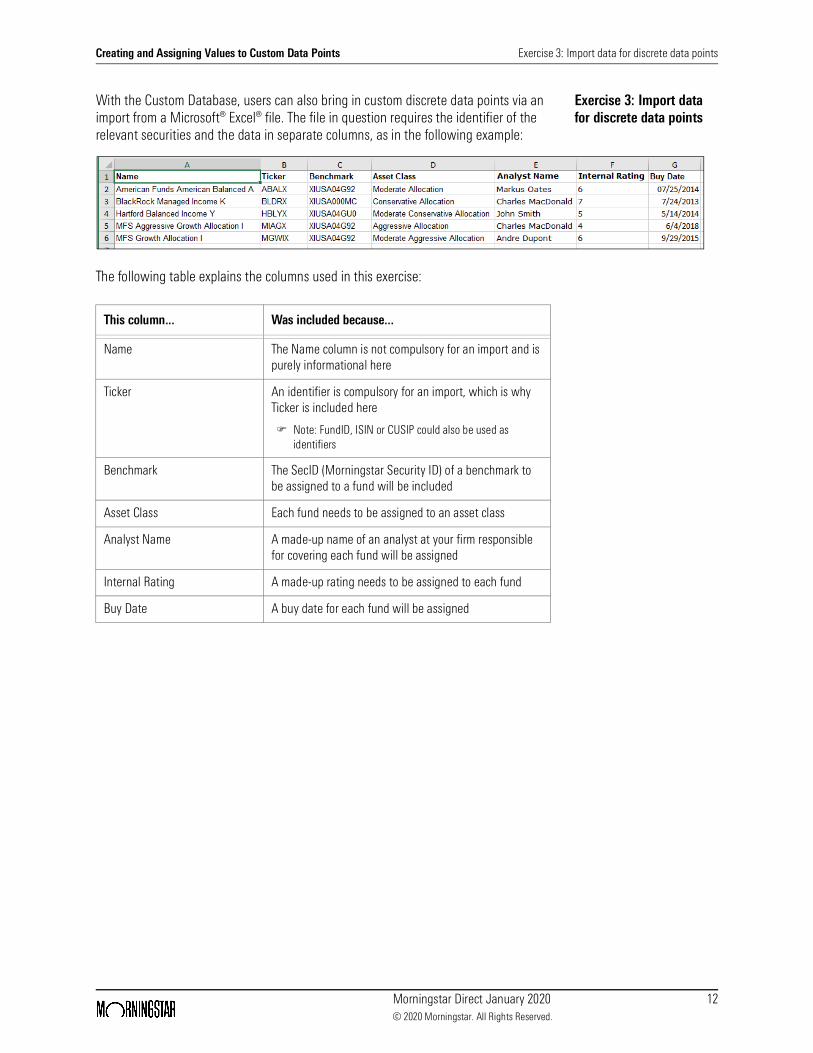
With the Custom Database, users can also bring in custom discrete data points via an import from a Microsoft® Excel® file. The file in question requires the identifier of the relevant securities and the data in separate columns, as in the following example:
The following table explains the columns used in this exercise:
This column... Was included because...
Name The Name column is not compulsory for an import and is purely informational here
Ticker An identifier is compulsory for an import, which is why Ticker is included here
Note: FundID, ISIN or CUSIP could also be used as identifiers
Benchmark The SecID (Morningstar Security ID) of a benchmark to be assigned to a fund will be included
Asset Class Each fund needs to be assigned to an asset class
Analyst Name A made-up name of an analyst at your firm responsible for covering each fund will be assigned
Internal Rating A made-up rating needs to be assigned to each fund
Buy Date A buy date for each fund will be assigned
Creating and Assigning Values to Custom Data Points Exercise 3: Import data for discrete data points
Morningstar Direct January 2020 13© 2020 Morningstar. All Rights Reserved.
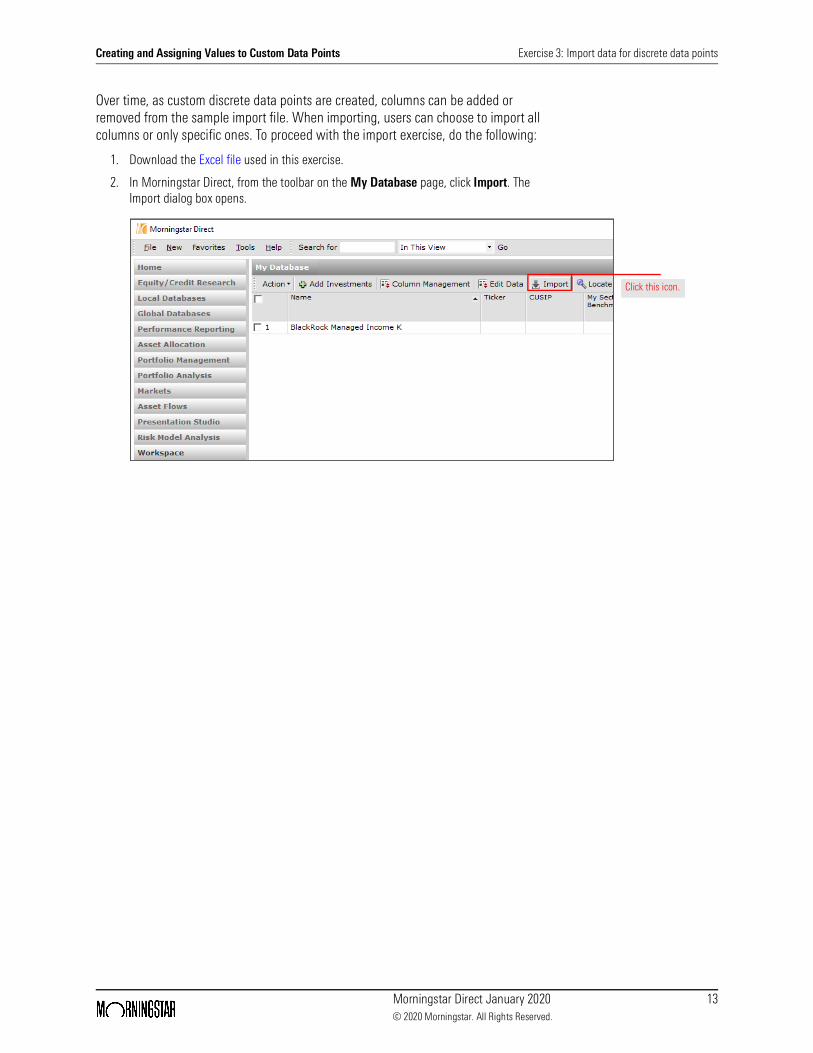
Over time, as custom discrete data points are created, columns can be added or removed from the sample import file. When importing, users can choose to import all columns or only specific ones. To proceed with the import exercise, do the following:
1. Download the Excel file used in this exercise.
2. In Morningstar Direct, from the toolbar on the My Database page, click Import. The Import dialog box opens.
Click this icon.
Creating and Assigning Values to Custom Data Points Exercise 3: Import data for discrete data points
Morningstar Direct January 2020 14© 2020 Morningstar. All Rights Reserved.
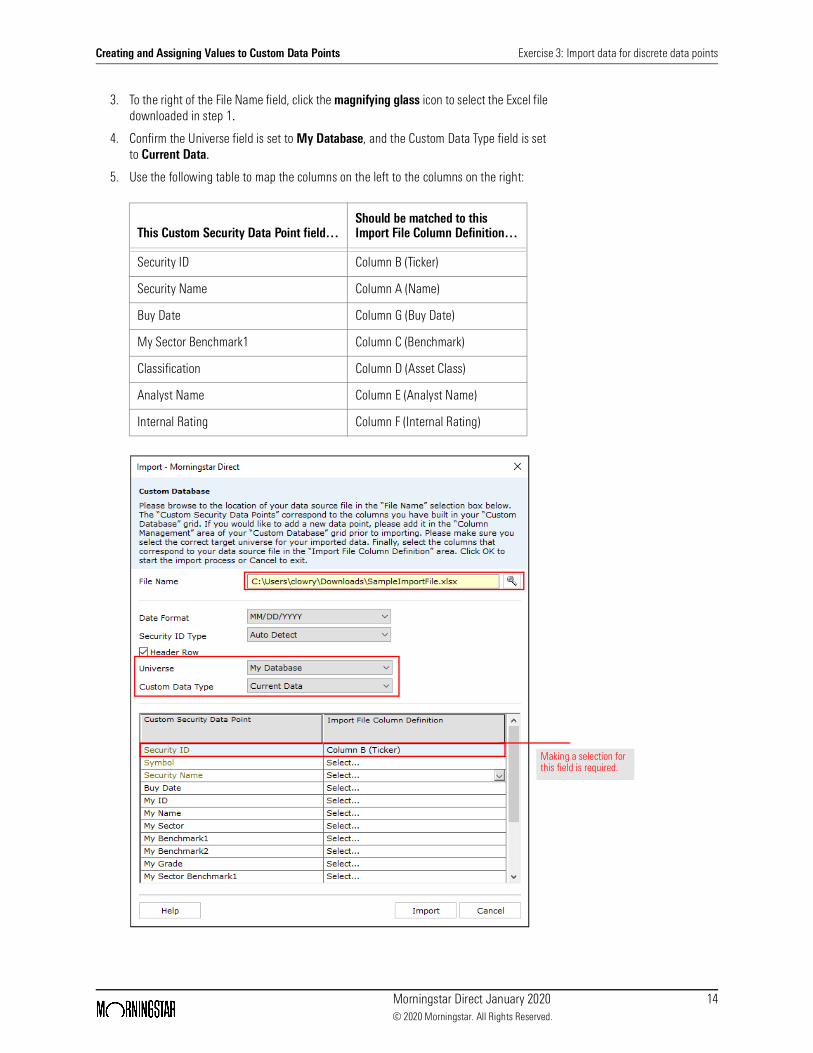
3. To the right of the File Name field, click the magnifying glass icon to select the Excel file downloaded in step 1.
4. Confirm the Universe field is set to My Database, and the Custom Data Type field is set to Current Data.
5. Use the following table to map the columns on the left to the columns on the right:
This Custom Security Data Point field…Should be matched to this Import File Column Definition…
Security ID Column B (Ticker)
Security Name Column A (Name)
Buy Date Column G (Buy Date)
My Sector Benchmark1 Column C (Benchmark)
Classification Column D (Asset Class)
Analyst Name Column E (Analyst Name)
Internal Rating Column F (Internal Rating)
Making a selection for this field is required.
Creating and Assigning Values to Custom Data Points Exercise 3: Import data for discrete data points
Morningstar Direct January 2020 15© 2020 Morningstar. All Rights Reserved.
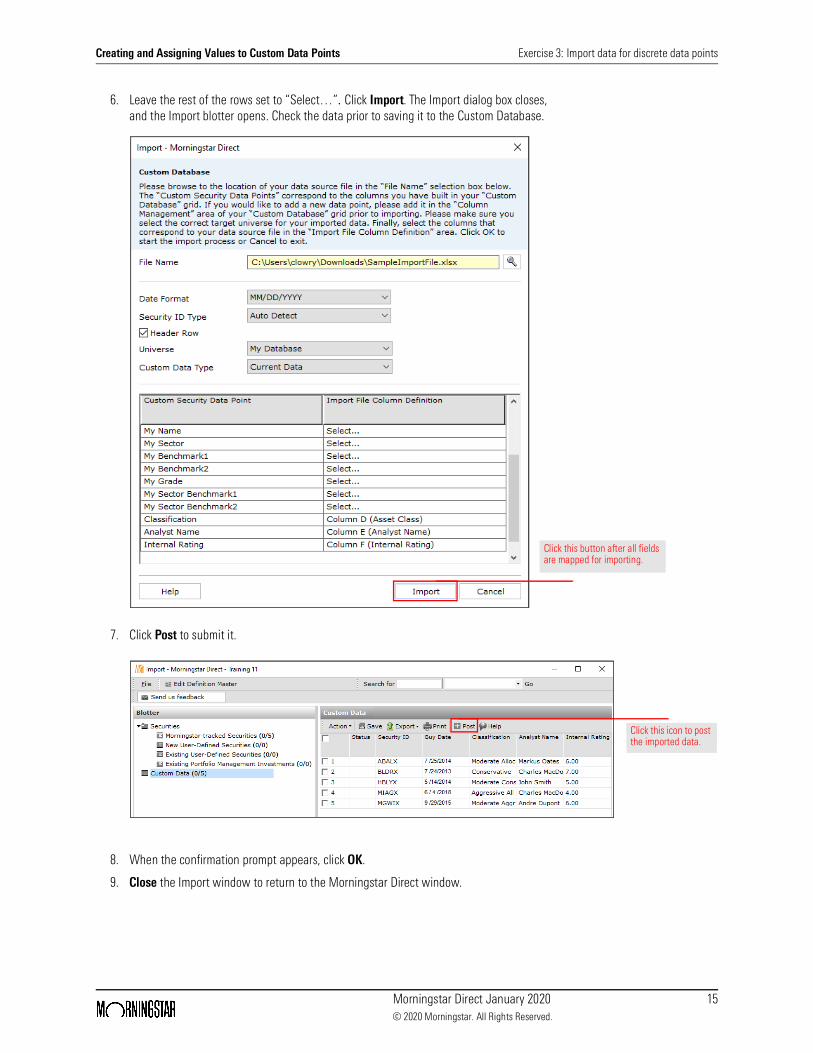
6. Leave the rest of the rows set to “Select…”. Click Import. The Import dialog box closes, and the Import blotter opens. Check the data prior to saving it to the Custom Database.
7. Click Post to submit it.
8. When the confirmation prompt appears, click OK.
9. Close the Import window to return to the Morningstar Direct window.
Click this button after all fields are mapped for importing.
Click this icon to post the imported data.
Creating and Assigning Values to Custom Data Points Exercise 3: Import data for discrete data points
Morningstar Direct January 2020 16© 2020 Morningstar. All Rights Reserved.
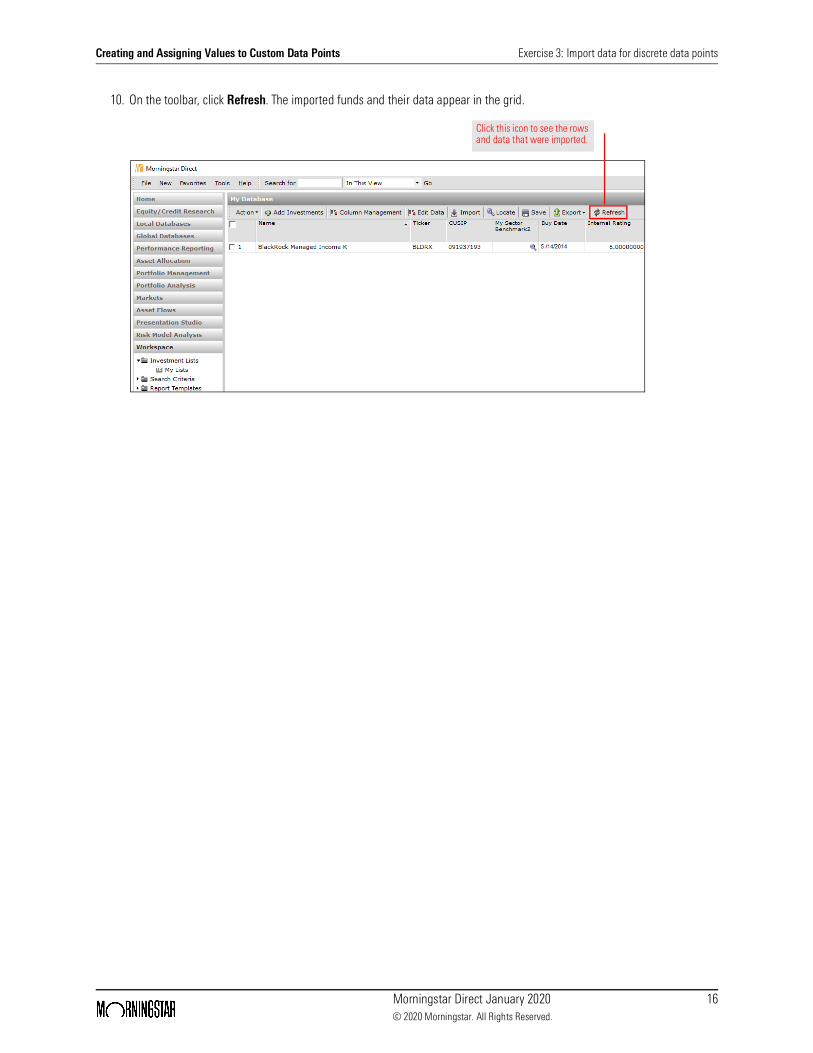
10. On the toolbar, click Refresh. The imported funds and their data appear in the grid.
Click this icon to see the rows and data that were imported.
Creating and Assigning Values to Custom Data Points Exercise 4: Create custom time series data points
Morningstar Direct January 2020 17© 2020 Morningstar. All Rights Reserved.
Exercise 4: Create custom time series data points
The Custom Database enables users to create custom time series data points. These data points can then be used in Presentation Studio with the Time Series charts and tables, and they can also be displayed as data in the Workspace and Performance Reporting grid views.
Note: This exercise is valid only for Free Text, Numeric, Price, and Return Historical Series data points.
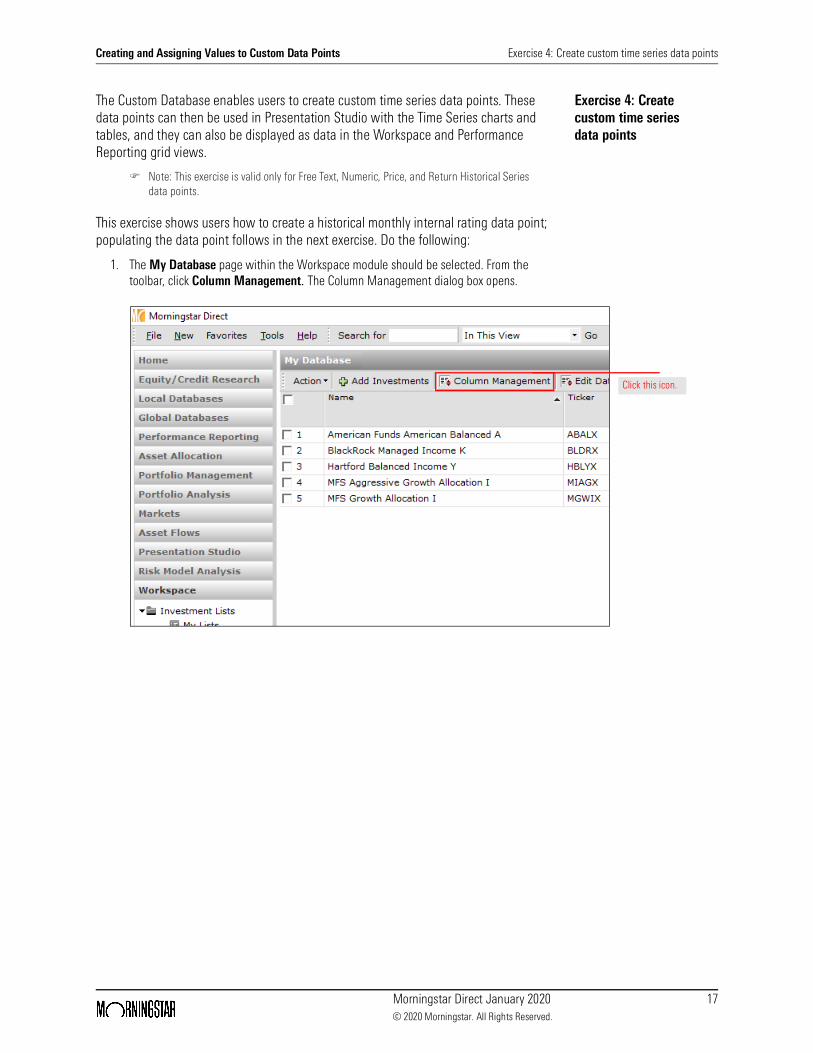
This exercise shows users how to create a historical monthly internal rating data point; populating the data point follows in the next exercise. Do the following:
1. The My Database page within the Workspace module should be selected. From the toolbar, click Column Management. The Column Management dialog box opens.
Click this icon.
Creating and Assigning Values to Custom Data Points Exercise 4: Create custom time series data points
Morningstar Direct January 2020 18© 2020 Morningstar. All Rights Reserved.
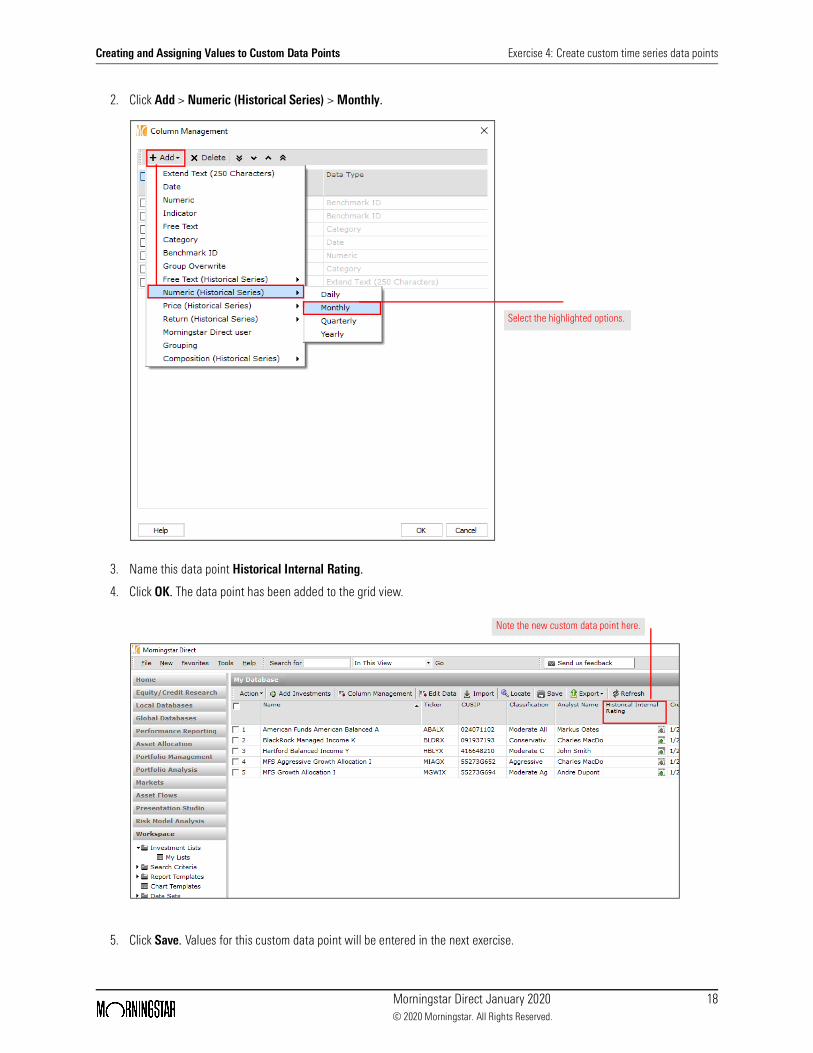
2. Click Add > Numeric (Historical Series) > Monthly.
3. Name this data point Historical Internal Rating.
4. Click OK. The data point has been added to the grid view.
5. Click Save. Values for this custom data point will be entered in the next exercise.
Select the highlighted options.
Note the new custom data point here.
Creating and Assigning Values to Custom Data Points Exercise 5: Input data for time series custom data points
Morningstar Direct January 2020 19© 2020 Morningstar. All Rights Reserved.
Exercise 5: Input data for time series custom data points
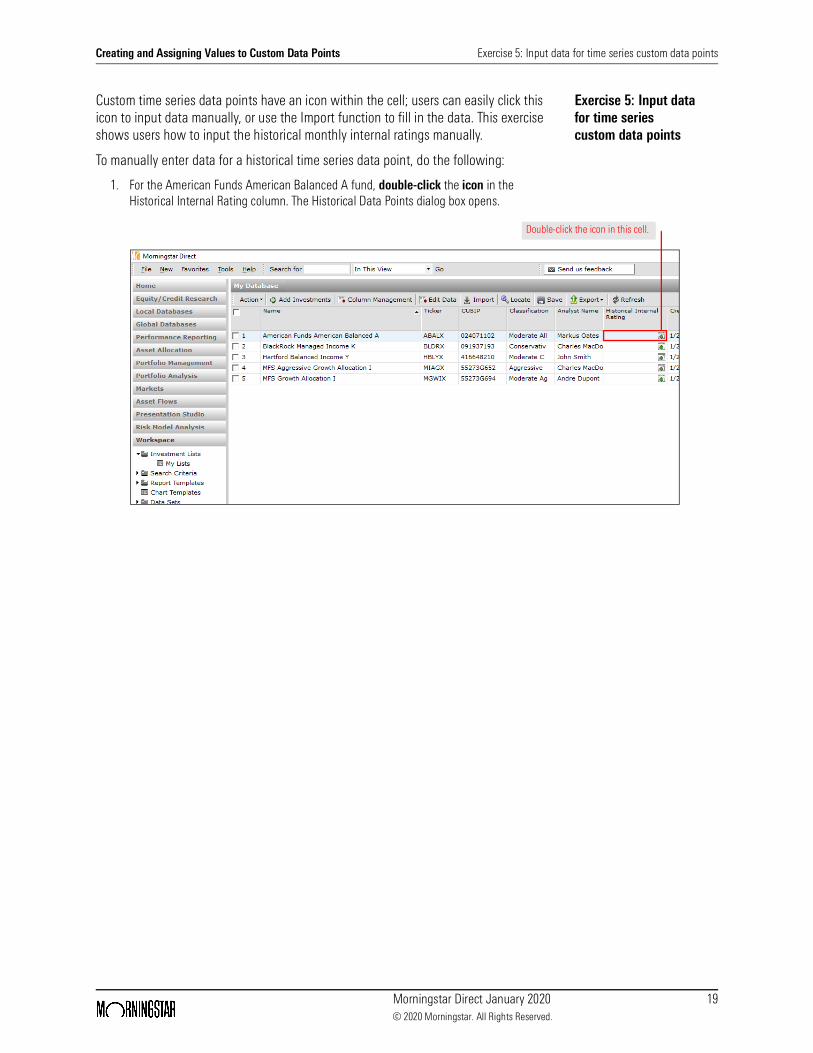
Custom time series data points have an icon within the cell; users can easily click this icon to input data manually, or use the Import function to fill in the data. This exercise shows users how to input the historical monthly internal ratings manually.
To manually enter data for a historical time series data point, do the following:
1. For the American Funds American Balanced A fund, double-click the icon in the Historical Internal Rating column. The Historical Data Points dialog box opens.
Double-click the icon in this cell.
Creating and Assigning Values to Custom Data Points Exercise 5: Input data for time series custom data points
Morningstar Direct January 2020 20© 2020 Morningstar. All Rights Reserved.
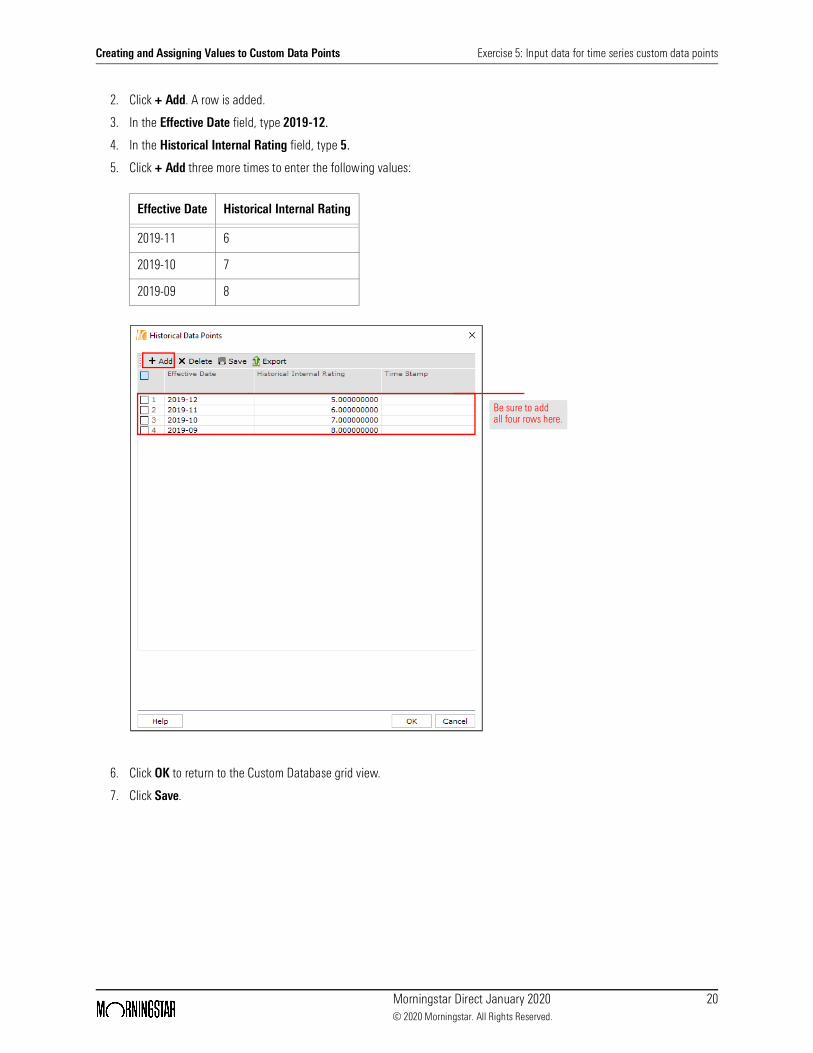
2. Click + Add. A row is added.
3. In the Effective Date field, type 2019-12.
4. In the Historical Internal Rating field, type 5.
5. Click + Add three more times to enter the following values:
6. Click OK to return to the Custom Database grid view.
7. Click Save.
Effective Date Historical Internal Rating
2019-11 6
2019-10 7
2019-09 8
Be sure to add all four rows here.
Creating and Assigning Values to Custom Data Points Exercise 6: Import data for custom time series data points
Morningstar Direct January 2020 21© 2020 Morningstar. All Rights Reserved.
Exercise 6: Import data for custom time series data points
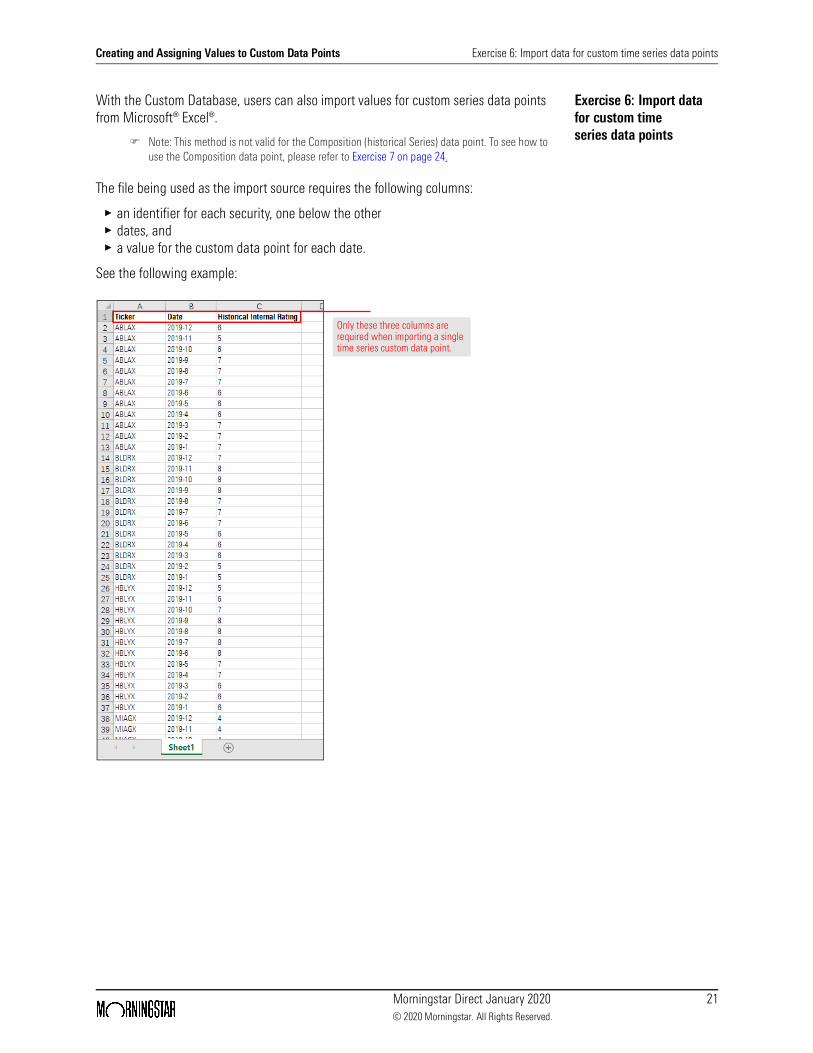
With the Custom Database, users can also import values for custom series data points from Microsoft® Excel®.
Note: This method is not valid for the Composition (historical Series) data point. To see how to use the Composition data point, please refer to Exercise 7 on page 24.
The file being used as the import source requires the following columns:
g an identifier for each security, one below the othergdates, andg a value for the custom data point for each date.
See the following example:
Only these three columns are required when importing a single time series custom data point.
Creating and Assigning Values to Custom Data Points Exercise 6: Import data for custom time series data points
Morningstar Direct January 2020 22© 2020 Morningstar. All Rights Reserved.
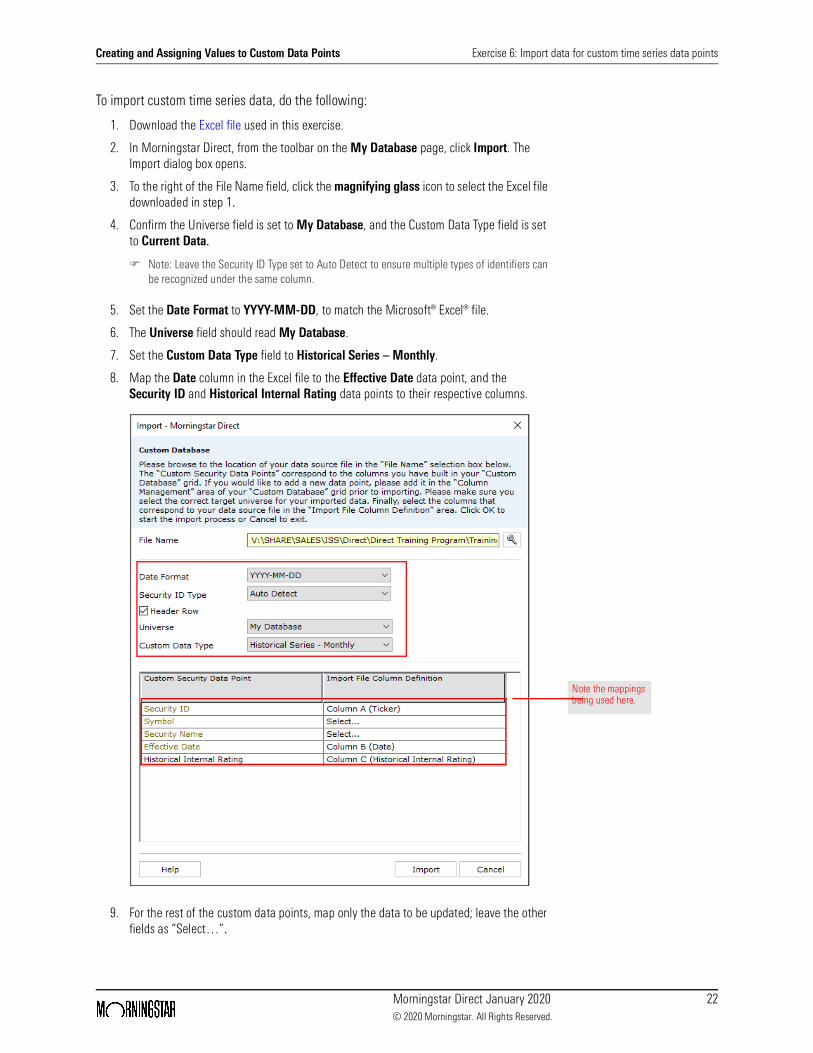
To import custom time series data, do the following:
1. Download the Excel file used in this exercise.
2. In Morningstar Direct, from the toolbar on the My Database page, click Import. The Import dialog box opens.
3. To the right of the File Name field, click the magnifying glass icon to select the Excel file downloaded in step 1.
4. Confirm the Universe field is set to My Database, and the Custom Data Type field is set to Current Data.
Note: Leave the Security ID Type set to Auto Detect to ensure multiple types of identifiers can be recognized under the same column.
5. Set the Date Format to YYYY-MM-DD, to match the Microsoft® Excel® file.
6. The Universe field should read My Database.
7. Set the Custom Data Type field to Historical Series – Monthly.
8. Map the Date column in the Excel file to the Effective Date data point, and the Security ID and Historical Internal Rating data points to their respective columns.
9. For the rest of the custom data points, map only the data to be updated; leave the other fields as “Select…”.
Note the mappings being used here.
Creating and Assigning Values to Custom Data Points Exercise 6: Import data for custom time series data points
Morningstar Direct January 2020 23© 2020 Morningstar. All Rights Reserved.
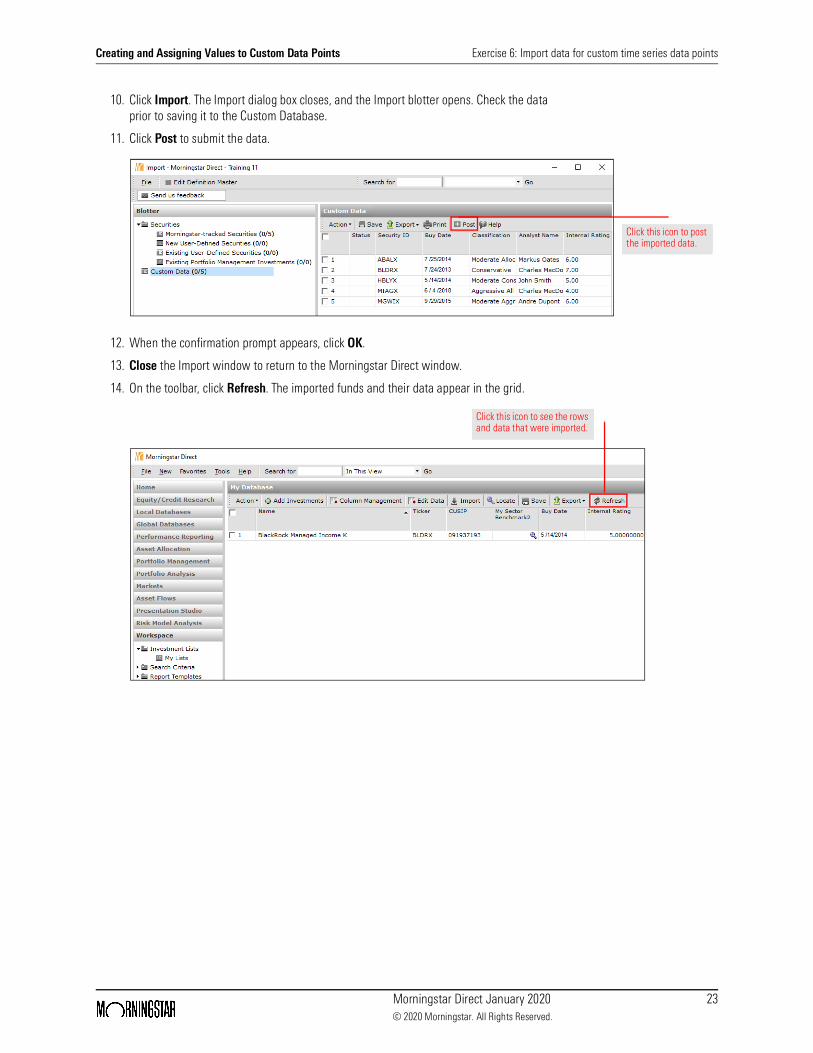
10. Click Import. The Import dialog box closes, and the Import blotter opens. Check the data prior to saving it to the Custom Database.
11. Click Post to submit the data.
12. When the confirmation prompt appears, click OK.
13. Close the Import window to return to the Morningstar Direct window.
14. On the toolbar, click Refresh. The imported funds and their data appear in the grid.
Click this icon to post the imported data.
Click this icon to see the rows and data that were imported.
Creating and Assigning Values to Custom Data Points Exercise 7: Add a custom Composition data point
Morningstar Direct January 2020 24© 2020 Morningstar. All Rights Reserved.
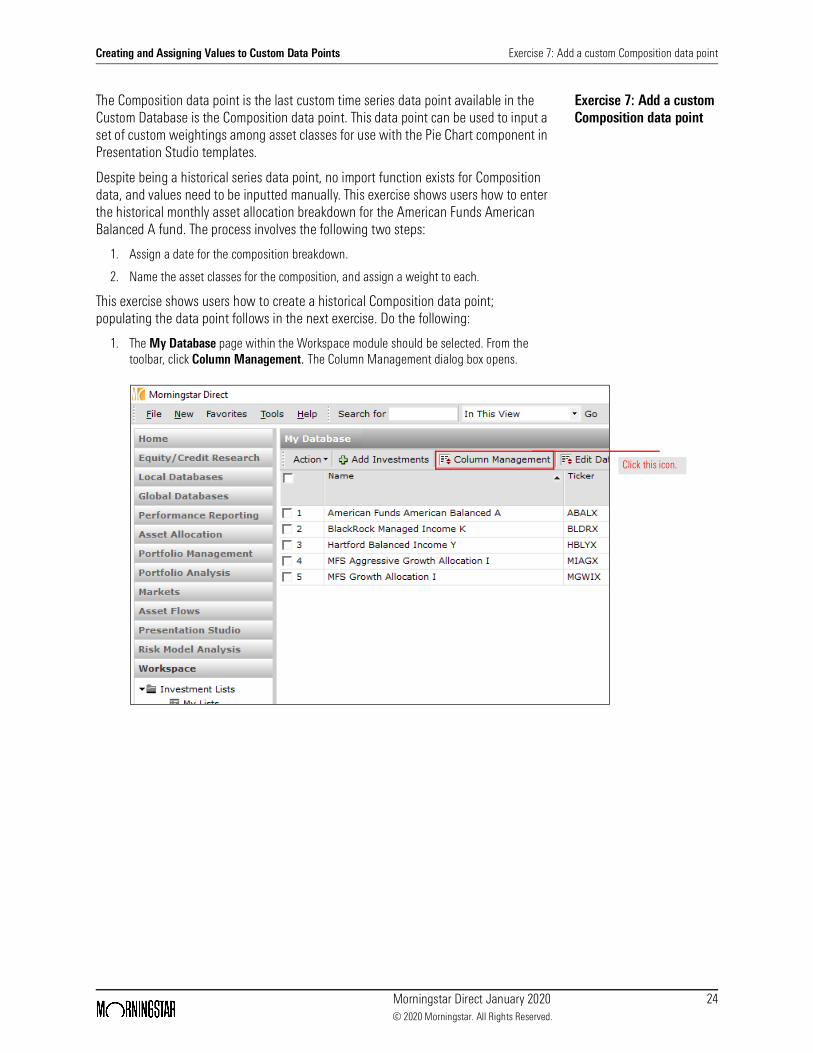
Exercise 7: Add a custom Composition data point
The Composition data point is the last custom time series data point available in the Custom Database is the Composition data point. This data point can be used to input a set of custom weightings among asset classes for use with the Pie Chart component in Presentation Studio templates.
Despite being a historical series data point, no import function exists for Composition data, and values need to be inputted manually. This exercise shows users how to enter the historical monthly asset allocation breakdown for the American Funds American Balanced A fund. The process involves the following two steps:
1. Assign a date for the composition breakdown.
2. Name the asset classes for the composition, and assign a weight to each.
This exercise shows users how to create a historical Composition data point; populating the data point follows in the next exercise. Do the following:
1. The My Database page within the Workspace module should be selected. From the toolbar, click Column Management. The Column Management dialog box opens.
Click this icon.
Creating and Assigning Values to Custom Data Points Exercise 7: Add a custom Composition data point
Morningstar Direct January 2020 25© 2020 Morningstar. All Rights Reserved.
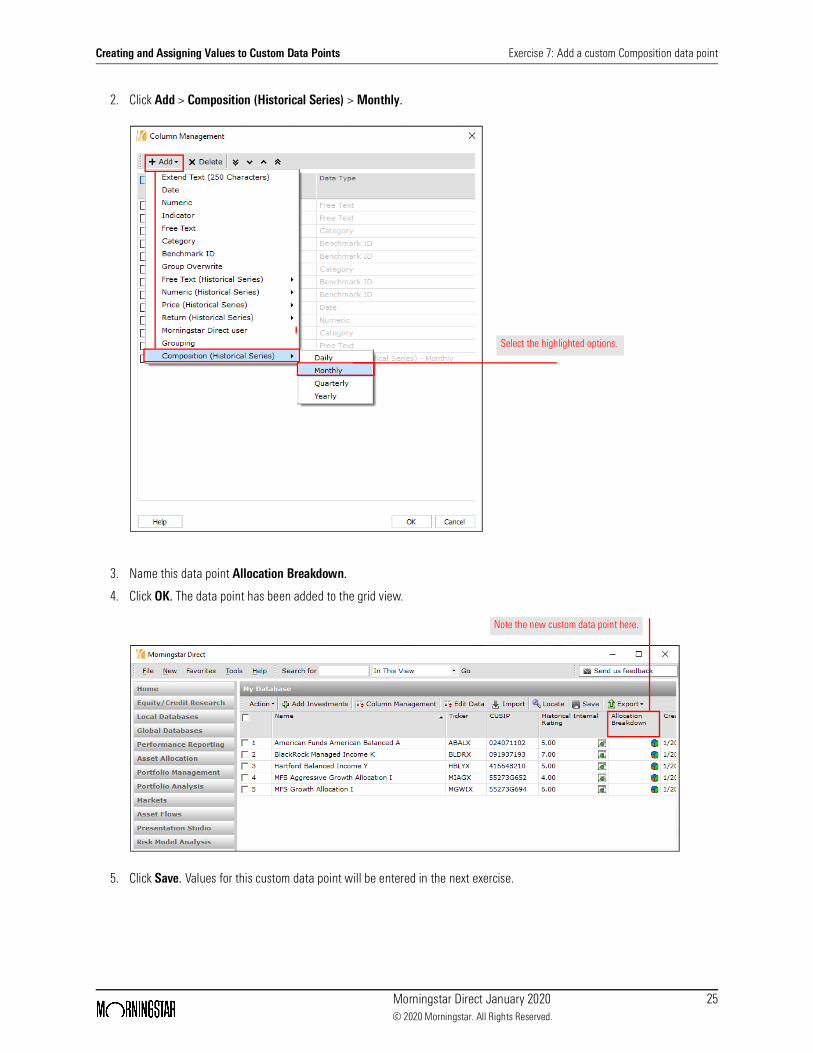
2. Click Add > Composition (Historical Series) > Monthly.
3. Name this data point Allocation Breakdown.
4. Click OK. The data point has been added to the grid view.
5. Click Save. Values for this custom data point will be entered in the next exercise.
Select the highlighted options.
Note the new custom data point here.
Creating and Assigning Values to Custom Data Points Exercise 8: Enter data for a Composition custom data point
Morningstar Direct January 2020 26© 2020 Morningstar. All Rights Reserved.
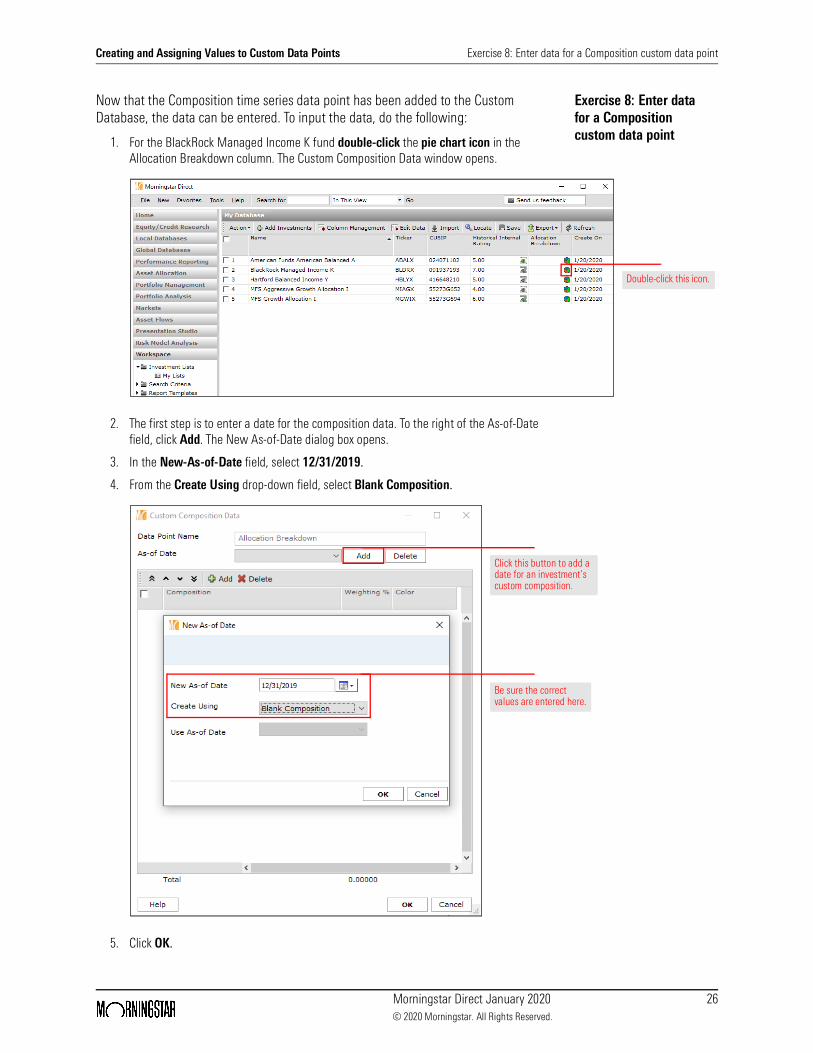
Exercise 8: Enter data for a Composition custom data point
Now that the Composition time series data point has been added to the Custom Database, the data can be entered. To input the data, do the following:
1. For the BlackRock Managed Income K fund double-click the pie chart icon in the Allocation Breakdown column. The Custom Composition Data window opens.
2. The first step is to enter a date for the composition data. To the right of the As-of-Date field, click Add. The New As-of-Date dialog box opens.
3. In the New-As-of-Date field, select 12/31/2019.
4. From the Create Using drop-down field, select Blank Composition.
5. Click OK.
Double-click this icon.
Click this button to add a date for an investment’s custom composition.
Be sure the correct values are entered here.
Creating and Assigning Values to Custom Data Points Exercise 8: Enter data for a Composition custom data point
Morningstar Direct January 2020 27© 2020 Morningstar. All Rights Reserved.
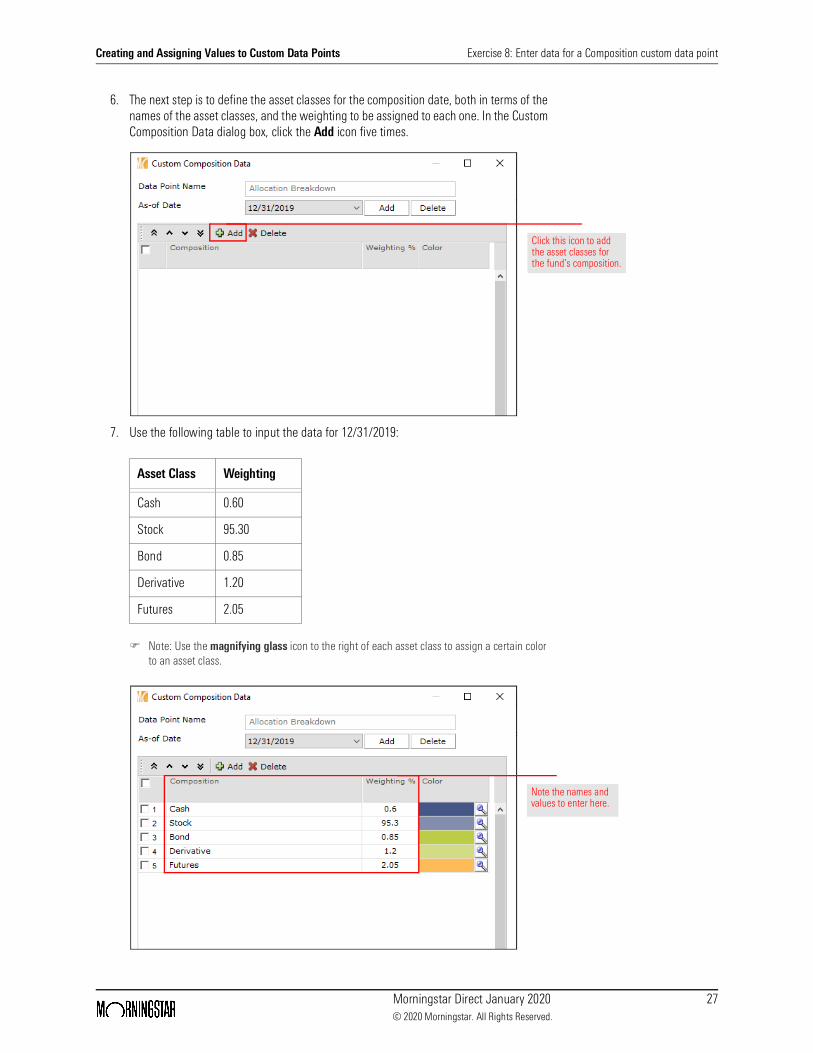
6. The next step is to define the asset classes for the composition date, both in terms of the names of the asset classes, and the weighting to be assigned to each one. In the Custom Composition Data dialog box, click the Add icon five times.
7. Use the following table to input the data for 12/31/2019:
Note: Use the magnifying glass icon to the right of each asset class to assign a certain color to an asset class.
Asset Class Weighting
Cash 0.60
Stock 95.30
Bond 0.85
Derivative 1.20
Futures 2.05
Click this icon to add the asset classes for the fund’s composition.
Note the names and values to enter here.
Creating and Assigning Values to Custom Data Points Exercise 8: Enter data for a Composition custom data point
Morningstar Direct January 2020 28© 2020 Morningstar. All Rights Reserved.
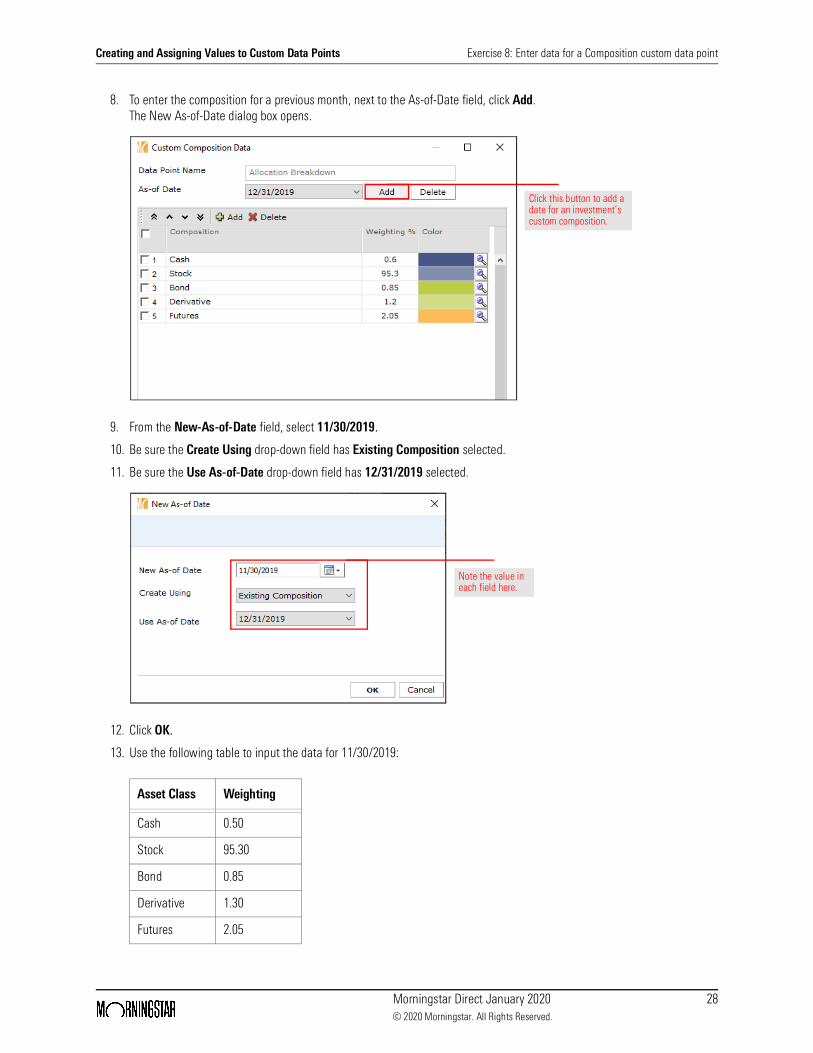
8. To enter the composition for a previous month, next to the As-of-Date field, click Add. The New As-of-Date dialog box opens.
9. From the New-As-of-Date field, select 11/30/2019.
10. Be sure the Create Using drop-down field has Existing Composition selected.
11. Be sure the Use As-of-Date drop-down field has 12/31/2019 selected.
12. Click OK.
13. Use the following table to input the data for 11/30/2019:
Asset Class Weighting
Cash 0.50
Stock 95.30
Bond 0.85
Derivative 1.30
Futures 2.05
Click this button to add a date for an investment’s custom composition.
Note the value in each field here.
Creating and Assigning Values to Custom Data Points Exercise 8: Enter data for a Composition custom data point
Morningstar Direct January 2020 29© 2020 Morningstar. All Rights Reserved.
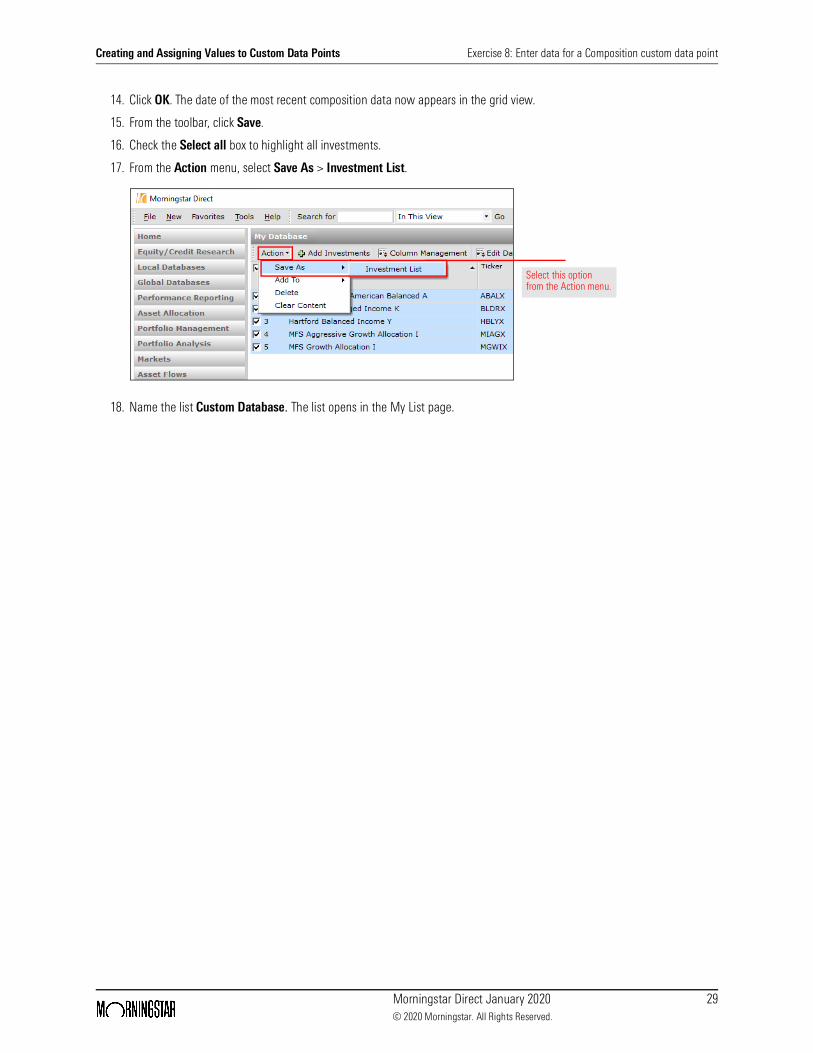
14. Click OK. The date of the most recent composition data now appears in the grid view.
15. From the toolbar, click Save.
16. Check the Select all box to highlight all investments.
17. From the Action menu, select Save As > Investment List.
18. Name the list Custom Database. The list opens in the My List page.
Select this option from the Action menu.
Leveraging Custom Data in Other Modules Overview
Morningstar Direct January 2020 30© 2020 Morningstar. All Rights Reserved.
Leveraging Custom Data in Other Modules
OverviewThis section explains how to leverage custom data in the following modules:
gWorkspace (Exercise 9 on page 30)gPerformance Reporting (Exercise 10 on page 32)gMorningstar Excel Add-In (begins with Exercise 14 on page 42), andgPresentation Studio (Exercise 15 on page 43).
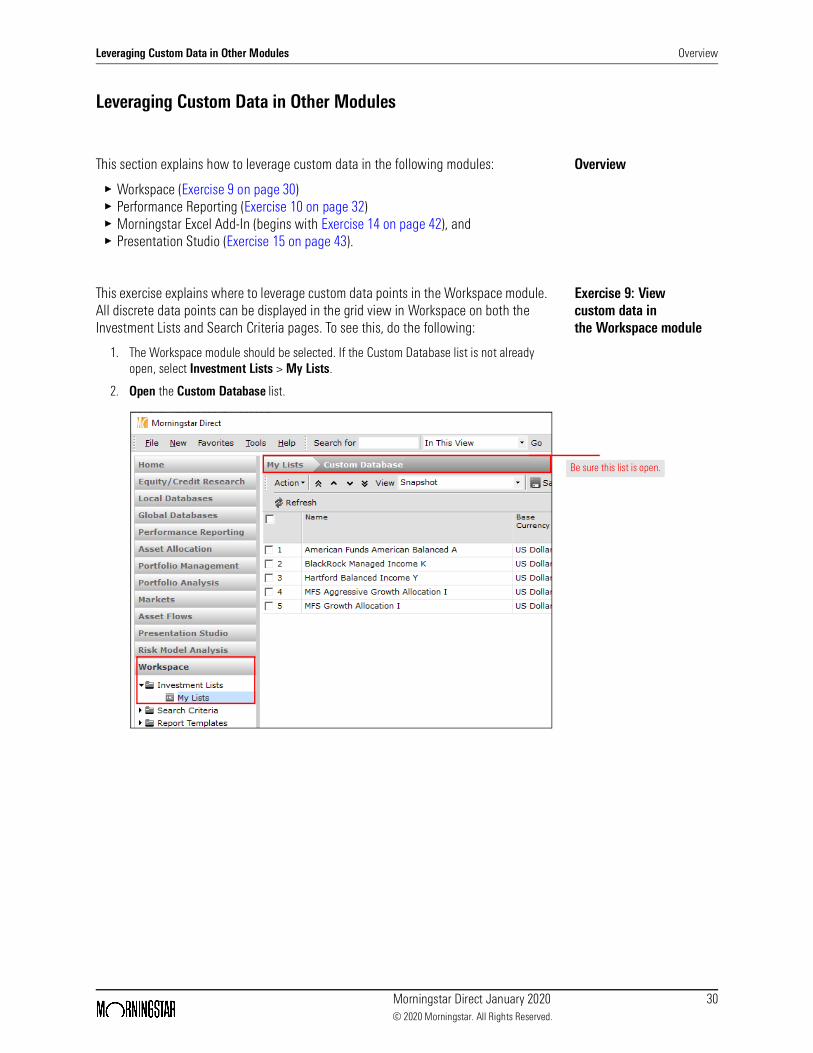
Exercise 9: View custom data in the Workspace module
This exercise explains where to leverage custom data points in the Workspace module. All discrete data points can be displayed in the grid view in Workspace on both the Investment Lists and Search Criteria pages. To see this, do the following:
1. The Workspace module should be selected. If the Custom Database list is not already open, select Investment Lists > My Lists.
2. Open the Custom Database list.
Be sure this list is open.
Leveraging Custom Data in Other Modules Exercise 9: View custom data in the Workspace module
Morningstar Direct January 2020 31© 2020 Morningstar. All Rights Reserved.
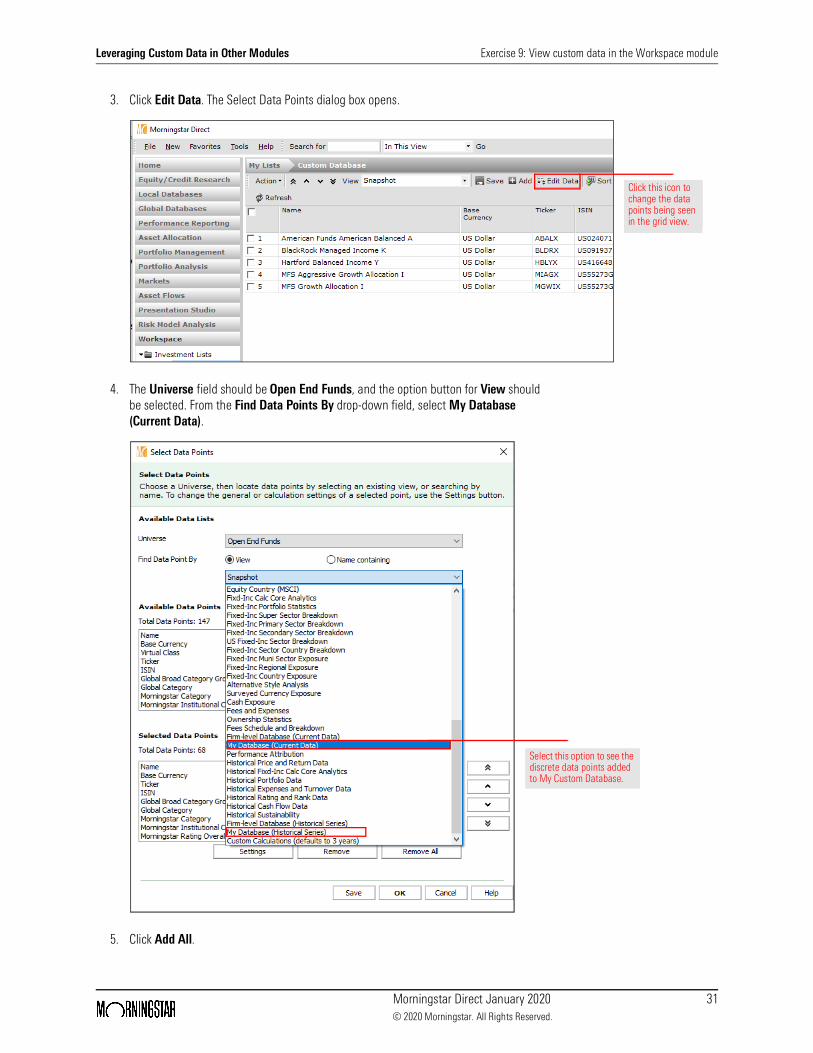
3. Click Edit Data. The Select Data Points dialog box opens.
4. The Universe field should be Open End Funds, and the option button for View should be selected. From the Find Data Points By drop-down field, select My Database (Current Data).
5. Click Add All.
Click this icon to change the data points being seen in the grid view.
Select this option to see the discrete data points added to My Custom Database.
Leveraging Custom Data in Other ModulesExercise 10: Adjust the general settings for performance reporting to use
custom data points
Morningstar Direct January 2020 32© 2020 Morningstar. All Rights Reserved.
6. From the Find Data Points By drop-down field, select My Database (Historical Series).
7. Click Add All.
Note: If desired, click Save to name the data set.
8. Click OK to close the dialog box.
9. Scroll right to see the custom data points.
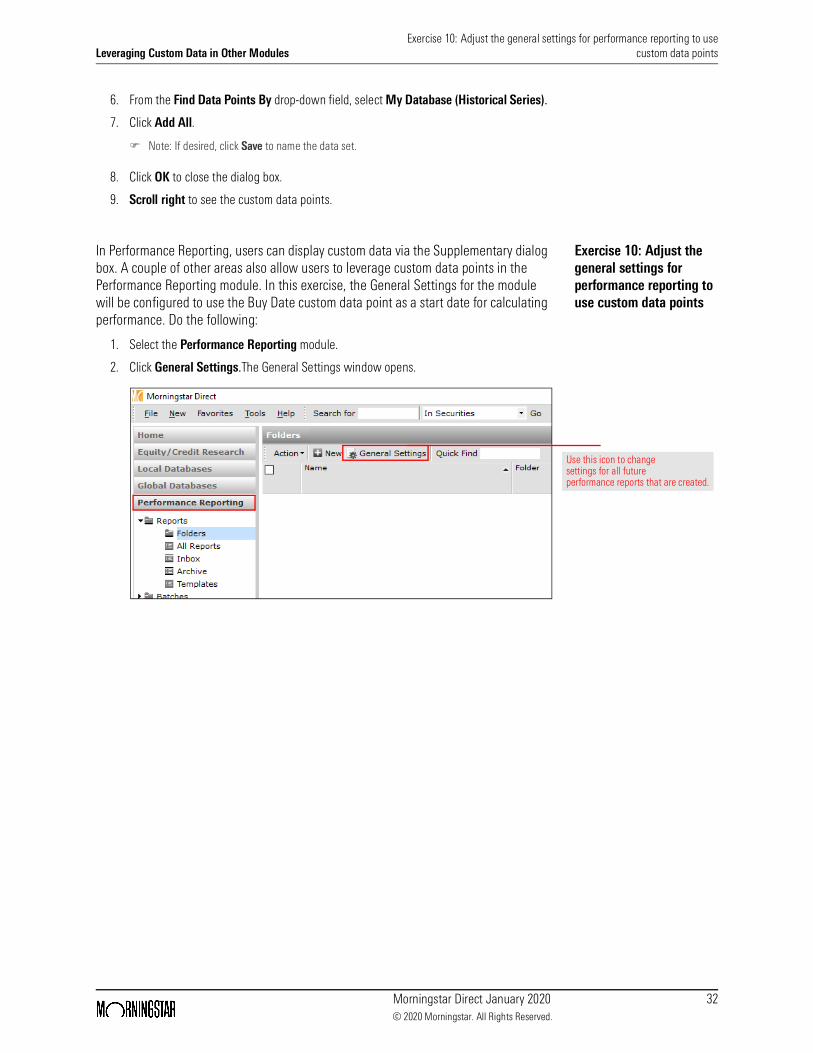
Exercise 10: Adjust the general settings for performance reporting to use custom data points
In Performance Reporting, users can display custom data via the Supplementary dialog box. A couple of other areas also allow users to leverage custom data points in the Performance Reporting module. In this exercise, the General Settings for the module will be configured to use the Buy Date custom data point as a start date for calculating performance. Do the following:
1. Select the Performance Reporting module.
2. Click General Settings.The General Settings window opens.
Use this icon to change settings for all future performance reports that are created.
Leveraging Custom Data in Other ModulesExercise 10: Adjust the general settings for performance reporting to use
custom data points
Morningstar Direct January 2020 33© 2020 Morningstar. All Rights Reserved.
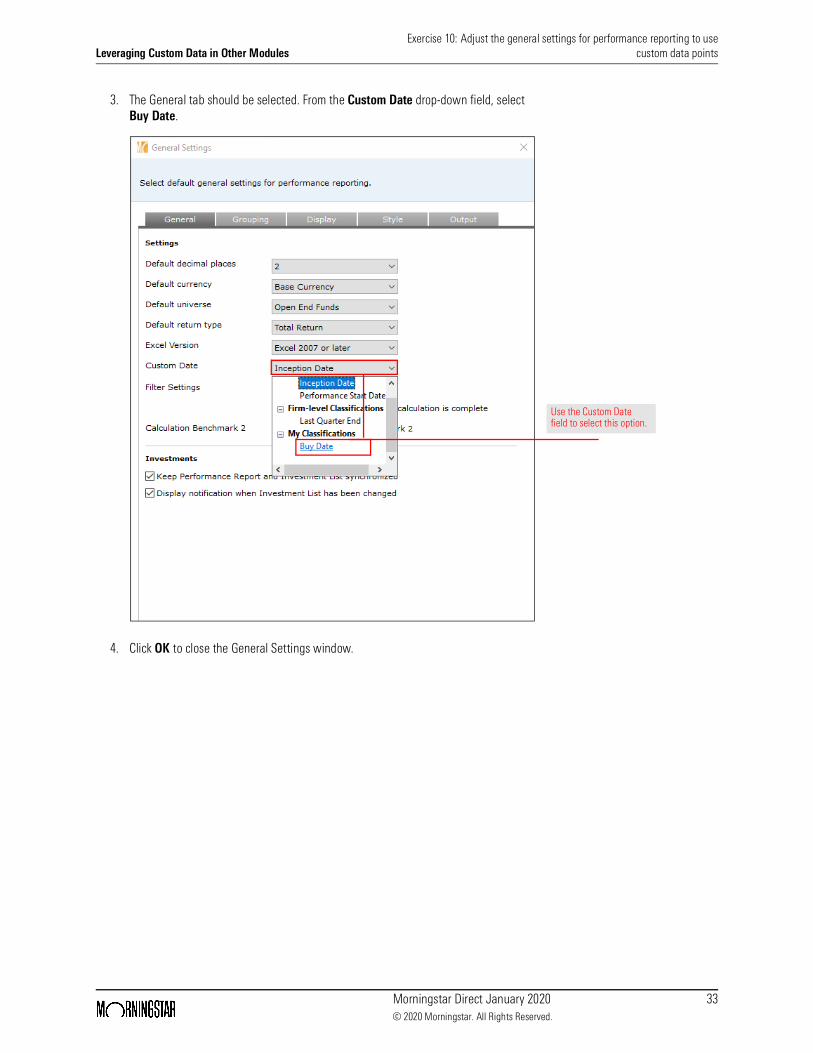
3. The General tab should be selected. From the Custom Date drop-down field, select Buy Date.
4. Click OK to close the General Settings window.
Use the Custom Date field to select this option.
Leveraging Custom Data in Other Modules Exercise 11: Use a custom data point as a benchmark
Morningstar Direct January 2020 34© 2020 Morningstar. All Rights Reserved.
Exercise 11: Use a custom data point as a benchmark
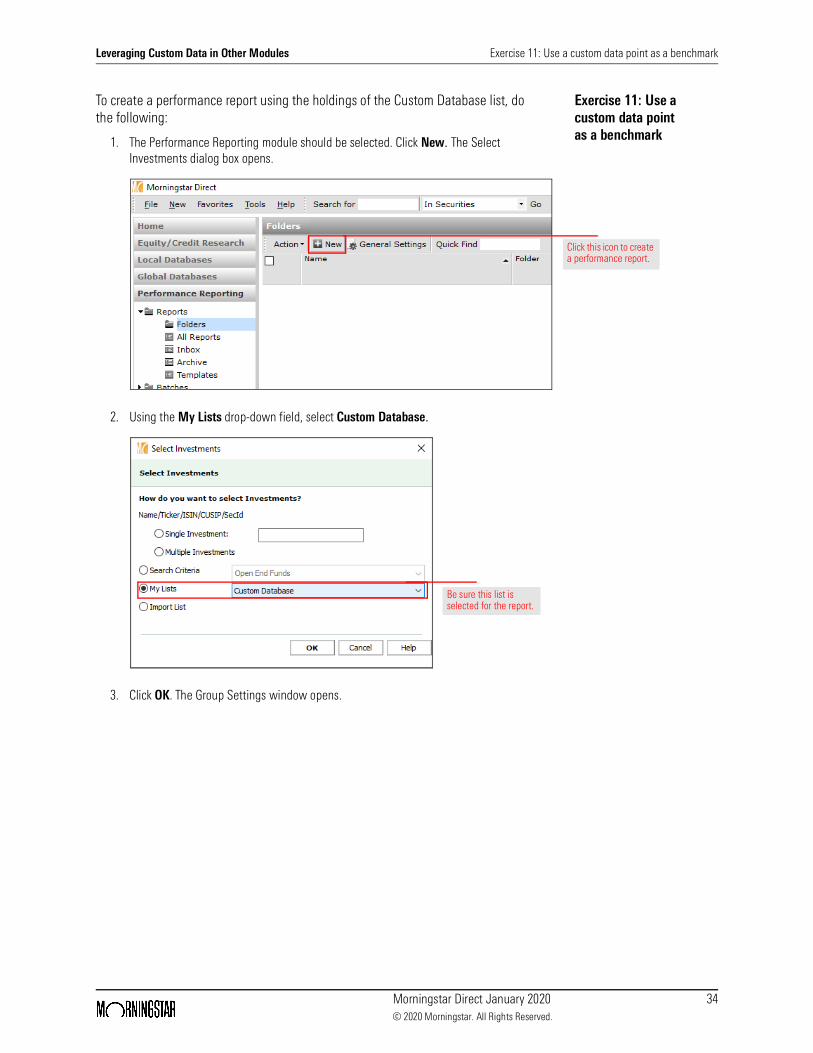
To create a performance report using the holdings of the Custom Database list, do the following:
1. The Performance Reporting module should be selected. Click New. The Select Investments dialog box opens.
2. Using the My Lists drop-down field, select Custom Database.
3. Click OK. The Group Settings window opens.
Click this icon to create a performance report.
Be sure this list is selected for the report.
Leveraging Custom Data in Other Modules Exercise 11: Use a custom data point as a benchmark
Morningstar Direct January 2020 35© 2020 Morningstar. All Rights Reserved.
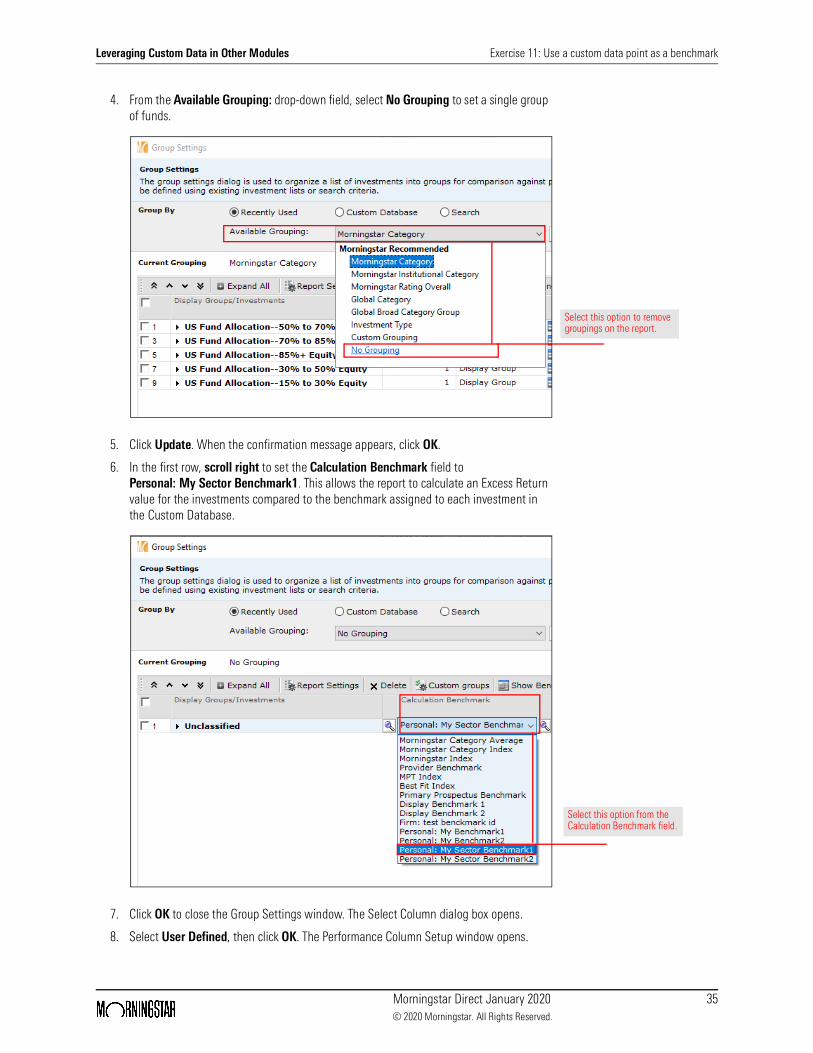
4. From the Available Grouping: drop-down field, select No Grouping to set a single group of funds.
5. Click Update. When the confirmation message appears, click OK.
6. In the first row, scroll right to set the Calculation Benchmark field to Personal: My Sector Benchmark1. This allows the report to calculate an Excess Return value for the investments compared to the benchmark assigned to each investment in the Custom Database.
7. Click OK to close the Group Settings window. The Select Column dialog box opens.
8. Select User Defined, then click OK. The Performance Column Setup window opens.
Select this option to remove groupings on the report.
Select this option from the Calculation Benchmark field.
Leveraging Custom Data in Other Modules Exercise 12: Use a custom date data point in a performance report
Morningstar Direct January 2020 36© 2020 Morningstar. All Rights Reserved.
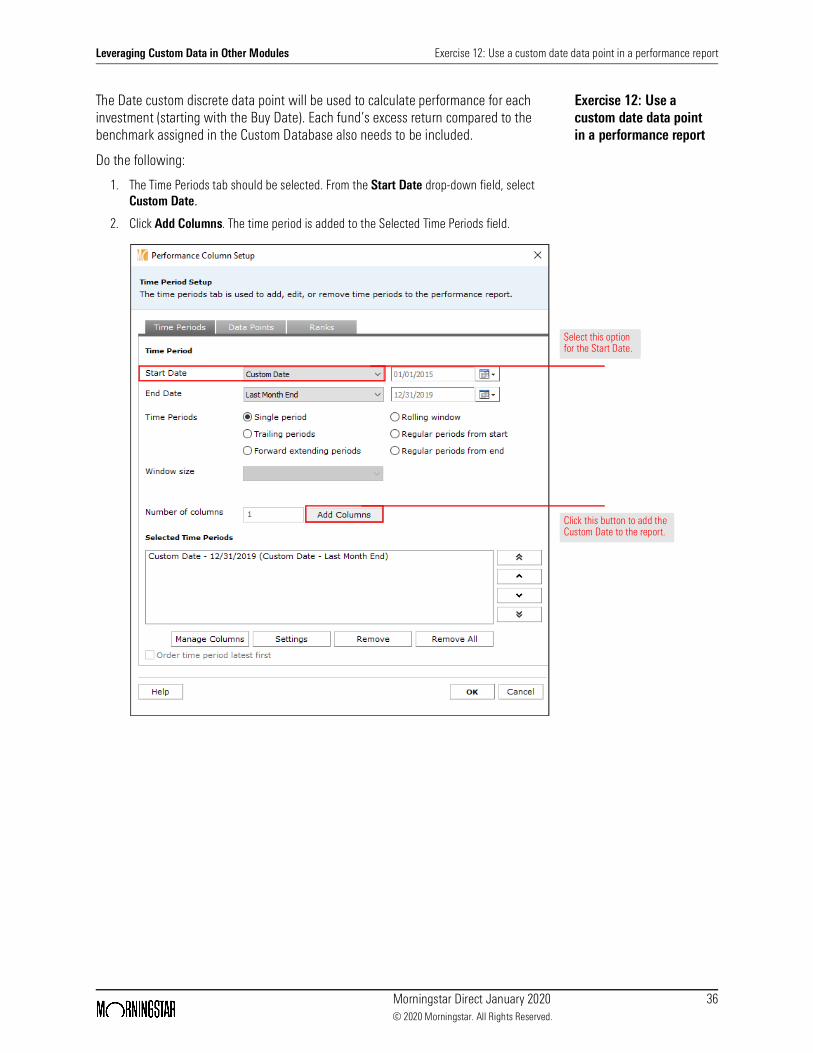
Exercise 12: Use a custom date data point in a performance report
The Date custom discrete data point will be used to calculate performance for each investment (starting with the Buy Date). Each fund’s excess return compared to the benchmark assigned in the Custom Database also needs to be included.
Do the following:
1. The Time Periods tab should be selected. From the Start Date drop-down field, select Custom Date.
2. Click Add Columns. The time period is added to the Selected Time Periods field.
Select this option for the Start Date.
Click this button to add the Custom Date to the report.
Leveraging Custom Data in Other Modules Exercise 12: Use a custom date data point in a performance report
Morningstar Direct January 2020 37© 2020 Morningstar. All Rights Reserved.
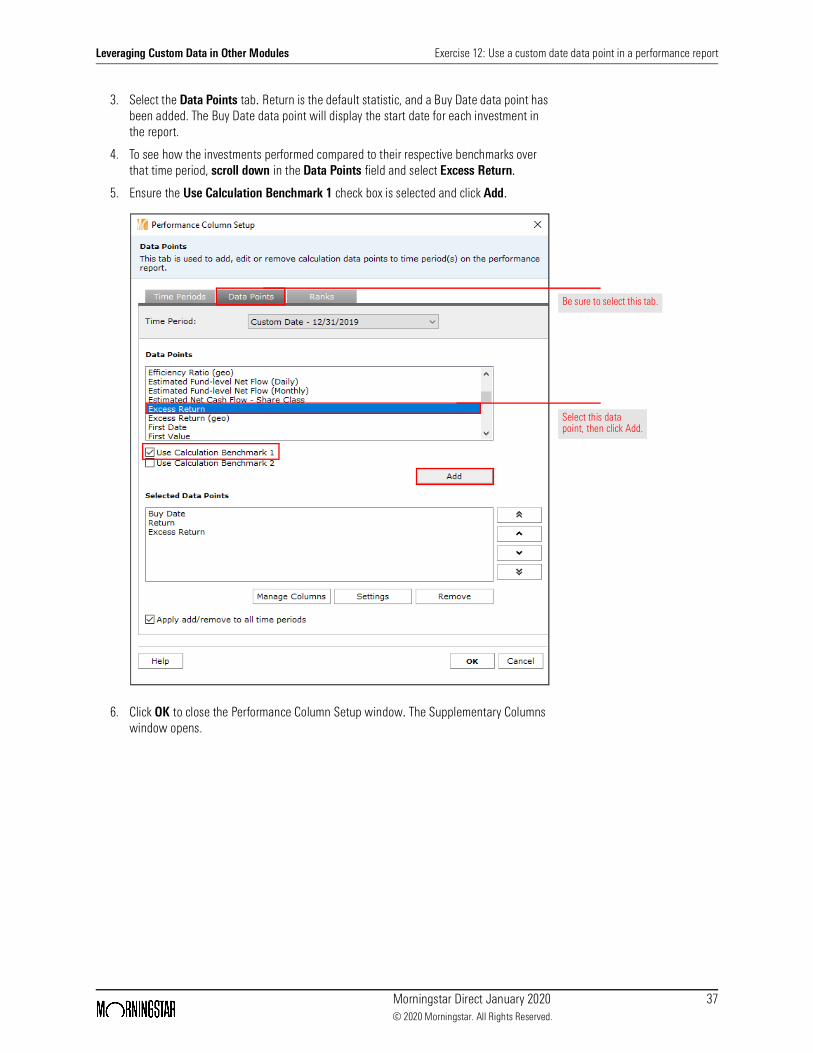
3. Select the Data Points tab. Return is the default statistic, and a Buy Date data point has been added. The Buy Date data point will display the start date for each investment in the report.
4. To see how the investments performed compared to their respective benchmarks over that time period, scroll down in the Data Points field and select Excess Return.
5. Ensure the Use Calculation Benchmark 1 check box is selected and click Add.
6. Click OK to close the Performance Column Setup window. The Supplementary Columns window opens.
Be sure to select this tab.
Select this data point, then click Add.
Leveraging Custom Data in Other ModulesExercise 13: Add the discrete and historical custom data points to
the performance report
Morningstar Direct January 2020 38© 2020 Morningstar. All Rights Reserved.
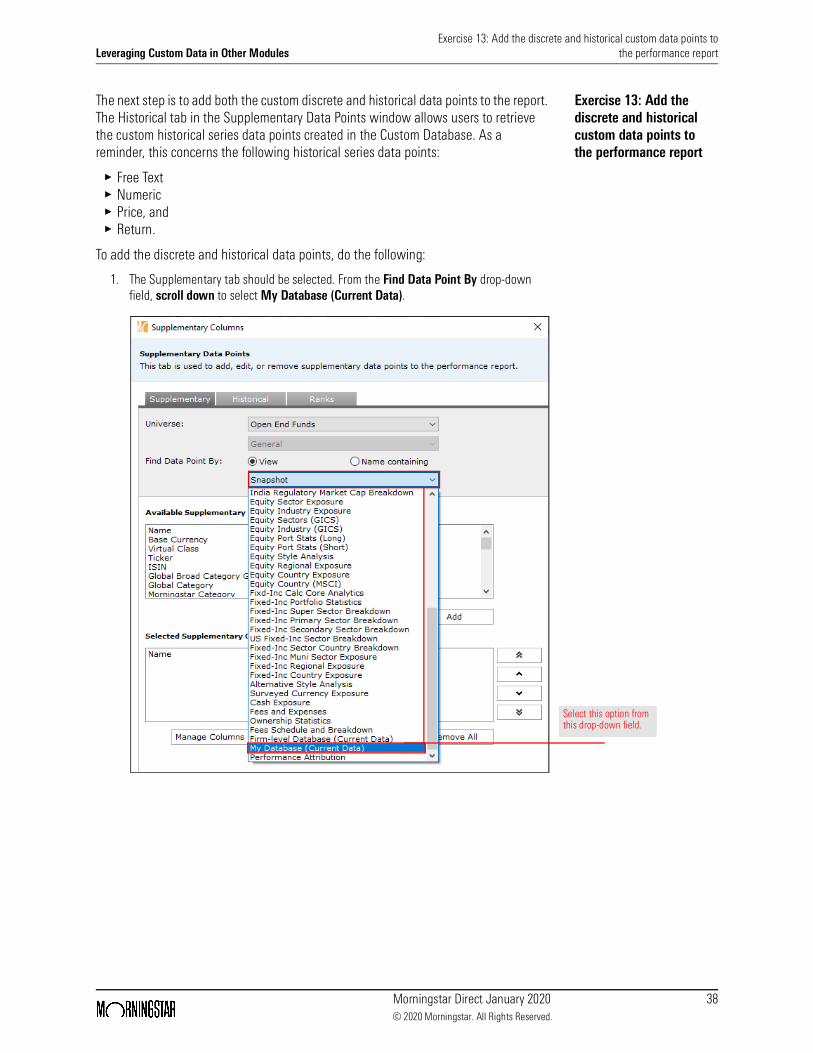
Exercise 13: Add the discrete and historical custom data points to the performance report
The next step is to add both the custom discrete and historical data points to the report. The Historical tab in the Supplementary Data Points window allows users to retrieve the custom historical series data points created in the Custom Database. As a reminder, this concerns the following historical series data points:
g Free TextgNumericgPrice, andgReturn.
To add the discrete and historical data points, do the following:
1. The Supplementary tab should be selected. From the Find Data Point By drop-down field, scroll down to select My Database (Current Data).
Select this option from this drop-down field.
Leveraging Custom Data in Other ModulesExercise 13: Add the discrete and historical custom data points to
the performance report
Morningstar Direct January 2020 39© 2020 Morningstar. All Rights Reserved.
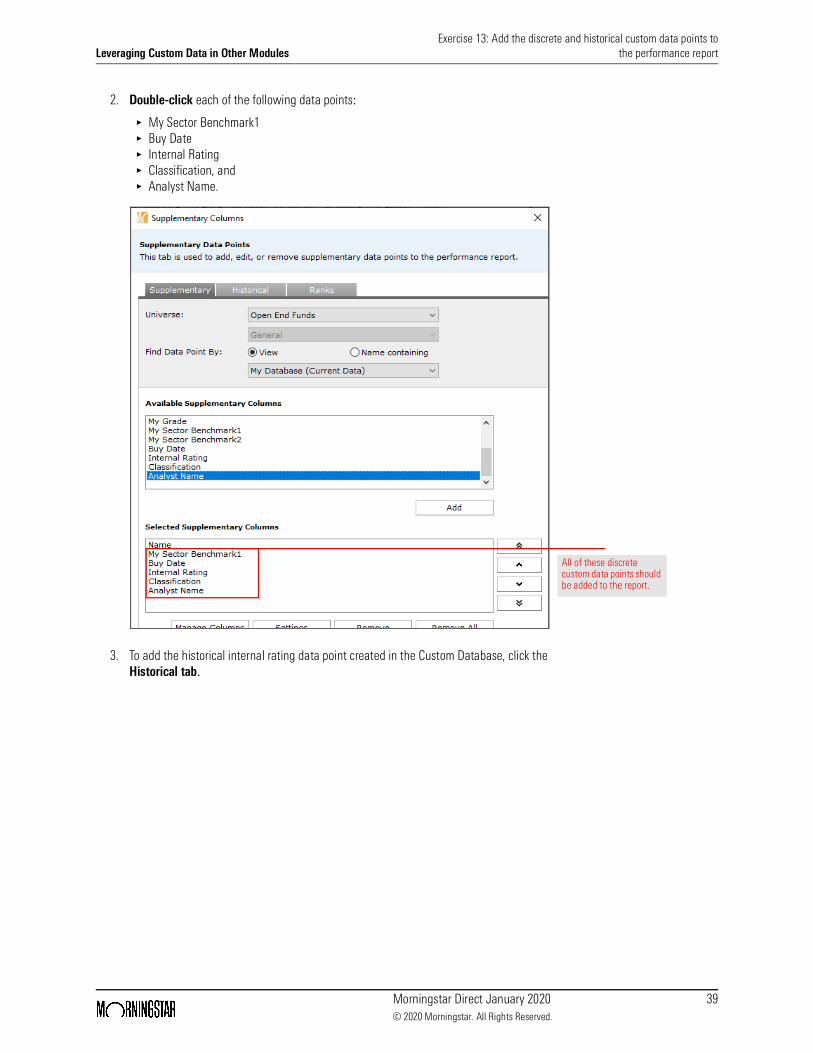
2. Double-click each of the following data points:
g My Sector Benchmark1g Buy Dateg Internal Ratingg Classification, andg Analyst Name.
3. To add the historical internal rating data point created in the Custom Database, click the Historical tab.
All of these discrete custom data points should be added to the report.
Leveraging Custom Data in Other ModulesExercise 13: Add the discrete and historical custom data points to
the performance report
Morningstar Direct January 2020 40© 2020 Morningstar. All Rights Reserved.
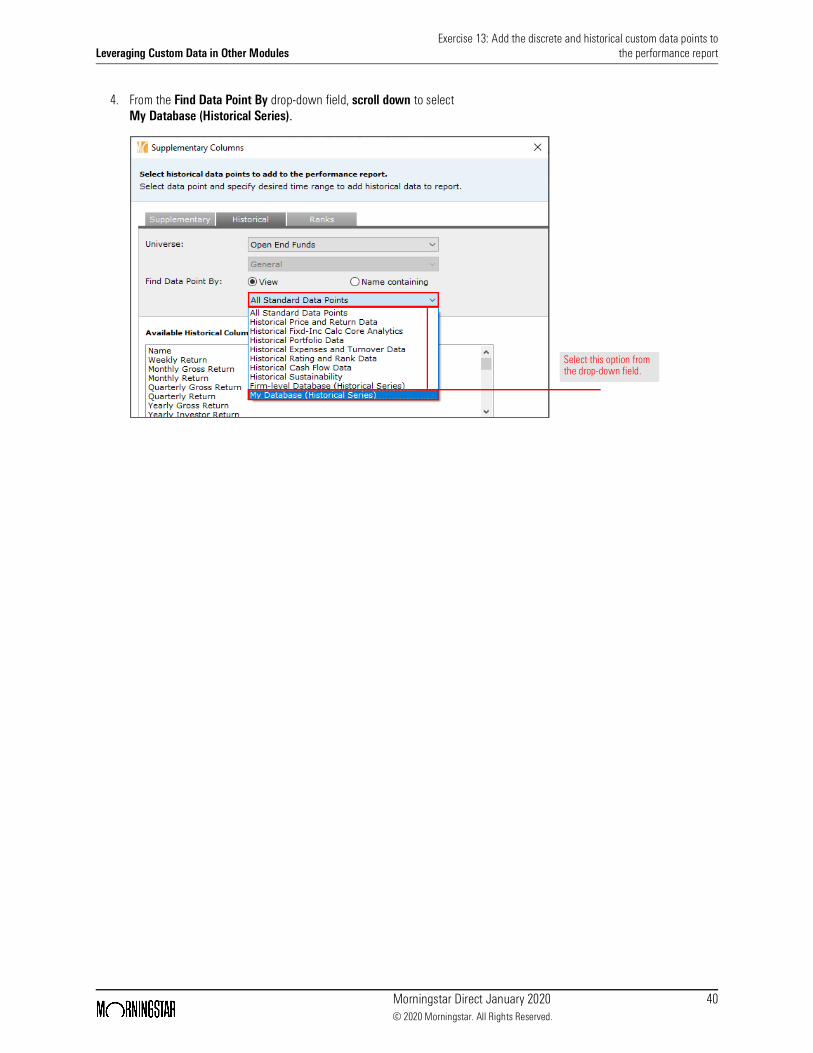
4. From the Find Data Point By drop-down field, scroll down to select My Database (Historical Series).
Select this option from the drop-down field.
Leveraging Custom Data in Other ModulesExercise 13: Add the discrete and historical custom data points to
the performance report
Morningstar Direct January 2020 41© 2020 Morningstar. All Rights Reserved.
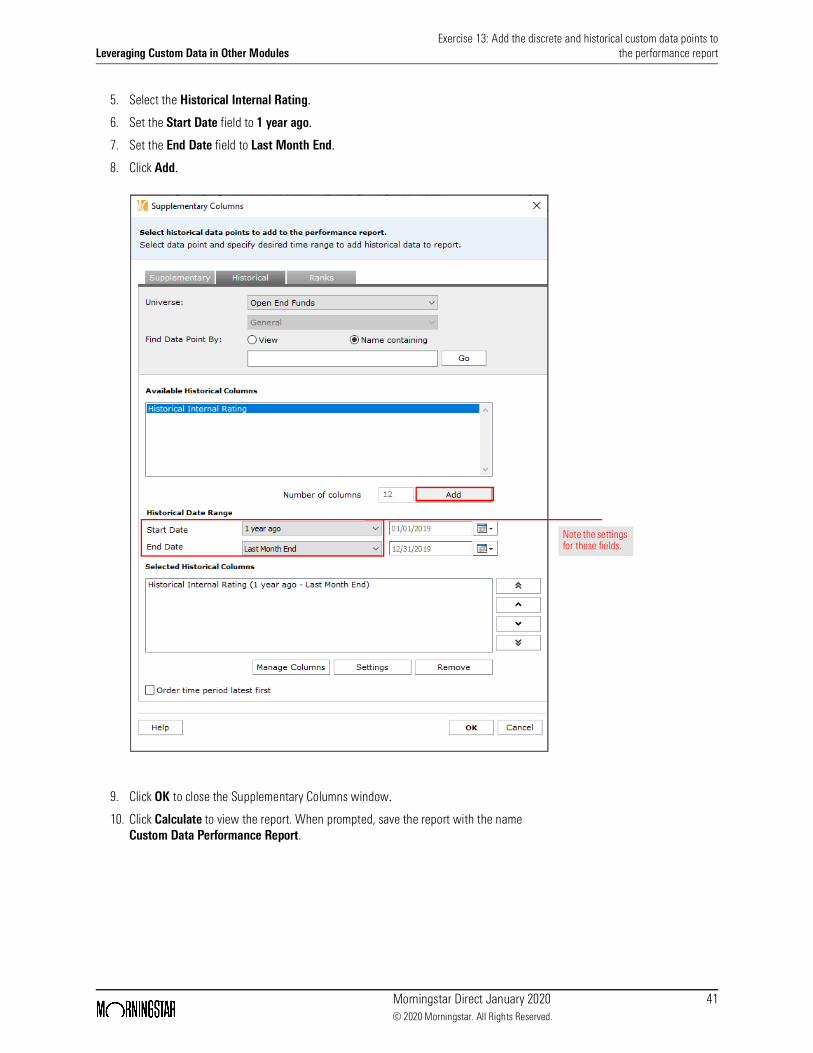
5. Select the Historical Internal Rating.
6. Set the Start Date field to 1 year ago.
7. Set the End Date field to Last Month End.
8. Click Add.
9. Click OK to close the Supplementary Columns window.
10. Click Calculate to view the report. When prompted, save the report with the name Custom Data Performance Report.
Note the settings for these fields.
Leveraging Custom Data in Other Modules Exercise 14: Retrieve custom data using the Morningstar Excel Add-In
Morningstar Direct January 2020 42© 2020 Morningstar. All Rights Reserved.
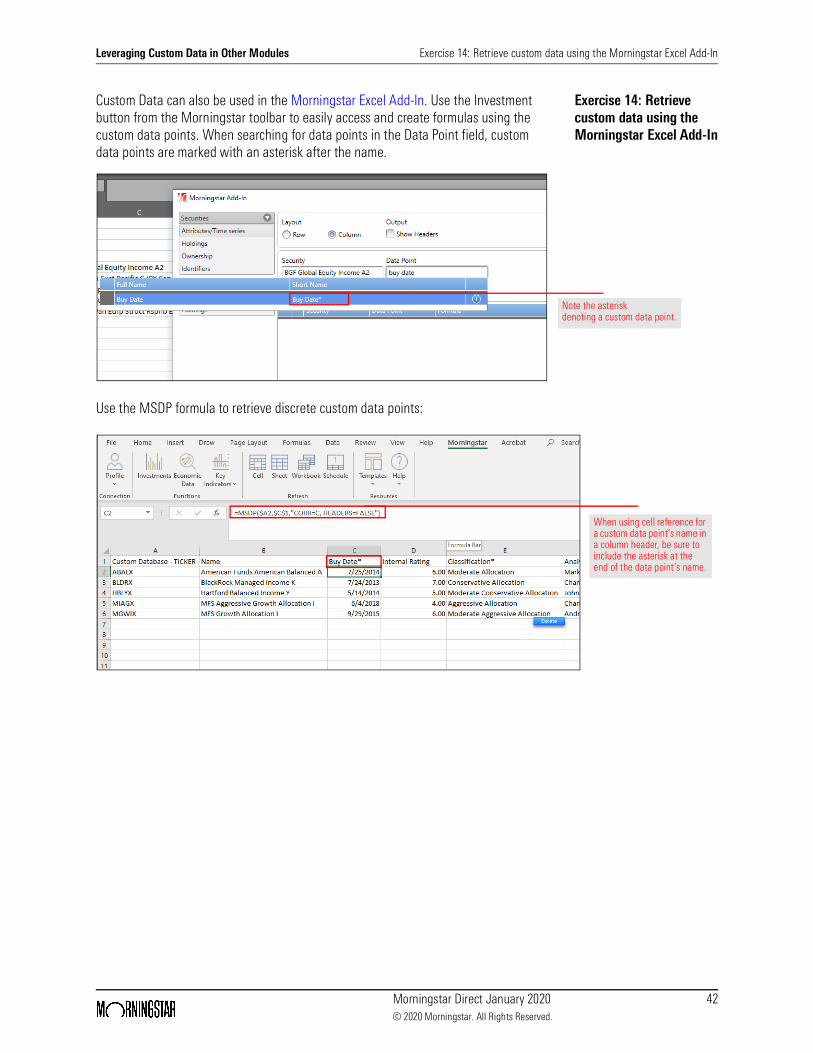
Exercise 14: Retrieve custom data using the Morningstar Excel Add-In
Custom Data can also be used in the Morningstar Excel Add-In. Use the Investment button from the Morningstar toolbar to easily access and create formulas using the custom data points. When searching for data points in the Data Point field, custom data points are marked with an asterisk after the name.
Use the MSDP formula to retrieve discrete custom data points:
Note the asterisk denoting a custom data point.
When using cell reference for a custom data point’s name in a column header, be sure to include the asterisk at the end of the data point’s name.
Leveraging Custom Data in Other Modules Exercise 15: Use custom data in Presentation Studio
Morningstar Direct January 2020 43© 2020 Morningstar. All Rights Reserved.
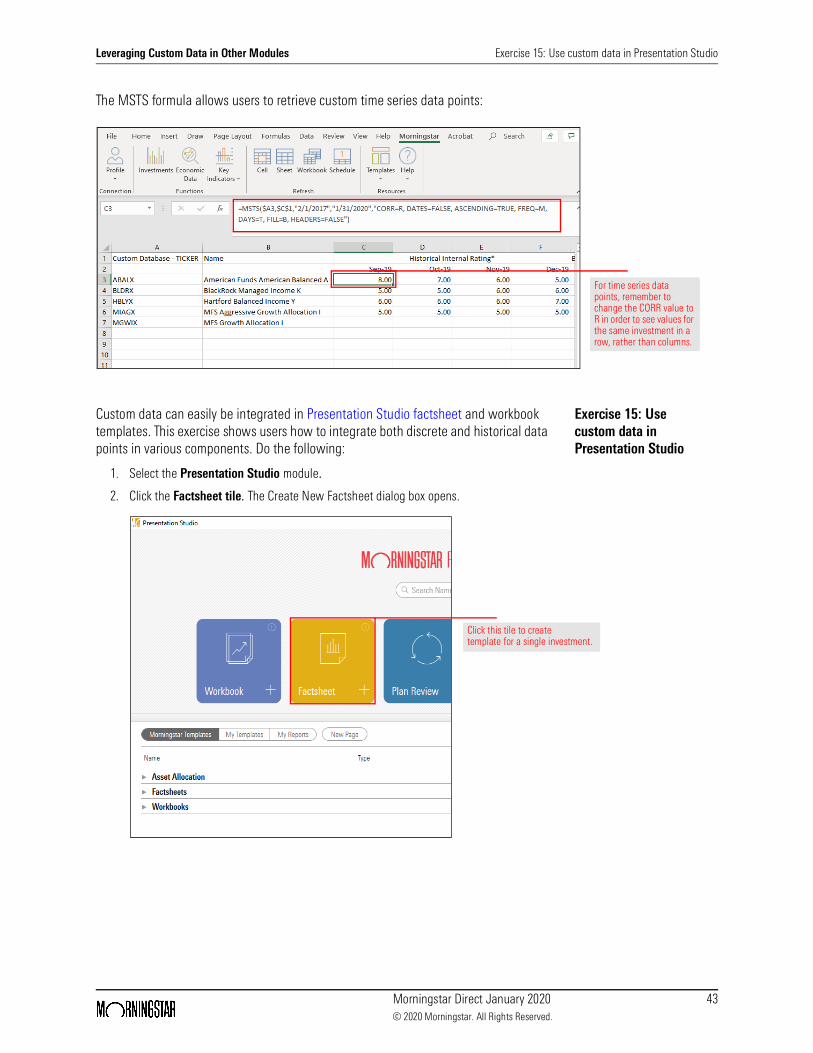
The MSTS formula allows users to retrieve custom time series data points:
Exercise 15: Use custom data in Presentation Studio
Custom data can easily be integrated in Presentation Studio factsheet and workbook templates. This exercise shows users how to integrate both discrete and historical data points in various components. Do the following:
1. Select the Presentation Studio module.
2. Click the Factsheet tile. The Create New Factsheet dialog box opens.
For time series data points, remember to change the CORR value to R in order to see values for the same investment in a row, rather than columns.
Click this tile to create template for a single investment.
Leveraging Custom Data in Other Modules Exercise 15: Use custom data in Presentation Studio
Morningstar Direct January 2020 44© 2020 Morningstar. All Rights Reserved.
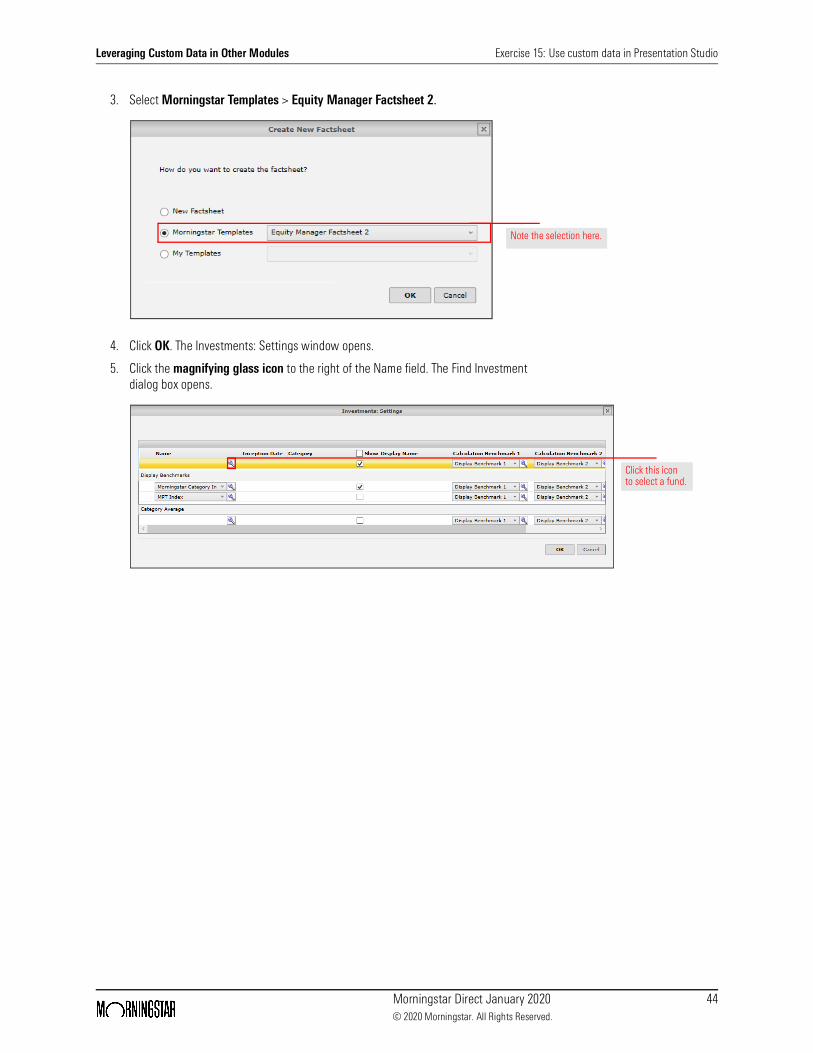
3. Select Morningstar Templates > Equity Manager Factsheet 2.
4. Click OK. The Investments: Settings window opens.
5. Click the magnifying glass icon to the right of the Name field. The Find Investment dialog box opens.
Note the selection here.
Click this icon to select a fund.
Leveraging Custom Data in Other Modules Exercise 15: Use custom data in Presentation Studio
Morningstar Direct January 2020 45© 2020 Morningstar. All Rights Reserved.
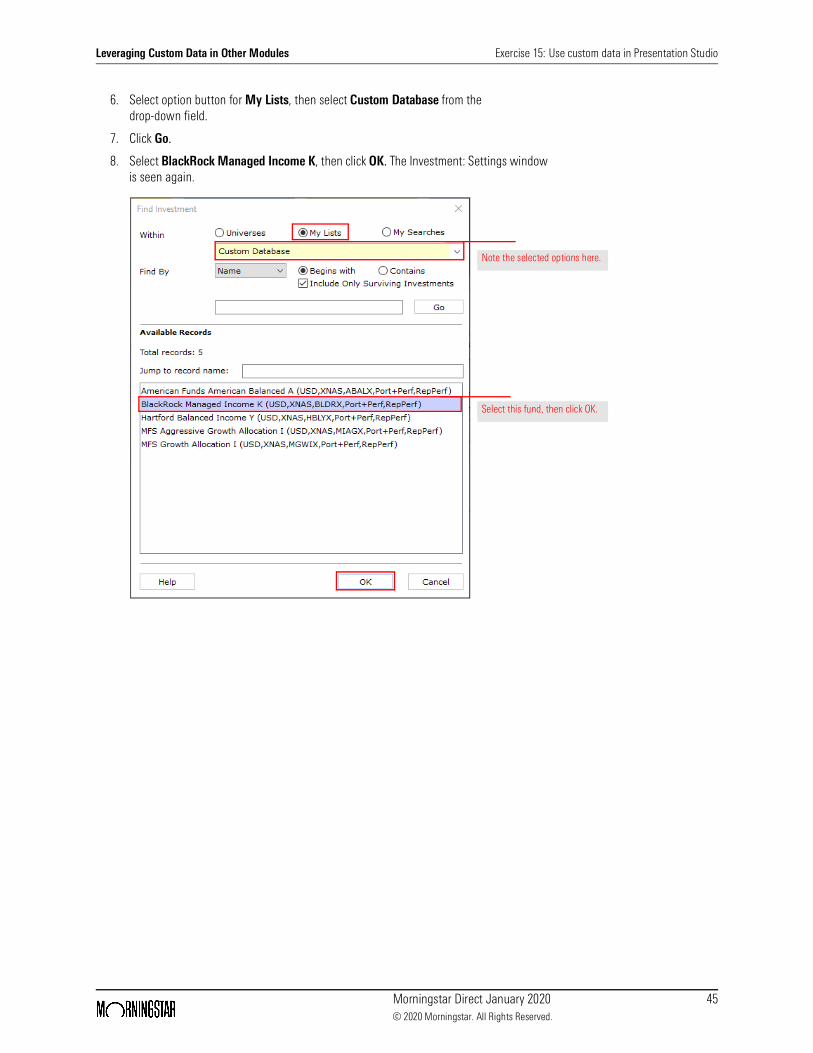
6. Select option button for My Lists, then select Custom Database from the drop-down field.
7. Click Go.
8. Select BlackRock Managed Income K, then click OK. The Investment: Settings window is seen again.
Select this fund, then click OK.
Note the selected options here.
Leveraging Custom Data in Other Modules Exercise 15: Use custom data in Presentation Studio
Morningstar Direct January 2020 46© 2020 Morningstar. All Rights Reserved.
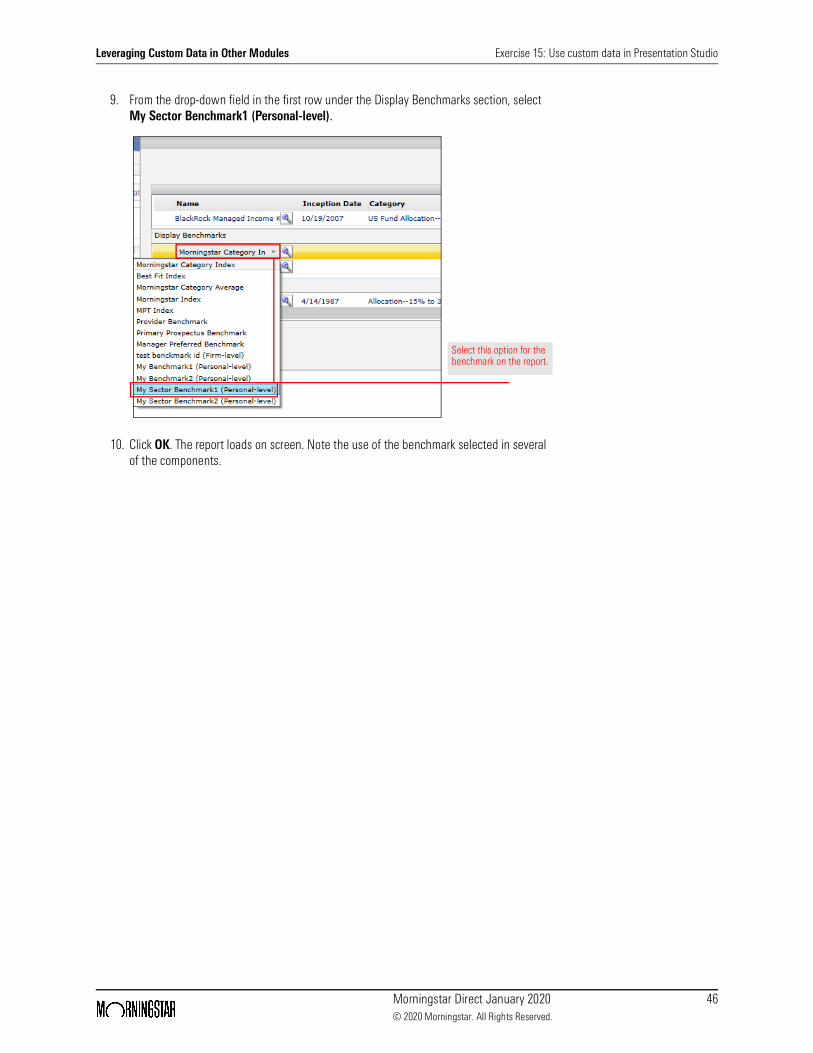
9. From the drop-down field in the first row under the Display Benchmarks section, select My Sector Benchmark1 (Personal-level).
10. Click OK. The report loads on screen. Note the use of the benchmark selected in several of the components.
Select this option for the benchmark on the report.
Leveraging Custom Data in Other Modules Exercise 16: Include discrete custom data points on a template
Morningstar Direct January 2020 47© 2020 Morningstar. All Rights Reserved.
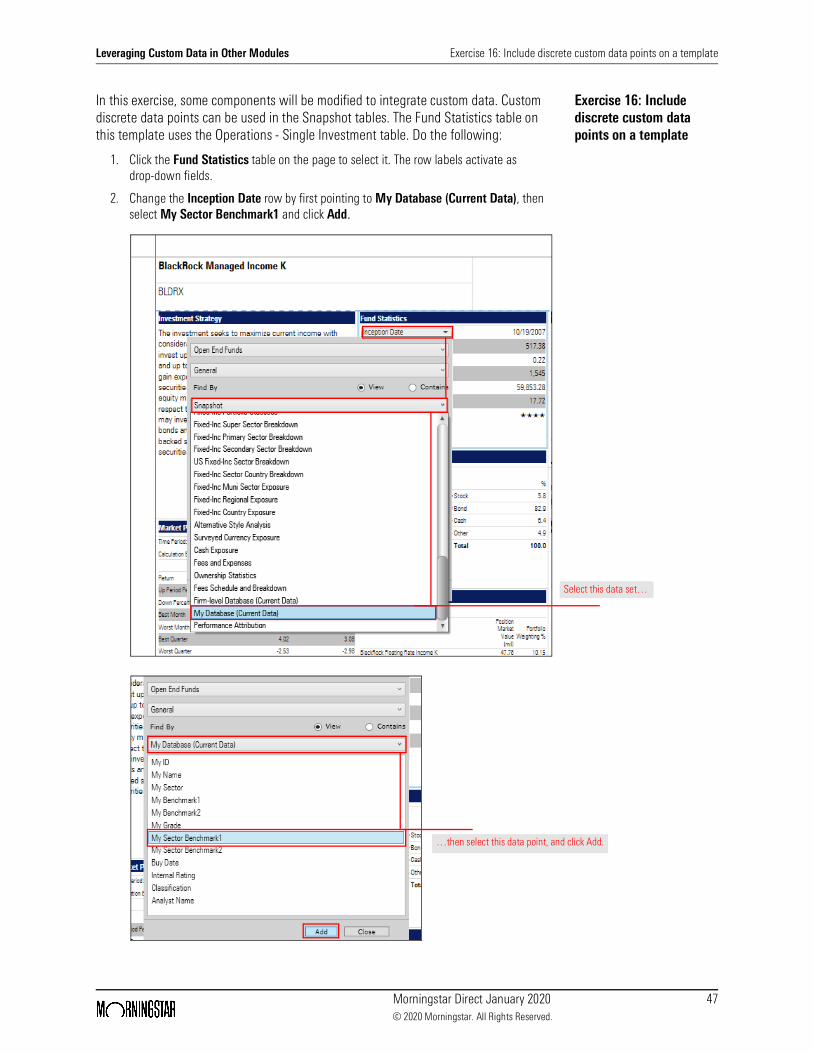
Exercise 16: Include discrete custom data points on a template
In this exercise, some components will be modified to integrate custom data. Custom discrete data points can be used in the Snapshot tables. The Fund Statistics table on this template uses the Operations - Single Investment table. Do the following:
1. Click the Fund Statistics table on the page to select it. The row labels activate as drop-down fields.
2. Change the Inception Date row by first pointing to My Database (Current Data), then select My Sector Benchmark1 and click Add.
Select this data set…
…then select this data point, and click Add.
Leveraging Custom Data in Other Modules Exercise 16: Include discrete custom data points on a template
Morningstar Direct January 2020 48© 2020 Morningstar. All Rights Reserved.
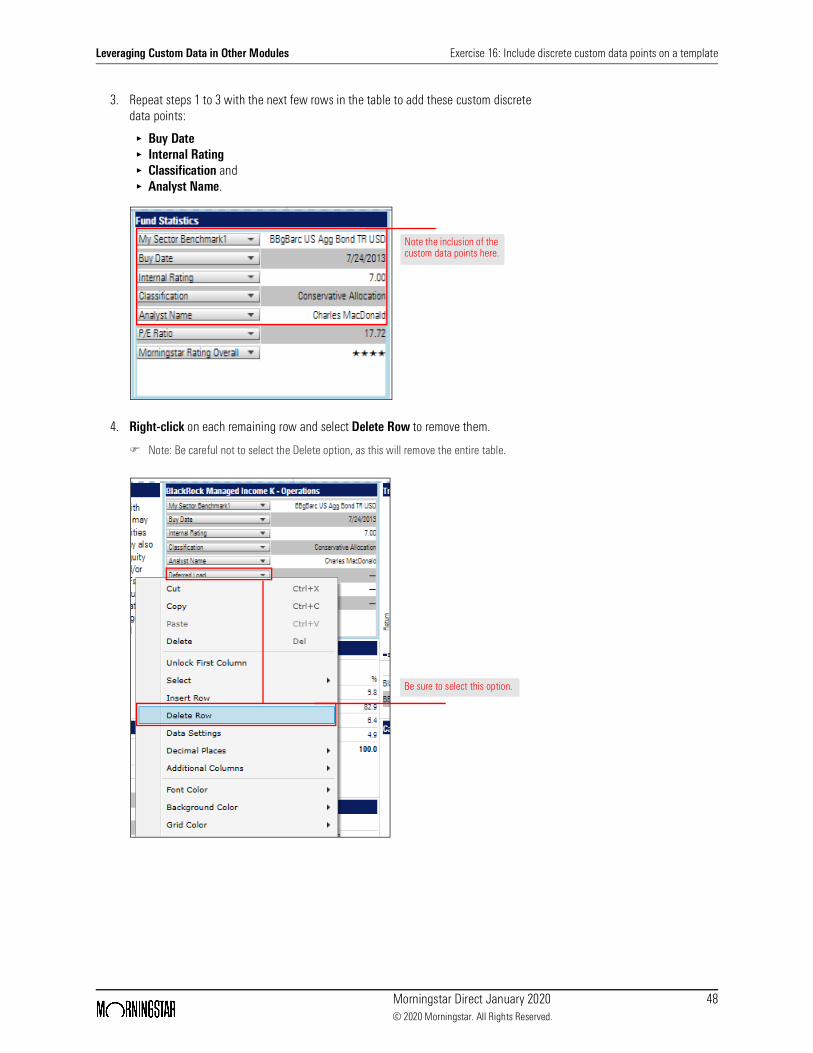
3. Repeat steps 1 to 3 with the next few rows in the table to add these custom discrete data points:
g Buy Dateg Internal Ratingg Classification andg Analyst Name.
4. Right-click on each remaining row and select Delete Row to remove them.
Note: Be careful not to select the Delete option, as this will remove the entire table.
Note the inclusion of the custom data points here.
Be sure to select this option.
Leveraging Custom Data in Other Modules Exercise 16: Include discrete custom data points on a template
Morningstar Direct January 2020 49© 2020 Morningstar. All Rights Reserved.
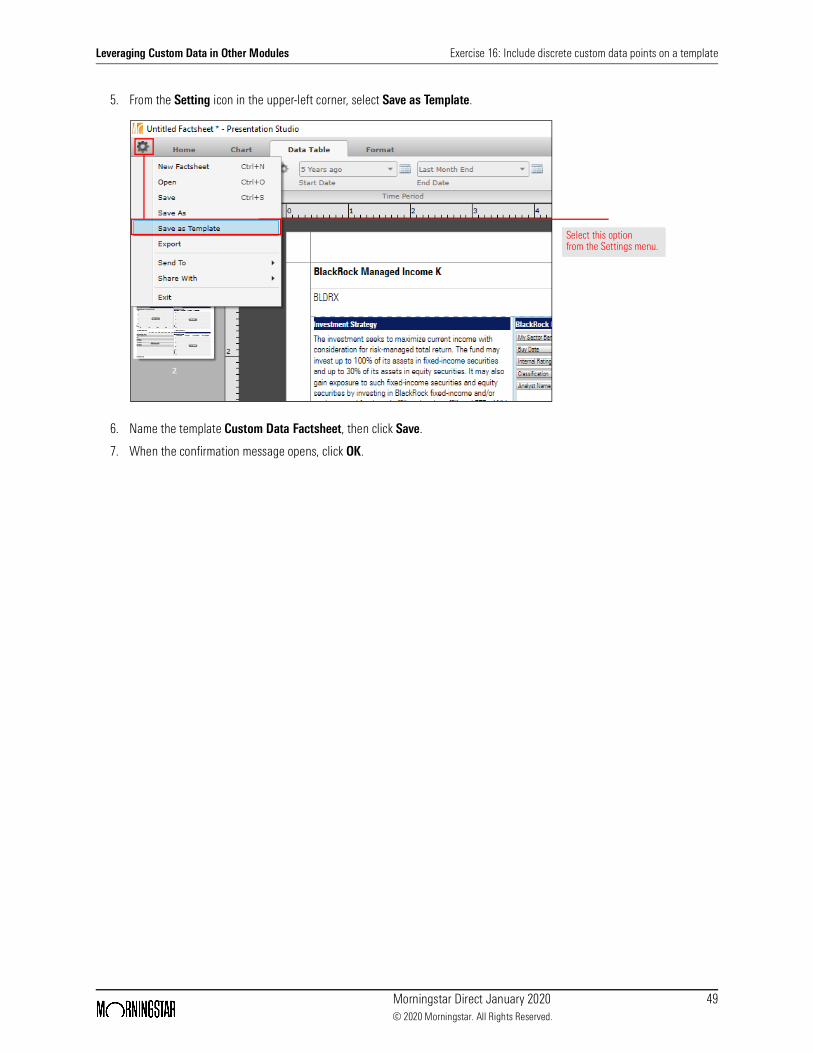
5. From the Setting icon in the upper-left corner, select Save as Template.
6. Name the template Custom Data Factsheet, then click Save.
7. When the confirmation message opens, click OK.
Select this option from the Settings menu.
Leveraging Custom Data in Other Modules Exercise 17: Use a composition custom data point in a template
Morningstar Direct January 2020 50© 2020 Morningstar. All Rights Reserved.
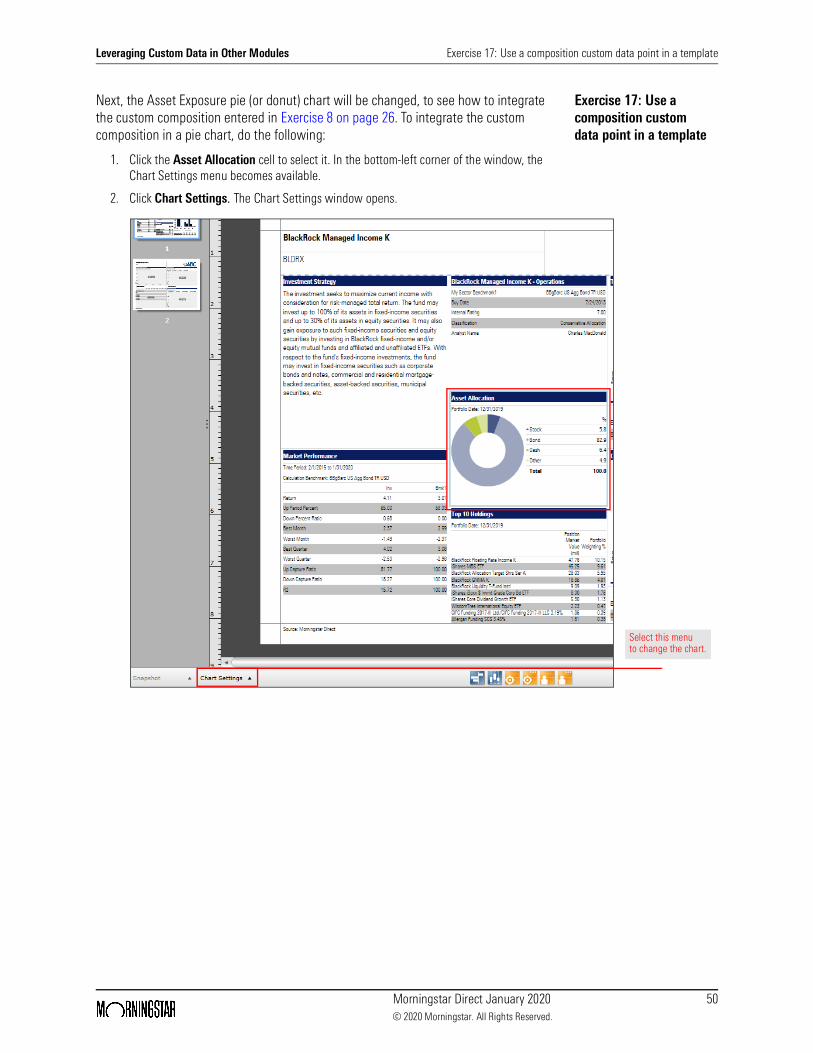
Exercise 17: Use a composition custom data point in a template
Next, the Asset Exposure pie (or donut) chart will be changed, to see how to integrate the custom composition entered in Exercise 8 on page 26. To integrate the custom composition in a pie chart, do the following:
1. Click the Asset Allocation cell to select it. In the bottom-left corner of the window, the Chart Settings menu becomes available.
2. Click Chart Settings. The Chart Settings window opens.
Select this menu to change the chart.
Leveraging Custom Data in Other Modules Exercise 17: Use a composition custom data point in a template
Morningstar Direct January 2020 51© 2020 Morningstar. All Rights Reserved.
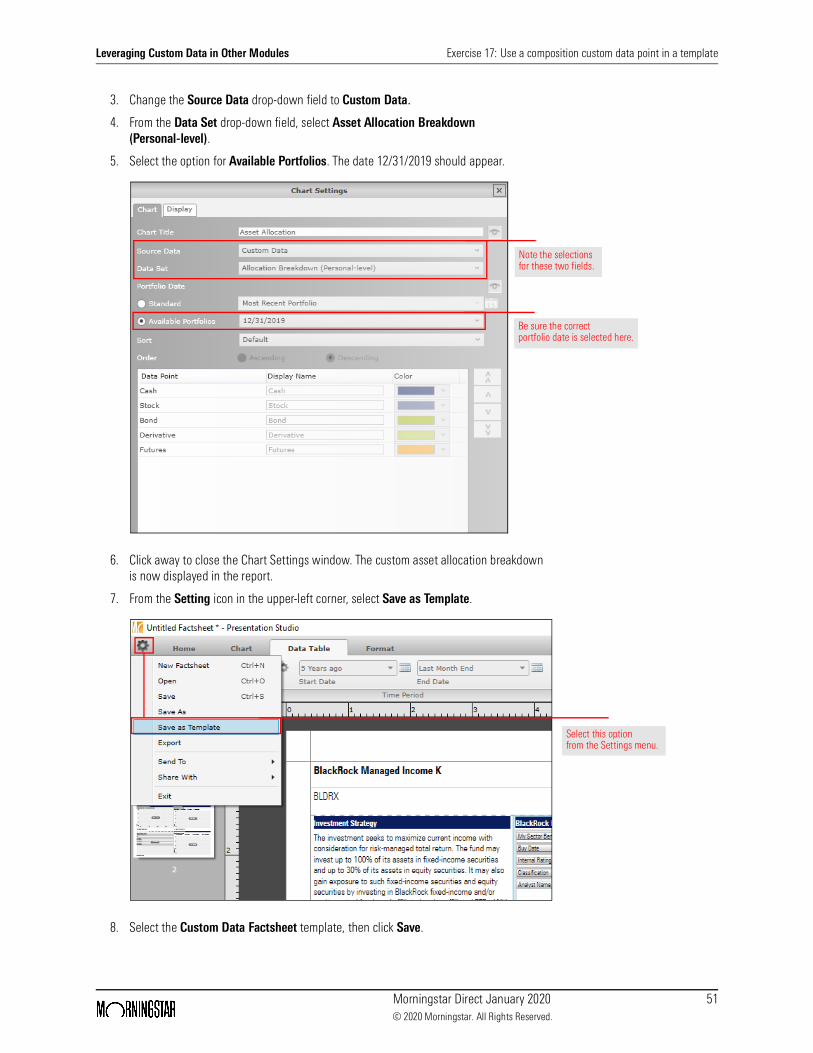
3. Change the Source Data drop-down field to Custom Data.
4. From the Data Set drop-down field, select Asset Allocation Breakdown (Personal-level).
5. Select the option for Available Portfolios. The date 12/31/2019 should appear.
6. Click away to close the Chart Settings window. The custom asset allocation breakdown is now displayed in the report.
7. From the Setting icon in the upper-left corner, select Save as Template.
8. Select the Custom Data Factsheet template, then click Save.
Note the selections for these two fields.
Be sure the correct portfolio date is selected here.
Select this option from the Settings menu.
Leveraging Custom Data in Other Modules Exercise 18: Use custom historical time series data points
Morningstar Direct January 2020 52© 2020 Morningstar. All Rights Reserved.
9. When the overwrite warning opens, click Yes.
10. When the confirmation message opens, click OK.
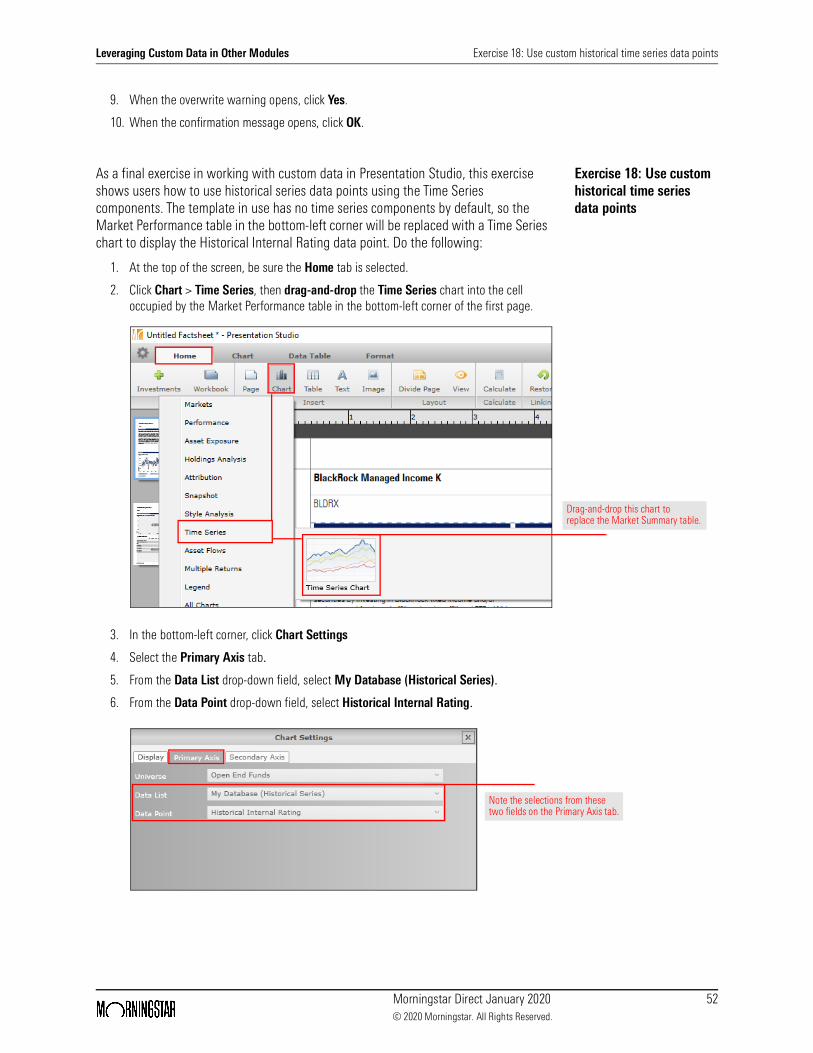
Exercise 18: Use custom historical time series data points
As a final exercise in working with custom data in Presentation Studio, this exercise shows users how to use historical series data points using the Time Series components. The template in use has no time series components by default, so the Market Performance table in the bottom-left corner will be replaced with a Time Series chart to display the Historical Internal Rating data point. Do the following:
1. At the top of the screen, be sure the Home tab is selected.
2. Click Chart > Time Series, then drag-and-drop the Time Series chart into the cell occupied by the Market Performance table in the bottom-left corner of the first page.
3. In the bottom-left corner, click Chart Settings
4. Select the Primary Axis tab.
5. From the Data List drop-down field, select My Database (Historical Series).
6. From the Data Point drop-down field, select Historical Internal Rating.
Drag-and-drop this chart to replace the Market Summary table.
Note the selections from these two fields on the Primary Axis tab.
Leveraging Custom Data in Other Modules Exercise 18: Use custom historical time series data points
Morningstar Direct January 2020 53© 2020 Morningstar. All Rights Reserved.
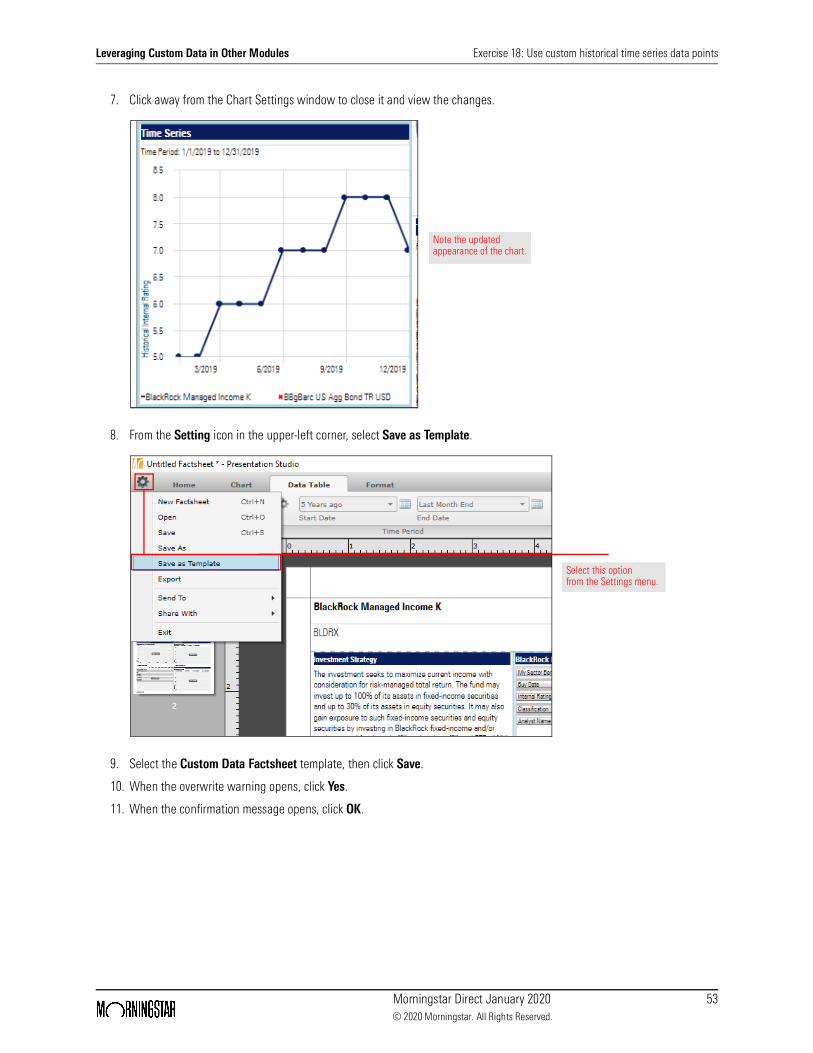
7. Click away from the Chart Settings window to close it and view the changes.
8. From the Setting icon in the upper-left corner, select Save as Template.
9. Select the Custom Data Factsheet template, then click Save.
10. When the overwrite warning opens, click Yes.
11. When the confirmation message opens, click OK.
Note the updated appearance of the chart.
Select this option from the Settings menu.