quick earthquake damage detection system for … · quick earthquake damage detection system for...
TRANSCRIPT
Quick Earthquake Damage Detection System for Bridges
by
Junichi Sakai1 and Shigeki Unjoh2 ABSTRACT When an extreme earthquake occurs, roads and bridges are fundamental infrastructures to evacuate the affected people and to transport the emergency equipment and materials. For these emergency activities, it is essential to detect immediately after the earthquake the severe structural damage that affects the performance of structures. This paper proposes a method for quick earthquake damage detection/evaluation of reinforced concrete bridge columns, which has been developed through investigations of dynamic response properties of reinforced concrete bridge columns obtained from shake table tests. An intelligent sensor unit was developed that captures changes of response period of a bridge column. Field measurements of traffic induced vibrations of bridges were also conduced to evaluate the efficiency and to improve the applicability of the proposed method. KEYWORDS: Earthquake Damage, Damage Detection, Intelligent Sensor Unit, Reinforced Concrete Bridge Column 1. INTRODUCTION When an extreme earthquake occurs, it is significant to ensure the emergency road network to evacuate the affected people and to transport the emergency equipment and materials. In particular, bridges are fundamental structures in the network because the damaged bridges are likely to result in long-term closer of the road. For these emergency activities, it is essential to obtain the information of the structural safety and serviceability of bridge structures immediately after the event and to conduct repair works as soon as possible if needed. Therefore, there is a strong need to develop a
method for quick detection and evaluation of severe damage that affects the structural safety and serviceability, and also a method for subsequent rapid repair works. The authors have been conducting research projects for developing these methods for bridge structures, and have proposed rapid repair methods [1] for the latter part of the project. In terms of the earthquake damage detection, detection/evaluation of the degree of damage and structural safety of bridge structures are currently done by visual inspection of experts; however, there are various problems on this procedure, such as: the lack of uniform standards for quantitative evaluation of the degree of damage, the difficulty of visual inspection for underground/underwater structures, and the time-consuming process for gathering and analyzing the information with a limited number of personnel. Therefore, it is necessary to develop a method for accurate and speedy determination of the degree of damage without experts’ inspection. For detecting and evaluating the seismic damage without visual inspections, research projects have been conducted to develop sensing technologies in two approaches. One is a method to evaluate the change of the global dynamic response, and the other is a method to detect a local damage. Kiremidjian et al. have proposed statistical pattern recognition based damage detection algorithms, and verified its efficiency by analyzing the data from a real three span prestressed concrete frame type bridge [2]. Some researchers proposed detection 1 Senior Researcher, Bridge and Structural Technology Research Group, Center for Advanced Engineering Structural Assessment and Research, Public Works Research Institute, Tsukuba, Ibaraki, 305-8516, Japan 2 Research Coordinator for Earthquake Disaster Prevention, Research Center for Disaster Risk Management, National Institute of Land and Infrastructure Management, Tsukuba, Ibaraki, 305-0804, Japan
GirderGirder
BridgeColumn
Intelligent Sensor Unit
Note PC
WirelessTransmission
Relay Box Patrol Car
200 mm
200
mm
Height: 100 mmWeight: 2.9 kg
Antenna for Wireless Transmission
Display
Battery
MotherboardD/A converter etc.
Servo Accelerometers
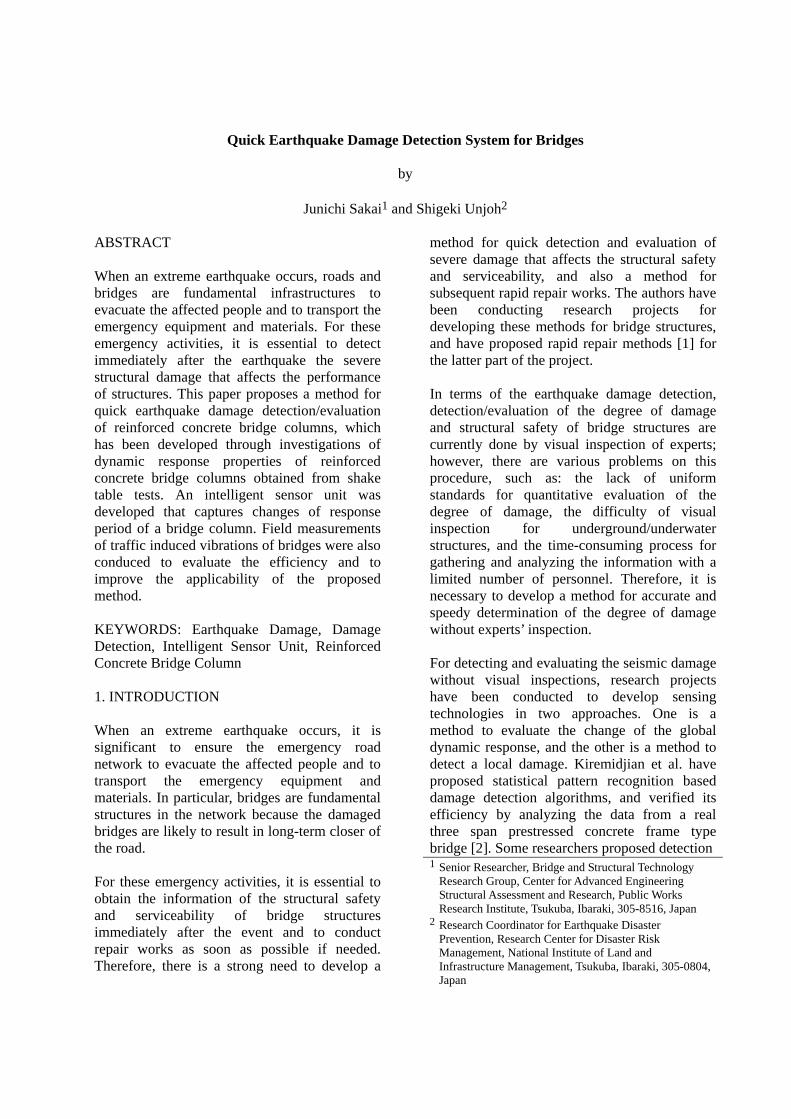
Figure 1 Seismic Damage Detection System Figure 2 Prototype Intelligent Sensor Unit methods by measuring vibration characteristics [3] [4] [5]. Nihei et al. have proposed a method by measuring a maximum response rotation at column-beam connection for frame type bridge columns [6]. On the other hand, some researchers proposed methods to detect local damage of structures, such as concrete cracking, strain distribution, etc, by utilizing optical fiber sensors, or sensors made of new materials [7] [8] [9]. The authors have also been conducting a research project to develop a method to detect seismic damage by capturing the changes of vibration characteristics of global response [10] [11] because the global behavior generally has stronger correlation with the serviceability and safety of the structures. In this paper, an algorithm estimating seismic damage of reinforced concrete bridge columns by measuring the change of response natural period is proposed. The method estimating the response ductility was developed through the analyses of shake table test results of reinforced concrete bridge column models. The field measurements were also conducted to evaluate the efficacy and the applicability of the proposed method. 2. DAMAGE DETECTION SYSTEM Figure 1 shows the damage detection system proposed in this research project [11]. This is a system intended to be used by road administrators for an emergency patrol after the
big event. The system contains an intelligent sensor unit that includes an accelerometer and a microcomputer, a relay box (if necessary), and a personal computer that indicates results. The key features of the system are: Ability for quick damage detection, Easy handling of sensor units, Low cost for manufacture and installation, Ability for obtaining the information of
bridge damage in a running patrol car, and Emergency battery in case of electrical
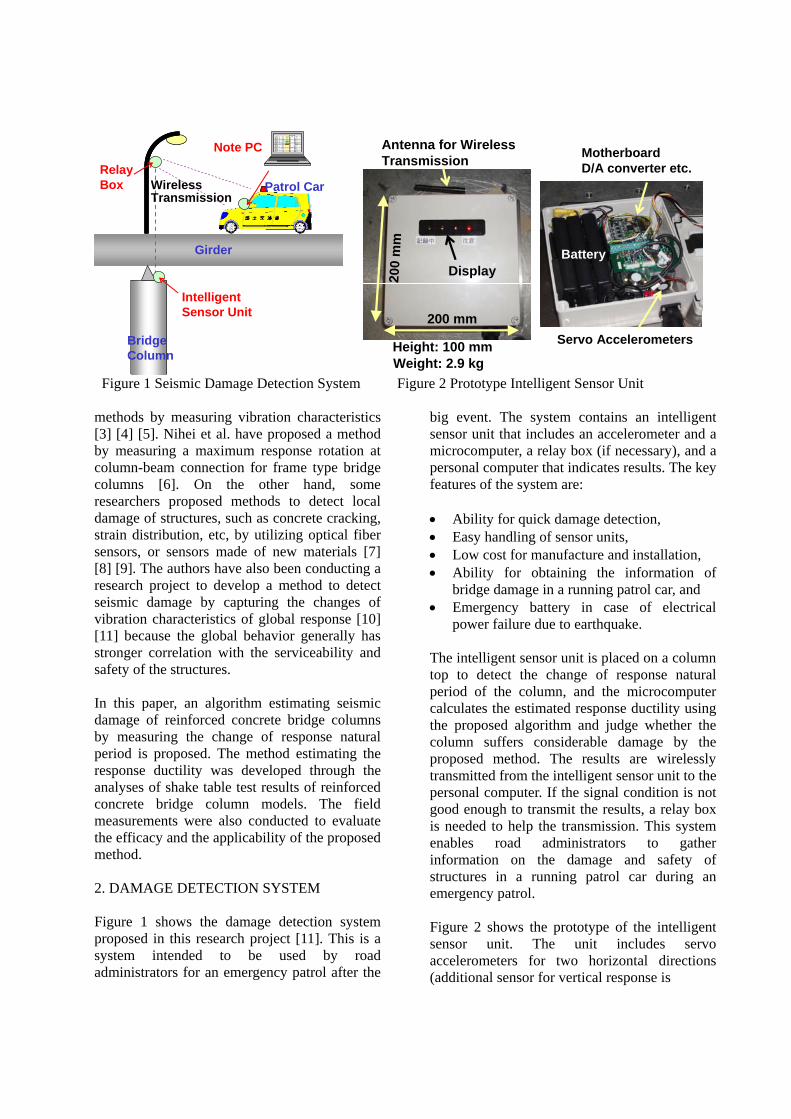
power failure due to earthquake. The intelligent sensor unit is placed on a column top to detect the change of response natural period of the column, and the microcomputer calculates the estimated response ductility using the proposed algorithm and judge whether the column suffers considerable damage by the proposed method. The results are wirelessly transmitted from the intelligent sensor unit to the personal computer. If the signal condition is not good enough to transmit the results, a relay box is needed to help the transmission. This system enables road administrators to gather information on the damage and safety of structures in a running patrol car during an emergency patrol. Figure 2 shows the prototype of the intelligent sensor unit. The unit includes servo accelerometers for two horizontal directions (additional sensor for vertical response is
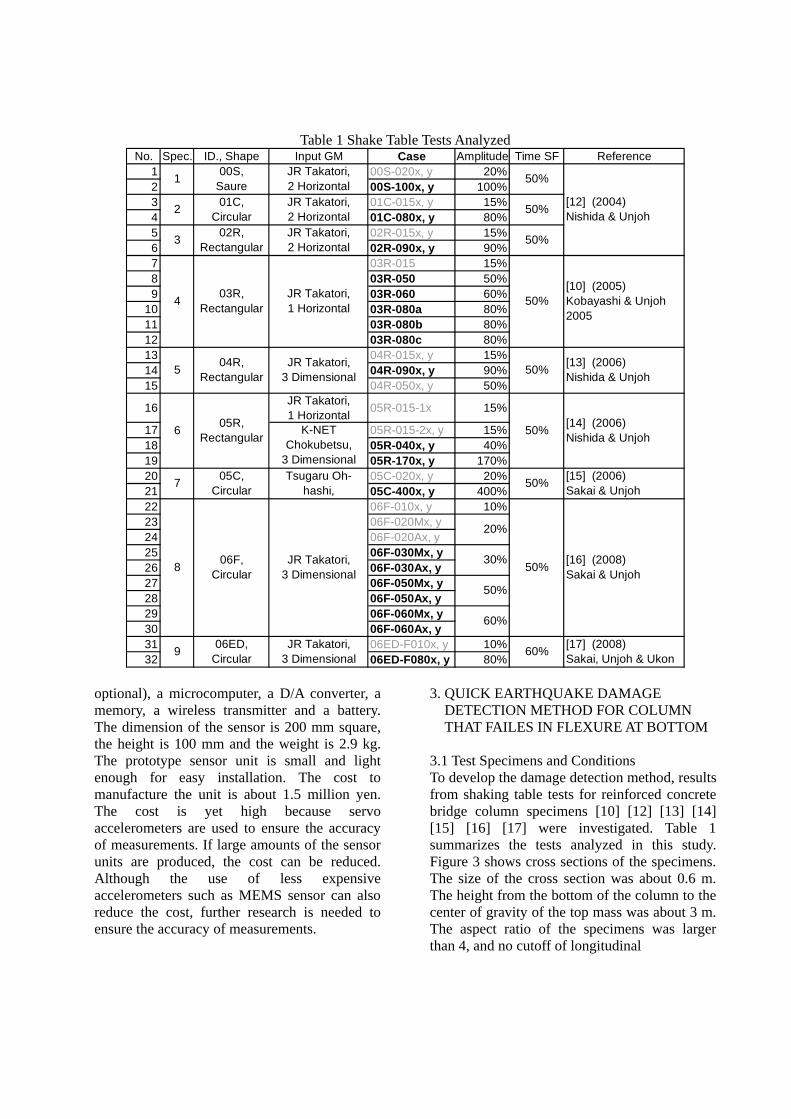
Table 1 Shake Table Tests Analyzed No. Spec. ID., Shape Input GM Case Amplitude Time SF Reference
1 00S-020x, y 20%2 00S-100x, y 100%3 01C-015x, y 15%4 01C-080x, y 80%5 02R-015x, y 15%6 02R-090x, y 90%7 03R-015 15%8 03R-050 50%9 03R-060 60%
10 03R-080a 80%11 03R-080b 80%12 03R-080c 80%13 04R-015x, y 15%14 04R-090x, y 90%15 04R-050x, y 50%
16JR Takatori,1 Horizontal
05R-015-1x 15%
17 05R-015-2x, y 15%18 05R-040x, y 40%19 05R-170x, y 170%20 05C-020x, y 20%21 05C-400x, y 400%22 06F-010x, y 10%23 06F-020Mx, y24 06F-020Ax, y25 06F-030Mx, y26 06F-030Ax, y27 06F-050Mx, y28 06F-050Ax, y29 06F-060Mx, y30 06F-060Ax, y31 06ED-F010x, y 10%32 06ED-F080x, y 80%
[12] (2004)Nishida & Unjoh
50%
100S,
SaureJR Takatori,2 Horizontal
201C,
CircularJR Takatori,2 Horizontal
50%
50%302R,
RectangularJR Takatori,2 Horizontal
[13] (2006)Nishida & Unjoh
50%[10] (2005)Kobayashi & Unjoh2005
403R,
RectangularJR Takatori,1 Horizontal
605R,
Rectangular50%
504R,
RectangularJR Takatori,
3 Dimensional50%
50%[15] (2006)Sakai & Unjoh
K-NETChokubetsu,
3 Dimensional
[14] (2006)Nishida & Unjoh
806F,
CircularJR Takatori,
3 Dimensional
705C,
CircularTsugaru Oh-
hashi,
50%[16] (2008)Sakai & Unjoh
20%
30%
50%
60%
60%[17] (2008)Sakai, Unjoh & Ukon
906ED,
CircularJR Takatori,
3 Dimensional optional), a microcomputer, a D/A converter, a memory, a wireless transmitter and a battery. The dimension of the sensor is 200 mm square, the height is 100 mm and the weight is 2.9 kg. The prototype sensor unit is small and light enough for easy installation. The cost to manufacture the unit is about 1.5 million yen. The cost is yet high because servo accelerometers are used to ensure the accuracy of measurements. If large amounts of the sensor units are produced, the cost can be reduced. Although the use of less expensive accelerometers such as MEMS sensor can also reduce the cost, further research is needed to ensure the accuracy of measurements.
3. QUICK EARTHQUAKE DAMAGE DETECTION METHOD FOR COLUMN THAT FAILES IN FLEXURE AT BOTTOM 3.1 Test Specimens and Conditions To develop the damage detection method, results from shaking table tests for reinforced concrete bridge column specimens [10] [12] [13] [14] [15] [16] [17] were investigated. Table 1 summarizes the tests analyzed in this study. Figure 3 shows cross sections of the specimens. The size of the cross section was about 0.6 m. The height from the bottom of the column to the center of gravity of the top mass was about 3 m. The aspect ratio of the specimens was larger than 4, and no cutoff of longitudinal

Figure 3 Typical Cross Sections of Specimens
Figure 4 Test Setup
reinforcement was provided to have all the specimens fail in flexure at the bottom of the column. The scale factor of the models was assumed to be 3 or 4. The time of ground motions was scaled using a scale factor considering the similitude requirements of each specimen. Figure 4 shows the test setup. Two types of setup were used; a single-column style setup and a setup with girders and bearings. For the single-column setup, the mass block modeling the inertia mass and axial force of a superstructure was directly fixed to the top of the columns. For the girder-bearing setup, the girders that the mass blocks were fixed onto were supported by fixed bearings on the top of the column and a longitudinal-movable/ transverse-fixed bearing at each end. In this study, the response at the center of gravity of the inertia mass was analyzed for the tests with single-column setup while the response at the
top of the column was analyzed for the tests with the girder-bearing setup. Each shake table test had two phases; one was for dynamic response in elastic range, and the other was for that in nonlinear range. Because the method was developed to estimate the damage, only tests for nonlinear response, which are 19 test cases from 32 cases shown in Table 1, were used in the analysis. As shown in Table 1, 8 specimens were tested under two horizontal (+ vertical) ground motions. Thus, total cases analyzed are 33 cases because each horizontal response was analyzed individually without consideration of interaction of two horizontal responses. For the rectangular columns, the stronger axis was defined as x axis while the weaker axis was defined as y axis. The ground motions recorded at the JR Takatori Station during the 1995 Hyogo-ken Nanbu, Japan, earthquake (Kobe earthquake), which is
Girder
Steel Block
Specimen
Bearings
Single-Column Setup Girder-Bearing Setup
0
Acc
eler
atio
n(m
/se
c2)
10
-10
Input Ground Motion
Input Ground Motion
Input Ground Motion
0
10
-10
Acc
eler
atio
n(m
/sec
2) Acceleration
Response
AccelerationResponse
Response Acceleration
-200
0
200
0 10 20 30
Dis
pla
cem
ent
(mm
)
Time (sec)
DisplacementResponse
0 10 20 30
Time (sec)
DisplacementResponse
0 10 20 30 40 50
Response Displacement
Time (sec)
-200 0 200
Acc
ele
ratio
n (m
/sec
2 )
Lateral Disp.(mm)
-6
0
-6
Response Hysteresis
Lateral Disp.(mm)-200 0 200
Response Hysteresis
-200 0 200
Lateral Disp.(mm)
Response Hysteresis
(a) 01C-080y (b) 02R-090y (c) 05C-400y
Figure 5 Dynamic Response of Specimen
Duration of FFT Analysis 2.5 sec 5 sec
0
1
2
0 10 20 30
Per
iod
(sec
)
Time (sec) 0 10 20 30
Time (sec) 0 10 20 30 40 50
Time (sec) (a) 01C-080y (b) 02R-090y (c) 05C-400y
Figure 6 Changes of Response Period Due to Flexural Damage commonly used as a near-field ground motion, was used in the most cases of the tests. Far field ground motions that have longer duration were used in some tests.
3.2 Dynamic Response and Change of Response Period
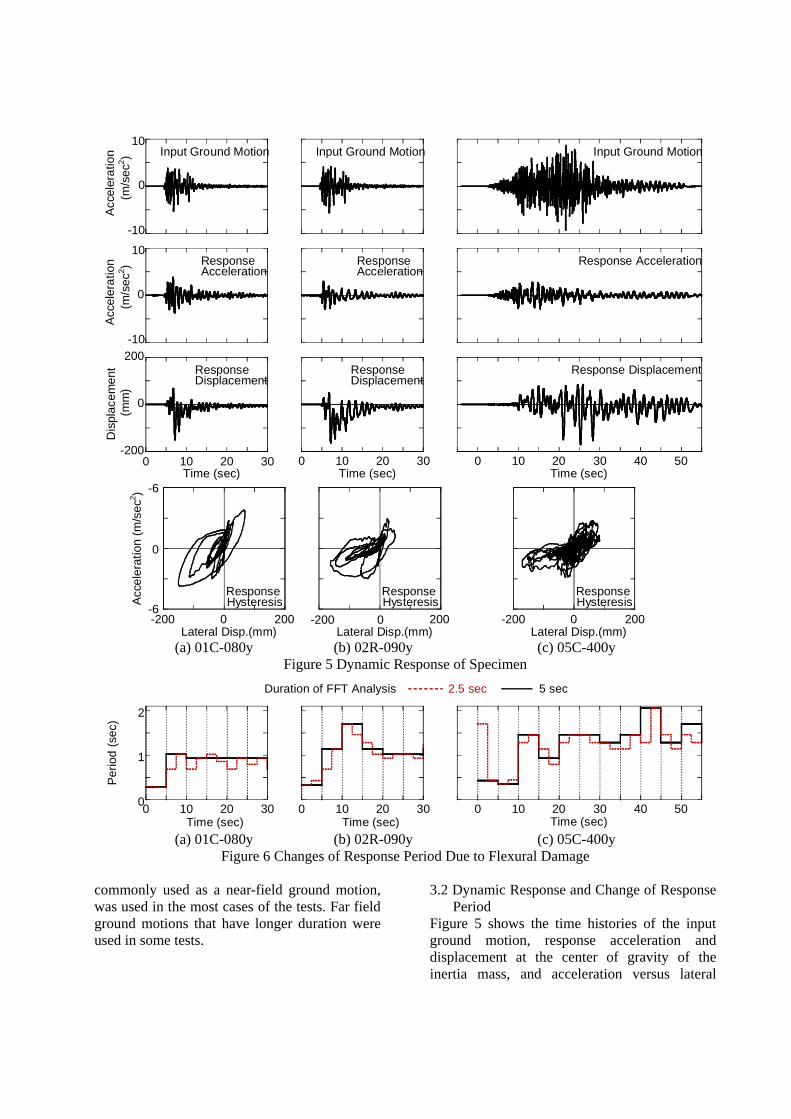
Figure 5 shows the time histories of the input ground motion, response acceleration and displacement at the center of gravity of the inertia mass, and acceleration versus lateral
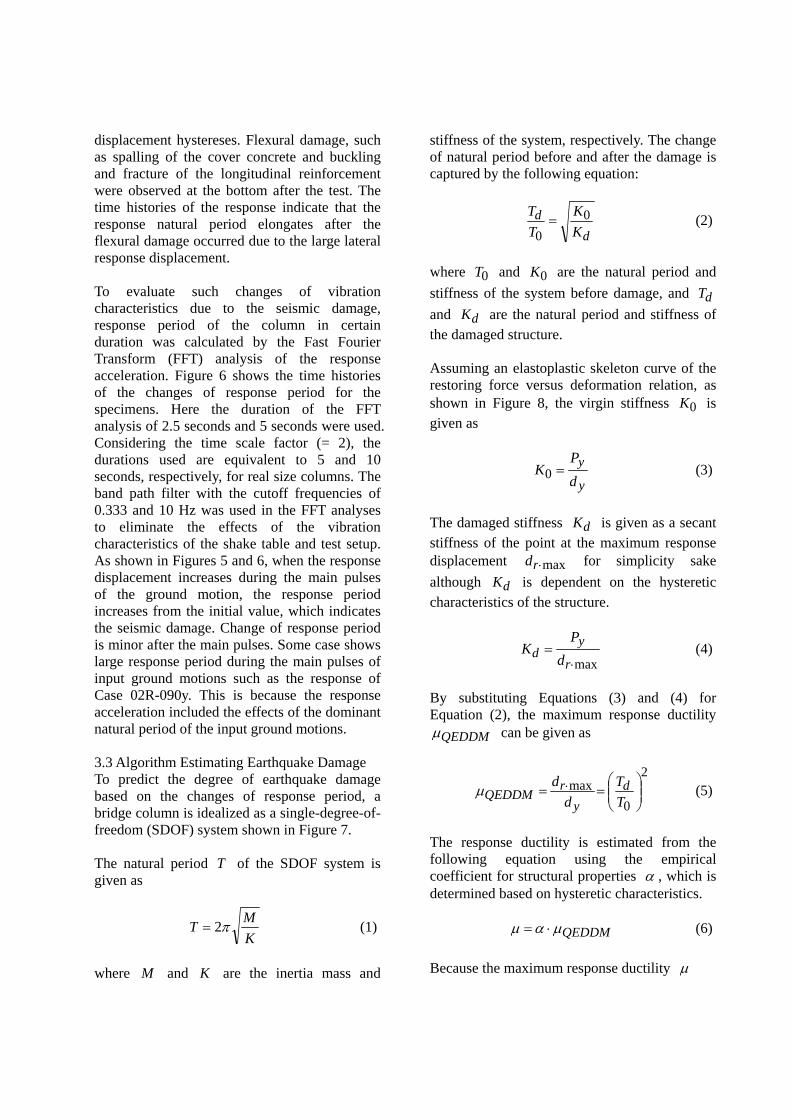
displacement hystereses. Flexural damage, such as spalling of the cover concrete and buckling and fracture of the longitudinal reinforcement were observed at the bottom after the test. The time histories of the response indicate that the response natural period elongates after the flexural damage occurred due to the large lateral response displacement. To evaluate such changes of vibration characteristics due to the seismic damage, response period of the column in certain duration was calculated by the Fast Fourier Transform (FFT) analysis of the response acceleration. Figure 6 shows the time histories of the changes of response period for the specimens. Here the duration of the FFT analysis of 2.5 seconds and 5 seconds were used. Considering the time scale factor (= 2), the durations used are equivalent to 5 and 10 seconds, respectively, for real size columns. The band path filter with the cutoff frequencies of 0.333 and 10 Hz was used in the FFT analyses to eliminate the effects of the vibration characteristics of the shake table and test setup. As shown in Figures 5 and 6, when the response displacement increases during the main pulses of the ground motion, the response period increases from the initial value, which indicates the seismic damage. Change of response period is minor after the main pulses. Some case shows large response period during the main pulses of input ground motions such as the response of Case 02R-090y. This is because the response acceleration included the effects of the dominant natural period of the input ground motions. 3.3 Algorithm Estimating Earthquake Damage To predict the degree of earthquake damage based on the changes of response period, a bridge column is idealized as a single-degree-of- freedom (SDOF) system shown in Figure 7. The natural period T of the SDOF system is given as
K
MT 2 (1)
where M and K are the inertia mass and
stiffness of the system, respectively. The change of natural period before and after the damage is captured by the following equation:
d
dK
K
T
T 0
0 (2)
where 0T and 0K are the natural period and
stiffness of the system before damage, and dT
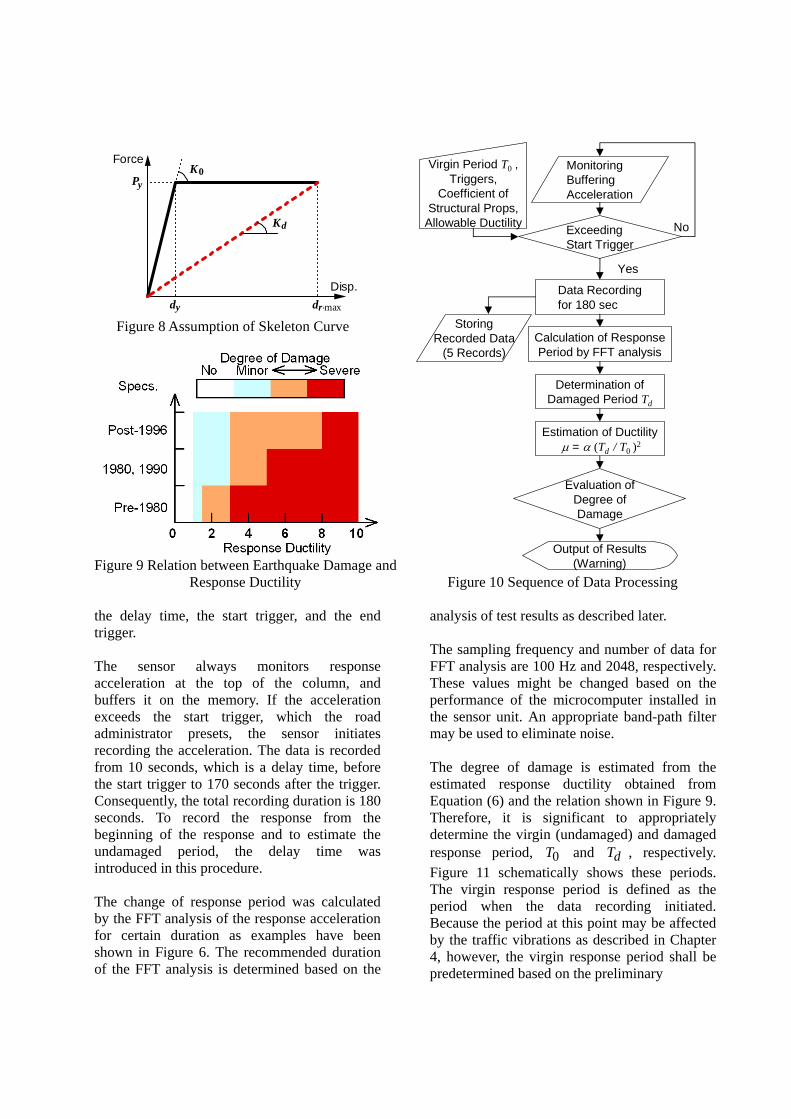
and dK are the natural period and stiffness of the damaged structure. Assuming an elastoplastic skeleton curve of the restoring force versus deformation relation, as shown in Figure 8, the virgin stiffness 0K is given as
y
y
d
PK 0 (3)
The damaged stiffness dK is given as a secant stiffness of the point at the maximum response displacement maxrd for simplicity sake
although dK is dependent on the hysteretic characteristics of the structure.
max
r
yd d
PK (4)
By substituting Equations (3) and (4) for Equation (2), the maximum response ductility
QEDDM can be given as
2
0
max
T
T
d
d d
y
rQEDDM (5)
The response ductility is estimated from the following equation using the empirical coefficient for structural properties , which is determined based on hysteretic characteristics. QEDDM (6)
Because the maximum response ductility
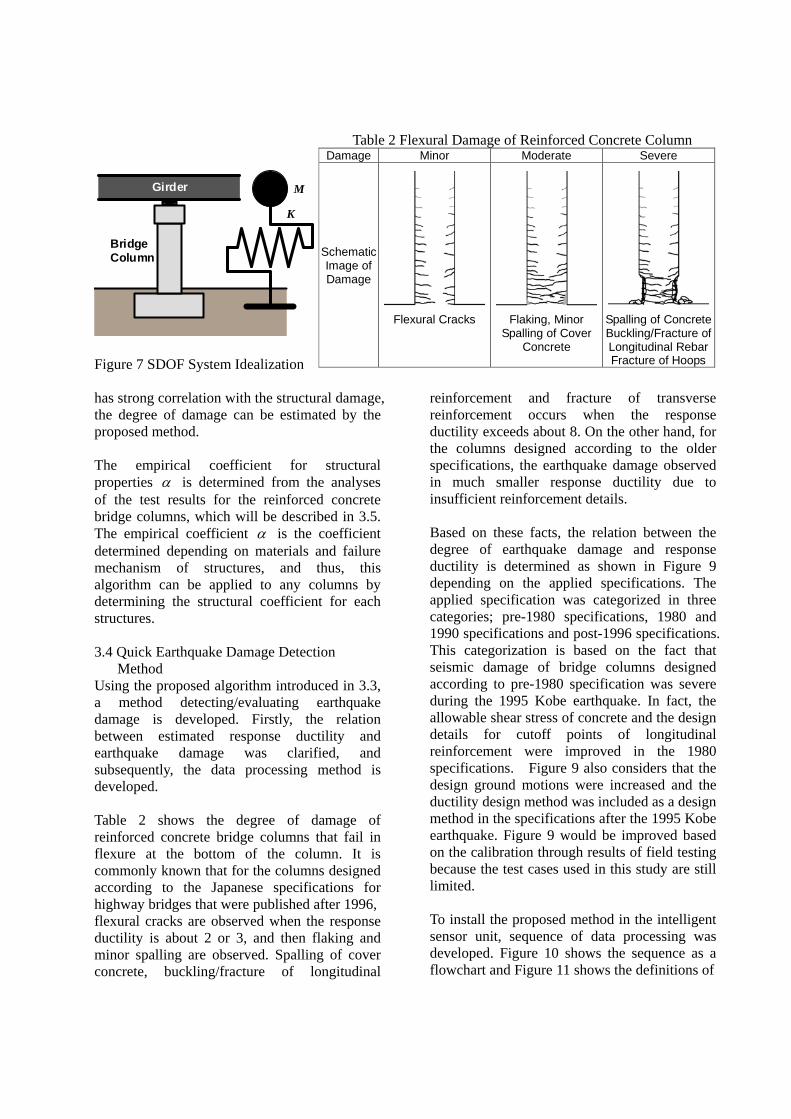
Table 2 Flexural Damage of Reinforced Concrete Column
Figure 7 SDOF System Idealization
Damage Minor Moderate Severe
SchematicImage ofDamage
Flexural Cracks
Flaking, Minor Spalling of Cover
Concrete
Spalling of ConcreteBuckling/Fracture of Longitudinal RebarFracture of Hoops
has strong correlation with the structural damage, the degree of damage can be estimated by the proposed method. The empirical coefficient for structural properties is determined from the analyses of the test results for the reinforced concrete bridge columns, which will be described in 3.5. The empirical coefficient is the coefficient determined depending on materials and failure mechanism of structures, and thus, this algorithm can be applied to any columns by determining the structural coefficient for each structures. 3.4 Quick Earthquake Damage Detection
Method Using the proposed algorithm introduced in 3.3, a method detecting/evaluating earthquake damage is developed. Firstly, the relation between estimated response ductility and earthquake damage was clarified, and subsequently, the data processing method is developed. Table 2 shows the degree of damage of reinforced concrete bridge columns that fail in flexure at the bottom of the column. It is commonly known that for the columns designed according to the Japanese specifications for highway bridges that were published after 1996, flexural cracks are observed when the response ductility is about 2 or 3, and then flaking and minor spalling are observed. Spalling of cover concrete, buckling/fracture of longitudinal
reinforcement and fracture of transverse reinforcement occurs when the response ductility exceeds about 8. On the other hand, for the columns designed according to the older specifications, the earthquake damage observed in much smaller response ductility due to insufficient reinforcement details. Based on these facts, the relation between the degree of earthquake damage and response ductility is determined as shown in Figure 9 depending on the applied specifications. The applied specification was categorized in three categories; pre-1980 specifications, 1980 and 1990 specifications and post-1996 specifications. This categorization is based on the fact that seismic damage of bridge columns designed according to pre-1980 specification was severe during the 1995 Kobe earthquake. In fact, the allowable shear stress of concrete and the design details for cutoff points of longitudinal reinforcement were improved in the 1980 specifications. Figure 9 also considers that the design ground motions were increased and the ductility design method was included as a design method in the specifications after the 1995 Kobe earthquake. Figure 9 would be improved based on the calibration through results of field testing because the test cases used in this study are still limited. To install the proposed method in the intelligent sensor unit, sequence of data processing was developed. Figure 10 shows the sequence as a flowchart and Figure 11 shows the definitions of
Girder
BridgeColumn
M
K
Py
dy dr max
K0
Kd
.
Disp.
Force
Figure 8 Assumption of Skeleton Curve
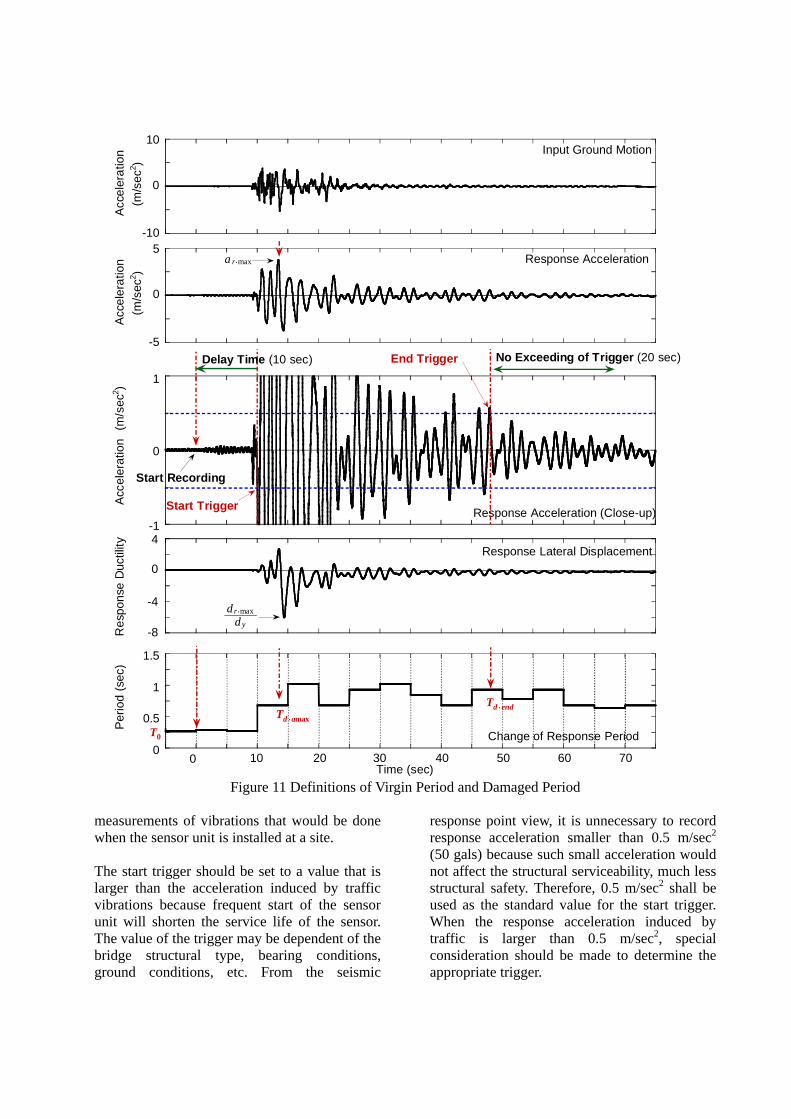
Figure 9 Relation between Earthquake Damage and Response Ductility Figure 10 Sequence of Data Processing the delay time, the start trigger, and the end trigger. The sensor always monitors response acceleration at the top of the column, and buffers it on the memory. If the acceleration exceeds the start trigger, which the road administrator presets, the sensor initiates recording the acceleration. The data is recorded from 10 seconds, which is a delay time, before the start trigger to 170 seconds after the trigger. Consequently, the total recording duration is 180 seconds. To record the response from the beginning of the response and to estimate the undamaged period, the delay time was introduced in this procedure. The change of response period was calculated by the FFT analysis of the response acceleration for certain duration as examples have been shown in Figure 6. The recommended duration of the FFT analysis is determined based on the
analysis of test results as described later. The sampling frequency and number of data for FFT analysis are 100 Hz and 2048, respectively. These values might be changed based on the performance of the microcomputer installed in the sensor unit. An appropriate band-path filter may be used to eliminate noise. The degree of damage is estimated from the estimated response ductility obtained from Equation (6) and the relation shown in Figure 9. Therefore, it is significant to appropriately determine the virgin (undamaged) and damaged response period, 0T and dT , respectively. Figure 11 schematically shows these periods. The virgin response period is defined as the period when the data recording initiated. Because the period at this point may be affected by the traffic vibrations as described in Chapter 4, however, the virgin response period shall be predetermined based on the preliminary
MonitoringBuffering Acceleration
ExceedingStart Trigger
Data Recordingfor 180 sec
Calculation of Response Period by FFT analysis
Determination of Damaged Period Td
Estimation of Ductility = (Td / T0 )
2
Evaluation of Degree of Damage
Output of Results(Warning)
Virgin Period T0 ,Triggers,
Coefficient ofStructural Props,
Allowable Ductility No
Yes
StoringRecorded Data
(5 Records)
0
Input Ground Motion10
-10
Acc
eler
atio
n
(m/s
ec2 )
0
Response Acceleration a r max.5
-5
Acc
eler
atio
n
(m/s
ec2 )
0
Response Acceleration (Close-up)Start Trigger
End TriggerDelay Time (10 sec) No Exceeding of Trigger (20 sec)
1
-1
Acc
ele
ratio
n(m
/sec
2 )
Start Recording
0
Re
spon
se D
uctil
ity Response Lateral Displacement4
dr max.-4
-8dy
0
0.5
1
1.5
Per
iod
(sec
)
Time (sec)
Change of Response PeriodT0
Td end
0 10 30 40 50 60 70
.Td amax.
20
Figure 11 Definitions of Virgin Period and Damaged Period measurements of vibrations that would be done when the sensor unit is installed at a site. The start trigger should be set to a value that is larger than the acceleration induced by traffic vibrations because frequent start of the sensor unit will shorten the service life of the sensor. The value of the trigger may be dependent of the bridge structural type, bearing conditions, ground conditions, etc. From the seismic
response point view, it is unnecessary to record response acceleration smaller than 0.5 m/sec2 (50 gals) because such small acceleration would not affect the structural serviceability, much less structural safety. Therefore, 0.5 m/sec2 shall be used as the standard value for the start trigger. When the response acceleration induced by traffic is larger than 0.5 m/sec2, special consideration should be made to determine the appropriate trigger.
0 5 10 15 20 25
1 m/s2 0.5 m/s2 0.25 m/s2
0
5
10
15
20
End Trigger
Ductility Estimated by Equation (5)
Mea
sure
d R
esp
onse
Duc
tility
0 5 10 15 20 25
10 sec5 sec
0
5
10
15
20
Duration of FFT Analysis
Ductility Estimated by Equation (5)
Mea
sure
d R
espo
nse
Duc
tility
(a) Effect of End Trigger (b) Effect of Duration of FFT analysis
Figure 12 Effect of End Trigger and Duration of FFT analysis
0 2 4 6 8 100
2
4
6
8
10
04R-090x
02R-090x
06EDx06EDy
02R-090y
03R-60
03R-50
05R-040y
06F-030Mx 06F-030Ax
Mx, Ax06F-050
06F-060Ay
06F-060My01C-080y
Mx, Ax06F-060 My, Ay
06F-050
06F-030My
06F-030Ay
05R-040x
= 1= 1.5
= 0.5
Ductility Estimated by Equation (5)
Mea
sure
d R
espo
nse
Duc
tility
0 5 10 15 20 25
0
5
10
15
20
05R-170x
01C-080y
00S-100x
04R-090y
03R-80-1,2,3
00S-100y
05R-170y
05C-400x
= 1= 1.5
= 0.5
05C-400y
Mea
sure
d R
espo
nse
Duc
tility
Ductility Estimated by Equation (5) (a) Results in Range of Ductility smaller than 10 (b) All Results
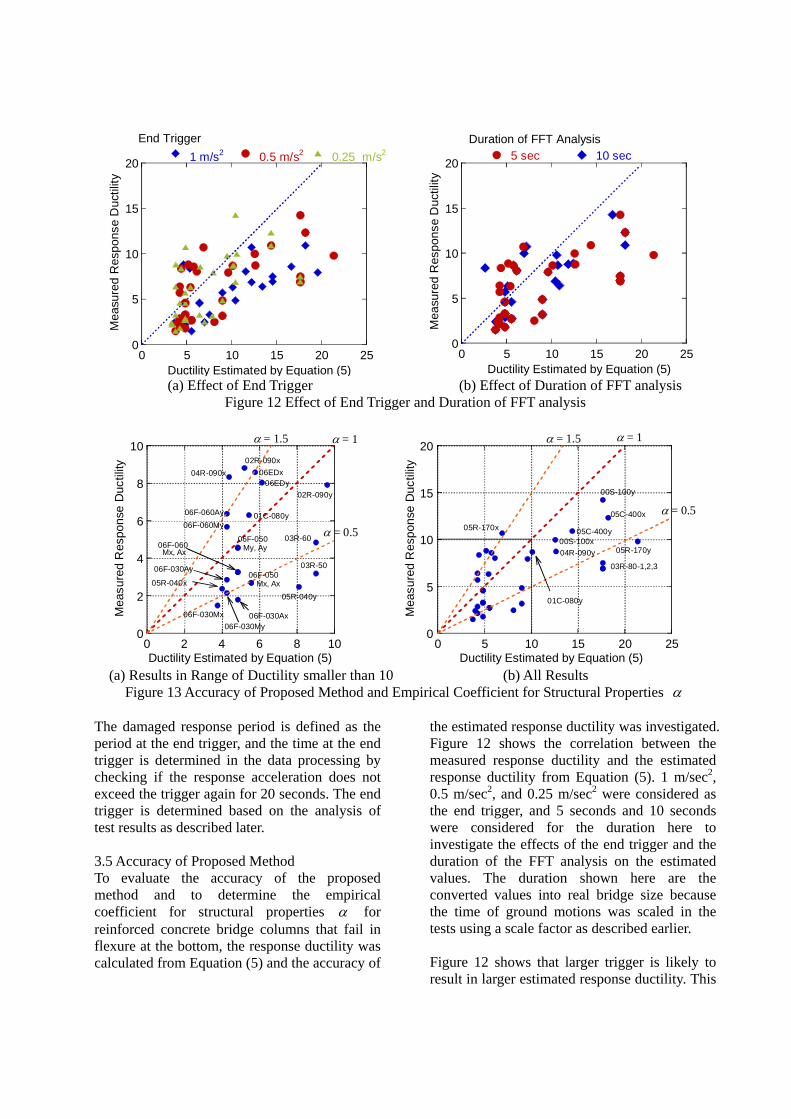
Figure 13 Accuracy of Proposed Method and Empirical Coefficient for Structural Properties The damaged response period is defined as the period at the end trigger, and the time at the end trigger is determined in the data processing by checking if the response acceleration does not exceed the trigger again for 20 seconds. The end trigger is determined based on the analysis of test results as described later. 3.5 Accuracy of Proposed Method To evaluate the accuracy of the proposed method and to determine the empirical coefficient for structural properties for reinforced concrete bridge columns that fail in flexure at the bottom, the response ductility was calculated from Equation (5) and the accuracy of
the estimated response ductility was investigated. Figure 12 shows the correlation between the measured response ductility and the estimated response ductility from Equation (5). 1 m/sec2, 0.5 m/sec2, and 0.25 m/sec2 were considered as the end trigger, and 5 seconds and 10 seconds were considered for the duration here to investigate the effects of the end trigger and the duration of the FFT analysis on the estimated values. The duration shown here are the converted values into real bridge size because the time of ground motions was scaled in the tests using a scale factor as described earlier. Figure 12 shows that larger trigger is likely to result in larger estimated response ductility. This
is because the response includes the characteristics of the input ground motion. If 0.5 m/sec2 and 0.25 m/sec2 are used for the end trigger, Equation (5) provides almost similar accuracy for the estimated ductility, which indicates that input ground motion characteristics do not have significant effects when the trigger of smaller than 0.5 m/sec2 is used. Consequently, the end trigger is set to the same value of the starting trigger, 0.5 m/sec2 (50 gals). This can be used as the standard value for the start and end triggers unless the traffic vibration induces larger response acceleration. The duration of the FFT analysis does not have significant effect on the accuracy. Because smaller duration captures changes of response periods better, the smaller duration, which is 5 seconds, is recommended. Figure 13 shows the accuracy of the estimated ductility that is computed when 0.5 m/sec2 and 5 seconds are used for the end trigger and the duration of the FFT analysis, respectively, and also shows the lines for the empirical coefficient for structural properties equal to 0.5, 1 and 1.5 for comparison. Values under these lines overestimate the response ductility by the proposed method while those over the lines underestimate. Figure 13 shows that the proposed method tends to estimate 2 times larger response ductility than the measured. Based on the regression analysis, 0.64 is obtained as the empirical coefficient for structural properties , and the coefficient of
determination 2R is 0.22. Figure 13 also shows that the method tends to underestimate the response ductility for the stronger axis of the columns of the rectangular section. This is because the effect of stiffness changes due to the seismic damage would be relatively small in stronger axis, which indicates the response of the column with the considerable earthquake damage tends to occur in the response in the weaker axis. Therefore, the regression analysis was conducted for the results excluding the response of the stronger axis of the rectangular columns. Consequently, the
coefficient of determination 2R was improved
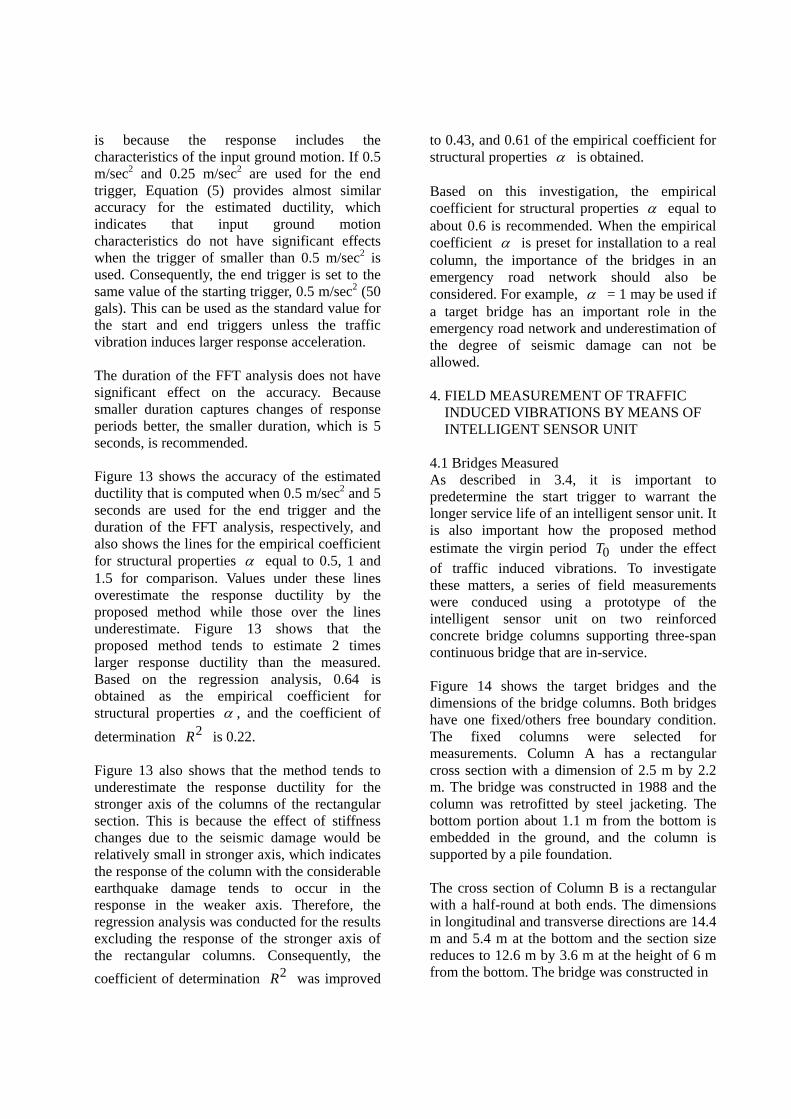
to 0.43, and 0.61 of the empirical coefficient for structural properties is obtained. Based on this investigation, the empirical coefficient for structural properties equal to about 0.6 is recommended. When the empirical coefficient is preset for installation to a real column, the importance of the bridges in an emergency road network should also be considered. For example, = 1 may be used if a target bridge has an important role in the emergency road network and underestimation of the degree of seismic damage can not be allowed. 4. FIELD MEASUREMENT OF TRAFFIC INDUCED VIBRATIONS BY MEANS OF INTELLIGENT SENSOR UNIT 4.1 Bridges Measured As described in 3.4, it is important to predetermine the start trigger to warrant the longer service life of an intelligent sensor unit. It is also important how the proposed method estimate the virgin period 0T under the effect of traffic induced vibrations. To investigate these matters, a series of field measurements were conduced using a prototype of the intelligent sensor unit on two reinforced concrete bridge columns supporting three-span continuous bridge that are in-service. Figure 14 shows the target bridges and the dimensions of the bridge columns. Both bridges have one fixed/others free boundary condition. The fixed columns were selected for measurements. Column A has a rectangular cross section with a dimension of 2.5 m by 2.2 m. The bridge was constructed in 1988 and the column was retrofitted by steel jacketing. The bottom portion about 1.1 m from the bottom is embedded in the ground, and the column is supported by a pile foundation. The cross section of Column B is a rectangular with a half-round at both ends. The dimensions in longitudinal and transverse directions are 14.4 m and 5.4 m at the bottom and the section size reduces to 12.6 m by 3.6 m at the height of 6 m from the bottom. The bridge was constructed in
(a) Column A
(b) Column B
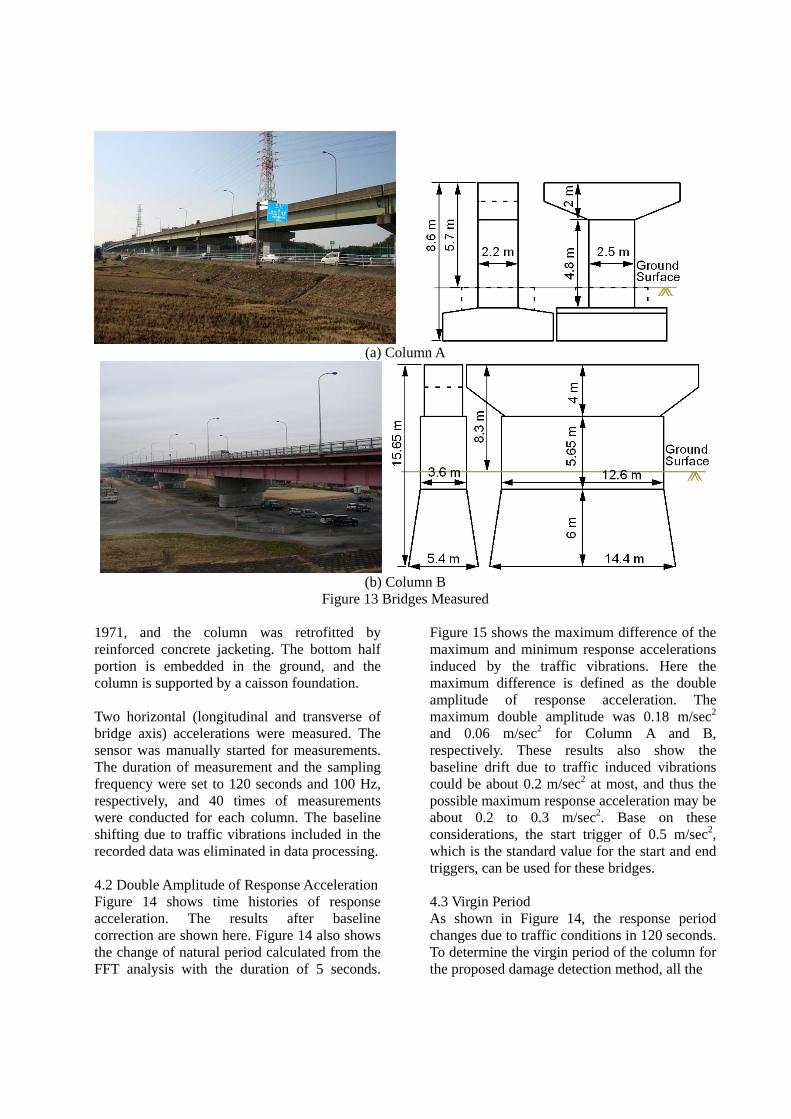
Figure 13 Bridges Measured 1971, and the column was retrofitted by reinforced concrete jacketing. The bottom half portion is embedded in the ground, and the column is supported by a caisson foundation. Two horizontal (longitudinal and transverse of bridge axis) accelerations were measured. The sensor was manually started for measurements. The duration of measurement and the sampling frequency were set to 120 seconds and 100 Hz, respectively, and 40 times of measurements were conducted for each column. The baseline shifting due to traffic vibrations included in the recorded data was eliminated in data processing. 4.2 Double Amplitude of Response Acceleration Figure 14 shows time histories of response acceleration. The results after baseline correction are shown here. Figure 14 also shows the change of natural period calculated from the FFT analysis with the duration of 5 seconds.
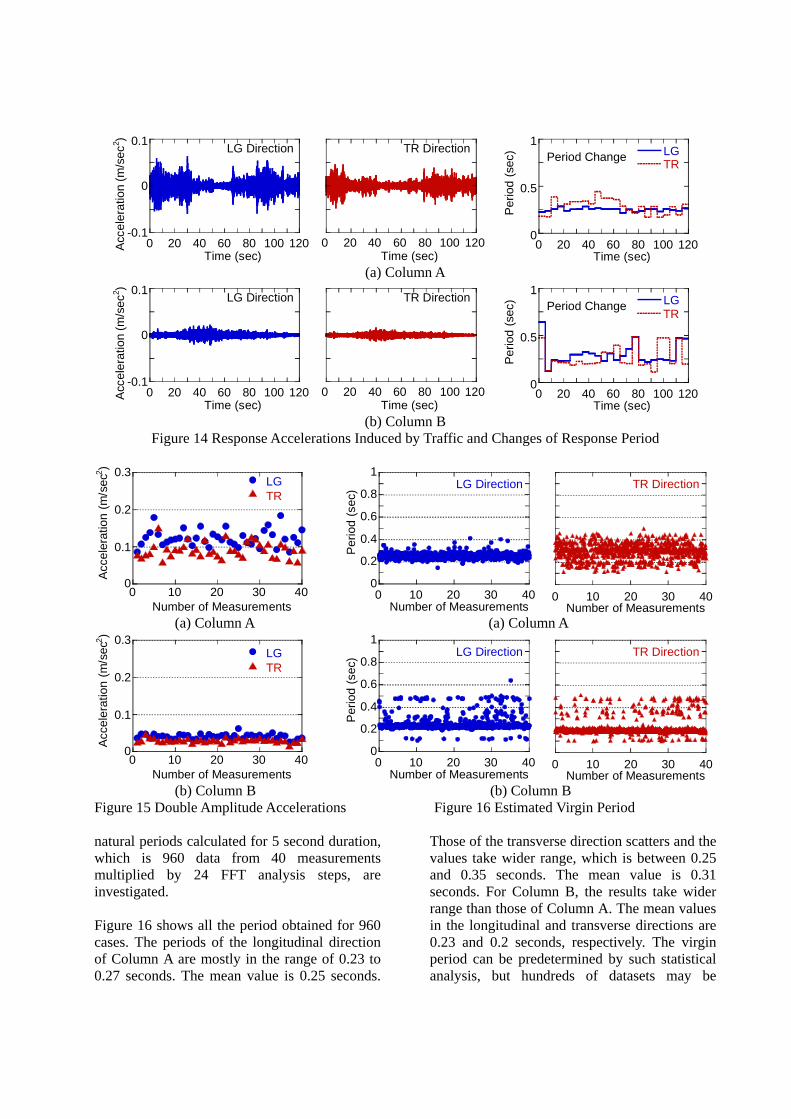
Figure 15 shows the maximum difference of the maximum and minimum response accelerations induced by the traffic vibrations. Here the maximum difference is defined as the double amplitude of response acceleration. The maximum double amplitude was 0.18 m/sec2 and 0.06 m/sec2 for Column A and B, respectively. These results also show the baseline drift due to traffic induced vibrations could be about 0.2 m/sec2 at most, and thus the possible maximum response acceleration may be about 0.2 to 0.3 m/sec2. Base on these considerations, the start trigger of 0.5 m/sec2, which is the standard value for the start and end triggers, can be used for these bridges. 4.3 Virgin Period As shown in Figure 14, the response period changes due to traffic conditions in 120 seconds. To determine the virgin period of the column for the proposed damage detection method, all the
0
0 20 40 60 80 100 120Acc
eler
atio
n(m
/sec
2 )
LG Direction0.1
-0.1
Time (sec) 0 20 40 60 80 100 120
Time (sec)
TR Direction
0
0.5
1LGTR
0 20 40 60 80 100 120
Pe
riod
(sec
)
Time (sec)
Period Change
(a) Column A
0
0 20 40 60 80 100 120Acc
eler
atio
n(m
/sec
2 )
LG Direction0.1
-0.1
Time (sec) 0 20 40 60 80 100 120
Time (sec)
TR Direction
0
0.5
1LGTR
0 20 40 60 80 100 120
Pe
riod
(sec
)
Time (sec)
Period Change
(b) Column B
Figure 14 Response Accelerations Induced by Traffic and Changes of Response Period
0
U• x U• y
0 10 20 30 40
Acc
eler
atio
n (m
/sec
2)
Number of Measurements
LGTR
0.3
0.2
0.1
0
0.2
0.4
0.6
0.8
1
0 10 20 30 40
Per
iod
(sec
) LG Direction
Number of Measurements 0 10 20 30 40
TR Direction
Number of Measurements (a) Column A (a) Column A
0
U• x U• y
0 10 20 30 40
Acc
eler
atio
n (m
/sec
2)
Number of Measurements
LGTR
0.3
0.2
0.1
0
0.2
0.4
0.6
0.8
1
0 10 20 30 40
Per
iod
(sec
) LG Direction
Number of Measurements 0 10 20 30 40
TR Direction
Number of Measurements (b) Column B (b) Column B Figure 15 Double Amplitude Accelerations Figure 16 Estimated Virgin Period natural periods calculated for 5 second duration, which is 960 data from 40 measurements multiplied by 24 FFT analysis steps, are investigated. Figure 16 shows all the period obtained for 960 cases. The periods of the longitudinal direction of Column A are mostly in the range of 0.23 to 0.27 seconds. The mean value is 0.25 seconds.
Those of the transverse direction scatters and the values take wider range, which is between 0.25 and 0.35 seconds. The mean value is 0.31 seconds. For Column B, the results take wider range than those of Column A. The mean values in the longitudinal and transverse directions are 0.23 and 0.2 seconds, respectively. The virgin period can be predetermined by such statistical analysis, but hundreds of datasets may be
needed because some scattering is included due to traffic conditions and this may depend on the bridge structural type, bearing conditions, ground conditions, etc. If the sensor unit is installed for an important bridge, and the scatter of the periods obtained from preliminary measurements is relatively large, special attention may be paid for predetermination of the virgin period. Smaller virgin period may be used in such a case to prevent underestimation of the damage because smaller virgin period results in larger estimated response ductility as shown in Equation (5). 5. CONCLUSIONS To develop a quick detection system of earthquake damage for structures, an algorithm estimating changes of natural period has been proposed. The method estimating the earthquake damage was investigated through the analyses of shake table test data of reinforced concrete bridge column models. The field measurements were conducted to evaluate the efficacy and the applicability of the proposed method. Below are the conclusions determined from the study: 1) The response natural period increases after the flexural damage due to the large deformation of the columns. Seismic damage of reinforced concrete bridge columns can be evaluated using natural period change. 2) The method estimating the response ductility using response period before and after damage was proposed. The relation between the degree of damage and response ductility depending on the applied specifications, and the sequence of data processing were also proposed. This method can be used for any structural type by determining the empirical coefficient for structural properties. 3) Through the analyses of shake table test results, the empirical coefficient for structural properties for reinforced concrete bridge column that fails in flexure at the bottom was determined to be 0.6. The start and end triggers and the duration of FFT analyses were also determined to be 0.5 m/sec2 and 5 seconds.
4) Field measurements verified that the 0.5 m/sec2 for the start and end triggers are appropriate. It is also found that the virgin period can be predetermined by statistical analysis, but hundreds of datasets may be needed because some scattering is included due to traffic conditions. 6. REFERENCES 1. Sakai, J. and Unjoh, S.: Shake Table Tests for
Development of Rapid Repair Method for Damaged Reinforced Concrete Bridge Columns, Proc. 6th International Conference on Urban Earthquake Engineering, pp. 601-606, Tokyo, Japan 2009.
2. Kiremidjian, A. S., Cheung, A., Sarabandi, P. and Nair, K.: Application of Damage Detection Algorithms to Bridge Filed Data, Proc. 23rd US-Japan Bridge Engineering Workshop, pp. 337-350, Tsukuba, Japan, 2007.
3. Seki, M., Nishimura, A., Sano, H. and Nakano, S.: Study on The Evaluation of Damage Levels of RC Rigid Frame Railway Bridges in The Case of Earthquake, J. Structure Mechanics and. Earthquake Engineering., JSCE, 731/I-63, 51-64., 2003. (in Japanese)
4. Uehan, F. and Meguro, K.: Experimental Research on Inspection Method for Damaged Structure Using Microtremor Measurement, Proc. of 11th Japan Earthquake Engineering Symposium, pp.1975-1980, Tokyo, Japan, 2002. (in Japanese)
5. Uehan, F. and Meguro, K.: Development of Non-Contact Microtremor Measuring Method for Vibration Diagnoses of Railway Structure, JSCE Journal of Earthquake Engineering, Vol. 27, CD-ROM No. 272, 2003. (in Japanese)
6. Nihei, T., Sogabe, M., Tanimura, Y., Sasaya, T., Hirano, K., Miyamoto, N. and Hamada, H.: Development of Damage Level Sensor System for Railway RC Rigid-frame Viaduct, J-RAIL 2007, pp. 183-186, 2007. (in Japanese)
7. Wu, Z. S. and Takahashi, T.: Damage Detection with Hybrid Sensors of Fiber

Optics and Composite Fibers, Proc. of the Japan Concrete Institute, Vol/24, No.1, pp.1647-1652, Vol.24, 2002. (in Japanese)
8. Chen, G., Mu, H., Pommerenke, D. and Drewniak, J. L.: Damage Detection of Reinforced Concrete Beams with Novel Distributed Crack/Strain Sensors, Structural Health Monitoring, Sage Publications, Vol.3 (3), pp. 225-243, 2004.
9. Sonehara, K., Yokoyama, K., Harada, T. and Tanabe, K.: Laboratory Test on Seismic Damage Detection Using PVDF Film Sensor, Proc. of 9th Motion and Vibration Control Symposium, JSME, Vol. 2005, No.9, pp.444-448, 2005. (in Japanese)
10. Kobayashi, H. and Unjoh, S.: Development of an earthquake damage detection system for bridge structures, Proc. 20th US-Japan Bridge Engineering Workshop, pp. 125-132, Washington D.C., USA, 2004.
11. Sakai, J., Kobayashi H. and Unjoh, S.: Quick earthquake damage detection method for bridge structures, Proc. of World Forum on Smart Materials and Smart Structures Technology, Chongqing, China, 2007.
12. Nishida, H. and Unjoh, S.: Dynamic response characteristic of reinforced concrete column subjected to bilateral earthquake ground motions, Proc. of 13th World Conference on Earthquake Engineering, CD-ROM No. 576, Vancouver, Canada, 2004.
13. Nishida, H. and Unjoh, S.: Shake Table Test for Rectangular RC Column Subjected to Three Dimensional Excitation, Proc. of 9th Symposium on Ductility Design Method for Bridges, pp. 327-330, 2006. (in Japanese)
14. Nishida, H. and Unjoh, S.: Applicability of fiber Model Analysis for Dynamic Response of Rectangular RC Column Subjected to Three Dimensional Excitation, Proc. of 12th Japan Earthquake Engineering Symposium, No. 0196, Tokyo, Japan, 2006. (in Japanese)
15. Sakai, J. and Unjoh, S.: Earthquake Simulation Test of Circular Reinforced Concrete Bridge Column under Multi- directional Seismic Excitation, Earthquake Engineering and Engineering Vibration, Vol.5, No.1, pp. 103-110, 2006.
16. Sakai, J. and Unjoh, S.: Shake Table Test for Development of Quick Repair Method for Seismic Damage of Reinforced Concrete Bridge Columns, Civil Engineering Journal, Public Works Research Center, Vol. 50, No. 9, pp. 30-35, 2008.
17. Sakai, J. and Unjoh, S.: Earthquake Simulation Tests of Bridge Column Models Damaged during 1995 Kobe Earthquake, Proc. of 14th World Conference on Earthquake Engineering, CD-ROM No. S17-02-001, Beijing, China, 2008.