quarterly report on the euro area - european commission
TRANSCRIPT

Economic and Financial Affairs
ISSN 2443-8014 (online)
INSTITUTIONAL PAPER 100 | MARCH 2019
• A retrospective look at sovereign bond dynamics in the euro area by Daniel Monteiro and Bořek Vašíček
• Completing the Capital Markets Union and its impact on economic resilience in the euro area by Eric Meyermans, Chris Uregian, Geert Van Campenhout and Diego Valiante
• The labour income share in the euro area by Elizaveta Archanskaia, Eric Meyermans and Anneleen Vandeplas
EUROPEAN ECONOMY
Quarterly Report on the Euro AreaVolume 17, No 4 (2018)

The Quarterly Report on the Euro Area is written by staff of the Directorate-General for Economic and Financial Affairs. It is intended to contribute to a better understanding of economic developments in the euro area and to improve the quality of the public debate surrounding the area's economic policy. The views expressed are the author’s alone and do not necessarily correspond to those of the European Commission. The Report is released every quarter of the year. Editors: Jose Eduardo Leandro, Gabriele Giudice Coordination: Zenon Kontolemis, Eric Meyermans Statistical and layout assistance: Despina Efthimiadou, Dris Rachik Comments on the report would be gratefully received and should be sent to: Unit A2 – EMU Deepening and Macroeconomy of the Euro Area European Commission Directorate-General for Economic and Financial Affairs Directorate Policy, Strategy and Communication Email: [email protected]
LEGAL NOTICE Neither the European Commission nor any person acting on behalf of the European Commission is responsible for the use that might be made of the information contained in this publication. This paper exists in English only and can be downloaded from https://ec.europa.eu/info/publications/economic-and-financial-affairs-publications_en. Luxembourg: Publications Office of the European Union, 2019 PDF ISBN 978-92-79-98847-9 ISSN 2443-8014 doi:10.2765/862807 KC-BC-19-007-EN-N
© European Union, 2019 Reuse is authorised provided the source is acknowledged. The reuse policy of European Commission documents is regulated by Decision 2011/833/EU (OJ L 330, 14.12.2011, p. 39). For any use or reproduction of material that is not under the EU copyright, permission must be sought directly from the copyright holders.

European Commission Directorate-General for Economic and Financial Affairs
Quarterly Report on the Euro Area Volume 17, No 4 (2018)
EUROPEAN ECONOMY Institutional Paper 100

Table of contents
Editorial 5
I. A retrospective look at sovereign bond dynamics in the euro area 7 I.1. Introduction 7 I.2. The evolution of euro area cross-border debt flows 9 I.3. A lookback at the evolution of bond prices in euro area countries 11 I.4. Conclusion 21
II. Completing the Capital Markets Union and its impact on economic resilience in the euro area 27 II.1. Introduction 27 II.2. Weak economic resilience in the past 28 II.3. State of Play: Towards a More Resilient European Financial Structure 30 II.4. How can CMU reduce vulnerability and strengthen shock absorption 34 II.5. How can CMU contribute to economic recovery 36 II.6. Conclusions 38
III. The labour income share in the euro area 41 III.1. Introduction 41 III.2. Labour share dynamics at the euro area and the Member State level 42 III.3. Determinants of labour shares: a brief literature review 44 III.4. Labour share dynamics in the euro area: a sectoral perspective 48 III.5. Determinants of sectoral labour share dynamics in the euro area 51 III.6. Conclusions and policy implications 56
Boxes I.1. Sovereign bond yield drivers in a fixed effects panel model 14 I.2. A time-varying parameter analysis of sovereign bond yields in euro area countries 23 I.3. Actual yields vs. predicted yields from CP FGLS, FE-CI and EA-6 models 26 II.1. Economic resilience 29 III.1. Labour income shares and wage dispersion 45 III.2. Towards empirical estimation 53
Editorial
Volume 17 No 4 | 5
The euro area economy grew at its fastest pace in a decade in 2017, but growth has moderated since then and the outlook is now less favourable as documented in the Winter Economic Forecast of the European Commission. The loss of momentum since last summer reflects the euro area’s sensitivity to weakening world trade as well as country- and sector-specific developments in recent months. Barring major shocks, we expect GDP to continue expanding, but at a slower pace, and the road ahead is fraught with uncertainty and numerous, interconnected risks. Most of these risks are political in nature (trade dispute between US and China, Brexit, fiscal policy uncertainty) so the right policies will help to defuse them. Against this background our economic policy recommendations for the euro area call for reforms to boost GDP potential and economic resilience, achieve an appropriate fiscal stance, differentiating according to available space, and promoting investment in countries with large current account surpluses. These actions will prepare the euro area economy to tackle future shocks.
This Quarterly Report on the Euro Area provides policy-oriented research on some important developments that affect the proper functioning of the euro area. Specifically, it examines the drivers and the dynamics of sovereign bond yields and flows over the past two decades, and it explores how completing the Capital Markets Union (CMU) could strengthen economic resilience in the euro area. Finally, it provides analysis of developments in the labour income share at national and sectoral level over the 2000-2017 period and considers the policy implications based on these trends.
The first section provides a retrospective of sovereign bond dynamics in the euro area Member States since the introduction of the euro, taking stock of both the price and flow dimensions. The crisis period was characterised by highly asymmetric dynamics across groups of euro area countries, which according to model-based results, appear to have been driven partly by fundamentals (e.g., differences in debt ratios) but also by other factors exacerbated by bouts of illiquidity and divergent and time-varying market sensitivities
with respect to the fundamentals. The latter are, among other things, suggestive of flights to safety. Unconventional monetary policy was as an important driver of yields in recent years, contributing to stabilising sovereign debt markets and bringing down overall bond yields. The empirical evidence also points to important instances of cross-border reversals in debt and bond flows in the wake of the 2007-2008 financial crisis, both within the euro area and with respect to the US.
The second section examines how a well-functioning, diversified and integrated Capital Markets Union can contribute to the strengthening of economic resilience in the euro area. The most direct positive effect of the CMU on resilience would come from the greater opportunities for risk dispersion and diversification that the cross-border holding of assets in a CMU will provide. A Capital Markets Union could also accelerate recoveries by facilitating the reallocation of resources and reducing financial market fragmentation and frictions that hamper the transmission of monetary policy in the euro area. However, in order to achieve this, certain barriers still need to be overcome including the corporate sector’s over-reliance on bank financing, the strong ‘home bias’ of credit and capital markets, a lack of transparency, and the fragmented nature of regulatory and institutional frameworks. The Capital Markets Union should also be complemented by other euro area level reforms, such as the introduction of a common budgetary capacity, further deepening of the Single Market and the completion of the Banking Union.
The third section analyses the evolution of the labour income share at the national and sectoral levels across euro area Member States for the 2000-2017 period. National labour income shares are strongly countercyclical, but there differences among countries and some evidence of convergence. For most euro area Member States, the evolution of the national labour share observed is attributable to intra-sectoral changes, particularly the reduction in the manufacturing sector and the increase in the business services sector. The results confirm that technological progress and capital deepening are the main
Marco Buti Director-General

6 | Quarterly Report on the Euro Area
determinants of sectoral labour shares. The findings reported in this section highlight the complexity of targeting the labour share directly using existing labour market policy instruments– if such a policy were desired.
Overall, the evidence provided in this edition of the QREA points to the need to boost the “indigenous”
engines of domestic growth - and relying less on the external environment – and to underpin the monetary union by a strong national and euro area institutional framework while also tackling challenges of inclusiveness more effectively. This would make the economy of the euro area more resilient and less exposed to external shocks.
I. A retrospective look at sovereign bond dynamics in theeuro area
Volume 17 No 4 | 7
I.1. Introduction
Sovereign bond markets are now completing two decades of existence under the single currency in several Member States. Throughout this period they have experienced distinct phases, from a period of quietude and synchronous dynamics before the global financial crisis, through years of turbulence and marked cross-country divergences, to a period of imperfect re-convergence in a context of resuming growth, an improved institutional framework and unconventional monetary policy.
Sovereign bond prices are generally expected to reflect the risk-free rate and a credit risk premium which is specific to the sovereign issuer. However, as discussed in the following subsections, a large body of economic literature has found that, besides these fundamental drivers, sovereign bond prices also reflect other factors, namely those related to bond market structure, liquidity and investor sentiment. Given the close linkages between euro area countries, such factors can have a significant euro area dimension.
A monetary union implies some particularities as to the role of sovereign funding costs. On one hand, the cost of funding complements fiscal rules and contributes to exert market pressure on Member
(1) This article was prepared by Daniel Monteiro and Bořek Vašíček.The authors wish to thank Gabriele Giudice, Anton Jevčák, Zenon Kontolemis and an anonymous referee for their useful comments.
States to enact responsible fiscal policies. On the other hand, excessive divergences and volatility in sovereign funding costs may hamper the transmission of monetary policy. In particular, sovereign funding costs affect bank funding costs and, in turn, lending rates to households and non-financial corporations. (2) This is related to three facts: (i) sovereign credit ratings usually represent the ceiling for other credit ratings in the same jurisdiction, (ii) the euro-area banking sector has a large exposure to sovereign bonds along with a significant degree of home bias and, (iii) in the euro area, bank credit represents the main source of financing of the private sector. The experience of the past two decades shows that a procyclical interest rate channel was at play both before and after the crisis, exacerbating differences in economic performance across Member States. (3)
Graph I.1 depicts the evolution of sovereign funding costs of selected euro area countries since the introduction of the common currency. It is possible to distinguish three structurally different periods. First, by the time the common currency
(2) In particular, firms that are more likely to benefit from government aid, those more concentrated in the domestic market, and those relying more heavily on bank financing are seen to have been affected more significantly by an increase in sovereign funding costs. See for example: Bedendo, M. and P. Colla (2015), ‘Sovereign and corporate credit risk: Evidence from the Eurozone’, Journal of Corporate Finance, Vol. 33, pp. 34-52.(3)
(3) Ruscher, E. and B. Vašíček (2015), 'Revisiting the Real Interest Rate Mechanism', Quarterly Report on the Euro Area, Vol. 14, No 4, pp. 33-48.
This section looks back at sovereign bond dynamics in the euro area over the past two decades, taking stock of both the price and flow dimensions. As regards cross-border flows, the 2008 crisis appears to have provoked, amongst its more immediate effects, investment fund outflows from EU bond markets. The years of the subsequent Great Recession witnessed a mutual retrenchment in the US and the EU from each other's international debt markets. At the same time, debt flow dynamics within the euro area largely reversed when compared with the pre-crisis period, with the countries more severely affected by the crisis experiencing outflows, as less vulnerable countries pulled back their cross-border debt investments. As regards bond prices, the crisis period was characterised by highly asymmetric dynamics across groups of euro area countries which – according to model-based results – appear to have been largely driven by differences in debt ratios, bouts of illiquidity and divergent market sensitivities, the latter being suggestive of flight-to-safety phenomena, among other factors. Panel model-based evidence is also suggestive of instances of price misalignment from fundamentals, in different moments and countries. Unconventional monetary policy is seen to have played an important role in stabilising sovereign debt markets since 2012. Overall, an institutional setup that can eliminate bouts of illiquidity, prevent market sensitivities from reacting in a divergent manner to yield drivers and remove redenomination risk could deliver significant stability benefits for the euro area. (1)

8 | Quarterly Report on the Euro Area
had been introduced, exchange rate risk had been fully eliminated and sovereign bond yields had almost perfectly converged for the euro-area Member States. Such alignment lasted until 2008, when sovereign funding costs started to significantly diverge amidst the global financial crisis and the consecutive euro area debt crisis. Finally, the ECB’s announcement of the Outright Monetary Transactions program in August 2012 represented a turning point in the euro area debt crisis and initiated a period of renewed, if imperfect, interest rate convergence, which was further supported by the economic recovery that started in 2013, by an on-going process of balance sheet repair in crisis-hit countries, by an improved institutional framework, as well as by the Eurosystem's Public Sector Purchase Programme, initiated in 2015.
Graph I.1: Evolution of 10-year sovereign bond yields in euro area countries
(1) Country sample comprises the 11 largest euro areaeconomies.Source: Eurostat
Graph I.2: Evolution of sovereign bond volumes in euro area countries
(1) Country sample comprises the 11 largest euro areaeconomies.Source: Eurostat
Graph I.2 reports the evolution of outstanding amount of sovereign bonds in selected euro area countries. Since the global financial crisis and until 2016, a general increase in outstanding bond amounts can be observed as government debt was on an increasing path until then. Greece represents an exception due to its debt restructuring and re-composition of liabilities towards loans under a financial assistance programme. While overall volumes increased, credit quality has decreased, with the amount of sovereign debt rated AAA and AA declining markedly (Graph I.3). 0
5
10
15
20
25
30
0
2
4
6
8
10
12
14
16
2000
2001
2002
2003
2004
2005
2006
2007
2008
2009
2010
2011
2012
2013
2014
2015
2016
2017
2018
%
AT BE DE ESFI FR IE ITNL PT EL (rhs)
0
20
40
60
80
100
120
140
2000
2001
2002
2003
2004
2005
2006
2007
2008
2009
2010
2011
2012
2013
2014
2015
2016
2017
2018
% o
f GDP
AT BE DE EL ES FIFR IE IT NL PT

I. A retrospective look at sovereign bond dynamics in the euro area
Volume 17 No 4 | 9
Graph I.3: Outstanding sovereign debt in the euro area, per credit rating
Source: Moody's, Eurostat, own calculations
This Section aims to provide a retrospective look at sovereign bond dynamics in the euro area countries since the introduction of the euro. It is structured as follows. Subsection I.2 first reviews the evolution of cross-border debt flows in the euro area. Subsection I.3 reviews the literature on the determinants of bond yields, as well as the euro area dimension of sovereign bond price dynamics. Moreover, it provides empirical evidence on these determinants based both on a standard panel regression as well as on a time-varying parameter model. The latter allows tracking both the impact of changes in each yield determinant, as well as changes in market sensitivities to these determinants, across Member States and across time. Subsection I.4 concludes and provides some tentative policy implications.
I.2. The evolution of euro area cross-border debt flows
Cross-border flows represent an alternative dimension to prices when analysing euro area
sovereign bond dynamics. In equilibrium, capital flows must reflect the confluence of push (supply-side) factors and pull (demand-side) factors so that it will be hard to attribute the observed flows exclusively to one side or the other. (4) The literature on cross-border flows has mainly focused on emerging markets, where it is generally more meaningful to consider the determinants of inflows that are abnormally large, referred to as ‘surges’. (5)
Cross-border debt data for the euro area shows that the crisis period witnessed a reversal from positive net debt inflows (6) to net debt outflows vis-à-vis the rest of the euro area in some of the debtor countries more severely affected by the crisis. These dynamics had their counterpart in creditor countries, where debt outflows are seen to have reversed into inflows from the rest of the euro area, or at least to move into balanced dynamics, with the onset of the crisis (see Graph I.4). (7)
(4) The determinants of financial flows can be broadly classified into
three categories of variables: 1. global or push factors (e.g., foreign growth, global interest rates, global liquidity, global risk, commodity prices and policy uncertainty), 2. domestic or pull (e.g., industrial production, domestic interest rates, inflation, equity returns, exchange rate dynamics and regime, trade openness, credit growth, stock market capitalisation and financial openness) and 3. contagion (i.e., mostly factors outside of country control such as geographical proximity, trade and financial linkages). See for example: Calderón, C., and M. Kubota (2013), ‘Sudden stops: Are global and local investors alike?’, Journal of International Economics, Vol. 89, No 1, pp. 122-142.
(5) Ghosh, A., M. Qureshi, J. Kim and J. Zalduendo (2014), ‘Surges’, Journal of International Economics, No 92, pp. 266–285.
(6) The financial flow data refers to overall bilateral debt flows between countries, irrespective of the institutional sector originating or receiving the flows. It includes portfolio investment and other investment (e.g., loans), but excludes official debt flows such as financial assistance and asset purchase programmes.
(7) Also, Bijlsma, M. and R. Vermeulen, R. (2016), ‘Insurance companies’ trading behaviour during the European sovereign debt crisis: Flight home or flight to quality?’, Journal of Financial Stability, Vol. 27, pp. 137-154 analyse whether Dutch insurers exhibit a flight to home or a flight to quality behaviour during the recent financial crisis using a detailed micro dataset. They find that these insurance companies engaged in procyclical investment behaviour during the height of the European debt crisis, selling periphery assets and investing into core assets, but not specifically of the Netherlands.
0%
20%
40%
60%
80%
100%
2007
Q1
2007
Q3
2008
Q1
2008
Q3
2009
Q1
2009
Q3
2010
Q1
2010
Q3
2011
Q1
2011
Q3
2012
Q1
2012
Q3
2013
Q1
2013
Q3
2014
Q1
2014
Q3
2015
Q1
2015
Q3
2016
Q1
2016
Q3
2017
Q1
2017
Q3
2018
Q1
% o
f eu
ro a
rea
GDP
AAA AA or higher Total
0
1
2
3
4
5
6
2007
Q1
2007
Q3
2008
Q1
2008
Q3
2009
Q1
2009
Q3
2010
Q1
2010
Q3
2011
Q1
2011
Q3
2012
Q1
2012
Q3
2013
Q1
2013
Q3
2014
Q1
2014
Q3
2015
Q1
2015
Q3
2016
Q1
2016
Q3
2017
Q1
2017
Q3
2018
Q1
EUR
trillio
n
AAA DE

10 | Quarterly Report on the Euro Area
Graph I.4: Net debt inflows vis-à-vis RoEA in creditor and debtor countries
(1) The net debt inflows are the difference between debt inflows (+) and outflows (-) vis-à-vis RoEA (% of the GDP, 3 year centred moving average). France was included among the set of creditor countries notwithstanding its modestly negative NIIP due to the similarity in net debt flow dynamics when compared with other countries in this group. Source: Based on an update of the database described in Hobza, A. and S. Zeugner (2014). 'Current accounts and financial flows in the euro area', Journal of International Money and Finance, Vol. 48, pp. 291-313; authors' calculations.
An analysis of bilateral flows reveals consistently positive net debt inflows from the euro area to the US in the pre-crisis period, possibly reflecting the dollar’s pre-eminence as a reserve currency. A general retrenchment of cross-border movements in both economies can be observed with the onset of the 2008 financial crisis (Graph I.6). The emergence of the sovereign debt crises in the euro area appears to have coincided with a surge in outflows in 2011. Focusing specifically on the bond flows of global investment funds (8) there is some (8) There is no single dataset that covers all the types of cross-border
flows on a bilateral basis at infra-annual frequency. Empirical studies mostly look at one specific type of financial flow. Some
evidence of flight-to-safety dynamics during the financial crisis years of 2007 to 2009 (Graph I.6). (9) In particular, outflows linked to bond instruments were noticeably less pronounced in "core" EU economies when compared with more "peripheral" economies. In fact, while the four largest euro area sovereign bond markets are depicted in Graph I.6 for illustration purposes, similar dynamics are seen to broadly apply to other "core" and "periphery" countries. At the same time, the US appears comparatively insulated from bond outflows driven by investment funds, suggesting that is was perceived as the main "safe haven", despite the fact that the financial crisis originated in its financial and housing markets. It is worth noting that in the post-financial crisis years, bond flow dynamics of investment funds are broadly convergent across US, "core" and "periphery" countries.
Graph I.5: Debt flows between the US and the euro area
Source: Based on an update of the database described in Hobza and Zeugner (2014), op. cit.; authors' calculations.
studies cover international investment fund flows as these are among the most volatile capital flows (Eichengreen, B., P. Gupta and O. Masetti (2017), ‘Are Capital Flows Fickle? Increasingly? And Does the Answer Still Depend on Type?’, World Bank Policy Research Working Paper, No. 7972; Fratzscher, M. (2012), ‘Capital flows, push versus pull factors and the global financial crisis’, Jounal of International Economics, Vol. 88 (2), pp. 341–356; Li, S., J. de Haan and B. Scholtens (2018), ‘Surges of international fund flows’, Journal of International Money and Finance, Vol. 82, pp. 97-119) or cross-border banking flows (Choi, S. and D. Furceri (2018), ‘Uncertainty and Cross-Border Banking Flows’, IMF Working Papers, No 18/4).
(9) The data is based on the EPFR Global Database, which tracks the flows and allocations of global investment funds.
-300
-200
-100
0
100
200
300
-30
-20
-10
0
10
20
30
2000
2001
2002
2003
2004
2005
2006
2007
2008
2009
2010
2011
2012
2013
2014
2015
% o
f GDP
Creditor countries
BE DE FR LU (rhs)
-60
-40
-20
0
20
40
60
-20
-15
-10
-5
0
5
10
15
20
25
2000
2001
2002
2003
2004
2005
2006
2007
2008
2009
2010
2011
2012
2013
2014
2015
% o
f GDP
Debtor countries
IT ES PT EL IE (rhs)
-300.000
-200.000
-100.000
0
100.000
200.000
300.000
400.000
500.000
2000
2001
2002
2003
2004
2005
2006
2007
2008
2009
2010
2011
2012
2013
2014
2015
Millio
ns o
f Eu
ro
Net inflows to EA US flows to EA EA flows to the US

I. A retrospective look at sovereign bond dynamics in the euro area
Volume 17 No 4 | 11
Graph I.6: Net investment flows into bonds by global investment funds, per country of
issuance
(1) The net flows represent the difference between inflows (+) and outflows (-); based on the flows and amounts held by bond funds; 3-month centred moving averages Source: EPFR, authors’ calculations
I.3. A lookback at the evolution of bond prices in euro area countries
The following subsections review the literature on the determinants of sovereign bond yields, consider some of the specificities implied by a currency union and present an empirical assessment of the drivers of yields in euro area countries based on constant-parameter and time-varying parameter models.
I.3.1. The determinants of bond yields
This subsection reviews the determinants of sovereign bond yields, as presented in the literature, and lays the ground for their joint empirical assessment in Subsection I.3.2. As mentioned in the introductory subsection, in the absence of exchange rate risk, sovereign bond yields in the euro area are expected to primarily reflect the risk-free yield curve plus a premium for credit risk. The risk-free yield curve is itself driven by short-term rates and longer term expectations for the risk-free rate at different maturities, which are linked to inflation expectations. Credit risk is usually related to fundamental macroeconomic variables such as current and expected debt-to-GDP ratios and potential growth. The pre-crisis evidence for the euro area countries confirmed the role of both of these factors but also of liquidity risks that are related to the size and depth of bond markets (as proxied, e.g., by bid-ask spreads and the volume of
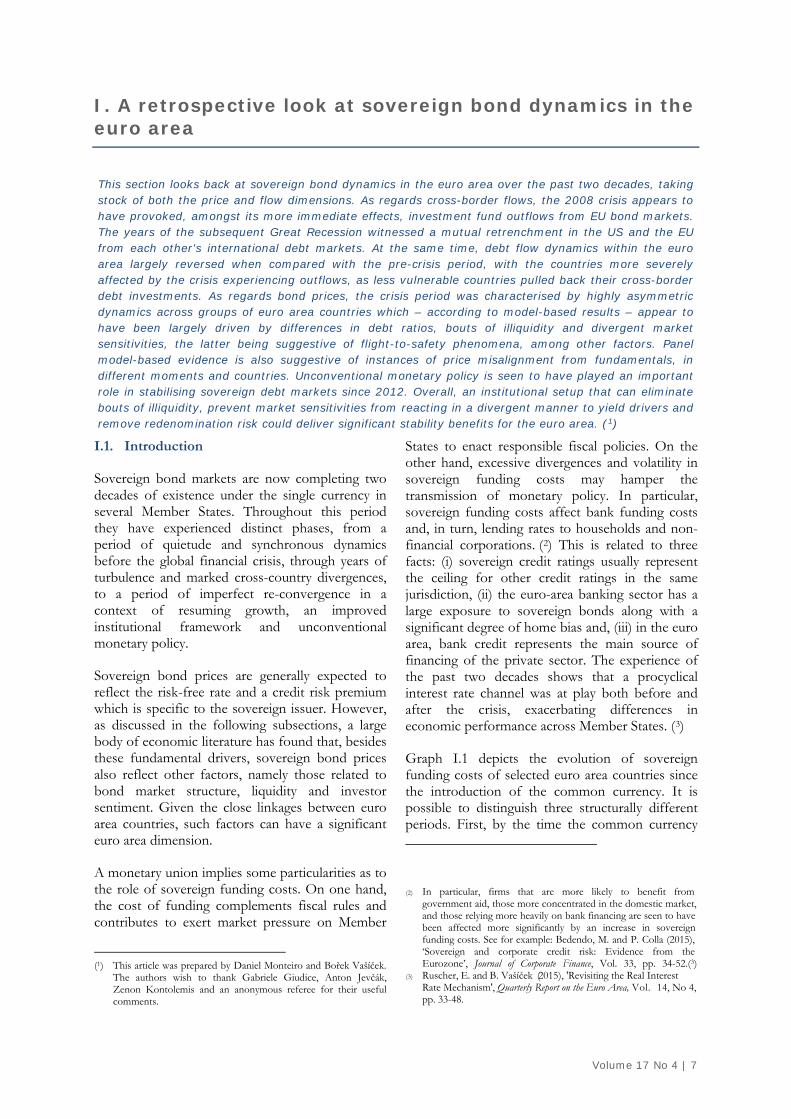
transactions) and international risk factors. (10) While liquidity will be further discussed in Subsection I.3.3, the dynamics of global risk factors can be observed in Graph I.7 which plots two risk measures for the US (the corporate bond spread and the VIX index of implied stock market volatility) and one for the euro area (VTSOXX, the euro area counterpart of the VIX index). Two periods of heightened volatility are discernible across all the measures, one during the recession of the early 2000s, and the second around the 2008 Global Financial Crisis.
The role of country fundamentals in the pricing of sovereign bonds during the crisis remains a contentious issue. The tumultuous yield developments observed after 2008 and depicted in Graph I.1 have been both interpreted as an overreaction that largely ignored Member States' fundamentals and as a "wake up call" after a long pre-crisis period of oversight of fundamentals by investors. However, there is a broad agreement on a greater sensitivity of government bond yields to fundamentals in euro area "peripheral" countries during the debt crisis of 2010-2012, and on sovereign risk premium being reinforced by the riskiness of domestic banks, (11) by existing external imbalances (12) and by international risk and liquidity factors. (13) Furthermore, it has been found that part of the risk premia on some sovereigns was a reflection of redenomination risk, i.e., the risk that one or more countries would leave the European Monetary Union and reintroduce their own national currencies, which would likely depreciate subsequently. (14)
(10) See, for example: Manganelli, S. and G. Wolswijk (2009), ‘What
drives spreads in the euro-area government bond market?’, Economic Policy, Vol. 24 (58), pp. 191-240; Favero, C., M. Pagano and E.-L. von Thadden (2010), ‘How does liquidity affect government bond yields?’, Journal of Financial and Quantitative Analysis, Vol. 45(1), pp. 107-134.
(11) See for example: Afonso, A., M. Arghyrou and A. Kontonikas (2014), ‘Pricing sovereign bond risk in the European Monetary Union area: an empirical investigation’, International Journal of Finance & Economics, Vol. 19(1), pp. 49-56; Bruneau, C., A. Delatte and J. Fouquau (2014), ‘Was the European sovereign crisis self-fulfilling? Empirical evidence about the drivers of market sentiments’, Journal of Macroeconomics, Vol. 42, pp. 38-51; Delatte, A., L. Fouquau and R. Portes (2017), ‘Regime-dependent sovereign risk pricing during the euro crisis’, Review of Finance, Vol. 21(1), pp. 363-385.
(12) Salem, M. and B. Castelletti-Font (2016), ‘Which combination of fiscal and external imbalances to determine the long-run dynamics of sovereign bond yields?’, Banque de France, Working Paper, No. 606.
(13) Afonso, op. cit. (14) See for example: De Santis, R. (2015), ‘A measure of
redenomination risk’, ECB Working Paper, No 1785; Klose, J. and
-6
-5
-4
-3
-2
-1
0
1
2
3
4
5
% o
f to
tal a
mou
nts
held
USA Italy France Germany Spain
2007-09 financial
crisis
12 | Quarterly Report on the Euro Area
Graph I.7: Measures of global risk
(1) The corporate bond spread refers to the difference between the bond yields of Baa-rated US companies and 10-year US treasuries. Source: FRED, DataInsight, STOXX and authors’ calculations
The widely discussed loop between sovereigns and domestic banks is also understood to have been reflected in a two-sided link between sovereign and bank funding costs at country level. (15) This loop, whereby banks and their sovereigns mutually enfeeble themselves in vulnerable countries in periods of distress, became evident in some Member States in the crisis period when bank losses led to government-sponsored recapitalisations, thereby increasing government debt and putting downward pressure on bond prices. Given banks' bias towards holding domestic sovereign bonds, this contributed to weakening their balance sheets, thereby re-starting the loop. The loop is understood to have also originated in some cases on the side of the sovereign, as when macroeconomic shocks led to increases in government debt and country risk, which transmitted to domestic banks. (16)
B. Weigert (2014), ‘Sovereign yield spreads during the euro crisis: fundamental factors versus redenomination risk’, International Finance, Vol. 17(1), 25-50. For a recent assessment of redenomination risk in a large euro area Member State, see Gros, D. (2018), ‘Italian risk spreads: Fiscal versus redenomination risk’, VoxEU.org, 29 August.
(15) See for example: Acharya, V., I. Drechsler and P. Schnabl (2014), ‘A pyrrhic victory? Bank bailouts and sovereign credit risk’, The Journal of Finance, Vol. 69(6), pp. 2689-2739; Alter, A. and Y. Schüler (2012), ‘Credit spread interdependencies of European states and banks during the financial crisis’, Journal of Banking & Finance, Vol. 36(12), pp. 3444-3468; De Bruyckere, V., M. Gerhardt, G. Schepens and R. Vander Vennet (2013), ‘Bank/sovereign risk spillovers in the European debt crisis’, Journal of Banking & Finance, Vol. 37(12), No. 4793-4809.
(16) A form of the sovereign-bank loop can also emerge in the absence of government recapitalisations or of banks' bias towards
There is also evidence that sovereign bond dynamics have at times been affected by discrete events and news. The credit rating actions represent the most prominent type of event and studies show that government bond yields respond significantly to changes in ratings and outlook, especially in the case of negative announcements. Conversely, spread dynamics are seen to have a feedback effect on sovereign rating decisions. These may affect also corporate ratings and hence have a broader impact on the economy. In addition, effects appear to be persistent, as recently-downgraded countries face higher spreads than countries with similar ratings that were not recently downgraded. (17) It is also documented that sovereign bond yields were affected by other, usually negative, news, especially during the euro area crisis period. (18)
Finally, the sovereign bond market is closely linked to the sovereign credit default swap (CDS) market which allows sovereign bond holders to insure themselves against a credit event. The use of sovereign CDS has increased dramatically during the last 15 years. (19) CDS spreads are sometimes deemed to be more direct measures of credit risk than sovereign bond yields, since they are not distorted by market liquidity. (20) Sizable deviations between CDS premia and the yield spread of the underlying bonds have been observed during the crisis, which has triggered a discussion on the direction of price discovery between the derivatives
holding domestic bonds, when a shock leads to reduced bank lending, thereby negatively impacting the economy, government revenues and bond prices. The government in its turn may see its debt increase, or embark on fiscal consolidation. As a result, economic activity as well as banks' balance sheets and lending capacity may be weakened.
(17) See, for example, Afonso, A., D. Furceri, and P. Gomes (2012), ‘Sovereign credit ratings and financial markets linkages: Application to European data’, Journal of International Money and Finance, Vol. 31(3), pp. 606-638; Arezki, M., B. Candelon and M. Sy (2011), ‘Sovereign rating news and financial markets spillovers: Evidence from the European debt crisis’, IMF Working Papers, No. 11/68; De Santis, R. (2012), ‘The Euro area sovereign debt crisis: safe haven, credit rating agencies and the spread of the fever from Greece, Ireland and Portugal’, ECB Working Paper Series, No. 1419.
(18) Beetsma, R., M. Giuliodori, F. De Jong and D. Widijanto (2013), ‘Spread the news: The impact of news on the European sovereign bond markets during the crisis’, Journal of International Money and Finance, Vol. 34, pp. 83-101.
(19) Sovereign CDS represent key instruments for transferring credit risk related to sovereign exposures. However, since the onset of the U.S. subprime crisis the sovereign CDS has become subject to controversies as their usage was blamed for exacerbating the credit crunch by allowing excessive leverage and risk-taking by financial institutions and even market manipulation.
(20) Longstaff, F. (2004), ‘The flight to liquidity premium in US Treasury bond prices’, Journal of Business No 77, pp. 511-526.
0
50
100
150
200
250
300
350
2000
2001
2002
2003
2004
2005
2006
2007
2008
2009
2010
2011
2012
2013
2014
2015
2016
2017
2018
Perio
d av
erag
e = 1
00
US corporate bond spread VIX Euro Area VSTOXX

I. A retrospective look at sovereign bond dynamics in the euro area
Volume 17 No 4 | 13
market and the underlying cash market. (21) CDS markets often behaved as a further shock transmitter, a phenomenon which has been linked, in particular, to uncovered (“naked”) CDS positions, where the protection buyer does not hold the reference sovereign bond. (22)
I.3.2. Evidence from a fixed effects panel model
In order to assess the effects of different determinants on sovereign bond yields a panel regression model with fixed effects was estimated, covering the 11 largest euro area economies. (23) Beyond the country-specific fixed effects, the explanatory variables in the regression include a measure of the risk-free rate and of the risk-free yield curve slope, the debt-to-GDP ratio, year-on-year GDP growth, the VIX index as a measure of global risk, the bid-ask spread as a measure of liquidity, and the amount of securities held by the Eurosystem for monetary policy purposes, to control for the effects of the asset
(21) Fontana, A. and M. Scheicher (2016), ‘An analysis of euro area
sovereign CDS and their relation with government bonds’, Journal of Banking & Finance, Vol. 62, pp. 126-140.
(22) EU Regulation No 236/2012 effectively banned "naked" CDS. (23) This group of countries also offers the advantage of greater data
availability given that it represents the first wave of Member States having adopted the euro. The sample thus includes Austria, Belgium, Finland, France, Germany, Greece, Italy, Ireland, the Netherlands, Portugal and Spain. Luxembourg is not included due to the small size of its sovereign bond market and attendant difficulties in terms of data availability.
purchase programmes. The details of the model specification and estimation results are provided in Box I.1. A country-level assessment using a time-varying parameter version of the model is provided in Subsection I.3.4.
Graph I.8: Decomposition of the evolution of average sovereign 10-year bond yields in the euro area based on a fixed effects panel model
(1) Based on the simple average for AT, BE, DE, EL, ES, FI, FR, IE, IT, NL and PT. For readability, the constant (negative) contribution of the average intercept was subtracted from the average yield. Source: Authors’ estimations
-3-2-10123456789
10
00 01 02 03 04 05 06 07 08 09 10 11 12 13 14 15 16 17 18
%
Risk free rate and slope Debt-to-GDP GDP growthGlobal risk Illiquidity UnexplainedUnconventional monetary policy Average yield minus intercept

14 | Quarterly Report on the Euro Area
(Continued on the next page)
Box I.1: Sovereign bond yield drivers in a fixed effects panel model
In order to investigate the effects of different determinants on the euro area sovereign bond yields a panel regression model was estimated for a period running from February 2000 to February 2018 and comprising the 11 largest euro area economies (i.e., Austria, Belgium, Finland, France, Germany, Greece, Ireland, Italy, the Netherlands, Portugal and Spain). The model takes the following form: 𝑦𝑦𝑖𝑖,𝑡𝑡 = 𝐼𝐼𝑖𝑖 + 𝛽𝛽𝑟𝑟𝑟𝑟 𝑟𝑟𝑟𝑟𝑡𝑡 + 𝛽𝛽𝑠𝑠𝑠𝑠𝑠𝑠𝑠𝑠𝑠𝑠 𝑠𝑠𝑠𝑠𝑠𝑠𝑠𝑠𝑠𝑠𝑡𝑡 + 𝛽𝛽𝑑𝑑𝑠𝑠𝑑𝑑𝑡𝑡 𝑑𝑑𝑠𝑠𝑑𝑑𝑡𝑡𝑖𝑖 ,𝑡𝑡 + 𝛽𝛽𝐺𝐺𝐺𝐺𝐺𝐺𝑔𝑔𝑟𝑟𝑠𝑠𝑔𝑔𝑡𝑡ℎ𝑖𝑖,𝑡𝑡 + 𝛽𝛽𝑟𝑟𝑖𝑖𝑠𝑠𝑟𝑟 𝑟𝑟𝑖𝑖𝑠𝑠𝑟𝑟𝑡𝑡 + 𝛽𝛽𝑠𝑠𝑖𝑖𝑞𝑞 𝑠𝑠𝑖𝑖𝑞𝑞𝑖𝑖,𝑡𝑡−1 + 𝛽𝛽𝐴𝐴𝐺𝐺𝐺𝐺𝐴𝐴𝐺𝐺𝐺𝐺𝑡𝑡 + 𝜀𝜀𝑖𝑖 ,𝑡𝑡
where the dependent variable, 𝑦𝑦𝑖𝑖 ,𝑡𝑡 , represents the average 10-year sovereign bond yield (1) for country i during month t. The explanatory variables are as follows: I represents a country-specific intercept, or fixed effect; rf represents the short-term risk-free rate as measured by the 3-month EONIA overnight indexed swap (OIS); slope represents the slope of the risk-free yield curve, as measured by the spread between the 3-month and the 2-year EONIA OIS; (2) debt is the debt-to-GDP ratio; growth is the year-on-year GDP growth; risk represents a global risk factor as measured by the (logged) VIX index; liq represents market liquidity as measured by the bid-ask spread on 10-year sovereign bonds, with a higher figure therefore representing a higher degree of market illiquidity; APP represents the effects of the asset purchase programmes, as measured by the value of the securities held for monetary policy purposes by the Eurosystem, in billions of euros; (3) finally, ε is an error term. Overall, the model seeks to assess the role of fundamental factors such as monetary policy (expressed, e.g., in the risk-free rate and in the APP), key macroeconomic variables bearing on credit risk such as the government debt ratio and economic activity, as well as global risk factors and liquidity conditions. While some of the included variables such as the slope of the risk-free rate and the risk factor have a clear forward-looking nature, the debt and growth variables are based on contemporaneous year-on-year growth rates, cubically interpolated from quarterly data. (4) Given investors' forward-looking perspective, it would be theoretically correct to use expect values for debt, growth and APP. However, from an empirical viewpoint such approach is not without issues. For instance, if expected values are inferred from contemporaneous forecasts, these are typically updated at low frequency, may cover a relatively short horizon and may refer only to whole year (or end-of-year) figures. Due to the difficulties involved in accurately deriving expectations at a relatively high macroeconomic frequency some practitioners use contemporaneous outturns, which generally produce sensible results. Another issue worth of consideration is the possible endogeneity of some of the explanatory variables. Given the financial market nature of sovereign bond yields, they should respond contemporaneously to all the explanatory variables. The risk-free rate and slope are forward looking and largely driven by inflation and monetary policy implications. As such, contemporaneous sovereign yields should play a limited causal role. Debt dynamics only respond slowly to changing yields and therefore can be assumed as essentially exogenous. Likewise, the expenditure components of GDP growth should be mostly driven, inter alia, by sustained, long-term expectations for interest rates and financing conditions, rather than react immediately to contemporaneous government rates. As regards risk perceptions and attitudes, a global, US-based risk factor was preferred as compared to an EU-specific one in order to mitigate issues of endogeneity. Liquidity conditions should, in their turn, be endogenous to bond yields in the sense that not only can bouts of illiquidity cause spikes in yields but also very high sovereign risk can cause market liquidity to dry up. To mitigate this issue, liq is included with a lag in the regression. Finally, APP comprises rules-based asset purchase programmes that were not designed to respond to particular changes in interest rates. (1) A 10-year maturity is often used in the literature on bold yield drivers, and is also the maturity of the Maastricht convergence criterion
for long-term interest rates. 10-year bond yields are understood to reflect not only short-term policy developments but also longer term economic prospects.
(2) The 2-year tenor is the longest for which data is available covering our whole sample period. (3) The value of the securities held for monetary policy purposes takes the value zero prior to July 2009. With the introduction of the
public sector purchase programme in March 2015, its magnitude has become increasingly dominated by the latter. (4) Using industrial production growth – a narrower measure of economic activity available at monthly frequency – instead of
interpolated monthly GDP growth does not materially change the results presented in this subsection.

I. A retrospective look at sovereign bond dynamics in the euro area
Volume 17 No 4 | 15
Graph I.8 provides a decomposition of the evolution of the average euro area yield over time, based on the regression model and results detailed in Box I.1. As expected, monetary policy loosening in the wake of the crisis, as captured by the risk-free rate and slope variables, put strong downward pressure on sovereign bond yields across the euro area over the past decade. Debt ratios are also seen to have played a major contribution to the yield level. In fact, as of early 2018, relatively large government debts were the largest factor putting upward pressure on sovereign interest rates. GDP growth has played a moderate role, helping to bring down average yields by 30 to 60 bps during most of our sample period. During the 2008-09 financial crisis, however, average negative growth is reckoned to have contributed to increase average yields by up to 100 bps. Changes in a global risk factor have induced yield variations of at most 100 bps over our sample period. Market illiquidity played a negligible role up until 2010. However, it is seen as the major driver of the spike in average yields observed during the 2011-12 sovereign debt crisis. Unconventional monetary policy and the associated asset purchase programmes of the Eurosystem have contributed, as expected, to lower interest rates across the euro area since 2012.
It may also be useful to consider the periods where the unexplained component of the average yield is
largest. The first such period was during the 2008-09 financial crisis, when average yields remained lower than predicted by the panel regression model. This result is consistent with some risk under-pricing in the early stages of the recession, possibly linked to favourable expectations regarding the short-term nature of the economic troubles and the supportive role of fiscal and monetary policies. Such undershooting reversed in 2010-13, when actual average yields exceeded model-predicted yields. This was a period of asymmetric bond market dynamics in the euro area, which included panic-like yield spikes in some countries. Finally, the fact that actual yields were lower than predicted by the panel model in the 2014-16 is likely due to the frontloaded market anticipation of the effects of the Eurosystem's public sector purchase programme, which began gradually in March 2015, after having been announced in 2014.
I.3.3. The euro area dimension of bond price dynamics
As already hinted at in the previous subsection, the pricing of sovereign bonds can be affected by other factors beyond sovereign credit risk per se. In the euro area some of these factors carry an important cross-country dimension given the strong economic and institutional linkages between Member States.
Box (continued)
In line with the literature and with the results of a Hausman test, the model was estimated as a fixed effects model. Given a relatively small dimension for the cross section (11 countries) along a relatively long dimension for the time series (217 months) the fixed effects estimator can ideally be implemented by introducing 11 country-specific dummy variables I in the regression (and no common intercept). The results of the estimation are reported in Table 1. All the regression coefficients show the expected sign and are significant at a 1% significance level. The goodness-of-fit of the model is relatively high, with an R2 of 79%.
Table 1: estimation results for a sovereign bond yield panel data model with fixed effects 𝛽𝛽𝑟𝑟𝑟𝑟 𝛽𝛽𝑠𝑠𝑠𝑠𝑠𝑠𝑠𝑠𝑠𝑠 𝛽𝛽𝑑𝑑𝑠𝑠𝑑𝑑𝑡𝑡 𝛽𝛽𝑔𝑔𝑟𝑟𝑠𝑠𝑔𝑔𝑡𝑡 ℎ 𝛽𝛽𝑟𝑟𝑖𝑖𝑠𝑠𝑟𝑟 𝛽𝛽𝑠𝑠𝑖𝑖𝑞𝑞 𝛽𝛽𝐴𝐴𝐺𝐺𝐺𝐺 0.78 1.56 0.047 -0.17 0.54 5.14 -0.00058
(0.05) (0.15) (0.006) (0.04) (0.15) (1.03) (0.0001)
Note: HAC standard errors in parentheses. The regression coefficients can be interpreted as follows. As must needs be the case, yields respond positively to changes in the short-term risk-free rate and the medium-term risk-free spread, loading more on the latter given the 10-year maturity of the sovereign bonds under consideration. A ten percentage point increase in the government debt-to-GDP ratio increases sovereign yields by 47 basis points (bps) while a 1 pp increase in the annual growth rate lowers yields by 17 bps. A 10% increase in the VIX global risk factor increases yields by approximately 5 bps. An increase in the bid-ask spread of 1 bp increases yields by 5 bps. A EUR trillion of asset purchases under the asset purchase programmes of the Eurosystem can lower yields by 58 bps.

16 | Quarterly Report on the Euro Area
Cross-border spillovers and contagion
While the period before the Global Financial Crisis was characterised by strong convergence across sovereign bond prices, the subsequent period witnessed the emergence of significant divergence among Member States. Graph I.9 shows the evolution of price-based indices of both bond market and broader financial integration. In both cases, a trend towards closer integration is clear until 2006. This trend inverted after 2007, leading to a full reversion in integration in the case of the bond market. After reaching its through during the euro area debt crisis in mid-2012, bond market integration has been increasing, which was likely supported by a broad-based economic recovery, an improvement in credit ratings and the unconventional monetary policy of the ECB.
Graph I.9 also suggests that convergence and divergence dynamics in bond markets have preceded similar dynamics in the broader financial market since 1995. In fact, Granger causality tests suggest that changes in bond market integration have caused changes in overall financial integration, while the reverse is not true. (24)
Despite fragmentation at euro area level, the interdependence between bond markets of some Member States has increased since the global financial crisis. This increase in co-movements between the sovereign bond markets of some Member States has often been titled as a spillover or even contagion effect. Several studies have tried to measure such linkages and distinguish spillovers – which are usually understood as increased co-movements between sovereign bond yields – from pure contagion, which represents an intensification in the transmission of shocks from a crisis-hit country to another country that cannot be objectively explained by financial linkages between them. (25) These studies broadly agree that there (24) Granger causality tests were run for the following two variables: i)
changes in the bond market integration indicator (BM indicator) and ii) changes in the broader financial integration indicator, excluding the bond market (FI indicator). The sample runs from January 1995 to December 2017. The null hypothesis that BM does not Granger cause FI is rejected at a 5% confidence level, irrespective of whether the test is run with 9 month ("3 quarter"), 6 month ("2 quarter") or 3 month ("1 quarter") lags. This result is stronger when the test is run with a 9-month lag (where the p-value equals 0.013). Furthermore, the hypothesis that FI does not Granger cause BM is not rejected for the same lag lengths, even at a 10% confidence level (with p-value for the test with a 9-month lag equal to 0.26).
(25) There is significant ambiguity in the literature in terms of definitions and empirical methods for testing contagion. See for
were significant co-movements, especially within the euro area periphery, but also that pure contagion was largely limited to short-lived episodes before the announcement of the ECB's Outright Monetary Transactions programme in 2012.
Graph I.9: Indices of bond market and broader financial market integration
(1) The financial integration index is constructed from a selection of price-based indicators that cover the money, bond, equity and banking markets. It is defined to be bounded between 0 and 1. The indicators aggregated into the bond market sub-index are the cross-country standard deviations of two and ten-year sovereign bond yields (Greece excluded), and the cross-country standard deviation of the bond yields of uncovered corporate bonds issued by non-financial corporations. Source: ECB and authors’ calculations
Cross-border effects have also been documented for rating actions, when a rating decision affecting lower-rated countries also affects yields of higher-rated countries, as well as for negative news, especially within the group of periphery countries. The size of cross-border spillovers also seems to be related to cross-border bank holdings. (26) As past rating announcements have seemed to have only a limited effect on the euro exchange rate, there is evidence that they have led investors to rebalance their sovereign bond portfolios within the euro area. (27)
example: Rigobon, R. (2016), ‘Contagion, spillover and interdependence’, ECB Working Paper, No. 1975.
(26) Böninghausen, B. and M. Zabel (2015), ‘Credit ratings and cross-
border bond market spillovers’, Journal of International Money and Finance, Vol. 53, pp. 115-136.
(27) Baum, C., D. Schäfer and A. Stephan (2016), ‘Credit rating agency downgrades and the Eurozone sovereign debt crises’, Journal of Financial Stability, Vol. 24, pp. 117-131.
0
0,1
0,2
0,3
0,4
0,5
0,6
0,7
0,8
0,9
1
1995
1996
1997
1998
1999
2000
2001
2002
2003
2004
2005
2006
2007
2008
2009
2010
2011
2012
2013
2014
2015
2016
2017
Composite financial integration indicator (excluding bondmarket)Sub-index for the bond market
I. A retrospective look at sovereign bond dynamics in the euro area
Volume 17 No 4 | 17
Flight to safety and flight to liquidity
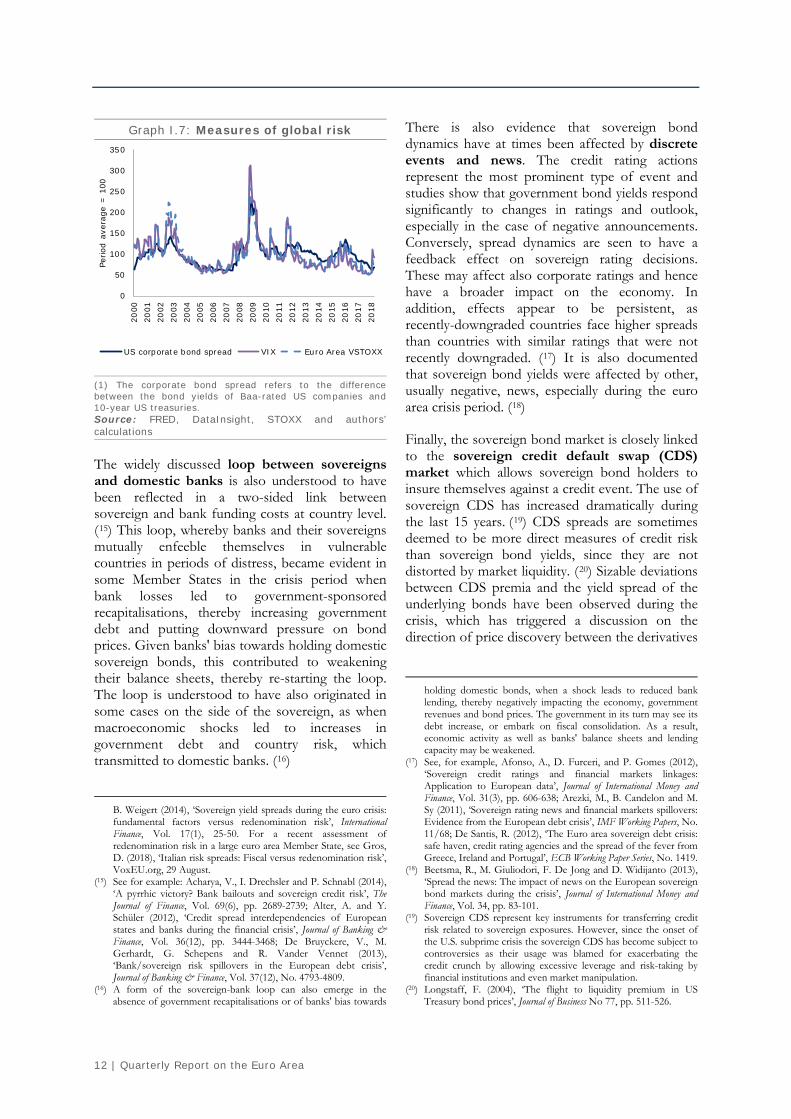
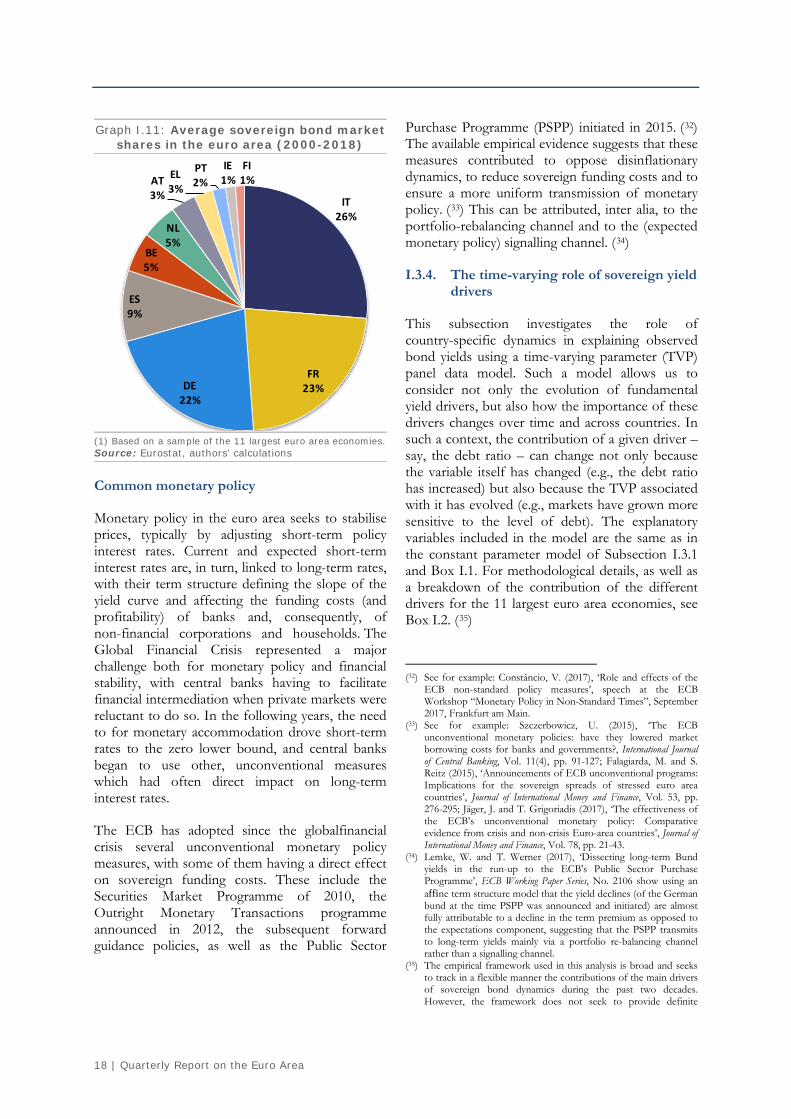
Flight to safety (FTS) is usually identified as a negative price co-movement between different asset categories (typically, stocks vs. bond returns) in periods of financial stress (e.g. when the stock market is falling), although the concept can also be applied to securities with different perceived risk levels within the same asset class. In a FTS episode, investors shed assets perceived to be riskier in favour of safer ones. (28) FTS episodes are not necessarily triggered by observed changes in fundamentals. Rather, they are often triggered by changes in risk perceptions and attitudes, which motivates the time-varying parameter analysis in the following subsection. Moreover, portfolio reallocations in connection with FTS usually reflect both safety and liquidity concerns. Therefore, flights to safety are often accompanied by flights to liquidity. In fact, market illiquidity appears to have played an important role in driving yield spikes in "periphery" countries at the height of the crisis, as documented in Graph I.14 of the next subsection. In other countries, market liquidity, as measured by bid-ask spreads, has played a more modest role, although with noticeable cross-country and intertemporal variations (Graph I.10). In particular, it is interesting to note that there has not been a clear link between bid-ask spreads and bond market shares (Graph I.11), another possible indicator of liquidity. As such, the Italian sovereign bond market, the largest in the euro area, has often experienced some of the largest bid-ask spreads among non-periphery countries, while Finland, the smallest market in our sample, does not show particularly unfavourable dynamics.
FTS has been identified as a factor affecting the pricing of sovereign bonds during the euro area debt crisis, when yields of some "core" countries moved in the opposite direction from that of the yields of vulnerable countries. Such joint dynamics confirm the increased importance of investors’ risk aversion in times of uncertainty, which leads them to favour bonds of countries that are generally regarded to have a low default risk, and implies
(28) Baur, D. and B. Lucey (2009), ‘Flights and contagion—An
empirical analysis of stock–bond correlations’, Journal of Financial stability, Vol. 5(4), pp. 339-352. Several papers provided stylised micro-founded models that aim to rationalise the flight to quality behaviour, e.g. Caballero, R. and A. Krishnamurthy (2008), ‘Collective risk management in a flight to quality episode’, Journal of Finance, Vol. 63(5), pp. 2195-223; Brunnermeier, M. and L. Pedersen (2009), ‘Funding liquidity and market liquidity’, Review of Financial Studies, 22, pp. 2201-2238.
consequently a risk premium increase in other countries. (29) Some part of the yield divergence seems to be also driven by liquidity premia, as the liquidity of "core" bond markets increased, at the same time as it decreased for the "periphery". (30) FTS has been identified also as one of the drivers of worsening efficiency in the bond markets, and one of the reasons for the observed deviation between CDS and bond spreads. (31)
Graph I.10: Bid-ask spreads on 10-year sovereign bonds in selected euro area
Member States
Source: Bloomberg
(29) See for example: De Santis (2014), op. cit., Monfort, A. and J.
Renne (2013), ‘ Decomposing euro-area sovereign spreads: credit and liquidity risks’, Review of Finance, Vol. 18(6), pp. 2103-2151; Ehrmann and Fratzscher (2017), op. cit.
(30) Garcia, J. and R. Gimeno (2014), ‘Flight to liquidity Flows in the Euro Area Sovereign Debt Crisis’, Banco de Espana Working Paper, No. 1429. Fontana and Scheicher (2016), op. cit.
(31) Arce, O., S. Mayordomo and J. Peña (2013), ‘Credit-risk valuation in the sovereign CDS and bonds markets: Evidence from the euro area crisis’, Journal of International Money and Finance, Vol. 35, pp. 124-145.
0
1
2
3
4
5
6
7
8
2000
2001
2002
2003
2004
2005
2006
2007
2008
2009
2010
2011
2012
2013
2014
2015
2016
2017
2018
basi
s po
ints
AT BE DE FI FR IT NL
18 | Quarterly Report on the Euro Area
Graph I.11: Average sovereign bond market shares in the euro area (2000-2018)
(1) Based on a sample of the 11 largest euro area economies. Source: Eurostat, authors’ calculations
Common monetary policy
Monetary policy in the euro area seeks to stabilise prices, typically by adjusting short-term policy interest rates. Current and expected short-term interest rates are, in turn, linked to long-term rates, with their term structure defining the slope of the yield curve and affecting the funding costs (and profitability) of banks and, consequently, of non-financial corporations and households. The Global Financial Crisis represented a major challenge both for monetary policy and financial stability, with central banks having to facilitate financial intermediation when private markets were reluctant to do so. In the following years, the need to for monetary accommodation drove short-term rates to the zero lower bound, and central banks began to use other, unconventional measures which had often direct impact on long-term interest rates.
The ECB has adopted since the globalfinancial crisis several unconventional monetary policy measures, with some of them having a direct effect on sovereign funding costs. These include the Securities Market Programme of 2010, the Outright Monetary Transactions programme announced in 2012, the subsequent forward guidance policies, as well as the Public Sector
Purchase Programme (PSPP) initiated in 2015. (32) The available empirical evidence suggests that these measures contributed to oppose disinflationary dynamics, to reduce sovereign funding costs and to ensure a more uniform transmission of monetary policy. (33) This can be attributed, inter alia, to the portfolio-rebalancing channel and to the (expected monetary policy) signalling channel. (34)
I.3.4. The time-varying role of sovereign yield drivers
This subsection investigates the role of country-specific dynamics in explaining observed bond yields using a time-varying parameter (TVP) panel data model. Such a model allows us to consider not only the evolution of fundamental yield drivers, but also how the importance of these drivers changes over time and across countries. In such a context, the contribution of a given driver – say, the debt ratio – can change not only because the variable itself has changed (e.g., the debt ratio has increased) but also because the TVP associated with it has evolved (e.g., markets have grown more sensitive to the level of debt). The explanatory variables included in the model are the same as in the constant parameter model of Subsection I.3.1 and Box I.1. For methodological details, as well as a breakdown of the contribution of the different drivers for the 11 largest euro area economies, see Box I.2. (35)
(32) See for example: Constâncio, V. (2017), ‘Role and effects of the
ECB non-standard policy measures’, speech at the ECB Workshop “Monetary Policy in Non-Standard Times”, September 2017, Frankfurt am Main.
(33) See for example: Szczerbowicz, U. (2015), ‘The ECB unconventional monetary policies: have they lowered market borrowing costs for banks and governments?, International Journal of Central Banking, Vol. 11(4), pp. 91-127; Falagiarda, M. and S. Reitz (2015), ‘Announcements of ECB unconventional programs: Implications for the sovereign spreads of stressed euro area countries’, Journal of International Money and Finance, Vol. 53, pp. 276-295; Jäger, J. and T. Grigoriadis (2017), ‘The effectiveness of the ECB’s unconventional monetary policy: Comparative evidence from crisis and non-crisis Euro-area countries’, Journal of International Money and Finance, Vol. 78, pp. 21-43.
(34) Lemke, W. and T. Werner (2017), ‘Dissecting long-term Bund yields in the run-up to the ECB's Public Sector Purchase Programme’, ECB Working Paper Series, No. 2106 show using an affine term structure model that the yield declines (of the German bund at the time PSPP was announced and initiated) are almost fully attributable to a decline in the term premium as opposed to the expectations component, suggesting that the PSPP transmits to long-term yields mainly via a portfolio re-balancing channel rather than a signalling channel.
(35) The empirical framework used in this analysis is broad and seeks to track in a flexible manner the contributions of the main drivers of sovereign bond dynamics during the past two decades. However, the framework does not seek to provide definite
IT26%
FR23%DE
22%
ES9%
BE5%
NL5%
AT3%
EL3%
PT2%
IE1%
FI1%
I. A retrospective look at sovereign bond dynamics in the euro area
Volume 17 No 4 | 19
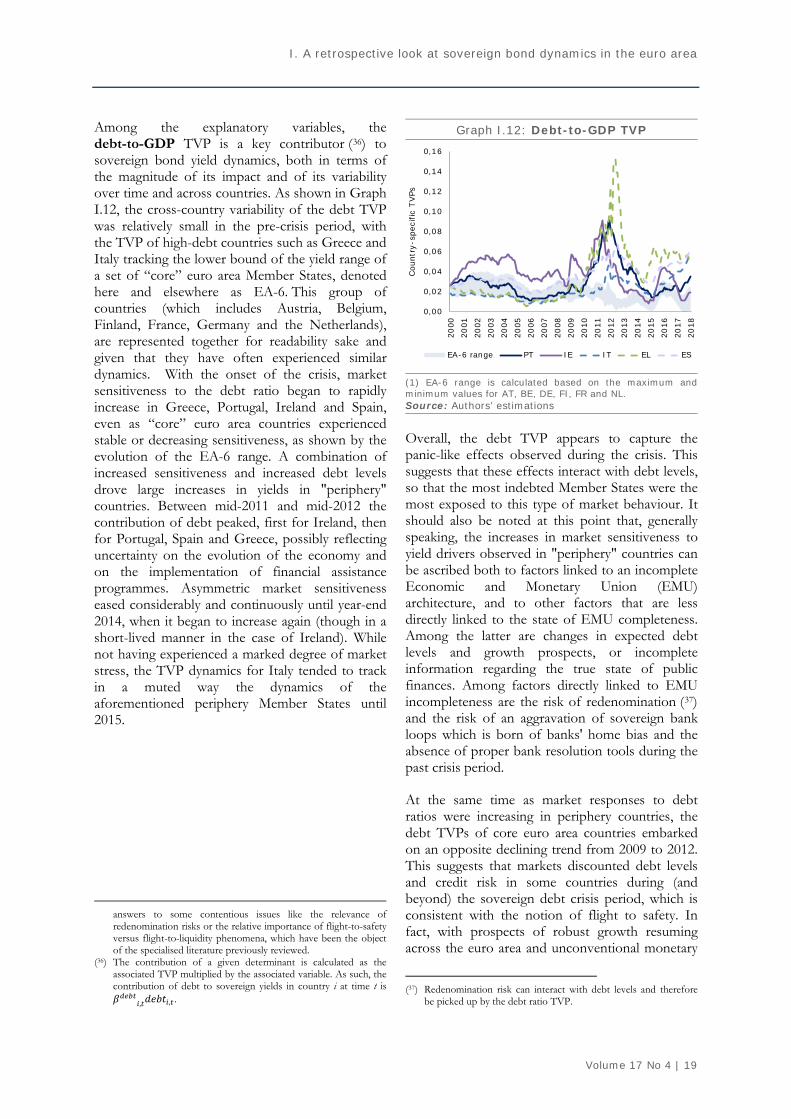
Among the explanatory variables, the debt-to-GDP TVP is a key contributor (36) to sovereign bond yield dynamics, both in terms of the magnitude of its impact and of its variability over time and across countries. As shown in Graph I.12, the cross-country variability of the debt TVP was relatively small in the pre-crisis period, with the TVP of high-debt countries such as Greece and Italy tracking the lower bound of the yield range of a set of “core” euro area Member States, denoted here and elsewhere as EA-6. This group of countries (which includes Austria, Belgium, Finland, France, Germany and the Netherlands), are represented together for readability sake and given that they have often experienced similar dynamics. With the onset of the crisis, market sensitiveness to the debt ratio began to rapidly increase in Greece, Portugal, Ireland and Spain, even as “core” euro area countries experienced stable or decreasing sensitiveness, as shown by the evolution of the EA-6 range. A combination of increased sensitiveness and increased debt levels drove large increases in yields in "periphery" countries. Between mid-2011 and mid-2012 the contribution of debt peaked, first for Ireland, then for Portugal, Spain and Greece, possibly reflecting uncertainty on the evolution of the economy and on the implementation of financial assistance programmes. Asymmetric market sensitiveness eased considerably and continuously until year-end 2014, when it began to increase again (though in a short-lived manner in the case of Ireland). While not having experienced a marked degree of market stress, the TVP dynamics for Italy tended to track in a muted way the dynamics of the aforementioned periphery Member States until 2015.
answers to some contentious issues like the relevance of redenomination risks or the relative importance of flight-to-safety versus flight-to-liquidity phenomena, which have been the object of the specialised literature previously reviewed.
(36) The contribution of a given determinant is calculated as the associated TVP multiplied by the associated variable. As such, the contribution of debt to sovereign yields in country i at time t is 𝛽𝛽𝑑𝑑𝑑𝑑𝑑𝑑𝑑𝑑𝑖𝑖,𝑑𝑑𝑑𝑑𝑠𝑠𝑑𝑑𝑡𝑡𝑖𝑖,𝑑𝑑 .
Graph I.12: Debt-to-GDP TVP
(1) EA-6 range is calculated based on the maximum and minimum values for AT, BE, DE, FI, FR and NL. Source: Authors’ estimations
Overall, the debt TVP appears to capture the panic-like effects observed during the crisis. This suggests that these effects interact with debt levels, so that the most indebted Member States were the most exposed to this type of market behaviour. It should also be noted at this point that, generally speaking, the increases in market sensitiveness to yield drivers observed in "periphery" countries can be ascribed both to factors linked to an incomplete Economic and Monetary Union (EMU) architecture, and to other factors that are less directly linked to the state of EMU completeness. Among the latter are changes in expected debt levels and growth prospects, or incomplete information regarding the true state of public finances. Among factors directly linked to EMU incompleteness are the risk of redenomination (37) and the risk of an aggravation of sovereign bank loops which is born of banks' home bias and the absence of proper bank resolution tools during the past crisis period.
At the same time as market responses to debt ratios were increasing in periphery countries, the debt TVPs of core euro area countries embarked on an opposite declining trend from 2009 to 2012. This suggests that markets discounted debt levels and credit risk in some countries during (and beyond) the sovereign debt crisis period, which is consistent with the notion of flight to safety. In fact, with prospects of robust growth resuming across the euro area and unconventional monetary
(37) Redenomination risk can interact with debt levels and therefore
be picked up by the debt ratio TVP.
0,00
0,02
0,04
0,06
0,08
0,10
0,12
0,14
0,16
2000
2001
2002
2003
2004
2005
2006
2007
2008
2009
2010
2011
2012
2013
2014
2015
2016
2017
2018
Cou
ntry
-spe
cific
TVPs
EA-6 range PT IE IT EL ES

20 | Quarterly Report on the Euro Area
policy in full swing, debt levels even appear to have been momentarily written off as risk factors in the second half of 2017 in the case of Germany.
TVP estimations ascribe a modest role to contemporaneous GDP growth. However, inasmuch as growth can improve or aggravate debt-to-GDP ratios, its effect on yields is also captured via the debt ratio. Graph I.13 plots the contribution of GDP growth to sovereign bond yields over time. As can be observed, the contributions of growth show similar magnitudes for most countries during most of the time. Pure growth effects are seen to have switched from a supportive role (i.e., a negative contribution) in the pre-crisis period to adding up to 30 basis points to yields in the 2008-09 recession. Growth effects have generally been favourable in the post-crisis period, safe for the “double dip” recession of 2012. Two notable cases are Greece and Ireland. Prolonged negative growth has put upward pressure on Greek sovereign bond yields up until 2014, while dynamic growth in Ireland has had the reverse effect during the post-crisis period.
Graph I.13: Contribution of growth to yields
(1) EA-6 range is calculated based on the maximum and minimum values for AT, BE, DE, FI, FR and NL. Source: Authors’ estimations
The global risk factor (not shown here) has played a relevant role, having added more than 50 bps to euro area sovereign bond yields at the height of the 2008-09 crisis. The importance ascribed to the global risk factor is, nevertheless, significantly smaller in the TVP model than in the fixed effects model estimated in the previous subsection. TVP estimations suggest similar global risk sensitivities across the euro area over time, so that differences in country-specific TVPs induce only negligible
differences in the contribution of global risk to yields.
Spikes in market illiquidity in the peak of the sovereign debt crisis had an increased, sizeable effect on the yields of Portugal and Ireland, and a major effect on the yields of Greece. While Italy and Spain do not show spikes in illiquidity, their bid-ask spreads have nevertheless tended to remain on the high side since 2011 when compared with “core” countries. Graph I.14 shows the effects of illiquidity over time. (38) The observed increases in the contribution of liquidity were essentially driven by spikes in bid-ask spreads, rather than by spikes in the associated TVPs.
Graph I.14: Contribution of illiquidity to yields
(1) Vertical axis in logarithmic scale; EA-6 range is calculated based on the maximum and minimum values for AT, BE, DE, FI, FR and NL. Source: Authors’ estimations
The asset purchase programmes (APP) of the Eurosystem have played an important role in stabilising government interest rates. Our measure of APP is the aggregate amount of securities held by the Eurosystem for monetary policy purposes. (39) This variable is zero prior to July 2009 and has grown since then in connection with the private sector asset purchase programmes of the Eurosystem. With the introduction of the public sector purchase programme (PSPP) in March 2015 the magnitude of this asset class has become increasingly dominated by the latter. In
(38) The vertical axis is plotted in a non-linear (logarithmic) scale for
readability purposes. (39) I.e., the total amount on the balance sheet of the Eurosystem,
summed over all participating countries. This variable is not, therefore, country-specific.
-1,0
-0,8
-0,6
-0,4
-0,2
0,0
0,2
0,4
0,6
2000
2001
2002
2003
2004
2005
2006
2007
2008
2009
2010
2011
2012
2013
2014
2015
2016
2017
2018
Con
trib
utio
n to
yie
lds
(pps
.)
EA-6 range PT IE IT EL ES
0,00
0,00
0,01
0,02
0,03
0,06
0,13
0,25
0,50
1,00
2,00
4,00
8,00
2000
2001
2002
2003
2004
2005
2006
2007
2008
2009
2010
2011
2012
2013
2014
2015
2016
2017
2018
Con
trib
utio
n to
yie
lds
(pps
.)
EA-6 range PT IE IT EL ES

I. A retrospective look at sovereign bond dynamics in the euro area
Volume 17 No 4 | 21
order to identify the time-varying role of the asset purchases a common constant coefficient is assumed until July 2012. This was the month when the president of the ECB, Mario Draghi, delivered a pivotal speech to the effect that “the ECB is ready to do whatever it takes to preserve the euro.” This speech is widely regarded as having changed market perceptions, namely as concerns expectations of a greater role for the ECB's non-conventional monetary policy. As such, from July 2012 onwards our identification strategy allows country-specific reactions to the balance sheet size of the ECB to emerge and complement the constant, common coefficient. (40)
In Box I.3 a simple counterfactual exercise is conducted whereby the actual sovereign bond yields are compared with the yields predicted by three different models capturing an “average” behaviour of parameters: a common-intercept version of fixed effects model discussed in Box I.1 (FE-CI); a “EA-6” model which is based on the average TVP values for the set of EA-6 countries; and a constant parameter model based on the FGLS-estimated coefficients in Box I.2 (CP FGLS). The objective is to assess what the yield dynamics might have looked like under a symmetric reaction to fundamental yield drivers. In order to assume cross-country symmetry, an average intercept value is taken in the fixed effects model. All three models predict much smoother profiles for Member States that underwent market stress, (41) reinforcing the notion that a large part of the sovereign bond dynamics observed during the 2008-09 financial crisis and the ensuing Great Recession were not driven by observed changes in country-specific fundamental determinants, but rather by differentiated and time-varying market reactions.
The models also present instances of downward price misalignment in both pre-crisis and post-crisis periods, when predicted yields are noticeably above actual yields.
(40) In the case of Greece, sovereign bonds were not eligible for the
PSPP. Therefore, the bond yield effects estimated for Greece derive mainly from the existence and potential of APP as a set of policy measures, rather than from actual purchases of securities in the Greek jurisdiction.
(41) The exception is Greece in the first quarter of 2012. This is due to an extreme spike in bid-ask spreads which more than rationalise, and possibly over-explain, the observed yields.
I.4. Conclusion
When the common currency was launched in 1999, exchange rate risks had been eliminated and sovereign funding costs had almost perfectly converged for the (at the time) euro area Member States. Sovereign interest rate differences across these countries remained negligible for almost a decade, also reflecting the strong credibility of the European Monetary Union project. The subsequent fragmentation of sovereign bond markets brought to the fore the double role played by sovereign funding costs in a monetary union. While they incentivise prudent fiscal policies at Member State level, excessive differences across Member States can hamper the transmission of monetary policy. Moreover, this differentiation is typically procyclical and can exacerbate divergences in economic performance across the euro area.
While sovereign bond yields represent a prominent indicator of sovereign credit risk, it has been shown that it reflects also other factors such as market liquidity and general investor sentiment. (42) The empirical assessment conducted in this Section confirms the role of these and other factors in driving bond yields in the euro area over time.
In particular model-based evidence suggests that heightened market sensitiveness to debt ratios, combined with an increase in debt levels, appear to have explained a large part of the asymmetric dynamics observed during the sovereign debt crisis and the Great Recession. Changes in market sensitiveness are seen to have evolved in a divergent manner during this period, increasing for some euro area economies, while decreasing for others, which is suggestive of flight-to-safety dynamics. At the same time, data on cross-border flows supports the notion of a flight-to-safety from "periphery" to "core" euro area economies, and also from the euro area to the US during the 2007-09 crisis period. In addition, bouts of illiquidity are seen to have driven yield peaks in periphery countries in the most acute phases of the crisis.
(42) Garcia-de-Andoain, C. and M. Kremer (2018), ‘Beyond spreads:
measuring sovereign market stress in the euro area’, ECB Working Paper Series, No. 2185 propose a composite indicator of sovereign bond market stress in the euro area. This indicator integrates measures of credit risk, volatility and liquidity at short-term and long-term government bond maturities into a broad measure of sovereign market stress.

22 | Quarterly Report on the Euro Area
While increased market sensitiveness to yield drivers can reflect fundamental country-specific issues, the divergent dynamics observed in the past also appear to be linked to an incomplete EMU architecture. An institutional setup that can contain abrupt and undue shifts in investors’ perceptions in crisis periods, as well as eliminate bouts of illiquidity and remove redenomination risk can deliver significant stability benefits for the euro area.
Over the past years, significant progress has been achieved in strengthening the EU's institutional framework, namely as regards the implementation of a banking union, the capital markets union initiatives and the introduction of new monetary policy tools. A number of additional reforms are warranted as discussed in the Commission’s
Reflection Paper on EMU, (43) which can potentially help to overcome the observed fragmentation in sovereign bond markets and address some of the issues reviewed in this Section. Such issues include i) the emergence of flight-to-safety dynamics observed within the euro area and with respect to the rest of the world; ii) the risk of bond market fragmentation experienced in the euro area, which could materialise again and foment broader financial market disintegration in periods of stress; iii) the risk of illiquidity spikes in such periods, which could transmit through the credit channel to the real economy; and iv) the risk of currency redenominations. In any case, given the prominent and continued role of debt ratios in driving yield dynamics, polices that are fiscally prudent and growth friendly remain an important complement to past or prospective improvements in the institutional setup of the euro area.
(43) See Buti, M., S. Deroose, J. Leandro, and G. Giudice (2017),
'Completing EMU', VoxEU.org, 13 July.

I. A retrospective look at sovereign bond dynamics in the euro area
Volume 17 No 4 | 23
(Continued on the next page)
Box I.2: A time-varying parameter analysis of sovereign bond yields in euro area countries
Time-varying parameter (TVP) models are particularly useful when causal relationships are unstable, or evolve, over time. They can help deal with different forms of model misspecification by allowing regression coefficients to evolve stochastically under some law of motion. The literature on TVP panel data models is limited, and this is particularly true of applications to bond yields. The authors are aware of two studies that apply a TVP approach to explain sovereign bond yields in the euro area. The first, by Bernoth and Erdogan, (1) applies a semi-parametric approach to derive common (i.e., not country-specific) TVPs for a time period running from 1999 to 2010. The second, by Paniagua, Sapena and Tamarit, (2) is the closest in nature to the approach developed in this subsection. Like Paniagua et al, country-specific TVPs are estimated to analyse sovereign bond yields in euro area countries since the year 2000 using state-space techniques. Differently from Paniagua et al, the panel explicitly includes Germany and the sample was prolonged to cover the 2014-18 period. A different, enlarged set of explanatory variables is also included, as well as a more flexible parameter structure. In particular, the panel regression model described in Box I.1 was adapted and expanded to a TVP context, and a model of the following form specified: 𝑦𝑦𝑖𝑖 ,𝑡𝑡 = 𝐼𝐼 ̅+ � 𝐼𝐼𝑖𝑖,𝑡𝑡 − 𝐼𝐼�̅ + 𝛽𝛽𝑟𝑟𝑟𝑟�����𝑟𝑟𝑟𝑟𝑡𝑡 + �𝛽𝛽𝑡𝑡
𝑟𝑟𝑟𝑟 − 𝛽𝛽𝑟𝑟𝑟𝑟������𝑟𝑟𝑟𝑟𝑡𝑡 + 𝛽𝛽𝑠𝑠𝑠𝑠𝑠𝑠𝑠𝑠𝑠𝑠��������𝑠𝑠𝑠𝑠𝑠𝑠𝑠𝑠𝑠𝑠𝑡𝑡 + �𝛽𝛽𝑠𝑠𝑠𝑠𝑠𝑠𝑠𝑠𝑠𝑠 𝑡𝑡 − 𝛽𝛽𝑠𝑠𝑠𝑠𝑠𝑠𝑠𝑠𝑠𝑠���������𝑠𝑠𝑠𝑠𝑠𝑠𝑠𝑠𝑠𝑠𝑡𝑡 + 𝛽𝛽𝑑𝑑𝑠𝑠𝑑𝑑𝑡𝑡�������𝑑𝑑𝑠𝑠𝑑𝑑𝑡𝑡𝑖𝑖 ,𝑡𝑡 +�𝛽𝛽𝑑𝑑𝑠𝑠𝑑𝑑𝑡𝑡 𝑖𝑖 ,𝑡𝑡 − 𝛽𝛽𝑑𝑑𝑠𝑠𝑑𝑑𝑡𝑡�������� 𝑑𝑑𝑠𝑠𝑑𝑑𝑡𝑡𝑖𝑖 ,𝑡𝑡 + 𝛽𝛽𝑔𝑔𝑟𝑟𝑠𝑠𝑔𝑔𝑡𝑡 ℎ����������𝑔𝑔𝑟𝑟𝑠𝑠𝑔𝑔𝑡𝑡ℎ𝑖𝑖,𝑡𝑡 + �𝛽𝛽𝑔𝑔𝑟𝑟𝑠𝑠𝑔𝑔𝑡𝑡 ℎ 𝑖𝑖 ,𝑡𝑡 − 𝛽𝛽𝑔𝑔𝑟𝑟𝑠𝑠𝑔𝑔𝑡𝑡 ℎ����������� 𝑔𝑔𝑟𝑟𝑠𝑠𝑔𝑔𝑡𝑡ℎ𝑖𝑖,𝑡𝑡 + 𝛽𝛽𝑟𝑟𝑖𝑖𝑠𝑠𝑟𝑟�������𝑟𝑟𝑖𝑖𝑠𝑠𝑟𝑟𝑡𝑡 + �𝛽𝛽𝑟𝑟𝑖𝑖𝑠𝑠𝑟𝑟 𝑖𝑖,𝑡𝑡 −
𝛽𝛽𝑟𝑟𝑖𝑖𝑠𝑠𝑟𝑟�������� 𝑟𝑟𝑖𝑖𝑠𝑠𝑟𝑟𝑡𝑡 + 𝛽𝛽𝑠𝑠𝑖𝑖𝑞𝑞�����𝑠𝑠𝑖𝑖𝑞𝑞𝑖𝑖,𝑡𝑡−1 + �𝛽𝛽𝑠𝑠𝑖𝑖𝑞𝑞 𝑖𝑖 ,𝑡𝑡 − 𝛽𝛽𝑠𝑠𝑖𝑖𝑞𝑞������ 𝑠𝑠𝑖𝑖𝑞𝑞𝑖𝑖,𝑡𝑡−1 + 𝛽𝛽𝐴𝐴𝐺𝐺𝐺𝐺�������𝐴𝐴𝐺𝐺𝐺𝐺𝑡𝑡 + �𝛽𝛽𝐴𝐴𝐺𝐺𝐺𝐺 𝑖𝑖 ,𝑡𝑡 − 𝛽𝛽𝐴𝐴𝐺𝐺𝐺𝐺��������𝐴𝐴𝐺𝐺𝐺𝐺𝑡𝑡 + 𝜀𝜀𝑖𝑖,𝑡𝑡 (1) An upper bar denotes a constant parameter that is common across countries. The meaning of the variables is the same as before: 𝑦𝑦𝑖𝑖 ,𝑡𝑡 , represents the 10-year sovereign bond yield for country i during month t; I represents an intercept; rf represents the short-term risk rate; slope represents the slope of the risk-free yield curve; debt is the debt-to-GDP ratio; growth is year-on-year GDP growth; risk represents a global risk factor; liq represents market liquidity; APP represents the effects of the Eurosystem’s asset purchase programmes; and ε is an error term. (3) For the β coefficient on variable j of country i, the specification allows for time-varying deviations from the constant parameter, �𝛽𝛽𝑗𝑗 𝑖𝑖 ,𝑡𝑡 − 𝛽𝛽𝑗𝑗����, which evolve in an autoregressive manner:
�𝛽𝛽𝑗𝑗 𝑖𝑖 ,𝑡𝑡 − 𝛽𝛽𝑗𝑗���� = 𝜌𝜌𝑖𝑖𝑗𝑗 �𝛽𝛽𝑗𝑗 𝑖𝑖 ,𝑡𝑡−𝑡𝑡 − 𝛽𝛽𝑗𝑗���� + 𝜇𝜇𝑖𝑖
𝑗𝑗 𝑐𝑐𝑦𝑦𝑐𝑐𝑠𝑠𝑖𝑖 ,𝑡𝑡 + 𝑢𝑢𝑖𝑖 ,𝑡𝑡𝑗𝑗 (2)
where ρ is an autoregressive parameter, µ is a “coefficient driver” and u is an error term. Like Paniagua et al (2017 the evolution of the TVPs is allowed to respond to an indicator of cyclical asymmetry in the euro area, the cyas variable, through the coefficient driver µ. (4) The rationale behind its inclusion is that macroeconomic divergences may influence market expectations regarding the future of a currency union. It should be noted that the time-varying coefficients on rf and slope are assumed common to all Member States and that the coefficient drivers are therefore turned off for these two variables. The model was estimated in three stages. Firstly, the constant parameters are estimated through feasible generalised least squares (FGLS). In a constant parameter (CP) panel data context this would be equivalent to (1) Bernoth, K. and B. Erdogan (2012), ‘Sovereign bond yield spreads: A time-varying coefficient approach’, Journal of International Money
and Finance, Vol. 31(3), pp. 639-656. (2) Paniagua, J., J. Sapena, J. and C. Tamarit (2016), ‘Sovereign debt spreads in EMU: The time-varying role of fundamentals and market
distrust’, Journal of Financial Stability, Vol. 33, pp. 187-206. The authors are grateful for the very useful exchanges with Juan Sapena on the estimation results presented in the aforementioned paper.
(3) For more details, please see Box I.1. (4) The cyas variable measures, for each country, the difference between its year-on-year GDP growth and that of Germany, deemed as
an “anchor country”. The associated coefficients, 𝜇𝜇𝑖𝑖𝑗𝑗 , were found to be significant in most of the state equations. Nevertheless,
removing cyas from our specification does not materially affect the results.

24 | Quarterly Report on the Euro Area
Box (continued)
(Continued on the next page)
assuming a random effects model. In a FGLS estimation, observations with higher variance are given less weight. In our exercise this offers the advantage of a less erratic profile for the residuals,(5) less fit of the constant parameter model and therefore more revealing dynamics for the TVPs. The fact that the Hausman test recommends the fixed effects model need not be an obstacle as this is a test between two types of CP models rather than between different types of TVP models. In fact, as will be seen, our specification allows for permanent “country effects” irrespective of the initial FGLS estimation. Secondly, given the CPs estimated via FGLS, the unexplained part of the 𝑦𝑦𝑖𝑖 ,𝑡𝑡 in the set of equations (1) is taken as the “signal equations” to be explained by the set of “state equations”. (2) In such a state-space setting, the time series for the TVP deviations from the CP, �𝛽𝛽𝑗𝑗 𝑖𝑖 ,𝑡𝑡 − 𝛽𝛽𝑗𝑗����, can be estimated with a Kalman filter. Let R
denote the covariance matrix of 𝜀𝜀𝑖𝑖 ,𝑡𝑡 and Q the covariance matrix of 𝑢𝑢𝑖𝑖 ,𝑡𝑡𝑗𝑗 . The Kalman filter estimation requires
initial guesses on R, Q, the set of 𝜌𝜌𝑖𝑖𝑗𝑗 and 𝜇𝜇𝑖𝑖
𝑗𝑗 , as well as starting values for 𝛽𝛽𝑗𝑗 𝑖𝑖 ,𝑡𝑡 − 𝛽𝛽𝑗𝑗���. An iterative procedure was followed whereby the Kalman filter is initially run by setting uninformed guesses on R and Q in the form of (scaled-down) identity matrices. Reversion of country-specific deviations to the constant parameters was assumed, and the initial 𝜌𝜌𝑖𝑖
𝑗𝑗 and 𝜇𝜇𝑖𝑖𝑗𝑗 were set to 0.9 and to zero, respectively. The exception are the TV intercepts
where the 𝜌𝜌𝑖𝑖𝐼𝐼 were set to one, thereby initially assuming a random walk, which allows country effects to be potentially permanent. Finally, the zero-period values of �𝛽𝛽𝑗𝑗 𝑖𝑖,𝑡𝑡 − 𝛽𝛽𝑗𝑗���� were to zero. Thirdly, an iterative procedure was run whereby the results of the Kalman filter estimation are used to formulate new initial guesses, until a good degree of convergence is achieved. All the constant parameters display the right sign and are significant at a X% significant level. The flexibility of the TVPs allows for a near-perfect fit of the model. Approximately half of the yield variance is explained by the CPs, with the rest being explained by the TVPs, with an overall R2 of close to 100%. (6) Table 1 summarises our estimation results.
Table 1: estimation results for a sovereign bond yield TVP panel data model 𝐼𝐼 𝛽𝛽𝑟𝑟𝑟𝑟 𝛽𝛽𝑠𝑠𝑠𝑠𝑠𝑠𝑠𝑠𝑠𝑠 𝛽𝛽𝑑𝑑𝑠𝑠𝑑𝑑𝑡𝑡 𝛽𝛽𝑔𝑔𝑟𝑟𝑠𝑠𝑔𝑔𝑡𝑡 ℎ 𝛽𝛽𝑟𝑟𝑖𝑖𝑠𝑠𝑟𝑟 𝛽𝛽𝑠𝑠𝑖𝑖𝑞𝑞 𝛽𝛽𝐴𝐴𝐺𝐺𝐺𝐺
Constant parameter
1.023 0.46 0.71 0.023 -0.03 0.13 1.7 -0.001
TVP deviations
[0.025, -0.017]
[0.005, -0.003]
[0.0007, -0.0005]
[0.128, -0.024]
[0.004, -0.007]
[0.003, -0.001]
[0.002, -0.001]
[0.001, -0.0104]
Note: the range across time and countries for the TVP deviations from the constant parameter is reported between squar brackets.
A look at Table 1 shows that the TVPs exhibiting the greatest (relative) variability are those associated with debt and APP. As in the fixed effects model estimated in the previous subsection, the debt ratio is a key determinant of bond yields and asymmetric market sensitiveness to this variable is a key driver of variability along the cross-section and the time-series dimensions. It can also be observed that none of the TVP deviations are sufficient to change the sign of the associated coefficient, with the exception of the debt coefficient for a particular country and quarter. This exception is discussed in the main text. The chart panels below provide decompositions for the evolution of 10-year sovereign bond yields for the 11 largest euro area economies. (5) For instance, in countries that have experienced acute market stress, spikes in illiquidity more than fully rationalise spikes in yields in
the peak period of the crisis under a fixed effects CP model, so that the resulting time series of the residuals follow an M shape, with the through observed precisely during the crisis peak. This is a counter-intuitive result which is avoided by FGLS estimation, which places a lower weight on this very erratic period and produces Λ-shaped residuals. Under FGLS estimation the effect of spikes in illiquidity are not over-explained by the constant liquidity parameter but rather by changes in country-specific TVPs.
(6) An R2 of 100% is a characteristic of the TVP approach and does not constitute, in itself, evidence in favour of our model specification.

I. A retrospective look at sovereign bond dynamics in the euro area
Volume 17 No 4 | 25
Box (continued)
Decomposition of the evolution of 10-year sovereign bond yields based on a panel TVP model

26 | Quarterly Report on the Euro Area
Box I.3: Actual yields vs. predicted yields from CP FGLS, FE-CI and EA-6 models
Note: the FE-CI model is based on the constant parameters shown in Box I.1 and on an average, common intercept; the EA-6 TVP model is based on the average TVPs for AT, BE, DE, FI, FR and NL; CP FGLS model is based on the constant parameters shown in Box I.2.

II. Completing the Capital Markets Union and its impact on economic resilience in the euro area
Volume 17 No 4 | 27
II.1. Introduction
The Capital Markets Union (CMU) plan is a combination of legislative and non-legislative initiatives aimed at mobilising capital in the European Union with a view to strengthening allocative efficiency, the diversification of capital flows, household and business liabilities, and facilitate private risk-sharing. (45) It aims to develop a more diversified financial ecosystem, by complementing traditional credit markets with deeper, more developed and more integrated capital markets. (46) The CMU could unlock a sizeable pool of capital around Europe that is currently allocated to cash and bank deposits. Unlocking this capital and making it work for the economy would give savers more investment choices while offering businesses a greater choice of funding sources at lower costs. This requires establishing a genuine single capital market in the EU where investors do not face barriers to cross-border investments and businesses can raise funding from a wide range of sources, irrespective
(44) This section was prepared by Eric Meyermans (DG ECFIN),
Christopher Uregian (DG ECFIN), Geert Van Campenhout (DG FISMA and KU Leuven) and Diego Valiante (DG FISMA and Bologna University). The paper represents the authors' views and not necessarily those of their respective affiliation. The authors gratefully acknowledge the comments of an anonymous referee and data support from Raluca Maran (DG FISMA).
(45) For example, cross-border holding of assets such as equity and fixed income instruments (but not cross-border bank financial flows). This may then lead to further convergence of prices and returns for financial assets and services as the cost for arbitrage comes down.
(46) The capital market provides longer-term financing and includes equity markets, corporate bond markets, as well as crowdfunding and securitisation markets.
of their location. (47) Notably, while delivering a well-functioning CMU requires more harmonised and simplified rules, and more consistent and efficient supervision, it does not require that all financial structures across Member States converge into a common one. (48)
The Five Presidents' Report (49) identified the convergence towards more resilient economic and social structures across Member States as an essential element for a successful Economic and Monetary Union (EMU). This section outlines why a well-functioning CMU is a crucial component of efforts to strengthen the resilience of Member States to economic shocks. (50)
The rest of this section is organised as follows: the second sub-section provides a brief overview of economic resilience in the euro area and its key elements. The third sub-section summarises the state of play of the CMU project as of late-2018, highlighting the elements that are especially (47) See https://ec.europa.eu/info/business-economy-euro/growth-
and-investment/capital-markets-union/what-capital-markets-union_en
(48) See, for instance, European Commission (2015), 'Action Plan on Building a Capital Markets Union – Economic Analysis', SWD(2015) 183 final.
(49) Juncker, J-C, in close cooperation with Tusk, D., J. Dijsselbloem, M. Draghi and M. Schulz (2015), The Five Presidents' Report: Completing Europe's Economic and Monetary Union. See also, Buti, M., S. Deroose, J. Leandro, and G. Giudice (2017), 'Completing EMU', at https://voxeu.org/article/completing-emu
(50) Economic resilience can be broken down into three main aspects: i) reducing economies' vulnerability to shocks; ii) increasing their shock-absorption capacity; and iii) increasing their ability to reallocate resources and recover from the shocks. See, for instance, Giudice, G., Hanson, J. and Z. Kontolemis (2018), 'Economic Resilience in EMU', Chapter 1 in Quarterly Report on the Euro Area, Vol. 17 No 2, pp. 9-15. See, also, Box II.1
This section examines how the deepening of the single market for capital can contribute to strengthening economic resilience in the euro area. First, it argues that ongoing policy action to establish a Capital Markets Union (CMU) should continue to focus on lowering the corporate sector's heavy reliance on banks, correcting the "home bias" of credit and capital markets, strengthening market transparency and reducing differences among regulatory and institutional frameworks. Next, the section describes the transmission channels through which a well-functioning CMU could reduce euro area Member States' vulnerability to shocks and increase their capacity to absorb and recover from those. For instance, a well-functioning CMU could help stabilise national income, strengthen the pass-through of policy interest rates, support banks' lending capacity via well-designed securitisation, facilitate the reallocation of resources and support aggregate demand. Finally, the CMU project should not be seen in isolation, but as part of the broader set of policies and reforms for completing the EMU architecture, notably the completion of the Banking Union and the setting up of macroeconomic stabilisation function. (44)

28 | Quarterly Report on the Euro Area
relevant to strengthen resilient economic structures across the euro area. The two following sub-sections describe in further detail the transmission channels through which the further completion of the CMU may affect economic resilience. In particular, the fourth sub-section explores how a well-functioning and integrated CMU may reduce the vulnerability of economies to shocks and may cushion their impact on output and employment by promoting private risk-sharing. The fifth sub-section discusses how the CMU may accelerate the recovery towards a sustainable growth path after a shock has taken place by facilitating the reallocation of resources and stimulating aggregate demand. The last sub-section concludes and presents the policy implications of the analysis.
The analysis in this section is based on a literature review and is of a qualitative nature, as it covers new structural changes for which not enough historical data is available to infer definitive conclusions. It lays out the conceptual framework and analytic elements for a better understanding of the role of the CMU project in the context of the reform of EMU.
It should be noted that an economy's resilience is also closely related to its growth potential. Capital markets have an impact on both resilience (through the risk absorption channel) and potential growth (through the innovation and productivity channel). On the one hand, economic resilience is a precondition for potential growth as, for example, it mitigates adverse hysteresis effects in both labour and capital markets.(51) It also fosters the macroeconomic stability required for private sector innovation and investment intermediated by the financial sector. On the other hand, strong sustainable growth fosters economic resilience as it facilitates the build-up of fiscal buffers to absorb shocks and the implementation of structural reforms that promote resource reallocation, for
(51) Hysteresis effects refer to economic events that persist despite the
factors that led to them eclipsing. For example, an increase in unemployment may persist even after a fall in aggregate demand that caused it has been reversed. Such labour market hysteresis effects can be triggered by deteriorating employee employability (e.g. skills erosion), availability (e.g. early retirement) or bargaining power (e.g. increasing insider bargaining power), as well as changes in labour market structure (such as increased labour market polarisation) and macro-economic conditions (such as secular stagnation). In capital markets, hysteresis effects may be caused by a lack of investments embedding the latest innovations and technological advances and an underuse of the exiting capital stock, as well as sunk costs that make, for instance, firms' entry and exit conditions asymmetric over the business cycle.
instance. This section will focus on the impact of the CMU on economic resilience and only briefly touch upon its implications for potential growth.
II.2. Weak economic resilience in the past
The large downturn that many euro area economies experienced following the global financial crisis that started in 2008 revealed their significant vulnerabilities that made them ill-prepared to smoothly absorb and adjust to the economic shocks that followed. Certain Member States were not only highly vulnerable — due, in particular, to accumulated current account imbalances, housing bubbles and high private indebtedness — but also had limited capacity to absorb shocks. This resulted in large and persistent drops in output (relative to the size and complexity of the shocks themselves). Unwinding these imbalances led to sharp increases in sovereign debt via in particular the sovereign-bank feedback loop. It also created spill-over effects across Member States that endangered the stability of the euro area as a whole and marked a period of economic and financial divergence among Member States.
The risk of growing economic divergence among Member States called into question the sustainability of the single currency. More resilient euro area economies will be less likely to develop vulnerabilities and better equipped to absorb and recover from shocks (see Box II.1).This will reduce economic divergence among Member States and also mitigate the strong spill-over effects across the euro area witnessed especially through the national retrenchment of financial flows during the crisis.
More resilient economic and financial structures may also play an important role in synchronising business and financial cycles across Member States. Business cycles of euro area Member States have become increasingly synchronised over the last decades due to monetary unification, policy convergence and trade integration.(52) However, the recent crisis showed that the amplitude of business cycles still differs across Member States, reflecting critical weaknesses in both domestic and European-level economic and financial structures. (52) On the impact of monetary policy unification, see Bayoumi,T. and
B. Eichengreen (2017), ’Aftershocks of Monetary Unification: Hysteresis with a Financial Twist’, IMF Working Paper No. 17/55. On the impact of trade integration, see Jolles, M. and E. Meyermans (2018), 'Economic resilience, the Single Market and EMU: a self-reinforcing interaction', Quarterly Report on the Euro Area, Vol. 17, No. 1, pp. 7-22.

II. Completing the Capital Markets Union and its impact on economic resilience in the euro area
Volume 17 No 4 | 29
Preventing such boom-bust cycles and reducing the impact of economic shocks will help Member States' business cycles synchronise further, ensuring better transmission of the single monetary policy and strengthening the capacity of the euro area as a whole to withstand shocks.(53)Finally, the real convergence during the first decade of EMU largely coincided with structural divergence, with the economies at the core relying more on tradeables, while those of the periphery were increasingly dominated by non-tradable sectors.(54) Since then,
(53) Remarks by Vítor Constâncio (2017),’Growth, adjustment and
resilience in the euro area,’ available at: https://www.ecb.europa.eu/press/key/date/2017/html/ecb.sp170901.en.html.
(54) See Buti, M. and A. Turrini (2015), ‘Three waves of convergence. Can Eurozone countries start growing together again?’, Vox, April
structural reforms at national level, supportive monetary policy and reforms at the EMU level, including the CMU, will help promote structural convergence.(55) Several factors shape a Member State's economic resilience, including the working of markets, structural characteristics such as trade openness and the quality of institutional frameworks. (56) The following sub-sections focus on the building of a CMU and its impact on economic resilience.
2015, and Marelli, E and M Signorelli (2005), ‘Institutional, nominal, and real convergence in Europe’, Banks and Bank Systems Vol. 5, pp. 140-155.
(55) See Buti, M. and A. Turrini (2015), op cit. (56) See Box II.1 and references therein.
Box II.1: Economic resilience
Economic resilience is defined as the ability of a country to avoid or withstand a shock and for output to recover quickly to its potential level after the onset of the recession and has thus three main aspects: (i) the vulnerability to shocks; (ii) the shock absorption capacity; and (iii) the ability to recover quickly after a shock. (1)
Vulnerability refers to whether and how strongly a shock hits the economy. It reflects exposure to shocks, their frequency and intensity. Given that a country's vulnerability depends on a number of parameters that vary from country to country (such as the structure of the economy, various policy settings, the financial sector and asset markets, and the state of the non-financial sector), some countries will be more exposed than others to the same shock.
Absorption capacity reflects the ability of an economy to cushion the direct impact of a shock and thus minimise immediate output and job losses. A shock can be absorbed by spreading its effects across the economy –to other variables than employment and output – and over time, for example through automatic stabilisers, responsive wages and prices, as well as via credit and financial risk sharing.
The ability of an economy to recover affects the extent to which a shock has persistent effects on the economy. It reflects a country's capacity to ensure a swift return to the previous status in case of a temporary shock or the smooth reallocation of productive resources. (2) The necessary adjustment or reallocation depends on the type of shock, with permanent shocks requiring a more significant reallocation of resources. The speed of the adjustment or reallocation also matters: faster processes lead to stronger recoveries.
Hence, resilient economic and financial structures can be defined as those which prevent economic shocks from having significant and persistent effects on income and employment levels, and thus are able to reduce the impact of economic fluctuations. This is particularly relevant in a monetary union where the policy instruments to address asymmetric negative economic events are more limited. In addition, inflation differentials in a monetary union can exacerbate real interest rate differentials, which in turn can magnify shocks by fuelling economic booms. (1) The concept of resilience has attracted considerable attention recently at research and policy level. In September 2017, the Eurogroup
discussed a note prepared by DG ECFIN with the theme of “Economic Resilience in EMU”. In March 2017, the German Presidency of the G20 issued a set of "resilience principles" for the G20 countries; "Note on Resilience Principles in G20 countries". The OECD has undertaken further work in this area, building on its early research showing that shocks are more persistent in countries with rigid product and labour markets (see: https://www.oecd.org/eco/growth/economic-resilience.htm and in particular Duval, R. and L. Vogel (2008), Caldera-Sanchez, A., A. de Serres, F. Gori, M. Hermansen and O. Röhn (2016). Important contributions to this debate have also been provided by the IMF and ECB, as summarized in IMF (2016), 'A Macroeconomic Perspective on Resilience', Note to the G20.
(2) On the impact of the Single Market on resilience, see for example, Jolles, M. and E. Meyermans (2018), 'Economic resilience, the Single Market and EMU: a self-reinforcing interaction', Quarterly Report on the Euro Area, Vol. 17, No. 1, pp. 7-22.
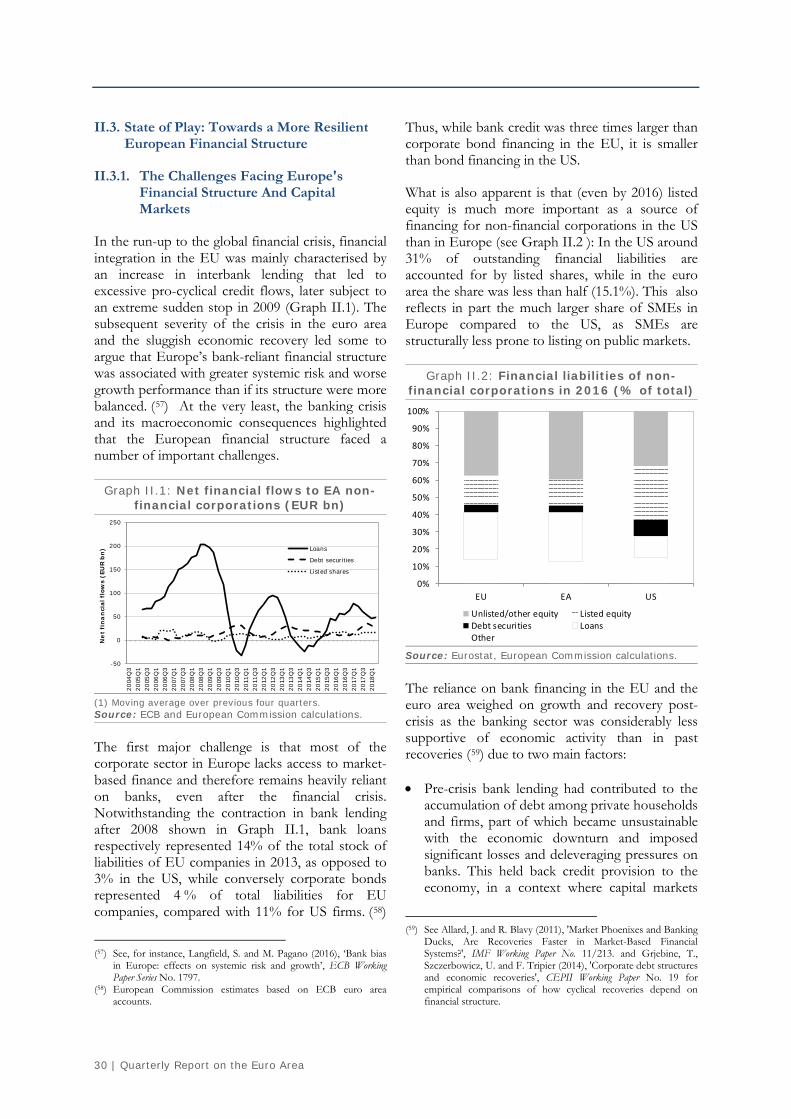
30 | Quarterly Report on the Euro Area
II.3. State of Play: Towards a More Resilient European Financial Structure
II.3.1. The Challenges Facing Europe's Financial Structure And Capital Markets
In the run-up to the global financial crisis, financial integration in the EU was mainly characterised by an increase in interbank lending that led to excessive pro-cyclical credit flows, later subject to an extreme sudden stop in 2009 (Graph II.1). The subsequent severity of the crisis in the euro area and the sluggish economic recovery led some to argue that Europe’s bank-reliant financial structure was associated with greater systemic risk and worse growth performance than if its structure were more balanced. (57) At the very least, the banking crisis and its macroeconomic consequences highlighted that the European financial structure faced a number of important challenges.
Graph II.1: Net financial flows to EA non-financial corporations (EUR bn)
(1) Moving average over previous four quarters. Source: ECB and European Commission calculations.
The first major challenge is that most of the corporate sector in Europe lacks access to market-based finance and therefore remains heavily reliant on banks, even after the financial crisis. Notwithstanding the contraction in bank lending after 2008 shown in Graph II.1, bank loans respectively represented 14% of the total stock of liabilities of EU companies in 2013, as opposed to 3% in the US, while conversely corporate bonds represented 4 % of total liabilities for EU companies, compared with 11% for US firms. (58)
(57) See, for instance, Langfield, S. and M. Pagano (2016), ‘Bank bias
in Europe: effects on systemic risk and growth’, ECB Working Paper Series No. 1797.
(58) European Commission estimates based on ECB euro area accounts.
Thus, while bank credit was three times larger than corporate bond financing in the EU, it is smaller than bond financing in the US.
What is also apparent is that (even by 2016) listed equity is much more important as a source of financing for non-financial corporations in the US than in Europe (see Graph II.2 ): In the US around 31% of outstanding financial liabilities are accounted for by listed shares, while in the euro area the share was less than half (15.1%). This also reflects in part the much larger share of SMEs in Europe compared to the US, as SMEs are structurally less prone to listing on public markets.
Graph II.2: Financial liabilities of non-financial corporations in 2016 (% of total)
Source: Eurostat, European Commission calculations.
The reliance on bank financing in the EU and the euro area weighed on growth and recovery post-crisis as the banking sector was considerably less supportive of economic activity than in past recoveries (59) due to two main factors:
• Pre-crisis bank lending had contributed to the accumulation of debt among private households and firms, part of which became unsustainable with the economic downturn and imposed significant losses and deleveraging pressures on banks. This held back credit provision to the economy, in a context where capital markets
(59) See Allard, J. and R. Blavy (2011), 'Market Phoenixes and Banking
Ducks, Are Recoveries Faster in Market-Based Financial Systems?', IMF Working Paper No. 11/213. and Grjebine, T., Szczerbowicz, U. and F. Tripier (2014), 'Corporate debt structures and economic recoveries', CEPII Working Paper No. 19 for empirical comparisons of how cyclical recoveries depend on financial structure.
-50
0
50
100
150
200
250
2004
Q3
2005
Q1
2005
Q3
2006
Q1
2006
Q3
2007
Q1
2007
Q3
2008
Q1
2008
Q3
2009
Q1
2009
Q3
2010
Q1
2010
Q3
2011
Q1
2011
Q3
2012
Q1
2012
Q3
2013
Q1
2013
Q3
2014
Q1
2014
Q3
2015
Q1
2015
Q3
2016
Q1
2016
Q3
2017
Q1
2017
Q3
2018
Q1
Ne
t fi
na
nci
al f
low
s (E
UR
bn
) Loans
Debt securities
Listed shares
0%
10%
20%
30%
40%
50%
60%
70%
80%
90%
100%
EU EA US
Unlisted/other equity Listed equityDebt securities LoansOther

II. Completing the Capital Markets Union and its impact on economic resilience in the euro area
Volume 17 No 4 | 31
were underdeveloped and could therefore not offer funding alternatives. (60)
• EU banks reduced their cross-border activities, (61) particularly in EU Member States heavily exposed to stress in sovereign bond markets. Capital flows reversed, despite the anchor offered by a common currency area. The worsening in funding conditions and the instability in financial markets contributed to deepening the recessions, increasing the share of non-performing loans in banks' balance sheets, and further reducing their capacity to supply new loans. (62)
With bank lending curtailed after the financial crisis, viable enterprises, and particularly SMEs had difficulties accessing alternative funding sources, especially in vulnerable Member States where alternative channels via capital markets remain under-developed.(63)
Notwithstanding bank deleveraging in certain Member States, as shown in Graph II.1, bank loans still represent as large a share of net financial flows to non-financial corporations in the euro area as bonds and listed shares in 2017. This lack of financial diversification, notably the low recourse to equity, poses a systemic risk caused by the volatility of non-equity financial flows when there is a structural shock. (64)
(60) See IMF Global Financial Stability Report 2014 and IMF Global
Financial Stability Report 2015. (61) See Reinhart, C. M. and Rogoff, K.S. (2009), 'The Aftermath of
Financial Crises', American Economic Review Vol. 99, No. 2, pp. 466-72 and Reinhart, C. M. and Rogoff, K.S. (2010), ‘Growth in a Time of Debt’, American Economic Review Vol. 100, No. 2, pp. 573–78.
(62) See Al-Eyd, A. and S. Pelin Berkmen (2013), 'Fragmentation and Monetary Policy in the Euro Area', IMF Working Paper No. 13/208, and Balduzzi, P., Brancati, E. and F. Schiantarelli (2013), 'Financial Markets, Banks' Cost of Funding, and Firms' Decisions: Lessons from Two Crises', IZA Dicussion Paper No. 7872.
(63) See European Commission (2013a), Ex ante assessment of the EU SME Initiative, Staff Working Document SWD(2013)517. This is also documented through the semi-annual surveys on the access to finance of enterprises (SAFE) and the quarterly ECB Bank Lending Survey. For an economic analysis of the issue, see also Hoffmann, M. and Sørensen, B. E. (2015), 'Small firms and domestic bank dependence in Europe's Great Recession', DG ECFIN Discussion Paper No. 12.
(64) See, for instance, Langfield, S. and M. Pagano (2016), ‘Bank bias in Europe: effects on systemic risk and growth’, ECB Working Paper Series No. 1797 and European Commission (2013b), 'Green Paper on the Long-term Financing of the European Economy', COM/2013/0150 final.
The second major challenge is that the banking sector and, more acutely, capital markets still show a strong "home bias" rather than being integrated across Member States. Economic theory has long conjectured a link between cross-border financial integration (via the capital and bank credit market channels), risk-sharing and higher economic growth through a "risk-amelioration" channel. (65) By giving access to foreign assets, capital markets provide stable revenues to investors when domestic income sources deteriorate. The bank credit market channel assumes that cross-border banks with diversified asset pool would be more able to provide funding to an economy with weakening economic activity than domestic banks with concentrated exposure to the local economy.
In practice, however, both market and bank-based financial channels remain underdeveloped in the euro area and broke down during the financial crisis, reducing significantly the cushioning effect of diversification and cross-border risk-sharing. First, the decline in lending by the domestic banking sector during the crisis in vulnerable Member States was not compensated by increased lending by EU-wide banks, resulting in an overall credit supply decline for the economy. (66) This is in contrast to the US and Japan, where cross-regional banks have had an important role in smoothing the impact of local recessions. (67)
Secondly, a review of the crisis literature suggests the low degree of private risk-sharing in the EU and the euro area during the crisis reflected particularly weak capital markets and related factor income flows. (68) In fact, studies have found that the capital market channel amplified output shocks during the financial crisis in the euro area, (69) reflecting the strong fragmentation and home bias effects.
(65) See Obstfeld, M. (1994), 'Risk-taking, global diversification, and
growth', American Economic Review, Vol. 84, NO. 5, pp. 1310-1329. (66) See Demyanyk, Y., Ostergaard, C. and B. Sørensen (2008), 'Risk
sharing and portfolio allocation in EMU', DG ECFIN Economic Paper No. 334.
(67) See Hoffmann, M. and B. Sørensen, (2015), 'Small firms and domestic bank dependence in Europe's Great Recession', DG ECFIN Discussion Paper No. 12.
(68) See Anderson, N, Brooke, M, Hume, M. and M. Kürtösiová (2015), 'A European Capital Markets Union: implications for growth and stability', Bank of England Financial Stability Paper No. 33. and the studies quoted therein
(69) See Furceri and Zdzienicka (2013), Bijlsma and Zwart (2014).

32 | Quarterly Report on the Euro Area
Home bias - measured as the holding of domestic assets versus their optimal intra-EU allocation - remains very high even after the crisis, especially in equity instruments as shown in Graph II.3. Despite a slightly declining trend in the two previous years, in 2015 domestic equity investments in the EU and the euro area were over 85 % overweight in domestic investment portfolios vis-à-vis the average weight of domestic equity markets in the EU total. Other research has also corroborated that home bias in equity holdings in the EU remains very high after the financial crisis. (70) For bond holdings, the home bias was lower than for equity holdings for both the EU and the euro area (around 64 % and 56 % respectively) but still pronounced. In effect, the geographical diversification of the financial system in Europe is still far from optimal and there are only timid signs in the post-crisis period that the financial integration process is moving towards a more diversified path. Overall, euro area Member States have the lowest home bias within the EU-28, some 20 percentage points lower than in the Central and Eastern Europe (CEE) countries. After 2008, home bias in the euro area core countries has been stable at around 70 %, while home bias for CEE countries has been falling over time to 88 % in 2015. CEE countries' debt home bias felt after the crisis as their search for less risky
(70) See Schoenmaker D. and C. Soeter (2014), 'New evidence on the
Home Bias in European Investments', DSF Policy Briefs No. 34.
debt investment drove them towards core euro area debt investments. (71)
As a consequence of this limited cross-border financial integration in banking, and capital markets in particular, significant differences in financing conditions between EU and especially euro area countries arose during the crisis, slowing the recovery and undermining economic convergence. (72)
The third big challenge that emerged after the crisis was the lack of transparency of financial institutions, especially when dealing with capital markets instruments (such as over-the-counter derivatives), and the shortcomings in a fragmented regulatory and supervisory oversight. Under the G20 guidance, major reforms in EU capital markets were introduced, with a view to (i) ensuring market transparency and restoring investor confidence; (ii) providing more options for funding and easier access to capital markets especially for retail investors, entrepreneurs and companies in all stages of their business development, as well as (iii) fostering financial stability.
In particular, actions, such as the "Markets in Financial Instruments Directive (MiFID 2)" (73), (71) European Commission (2018), Commission staff working
document on the movement of capital and the freedom of payments, SWD(2018) final, pp. 70.
(72) See Anderson et al. (2015), op cit. and the studies quoted therein. (73) Directive 2014/65/EU repealing Directive 2004/39/EC.
Graph II.3: Quantity-based financial integration (home bias) in Europe
(1) The graphs above show home bias measured as the holding of domestic assets versus their optimal intra-EU allocation in investment portfolios. 100% implies full holding of domestic assets while 0% implies the optimal intra-EU allocation. (2) No data for Croatia. Source: European Commission (JRC) calculations using National Accounts data from Eurostat for equity and BIS debt securities statistics (no selection is made on the issuer sector) for debt. The bilateral foreign portfolio size is from the FinFlows database.
50%
55%
60%
65%
70%
75%
80%
85%
90%
95%
100%
2000
2001
2002
2003
2004
2005
2006
2007
2008
2009
2010
2011
2012
2013
2014
2015
Debt EU27 EA
50%
55%
60%
65%
70%
75%
80%
85%
90%
95%
100%
2000
2001
2002
2003
2004
2005
2006
2007
2008
2009
2010
2011
2012
2013
2014
2015
EquityEU27 EA

II. Completing the Capital Markets Union and its impact on economic resilience in the euro area
Volume 17 No 4 | 33
the associated regulation (MiFIR) (74) and the European Markets Infrastructure Regulation (75), increased the transparency of capital market instruments, improved market structure rules and strengthened the investor protection regime.
The European Union also created a set of regulatory agencies, called the European Securities and Markets Authority (ESMA), (76) the European Insurance and Occupation Pension Authority (EIOPA) (77) and the European Banking Authority (EBA), (78) to promote greater regulatory and supervisory convergence among Member States on macro prudential surveillance, as well as micro prudential and conduct supervision.
Despite these reforms, European capital markets remain largely fragmented, as businesses and firms are unable to access funding and investment products on equal terms. For example, there is a wide divergence in the retail investment product market, where the median entry fee for equity funds across Member States ranges from as low as 0.30 % to as high as 5 %. (79)
II.3.2. The Capital Markets Union Action Plan
In light of these ongoing challenges facing the European financial architecture, the European Commission adopted the Capital Markets Union (CMU) action plan (80) in September 2015, setting out a list of actions to establish the building blocks of more integrated capital markets in the EU. (81) This action plan was subsequently reviewed in June 2017 and March 2018. (82)
(74) Regulation (EU) n. 600/2014. (75) Regulation (EU) n. 648/2012. (76) Regulation (EU) n. 1095/2010. (77) Regulation (EU) n. 1094/2010. (78) Regulation (EU) n. 1093/2010. (79) See Deloitte Luxembourg (2018), 'Distribution systems of retail
investment products across the European Union', Final report (80) European Commission (2015), Action Plan on Building a Capital
Markets Union, COM (2015) 468 final. (81) An up-to-date overview of progress achieved and next steps for
each area of intervention in the CMU action plan are readily available on the FISMA website at https://ec.europa.eu/info/business-economy-euro/growth-and-investment/capital-markets-union/capital-markets-union-action-plan_en
(82) Communications on the mid-term review (COM(2017) 292 final),on accelerating reforms (COM (2018) 114 final) and financing sustainable growth (COM(2018) 97 final) introduced new priorities, but without changing the spirit of the action plan. In June 2017, a mid-term review of the CMU action plan found that 20 (out of the 33) policy actions had been delivered. Another 38 actions, including 9 priority actions were identified in the mid-term review while eight actions were identified in the
The key objectives of the CMU action plan are to:
• Support private and public investments that can fund innovation and boost jobs and growth via the productivity channel; and
• Promote a more sustainable financial integration process via the greater stability offered by more diversified capital flows and the development of a capital market architecture that connects all European capital markets on equal terms for businesses and citizens.
At a pan-European level, the CMU action plan promotes greater cross-border:
• Data availability and comparability ;
• Accessibility to markets and products (with fair access);
• Enforcement of rules and procedures to ensure legal certainty and investor confidence.
To operationalise these objectives, the CMU action plan has identified six sectorial areas for intervention, including actions to promote financing for innovative start-ups and scale ups, start-ups and unlisted companies, to support fund raising on public markets, to strengthen the banking sector capacity via capital markets tools, to remove barriers to cross-border investments and to promote long-term investments and retail investor participation.
Finally, it is important to stress that the CMU action plan complements the G20 financial reforms introduced at European level, as well as the Banking Union reforms. The Banking Union reforms, inter alia, was launched to increase banking sector resilience and to break the bank-sovereign feedback loop, exacerbated by the euro are sovereign debt crisis, by creating a common safety net for deposits, common bank supervision and a single resolution mechanism. By developing European capital markets and related non-bank funding for the economy, the CMU is truly complementary to Banking Union reforms.
Communications on accelerating reforms and financing sustainable growth . See the reference in the previous footnote for the latest state of play.

34 | Quarterly Report on the Euro Area
II.4. How can CMU reduce vulnerability and strengthen shock absorption
An economy's absorption capacity reflects its ability to cushion the direct impact of any shock on output and employment by spreading its effects across the economy to other variables, such as (financial and non-financial asset) prices and wages, as well as over time (via consumption) or over borders by risk-sharing via financial markets. (83)
International capital markets (as market-based funding) allow for private (cross-sectional) risk-sharing in the face of permanent shocks, such as an adverse productivity shock that lowers GDP levels via lower returns on capital (as production factor). (84) As a result, while shocks will be still transmitted to the economy via firms (e.g. higher corporate spreads) and investors (e.g. capital
(83) See, for instance, Giudice et al. (2018), op cit. (84) See, for instance, Valiante, D. (2016), Europe’s Untapped Capital
Market: Rethinking financial integration after the crisis, CEPS Paperback, London: Rowman & Littlefield International, Valiante, D. (2018), 'Risk sharing and financial integration: how can the Capital Markets Union deliver?', in Andritzky J. and J. Rocholl (eds.), Towards a more resilient Euro Area, ebook available at https://www.ceps.eu/publications/towards-more-resilient-euro-area and Martinez, J. and T. Philippon (2014), ‘Does a Currency Union Need a Capital Market Union?’, 15thJacques Polak Annual Research Conference, International Monetary Fund, 13–14 November 2014.
losses), risk dispersion in capital markets provides a spatial redistribution of risk to a larger set of actors, so reducing its systemic implications (e.g. knock-on effects on specific parts of the financial sector).
International credit markets (as institution-based funding) also allow for the risk-sharing of temporary shocks, such as consumption smoothening in the face of a temporary demand shock. In effect, risk concentration via a banking institution provides a temporal redistribution of risk, which is very effective when the shock is temporary and allows for recovery over a relatively short timeframe (compared to a structural shock).
Public (fiscal) risk-sharing, in some instances, supplements private risk sharing via capital and credit markets, as there are limits to the shock absorption that can be provided by Banking Union and Capital Markets Union. There is evidence that suggests that while in moderate downturns private financial markets can provide sufficient shock absorption, in times of acute market stress they have to be complemented by a credible central fiscal capacity to limit the risk that they would behave pro-cyclically. (85) For example, the credit channel froze during the recent euro area crisis and
(85) Buti, M. and N. Carnot (2018), ‘The case for a central fiscal
capacity in EMU’ Vox, 8th December 2018.
Graph II.4: Risk-sharing in Europe and US: 1963-2014 (% of shock absorbed)
(1) The absorption of a shock is measured based on the methodology developed by Asdrubali et al. (1996). (2) "Fiscal transfer" does not include crisis intervention via intergovernmental agreements, like the European Stability Mechanism (ESM). Source: Valiante (2018) based on Furceri & Zdzienicka (2013), Asdrubali et al. (1996) and Milano & Reichlin (2017).

II. Completing the Capital Markets Union and its impact on economic resilience in the euro area
Volume 17 No 4 | 35
actually worked in reverse. (86) Some studies also find that financial markets are not Pareto-efficient as private agents fail to hold the kinds of portfolios ensuring proper risk sharing in large shocks. (87) Nevertheless, as CMU promotes private risk-sharing, the need for using public stabilisation tools to cushion local shocks may decrease. (88)
The available empirical research summarised in Graph II.4 suggests that financial markets absorbed only a minor fraction of the shock in the euro area in the period 2007 to 2014, and actually amplified the shock (negative absorption) in the European Union over the period 1979 to 2010.
This is particularly true for euro area countries where other factors, such as market concerns about public debt sustainability, not only limited their fiscal capacity to act counter-cyclically but also hampered the liquidity of local financial markets, resulting in a further reduction of the private risk-sharing channel. (89) Moreover, in the euro area, most of the absorption via financial markets was carried out by credit markets rather than capital markets. (90) The empirical analysis summarised in Graph II.4 shows that although the fiscal channel's contribution to absorption tends to increase in systemic crises, it has never exceeded the contribution of private risk-sharing channels. The analysis also shows that most of the structural shocks in the euro area remained unsmoothed and thus drastically reduced consumption levels. (91)
A well-functioning, diversified and integrated CMU increases an economy’s absorption capacity via direct channels, like cross-border interest and (86) Furceri and Zdzienicka (2013), 'The euro area crisis: Need for a
supranational fiscal risk sharing mechanism? ', Open Economies Review Vol. 26, No. 4, pp. 683-710.
(87) Fahri E and I Werning (2017), 'Fiscal Unions', American Economic Review, Vol. 107, No 12, pp.3788-3834.
(88) See, for instance, Draghi, M. (2018), 'Hearing of the Committee on Economic and Monetary Affairs of the European Parliament', Introductory statement at the ECON committee of the European Parliament.
(89) See Kalemli-Ozcan et al. (2014) and, Alcidi et al. (2017). (90) See, for instance, Furceri, D. and M. Zdzienicka (2013), 'The Euro
Area Crisis: Need for a Supranational Fiscal Risk Sharing Mechanism?', IMF Staff Discussion Note No. 13-198.
(91) Another study comparing risk-sharing in the euro area (1999-2015) and US (1964-2013) not summarised in Graph II.4 had similar findings. In particular, it found that: (i) close to 80% of shocks were unsmoothed in the euro area as opposed to just 20% in the US; and (ii) the share of shocks absorbed by the cross-border capital and labour income channel was much lower in the Eurozone than in the US (6% versus 40% respectively). See European Commission (2016) “Cross-border risk sharing after asymmetric shocks: evidence from the euro area and the United States”, Quarterly Report on the Euro Area 15(2).
dividend payments or capital gains/losses, as well as indirect ones, such as supporting a more resilient banking system and a more effective monetary policy function.
While more integrated banking and capital markets do provide broader protection from shocks and support capital mobility in a single currency area, Banking Union and CMU have complementary stability implications for the risk absorption capacity of the Euro Area. The Banking Union strengthens the intertemporal risk-sharing channel, which is very effective against temporary shocks that do not affect permanent income and the capacity to service loans. CMU's cross-sectional risk-sharing capability, instead, facilitates the absorption of structural shocks that affect permanent income and helps to minimise impact on national income via risk dispersion and diversification that follow from the cross-border holding of assets. As a result, market-based funding (which is promoted by CMU) is anti-cyclical as it absorbs shocks through instant market evaluation via secondary markets. By contrast, bank lending is strongly pro-cyclical: credit rationing during shocks occurs in order to allow for the gradual (intertemporal) absorption of losses, making bank lending more susceptible to sudden stops.
A well-functioning CMU also strengthens the effectiveness of a single monetary policy (92) because it reduces financial market fragmentation and frictions on policy transmission to the banking and non-banking sector, (93)) which in turn strengthens the pass-through of the policy interest rate to market interest rates. (94) This mechanism is (92) On the transmission of single monetary policy, see, for instance,
https://www.ecb.europa.eu/mopo/intro/transmission/html/index.en.html
(93) Fragmentation may arise from differences in tax treatment of debt and equity or legal definitions across Member States, as well as other factors (see European Commission Staff Working Document (2015) 183 final). Abascala, M., Alonsoa, T. and S. Mayordomob (2013), 'Fragmentation in European Financial Markets: Measures, Determinants, and Policy Solutions', BBVA Working Papers No 13/22, apply an econometric analysis to find that counterparty risk and financing costs, as well as banking sector openness, debt-to-GDP and the relative size of the financial sector were the most significant determinants of inter-bank fragmentation observed during the crisis.
(94) In turn, a well-designed common monetary policy may improve the functioning of CMU. For instance, Roberto A. De Santis, André Geis, Aiste Juskaite and Lia Vaz Cruz 'The impact of the corporate sector purchase programme on corporate bond markets and the financing of euro area non-financial corporations', ECB Economic Bulletin, Issue 3 / 2018 report that the ECB’s corporate sector purchase programme (CSPP) which started on 8 June 2016 and whereby the Eurosystem purchases securities issued by non-bank corporations in both the primary and the

36 | Quarterly Report on the Euro Area
especially important to absorb temporary idiosyncratic shocks. (95) By promoting convergence towards a more resilient and consistent financial structure across the euro area, a single monetary policy becomes even more appropriate for all euro area Member States, reducing the probability that country-specific pockets of vulnerability emerge. (96)
Moreover, the CMU can facilitate the functioning of the banking sector that in turn may stabilise the supply of credit following a shock to smoothen aggregate demand. For example, the CMU mid-term review includes a number of actions to develop secondary markets for non-performing loans, facilitating their gradual disposal by banks, thus strengthening the latter’s balance sheets and lending capacity.
Lastly, cross-border equity investment and foreign ownership of financial institutions — facilitated by the further deepening of the CMU — may work as shock absorber. For example, some argue that the large degree of foreign ownership of domestic banks was shown to act as a loss absorber in Bulgaria and the three Baltic Member States following the sudden stop in capital flows at the height of the global financial crisis. (97) However, if foreign banks experience adverse shocks in their home country, they may start pulling back capital from their foreign subsidiaries, resulting in negative spill-over effects. (98)
secondary market, improved considerably corporate bond market functioning and liquidity conditions.
(95) Of course, this does not mean that for instance interest rates will be the same across euro area Member States as such differences may also reflect differences in country risks.
(96) See, for instance, Cœuré, B. (2017), ‘Convergence matters for monetary policy’, speech delivered at the Competitiveness Research Network (CompNet) conference on ‘Innovation, firm size, productivity and imbalances in the age of de-globalisation’.
(97) Gros, D. and C. Alcidi (2015), 'Country adjustment to a ‘sudden stop’: Does the euro make a difference?', International Economics and Economic Policy, Vol. 12, No. 1, pp 5-20. Here it should also be noted that, for instance, De Haas, R., Korniyenko, Y., Loukoianova, E. and A. Pivovarsky (2017), 'Foreign Banks and the Vienna Initiative: Turning Sinners into Saints?', IMF Working Paper WP/12/117 argue that with the Vienna Initiative inaugurated on January 23rd 2009 17 parent banks pledged to maintain their exposures to Central and Eastern European banks and to recapitalise subsidiaries for the duration of the IMF-EU programs - thereby overcoming the fear that while it would be in the collective interest of banks to roll-over debt, the absence of a coordination mechanism could lead individual banks to withdraw.
(98) Alcidi, C. and G. Thirion (2016), 'Assessing the Effect of Shocks in the Euro Area’s Shock Absorption Capacity - Risk-sharing, consumption smoothing and fiscal policies', CEPS Special Report No. 146.
II.5. How can CMU contribute to economic recovery
Policies that support economic recovery matter given that financial crises, and banking crises in particular, have a negative and rather persistent effect on output. (99) More broadly, a recovery involves closing the output gap by reallocating resources and raising aggregate demand. (100)
A well-functioning CMU would facilitate resource reallocation by stimulating cross-border investment and by facilitating firms’ entry and exit. In addition, it will help correct the pro-cyclical bias in credit supply of the banking sector.
First, banks may deleverage by reducing credit to the private sector, thereby slowing economic recovery. By allowing banks to sell some of their assets to investors, securitisation provides them with a tool to deleverage without cutting credit provision to the private sector. (101). Well-designed securitisation (102) may thus make the credit supply less pro-cyclical by allowing banks to generate new lending to households and SMEs while avoiding the pitfalls of the US experience .
Secondly and more importantly, CMU can help viable credit-constrained firms diversify their funding. Many European firms, and especially SMEs, were credit constrained during the crisis, (103) and in the absence of well-functioning financial markets, SMEs in particular lack sufficient access to diversified sources of finance to realise
(99) See, for instance, Cerra, V. and S.C. Saxena (2008) 'Growth
dynamics: the myth of economic recovery', American Economic Review, Vol. 98, No. 1, pp.439-457 and Reinhart, C.M. and K.S. Rogoff, (2014) 'Recovery from financial crises: Evidence from 100 episodes', American Economic Review, Vol. 104, No. 5, pp.50-55.
(100) Additionally, avoiding a decrease in potential output due to hysteresis effects is a relevant concern. For instance, Mourougane, A. (2017), 'Crisis, potential output and hysteresis', International Economics, Vol. 149, No. C, pp. 1-14 concludes for a panel of 34 OECD countries that hysteresis amplifies the effect of financial crises on potential output.
(101) For details on (barriers to) the European securitisation market, we refer to European commission (2015), ‘Impact Assessment accompanying the Proposal for a Regulation laying down common rules on securitisation and creating a European framework for simple and transparent securitisation’, 185 final.
(102) Under CMU, Securitisation Regulation (published in December 2017) introduces a uniform regulatory regime for securitisation and set out criteria for simple, transparent and standardised (STS) securitisation.
(103) See, e.g. Artola, C. and V. Genre (2011), 'Euro Area SMEs Under Financial Constraints: Belief or Reality?', CESifo Working Paper Series, No. 3650.

II. Completing the Capital Markets Union and its impact on economic resilience in the euro area
Volume 17 No 4 | 37
their full growth potential during a recovery. (104) Banks that are in the process of deleveraging might refrain from extending new credit to SMEs. A credit crunch for SMEs is particularly harmful to an economic recovery because they are labour intensive and account for a large part of the European economy: About 99.8 % of all European non-financial firms operating in the European Union in 2016 were SMEs and they accounted for 67 % of total employment and 57 % of value added in the non-financial business sector. (105)
Thirdly, well-developed financial markets support the recovery by ensuring that financial resources can be reallocated towards the most productive and viable firms. For instance, high stocks of NPLs are often associated with credit being locked up with non-viable firms. If banks refinance non-viable firms at the expense of the supply of credit to healthy firms capital is misallocated. (106) The package of measures to tackle high NPL ratios will, among others, support the development of secondary markets where banks can sell their NPLs, thereby mitigating the negative effect of high NPLs on credit provision and economic recovery. (107)
In addition, the initiative on business insolvency promotes early restructuring of firms to preserve jobs and to increase the efficiency of insolvency, restructuring and discharge procedures. (108) The (104) In May 2018, the Commission put forward a proposed regulation
on Promoting SME growth markets in order to improve SMEs' access to market-based finance. For further details, see https://ec.europa.eu/info/publications/180524-proposal-sme-market-abuse-prospectus_en.
(105) See, Muller, P., J. Julius, D. Herr, L. Koch, V. Peycheva, and S. McKiernan (2017), 'Annual report on European SMEs 2016/2017: Focus on self-employment', EU Publications.
(106) Bricongne, J.-C., M. Demertzis, P. Pontuch and A. Turrin. (2016), 'Macroeconomic Relevance of Insolvency Frameworks in a High-debt context: an EU Perspective', European Commission, Discussion Paper, No. 32.
(107) See, https://ec.europa.eu/info/business-economy-euro/banking-and-finance/financial-supervision-and-risk-management/managing-risks-banks-and-financial-institutions/non-performing-loans-npls_en for more detail
(108) The Commission has made two proposals. In November 2016, the Commission proposed rules on preventive restructuring, to avoid the liquidation of viable companies with financial difficulties and give entrepreneurs a chance to re-enter business life after bankruptcy. The proposal also lays down rules to enhance the efficiency of insolvency procedures, to make them more predictable, less costly and speedier. In March 2018, the Commission published a proposal for a regulation on the law applicable to the third-party effects of assignments of claims to provide legal certainty as to which national law as to which national law applies when determining who owns a claim after it has been assigned in a cross-border case. The proposal will promote cross-border investment and access to cheaper credit. See,
harmonisation of insolvency frameworks will directly impact recovery dynamics. It improves the exit of insolvent firms and tackles inefficiencies and differences in national insolvency frameworks that generate legal uncertainty, and create obstacles to recovery of value by creditors, and barriers to the efficient restructuring of viable companies. Nevertheless, while such reforms are necessary, they may call for appropriate flanking policies, as experience from many crisis countries shows that it takes years to change insolvency practices due to e.g. the operational workings of the courts and judges. As such, promoting initiatives enhancing institutional frameworks to ensure an efficient functioning of insolvency procedures, such as on out-of-court collateral enforcement prior to insolvency, could also be helpful to speed-up reallocation. (109)
At the same time, several actions in the CMU action plan and mid-term review aim to make it easier for start-ups and high-growth SMEs to get the funding to expand. For instance, the initiative to introduce a more proportionate regime for SMEs trying to list and issue securities on SME Growth Markets should facilitate EU growth companies to tap market-based funding. (110) This may then speed up resource reallocation and positively affect growth. Even so, the funding choices available to firms should be sufficiently diverse to ensure that existing firms do not refrain from accessing new markets and introducing new products because their specific funding needs cannot be met. (111) Alternative sources of finance could alleviate this problem: the initiative to create a European license for crowdfunding may facilitate the entry of new firms that need start-up capital or complement firms’ traditional sources of
http://ec.europa.eu/information_society/newsroom/image/document/2016-48/proposal_40046.pdf for further details.
(109) See, for instance, Macroeconomic Relevance of Insolvency Frameworks in a High-debt Context: An EU Perspective Bricongne, J-C, M. Demertzis, P. Pontuch and A. Turrini (2016), Suropean Economy Discussion Paper No. 032 for a comprehensive discussion of design issues of insolvency regimes and the main features of insolvency frameworks in selected EU Member States.
(110) See, http://europa.eu/rapid/press-release_MEMO-18-3728_en.htm for more details.
(111) See Archibugi, D., M. Filippetti, and M. Frenz (2013), 'Economic crisis and innovation: Is destruction revailing over accumulation?', Research Policy, Vol. 42, No. 2, pp. 303-314, D’Este, P., S. Iammarino, M. Savona, and N. von Tunzelmann (2012), 'What hampers innovation? Revealed barriers versus deterring barriers', Research Policy, Vol. 41, No. 2, pp.482-484, and Lee, N., H. Sameen, and M. Cowling (2015), 'Access to finance for innovative SMEs since the financial crisis', Research Policy, Vol. 44, No. 2, pp. 370-380.

38 | Quarterly Report on the Euro Area
financing. (112) In addition, revamped rules on European venture capital funds may also make it easier for high-growth SMEs enterprises to obtain risk capital. (113)
Fourthly, the smooth functioning of financial markets is enabled by predictable, efficient legal and institutional frameworks. The initiative on the harmonisation of insolvency frameworks cited above is a good example of the possible benefits of such harmonisation for the smooth functioning of markets and economic recovery.
Fifth, a well-functioning CMU may also support aggregate demand via several channels. For example, structural policies that successfully increase long-term GDP will have positive wealth effects on aggregate demand in the short run if well-functioning capital markets help to bring forward investment and consumption. (114) In addition, it might to some extent reduce the need for precautionary savings (in view of increased portfolio diversification opportunities) and promote the accumulation of wealth via private pension provisions. This is one of the objectives of the Pan-European Personal Pensions Product (PEPP) initiative (115) that enhances the cross-border provision of complementary pension schemes. This initiative has the additional advantage that it may strengthen cross-border labour mobility, which is key to speed up the recovery.
Finally, over the longer-term, the importance of CMU for economic resilience and recovery also follows from the importance of market-based finance to stimulate economic growth (cf. section I). (116) Recent research has shown that market-
(112) In March, the Commission adopted a legislative proposal for an
EU framework on crowdfunding and peer-to-peer lending. For more details, see https://ec.europa.eu/info/law/better-regulation/initiatives/ares-2017-5288649_en
(113) Equity markets provides venture capitalists a viable exit option for their early-stage investments (See Allen, F. and L. Pastor (2018), ‘The Capital Markets Union: key challenges’, CEPR Discussion Paper Series No. 12761).
(114) Buti, M., Turrini, A, Van den Noord, P. and P. Biroli (2018), 'Defying the 'Juncker Curse’: Can Reformist Governments Be Re-elected?', European Economy, Economic Papers No. 32.
(115) In June 2017 the Commission adopted a proposal for a regulation on a pan-European personal pension product (PEPP). For further details, see https://ec.europa.eu/info/business-economy-euro/banking-and-finance/insurance-and-pensions/personal-pension-products_en
(116) A market-based system also contributes to the other phases: it reduces vulnerability (see, e.g., Bats, J. and A. Houben (2017), ' Bank-based versus market-based financing: implications for systemic risk', De Nederlandse Bank Working Paper No. 577) for a
based finance is better at stimulating innovation and productivity than bank financing. (117) This is particularly true with respect to equity financing as a recent analysis of 21 EU countries finds evidence that sectors with better global growth opportunities grew faster in countries with relatively bigger equity markets. (118) Although the relative importance of market-based finance in non-financial companies' (NFC's) total finance has increased moderately in the EU27 in the last decade, it was still more than three times less than for NFCs in the United States in 2017. (119)
II.6. Conclusions
The under-development of European capital markets prior to 2008 meant that private risk-sharing in the euro area was grossly insufficient and much lower than in the US and other economies in the aftermath of the global financial crisis. In turn, the lack of adequate private risk-sharing channels via financial markets strongly limited the euro area Member States' capacity to absorb and recover from adverse shocks.
The three main structural barriers hampering the development of a well-functioning financial architecture in the euro area are (i) the corporate sector's over-reliance on bank financing; (ii) the strong "home bias" of credit and capital markets (exacerbated by fragmented sovereign bond markets); which in turn are to a large extent explained by (iii) the lack of transparency of European capital markets and the prevailing fragmented regulatory and institutional frameworks. The Capital Markets Union action plan adopted in 2015 and subsequently reviewed in 2017 and 2018 is a first attempt to overcome these structural barriers.
discussion on how market-based systems contribute more to financial stability than a bank-based one); and stimulates the absorption capacity via better cross-sectional risk sharing (Allen, F. and Gale, D. (1997), 'Financial Markets, Intermediaries, and Intertemporal Smoothing', Journal of Political Economy, Vol. 105, No. 3, pp. 523-46.). Note that bank-based and market-based systems complement each other (see section II.4).
(117) Hsu, P.-H., T. Xuan and Y. Xu. (2014) 'Financial development and innovation: Cross-country evidence.' Journal of Financial Economics, Vol. 112, No..1, pp.: 116-135.
(118) Kremer, M. and A. Popov (2018), 'Financial development, financial structure and growth: evidence from Europe', in: European Central Bank, Financial integration in Europe, pp. 66-97.
(119) European Commission, European Financial Stability and Integration Review (EFSIR), various editions and AFME, (2018), Capital Markets Union. Measuring progress and planning for success, pp. 52.

II. Completing the Capital Markets Union and its impact on economic resilience in the euro area
Volume 17 No 4 | 39
Once these barriers have been overcome, the most direct positive effect of a well-functioning, diversified and integrated CMU on resilience will come via the strengthening of countries' absorption capacity through a number of channels: First, the cross-border holding of assets in a CMU will provide diversified capital income (interest, dividends or capital gains) from across the euro area for households, financial institutions and corporates, allowing them to cushion the impact of domestic shocks. Moreover, a well-functioning CMU will strengthen absorption capacity by reducing the financial market fragmentation and frictions that hamper the transmission of the single monetary policy to the banking and non-banking sectors. Lastly, higher cross-border equity investments into corporates and financial institutions in a well-functioning CMU will also act as a shock-absorber as such inflows tend to be less likely to reverse in a crisis (particularly foreign direct investment) than credit flows due to their higher cost of liquidation.
In the long-run, a well-functioning CMU is expected to reduce the vulnerability of the EU and the euro area to idiosyncratic and structural shocks in three ways. First, it promotes convergence towards a more resilient and consistent market-based financial structure that promotes innovation and so boosts productivity. Secondly, it improves the efficiency of the banking sector with knock-on stabilising effects on the supply of credit (not necessarily increasing the availability of credit) and aggregate demand over the business cycle. For instance, it may facilitate the disposal of non-performing loans on banks' balance sheets via specialised investment funds on secondary markets.
Finally, building a CMU should not be seen in isolation, as it is complementary to a broader set of policies and reforms aimed at completing the EMU architecture and the functioning of the EU as a whole. Such measures include bringing down the remaining barriers in the Single Market to exploit fully the benefits of further integration in goods and services markets, fostering well-functioning labour market along “flexicurity” principles, creating a common stabilisation mechanism, as well as completing the Banking Union and strengthening the institutional framework. At the same time, due regard should be given to the fact that structural reforms that increase for instance product and labour market flexibility may face less resistance if accompanied by reforms that help to bring forward some of the benefits of these reforms via the further development of a CMU.
Looking forward, there are two broad avenues of potential research on CMU. First, a more detailed analysis of the transmission channels through which a well-functioning, diversified and integrated CMU could increase potential growth in the euro area, and in particular the role of equity financing that is relatively low in the euro area. Secondly, as more data becomes available, an empirical analysis of the interactions between CMU implementation, financial integration and economic resilience could be undertaken.


III. The labour income share in the euro area
Volume 17 No 4 | 41
III.1. Introduction
Until recently, wage growth in the euro area has remained below what has historically been observed at similar levels of unemployment. Low productivity growth, low inflation and remaining labour market slack in certain member states help to explain this. (121) But some have argued that structural factors such as labour-replacing technical change and the internationalisation of production have also kept wage growth down. (122)
A major policy concern is that labour productivity growth no longer translates one-for-one into real wage growth, resulting in a lower labour income share. (123) Several recent studies describe the decoupling of median wage growth from labour productivity growth and a declining labour share as a share of value added as a more general trend in advanced countries over recent decades. (124) (120) This section was prepared by Elizaveta Archanskaia, Eric
Meyermans, and Anneleen Vandeplas. The authors wish to thank Alfonso Arpaia, Erik Canton, Alexander Hobza, Aron Kiss, Zenon Kontolemis and Karl Pichelmann for useful comments.
(121) See Vandeplas, A., Arpaia, A., Ruscher, E., Turrini, A. and W. Röger (2018), 'Wage dynamics in the EMU', QREA Vol. 16, No. 3, pp. 1-20; and European Commission (2018), Labour Market and Wage Developments in Europe. Annual Review.
(122) Dao, M.C., Das, M., Koczan, Z., and W. Lian (2017), 'Why is labour receiving a smaller share of global income? Theory and Empirical Evidence', IMF Working Paper No. 17/169.
(123) The labour income share is defined as the share of gross value added paid to workers – as distinct from the share going to capital compensation and to profits.
(124) Autor D. and A. Salomons (2018), Is Automation Labor-Displacing? Productivity growth, employment, and the labour share', NBER Working Paper No. 24871; Karabarbounis, L., and B. Neiman (2014), 'The global decline of the labour share', Quarterly Journal of Economics 121(9). See also Schwellnus, C., Kappeler, A.,
Declining labour shares have been linked not only to automation and globalisation, but also to the by-products of these processes, i.e. the increasingly oligopolistic structure of markets attributable to winner-take-all dynamics. The reduction in the labour share may thus be a consequence of the increasing market power of a small group of firms and/or of a longer-term decline in worker bargaining power. (125)
However, most of the available micro-level evidence underpinning the evolution of the aggregate labour share is based on US data. Cross-country analysis by international institutions such as OECD and IMF is obtained on a sample that has only partial overlap with the euro area. For Europe, the evidence on the evolution of labour shares in previous work is mixed and suggestive of significant cross-country heterogeneity. (126) Also, the timeframe considered in previous studies mostly fails to cover the recovery period. To shed more light on which of these trends apply to euro area Member States, this section provides a set of stylised facts on the evolution of labour income shares in the euro area Member States over 2000-2017 and identifies the technological and
and P-A Pionnier (2017), 'Decoupling of wages from productivity: macro-level facts', OECD Working Paper No. 1373.
(125) Kehrig M. and N. Vincent (2018), ‘The micro-level anatomy of the labor share decline’, NBER Working Paper No. 25275; Barkai S. (2018), ‘Declining labor and capital shares’, mimeo; Autor D., Dorn D., Katz L., Patterson C., and J. Van Reenen (2017a), ‘The fall of the labor share and the rise of superstar firms’, NBER Working Papers 23396.
(126) See Dao et al. (2017) op cit. and Schwellnus et al. (2017), op cit.
This section analyses the evolution of the labour income share at the national and sectoral levels across euro area Member States. For the euro area as a whole, changes in the labour income share mostly reflect countercyclical dynamics over 2000-2017. National labour income shares are strongly countercyclical as well, but there are country specificities and some evidence of cross-country convergence. For most euro area Member States, the observed evolution of the national labour share is attributable to within-sectoral changes in the labour income share, in particular its reduction in manufacturing and its increase in business services.
A reduced form estimation approach suggests that technological progress and capital deepening are the main determinants of sectoral labour income shares. These factors determine sectoral labour productivity growth, providing the basis for a sustained increase in the sectoral real wage, but they may also result in a reduction of the sectoral labour share if technical change is capital-augmenting and capital-labour substitutability is sufficiently high. As capital-labour substitutability is likely decreasing in the employees’ level of skills, such results suggest that investing in skills can produce a double dividend: strengthening macro-economic performance and productivity growth on the one hand, and supporting a commensurate development of workers’ living standards. (120)

42 | Quarterly Report on the Euro Area
institutional determinants of labour share dynamics in the euro area.
The labour income share is one of four components of GDP, the other ones being the capital income share (e.g. interest payments, depreciation), the profit share (or mark-up), and net taxes (taxes-subsidies on products). (127) Put differently, labour productivity or GDP per person employed is used to pay for wages, capital compensation, and profits.
The labour share can affect socio-economic outcomes via several channels, including the following. First, labour share dynamics relate to the relative distribution of income among labour, capital and profits. With labour income distributed more evenly than income from capital and profits, a lower labour share might be associated with higher income inequality. (128) Second, changes in the labour share can have a feedback effect on aggregate (domestic) demand if the marginal propensity to spend labour income is higher than the marginal propensity to spend income from capital or profits. (129) Third, changes in the labour share mirror the evolution of real unit labour costs (RULC). (130) An increase in the labour share may make it relatively less attractive to hire labour, favouring investment in labour replacing technologies. Through their interaction with real effective exchange rates, sectoral RULC can also affect cost competitiveness in tradable sectors.
This section is structured as follows. The second sub-section presents stylised facts on aggregate labour share dynamics in the euro area. The third subsection reviews recent evidence on the determinants of the labour share. The fourth sub-section presents stylised facts on sectoral labour share dynamics in the euro area using a shift-share decomposition. The fifth sub-section estimates the impact of technological and institutional factors on
(127) The tax part reflects the difference between GDP and Gross
Value Added (GVA), and it is in practice relatively small. In this study, for clarity of exposition, the tax part is neglected.
(128) See Box III.I for a broader discussion on the link between the labour share and income inequality.
(129) See, for instance, Stiglitz, J. (2018), ‘Where modern macroeconomics went wrong‘, Oxford Review of Economic Policy, Vol. 34, No 1-2, pp. 70–106.
(130) Unless otherwise mentioned, the labour share is defined as follows (AMECO definition), where total employment comprises employees and self-employed:
𝐿𝐿𝐿𝐿 = 𝑠𝑠𝑚𝑚𝑠𝑠𝑠𝑠𝑠𝑠𝑦𝑦𝑠𝑠𝑠𝑠 𝑐𝑐𝑠𝑠𝑚𝑚𝑠𝑠𝑠𝑠𝑐𝑐𝑠𝑠𝑐𝑐𝑡𝑡𝑖𝑖𝑠𝑠𝑐𝑐𝐺𝐺𝐺𝐺𝐺𝐺 𝑐𝑐𝑡𝑡 𝑐𝑐𝑢𝑢𝑟𝑟𝑟𝑟𝑠𝑠𝑐𝑐𝑡𝑡 𝑠𝑠𝑟𝑟𝑖𝑖𝑐𝑐𝑠𝑠𝑠𝑠
×𝑡𝑡𝑠𝑠𝑡𝑡𝑐𝑐𝑠𝑠 𝑠𝑠𝑚𝑚𝑠𝑠𝑠𝑠𝑠𝑠𝑦𝑦𝑚𝑚𝑠𝑠𝑐𝑐𝑡𝑡𝑐𝑐𝑟𝑟 𝑠𝑠𝑚𝑚𝑠𝑠𝑠𝑠𝑠𝑠𝑦𝑦𝑠𝑠𝑠𝑠𝑠𝑠
This definition aligns with the one of real unit labour costs.
the evolution of sectoral labour shares. The sixth sub-section summarises the findings and draws some policy conclusions.
III.2. Labour share dynamics at the euro area and the Member State level
The global decline in the labour income share since the late 1970s has been well documented by now. This decline has been observed in the US as well as in Europe. Both regions started started out from roughly similar labour income shares in the 1960s, and both experienced a strong decline until roughly 1990. The labour share in Europe continued to decline over 1990-2000, after which it remained roughly stable (see Graph III.1). The decline in the US was more gradual until around 2000, after which it accelerated. In 2017, the labour share in Europe (EA and EU alike) remains above that in the US. (131)
Graph III.1: Labour share dynamics over 1960-2017, US and Europe
(1) The labour share is measured as the adjusted wage share (AMECO variable ALCD2: Compensation per employee as percentage of GDP at factor cost per person employed, corrected for self-employment, Total economy). Before 1995, partial EU and EA aggregates are considered for lack of full data availability. Source: AMECO
Most of the variation of the euro area labour share since 2000 seems linked to the economic cycle, (132) (131) AMECO also provides data on the adjusted wage share expressed
as % of GDP per employed person in current prices. We follow Dünhaupt (2017) in considering the measure expressed of GDP per person employed at factor cost. If the alternative measure were considered, a closure of the gap between Europe and the US would be observed. See Dünhaupt, C. (2017) ‘Determinants of labour’s income share in the era of financialisation’, Cambridge Journal of Economics, Vol. 41, No.1, pp.: 283-306.
(132) A simple bivariate regression of the labour share on a time trend suggests the absence of a significant trend over the period 2000-
60
62
64
66
68
70
72
74
1960
1963
1966
1969
1972
1975
1978
1981
1984
1987
1990
1993
1996
1999
2002
2005
2008
2011
2014
2017
US EA19 EU28 EA12 EU15

III. The labour income share in the euro area
Volume 17 No 4 | 43
with the labour income share hitting rock bottom (at around 61%) in 2007, then climbing up to more than 63% in the crisis period, only to start gradually declining again as of 2013, to reach 62.8% in 2017. This counter-cyclical pattern of labour shares has been documented in previous work. (133) It likely results from the fact that employment and wages tend to move more slowly than output, and it can therefore be considered as socially desirable. (134)
When comparing labour share levels across euro area Member States, significant variation is observed. First, in terms of levels, in 2017 the labour share varied from around 38% in Ireland (which is a clear outlier, however) to 70% in Slovenia. Other countries with a labour share above the euro area average are France, Belgium, and the Netherlands. Labour income shares are relatively low in Slovakia, Malta, and Lithuania.
Graph III.2: Labour income shares across EA countries, 2000 and 2017
Source: AMECO
Member States also differ in terms of labour share dynamics. Most countries (except for Spain and Portugal and possibly Ireland) have not seen a general downward trend in labour shares over the period 2000-17 in the way there had been one over previous decades. Some countries which started out from relatively low labour share levels in 2000 (most notably Estonia and Latvia) show an upward trend in the labour share. Labour share movements in countries such as Finland, France, Italy, Malta
17. Over the same period, around 40% of the variation in the labour share is explained by fluctuations in the output gap.
(133) IMF (2012). World Economic Outlook: Growth Resuming, Dangers Remain. Washington, April, 2012.
(134) see e.g. Pino, G., Soto, A. (2014) Analysis of wage flexibility across the Euro Area: evidence from the process of convergence of the labour income share ratio. Applied Economics, 46(29): 3572-80; and Hutchinson, J., Persyn, D. (2012) Globalisation, concentration and footloose firms: in search of the main cause of the declining labour share. Review of World Economics, 148(1): 17-43; Growiec, J., McAdam, P., Muck, J. (2018) On the optimal labor income share. ECB Working Paper Series No. 2142.
and Slovenia seem to reflect mostly business cycle effects (see Graph III.4).
The data hint at convergence in labour shares across Member States, as those countries which had the highest labour shares in 2000 (such as Portugal and Spain), saw it decline over the period 2000-17; while countries with relatively low labour shares in 2000 (such as Slovakia, Latvia, Estonia) experienced increases (see Graph III.3). (135)
Graph III.3: Convergence in labour shares over time across the EA, 2000-17
(1) Changes in labour shares are expressed in % (but a similar relationship is observed when they are expressed in ppt). IE is dropped from the graph as it represents a significant outlier (mostly as a result of substantial GDP revisions in 2015 relating to transfer pricing by multinational companies). The bivariate regression model has an R-squared of 0.42. EU28 and EA19 are not included in the linear fit. Dark bullets reflect countries in which the labour share shows a significant (positive or negative) time trend over the considered period. Source: EC calculations based on AMECO
Hence, in summary, the broad stability of the labour share in the euro area over the period 2000-17 hides more interesting, but also heterogeneous, dynamics at the Member State level. The following subsections will explore in more detail what could be driving these dynamics. We start by briefly reviewing the literature on the determinants of the labour share in subsection IV.3. Next, empirical analysis is presented based on data from a set of euro area Member States in order to investigate some of the suggested hypotheses (subsections IV.4 and IV.5).
(135) The major change in IE is largely due to a structural break in the
data in 2015 (see above). If IE is not taken into account, the standard deviation of labour shares across countries is significantly lower in 2017 than in 2000.
30
40
50
60
70
80
IE SK
MT LT EL CY IT PT ES LU LV FI EE AT
DE
EA19 NL
BE FR SI
2017 2000

44 | Quarterly Report on the Euro Area
III.3. Determinants of labour shares: a brief literature review
Various factors have been proposed as contributing to the evolution of the labour share, including compositional shifts in economic activity, technological change, globalisation (including global value chain integration), financialisation, and institutional settings (such as product and labour market regulations). In what follows, we will briefly review each of these factors.
Sectoral shifts can have a notable impact on the labour income share. As agriculture, manufacturing and construction used to have higher labour shares than other service sectors, the structural shift towards these service sectors exerted downward pressure on the labour share in Europe prior to 2000. (136) In more recent years, the labour share in the services sector bypassed the one in manufacturing, and strong shifts in labour shares within sectors have been observed (see Section IV.4). Such shifts do not necessarily result from labour share changes within incumbent firms: they may also reflect within-sector compositional shifts from (to) firms with a higher labour share to (from) firms with a lower labour share. (137)
(136) See Arpaia, A., Pérez, E., and K. Pichelmann (2009),
'Understanding Labour Income Share Dynamics in Europe', ECFIN Economic Papers 379, European Commission; De Serres, A., Scarpetta, S., and C. De La Maisonneuve (2001), 'Falling wage shares in Europe and the United States: How Important is Aggregation Bias?', Empirica, Vol. 28, No. 4, pp. 375-401.
(137) Autor et al. (2017a) argue that most of the within-sectoral change in the labour share results from the reallocation of activities between firms, towards firms with high profits and low labour shares, for example because firms with a higher labour share are generally less profitable and therefore have a higher exit rate.
Graph III.5: Labour share in EA19
(1) The figure shows the observed annual labour share as well as its 3- and 5-year moving average and its trend (HP filtering) focussing on employee compensation only in the right panel and adjusting for the compensation of the self-employed in the left panel. Source: Eurostat
Shifts in the relative distribution of employees versus self-employed can contribute to magnifying measurement error in the computation of the labour share since compensation of the self-employed is not reported as labour income but rather is included in the gross operating surplus of the sector. The standard way of adjusting for the compensation of the self-employed is to assume that they receive the same compensation as the average employee.
Graph III.4: Evolution of the aggregate labour share in euro area countries, 2000-17
Source: AMECO ALCD2

III. The labour income share in the euro area
Volume 17 No 4 | 45
Box III.1: Labour income shares and wage dispersion
Around 1900, studies of inequality in the economics literature focused on the functional distribution of income, in other words the division of income among labour (often farmers), landowners, and capitalists. At that time, wage earners were often identified as “the poor”, underscoring the relevance of the labour share for distributional considerations.(1) This approximation became less satisfactory with economic development, which led to a blurring of the correspondence between classes of people and sources of income. Also the increased availability of household- and individual-level income data, and the emergence of human capital theory which highlighted the differences in returns to skills contributed to a rising interest among economics scholars in the personal income distribution and wage inequality as of the 1960s.
At the same time, looking at functional income distribution rather than the personal income distribution might still be attractive as a relatively simple and pragmatic way to incorporate distributional concerns into modern macro-theoretical models (such as real business cycle models). Moreover, the functional income distribution still raises questions of social fairness, as many perceive the extent to which real wage growth reflects labour productivity growth as a crucial element of fair division of the benefits from production. (2)
Nevertheless, caution is due in drawing a direct link between factor shares and the personal income distribution, given that individuals increasingly draw income from a variety of sources, and given that also within categories of income, there is substantial inequality.(3) Earlier QREA analysis concluded that the link between income inequality and the wage share is complex, and that in some euro area countries, the decline in the labour share was not associated with a commensurate increase in disposable inequality, partly because of an equalising impact of taxes and transfers. (4)
Graph 1 and 2 present scatter plots of wage inequality and the labour income share, in two different years (2006 and 2014), highlighting the complex relationship between these two variables. While the 2014 graph shows a relatively strong (1) See Goldfarb, R.S., Leonard, T.C. (2005) Inequality of what
among whom?: Rival conceptions of distribution in the 20th Century. In: A Research Annual. Research in the History of Economic Thought and Methodology, Volume 23A: 75-118.
negative correlation; the correlation in 2006 was close to nil. On average, the data suggest that wage dispersion has declined over time; and there is some evidence of convergence in wage inequality across EU member states over time. Further work is needed to explore the reasons for these differences over time.
Graph 1: Wage inequality versus the labour income share, 2014
(1) D9/D1 is defined as the ratio of the upper decile over the lower decile of wages for companies with at least 10 employees. R² adj linear fit=0.22. Source: Eurostat, Structure of Earnings Survey 2014
Graph 2: Wage inequality versus the labour income share, 2006
(1) D9/D1 defined as above. R² adj linear fit≈0. Source: Eurostat, Structure of Earnings Survey 2006
(2) see Atkinson, A.B. (2009) Factor shares: the principal problem of political economy? Oxford Review of Economic Policy, 25(1): 3-16.
(3) see Atkinson (2009, op cit.) (4) European Commission (2008) Income inequality and wage
share: patterns and determinants. QREA, III/2008: 31-44.

46 | Quarterly Report on the Euro Area
This is a quite rough approximation, (138) and increases in the share of self-employed (which have been reported in Europe since the 1980s) may exacerbate the measurement error. In the case of the euro area, the adjustment for self-employment does not change the qualitative results on the evolution of the labour share over 2000-2017 (Graph III.5).
Recent work suggests that technological progress has considerably reduced the price of investment goods, inducing firms to shift resources away from labour towards capital, resulting in a declining labour share. (139) At the same time, the reduction in the relative price of investment goods (such as computer equipment) is argued to have contributed to economic growth and the increase in the skills premium. (140) A related driver is capital-augmenting technological progress, (141) which raises the productivity of capital relative to that of labour. The fact that labour shares vary more strongly across sectors within a country than across countries, suggests indeed the importance of technology as a determinant of the labour share. (142)
The effect of rising capital intensity and capital augmenting technical change on the labour income share may differ across industries or across workers of different skills levels. Notably, in sectors (or among workers) where labour and capital are strong substitutes, capital is likely to replace labour and therefore reduce labour demand and the labour income share. This mostly concerns sectors with a high share of jobs involving routine tasks
(138) Notably, in countries with a high incidence of agriculture, self-
employed are likely to earn less than employees; in other countries, where self-employed are often high-skilled freelancers, they are likely to earn more than the average employee. Schwellnus (2017) has proposed a more refined way to correct for self-employment, notably by approximating income from self-employment by sectoral wages, weighted by the sectoral incidence of self-employment. Alternative methods are discussed by Schwellnus et al. (2017), op cit., and Cho, T., Hwang, S. and P. Schreyer (2017), 'Has the labour share declined?: It depends', OECD Statistics Working Paper No. 2017/01.
(139) See Karabarbounis & Neiman (2014) op cit. (140) See, for instance, Greenwood, J., Hercowitz, Z., and P. Krusell
(1997), 'Long-Run Implications of Investment-Specific Technological Change', American Economic Review, Vol. 87, No. 3, pp. 342-62; Krusell, P., Ohanian, L. E., Rios-Rull, J.-V., and G.L. Violante (2000), 'Capital-Skill Complementarity and Inequality: A Macroeconomic Analysis', Econometrica, Vol. 68, No. 5, pp. 1029-53.
(141) Berman E., Bound, J., and Z. Griliches (1994), 'Changes in the Demand for Skilled Labor within US Manufacturing: Evidence from the Annual Survey of Manufactures', Quarterly Journal of Economics, Vol. 109, No. 2, pp. 367–397.
(142) Arpaia et al., op cit.
(such as traditional manufacturing (143)) and low- or medium-skilled workers. (144) However, in industries (or groups of workers) where labour is rather a complement to capital, rising capital intensity is more likely to increase the demand for labour and as a result also increase the labour income share. This mechanism likely plays out in skill-intensive services and for highly qualified workers. (145) Hence, variation across sectors in the elasticity of substitution between capital and labour could give rise to differences in the size and the direction of the effect of technological progress.
Globalisation has also been identified as an important contributor to the evolution of the labour share. On the one hand, offshoring of the most labour-intensive parts of production processes may contribute to reduce labour shares in advanced economies. (146) It may also reduce the relative bargaining power of labour. (147) Further, trade integration may increase the market share of the exporting firms, which tend to be more capital intensive. There is some empirical evidence for Europe that the labour share is lower for exporting firms and those engaged in foreign direct investment and offshoring. (148) On the other hand, increased specialisation of advanced economies in
(143) Which is in sharp contrast to the emerging industries using key
enabling technologies (KETs) such as micro-/nano-electronics, nanotechnology, photonics, advanced materials, industrial biotechnology and advanced manufacturing technologies such as bio-based products, smart vehicles, sustainable construction and smart grids. For more details, see for instance http://ec.europa.eu/growth/industry/policy/key-enabling-technologies_en
(144) See for instance Marcolin, L., Miroudot, S., and M. Squicciarini (2018), 'To be (routine) or not to be (routine), that is the question: a cross-country task-based answer', Industrial and Corporate Change, 2018: 1-25; and Marcolin, L., Miroudot, S., M. Squicciarini (2016), 'The Routine Content Of Occupations: New Cross-Country Measures Based On PIAAC', OECD Trade Policy Papers, No. 188, OECD Publishing, Paris.
(145) At the same time, the value of the elasticity of capital-labour substitution remains highly debated in the economics literature. See e.g. Guschanski, A. and A. Onaran (2018), 'Determinants of the wage share: a cross-country comparison using sectoral data', CESifo Forum 2/2018, June, Volume 19.
(146) See, for instance, Elsby, M.W., Hobijn, B. and A. Sahin (2013), 'The decline of the US Labor Share. Brooking papers on Economic Activity;' in IMF (2007) 'The globalisation of labor', Chapter 5 in World Economic Outlook, April 2007 (Washington, DC: IMF).
(147) As globalisation increases the bargaining position of the “most mobile” factor, and capital is considered more mobile than labour (See Stockhammer, E. (2013), 'Why have wage shares fallen? An analysis of the determinants of functional income distribution' in Lavoie M. and E. Stockhammer (eds) Wage-led Growth. Advances in Labour Studies. Palgrave Macmillan, London.).
(148) Perugini, C., Vecchi, M. and F. Venturini (2017), 'Globalisation and the decline of the labour share : a microeconomic perspective', Economic Systems, Vol. 41, No. 4, pp 524-536.

III. The labour income share in the euro area
Volume 17 No 4 | 47
the skill-intensive parts of the production process may increase the aggregate labour share.
Another potentially contributing factor is financialisation whereby more developed and less regulated financial markets may lower the labour share via various channels such as increased pressure for dividend payments and enhanced exit options of capital. (149) Hence, financialisation may also affect the bargaining power of labour. (150)
Finally, some have pointed at the impact of policies and institutions, such as labour or product markets regulations, and other institutional settings that influence worker bargaining power (such as union density, unemployment benefit levels and coverage, minimum wages, centralisation of bargaining and so on). The direction of the impact of factors that raise worker bargaining power is difficult to determine ex ante on theoretical grounds: while they might have a positive impact on wages, they might as well have a negative impact on employment. (151) A recent study by IMF staff suggests that deregulation of employment protection legislation has had a large and robust negative impact on the labour share in advanced economies over the period 1970-2015. (152)
A new strand of literature points at the influence of between-firm productivity differences on the labour share. More specifically, some have observed an increasing divergence in productivity between frontier firms and the other ones. (153) A possible driver is the progressive digitalisation of the economy, and the increased importance of
(149) Giovannoni, O. (2014), 'What do we know about the labour share
and the profit share? Part II: Empirical Studies. Levy Economics' Institute of Bard College Working Paper 804; Dünhaupt, P. (2017), op. cit.
(150) See Guschanksi and Onaran (2018), op cit. for additional details (151) For example, Jaumotte and Tytell (2007) find that unemployment
benefit replacement rates and union density have a negative impact on labour shares (albeit not significant in the latter case). Checchi and Garcia (2008) also find a negative significant effect of unemployment benefit replacement rates, but no impact of union density. See Jaumotte, F., Tytell, I. (2007) How has the globalisation of labor affected the labor income share in advanced countries? IMF Working Paper 07/298; Checchi, D., García-Peñalosa, C. (2008) Labour market institutions and income inequality. Economic Policy, 23(56): 602-649.
(152) Ciminelli, G., Duval, R.A. and D. Furceri (2018), 'Employment Protection Deregulation and Labor Shares in Advanced Economies', IMF Working Paper 18/186.
(153) Frontier firms are often defined as the top 5% best performers in terms of productivity. See e.g. Andrews, D, Criscuolo, C. and P.N. Gal (2016), 'The Best versus the Rest: The Global Productivity Slowdown, Divergence across Firms and the Role of Public Policy', OECD Productivity Working Papers No. 5, OECD Publishing, Paris.
intangible capital assets. This evolution may generate global winner-takes-all dynamics, (154) resulting in a stronger concentration of sales in large firms which have higher mark-ups and lower, or declining, labour shares. (155) A recent study documents a rise in mark-ups in the US over 1980-2014, driven by a set of firms with already above-median mark-ups. (156) However, more work is needed to see if this finding applies to the EU. (157) Understanding whether increasing concentration of firms results in increasing mark-ups and declining labour shares is important for policymakers, as it could imply a role for strengthening or modernising competition policy.
Recent work by the OECD asserts that the decline in the labour share in firms at the technological frontier is not driven by rising mark-ups or capital intensity in incumbent frontier firms. Instead, it comes about through the entry of new firms that start out as relatively capital intensive and have relatively high mark-ups. (158)
Past research has arrived at diverging conclusions regarding the significance (and sometimes even the direction) of the reviewed determinants, depending on the country sample and timespan considered. In this section, we explore whether the drivers identified in the existing studies have had a discernible impact on the evolution of the labour share in the euro area over the period 2000-17. We first look at the impact of sectoral shifts (Subsection IV.4) and then consider the impact of other factors such as capital accumulation, technological change, globalisation and institutional factors in Subsection IV.5.
(154) See Brynjolfsson, E, and A McAfee (2011), Race Against The
Machine: How the Digital Revolution is Accelerating Innovation, Driving Productivity, and Irreversibly Transforming Employment and the Economy, Digital Frontier Press.
(155) Autor, D., Dorn, D., Katz, L.F., Patterson, C. and J. Van Reenen (2017b), 'Concentrating on the Fall of the Labor Share', American Economic Review Papers and Proceedings, Vol. 107, No. 5, pp. 180-85.
(156) De Loecker, J. and J. Eeckhout (2017), 'The rise of market power and the macroeconomic implications', NBER Working Paper 23687.
(157) An earlier paper by ECB was not able to discern a clear trend in markups over the 1980s and 1990s in the Euro Area (see Christopoulou, R. and P. Vermeulen (2008), 'Markups in the Euro Area and the US over the period 1981-2004: a comparison of 50 sectors', ECB Working Paper No. 856. Analysis by Guschanski and Onaran (2018) does not confirm the expected impact of firm concentration on the labour share. See Guschanski, A., Onaran, Ö. (2018) The labour share and financialisation: Evidence from publicly listed firms. Greenwich Papers in Political Economy No. GPERC59. See also De Loecker, J. and J. Eeckhout (2018), 'Global Market Power', NBER Working Paper 24768.
(158) This finding aligns with views by Autor et al. (2017b), op cit.
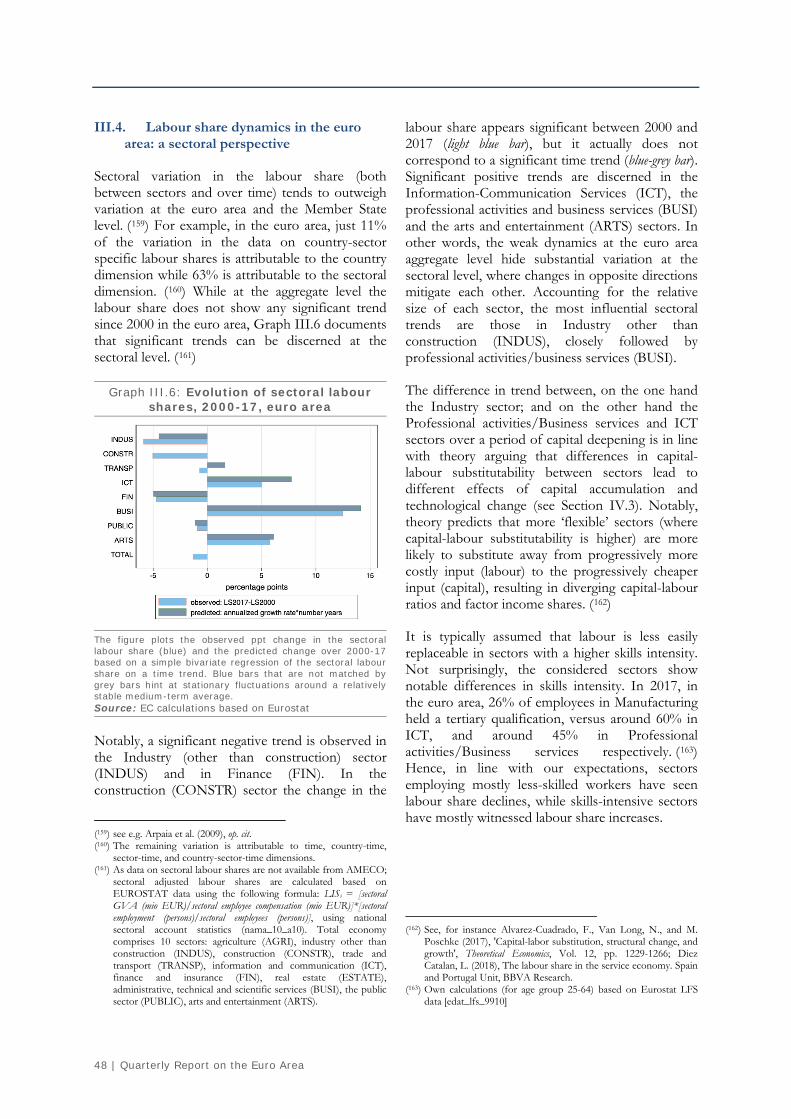
48 | Quarterly Report on the Euro Area
III.4. Labour share dynamics in the euro area: a sectoral perspective
Sectoral variation in the labour share (both between sectors and over time) tends to outweigh variation at the euro area and the Member State level. (159) For example, in the euro area, just 11% of the variation in the data on country-sector specific labour shares is attributable to the country dimension while 63% is attributable to the sectoral dimension. (160) While at the aggregate level the labour share does not show any significant trend since 2000 in the euro area, Graph III.6 documents that significant trends can be discerned at the sectoral level. (161)
Graph III.6: Evolution of sectoral labour shares, 2000-17, euro area
The figure plots the observed ppt change in the sectoral labour share (blue) and the predicted change over 2000-17 based on a simple bivariate regression of the sectoral labour share on a time trend. Blue bars that are not matched by grey bars hint at stationary fluctuations around a relatively stable medium-term average. Source: EC calculations based on Eurostat
Notably, a significant negative trend is observed in the Industry (other than construction) sector (INDUS) and in Finance (FIN). In the construction (CONSTR) sector the change in the
(159) see e.g. Arpaia et al. (2009), op. cit. (160) The remaining variation is attributable to time, country-time,
sector-time, and country-sector-time dimensions. (161) As data on sectoral labour shares are not available from AMECO;
sectoral adjusted labour shares are calculated based on EUROSTAT data using the following formula: LISs = [sectoral GVA (mio EUR)/sectoral employee compensation (mio EUR)]*[sectoral employment (persons)/sectoral employees (persons)], using national sectoral account statistics (nama_10_a10). Total economy comprises 10 sectors: agriculture (AGRI), industry other than construction (INDUS), construction (CONSTR), trade and transport (TRANSP), information and communication (ICT), finance and insurance (FIN), real estate (ESTATE), administrative, technical and scientific services (BUSI), the public sector (PUBLIC), arts and entertainment (ARTS).
labour share appears significant between 2000 and 2017 (light blue bar), but it actually does not correspond to a significant time trend (blue-grey bar). Significant positive trends are discerned in the Information-Communication Services (ICT), the professional activities and business services (BUSI) and the arts and entertainment (ARTS) sectors. In other words, the weak dynamics at the euro area aggregate level hide substantial variation at the sectoral level, where changes in opposite directions mitigate each other. Accounting for the relative size of each sector, the most influential sectoral trends are those in Industry other than construction (INDUS), closely followed by professional activities/business services (BUSI).
The difference in trend between, on the one hand the Industry sector; and on the other hand the Professional activities/Business services and ICT sectors over a period of capital deepening is in line with theory arguing that differences in capital-labour substitutability between sectors lead to different effects of capital accumulation and technological change (see Section IV.3). Notably, theory predicts that more ‘flexible’ sectors (where capital-labour substitutability is higher) are more likely to substitute away from progressively more costly input (labour) to the progressively cheaper input (capital), resulting in diverging capital-labour ratios and factor income shares. (162)
It is typically assumed that labour is less easily replaceable in sectors with a higher skills intensity. Not surprisingly, the considered sectors show notable differences in skills intensity. In 2017, in the euro area, 26% of employees in Manufacturing held a tertiary qualification, versus around 60% in ICT, and around 45% in Professional activities/Business services respectively. (163) Hence, in line with our expectations, sectors employing mostly less-skilled workers have seen labour share declines, while skills-intensive sectors have mostly witnessed labour share increases.
(162) See, for instance Alvarez-Cuadrado, F., Van Long, N., and M.
Poschke (2017), 'Capital-labor substitution, structural change, and growth', Theoretical Economics, Vol. 12, pp. 1229-1266; Diez Catalan, L. (2018), The labour share in the service economy. Spain and Portugal Unit, BBVA Research.
(163) Own calculations (for age group 25-64) based on Eurostat LFS data [edat_lfs_9910]

III. The labour income share in the euro area
Volume 17 No 4 | 49
Graph III.7: Relationship between changes in sectoral labour shares, labour
productivity, and wages , euro area
(1) The labour share is measured as the adjusted wage share (AMECO definition) Source: AMECO
There are important differences between, on the one hand, the size and the direction of relative sectoral labour share dynamics, and on the other hand, changes in relative sectoral wages. Graph III.7 illustrates that while labour productivity in Industry grew dramatically over the period 2000-17 (by more than 60%), labour productivity in Professional activities/business services grew by less than 20%. Sectoral wage growth was much more similar: around 50% in Industry, and around 40% in Professional activities/business services. This evolution corresponded to an increasing labour share in the latter sector, and a reduced labour share in the former sector. In other words, workers in sectors with declining labour shares are not necessarily worse off than workers in other sectors in terms of nominal compensation growth. While the labour share in Industry started out at a level similar to Professional activities/business services (60.7% vs. 61.4%) in 2000, by 2017 a significant gap has emerged (54.6% vs. 73.8%).
Graph III.8: Evolution of the sectoral labour share in industry (B-E), 2000-17
(1) The figure plots the observed percentage point change in the labour share over 2000-2017 as well as the predicted change based on a simple bivariate regression of the labour share on a time trend. Source: EC calculations based on Eurostat
Graph III.9: Evolution of the sectoral labour share in Professional Activities/Business
services (M-N), 2000-17
(1) The figure plots the observed percentage point change in the labour share over 2000-2017 as well as the predicted change based on a simple bivariate regression of the labour share on a time trend. Source: EC calculations based on Eurostat
At the individual Member State level, similar patterns are observed as for the euro area as a whole: most saw a reduction in the labour share in industry (manufacturing), and an increase in prof. activities/business services (see Graphs III.8 and III.9). At the same time, the starting points and the slope of the change are often very different.
A formal shift-share decomposition can be used to pin down the relative importance of within-sectoral changes in the labour share relative to compositional effects, i.e. the changing weight of sectors in total value added. The results of this decomposition as well as the total change in the

50 | Quarterly Report on the Euro Area
aggregate labour share are shown in Graph IV.9 for the euro area. The decomposition is carried out for the total economy as well as for the so-called 'market economy', i.e. the subset of sectors for which the labour share is well defined (excluding agriculture, real estate, the public sector, as well as the arts-entertainment sector).
Graph III.10: Shift-share decomposition of labour share dynamics in EA19, 2000-17
(1) Total economy corresponds to sectors A-U (10 sectors). Market economy comprises sectors B-N, while excluding the real estate sector (L) (6 sectors). Results are qualitatively similar if manufacturing (C) is used instead of industry other than construction (B-E). Source: EC calculations based on Eurostat
The shift-share decomposition contains three terms.(164) The first term is the ‘within’ effect. It is negative (see Graph III.10), suggesting that the aggregate labour share would have declined, had the sectoral composition of the economy remained unchanged. The ‘within’ effect is measured as the weighted average of changes in the sectoral labour shares, with the weights given by the initial share of each sector in total value added.
The second term is the ‘between’ effect. It reflects the change in the aggregate labour share due to shifts in the sectoral composition of the economy. Put differently, it indicates how the aggregate labour share would have evolved if sectoral labour shares had remained unchanged. It is equal to the weighted average of changes in the share of each sector in total value added, with the weights given by the initial labour share in each sector. The negative 'between' effect in Graph III.11 suggests that the euro area economy saw a relative shift (in value (164) 𝐿𝐿𝐿𝐿2017 − 𝐿𝐿𝐿𝐿2000 = ∑ ∆𝑠𝑠𝑠𝑠𝑘𝑘𝜔𝜔𝑘𝑘,2000 +𝐾𝐾
𝑘𝑘=1∑ ∆𝜔𝜔𝑘𝑘𝑠𝑠𝑠𝑠𝑘𝑘,2000 +𝐾𝐾𝑘𝑘=1 ∑ ∆𝑠𝑠𝑠𝑠𝑘𝑘∆𝜔𝜔𝑘𝑘
𝐾𝐾𝑘𝑘=1 ,where LS (ls) is the
aggregate (sectoral) labour share, k is the sector, and ωk is the share of sector k in total value added.
added) from sectors with relatively higher to sectors with relatively lower labour shares.
The third term is the ‘interaction term’. It captures to what extent sectoral labour shares move in the same direction as sectoral value added shares. The interaction term is positive for the euro area level, suggesting that labour shares increased (decreased) in sectors whose share in total value added also increased (decreased). Typically, the interaction term is relatively small in shift-share decompositions and therefore sometimes even neglected. (165) However, in this case, given the small magnitude of the between and the within effects, the interaction term is relatively sizeable.
In all, the shift-share decomposition at the euro area level indicates that shifts between sectors (and in particular from high-labour share to low-labour share sectors) have had a stronger impact on the euro area labour share than shifts within sectors (leading to a reduction of sectoral labour shares on average), even if both effects moved in the same direction. At the same time, sectors that had initially a low labour share and saw their share in value added increase, also experienced an increase in the labour share, exerting countervailing (upward) pressure on the euro area labour share.
Graph III.11: Shift-share decomposition at the level of labour share dynamics, euro area individual Member States, 2000-17
(1) The shift-share decomposition is carried out for the 6 sectors of the 'market economy', i.e. sectors B-N, but excluding the real estate sector (L). Source: EC calculations based on Eurostat
A similar analysis (focusing on the market economy) can be carried out at the Member State level. The results are presented in Graph III.11. (165) see e.g. Dao et al. (2017) op cit.

III. The labour income share in the euro area
Volume 17 No 4 | 51
They show that at this level, within-sector effects clearly trump the effects of sectoral shifts and the interaction term. These results are more in line with other recent studies. (166) At the same time, the direction of these within-sector changes varies considerably, with more (albeit generally smaller) Member States experiencing positive than negative within-sector changes. Sectoral shifts are typically small in magnitude, and their sign varies across countries as well. The finding that intra-sectoral changes in the labour share are the main driving force behind changes in country-level labour share dynamics motivates the estimation approach in section IV.5, which focuses on sector-level changes. This also allows to explore whether there are relevant differences in the impact of certain variables across sectors, such as for example a different effect of capital accumulation as a result of differences between sectors at the level of capital-labour substitutability.
III.5. Determinants of sectoral labour share dynamics in the euro area
This sub-section examines empirically the factors that affect the adjusted labour income share at sectoral level (167) – within the limits set by data availability. Box IV.4 provides a brief overview of the sectors covered and the data.
An econometric analysis at the sectoral level may give us a better understanding of labour income share developments at national level in recent decades as the shift-share analysis of the previous sub-section showed that the overall changes at national level is to a large extent due to changes of the labour income share at sectoral level rather than changes in the economy's sectoral composition.
In perfect markets, assuming a CES production function with capital and labour as inputs, and allowing for capital- and labour-augmenting technical change, the sectoral labour income share is determined by the relative cost of production factors, scaled by their relative technical efficiency. (168) The impact of capital deepening and of technical progress on the relative income shares of labour and capital depends on the
(166) such as Dao et al. (2017) op cit. (167) This section analyses the adjusted sectoral adjusted labour income
share, assuming that the self-employed earn the same compensation as the employees in the sector.
(168) See for instance Elsby et al. (2013), op cit.
elasticity of substitution between the two production factors. More specifically, further capital deepening and technical progress will induce an increase in the relative share of labour income if labour and capital are complements and technical progress is capital-augmenting; but a reduction in the relative share of labour income if labour and capital are substitutes and if technical progress is labour-augmenting.
In practice however, the direction of technical progress is not observed. Further, it may be argued that a refined production function with multiple labour and capital types is needed, to take into account differences in the relative substitutability of tangible and intangible capital with labour in routine and non-routine tasks. The analysis in this sub-section takes two shortcuts, mainly due to data limitations. (169) Firstly, it is not possible to include multiple labour and capital types. Secondly, sectoral total factor productivity (TFP) growth is used to proxy technological progress, i.e. de facto assuming Hicks-neutral rather than factor-biased technical change. (170)
Graph IV.12 shows developments in manufacturing's labour share as well as developments in its TFP growth (171) and capital to labour ratio for an aggregate of a selected set of euro area Member States for which sufficient data are available to cover the 2000-2017 period.
(169) See Box IV.3 for a detailed discussion of the dataset. (170) The use of the Solow residual obtained by fitting a Cobb-Douglas
production function impedes the interpretation of the coefficient estimated on the TFP as a structural parameter of the CES production function. Interpreting the coefficient estimated on the capital-labour ratio as an estimate of capital-labour substitutability may also be problematic.
(171) In EU KLEMS sectoral TFP data are indices with base year 2010. As such their levels can not be compared or aggregated into an EA aggregate, but growth rates can be estimated taking the geometric average of sectoral TFPs for the countries for which the data are available, with weights given by the share of each country in total output.
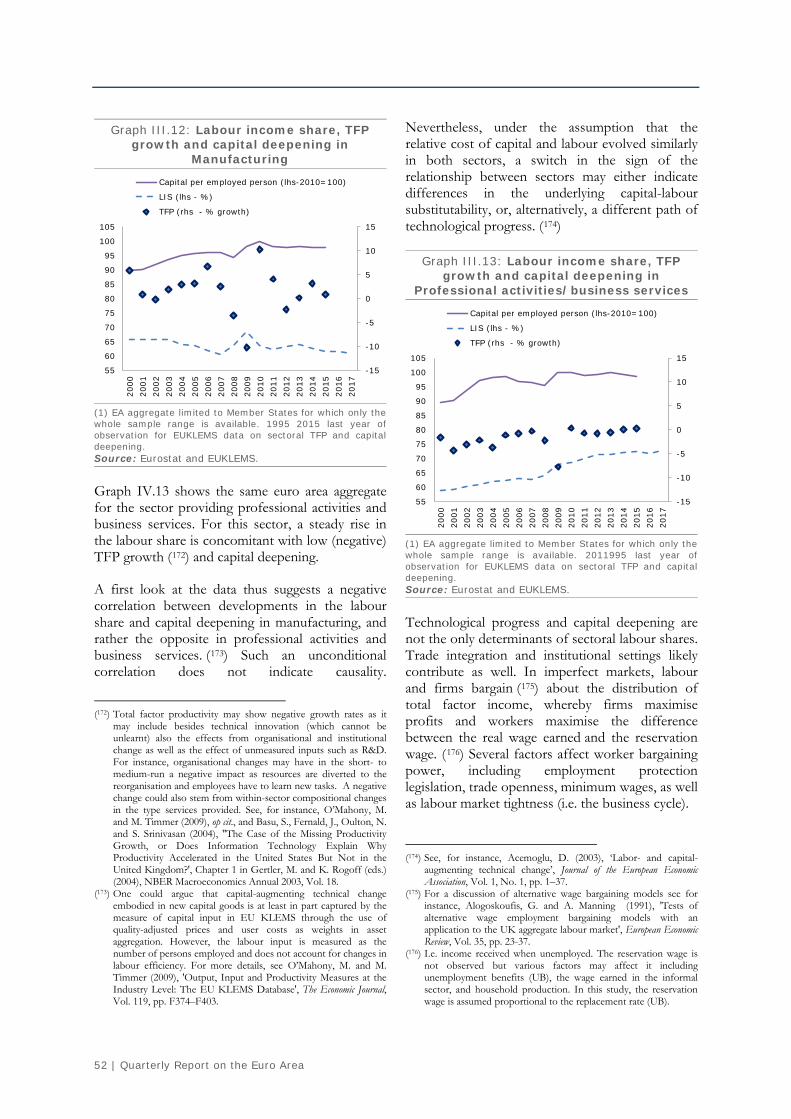
52 | Quarterly Report on the Euro Area
Graph III.12: Labour income share, TFP growth and capital deepening in
Manufacturing
(1) EA aggregate limited to Member States for which only the whole sample range is available. 1995 2015 last year of observation for EUKLEMS data on sectoral TFP and capital deepening. Source: Eurostat and EUKLEMS.
Graph IV.13 shows the same euro area aggregate for the sector providing professional activities and business services. For this sector, a steady rise in the labour share is concomitant with low (negative) TFP growth (172) and capital deepening.
A first look at the data thus suggests a negative correlation between developments in the labour share and capital deepening in manufacturing, and rather the opposite in professional activities and business services. (173) Such an unconditional correlation does not indicate causality.
(172) Total factor productivity may show negative growth rates as it
may include besides technical innovation (which cannot be unlearnt) also the effects from organisational and institutional change as well as the effect of unmeasured inputs such as R&D. For instance, organisational changes may have in the short- to medium-run a negative impact as resources are diverted to the reorganisation and employees have to learn new tasks. A negative change could also stem from within-sector compositional changes in the type services provided. See, for instance, O’Mahony, M. and M. Timmer (2009), op cit., and Basu, S., Fernald, J., Oulton, N. and S. Srinivasan (2004), ''The Case of the Missing Productivity Growth, or Does Information Technology Explain Why Productivity Accelerated in the United States But Not in the United Kingdom?', Chapter 1 in Gertler, M. and K. Rogoff (eds.) (2004), NBER Macroeconomics Annual 2003, Vol. 18.
(173) One could argue that capital-augmenting technical change embodied in new capital goods is at least in part captured by the measure of capital input in EU KLEMS through the use of quality-adjusted prices and user costs as weights in asset aggregation. However, the labour input is measured as the number of persons employed and does not account for changes in labour efficiency. For more details, see O’Mahony, M. and M. Timmer (2009), 'Output, Input and Productivity Measures at the Industry Level: The EU KLEMS Database', The Economic Journal, Vol. 119, pp. F374–F403.
Nevertheless, under the assumption that the relative cost of capital and labour evolved similarly in both sectors, a switch in the sign of the relationship between sectors may either indicate differences in the underlying capital-labour substitutability, or, alternatively, a different path of technological progress. (174)
Graph III.13: Labour income share, TFP growth and capital deepening in
Professional activities/business services
(1) EA aggregate limited to Member States for which only the whole sample range is available. 2011995 last year of observation for EUKLEMS data on sectoral TFP and capital deepening. Source: Eurostat and EUKLEMS.
Technological progress and capital deepening are not the only determinants of sectoral labour shares. Trade integration and institutional settings likely contribute as well. In imperfect markets, labour and firms bargain (175) about the distribution of total factor income, whereby firms maximise profits and workers maximise the difference between the real wage earned and the reservation wage. (176) Several factors affect worker bargaining power, including employment protection legislation, trade openness, minimum wages, as well as labour market tightness (i.e. the business cycle).
(174) See, for instance, Acemoglu, D. (2003), ‘Labor- and capital-
augmenting technical change’, Journal of the European Economic Association, Vol. 1, No. 1, pp. 1–37.
(175) For a discussion of alternative wage bargaining models see for instance, Alogoskoufis, G. and A. Manning (1991), 'Tests of alternative wage employment bargaining models with an application to the UK aggregate labour market', European Economic Review, Vol. 35, pp. 23-37.
(176) I.e. income received when unemployed. The reservation wage is not observed but various factors may affect it including unemployment benefits (UB), the wage earned in the informal sector, and household production. In this study, the reservation wage is assumed proportional to the replacement rate (UB).
-15
-10
-5
0
5
10
15
55
60
65
70
75
80
85
90
95
100
105
2000
2001
2002
2003
2004
2005
2006
2007
2008
2009
2010
2011
2012
2013
2014
2015
2016
2017
Capital per employed person (lhs-2010=100)
LIS (lhs - %)
TFP (rhs - % growth)
-15
-10
-5
0
5
10
15
55
60
65
70
75
80
85
90
95
100
105
2000
2001
2002
2003
2004
2005
2006
2007
2008
2009
2010
2011
2012
2013
2014
2015
2016
2017
Capital per employed person (lhs-2010=100)
LIS (lhs - %)
TFP (rhs - % growth)

III. The labour income share in the euro area
Volume 17 No 4 | 53
(Continued on the next page)
Box III.2: Towards empirical estimation
The econometric analysis in this section covers 9 sectors, i.e. i) manufacturing, iii) industry without manufacturing and construction, iii) construction, iv) wholesale and retail trade, v) transport and storage, vi) accommodation and food service activities, vii) information and communication (1), viii) financial and insurance activities, and ix) professional, scientific and technical activities; administrative and support – as defined by the European System of National Accounts 2010.
The econometric analysis does not cover i) agriculture, forestry and fishing, ii) real estate activities, iii) public administration, defence, education, human health and social work or iv) arts, entertainment and recreation because measuring economic activity in these sectors poses some challenges. First, gross value added of the public service sector is difficult to measure as its output is often unpriced and public services are often consumed collectively (2) so that output of this sector is measured as the total value of inputs. (3) Second, gross value added of real estate activities is difficult to measure because financial costs and depreciation are not considered in the calculation of gross value added, in spite of representing the main costs in some parts of the real estate sector, (4) and also because gross value added in the real estate sector covers imputed rent for owner-occupied dwellings. (5) Third, the agricultural sector (compared with the other sectors) has a disproportionally high share of self-employed which creates a strong wedge between its unadjusted labour income share (based solely on employees) and the adjusted labour income share (which includes the self-employed).
For each sector a reduced form regression equation is estimated by pooling the data of the 10 euro area Member States (6) for which sufficient data are available. The dependent variable is the sectoral adjusted labour income share, assuming that the self-employed earn the same compensation as the employees in the sector.
While the transmission mechanisms via which the explanatory variables affect the sectoral labour income share are discussed in more detail in the main text, this box briefly describes their main characteristics and source:
• sectoral total factor productivity growth: disembodied technological change available for a selected set of euro area Member States in the EUKLEMS database, (7)
• sectoral non-residential real fixed capital stock per person employed: technical change embodied in new capital goods is captured through the use of quality-adjusted prices and user costs as weights in asset aggregation (8) available for a selected set of euro area Member States in the EUKLEMS database,
• sectoral openness to international trade: openness to international trade of the Manufacturing sector and Other industry is approximated as the sum of a country's exports and imports of goods divided by GDP. Openness of the service sectors (Finance, Professional activities and business services) and Construction are approximated by the sum of exports and imports of services divided by GDP. Hodrick-Prescot filtered series used in the regression analysis. These data are available in the AMECO database,
(1) Which includes publishing activities, telecommunications, computer programming, consultancy and related activities , data
processing, hosting and related activities; web portals, motion picture, video and television programme production, sound recording and music publishing activities.
(2) See, for instance, Boyle, R. (2006), ‘Measuring Public services sector Productivity: Lessons from International Experience,’ CPMR Discussion Paper 35.
(3) For more details, see European Commission et al. (2008), System of National Accounts 2008 (4) See, for instance, http://ec.europa.eu/eurostat/statistics-explained/index.php/Real_estate_activity_statistics_-_NACE_Rev._2 (5) This component of gross value added stems from the use by employed persons or households of stocks of dwellings, and as such it
does not correspond with observed paid labour input in the real estate sector. (6) I.e. DE, ES, FR, IT, LU, NL, AT, SI, SK and FI. (7) For more details, see O’Mahony, M. and M. Timmer (2009), 'Output, Input and Productivity Measures at the Industry Level: The
EU KLEMS Database', The Economic Journal, Vol. 119, pp. F374–F403. (8) For more details, see O’Mahony, M. and M. Timmer (2009), op cit.

54 | Quarterly Report on the Euro Area
Controlling for technological progress and capital deepening allows investigating whether the residual variation in the labour share is connected to specific institutional features and to integration in the global economy.
In order to investigate in a more rigorous way how technological and institutional changes contributed to determine the evolution of sectoral labour
shares since 2000, a sectoral regression of labour shares on a set of determinants is implemented.
The estimation is carried out in an unbalanced panel covering 10 euro area Member States for which harmonised sectoral data are available. (177) (177) The sample includes DE, ES, FR, IT, LU, NL, AT, SI, SK, FI
with sample size from 2001-2015 for all, except IT (2001-2014), SK (2005-2015), SI (2009-2013), LU (2009-2015).
Box (continued)
Table III.1: Factors affecting sectoral labour income share
(1) See Box IV.3. for data and estimation procedure (2) t-values between brackets; *** for p < 0.01, ** for p < 0.05, * for p < 0.1. (3) p-values for Kao Residual Panel Cointegration Test with Null Hypothesis no cointegration. Source: Authors' estimates
• the sectoral output gap: the difference between the observed value of the sectoral gross value added in constant prices and its Hodrick-Prescott filtered trend, divided by the Hodrick-Prescott filtered trend using Eurostat's National Accounts data,
• net replacement rate: based on unemployment benefits of a single earner without children previously earning 100% of the national wage and unemployed for less than 7 months – as reported in OECD/ECFIN Tax and benefits indicators database (10),
• union density: national net union membership as a proportion of wage earners in employment available in the ICTWSS database. (11)
Country dummies are included to capture specific (unobserved) country characteristics that differ across Member States and that are assumed not to have changed over the sample period. A time trend is added to capture trend developments not captured by the explanatory variables.
Focussing on co-integrated long-term relationships between the dependent and explanatory variable, no lagged variables are included and the equations are estimated applying ordinary least squares taking into account Member State differences in the variance of the stochastic term (i.e. heteroskedasticity) and contemporaneous correlation between Member States' stochastic terms. (10) This database is accessible at http://europa.eu/economy_finance/db_indicators/tab/# (11) Visser, J. (2016) ICTWSS Data base. version 5.1. Amsterdam: Amsterdam Institute for Advanced Labour Studies (AIAS), University
of Amsterdam. September 2016.
Manufacturing Other industry Construction Wholesale retail Transport and storage
Accommodation and food services
Information Finance Professional services
Sectoral capital per employed person -0.43 *** -0.01 *** -0.07 *** -0.59 *** -0.13 *** -0.24 *** -0.11 *** -0.09 *** 0.15(-20.19) (-4.76) (-8.35) (-7.42) (-11.23) (-3.69) (-4.26) (-3.16) ( 1.32)
Sectoral TFP -0.03 -0.20 *** -0.26 *** -0.28 *** -0.51 *** -0.27 *** -0.22 *** -0.06 ** -0.25 ***(-1.06) (-15.50) (-9.87) (-9.69) (-18.60) (-12.36) (-10.49) (-2.54) (-16.06)
Sectoral international trade openness -0.12 *** 0.04 -0.07 *** -0.05 ** -0.06 * -0.02 -0.02 -0.05 *** -0.05 ***(-3.15) ( 1.51) (-5.97) (-2.06) (-1.80) (-1.56) (-1.19) (-3.93) (-4.56)
National minimum wage relative to national wage -0.12 *** 0.10 * -0.10 *** -0.06 ** -0.16 *** -0.02 -0.04 * 0.03 0.09 ***(-4.49) ( 1.79) (-2.67) (-2.21) (-6.61) (-1.06) (-1.76) ( 0.36) ( 2.88)
Sectoral output gap -0.48 *** 0.12 *** -0.27 *** -0.20 *** 0.27 *** -0.17 *** -0.03 -0.18 *** -0.12 ***(-11.40) ( 3.95) (-6.38) (-6.11) ( 5.72) (-2.96) (-0.86) (-2.67) (-3.36)
Replacement ratio 0.05 *** 0.00 0.02 0.09 *** -0.01 ** 0.01 0.03 *** -0.03 0.01( 5.05) ( 0.41) ( 1.56) ( 6.82) (-2.26) ( 1.15) ( 3.23) (-1.11) ( 1.40)
Union density rate 0.12 *** 0.25 *** 0.19 *** 0.16 *** -0.45 *** 0.16 *** -0.21 *** -0.24 *** -0.05 **( 2.89) ( 6.23) ( 3.62) ( 3.58) (-10.36) ( 4.00) (-5.70) (-3.05) (-2.20)
Time trend 0.40 *** -0.42 *** -0.08 0.61 *** 0.31 *** 0.10 *** 0.80 *** -0.02 0.38 ***( 8.06) (-10.79) (-1.29) ( 19.53) ( 6.04) ( 2.74) ( 23.87) (-0.48) ( 14.33)
Country fixed effects Yes Yes Yes Yes Yes Yes Yes Yes Yes
Adjusted R-squared 0.91 0.94 0.93 0.95 0.90 0.97 0.92 0.82 0.97Durbin-Watson 1.48 1.48 1.23 1.58 1.55 1.43 1.56 1.54 1.60Number of observations 127 127 127 127 127 127 127 127 127Number of explanatory variables 18 18 18 18 18 18 18 18 18Kao residual cointegration test (p-values) 0.000 0.022 0.039 0.000 0.126 0.002 0.000 0.034 0.004

III. The labour income share in the euro area
Volume 17 No 4 | 55
The dependent variable is the adjusted sectoral labour share. The explanatory variables defined at the sectoral level are: capital-labour ratios, TFP, trade openness, and the output gap. The explanatory variables defined at the national level are the ratio of the statutory minimum wage to the average wage, the replacement ratio, and the union density. (178) The sample (set by data availability) covers the 2001-2015 period. The data and estimation method are described in Box IV.3.
Table III.1 shows the results. (179) Focussing on capital deepening, the significant negative point estimates for most sectors suggest a relatively high degree of substitutability between capital and labour (under the restrictive assumption that the TFP variable adequately controls for the unobserved process of technical change). (180) The only sector in which the coefficient on the capital-labour ratio is not significantly negative is in professional and business services. In the latter sector, the estimated coefficient on capital deepening is positive but insignificant. (181)
Whenever significant, trade openness also appears negatively linked to sectoral labour share dynamics. The relationship is significantly negative in manufacturing and finance, but also in business services, transport and storage, as well as construction, possibly reflecting a reduction in worker bargaining power. (182) This variable is
(178) Here it should be noted that some variables, such as employment
protection legislation have not been included in the regression analysis as they show often little variation over time within Member States so that their impact is captured by the country dummies. This does not mean that they would not have an impact on the labour income share.
(179) Except for the sector construction, the Durbin Watson statistics have a value at or above 1.5 suggesting that null hypothesis of no autocorrelation in residuals cannot be rejected with high confidence. Also included the p-values for the Kao Residual Panel Cointegration Test with as Null Hypothesis no cointegration between the dependent and explanatory variables. The Null Hypothesis can be rejected with high confidence for all sectors, except the sector transport and storage.
(180) See footnote 53 for a caveat on the interpretation of this coefficient.
(181) Here it should be noted that manufacturing covers both traditional industrial activities such as textiles and food processing, as well as technology- and knowledge-intensive industrial activities such as semiconductors and communications equipment. Insufficient data are available to cover these differences in the regression analysis.
(182) However, at the same time a further opening also provides countries the opportunity to specialise in those activities in which they have a comparative advantage (provided resources can be reallocated in a flexible way). Such specialisation will then increase productivity and wages while at the same time lowering the price of imports (provided free and fair trade is not hindered). All these effects may then increase the standard of living of workers in
marginally significant in the wholesale-retail and ICT sectors, and insignificant in the accommodation-food sector as well as in the industries other than manufacturing and construction.
Changes in the ratio of the statutory minimum wage to the average national wage are significantly related with changes in sectoral labour shares in most sectors. An increase in this ratio is associated to a reduction in the labour share in all sectors except Other industries and professional services (183).
In most sectors, no significant linkage between replacement ratios and sectoral labour shares is picked up. The replacement ratio affects the fall-back position of a worker in the case of unemployment. The relationship is estimated as significantly positive in Manufacturing, Wholesale/retail trade, and the ICT sector.
A higher trade union density has a significantly positive relation with the labour share in all sectors (except for transport and storage, finance, ICT and professional series). At the same time, its coefficient is significantly negative in Transport and Finance.
The labour income share shows a significant counter-cyclical pattern for all sectors (except for Other industries and Transport and Storage where it shows a significant pro-cyclical pattern). This finding may reflect the fact that output decreases at a stronger pace than employment as labour gets hoarded at the beginning of a downturn so that labour productivity decreases.
Finally, while these point estimates provide a first indication of the impact of various factors on the sectoral labour income share, it should be recognised that with more detailed harmonised
absolute terms – even if the labour income share is declining at the same time.
(183) In this reduced form approach it is not possible to identify how changes in the minimum wage affect the wage distribution. For instance, firms may choose to reflect the change in the minimum wage, thereby keeping the ratio constant. An increase in the minimum wage may increase the labour income share in the short run, as discussed for instance in Neumark, D., J. Salas and W. Wascher (2014), 'Revisiting the Minimum Wage-Employment Debate: Throwing Out the Baby with the Bathwater?', Industrial & Labor Relations Review, Vol. 67/Supplement, pp. 608-648. But this section estimates the long-run effects in which case it is more likely that increases in minimum wages trigger capital-labour substitution.

56 | Quarterly Report on the Euro Area
data at the sectoral level, such as the skills and the asset composition, the analysis could be significantly sharpened.
Zooming in on developments in the labour income share in manufacturing (which recorded a sharp decrease in the euro area as a whole) and Professional activities/business services (which recorded a sharp increase in the euro area as a whole) as well as whole and retail sale (which recorded a less pronounced change) for the selected set of Member States for which sufficient data are available, Graph IV.14 shows that between 2001 and 2015 (or a shorter period) changes in trade openness had a relative limited impact on the labour income share especially in the professional services and wholesale and retail. TFP growth in combination with capital deepening exerted especially a negative impact in the manufacturing sector, but a positive one in the professional services sector.
Graph III.14: Impact of selected set of factors (2001-2015)
(1) "Manu" short for manufacturing, "Whole" short for wholesale and retail, "Prof" short for professional services. For all MS the change between 2001-2015 except IT (2001-2014), LU (2009-2015), NL (2001-,2015), SK (2005-2015), SI (2009-2013). (2) These estimates are obtained by multiplying the point estimate with the observed change in the underlying factor. Source: Authors' estimates
III.6. Conclusions and policy implications
The analysis in this section highlights that changes in the labour income share in the euro area over 2000-2017 mostly reflect countercyclical movements, without a significant downward trend. At the individual Member State level, no trend in the labour income share is found over this period in Austria, Belgium, Cyprus, Germany, Lithuania,
Luxembourg, the Netherlands, and Slovenia. The labour income share increased in Estonia, Finland, France, Italy, Latvia, and Slovakia while it was reduced in Ireland, Malta, Portugal, and Spain. The more pronounced reduction in the total labour income share in these countries, in particular in Spain and Portugal, is attributable to a strong reduction in the labour income share in Industry and a relatively weak increase in the labour income share in Professional activities /Business services. The analysis also underpins weak convergence in labour shares across the euro area as the labour income share increased in some Member States with initially low labour shares (Estonia, Latvia) while decreasing in some Member States with initially high labour shares (Portugal).
A shift-share analysis showed that in most Member States changes in the total labour income share of the market sector was mainly affected by changes in the labour income share within sectors rather than a reallocation of labour across sectors. The strongest impact derives from a declining labour share in Industry, coinciding with a rising labour share in the Professional Activities/Business services. When aggregating these changes, within-sector changes across euro area Member States almost fully counteract each other, such that at the euro area-level, within-sector variation (slightly negative) is much weaker than the impact of sectoral shifts (which is also negative, pointing at a move towards sectors with relatively lower labour shares). The interaction effect is positive, suggesting that sectors that are gaining market share (in particular the Professional Activities/Business services) are witnessing an increase in the labour share, and vice versa.
Focussing on developments within the market sectors shows that technological progress in combination with capital deepening as well as trade opening had an important impact on labour shares - which is in line with earlier results reported for the total labour income share. (184)
While the estimation results suggest that these structural factors reduced the labour income share in several sectors, and the labour income share may
(184) See, for instance, Schwellnus, C., Pak, M., Pionnier, P-A,
Crivellaro, E. (2018), 'Labour share developments over the past two decades: the role of technological progress, globalisation and “winner-takes-most” dynamics', OECD Working Paper No. 1503; and by Dao et al. (2017), op cit.
-15
-10
-5
0
5
10
15
20
Man
uW
hol
ePr
ofM
anu
Whol
ePr
ofM
anu
Whol
ePr
ofM
anu
Whol
ePr
ofM
anu
Whol
ePr
ofM
anu
Whol
ePr
ofM
anu
Whol
ePr
ofM
anu
Whol
ePr
ofM
anu
Whol
ePr
ofM
anu
Whol
ePr
of
DE ES FR IT LU NL AT SI SK FI
TFP + capital deepening Openness Observed

III. The labour income share in the euro area
Volume 17 No 4 | 57
be viewed as a measure of social fairness (185), these structural factors contributed nevertheless to productivity growth. The latter provides the basis for sustained increases in the overall wage level as well as quality improvements and lower quality-adjusted prices, thereby contributing to higher consumer purchasing power (i.e., welfare). Moreover, households also draw income from capital gains and profits - albeit that the distribution of capital income is skewed towards households in the very top of the income distribution. (186) Such trade-offs should be taken into account when formulating policies aimed at promoting smart, sustainable and inclusive growth.
The empirical analysis in this section also shows that since 2000 a large share of the variation over time in the labour share has reflected countercyclical movements. While overly rigid labour market institutions may delay the necessary reallocation of labour during a recovery, the counter-cyclical nature of the labour income share can act as a stabilising factor in the face of a temporary shock and therefore be socially desirable. Again, policymakers should be aware of such trade-offs when formulating policies to strengthen economic resilience.
For the other factors, which have a smaller impact on the sectoral labour income share, the econometric analysis suggests that specific factors do not have the same impact across sectors. For example, the impact of changes in the minimum wage differs across sectors partly reflecting differences in the substitutability between labour and capital as well as differences in the pass-through of wage changes at the bottom to the overall wage structure. Such findings highlight the complexity of targeting the labour share directly using existing labour market policy instruments – if such targeting would be considered desirable at all.
(185) See Atkinson, A. (2009), op cit. and Goldfarb, R. and T. Leonard,
(2005), op cit.. (186) For instance, Balestra, C. and R. Tonkin (2018), ‘Inequalities in
household wealth across OECD countries: Evidence from the OECD Wealth Distribution Database‘, OECD Statistics and Data Directorate Working Paper No.88 estimate that across the 28 OECD countries covered, the wealthiest 10% of households hold, on average, 52% of total household wealth, while the 60% least wealthy households own little over 12%.
At the same time, available evidence indicates that higher sectoral skill intensity is associated to relatively high labour income shares, and greater likelihood of increasing labour shares over time. This finding is likely due to high skilled labour’s higher complementarity with capital in production. Hence, investing in skills can produce a double dividend: strengthening macro-economic performance and productivity growth on the one hand, and supporting a commensurate development of workers’ living standards.
To the extent that labour share dynamics are influenced by a reallocation of market shares towards firms with lower labour shares at the technology frontier, policymakers may also want to monitor that the competitive advantage that these firms have does not become entrenched over time or give rise to anticompetitive behaviour such as the establishment of entry barriers. A lively debate is taking place in the academic literature in connection to US developments where changing market structures appear to be generating on the one hand higher allocative efficiency, with higher profits for a limited set of firms but lower labour shares, and on the other hand relatively low investment effort possibly indicating weakening competition pressure. For Europe, the evidence as regards the intensity of competition is inconclusive to date.
Further research could focus on a more rigorous specification of the transmission mechanisms via which the various factors affect the sectoral labour income share, and look beyond the traditional NACE sectoral classification making a distinction between economic activities according to technology and knowledge intensity (if adequate harmonised data become available).


EUROPEAN ECONOMY INSTITUTIONAL SERIES European Economy Institutional series can be accessed and downloaded free of charge from the following address: https://ec.europa.eu/info/publications/economic-and-financial-affairs-publications_en?field_eurovoc_taxonomy_target_id_selective=All&field_core_nal_countries_tid_selective=All&field_core_date_published_value[value][year]=All&field_core_tags_tid_i18n=22621. Titles published before July 2015 can be accessed and downloaded free of charge from: • http://ec.europa.eu/economy_finance/publications/european_economy/index_en.htm
(the main reports, e.g. Economic Forecasts) • http://ec.europa.eu/economy_finance/publications/occasional_paper/index_en.htm
(the Occasional Papers) • http://ec.europa.eu/economy_finance/publications/qr_euro_area/index_en.htm
(the Quarterly Reports on the Euro Area)


GETTING IN TOUCH WITH THE EU In person All over the European Union there are hundreds of Europe Direct Information Centres. You can find the address of the centre nearest you at: http://europa.eu/contact. On the phone or by e-mail Europe Direct is a service that answers your questions about the European Union. You can contact this service:
• by freephone: 00 800 6 7 8 9 10 11 (certain operators may charge for these calls),
• at the following standard number: +32 22999696 or • by electronic mail via: http://europa.eu/contact.
FINDING INFORMATION ABOUT THE EU Online Information about the European Union in all the official languages of the EU is available on the Europa website at: http://europa.eu. EU Publications You can download or order free and priced EU publications from EU Bookshop at: http://publications.europa.eu/bookshop. Multiple copies of free publications may be obtained by contacting Europe Direct or your local information centre (see http://europa.eu/contact). EU law and related documents For access to legal information from the EU, including all EU law since 1951 in all the official language versions, go to EUR-Lex at: http://eur-lex.europa.eu. Open data from the EU The EU Open Data Portal (http://data.europa.eu/euodp/en/data) provides access to datasets from the EU. Data can be downloaded and reused for free, both for commercial and non-commercial purposes.
