quarterly report on the euro area - european commission · area is not yet fully prepared to cope...
TRANSCRIPT

Economic and Financial Affairs
ISSN 2443-8014 (online)
INSTITUTIONAL PAPER 030 | JULY 2016
Quarterly Report on the Euro Area
Volume 15 No 2 (2016)
EUROPEAN ECONOMY
The Quarterly Report on the Euro Area is written by staff of the Directorate General for Economic and Financial Affairs (DG ECFIN) It is intended to contribute to a better understanding of economic developments in the euro area and to improve the quality of the public debate surrounding the areas economic policy The views expressed are the authorrsquos alone and do not necessarily correspond to those of the European Commission The Report is released every quarter of the year
LEGAL NOTICE Neither the European Commission nor any person acting on its behalf may be held responsible for the use which may be made of the information contained in this publication or for any errors which despite careful preparation and checking may appear This paper exists in English only and can be downloaded from httpeceuropaeueconomy_financepublications
Europe Direct is a service to help you find answers to your questions about the European Union
Freephone number ()
00 800 6 7 8 9 10 11 () The information given is free as are most calls (though some operators phone boxes or hotels may charge you)
More information on the European Union is available on httpeuropaeu Luxembourg Publications Office of the European Union 2016
KC-BC-16-030-EN-N (online) KC-BC-16-030-EN-C (print) ISBN 978-92-79-54335-7 (online) ISBN 978-92-79-54334-0 (print) doi10276590786 (online) doi102765592344 (print)
copy European Union 2016 Reproduction is authorised provided the source is acknowledged
European Commission Directorate-General for Economic and Financial Affairs
Quarterly Report on the Euro Area Volume 15 No 2 (2016)
EUROPEAN ECONOMY Institutional Paper 030
Table of contents
Editorial 5
I Cross-border risk sharing after asymmetric shocks evidence from the euro area and the United States 7 I1 Introduction 7 I2 Mechanisms of cross-border risk sharing 8 I3 Methods to measure cross-border risk sharing 9 I4 Empirical results of cross-state risk sharing in the euro area and the US 13 I5 Conclusion 16
II Financial channels and economic activity in the euro area 19 II1 Introduction 19 II2 The financial system and the real economy 19 II3 Transmission channels from financial to macro developments 22 II4 Financial developments and economic activity 25 II5 Conclusions 29
III Confidence spillovers in the euro area 33 III1 Introduction 33 III2 Recent trends in consumer confidence and private consumption in the euro area 33 III3 The existing evidence on confidence spillovers 34 III4 Confidence spillovers across the euro area 36 III5 Conclusions 37
Boxes
I1 Empirical methods to estimate relative weights of cross-border risk sharing channels 17
III1 A GVAR model to assess confidence spillovers 35
Editorial
Volume 15 No 2 | 5
According to the European Commissions latest forecast published in May 2016 the economic recovery in the euro area is expected to continue at a fairly modest pace especially when compared with pre-crisis standards Underwhelming growth is mainly supported by internal demand and some tailwinds in particular very accommodative monetary policies supportive fiscal policies low oil prices and a depreciating euro currency
However the downside risks to the outlook are considerable On the external side weaker growth in emerging market economies andor stronger geopolitical tensions could affect euro area economies more negatively than expected On the domestic side the probably most important policy risk surrounding our forecast has materialised namely the UKs vote to leave the EU Its prospective impact on the economic outlook needs to be carefully assessed
In this environment of lasting uncertainty the euro area is not yet fully prepared to cope with large economic shocks A major reason is that although domestic tax and benefits systems are quite extensive within euro area Member States for example in comparison with the US states the single currency area lacks an appropriate degree of cross-border risk sharing
Cross-border risk sharing in the euro area would reduce the insurable risk of each country by sharing it with a large group therefore supporting consumption smoothing in the face of asymmetric shocks While the determination of the optimal degree of cross-border risk sharing is challenging a comparison of the euro area and the US offers a good starting point Following the seminal paper by Asdrubali et al (1996) published in the Quarterly Journal of Economics we can distinguish three main channels through which the risk of asymmetric shocks can be shared among countries capital markets credit markets (these two represent private risk sharing) and fiscal transfers (which represent public risk sharing)
Section I of this edition of the QREA provides updated estimates for these cross-border channels for both the US and the euro area taking the observations from the global crisis period into account The findings show that around 75 of an asymmetric output shock gets smoothed in the US The most important contribution comes from capital markets in the form of cross-border ownership of assets (around 45 ) followed by credit markets (27 ) and fiscal transfers (8 ) The high share of private risk sharing in the US is strongly underpinned by a federal deposit insurance scheme supported by a public backstop which is crucial for a complete integration of financial markets By contrast only around 25 of an asymmetric shock is smoothed in the euro area While cross-border fiscal insurance is virtually absent the main reason for the substantial gap between the US and the euro area comes from the very limited degree of risk sharing through capital income flows between Member States
Therefore enhancing private risk sharing in the euro area especially through the completion of the Banking Union (including a common backstop to the Single Resolution Fund) and a true Capital Markets Union as proposed by the Five Presidents Report remains a key policy priority Well-functioning and integrated financial systems would also mitigate the propagation of financial shocks to the real economy as shown in Section II of this edition
As stated in the June 2016 ECOFIN Roadmap to complete the Banking Union further risk sharing needs to go along with further risk reduction This is important since a high degree of risk sharing can lead to excessive risk taking as illustrated by Paulys influential contribution in the American Economic Review (1968) This problem of moral hazard arises if individuals change their behaviour after benefitting from insurance (eg by increasing their risks) therefore shifting the risk from the party that can most efficiently protect it to a party that cannot The risk of moral hazard is considered to be an issue in the euro area and some financial market participants consider the so-called lsquono bailoutrsquo clause codified in the European treaties as no longer credible Moreover experience has clearly shown that market
Marco Buti Director-General
6 | Quarterly Report on the Euro Area
pressure does not build up gradually it moves abruptly from neglect to excessive worries
Hence it is important that euro area Member States further strengthen their resilience to address economic shocks and remove macroeconomic imbalances
A key objective that has repeatedly been stated in recent Commission documents most prominently in the Commissionrsquos communication on the European Deposit Insurance Scheme (EDIS) is to reduce to a minimum the likelihood of having to resort to public risk sharing Completing the Financial Union achieves precisely that the more private risk sharing and risk reduction the lower the need for fiscal risk sharing
Many important steps have been taken in that direction notably but not exclusively with the establishment of the Single Supervisory Mechanism (SSM) and further steps are planned for instance by eliminating the scope of remaining national options and discretions through EU regulatory measures or by strengthening the availability of adequate lsquobailinablersquo bank liabilities
Without prejudice to the importance of risk reduction it also needs to be stressed that elements of risk sharing also contribute to a process of risk reduction in the euro area the European Stability Mechanism (ESM) being an important case in point
Finally the current macroeconomic policy predicament
in the euro area also highlights the need to re-think the balance of risk sharing mechanisms Most observers concur that monetary policy alone cannot provide the entire stimulus that the economy needs because of the constraints imposed by the zero lower bound and because the current fiscal framework focuses on curbing excessive deficits and debt but does not offer any additional support to aggregate demand
The overreliance on monetary policy at the current juncture brings the issue of a central fiscal capacity to the forefront Such further fiscal integration would allow monetary policy to more quickly move away from the current unorthodox measures that it employs
In brief to better prepare the euro area for future economic shocks we need to work towards a more suitable level and balance of risk sharing and risk reduction The roadmap outlined in the Five Presidents Report includes many important proposals to reach this goal The UK lsquoLeaversquo vote makes it even more important to ensure an effective economic policy coordination to limit the fallout of the referendum outcome In the medium run it is also clear that without further progress the EMU will remain incomplete We urgently need to build a new narrative on how to react to the current challenges in both the short and long run with the ultimate goal to safeguard stability and prosperity in the single currency area and the EU as a whole
I Cross-border risk sharing after asymmetric shocks evidence from the euro area and the United States
Volume 15 No 2 | 7
I1 Introduction
One of the most important characteristics of a well-functioning economic and monetary union is the capacity to absorb asymmetric (ie country-specific) shocks The challenges specific to the euro area were clear from the beginning (2)
After a period of relatively high synchronisation in the run-up to and in the first years of Economic and Monetary Union (EMU) the surge in cyclical and structural differences during the economic and financial crisis has turned attention to the mechanisms available to smooth consumption in the face of asymmetric shocks These include possible policy measures to improve cross-border risk sharing among Member States
The Five Presidentsrsquo Report issued in June 2015 pays particular attention to enhancing the shock absorption capacity of the euro area both through better integrated financial and capital markets (private risk sharing) and through a mechanism
(1) This section was prepared by Plamen Nikolov (2) See lsquoEMU10 The first ten years a resounding successrsquo in
Quarterly Report on the Euro Area Vol 7 No 2 (2008) for a historical overview of the challenges in the functioning of the EMU and the design of the appropriate policy responses as seen by its early proponents and the policy-makers of the time Common shocks could also have asymmetric effects across countries A good example of an asymmetric effect of common shocks is presented in Box 6 of the report which explains the differentiated response to a fall in US private demand in Germany Italy and Ireland by referring to the differences in their trade openness and the structure of their exports
of fiscal stabilisation among euro area Member States (public risk sharing) (3)
Currently a high level of economic divergence among euro area Member States is still present (4) By 2015 the divergent economic performance since the crisis resulted in an eight percentage point growth gap between the best and the worst performing Member State while the gap between the highest and lowest unemployment rate in the euro area reached 20 percentage points (5) In such an environment even a small localised shock can have large effects if cross-border risk sharing among Member States is weak
Therefore the goal of this section is to present empirical evidence on the current degree of cross-border risk sharing in the euro area in the event of an asymmetric shock The section starts with a brief review of the existing channels of cross-border risk sharing and presents some stylised facts on consumption smoothing following asymmetric
(3) lsquoCompleting Europersquos Economic and Monetary Unionrsquo Report by
Jean-Claude Juncker in close cooperation with Donald Tusk Jeroen Dijsselbloem Mario Draghi and Martin Schulz 2015
(4) For a presentation of asymmetries across euro area Member States see Ruscher E (2015) lsquoAn overview of market-based adjustment in the euro area in the light of the crisisrsquo in Quarterly Report on the Euro Area Vol 14 No 4 (2015)
(5) In 2015 the fastest growing economy in the euro area was Ireland at 78 while the worst performance was in Greece at -02 The highest unemployment was in Greece at almost 25 of civilian labour force while the lowest in Germany at 46 To be fair US states also experience divergent growth performance In 2014 real state domestic product in Alaska shrank by -14 while in North Dakota it increased by 7 However labour market divergence between US states is much more subdued with a difference of only 41 pps between the worst performer (Illinois) and the best performer (South Dakota)
This section presents empirical evidence on the shock absorption capacity of the different channels of cross-border risk sharing in the euro area The surge in economic divergence since the crisis has turned attention to the available cross-border mechanisms to smooth consumption in the face of asymmetric shocks The main channels considered are private risk sharing through access to cross-border capital and credit markets and other cross-border factor income such as labour compensation and public risk sharing through cross-border fiscal transfers (public stabilisation through domestic means is not considered) This section shows that Economic and Monetary Union has likely facilitated cross-border shock absorption through private risk sharing even taking into account the impact of the crisis on the financial sector However a direct comparison with the shock absorption capacity across US states shows that the size of the asymmetric shock that remains unsmoothed in the euro area is very high The difference is mainly due to much less developed capital and labour market cross-border channels in the euro area Therefore enhancing private risk sharing among the euro area Member States especially through capital markets remains a policy priority (1)
8 | Quarterly Report on the Euro Area
output shocks Next the section presents quantitative results Specifically it employs an econometric approach to quantify the relative amount of smoothing of asymmetric output shocks that is due to three distinct cross-border channels net factor income fiscal support and savings The section contrasts private and public risk sharing results obtained by this method in the euro area and the United States and shows that private risk sharing works better in the latter The section concludes with policy implications for the efforts needed to increase the shock absorption capacity of the euro area through cross-border risk sharing
I2 Mechanisms of cross-border risk sharing
Cross-border risk sharing is linked to integration between countries first and foremost economic and financial but also political and institutional at least to some extent Therefore it is important to examine the channels through which this type of risk sharing operates and the minimum degree of integration that makes it efficient This needs to be done in order to anticipate necessary changes in policy
The channels of operation of cross-border risk sharing can be divided into two broad categories private and public
The private channels of cross-border risk sharing work through access to foreign financial markets including through foreign capital markets and cross-border loans and deposits as well as through labour compensation generated across borders
The cross-border provision of financial services by financial institutions and markets is one of the main ways that private risk sharing operates Residents of a country that experiences a negative output shock could smooth their consumption through property income streams generated by financial assets held in another jurisdiction which is shielded from the shock This is the capital market channel of risk sharing
Alternatively residents of a country that sees a negative output shock can secure consumption levels by drawing down savings accumulated during better times or by borrowing This can also be done indirectly for example when public borrowing is used to compensate for the loss of tax revenues after asymmetric shocks in order to sustain government expenditure levels and in turn smooth household consumption This is what is
called the credit market or savings channel of risk sharing The savings channel does not necessarily involve a cross-border element but integration helps deepening of financial markets thus ensuring cost-cutting and efficiency (6)
The operation of both the capital and the credit market channels is greatly facilitated by integrated financial markets and competition among financial institutions This requires the adoption of a legal framework (among which insolvency laws and accounting standards) for competitive cross-border financial intermediation the creation of an efficient financial infrastructure and the required institutional safeguards to ensure stable financial systems
Another private channel of risk sharing that operates through streams of cross-border factor income is the cross-border labour compensation channel Residents of a country that experiences a negative shock to output could smooth their consumption with labour income generated in another jurisdiction that does not experience the shock Such workers are called commuter workers (7) This channel requires free movement of labour as well as the prerequisites for a high degree of labour mobility among which are investment in human capital flexibility in compensation and hours worked portability of social security rights and facilitated firm entry and exit
The public channels of cross-border risk sharing involve some form of fiscal redistribution between those countries that experience a negative output shock and those which do not For example the fiscal redistribution can be in the form of cross-border subsidies social protection including a common unemployment scheme or cross-border financing of public investment such as transport corridors
The public channels require a great deal of solidarity among the partners and naturally involve
(6) In the case of risk sharing measured by balancing items for the
total economy a fixed level of household and government consumption after an output shock can only be achieved by borrowing or lending abroad
(7) This channel is different from although closely related to risk sharing through remittances sent to the home country by workers residing abroad The difference comes from the fact that remittances are sent by residents of an immigration country to residents of a country of origin and thus are measured differently in the national accounts
I Cross-border risk sharing after asymmetric shocks evidence from the euro area and the United States
Volume 15 No 2 | 9
a higher degree of political and institutional integration between them including a system of common decision-making that ensures democratic legitimacy and accountability
The initial EMU design did not envisage a substantial role for cross-border public risk sharing through common EMU fiscal support The EU budget remains quite small in comparison to the sum of the Member Statesrsquo national budgets and is mainly designed to support real convergence rather than smooth shocks across countries (8)
I3 Methods to measure cross-border risk sharing
Empirical facts on cross-border risk sharing among Member States support the view that the EMU likely helped the process of smoothing cross-border output shocks mainly through private channels Graph I1 shows the cross-country dispersion of output income (9) income after taxes and consumption in the euro area since the start of the EMU
(8) The amount of cross-border risk sharing in the EU through
common public channels such as spending through the multiannual financial framework (MFF) remains much lower than in federal states The EU budget accounts for 1 of the EUrsquos combined GDP while in the US it reaches 25 of GDP
(9) Income is derived from GDP adjusted for net factor income vis-agrave-vis rest of the world plus net taxes and subsidies on products and imports See also Box II1
The dispersion of output among Member States has remained quite stable since the launch of the euro despite a minor increase in the boom years before the crisis and a minor drop after the crisis hit Both income (including after-tax income) and consumption show a lower degree of dispersion among the Member States than output (10) This suggests that asymmetric shocks to output are being smoothed among countries as part of the general income and consumption convergence process in the euro area
Moreover the years after the introduction of the euro as a common currency seem to coincide with a visible even though slight reduction in the cross-country dispersion of income and consumption The trend is also visible when the sample excludes new Member States (right-hand panel) This suggests that the creation of the EMU has resulted in better convergence and possibly better cross-border risk sharing among Member States (11)
(10) Measured by the standard deviation in real per capita terms This
remains valid even when the sample excludes the countries that joined the euro area after 2004 See right-hand panel of Graph II1
(11) The fact that after-tax-income shows slightly more dispersion than pre-tax-income is hardly surprising given that fiscal policy in the euro area is decided at national level If there is a common system of risk sharing through cross-border transfers to smooth income and governments can borrow decentralised fiscal policy can also dampen variations in after tax income
Graph I1 Cross-country dispersion of output income and consumption in the euro area (1)(2)
(1999-2015 Index EA-19=100)
(1) Standard deviation of real per-capita terms output is measured by GDP income by gross national income (GNI) and income after taxes contributions and subsidies by gross disposable income (GDI)(2) New Member States (NMS) of the euro area are those that joined after 2004 Source AMECO
0
10
20
30
40
50
60
1999 2001 2003 2005 2007 2009 2011 2013 2015
OutputIncomeIncome after taxes contributions and transfersConsumption
0
10
20
30
40
50
60
1999 2001 2003 2005 2007 2009 2011 2013 2015
Output (exclNMS)
Income (exclNMS)
Income after taxes contributions and transfers(exclNMS)Consumption (exclNMS)
10 | Quarterly Report on the Euro Area
Looking at the same graph for the US reveals that the disparity of output income and consumption among the 50 US states is much lower than between the euro area Member States The crisis has affected divergence in the US as well with a sharp increase in the cross-state standard deviation of output and income in 2008 (Graph I2)
Another difference with the euro area is the smoothing role of taxes contributions and transfers with gross disposable state income having a much lower dispersion than unadjusted income in the US compared to the euro area This is to be expected given the larger size of the US federal budget
Graph I2 Cross-state dispersion of output income and consumption in the 50
US states (1) (1999-2014 in )
(1) Standard deviation of real per-capita terms output is measured by gross state product (GSP) income by gross state personal and non-personal income and income after taxes contributions and subsidies by gross disposable state income Source US Bureau of Economic Analysis (BEA) US Office of Management and Budget (OMB) US Bureau of Labour Statistics (BLS) US Census Bureau DG ECFIN calculations
A more concrete representation of the process of cross-border risk sharing within a single year can be obtained by looking at the dispersion of output and consumption growth among euro area Member States and US states shown on Graph I3 The vertical difference between the dispersions of output and consumption gives the amount of a change in output that is not picked up by the change in consumption over the course of the year and thus appears to be smoothed This is in contrast to dispersion of output income and consumption in levels presented above which contains in itself convergence irrespective of
shocks as well as smoothing of past shocks that takes more than one year
The graph shows that there were periods before the crisis when annual consumption growth within the euro area differed more than the growth in output Conversely between 2010 and 2013 the dispersion of consumption growth was clearly below the dispersion of output growth suggesting smoothing in the course of each of these years
The contrast with the US is visible here as well Both output and consumption growths among the US states vary less than among euro area Member States and in the US the variability of consumption growth is consistently lower than the variability of output growth suggesting a more consistent risk sharing process
Graph I3 Cross-border dispersion of output and consumption growth in the
euro area and the 50 US states (1) (1999-2015 in pps)
(1) Standard deviation of growth in real per-capita terms Source AMECO US Bureau of Economic Analysis (BEA) US Office of Management and Budget (OMB) US Bureau of Labour Statistics (BLS) US Census Bureau DG ECFIN calculations
Labour mobility
Looking at the specific channels of cross-border risk sharing Graph I4 attempts to illustrate the role of cross-border labour income with data from Eurostatrsquos Labour Force Survey (12) The graph
(12) The EU labour force survey is a large sample survey among
private households in Europe and an important source for European statistics about the situation and trends in the EU labour market
Visit httpeceuropaeueurostatwebmicrodataeuropean-union-labour-force-survey for more information
0
5
10
15
20
25
1999 2001 2003 2005 2007 2009 2011 2013
OutputIncomeIncome after taxes contributions and transfersConsumption
0
1
2
3
4
5
6
1999 2001 2003 2005 2007 2009 2011 2013 2015
Output growth in the euro areaConsumption growth in the euro areaOutput growth in the USConsumption growth in the US
I Cross-border risk sharing after asymmetric shocks evidence from the euro area and the United States
Volume 15 No 2 | 11
provides statistics on employment by citizenship and thus on the number of euro area workers who work in another Member State A caveat needs to be made here Employment by citizenship only approximates the number of cross-border commuter workers In the very narrow sense risk sharing through labour mobility is performed by commuter workers whose number fluctuates almost simultaneously with a shock in output while cross-border employment as presented in the graph also contains a structural pattern (13)
The share of euro area labour force that has an EU citizenship different from that of the reporting country has been increasing since the start of the survey There was a minor slowdown during the crisis but by 2015 the share of euro area workers who are citizens of another EU country had reached almost 4 Most of the increase since the beginning of the survey in 2006 can be attributed to workers from the new Member States By 2015 their number had surpassed the number of workers from the EU-15
Graph I4 Cross-border employment in the euro area (1)(2)
(2006-2015 y-o-y change)
(1) Employment by citizenship other than of the reporting country 15-64 year old of total employment (2) New Member States of the EU are those that joined after 2004 Source Eurostat
There is quite a disparity among Member States regarding the share of cross-border labour This means that cross-border risk sharing through this channel is not homogeneous across Member States as some countries likely benefit more from this
(13) Data on commuter workers that move in response to shocks are
unavailable in the Labour Force Survey
form of risk sharing than the rest In 2015 the share of workers that are citizens of another EU country varies between more than 10 in Ireland and Cyprus to as low as 06 in Portugal and below or close to 2 in France Finland the Netherlands Malta and Greece Luxembourg with its small size and high expatriate population is a clear outlier Workers from the new Member States are a clear majority of EU workers in Ireland Austria Spain and Italy This diversity among Member States suggests that the pattern of cross-border risk sharing through this channel is quite different depending on the country concerned
There is still quite a lot to be done to increase the impact of cross-border labour mobility on risk sharing among euro area Member States The line on Graph I4 clearly shows a pattern similar to the demand cycle during the crisis This means that the aggregate number of cross-border workers within the euro area is pro-cyclical This may help adjustment for example when cross-border workers return to their countries of origin after a negative shock in the host country (14) Yet at this stage given the lack of precise information on the number of cross-border commuters in the euro area it is difficult to arrive at more precise conclusions on the role of risk sharing through labour compensation in the various Member States
Financial integration
The rapid financial integration in the years between the EMUrsquos creation and the start of the global financial crisis undoubtedly provided conditions for better cross-border risk sharing in the euro area The increase in the importance and size of the financial services sector in the Member States followed similar developments in the other
(14) Putting this channel in a more comparative perspective is difficult
Annual interstate mobility in the US (a flow concept) is found to be 25 of working age population in 2005 This is a relatively high number compared to countries in Europe given that in 2006 29 of the euro area labour force had a citizenship of another EU country (a stock concept) See Bonin H W Eichhorst C Florman M Okkels Hansen L Skioumlld J Stuhler K Tatsiramos H Thomasen and K F Zimmermann (2008) lsquoGeographic mobility in the European Union optimising its economic and social benefitsrsquo IZA (Forschungsinstitut zur Zukunft der Arbeit) Research Report No 19 The crisis may have affected these estimates in a different way in the two blocs For evidence that the crisis has reduced the importance of migration across state borders as a labour market adjustment tool in the US see Foote A M Grosz and AH Stevens (2015) lsquoLocate your nearest exit mass layoffs and local labour market responsersquo NBER Working Paper Series No 21618 One possibility is that the Great Recession was unique given the role of the US housing crisis which impeded mobility
0
1
2
3
4
2006 2007 2008 2009 2010 2011 2012 2013 2014 2015
From the new Member States - BG CZ CYEE HU HR LV LT MT PL RO SK SL
From the old Member States - AT BE DKDE ES FI FR GR IE IT LU NL PT SEUK
12 | Quarterly Report on the Euro Area
advanced economies but in Europe the process was given an additional impetus by the creation of the common currency and linked to that the decrease in the costs of borrowing Previous analysis in this series has shown that financial market integration has supported cross-border risk sharing However this was less through equity markets and rather more through borrowing and saving on credit markets (15)
The crisis changed the perception about financial integration and the role of wholesale bank funding in a profound way The rapid cross-border expansion up until 2007 was followed by a retrenchment of financial intermediation behind state borders Moreover capital misallocation during the boom years appeared as a major destabilising factor after the crisis hit increasing the likelihood of asymmetries across Member States (16)
Not all cross-border financial instruments in the euro area have experienced the same deep fall since the crisis Graph I5 shows that in 2014 the cross-border deposits at euro area banks excluding positions vis-agrave-vis other banks stood at levels that were relatively close to those in the pre-crisis years despite localised drops in the immediate vicinity of the sovereign-debt crisis in 2008 (17)
Both cross-border loans and deposits expanded rapidly after the creation of the euro and judging from their level today the common currency plays an important role in risk sharing through cross-border provision of financial services However cross-border equity assets experienced a significant drop during the crisis and their recovery to pre-crisis levels has taken much longer than for cross-border deposits It is also important to stress that
(15) For an overview of increased pre-crisis financial integration and
its impact on risk sharing see lsquoCross-border risk sharing has it increased in the euro arearsquo in Quarterly Report on the Euro Area Vol 6 No3 (2007)
(16) For a presentation of the limits of shock absorption in the EMU since the crisis see Jevcak A and R Kuenzel lsquoRecent capital flow developments in the euro arearsquo in Quarterly Report on the Euro Area Vol 12 No2 (2013) Loublier A lsquoRecent developments in cross-border capital flows in the euro arearsquo in Quarterly Report on the Euro Area Vol 14 No1 (2015) and lsquoFinancial integration and risk-sharing in a monetary unionrsquo in Financial Integration in Europe (2016) ECB
(17) Naturally the share of large financial centres such as Ireland and Luxembourg as locations of cross-border financial positions in the euro area is disproportionately higher than their weight in the EMU population or GDP This is another example of the Member Statesrsquo uneven ability to share risk among each other through private channels
the size of the cross-border equity market is several times lower than the cross-border loan and deposit markets
Graph I5 Cross-border financial instruments in the euro area(1)
(2001-2014 Index 2001=100)
(1) For loans and deposits other bank counterparties are excluded Source Bank for International Settlements (BIS) reporting banks IMF Coordinated Portfolio Investment Survey (CPIS)
The euro facilitates private risk sharing through lowering transactions costs and deepening financial markets However as the crisis has shown appropriate measures to create a well-functioning Banking Union are also needed This includes in particular establishing a European Deposit Insurance Scheme (EDIS) thus building the third pillar of the Banking Union Given the current regime of country-based deposit insurance there are still differences in the regulatory treatment of banks Once operational the EDIS will work against country-specific shocks since it is likely to be fiscally neutral over time because insured risks will be spread and private contributions will be raised by a larger pool of banks In this way the EDIS together with a credible common backstop to the Single Resolution Fund will create further conditions for more cross-border presence of euro area banks by ensuring consistency in regulatory treatment and by shielding the financial sector from country-specific shocks It will therefore be another supporting factor in increasing competition in the financial sector lowering costs and increasing cross-border risk sharing
0
50
100
150
200
250
300
350
400
450
2001 2003 2005 2007 2009 2011 2013
Cross-border loansCross-border depositsCross-border equity assets
I Cross-border risk sharing after asymmetric shocks evidence from the euro area and the United States
Volume 15 No 2 | 13
I4 Empirical results of cross-state risk sharing in the euro area and the US
Econometric results on the relative weight of the different risk sharing channels among euro area Member States and US states are given below This sub-section updates findings of the canonical paper by Asdrubali et al (1996) (18) for the US states in the years since the crisis It next compares the US with the euro area and draws conclusions for the possible degree of risk sharing in the euro area had the latter possessed the capital and labour market characteristics of the former The comparison also acknowledges that the US is a federal state with a
(18) Asdrubali F B Sorensen and O Yosha (1996) lsquoChannels of
interstate risk sharing United States 1963-1990rsquo The Quarterly Journal of Economics November
sizeable budget while the EMU does not have common fiscal means to cope with asymmetric shocks
Cross-border risk sharing is measured using the system of national accounts The approach consists of sequential regressions of the balancing items in the primary and secondary distribution of income accounts and in the use of income account for the total economy (so including both the private and the public sector) in order to quantify the amount of co-movement of output income including after taxes and consumption after asymmetric shocks to output The method provides a breakdown of the relative size of the three different channels of cross-border risk sharing (net factor income fiscal transfers and credit markets) and the proportion of an asymmetric shock that remains unsmoothed
Graph I6 Channels of risk sharing 50 US States anchored-start regressions with rolling end dates (1)
(1990-2013 in of total asymmetric shock to output)
(1) Regressions cover 1964 until the year shown on the horizontal axis Regressions with rolling start and end dates did not give qualitatively different results Source US Bureau of Economic Analysis (BEA) US Office of Management and Budget (OMB) US Bureau of Labour Statistics (BLS) US Census Bureau DG ECFIN calculations
435
440
445
450
455
460
465
470
475
1990 1993 1996 1999 2002 2005 2008 2011
smoothed by net factor income
76
77
78
79
80
81
82
83
84
85
1990 1993 1996 1999 2002 2005 2008 2011
smoothed by federal taxes grants and transfers
235
240
245
250
255
260
265
270
275
280
285
1990 1993 1996 1999 2002 2005 2008 2011
smoothed by savings
160
165
170
175
180
185
1990 1993 1996 1999 2002 2005 2008 2011
not smoothed
14 | Quarterly Report on the Euro Area
See Box I1 for a full description of the model and its estimation
The Asdrubali et al (1996) methodology is applied to the 50 US states and to three sets of euro area Member States the euro area (EA) 19 except Malta Cyprus Luxembourg Lithuania Austria and Greece EA 12 except Luxembourg Austria and Greece and a set of euro area core and periphery countries (Germany Spain Ireland Netherlands and Portugal) The choice of euro area countries is partly based on data availability in the European System of Accounts 2010 and partly on the option to have a sample that excludes new Member States In this way it is possible to measure legacy effects from the closer integration even before the EMU and have a sample of countries in the EA12 core and periphery which are likely to experience more asymmetries
The time period chosen for the US is between 1964 and a rolling end date from 1990 until 2013 For the three different sets of euro area countries the time period is between 1999 and 2015 The time periods are chosen based on data availability while for the US it extends the period in Asdrubali et al (1996) The difference in the two time samples does not impair comparison between the two economies because risk sharing estimates for
an economy vary little depending on the period chosen (19) The main differences between two economies are driven by the legal institutional and economic structures that underpin risk sharing not by the different time samples
The most important result of the econometric exercise is that risk sharing among Member States is lower than across federal states in the US (20) The overall proportion of an asymmetric shock that is not smoothed in the euro area is more than four times larger than in the US (Table I1 last row) Naturally the gap comes from the different
(19) This is best illustrated when comparing estimates in the original
Asdrubali et al (1996) paper and its extension here See the small scale of the vertical axis in Graph II4 Note also that the econometric approaches in Asdrubali et al (1996) and the extension here are different 2-step generalised least squares vs panel-corrected ordinary least squares See Box II1 for more information
(20) The lower degree of risk sharing after asymmetric shocks in the euro area compared with the US was reported already after the first couple of years of the EMU For an overview see for example Demyanyk Y C Ostergaard and B Sorensen (2008) lsquoRisk sharing and portfolio allocation in EMUrsquo European Economy Economic Papers 334 and Sorensen B and O Yosha (1998) lsquoInternational risk sharing and European monetary unificationrsquo Journal of International Economics Vol 45 pp 211-238 On the other hand Furceri D and A Zdzienicka (2013) lsquoThe euro area crisis need for a supranational fiscal risk sharing mechanismrsquo IMF WP13198 point out that the crisis has hampered the ability of the euro area countries to share risk
Table I1 Cross-border risk sharing through different channels(1)(2) in of total asymmetric shock to output
(1) Time period for the euro area is between 2000q4 and 2015q4 while for the US it is between 1964 and 2013 To increase the number of observations risk sharing in the euro area is measured at a quarterly frequency (difference compared with the same quarter in the preceding year) However regressions with annual frequency did not produce qualitatively different results (2) Cross-border factor income includes property income such as income from cross-border ownership of equity rent income and cross-border labour compensation Source DG ECFIN calculations Asdrubali et al (1996)
Euro area
Euro area without the
New Member States
Core vs periphery US
Risk sharing throughall EA MS except CY MT LU LT
AT GR
EA12 except LU AT and
GR
DE ES IE NL and PT 50 states
00
56 20 34 448
02 -02 -01
757 617 631 176
cross-border factor income(2)
of which cross-border labour compensation
cross-border fiscal transfers
credit markets
unsmoothed
16 26 83
182 246 180 267
I Cross-border risk sharing after asymmetric shocks evidence from the euro area and the United States
Volume 15 No 2 | 15
political and institutional setups for sharing risks in the US and the euro area as well as the relatively big role of capital and labour markets for risk sharing in the US
Graph I6 shows the estimates of the amount of risk sharing through the different channels between the 50 US states following an asymmetric shock to output The lines report the evolution of the regression estimates depending on the end date of the time series starting with an end date in 1990 The goal is to evaluate how the different channels evolved since 1990 Table I1 compares the three euro area samples with the US
Cross-state risk sharing through net factor income remains the largest contributor to consumption smoothing following an asymmetric shock in the US This channel includes risk sharing through cross-state property income such as retained earnings and income streams from cross-state ownership of shares as well as smoothing through labour earnings by commuters across state borders It is natural that these income streams are hampered during recessions Graph II4 shows two steep drops in its relative weight which broadly correspond to the recessions in 2001 and 2008-9 (21)
The estimates in Table I1 show that there is a big difference between the role of cross-border net factor income among the euro area Member States and the US states This comes as a result of the higher degree of labour mobility and deeper and more integrated capital markets in the US Higher risk sharing through this channel is to be expected given the high annual interstate mobility and the high number of commuter workers across state border in the US (22) Better capital market development in the US is also well documented see Valiante (2016) (23) for evidence that Europersquos capital markets are poorly functioning and underdeveloped compared to the US
The relative share of fiscal redistribution across state borders in the US is lower than the shares of the private channels For the full time series
(21) Even though visually pronounced these drops are small in
absolute terms Note the scale of the vertical axes on Graph II4 again supporting the conclusion that the choice of a time period has a minor impact on the absolute value of the risk sharing coefficients while keeping their relative proportion constant
(22) See Bonin et al (2008) op cit (23) Valiante D (2016) lsquoEuropersquos untapped capital market rethinking
integration after the great financial crisisrsquo CEPS Paperback
between 1964 and 2013 the relative weight of fiscal support in risk sharing is around 85 Risk sharing through this channel has been at its highest level since the start of the crisis as the federal government provided support to struggling states
The role of cross-border public risk sharing in the euro area is smaller than in the US although the difference is less striking than for the cross-border private channels The largest role for the public channel comes up when the sample of euro area countries includes only those that benefited from official support during the crisis years This should come as no surprise given that the euro area does not have a common fiscal capacity to absorb shocks
The importance of credit markets for cross-border risk sharing is more similar in the euro area and the US than the other channels This includes borrowing by both the private and the public sector The role of public sector borrowing in risk sharing is likely smaller than the one of the private sector while stabilisation through purely domestic means is not considered here (24) The role of euro area credit markets in smoothing an asymmetric output shock is more similar to the one in the US in the pre-2004 euro area sample than in the other two euro area samples This reflects a very high degree of financial deepening in the old Member States compared to those that joined recently While encouraging at face value this result also needs to take into account that pre-crisis cross-border financial flows in some of the old Member States turned out to be unsustainable as a result of insufficient risk management and supervision
The overall proportion of an asymmetric shock that is not smoothed between the 50 US states is around 18 compared to more than 60 among the euro area Member States Given that the US is a federal country with a long history of fiscal redistribution and that it has well-developed capital markets with a large presence across state borders it is to be expected that the euro area could achieve a higher degree of cross-border risk sharing once
(24) Some authors have separated this channel into saving and
borrowing on the credit markets by private entities (households and non-financial corporations) and public entities (national and local governments) See for example Furceri and Zdzienicka (2013) they find that the role of public access to credit markets for cross-border risk sharing in the euro area is several times lower than the role of private savingborrowing That is to be expected given the provisions of the Stability and Growth Pact and the relative sizes of the private and public sectors
16 | Quarterly Report on the Euro Area
changes to its institutional setup towards more integration come into being (25) However shock absorption through fiscal redistribution in a fully-fledged fiscal union such as the US is not more than around 85 of the asymmetric shock (as measured by the rolling end date regressions) even though it has increased since the crisis
Therefore a much bigger part of cross-border risk sharing in the EMU could potentially come through private channels such as integrated capital markets once the Capital Markets Union is in place
I5 Conclusion
The econometric results presented in this section point to the great potential for improvement in smoothing asymmetric shocks in the euro area When comparing the amount of an asymmetric shock that remains unsmoothed by the private and public channels of cross-border risk sharing in the euro area and the US the importance of the recent initiatives to build a Capital Markets Union stand out The significance of factor income flows which include labour compensation and capital income generated across state borders in the US could serve as a model for a euro area where capital markets play an important role in cushioning asymmetric shocks across borders Also the creation of the Single Supervisory Mechanism and other innovations in the regulatory environment in
(25) The level of integration will probably not be of the same
magnitude since it is unlikely that the union between euro area member states will soon be politically and institutionally the same as the one between the 50 US states
the euro area are likely to make risk sharing through credit markets more sustainable going forward
Completion of the European Banking Union by establishing a European Deposit Insurance Scheme (EDIS) will also facilitate risk sharing among Member States The EDIS is expected to increase the cross-border presence of euro area banks by ensuring consistent regulatory treatment regardless of country of operation and will offer protection against country-specific shocks Completing the Banking Union will create conditions for more financial integration which is expected to increase competition among banks and thus lower intermediation costs and further increase cross-border risk sharing
The importance of the public channel of cross-border risk sharing in the euro area on the other hand should be seen in contrast with its role in the US a fully-fledged fiscal union where fiscal redistribution among states has an important role Even though the relative significance of this channel in the US has increased with the crisis taxes grants and fiscal transfers in the 50 states contribute relatively less to smoothing asymmetric shocks than the private channels Therefore policy efforts to achieve a higher degree of private cross-border risk sharing in the euro area especially through capital markets and equity holdings should remain the priority option
I Cross-border risk sharing after asymmetric shocks evidence from the euro area and the United States
Volume 15 No 2 | 17
(Continued on the next page)
Box I1 Empirical methods to estimate relative weights of cross-border risk sharing channels
This box presents the econometric methodology used to estimate the relative importance of the different cross-border risk sharing channels after an asymmetric shock in the euro area and the US
It is important to look at the balancing items in the primary and secondary distribution of income accounts and the use of income account in the European System of National Accounts 2010 (ESA 2010) in order to review the necessary variables for the estimation process Data for Belgium for 2014 can be used as an illustration to arrive at the required several balancing items (1) One channel of risk sharing is the difference between gross domestic product (GDP) and gross national income (GNI) ndash risk sharing through net international factor income The bigger this difference and the lower its correlation over time with GDP the more risk sharing there is through net international factor income In order to come up with this difference mdash EUR 6038 billion in this example mdash one has to add the net of several items For example there is a difference of EUR 5715 billion between compensation of employees paid by employers in Belgium including to workers who take their earnings abroad where they are domiciled and compensation of employees received by workers in Belgium including by workers who work in other countries but bring their earnings back to Belgium where they are domiciled This is a net positive inflow of income from a Belgian perspective Other items that are treated in the same way are production taxes paid (collected) by firms (governments) and subsidies on production earned (distributed) by firms (governments) Any cross-border net inflow here will be due to fewer of these taxes paid by Belgian firms abroad compared to foreign firms in Belgium and more of these subsidies earned by Belgian firms abroad compared to foreign firms in Belgium Finally property income which includes interest for example on debt securities equity dividends reinvested earnings and some other items is treated in the same way For example a net inflow occurs if Belgian citizens receive more dividends from foreign companies than foreigners from Belgian companies
Another channel of risk sharing is through cross-border fiscal redistribution This makes the difference between GNI and gross disposable income (GDI) Here a net inflow in Belgium will occur if social transfers received by Belgian persons and entities from foreign sources outweigh the transfers received by foreigners in Belgium The same will happen if income and wealth taxes paid by foreigners in Belgium are higher than income and wealth taxes paid by Belgians abroad
Finally the difference between GDI and consumption is gross savings through which consumption can be smoothed Borrowings and savings are channelled through domestic and foreign financial intermediaries
At the state level in the US some of these balancing items are not available Specifically state national income and state disposable income are constructed using the method in the Appendix in Asdrubali et al (1996) (2)
Asdrubali et al (1996) propose a series of regressions of these balancing items to estimate the relative
importance of each of the risk sharing channels Starting from the identity = ∙ ∙ ∙ it is
easy to show that a relationship 1 = + + + exists where the beta terms are the estimates of the regression coefficients in ∆ minus ∆ = + ∙ ∆ + ∆ minus ∆ = + ∙ ∆ + ∆ minus ∆ = + ∙ ∆ + ∆ = + ∙ ∆ + The beta terms are interpreted as the relative weights of cross-border risk sharing due to net factor income fiscal transfers savings and borrowings on credit markets The last beta coefficient shows the amount of an asymmetric shock that remains unsmoothed The panel regressions include time fixed effects μ and error terms u
18 | Quarterly Report on the Euro Area
Box (continued)
There are three sets of panels for the euro area EA19 except Malta Cyprus Luxembourg Lithuania Austria and Greece EA12 except Luxembourg Austria and Greece and a set of euro area core and periphery countries (Germany Spain Ireland Netherlands and Portugal) The choice of euro area countries is partly based on data availability in the European System of Accounts 2010 and partly on the option to have a sample that excludes new Member States to be able to measure legacy effects from the closer integration even before the EMU and to have a sample of countries in the EA12 core and periphery which are likely to experience more asymmetries The US sample includes the 50 US states
The time period chosen for the US is between 1964 and a rolling end date from 1990 until 2013 For the three different sets of euro area countries the time period is between 1999 and 2015 The time periods are chosen based on data availability while for the US it extends the period in Asdrubali et al (1996)
The regressions are estimated with 2-step generalised least squares (GLS) correcting for heteroscedasticity and cross-sectional correlation in the case of the euro area and ordinary least squares (OLS) with panel-corrected standard errors in the case of the US The latter method is better suited for panels with larger cross-sections while the former method is better in the opposite case (3) Both estimations include a common AR1 autocorrelation structure within panels The first differences in the quarterly euro area data are in terms of the same quarter of the preceding year The euro area regressions also include a further breakdown of GNI into one corrected only for cross-border labour compensation and one for the other elements of net factor income
Econometric results are in the table below All estimates marked with are statistically significant at the 99 confidence level Z-statistics are in parentheses
Table 1 Regression results
Source US Bureau of Economic Analysis (BEA) US Office of Management and Budget (OMB) US Bureau of Labour Statistics (BLS) US Census Bureau Eurostat DG ECFIN calculations (1) For more information see Box 2 in lsquoCross-border risk sharing has it increased in the euro arearsquo in QREA Vol 6 No3 (2007) (2) Asdrubali F B Sorensen and O Yosha (1996) lsquoChannels of interstate risk sharing United States 1963-1990rsquo The Quarterly Journal
of Economics November (3) These are standard econometric approaches in estimating cross-border risk sharing For a short discussion on the econometrics of
cross-border risk sharing see Hepp R and J von Hagen (2013) lsquoInterstate risk sharing in Germany 1970mdash2006rsquo Oxford Economic Papers Vol 65 No1 pps 1-24
(1) (2) (3) (4)Risk sharing through 2-step GLS 2-step GLS 2-step GLS PC-OLScross-border factor income 00552 00199 00343 04476
(722) (316) (568) (1198)of which cross-border labour compensation 00024 -00015 -00012
(281) (-414) (-282)cross-border fiscal transfers -00007 00156 00257 00832
(-039) (847) (761) (803)credit markets 01815 02459 01800 02668
(1738) (831) (478) (508)unsmoothed 07574 06171 06312 01760
(3784) (2505) (1838) (505)
Countries
Full panel - 13 countries BE
DE EE ES FI FR IE IT LV NL PT
SK SL
Old member states - 9
countries BE DE ES FI FR IE IT
NL PT
Core vs periphery - 5 countries DE ES IE NL PT
50 US states
Period 2000Q4-2015Q4 2000Q4-2015Q4 2000Q4-2015Q4 1964-2013No of observations 793 549 305 2500
II Financial channels and economic activity in the euro area
Volume 15 No 2 | 19
II1 Introduction
Since the global economic and financial crisis the linkages between macroeconomic and financial developments have been on the frontline of both research and policy making The massive dislocations observed during the crisis have forged a broad consensus that shocks originating in the financial sector can have profound effects on real economic activity and vice versa While the effect of macroeconomic developments on financial conditions is rather straightforward (27) the effect of financial developments on the macroeconomy is more complex and was (until recently) largely omitted in mainstream macroeconomic thinking The interest rate was the only financial variable included in standard macroeconomic models and only to the extent that it was assumed to influence the decisions of economic agents while no genuine role was assigned to the financial sector itself In reality financial intermediation is subject to numerous frictions that can affect macroeconomic developments via diverse transmission channels Given the decisive role of bank credit in financing the euro area economy shocks originating in the banking sector are of crucial importance
This section looks at macro-financial linkages in the euro area to shed light on how financial developments may have contributed to disappointing macroeconomic performance in the
(26) This section was prepared by Narcissa Balta and Bořek Vašiacuteček (27) Jacobson T J Linde and K Roszbach (2005) lsquoExploring
interactions between real activity and the financial stancersquo Journal of Financial Stability Vol 1 No 3 pp 308ndash41
recent past The methodology employed for this purpose is a large-scale Bayesian Vector Autoregression (VAR) that encompasses a wide set of macroeconomic and financial variables (28)
Subsection I2 discusses the importance of the financial system for the real economy and briefly reviews the relevant economic literature Subsection I3 describes the main transmission channels from financial markets to the real economy and defines specific variables that could be used to capture these transmission channels in the euro area Subsection I4 presents the results of the empirical analysis particularly some stylised facts on the co-movement between financial variables and economic activity since the crisis
II2 The financial system and the real economy
Market frictions are normally understood as a wide range of different bottlenecks that do not allow markets to efficiently clear demand and supply Financial frictions are impediments to the smooth functioning of the financial market that do not allow funds to be channelled effectively from creditors to borrowers Therefore they play an important role in the way the financial system affects the real economy Moreover the presence of frictions during periods of financial turmoil undermines the effectiveness of monetary policy
(28) Bańbura M D Giannone and M Lenza (2015) lsquoConditional
forecasts and scenario analysis with vector autoregressions for large cross-sectionsrsquo International Journal of Forecasting Vol 31 Issue 3 pp 739ndash756
This section discusses the nexus between financial and macroeconomic developments in the euro area It draws on key lessons from the literature and provides stylised facts on the main transmission channels through which financial developments have affected real economic activity since the crisis Macro-financial linkages are investigated from an empirical perspective for the euro area as a whole by looking at four key channels i) the interest rate channel ii) the borrower balance sheet channel iii) the bank balance sheet channel and iv) the uncertainty channel
Overall the results suggest that financial variables have significant impact on macroeconomic developments but also that the transmission seems to have changed since the crisis Notably the interest rate channel has helped the modest recovery since 2014 by supporting both private and public consumption The positive boost given to favourable financing conditions in 2015 has been somewhat compensating the adverse effects of the borrower balance sheet channel The bank balance sheet channel and the uncertainty channel play a particularly important role in capturing the weakness in the current rebound in investment (26)
20 | Quarterly Report on the Euro Area
transmission and financial sector stability which via feedback effects can have a detrimental impact on macroeconomic developments For instance hikes in bank funding costs when money markets stop functioning are likely to be transmitted to the lending rates applied to consumers which in turn can have a significant drag on both investment and consumption Also financial frictions increase the likelihood of financial shocks occurring both from the demand and the supply side
Financial shocks are usually deemed to be very persistent and have amplification effects in the sense that even small shocks can produce large and long-lasting effects (29) Graph II1 shows a clear negative correlation between GDP growth and financial distress in the euro area as measured by the Composite Indicator of Systemic Stress (CISS) (30)
Graph II1 Real GDP growth vs Composite indicators of systemic stress
(2000Q1-2016Q1)
Source ECB Eurostat
Since the key role of the financial sector consists in funding economic activity new credit is the main channel of transmission between the financial sector and the macroeconomy Financial shocks occurring on the demand side are usually triggered by an impairment of borrowers balance sheets
(29) Brunnermeier M K T Eisenbach and Y Sannikov (2012)
lsquoMacroeconomics with financial frictions A surveyrsquo National Bureau of Economic Research Working Paper No 18102
(30) The CISS measures contemporaneous stress in the financial system It is an aggregate of five market-specific sub-indices More weight is put when stress prevails in several market segments at the same time thus tracking financial stress of systemic nature
Holloacute D M Kremer and M Duca (2012) lsquoCISS-a composite indicator of systemic stress in the financial systemrsquo European Central Bank Working Paper No (No 1426)
which in turn undermines their creditworthiness and their capacity to invest and consume Financial shocks occurring on the supply side (ie those that originate from within the financial sector) normally manifest themselves through tightening of credit conditions andor credit rationing which again impact real economic activity via the investment behaviour of households and non-financial corporations Graph II2 shows the negative correlation between credit standards for firms and real investment (31)
Graph II2 Investment growth vs credit standards for NFC
(2003Q1-2016Q1)
Source ECB BLS Eurostat
Financial frictions have been fully embedded into macroeconomic models only recently
The neglect of financial sector effects in traditional macroeconomic thinking has its foundation in the famous Modigliani-Miller theorem (32) The theorem argues that the way a firm finances its investment (via debt or via equity) has no effect on its value and thus that their investment decisions are driven primarily by macroeconomic conditions (namely the real interest rate) rather than financial market developments However the validity of the theorem hinges on a set of very restrictive assumptions such as perfect information equal tax treatment for debt and equity etc which are generally not met in practice (33) Financial
(31) Credit standards are measured by the backward looking three
months index from ECB Bank Lending Survey (BLS) (32) Modiglini F and M Miller (1958) lsquoThe cost of capital
corporation finance and the theory of investmentrsquo The American Economic Review Vol 48 No 3 pp 261-297
(33) Morley J (2016) lsquoMacro-finance linkagesrsquo Journal of Economic Surveys forthcoming
-8
-6
-4
-2
0
2
4
6
0
10
20
30
40
50
60
70
80
2000Q1 2003Q1 2006Q1 2009Q1 2012Q1 2015Q1
CISS
GDP y-o-y change(rhs)
-15
-10
-5
0
5
10
-10
-5
0
5
10
15
20
25
30
35
40
2003Q1 2005Q1 2007Q1 2009Q1 2011Q1 2013Q1 2015Q1
Change in creditstandards for NFCInvestment y-o-y change (rhs)
II Financial channels and economic activity in the euro area
Volume 15 No 2 | 21
intermediation typically involves asymmetry of information between borrowers and lenders and potentially costly verification of the borrowers financial situation (34)
The first attempts to include financial frictions in macroeconomic models were based on the insight that the cost of external financing very much depends on the borrowers net worth (35) andor the market value of their collateral (36) In fact changes in asset prices turn out to be a crucial determinant of both the cost of external financing and the value of collateral Moreover a relatively small shock can have a major effect on economic activity through the so-called financial accelerator whereby negative feedback loops between lower assets prices restricted access to credit and lower consumption and investment significantly amplify and prolong the impact on the real economy (37) Real estate which is a typical asset used as collateral by both households and firms establishes a tight link between the housing market and the economy as a whole (38)
While the original theoretical contributions did not explicitly model financial intermediaries (assuming direct lending from investors to borrowers) the inclusion of financial intermediaries (ie the banking sector) implies that financial frictions can appear also on the lendersrsquo side (39) Specifically financial intermediaries can become balance sheet constrained in times of economic and financial stress which affects their funding costs Such shocks to the lendersrsquo side are usually mitigated by central bank intermediation during crisis times (40)
(34) Carlstrom C T and T S Fuerst (1997) lsquoAgency costs net worth
and business fluctuations A computable general equilibrium analysisrsquo The American Economic Review Vol 87 No 5 pp 893-910
(35) Bernanke B and M Gertler (1989) lsquoAgency costs net worth and business fluctuationsrsquo The American Economic Review Vol 79 No 1 pp 14-31
(36) Kiyotaki N and J Moore (1997) lsquoCredit cyclesrsquo Journal of Political Economy Vol 105 Issue 2 pp 211-248
(37) Bernanke B S M Gertler and S Gilchrist (1999) lsquoThe financial accelerator in a quantitative business cycle frameworkrsquo Handbook of Macroeconomics Vol 1 Part C pp 1341-1393
(38) Iacoviello M and S Neri (2010) lsquoHousing market spillovers evidence from an estimated DSGE modelrsquo American Economic Journal Macroeconomics Vol 2 No 2 pp 125-164
(39) Gertler M and N Kiyotaki (2010) lsquoFinancial intermediation and credit policy in business cycle analysisrsquo Handbook of Monetary Economics Vol 3 Issue 3 pp 547-599
(40) Gertler M and P Karadi (2011) lsquoA model of unconventional monetary policyrsquo Journal of Monetary Economics Vol 58 Issue 1 pp 17-34
Despite intensive efforts in recent years the financial sector is still not fully established as a consolidated part of conventional macroeconomic models Structural models augmented by a banking sector and financial markets (41) typically find that financial factors such as bank liquidity constraints are indeed the main drivers of economic fluctuations in both the US and the euro area and that they were the main shock propagator during the global financial crisis (42)
Empirical evidence on macro-financial linkages
There is now a wide consensus that financial cycles are crucial for understanding business cycle fluctuations (43) Numerous empirical studies evaluate the effects of financial shocks on macroeconomic fluctuations Importantly financial factors can both reinforce the transmission of other shocks and be a source of disturbance in their own right
Credit appears to be one of the most studied financial variables in empirical studies due to its established regularities in terms of boom-and-bust behaviour and its link to financial crises and economic downturns (44) Credit spreads play an important role for capital markets-based systems like the US economy For example corporate bond spreads usually increase disproportionately during periods of financial stress (so-called excess bond premiums) which in turn causes economic activity to contract (45) In the euro area where external financing is mostly bank based a crucial role is played by bank lending rates and bank lending volumes Credit supply shocks have been identified
(41) Christiano L J R Motto and M Rostagno (2010) lsquoFinancial
factors in economic fluctuationsrsquo European Central Bank Working Paper No 1192
(42) Gerke et al (2013) and Wieland et al (2015) provide detailed comparison exercise for different macrofinancial models
Gerke R M Jonsson M Kliem M Kolasa P Lafourcade A Locarno K Makarski and P McAdam (2013) lsquoAssessing macro-financial linkages A model comparison exercisersquo Economic Modelling Vol 31 pp 253-264
Wieland V E Afanasyeva M Kuete and J Yoo (2015) lsquoNew methods for macro-financial model comparison and policy analysisrsquo mimeo
(43) Borio C (2012) lsquoThe financial cycle and macroeconomics what have we learntrsquo Bank for International Settlements Working Papers No 395
(44) Balke N S (2000) lsquoCredit and economic activity credit regimes and nonlinear propagation of shocksrsquo Review of Economics and Statistics Vol 82 No 2 344-349
(45) Gilchrist S and E Zakrajšek (2012) lsquoCredit spreads and business cycle fluctuationsrsquo The American Economic Review Vol 102 No 4 pp 1692-1720
22 | Quarterly Report on the Euro Area
as important determinants of the increase in lending rates and the decline in lending volumes during the recent crisis (46) Bank lending represents the main transmission mechanism in the euro area
The evidence available indicates that the impact of financial shocks on the macroeconomy is lsquostate dependentrsquo ie the response of economic activity inflation and credit to financial shocks is stronger during periods of stress This is well documented for both the euro area and the US (47) Moreover during periods of high systemic stress financial shocks tend to have both a larger magnitude and a greater impact on real activity (48) Notably a single indicator of systemic stress such as the CISS for the euro area has been found to explain a significant part of macroeconomic developments especially due to episodes of elevated systemic stress such as the global financial crisis and the euro area debt crisis (49)
While studies on financial and business cycle have been popular for some time there has been much less investigation into macro-financial linkages between countries Existing evidence indicates that such linkages exist but their intensity varies both across time and across countries Specifically it has been documented that the observed heterogeneity is mainly due to country-specific characteristics which lead to international spillovers having a differentiated impact across countries (50) Such heterogeneity seems also to be present within the euro area
(46) Moccero D N M D Pariegraves and L Maurin (2014) lsquoFinancial
Conditions Index and identification of Credit Supply Shocks for the Euro Arearsquo International Finance Vol 17 Issue 3 pp 297-321
(47) Hubrich K and R J Tetlow (2015) lsquoFinancial stress and economic dynamics the transmission of crisesrsquo Journal of Monetary Economics Vol 70 pp 100-115
Prieto E S Eickmeier and M Marcellino (2016) lsquoTime variation in macro‐financial linkagesrsquo Journal of Applied Econometrics forthcoming
Silvestrini A and A Zaghini (2015) lsquoFinancial shocks and the real economy in a nonlinear world a survey of the theoretical and empirical literaturersquo Journal of Policy Modeling Vol 37 pp 915ndash929
(48) Hartmann P K Hubrich M Kremer and R J Tetlow (2015) lsquoMelting down Systemic financial instability and the macroeconomyrsquo mimeo
(49) Kremer M (2015) lsquoMacroeconomic effects of financial stress and the role of monetary policy a VAR analysis for the euro arearsquo International Economics and Economic Policy Vol 13 Issue 1 pp 1-34
(50) Ciccarelli M E Ortega and M T Valderrama (2016) lsquoCommonalities and cross-country spillovers in macroeconomic-financial linkagesrsquo The BE Journal of Macroeconomics Vol 16 Issue 1 pp 231-275
II3 Transmission channels from financial to macro developments
In spite of the broad consensus about the existence of macro-financial linkages the identification of the transmission channels is still a subject of debate There are different ways to classify the channels through which the financial sector might affect macroeconomic developments The important distinction applied in this section is whether the linkages are related to the balance sheets of borrowers or lenders At the same time the financial channels are also closely related to monetary transmission which affects their functioning (51) This subsection aims to better define the individual transmission channels in the euro area
The interest rate channel illustrates how money market rates affect the overall financing costs of the banking sector the price of credit and consequently consumption and investment decisions This channel is closely related to monetary policy decisions as they directly affect the funding costs of banks Moreover at the zero lower bound when the central bank uses other instruments besides short-term interest rates to conduct monetary policy this channel is more complex and difficult to assess
Thus in the analysis below the interest rate channel will be captured by variables that are affected by monetary policy decisions (Graph II3) In the euro area the most frequently used indicator directly affected by the ECBrsquos policy rates is the short-term interbank interest rate (EONIA) While the effect of monetary policy actions on short-term rates is rather quick there is also a delayed effect on long-term interest rates The long-term rates are of specific relevance in the current time as short-term rates are at the zero lower bound and monetary policy aims to affect long rates directly While long-term rates are commonly defined by the yield on respective sovereign bonds in the euro area this applies to a pool of euro area sovereigns As the yields diverge across sovereigns since the global financial crisis long-term rates in the euro area have become disconnected from short-term rates Since the ECB has employed diverse unconventional measures that affect the
(51) See for instance Basel Committee on Banking Supervision (2011)
lsquoThe transmission channels between the financial and real sectors a critical survey of the literaturersquo BCBS Working Paper No 18
II Financial channels and economic activity in the euro area
Volume 15 No 2 | 23
financial system additional measures need to be used to track their effect namely the shadow rate which is a factor model-based estimate of the short-term interest rate unconstrained by the ZLB (52) Likewise the excess liquidity defined as the liquidity held by the euro area banking sector in excess of the aggregate needs arising from minimum reserve requirements and autonomous factors is another quantitative-based indicator of the monetary policy stance as it is driven by the ECBrsquos refinancing operations
Graph II3 shows the dynamics of the variables described above in the period Q1-1996 - Q1-2016 which suggest that monetary conditions have been very supportive in recent years While short-term interest rates attained the ZLB monetary easing through unconventional measures is reflected in a significant decline in the shadow rate as well as long-term rates
Graph II3 Interest rate channel (2000Q1-2016Q1 )
Source Eurostat Bloomberg Reserve Bank of New Zealand
The borrower balance sheet channel reflects the fact that it is the net worth of borrowers that determines the external finance premium ie the opportunity cost of borrowing over using internal savings In other words it is the value of borrowersrsquo collateral that affects their credit conditions As indicated above fluctuations in
(52) There different shadow rates available all being subject of
significant model uncertainty The shadow rate used is based on Krippner (2012) and available from the Reserve Bank of New Zealand website
Krippner L (2012) lsquoMeasuring the stance of monetary policy in zero lower bound environmentsrsquo Economics Letters Vol 118 Issue 1 pp 135ndash138
asset prices can affect the ability of non-financial corporations and households to borrow and thus their investment and spending decisions While monetary policy commonly does not target asset prices its actions can affect the valuation of assets used as collateral which affects the credit available for investment and consumption spending (53) Whereas the previous discussion focuses on the demand side of credit the borrower balance sheet channel affects also the supply of credit Namely weak borrower balance sheets might induce credit rationing by the lenders and affect overall credit conditions
The borrower balance sheet channel can be captured mainly by variables that reflect the risks related to the balance sheets of firms and households as borrowers from the banking sector or from capital markets While there are no readily available direct measures of the quality of private balance sheets comparable across countries asset prices can be considered as indicative of their quality as they give the value of collateral for loans and of equity Therefore house prices and stock prices are generally used in the analysis to track this channel
Graph II4 Borrower balance sheet channel
(2000Q1-2016Q1)
Source Bloomberg BIS
Graph II4 suggests that developments in house prices and stock prices have been quite
(53) There is empirical evidence especially for the US stressing the
importance of asset prices and different credit spreads as leading indicator of economic activity eg Stock and Watson (2003) Stock J H and M W Watson (2003) lsquoForecasting output and inflation the role of asset pricesrsquo Journal of Economic Literature Vol 41 No 3 pp 788-829
-10
-5
0
5
10
15
20
25
2000Q1 2004Q1 2008Q1 2012Q1 2016Q1
Short-term interest rateLong-term interest rateShadow rate (Krippner)ECB Excess Liquidity Index
-6
-4
-2
0
2
4
6
8
10
-60
-40
-20
0
20
40
60
2000Q1 2002Q3 2005Q1 2007Q3 2010Q1 2012Q3 2015Q1
MSCI EURO Index y-o-y change
Housing prices y-o-y change
24 | Quarterly Report on the Euro Area
disconnected in recent years Specifically while house prices only started to recover in 2014 stock prices peaked in early 2015 and experienced a downward correction since then
The bank balance sheet channel relates to the fact that how much a bank lends depends on its own balance sheet and the different risks involved in its business model External developments (including monetary policy actions but also longer-term factors such as financial regulation and innovations in the banking sector) may affect bank liabilities (the supply of loanable funds and also bank funding costs) and in turn assets (supply of credit and the lending cost) (54) Bank lending is determined by banksrsquo business models it usually increases with the increase in leverage in the economy while deleveraging episodes may significantly hamper lending activities This makes leverage highly pro-cyclical (55) Importantly the impact of bank balance sheets on the real economy can be more pronounced in the euro area than in capital-market based systems as alternative forms of financing are relatively undeveloped
The bank balance sheet channel can thus be illustrated by variables such as banking leverage the stock of non-performing loans banksrsquo funding costs or the price of Credit Default Swaps (CDS) However reliable data for the euro area are relatively short available only for the period since the beginning of the crisis Indeed the lack of knowledge about the quality of bank balance sheets was an important aspect of the euro area financial crisis and a reason for the implementation of the Asset Quality Review (AQR) by the ECB in 2014 Therefore for the analysis in this section measures which directly track the supply of credit have been used instead (56) Namely the flow of credit as measured by the credit impulse (ie the change in new credit granted by the banking sector as a percentage of GDP) the stock of credit on banksrsquo balance sheet as measured by total economy credit as a percentage of GDP and the price of credit as measured by the Composite Financing Conditions Indicator (CFCI) for non-financial corporations
(54) Bernanke B and A Blinder (1988) lsquoCredit money and aggregate
demandrsquo the American Economic Review Vol78 No 2 pp 435ndash439 (55) Adrian T and H S Shin (2010) lsquoLiquidity and leveragersquo Journal of
Financial Intermediation Vol 19 Issue 3 pp 418-437 (56) In practice the lending volumes and rates can be affected both by
supply and demand side
which (assuming a constant mark-up) proxies bank funding costs (57)
Graph II5 shows that there is a negative correlation between the credit impulse and credit as a percentage of GDP Thus during downturns the flow of new credit declines while the ratio of credit to GDP increases due to the collapse of GDP The credit impulse indicator shows that the supply of new credit has been fairly limited since the onset of the global financial crisis The CFCI tracks the ECB policy rates rather closely with the exception of the euro area sovereign debt crisis episode (2011-2012) when financing costs increased due to idiosyncratic increases in some Member States reflecting financial market fragmentation
Graph II5 Bank balance sheet channel (2000Q1-2016Q1)
Source Capital Economics BIS DG ECFIN
While the previous channels are related to the quality of balance sheets either on the borrower or the lender side some shocks can originate in the overall financial system Examples are liquidity shocks or confidence shocks These shocks work both via the balance sheets but also by directly altering agents decisions through precautionary motives affecting both investment and consumption behaviour These mechanisms are defined as the uncertainty channel (58)
(57) For more details on CFCI calculations see European Commission
(2013) Drivers of diverging financing conditions across Member States Quarterly Report on the Euro Area Vol12 No1
(58) Bloom (2009) point to uncertainty shocks (that might be related but also unrelated to the financial system) as a crucial driver of economic dynamics Recently Caldara et al (2016) argue for the needs to distinguish uncertainty shocks from financial shocks while both of them are important source of macroeconomic
-8
-6
-4
-2
0
2
4
6
8
10
2000Q1 2003Q1 2006Q1 2009Q1 2012Q1 2015Q1
Total credit on GDP y-o-y change
Credit impulse (new crediton GDP y-o-y change)
Composite financingconditions indicator
II Financial channels and economic activity in the euro area
Volume 15 No 2 | 25
The uncertainty channel is captured by variables reflecting the different types of uncertainty that can affect the economy One type is commonly related to increased volatility in financial markets Given a high degree of global interconnectedness the euro area economy can be affected by uncertainty related to global financial developments which is usually measured by the implied volatility of SampP 500 index options (VIX) (59) The euro area specific stress in the financial system is measured through the ECBrsquos Composite Indicator of Systemic Stress (CISS)
Another type of uncertainty is linked to swings in business and consumer confidence Variations in the confidence of euro area households and non-financial firms are illustrated through the European Commissionrsquo confidence indicator the Economic Sentiment Indicator (ESI) which is based on data collected through business and consumer surveys However the indicator exhibits a very high contemporaneous correlation with actual GDP growth indicating that its dynamics are likely to reflect very accurately economic conditions rather than information related to exogenous changes in confidence
Finally unexpected outcomes of economic policy decisions can lead to policy uncertainty which in turn can have adverse effects on the savings and investment behaviour of firms and households Policy uncertainty is illustrated through an indicator based on newspaper coverage of uncertainty-generating events (60)
Graph II6 indicates that there is an apparent co-movement among these indicators even if they measure different types of uncertainty While economic sentiment has been gradually improving and uncertainty related to financial markets has eased the policy uncertainty affecting the euro area is still relatively high
fluctuations separately the Great Recession was likely outcome of the toxic interaction between the two
Bloom N (2009) lsquoThe impact of uncertainty shocksrsquo Econometrica Vol 77 Issue 3 pp 623-685
Caldara D C Fuentes-Albero S Gilchrist and E Zakrajšek (2014) lsquoThe macroeconomic impact of financial and uncertainty shocksrsquo European Economic Review forthcoming
(59) The VIX is calculated by the Chicago Board Options Exchange (CBOE)
(60) Baker S R N Bloom and S J Davis (2015) lsquoMeasuring economic policy uncertaintyrsquo National Bureau of Economic Research Working Paper No 21633 Data source wwwpolicyuncertaintycom
Graph II6 Uncertainty channel (2000Q1-2016Q1)
Source Chicago Board of Exchange ECB wwwpolicyuncertaintyorg
II4 Financial developments and economic activity
This sub-section provides stylised facts on the transmission channels defined above and show whether and how financial developments have affected the real side of the euro area economy since the crisis (namely consumption investment unemployment and long-term interest rates)
While financial variables are available in real time macroeconomic variables are normally released with lags Therefore conditioning macroeconomic forecasts on observed financial developments (ie a projection of macro variables on the observed paths of financial variables) can improve forecasts as more informative data are taken into account Several empirical studies have shown that financial variables can improve macroeconomic forecasts (61)
The methodology underlying this this section is a large-scale Bayesian VAR with 35 macroeconomic
(61) Stock and Watson (2003) provide a seminar contribution on the
role of financial variables namely asset prices for GDP and inflation forecast concluding that different financial variables allow macroeconomic forecasting in different times Espinosa et al (2012) document using standard VAR approach that financial variables improve GDP forecast for the euro area especially in the real time when numerous financial variables are available ahead of the macroeconomic releases
Stock J H and M W Watson (2003) lsquoForecasting output and inflation the role of asset pricesrsquo Journal of Economic Literature Vol 41 No 3 pp 788-829
Espinoza R F Fornari and M J Lombardi (2012) lsquoThe role of financial variables in predicting economic activityrsquo Journal of Forecasting Vol 31 No 1 pp 15-46
0
50
100
150
200
250
300
0
10
20
30
40
50
60
70
80
2000Q1 2002Q3 2005Q1 2007Q3 2010Q1 2012Q3 2015Q1
VIX
CISS
ESI (rhs)
Policy uncertainty (rhs)
26 | Quarterly Report on the Euro Area
and financial variables (62) The model is estimated for the sub-period Q1-2000 - Q4-2011 which covers both normal and crisis times but does not include some of the most important unconventional monetary policy measures Given the estimated past correlations a counterfactual path for the macroeconomic and financial variables (ie a distribution of conditional forecasts) can be obtained for the entire period Q1-2000 - Q4-2015 conditional on observed real GDP and inflation in the baseline case The deviations of the observed developments of financial variables from this counterfactual path can be interpreted as evidence of instability in the relationship between financial variables and economic activity (as measured by GDP growth and inflation) since the crisis
Subsequently the conditional set from the baseline case (including only real GDP and inflation) is extended by financial and uncertainty variables corresponding to each transmission channel described above (63)
Some recent developments are puzzling
Graph II7 shows the counterfactual paths of the main GDP components producer prices the unemployment rate and the long-term interest rate conditional on observed economic activity (real GDP and inflation) It also shows the conditional forecasts for the balance sheet variables of households and firms when only real GDP and inflation are taken into account in the conditioning set
(62) Alternative strand of literature using rich set of data in order to
nowcast or forecast employs dynamic factors models where data dimension is reduced in a first step by factor estimation with common factors being consequently used in the forecasting exercize see eg Giannone et al (2008) Bellego and Ferrara (2012) find using factor-augmented probit model that financial variables allow tracking better recession periods in the euro area (in the pre-crisis period) with optimal lead of financial variables over recession of around one year
Giannone D L Reichlin L and D Small (2008) lsquoNowcasting the real-time informational content of macroeconomic datarsquo Journal of Monetary Economics Vol 55 Issue 4 pp 665ndash676
Belleacutego C and L Ferrara (2012) lsquoMacro-financial linkages and business cycles A factor-augmented probit approachrsquo Economic Modelling Vol 29 pp 1793-1797
(63) For more details on the methodology see Box IV1 in European Commission (2015) lsquoInvestment dynamics in the euro area since the crisisrsquo Quarterly Report on the Euro Area Vol 14 No 1 pp 35-43
Bańbura M D Giannone and M Lenza (2015) lsquoConditional forecasts and scenario analysis with vector autoregressions for large cross-sectionsrsquo International Journal of Forecasting Vol 31 Issue 3 pp 739ndash756
The results suggest that private consumption was unusually low during the period of the euro area debt crisis and deleveraging (2012-2013) while it overshot during the recent recovery (from 2014 onward) Investment behaved in line with historical correlations during both downturn episodes (2008-2009 and 2012-2013) and was weak during the deleveraging phase because overall output growth was weak However its recent recovery (since 2014) has been more subdued than what the pace of economic activity would have predicted the observed investment path is positioned on the lower tail of the distribution of conditional forecasts) (64)
Large deleveraging pressures in the public sector have led to a significant decline in the euro area aggregate government consumption over the period 2011-2012 However this decline had almost been reversed by the end of 2014 with public consumption starting to overshoot from 2015 onwards (relative to its counterfactual path obtained through conditioning on output growth) reflecting the aggregate euro area fiscal stance which started to turn mildly expansionary
Moreover the results show that several variables capturing price and balance sheet developments are still at odds with historical patterns In particular producer prices house prices long-term interest rates and loans to firms and households undershoot the distribution of the conditional forecasts On one side this underlines that the recent recovery is characterized by a historically low inflation environment and loose monetary conditions pushing the long-term rates down On the other side the ongoing balance sheet adjustment is translating into very weak credit dynamics due to unprecedented deleveraging pressures
Graph II8 illustrates the zero lower bound constraint on monetary policy rates and the subsequent break in the correlation of economic activity with the two measures of monetary policy
(64) There is some relative instability in the estimated correlations over
the sample period notably pre-crisis vs crisis years However it does not significantly affect the result on the unusual weakness in investment recovery since 2014 The article lsquoInvestment dynamics in the euro area since the crisisrsquo Quarterly Report on the Euro Area Vol 14 No 1 pp 35-43 found that estimating the past correlations only with the sample for the pre-crisis period the amplitude of the investment fall during the first downturn (2008-2009) would also be slightly underestimated by the conditional forecasts
II Financial channels and economic activity in the euro area
Volume 15 No 2 | 27
rates since 2012 Among all variables the consumer and business confidence indicator (ESI) comes out as having the strongest contemporaneous correlation with economic activity during the crisis
In the consecutive analysis the conditioning dataset (including only real GDP and inflation in the baseline) is augmented by financial variables corresponding to each transmission channel
hellip different channels play an important role at different stages since the crisis
The interest rate channel (Graph II9 upper panel) seems to better account for the pattern of consumption during the recent recovery (compared to the baseline) This channel which reflects mainly monetary conditions suggests that monetary easing implemented since 2014 by means of additional unconventional measures (namely the targeted long-term refinancing operations (TLTRO) the asset-backed securities purchasing program (ABSPP) and the forthcoming public
securities purchase program (PSPP)) have translated into a further decline in the long-term interest rate and the shadow policy rate It also reflects an increase in excess liquidity which has had a very benign effect on the recent recovery However producer prices developments (PPI) still appear unusually subdued Likewise including information capturing the interest rate channel does not help explain the dismal performance of consumption during the deleveraging phase (2012-2013) or the persistent weakness of credit dynamics Therefore these developments seem to be determined also by drivers other than monetary conditions
The borrowers balance sheet channel (Graph II9 lower panel) captures in turn the exceptional deleveraging developments of 20122013 but clearly underestimates the pace of the recent recovery This finding suggests that strained balance sheets of households and firms represented the main weight on the recovery at the time of euro area sovereign debt crisis However whereas a mild recovery started in the euro area in 2014 private
Graph II7 Conditional forecasts based on real GDP and inflation (1) (2000Q1-2015Q4 y-o-y growth)
Misalignments of financial and real variables with output growth since the crisis
(1) Shades of orange distribution of the conditional forecasts in the BVAR in levels excluding the lower and higher 5 quantiles Green line actual values The variables are all reported in terms of annual percentage changes except for the unemployment rate and the long-term interest rate which are in levels Conditioning assumptions real GDP and HICP Source DG ECFIN MATLAB codes replication files of the methodological paper (Banbura et al 2015)
Government consumption
2005 2010 2015-2
0
2
4Real consumption
2005 2010 2015-5
0
5Real investment
2005 2010 2015-20
-10
0
10
Unemployment rate
2005 2010 20150
5
10
15PPI ex const
2005 2010 2015-50
0
50House prices
2005 2010 2015-10
0
10
Long-term i r
2005 2010 20150
5
10Loans to firms
2005 2010 2015-10
0
10
20Loans to households
2005 2010 2015-5
0
5
10
28 | Quarterly Report on the Euro Area
balance sheets still did not improve much In fact when the borrower balance sheet channel is taken into account observed consumption overshoots the conditional forecast even by a higher margin than in the baseline scenario and real investment seems to be on the upper side as well This suggests that the borrower balance sheet channel should have led to more subdued dynamics of both consumption and investment than what has been observed in 2014 and 2015 indicating that other channels have been somewhat compensating the adverse effects of this channel
The bank balance sheet channel (Graph II10 upper panel) improves the forecast of investment since 2014 and reduces the uncertainty around the median for some variables such as consumption unemployment and long-term interest rate The good fit of investment dynamics indicates a strong correlation of investment with total economy credit developments both in terms of flows and stocks
Interestingly the bank balance sheet information namely the total economy credit as percentage of GDP (including credit to public sector) the private sector credit impulse and the price of credit for the private sector cannot capture the weak observed dynamics of outstanding loans to firms and households This shows that the private deleveraging process has been much stronger than the public sector deleveraging making private credit developments disconnected from GDP
growth (65) Therefore while the recovery in real activity has been rather weak the private credit dynamics have been even weaker Furthermore the modest recovery does not facilitate passive deleveraging (a decrease in the relative debt burden due to a growing economy ie denominator effect) and feeds the active deleveraging (a decrease of absolute level of debt ie nominator effect)
Finally the current long-term interest rate seems very low even when the financing costs for non-financial corporations (which also attained historical minima) are taken into account This underlines the importance of the ECBrsquos measures that imply very easy financing conditions in the foreseeable future
Last but not least the uncertainty channel (Graph II10) seems to improve the conditional forecast over the baseline in the same spirit as the bank balance sheet channel For example there is a good fit of investment indicating a strong correlation of investment with confidence and financial stress measures Equally the rebound in private consumption seems to be well captured by the uncertainty channel indicating that the recent decrease in financial markets stress has also been an important driver for consumption However in general the uncertainty channel is likely to be implicitly included in the bank balance sheet
(65) GDP is a denominator of the credit indicators in bank balance
sheet channel
Graph II8 Conditional forecasts based on real GDP and inflation (1) (2000Q1-2015Q4 y-o-y growth)
Business and consumer confidence and short-term interest rates
(1) Shades of orange distribution of the conditional forecasts in the BVAR in levels excluding the lower and higher 5 quantiles Green line actual values The variables are all reported in terms of annual percentage changes except for the unemployment rate and the long-term interest rate which are in levels Conditioning assumptions real GDP and HICP Source DG ECFIN MATLAB codes replication files of the methodological paper (Banbura et al 2015)
Economic sentiment
2005 2010 2015-15
-10
-5
0
5
10Short-term i r
2005 2010 2015-4
-2
0
2
4
6
8Shadow short-term interest rate
2005 2010 2015-6
-4
-2
0
2
4
6
II Financial channels and economic activity in the euro area
Volume 15 No 2 | 29
channel For example in periods of high uncertainty bank funding costs increase (bank balance sheet channel) and firms with weaker balance sheets cannot obtain credit for new loans (borrower balance sheet channel)
Overall the findings above suggest that while there is clear evidence of the transmission of monetary policy measures on financial variables and from financial variables to consumer lending rates the evidence on the effects on real activity is more complex with different channels playing an important role at different stages of the crisis The interest rate channel has helped the modest recovery since 2014 by supporting both public and private consumption growth and by partially compensating the balance sheet channel for both borrowers and banks The results in Graph II9 (lower panel) can be interpreted as showing that in the absence of massive monetary easing given the high level of debt in the economy and the wealth effects associated with house and asset prices decreases both private and public consumption growth could have been much more subdued than what it is currently observed
Graph II10 (both panels) illustrate the importance of the bank balance sheet and the uncertainty channel for capturing investment dynamics Weak investment growth is well captured both by credit developments as captured through the bank balance sheet channel and confidence effects through the uncertainty channel Real economic activity as measured by GDP growth while playing an important role does not seem to fully explain the subdued growth in investment since 2014 (Graph II7)
II5 Conclusions
The section discusses the nexus between financial and macroeconomic developments drawing some
lessons from the literature and providing some stylised facts on the main transmission channels through which financial developments have affected real economic activity since the crisis
While there is clear evidence of the transmission of monetary policy measures on financial variables and from financial variables to consumer lending rates the evidence on the effects on real activity is more complex with different channels playing an important role at different stages of the crisis
The state of private balance sheets seems to have significantly contributed to the poor performance of consumption during the euro area debt crisis and high debt levels still weigh on growth However given the still high level of debt the current mild recovery should be seen as a rather positive outcome The analysis suggests that easy monetary conditions seem to represent an important driver of the current recovery Another driver seems to be the balance sheets of banks which have gradually improved and allow better transmission of easy monetary conditions to the lending rates
Given the still high levels of debt in the economy and the wealth and confidence effects associated with house and asset prices corrections both private and public consumption growth could have been much more subdued than what it is currently observed were it not for the exceptional easing of monetary conditions
Unfortunately the recovery is still not strong enough to facilitate the deleveraging process The stock of debt and the ongoing deleveraging combined with adverse confidence effects still represent major impediments for a stronger recovery in investment Consequently there is a need to implement policy measures that allow dealing effectively with the debt overhang notably an effective framework for non-performing loans resolution
30 | Quarterly Report on the Euro Area
Graph II9 Conditional forecasts based on variables capturing the interest rate channel and borrower balance sheet channel (1)
(2000Q1-2015Q4 y-o-y growth)
Interest rate channel
Borrower balance sheet channel
(1) Shades of orange distribution of the conditional forecasts in the BVAR in levels excluding the lower and higher 5 quantiles Green line actual values The variables are all reported in terms of annual percentage changes except for the unemployment rate and the long-term interest rate which are in levels Conditioning assumptions interest rate channel ESI HICP the short-term interest rate the long-term interest rate the shadow interest rate and the ECB excess liquidity measure Conditioning assumptions borrower balance sheet channel ESI HICP house prices stock prices and outstanding loans to households and firms Due to the high contemporaneous correlation between real GDP growth and the ESI indicator the ESI indicator contains the same forecasting information as real GDP ESI indicator is used in the conditioning set instead of real GDP variable in order to also illustrate conditional forecasts for real GDP Source DG ECFIN MATLAB codes replication files of the methodological paper (Banbura et al2015)
Real GDP
2005 2010 2015-10
-5
0
5Government consumption
2005 2010 2015-2
0
2
4Real consumption
2005 2010 2015-5
0
5
Real investment
2005 2010 2015-20
-10
0
10Unemployment rate
2005 2010 20150
10
20PPI ex const
2005 2010 2015-50
0
50
House prices
2005 2010 2015-10
0
10
20Loans to firms
2005 2010 2015-10
0
10
20Loans to households
2005 2010 2015-10
0
10
20
Real GDP
2005 2010 2015-10
-5
0
5Government consumption
2005 2010 2015-2
0
2
4Real consumption
2005 2010 2015-5
0
5
Real investment
2005 2010 2015-20
-10
0
10Unemployment rate
2005 2010 20150
5
10
15PPI ex const
2005 2010 2015-50
0
50
Shadow short-term interest rate
2005 2010 2015-5
0
5
10Short-term i r
2005 2010 2015-5
0
5
10Long-term i r
2005 2010 20150
5
10
II Financial channels and economic activity in the euro area
Volume 15 No 2 | 31
Graph II10 Conditional forecasts based on variables capturing the bank balance sheet channel and uncertainty channel (1)
(2000Q1-2015Q4 y-o-y growth) Bank balance sheet channel
Uncertainty channel
(1) Shades of orange distribution of the conditional forecasts in the BVAR in levels excluding the lower and higher 5 quantiles Solid black line point estimate of the conditional forecasts in the BVAR in differences which is computed as the median of the distribution of the conditional forecasts in this model Green line with crosses actual values The variables are all reported in terms of annual percentage changes except for the unemployment rate and the long-term interest rate which are in levels Conditioning assumptions for the bank balance sheet channel ESI HICP the credit impulse the private credit volumes (debt-to-GDP ratio) and bank lending rates for households and firms (CFCI) Conditioning assumptions uncertainty channel ESI HICP the policy uncertainty indicator the CISS and the VIX Due to the high contemporaneous correlation between real GDP growth and the ESI indicator the ESI indicator contains the same forecasting information as real GDP ESI indicator is used in the conditioning set instead of real GDP variable in order to also illustrate conditional forecasts for real GDP Source DG ECFIN MATLAB codes replication files of the methodological paper (Banbura et al 2015)
Real GDP
2005 2010 2015-10
-5
0
5Government consumption
2005 2010 2015-2
0
2
4Real consumption
2005 2010 2015-2
0
2
4
Real investment
2005 2010 2015-20
-10
0
10Unemployment rate
2005 2010 20150
5
10
15PPI ex const
2005 2010 2015-50
0
50
Loans to firms
2005 2010 2015-10
0
10
20Loans to households
2005 2010 2015-10
0
10
20Long-term i r
2005 2010 20150
2
4
6
Real GDP
2005 2010 2015-10
0
10Government consumption
2005 2010 2015-2
0
2
4Real consumption
2005 2010 2015-5
0
5
Real investment
2005 2010 2015-20
0
20Unemployment rate
2005 2010 20150
5
10
15PPI ex const
2005 2010 2015-50
0
50
Loans to firms
2005 2010 2015-10
0
10
20Loans to households
2005 2010 2015-10
0
10
20Long-term i r
2005 2010 20150
5
10
III Confidence spillovers in the euro area
Volume 15 No 2 | 33
III1 Introduction
During the recent crisis euro area private consumption fell substantially This was accompanied by a sharp decline in consumer confidence which many observers have identified as a key factor contributing to the persistence of the slowdown In fact the onset of the crisis coincided with an abrupt unwinding of imbalances that is of economic trends that turned out to be unsustainable and which led to a significant adjustment of expectations Both consumption growth rates and confidence levels have been improving since the start of 2013
There is some (mixed) evidence to suggest that fluctuations in consumer confidence affect the dynamics of private consumption (67) On the basis of this assumption and taking into account the unprecedented extent of the most recent crisis it is important to determine whether and to what extent confidence shocks spill over between countries This is particularly relevant in relation to the euro area where close trade and financial links and common institutional features can lead to the rapid propagation of shocks In addition confidence spillovers can be an important aspect to consider when discussing how to improve macroeconomic policymaking in a common currency area
This section reviews the evidence on the link between consumer confidence and private consumption and on cross-border confidence spillovers and presents some analysis of the transmission of confidence shocks across the euro area It is a follow-up to analysis discussed in
(66) This section was prepared by Francesca DrsquoAuria (67) See for a discussion Ludvigson SC 2004 lsquoConsumer
confidence and consumer spendingrsquo Journal of Economic Perspectives Vol 18(2) pp 29-50
previous issues of the Quarterly Report on the Euro Area (QREA) (68)
III2 Recent trends in consumer confidence and private consumption in the euro area
Graph III1 shows the evolution over the period 1995Q2-2016Q1 of euro area real private consumption and consumer confidence The latter is measured by the Consumer Confidence Indicator constructed by the European Commission as part of the Joint Harmonised EU Programme of Business and Consumer Surveys (BCS) (69)
There is close co-movement between the two variables Both real consumption growth and consumer confidence showed the greatest deterioration in the first quarter of 2009 and during the sovereign debt crisis They have been on a recovery path since early 2013 with consumer confidence reaching levels above the euro area long-term average since the first quarter of 2014
The relationship between consumer confidence and private consumption is much debated in the literature From a theoretical perspective there are two main competing theories One view is that confidence indicators can help predict the dynamics of consumption as they convey information about future economic conditions Another theory is that the link between the two variables can be interpreted in terms of lsquoanimal
(68) DrsquoAuria F lsquoCross-border spillovers in confidencersquo Quarterly
Report on the Euro Area (2013) Vol 12(3) pp26-30 DrsquoAuria F S Linden D Monteiro J in lsquot Veld and S Zeugner
lsquoCross-border spillovers in the euro arearsquo Quarterly Report on the Euro Area (2014) Vol 13(4) pp7-22
(69) See European Commission (2016) lsquoA user guide to the Joint Harmonised EU Programme of Business and Consumer Surveysrsquo for details on the construction of the indicators
In recent years there has been close co-movement between consumer confidence and private consumption in the euro area During the crisis in particular consumer confidence was identified by many commentators as a driving factor in its persistence as expectations about a sustainable path of economic growth were adjusted significantly In view of the unprecedented extent of the crisis the question of whether and to what extent changes in consumer confidence in one country could spill over to other countries was also raised This section discusses the relationship between consumer confidence and consumption and reviews the evidence of consumer confidence spillovers between euro area countries We conclude that there is some evidence to suggest that confidence shocks are transmitted between countries This conclusion is corroborated by results from the estimation of a Global Vector Autoregressive (GVAR) model for a number of euro area countries (66)
34 | Quarterly Report on the Euro Area
spiritsrsquo as confidence indicators capture fluctuations in beliefs which in turn affect consumption (70) In both cases the essence of confidence indicators is to gauge expectations ndash irrespective of how they are formed ndash about the future course of the economy which then have a knock-on effect on current consumer behaviour
Graph III1 Confidence and private consumption euro area
(1995Q2-2016Q1 q-o-q change)
Source Eurostat and DG ECFIN calculations based on EU Business and Consumer Surveys
Several studies test empirically the link between consumer confidence and private consumption A number of them find evidence in support of a strong correlation between consumer confidence and consumption (71)
However as confidence and consumption are to a large extent determined by the same factors other studies try to assess whether confidence indicators carry information beyond economic fundamentals The evidence on this issue is mixed although several studies conclude that confidence indicators play a significant role There is some evidence to suggest that while part of the information conveyed by confidence indicators is also captured by other variables (eg past consumption income and interest rates) confidence measures have an additional predictive power for the future path of
(70) See Barsky and Sims (2012) for a discussion of the different
theoretical approaches to the role of confidence Barsky R B and ER Sims (2012) lsquoInformation animal spirits and the meaning of innovations in consumer confidencersquo American Economic Review 102(4) pp 1343-1377
(71) See for example Carroll C J Fuhrer and D Wilcox (1994) lsquoDoes consumer sentiment forecast household spending If so whyrsquo American Economic Review Vol 84 pp 1397-1408
consumer spending (72) Moreover some papers find that confidence indicators have a stronger predictive power during periods of large economic fluctuations (73)
III3 The existing evidence on confidence spillovers
On the assumption that a causal relationship between consumer confidence and private consumption exists it is important to determine whether and to what extent changes in consumer confidence in one country affect confidence (and thus consumption) in others
There is some evidence to support the existence of confidence spillovers This pertains both to confidence shocks originating in the US and being transmitted to the euro area and shocks which occur in one euro area country and spill over to other euro area countries
Several studies provide evidence of a transmission channel of confidence shock to foreign confidence In particular evidence for G7 countries and Spain would suggest that variations in confidence generally spill over from large countries to smaller ones (74) Some studies support the idea that confidence shocks originating in US are transmitted to the euro area but not the other way round ie shocks to euro area confidence do not affect confidence in the US (75) Other studies show a transmission channel for confidence shocks
(72) Some authors eg Ludvigson (2004) Souleles (2004) and Lahiri
Monokroussos and Zhao (2016) conclude that including confidence indicators can reduce forecasting errors when predicting the dynamics of consumption while others reach the opposite conclusion (eg Claveria Pons and Ramos 2007)
Ludvigson S (2004) lsquoConsumer confidence and consumer spendingrsquo Journal of Economic Perspectives Vol 18(2) pp 29-50
Souleles NS (2004) lsquoExpectations heterogenous forecast errors and consumption Micro evidence from the Michigan Consumer Sentiment Surveysrsquo Journal of Money Credit and Banking Vol 36 pp 39-72
Lahiri K G Monokroussos and Y Zhao (2016) lsquoForecasting consumption the role of consumer confidence in real time with many predictorsrsquo Journal of Applied Econometrics forthcoming
Claveria O E Pons and R Ramos (2007) lsquoBusiness and consumer expectations and macroeconomic forecastsrsquo International Journal of Forecasting Vol 23 pp47-69
(73) For example Howrey E (2001) lsquoThe predictive power of the index of consumer sentimentrsquo Brookings Papers on Economic Activity Vol 1 pp 175-216
(74) Fei S (2011) lsquoThe confidence channel for the transmission of shocksrsquo Banque de France Working Paper No 314
(75) Deacutees S and P Soares-Brinca (2013) lsquoConsumer confidence as a predictor of consumption spending Evidence for the United States and the Euro Arearsquo International Economics Vol 134 pp 1-14
-40
-30
-20
-10
0
10
1995Q2 1998Q2 2001Q2 2004Q2 2007Q2 2010Q2 2013Q2-08
-04
00
04
08
12
16Consumption (rhs)Consumer Confidence Indicator
III Confidence spillovers in the euro area
Volume 15 No 2 | 35
(Continued on the next page)
Box III1 A GVAR model to assess confidence spillovers
The Global Vector Autoregressive (GVAR) methodology developed by Pesaran Schuermann and Weiner (2004) (1) combines individual vector error-correcting models where domestic variables are linked to country-specific foreign variables The latter combine the domestic variables using international trade financial or other relevant weights for each country This approach allows the analysis of interdependence across different economies providing a solution to the lsquocurse of dimensionalityrsquo (eg the high number of parameters as the dimension of the model increases) in global modelling
For a set of countries i=0 1 2 hellip N the individual VARX(pi qi) models take the following form
itqtiiqtiiitiiptiiptiiit uxxxxxxii
+Λ++Λ+Λ+Φ++Φ= minusminusminusminus
11
011
where xit is a vector of ki x 1 vector of domestic variables xit a ki x 1 vector of foreign variables and
00
===
iijt
N
jijit xx ωω
where ωij j=01hellipN is a set of weights such that 10
==
N
jijω The foreign variables xit are therefore a
weighted average of domestic variables for all countries included in the model The weights can be different in nature but are typically constructed using trade or capital flows data The GVAR model is then solved for the lsquoworldrsquo (ie all countries included in the model) as a whole considering all variables as endogenous to the system
The GVAR model has been applied to a variety of issues These include forecasting (eg Pesaran Schuermann and Smith 2009) credit risk (eg Pesaran Schuermann and Treutler 2007) oil price shocks (eg Galesi and Lombardi 2009) global imbalances (eg Bussiegravere Chudik and Sestieri 2012) business cycle synchronisation (eg Dreger and Zhang 2013) the impact of EU membership (eg Pesaran Smith and Smith 2007) the international effects of fiscal policy shocks (eg Favero Giavazzi and Perego 2011) (2) Chudik and Pesaran (2014) provide a detailed review of these and other recent applications (3)
In this section this approach is used to analyse the transmission of country-specific and global consumer confidence shocks in a model which includes eight euro area countries (Austria Belgium Finland France Germany Italy the Netherlands and Spain) using quarterly data over the period 1996Q2-2013Q1 The model is solved using the GVAR Toolbox developed by Smith and Galesi (2014) (4)
(1) Pesaran MH Schuermann T and Weiner S M (2004) lsquoModelling regional interdependencies using a global error-correcting
modelrsquo Journal of Business and Economic Statistics Vol 22 pp 129-162 (2) Pesaran M H Schuermann T and Smith LV (2009) lsquoForecasting economic and financial variables with global VARsrsquo
International Journal of Forecasting Vol 25(4) pp 642-675 Pesaran MH Schuermann T and Treutler B-J (2007) lsquoGlobal business cycles and credit riskrsquo in The Risks of Financial Institutions NBER Chapters pp 419-474 Bussiegravere M Chudik A and Sestieri G (2012) lsquoModelling global trade flows results from a GVAR modelrsquo Globalization and Monetary Policy Institute Working Paper 119 Federal Reserve Bank of Dallas Dreger C and Zhang Y (2013) lsquoDoes the economic integration of China affect growth and inflation in industrial countriesrsquo FIW Working Paper series 116 FIW Pesaran M H Smith L V and Smith R P (2007) lsquoWhat if the UK or Sweden had joined the euro in 1999 An empirical evaluation using a Global VARrsquo International Journal of Finance and Economics Vol 12(1) pp 55-87 Favero C Giavazzi F and Perego F (2011) lsquoCountry heterogeneity and the international evidence on the effects of fiscal policyrsquo IMF Economic Review 59(4) 652-682
(3) Chudik A and Pesaran MH (2014) lsquoTheory and Practice of GVAR Modelingrsquo Federal Reserve Bank of Dallas Globalization and Monetary Policy Institute Working Paper No 180
(4) Smith LV and Galesi A (2014) GVAR Toolbox 20 available at httpssitesgooglecomsitegvarmodellinggvar-toolbox
36 | Quarterly Report on the Euro Area
between the US the euro area as a whole and four EU countries taken individually (76)
In addition the role of consumer confidence spillovers in the euro area was assessed in a previous issue of the QREA (77) Consumption and confidence regressions were carried out for a panel of euro area countries over the period 1999-2012 The findings support the existence of confidence spillovers between euro area countries
III4 Confidence spillovers across the euro area
Table III1 shows simple correlations between the confidence indicators of eight euro area countries over the period 1995Q4-2016Q1 (78)The strength of the link between consumer confidence indicators across Member States is variable and in most cases is larger between neighbouring countries and between countries sharing similar macroeconomic environments (79)
Table III1 Consumer Confidence Indicator mdash Correlation Matrix
(1995Q4-2016Q1)
(1) Not statistically significant at conventional levels Source DG ECFIN calculations based on EU Business and Consumer Surveys
(76) Deacutees S and J Guntner (2014) lsquoThe international dimension of
confidence shockrsquo ECB Working Paper No 1669 (77) Op cit DrsquoAuria F (2013) (78) The very low and non-statistically significant correlation of the
Italian confidence indicator with the confidence indicators of a number of other euro area countries is somewhat puzzling and there is a need for further investigation into the reasons behind it
(79) The strong correlation between confidence indicators in countries sharing similar economic conditions can be indicative of larger confidence spillovers between them but can also be a reflection of the strong correlation between their economic fundamentals
The strength of the correlation also varies considerably over time Table III2 displays correlations between consumer confidence indicators in the same euro area countries over the period 2008Q1-2012Q4 During the crisis period the link between consumer confidence indicators is significantly tighter
Table III2 Consumer Confidence Indicator mdash Correlation Matrix
(2008Q1-2012Q4)
(1) Not statistically significant at conventional levels Source DG ECFIN calculations based on EU Business and Consumer Surveys
The presence of a correlation between confidence indicators may point to the existence of confidence spillover effects between countries but also be indicative of strong business cycle synchronisation To shed light on the nature of these correlations this section discusses confidence spillovers in the euro area on the basis of the findings from the estimation of a Global Vector Autoregressive (GVAR) model which includes data for eight euro area countries over the period 1996Q2-2013Q1 Box III1 describes the model in more detail
The model includes observations on consumption GDP the unemployment rate a short-term interest rate and consumer confidence The latter is measured by the BCS Consumer Confidence Indicator which is an arithmetic average of the balances of the answers to questions on the financial situation of households the general economic situation unemployment expectations and savings over the next 12 months It is therefore taken as a proxy for consumersrsquo expectations about their future economic situation
The results seem to support the existence of consumer confidence spillovers across the euro area As an illustration Graph III2 reports impulse
AT BE FI FR IT DE NL ES
AT 100 069 069 074 013(1) 054 043 022BE 069 100 067 088 055 057 068 066FI 069 067 100 068 039 028 075 055FR 074 088 068 100 046 055 066 060IT 013(1) 055 039 046 100 004(1) 063 081DE 054 057 028 055 004(1) 100 033 023NL 043 068 075 066 063 033 100 073ES 022 066 055 060 081 023 073 100
AT BE FI FR IT DE NL ES
AT 100 093 090 088 036(1) 079 086 063BE 093 100 081 080 034(1) 080 081 071FI 090 081 100 083 058 052 081 066FR 088 080 083 100 030(1) 066 074 061IT 036(1) 034(1) 058 030(1) 100 -016(1) 065 038DE 079 080 052 066 -016(1) 100 050 048NL 086 081 081 074 065 05 100 050ES 063 071 066 061 038 048 050 100
Box (continued)
by the European Commission Consumption and GDP enter the model in log differences while the other variables are in levels Some of the results are discussed in the main text
III Confidence spillovers in the euro area
Volume 15 No 2 | 37
response functions of consumer confidence in the euro area countries included in the GVAR model to a positive shock to consumer confidence in Germany over 24 quarters (80)
The largest effect appears to be in smaller neighbouring countries (Austria Belgium and the Netherlands) The response of consumer confidence is also relatively large in Finland France and Spain On the other hand spillovers to consumer confidence in Italy are very small and become negative after six quarters This is not a surprise given the statistically insignificant correlation between German and Italian consumer confidence emerging from the data reported in Table III1 The peak response occurs in the second or third quarter
Similar results although of a smaller magnitude were obtained for the other euro area countries included in the model Confidence spillovers appear to be larger across countries with stronger geographical and trade links Overall the evidence from the estimation of the model supports the existence of a transmission channel for consumer confidence shocks across the euro area However the effects of confidence shocks on foreign consumption are in most cases not statistically significant suggesting that the transmission channel is to foreign confidence rather than
(80) A caveat must be made about the difficulty of identifying truly
exogenous confidence shocks owing to the fact that confidence indicators are largely driven by the same factors which determine consumption
directly to foreign economic activity (81)
These results suggest that confidence shocks play a role in the international business cycle and that there are close interlinkages between confidence indicators across euro area countries This evidence supports the need for coordinated policy action able to boost confidence across euro area countries
III5 Conclusions
In recent years the dynamics of euro area consumer confidence and real private consumption have been very closely related Moreover consumer confidence indicators across the euro area appear to be strongly correlated The strength of the correlation was considerably greater during the crisis period
The evidence of a link between real consumption and consumer confidence is mixed but several studies are supportive of consumer confidence playing a role in determining consumption In addition there is evidence to suggest that shocks to consumer confidence in euro area countries affect confidence in other euro area Member States This is also borne out by results obtained from the estimation of a Global Vector Autoregressive (GVAR) model for eight euro area countries
(81) Similar conclusions are reached by op cit Deacutees and Soares-Brinca
(2013) and Deacutees and Guntner (2014)
38 | Quarterly Report on the Euro Area
Graph III2 Impulse response functions of foreign confidence to a one standard error confidence shock in Germany
Source DG ECFIN
000
005
010
015
020
025
030
035
1 2 3 4 5 6 7 8 9 10 11 12 13 14 15 16 17 18 19 20 21 22 23 24
AT
000
005
010
015
020
025
030
035
040
1 2 3 4 5 6 7 8 9 10 11 12 13 14 15 16 17 18 19 20 21 22 23 24
BE
000
005
010
015
020
025
030
1 2 3 4 5 6 7 8 9 10 11 12 13 14 15 16 17 18 19 20 21 22 23 24
FI
000
005
010
015
020
025
030
1 2 3 4 5 6 7 8 9 10 11 12 13 14 15 16 17 18 19 20 21 22 23 24
FR
-002
-001
000
001
002
003
004
005
006
007
1 2 3 4 5 6 7 8 9 10 11 12 13 14 15 16 17 18 19 20 21 22 23 24
IT
000
005
010
015
020
025
030
035
040
1 2 3 4 5 6 7 8 9 10 11 12 13 14 15 16 17 18 19 20 21 22 23 24
NL
000
005
010
015
020
025
030
035
1 2 3 4 5 6 7 8 9 10 11 12 13 14 15 16 17 18 19 20 21 22 23 24
ES
40 | Quarterly Report on the Euro Area
Editors Jose Eduardo Leandro and Martin Larch
Coordination Plamen Nikolov
Statistical and layout assistance Christos Zavos
Comments on the report would be gratefully received and should be sent to
Jose Eduardo Leandro Director ndash Policy strategy coordination and communication Directorate-General for Economic and Financial Affairs Office CHAR 1566
B-1049 Brussels
Email joseleandroeceuropaeu
or
Martin Larch Head of Unit ndash EMU deepening and macroeconomy of the euro area Directorate-General for Economic and Financial Affairs Office CHAR 1556
B-1049 Brussels
Email martinlarcheceuropaeu
EUROPEAN ECONOMY INSTITUTIONAL SERIES
European Economy Institutional series can be accessed and downloaded free of charge from the following address httpeceuropaeueconomy_financepublicationseeipindex_enhtm Titles published before July 2015 can be accessed and downloaded free of charge from bull httpeceuropaeueconomy_financepublicationseuropean_economyindex_enhtm
(the main reports eg Economic Forecasts) bull httpeceuropaeueconomy_financepublicationsoccasional_paperindex_enhtm
(the Occasional Papers) bull httpeceuropaeueconomy_financepublicationsqr_euro_areaindex_enhtm
(the Quarterly Reports on the Euro Area)
Alternatively hard copies may be ordered via the ldquoPrint-on-demandrdquo service offered by the EU Bookshop httpbookshopeuropaeu
HOW TO OBTAIN EU PUBLICATIONS Free publications bull one copy
via EU Bookshop (httpbookshopeuropaeu) bull more than one copy or postersmaps
- from the European Unionrsquos representations (httpeceuropaeurepresent_enhtm) - from the delegations in non-EU countries (httpeeaseuropaeudelegationsindex_enhtm) - by contacting the Europe Direct service (httpeuropaeueuropedirectindex_enhtm) or calling 00 800 6 7 8 9 10 11 (freephone number from anywhere in the EU) () () The information given is free as are most calls (though some operators phone boxes or hotels may charge you)
Priced publications bull via EU Bookshop (httpbookshopeuropaeu)
ISBN 978-92-79-54335-7
KC-BC-16-030-EN-N
- NEW_IP_index_enpdf
-
- EUROPEAN EconomY institutional SERIES
-

I Cross-border risk sharing after asymmetric shocks evidence from the euro area and the United States
Volume 15 No 2 | 7
I1 Introduction
One of the most important characteristics of a well-functioning economic and monetary union is the capacity to absorb asymmetric (ie country-specific) shocks The challenges specific to the euro area were clear from the beginning (2)
After a period of relatively high synchronisation in the run-up to and in the first years of Economic and Monetary Union (EMU) the surge in cyclical and structural differences during the economic and financial crisis has turned attention to the mechanisms available to smooth consumption in the face of asymmetric shocks These include possible policy measures to improve cross-border risk sharing among Member States
The Five Presidentsrsquo Report issued in June 2015 pays particular attention to enhancing the shock absorption capacity of the euro area both through better integrated financial and capital markets (private risk sharing) and through a mechanism
(1) This section was prepared by Plamen Nikolov (2) See lsquoEMU10 The first ten years a resounding successrsquo in
Quarterly Report on the Euro Area Vol 7 No 2 (2008) for a historical overview of the challenges in the functioning of the EMU and the design of the appropriate policy responses as seen by its early proponents and the policy-makers of the time Common shocks could also have asymmetric effects across countries A good example of an asymmetric effect of common shocks is presented in Box 6 of the report which explains the differentiated response to a fall in US private demand in Germany Italy and Ireland by referring to the differences in their trade openness and the structure of their exports
of fiscal stabilisation among euro area Member States (public risk sharing) (3)
Currently a high level of economic divergence among euro area Member States is still present (4) By 2015 the divergent economic performance since the crisis resulted in an eight percentage point growth gap between the best and the worst performing Member State while the gap between the highest and lowest unemployment rate in the euro area reached 20 percentage points (5) In such an environment even a small localised shock can have large effects if cross-border risk sharing among Member States is weak
Therefore the goal of this section is to present empirical evidence on the current degree of cross-border risk sharing in the euro area in the event of an asymmetric shock The section starts with a brief review of the existing channels of cross-border risk sharing and presents some stylised facts on consumption smoothing following asymmetric
(3) lsquoCompleting Europersquos Economic and Monetary Unionrsquo Report by
Jean-Claude Juncker in close cooperation with Donald Tusk Jeroen Dijsselbloem Mario Draghi and Martin Schulz 2015
(4) For a presentation of asymmetries across euro area Member States see Ruscher E (2015) lsquoAn overview of market-based adjustment in the euro area in the light of the crisisrsquo in Quarterly Report on the Euro Area Vol 14 No 4 (2015)
(5) In 2015 the fastest growing economy in the euro area was Ireland at 78 while the worst performance was in Greece at -02 The highest unemployment was in Greece at almost 25 of civilian labour force while the lowest in Germany at 46 To be fair US states also experience divergent growth performance In 2014 real state domestic product in Alaska shrank by -14 while in North Dakota it increased by 7 However labour market divergence between US states is much more subdued with a difference of only 41 pps between the worst performer (Illinois) and the best performer (South Dakota)
This section presents empirical evidence on the shock absorption capacity of the different channels of cross-border risk sharing in the euro area The surge in economic divergence since the crisis has turned attention to the available cross-border mechanisms to smooth consumption in the face of asymmetric shocks The main channels considered are private risk sharing through access to cross-border capital and credit markets and other cross-border factor income such as labour compensation and public risk sharing through cross-border fiscal transfers (public stabilisation through domestic means is not considered) This section shows that Economic and Monetary Union has likely facilitated cross-border shock absorption through private risk sharing even taking into account the impact of the crisis on the financial sector However a direct comparison with the shock absorption capacity across US states shows that the size of the asymmetric shock that remains unsmoothed in the euro area is very high The difference is mainly due to much less developed capital and labour market cross-border channels in the euro area Therefore enhancing private risk sharing among the euro area Member States especially through capital markets remains a policy priority (1)
8 | Quarterly Report on the Euro Area
output shocks Next the section presents quantitative results Specifically it employs an econometric approach to quantify the relative amount of smoothing of asymmetric output shocks that is due to three distinct cross-border channels net factor income fiscal support and savings The section contrasts private and public risk sharing results obtained by this method in the euro area and the United States and shows that private risk sharing works better in the latter The section concludes with policy implications for the efforts needed to increase the shock absorption capacity of the euro area through cross-border risk sharing
I2 Mechanisms of cross-border risk sharing
Cross-border risk sharing is linked to integration between countries first and foremost economic and financial but also political and institutional at least to some extent Therefore it is important to examine the channels through which this type of risk sharing operates and the minimum degree of integration that makes it efficient This needs to be done in order to anticipate necessary changes in policy
The channels of operation of cross-border risk sharing can be divided into two broad categories private and public
The private channels of cross-border risk sharing work through access to foreign financial markets including through foreign capital markets and cross-border loans and deposits as well as through labour compensation generated across borders
The cross-border provision of financial services by financial institutions and markets is one of the main ways that private risk sharing operates Residents of a country that experiences a negative output shock could smooth their consumption through property income streams generated by financial assets held in another jurisdiction which is shielded from the shock This is the capital market channel of risk sharing
Alternatively residents of a country that sees a negative output shock can secure consumption levels by drawing down savings accumulated during better times or by borrowing This can also be done indirectly for example when public borrowing is used to compensate for the loss of tax revenues after asymmetric shocks in order to sustain government expenditure levels and in turn smooth household consumption This is what is
called the credit market or savings channel of risk sharing The savings channel does not necessarily involve a cross-border element but integration helps deepening of financial markets thus ensuring cost-cutting and efficiency (6)
The operation of both the capital and the credit market channels is greatly facilitated by integrated financial markets and competition among financial institutions This requires the adoption of a legal framework (among which insolvency laws and accounting standards) for competitive cross-border financial intermediation the creation of an efficient financial infrastructure and the required institutional safeguards to ensure stable financial systems
Another private channel of risk sharing that operates through streams of cross-border factor income is the cross-border labour compensation channel Residents of a country that experiences a negative shock to output could smooth their consumption with labour income generated in another jurisdiction that does not experience the shock Such workers are called commuter workers (7) This channel requires free movement of labour as well as the prerequisites for a high degree of labour mobility among which are investment in human capital flexibility in compensation and hours worked portability of social security rights and facilitated firm entry and exit
The public channels of cross-border risk sharing involve some form of fiscal redistribution between those countries that experience a negative output shock and those which do not For example the fiscal redistribution can be in the form of cross-border subsidies social protection including a common unemployment scheme or cross-border financing of public investment such as transport corridors
The public channels require a great deal of solidarity among the partners and naturally involve
(6) In the case of risk sharing measured by balancing items for the
total economy a fixed level of household and government consumption after an output shock can only be achieved by borrowing or lending abroad
(7) This channel is different from although closely related to risk sharing through remittances sent to the home country by workers residing abroad The difference comes from the fact that remittances are sent by residents of an immigration country to residents of a country of origin and thus are measured differently in the national accounts
I Cross-border risk sharing after asymmetric shocks evidence from the euro area and the United States
Volume 15 No 2 | 9
a higher degree of political and institutional integration between them including a system of common decision-making that ensures democratic legitimacy and accountability
The initial EMU design did not envisage a substantial role for cross-border public risk sharing through common EMU fiscal support The EU budget remains quite small in comparison to the sum of the Member Statesrsquo national budgets and is mainly designed to support real convergence rather than smooth shocks across countries (8)
I3 Methods to measure cross-border risk sharing
Empirical facts on cross-border risk sharing among Member States support the view that the EMU likely helped the process of smoothing cross-border output shocks mainly through private channels Graph I1 shows the cross-country dispersion of output income (9) income after taxes and consumption in the euro area since the start of the EMU
(8) The amount of cross-border risk sharing in the EU through
common public channels such as spending through the multiannual financial framework (MFF) remains much lower than in federal states The EU budget accounts for 1 of the EUrsquos combined GDP while in the US it reaches 25 of GDP
(9) Income is derived from GDP adjusted for net factor income vis-agrave-vis rest of the world plus net taxes and subsidies on products and imports See also Box II1
The dispersion of output among Member States has remained quite stable since the launch of the euro despite a minor increase in the boom years before the crisis and a minor drop after the crisis hit Both income (including after-tax income) and consumption show a lower degree of dispersion among the Member States than output (10) This suggests that asymmetric shocks to output are being smoothed among countries as part of the general income and consumption convergence process in the euro area
Moreover the years after the introduction of the euro as a common currency seem to coincide with a visible even though slight reduction in the cross-country dispersion of income and consumption The trend is also visible when the sample excludes new Member States (right-hand panel) This suggests that the creation of the EMU has resulted in better convergence and possibly better cross-border risk sharing among Member States (11)
(10) Measured by the standard deviation in real per capita terms This
remains valid even when the sample excludes the countries that joined the euro area after 2004 See right-hand panel of Graph II1
(11) The fact that after-tax-income shows slightly more dispersion than pre-tax-income is hardly surprising given that fiscal policy in the euro area is decided at national level If there is a common system of risk sharing through cross-border transfers to smooth income and governments can borrow decentralised fiscal policy can also dampen variations in after tax income
Graph I1 Cross-country dispersion of output income and consumption in the euro area (1)(2)
(1999-2015 Index EA-19=100)
(1) Standard deviation of real per-capita terms output is measured by GDP income by gross national income (GNI) and income after taxes contributions and subsidies by gross disposable income (GDI)(2) New Member States (NMS) of the euro area are those that joined after 2004 Source AMECO
0
10
20
30
40
50
60
1999 2001 2003 2005 2007 2009 2011 2013 2015
OutputIncomeIncome after taxes contributions and transfersConsumption
0
10
20
30
40
50
60
1999 2001 2003 2005 2007 2009 2011 2013 2015
Output (exclNMS)
Income (exclNMS)
Income after taxes contributions and transfers(exclNMS)Consumption (exclNMS)
10 | Quarterly Report on the Euro Area
Looking at the same graph for the US reveals that the disparity of output income and consumption among the 50 US states is much lower than between the euro area Member States The crisis has affected divergence in the US as well with a sharp increase in the cross-state standard deviation of output and income in 2008 (Graph I2)
Another difference with the euro area is the smoothing role of taxes contributions and transfers with gross disposable state income having a much lower dispersion than unadjusted income in the US compared to the euro area This is to be expected given the larger size of the US federal budget
Graph I2 Cross-state dispersion of output income and consumption in the 50
US states (1) (1999-2014 in )
(1) Standard deviation of real per-capita terms output is measured by gross state product (GSP) income by gross state personal and non-personal income and income after taxes contributions and subsidies by gross disposable state income Source US Bureau of Economic Analysis (BEA) US Office of Management and Budget (OMB) US Bureau of Labour Statistics (BLS) US Census Bureau DG ECFIN calculations
A more concrete representation of the process of cross-border risk sharing within a single year can be obtained by looking at the dispersion of output and consumption growth among euro area Member States and US states shown on Graph I3 The vertical difference between the dispersions of output and consumption gives the amount of a change in output that is not picked up by the change in consumption over the course of the year and thus appears to be smoothed This is in contrast to dispersion of output income and consumption in levels presented above which contains in itself convergence irrespective of
shocks as well as smoothing of past shocks that takes more than one year
The graph shows that there were periods before the crisis when annual consumption growth within the euro area differed more than the growth in output Conversely between 2010 and 2013 the dispersion of consumption growth was clearly below the dispersion of output growth suggesting smoothing in the course of each of these years
The contrast with the US is visible here as well Both output and consumption growths among the US states vary less than among euro area Member States and in the US the variability of consumption growth is consistently lower than the variability of output growth suggesting a more consistent risk sharing process
Graph I3 Cross-border dispersion of output and consumption growth in the
euro area and the 50 US states (1) (1999-2015 in pps)
(1) Standard deviation of growth in real per-capita terms Source AMECO US Bureau of Economic Analysis (BEA) US Office of Management and Budget (OMB) US Bureau of Labour Statistics (BLS) US Census Bureau DG ECFIN calculations
Labour mobility
Looking at the specific channels of cross-border risk sharing Graph I4 attempts to illustrate the role of cross-border labour income with data from Eurostatrsquos Labour Force Survey (12) The graph
(12) The EU labour force survey is a large sample survey among
private households in Europe and an important source for European statistics about the situation and trends in the EU labour market
Visit httpeceuropaeueurostatwebmicrodataeuropean-union-labour-force-survey for more information
0
5
10
15
20
25
1999 2001 2003 2005 2007 2009 2011 2013
OutputIncomeIncome after taxes contributions and transfersConsumption
0
1
2
3
4
5
6
1999 2001 2003 2005 2007 2009 2011 2013 2015
Output growth in the euro areaConsumption growth in the euro areaOutput growth in the USConsumption growth in the US
I Cross-border risk sharing after asymmetric shocks evidence from the euro area and the United States
Volume 15 No 2 | 11
provides statistics on employment by citizenship and thus on the number of euro area workers who work in another Member State A caveat needs to be made here Employment by citizenship only approximates the number of cross-border commuter workers In the very narrow sense risk sharing through labour mobility is performed by commuter workers whose number fluctuates almost simultaneously with a shock in output while cross-border employment as presented in the graph also contains a structural pattern (13)
The share of euro area labour force that has an EU citizenship different from that of the reporting country has been increasing since the start of the survey There was a minor slowdown during the crisis but by 2015 the share of euro area workers who are citizens of another EU country had reached almost 4 Most of the increase since the beginning of the survey in 2006 can be attributed to workers from the new Member States By 2015 their number had surpassed the number of workers from the EU-15
Graph I4 Cross-border employment in the euro area (1)(2)
(2006-2015 y-o-y change)
(1) Employment by citizenship other than of the reporting country 15-64 year old of total employment (2) New Member States of the EU are those that joined after 2004 Source Eurostat
There is quite a disparity among Member States regarding the share of cross-border labour This means that cross-border risk sharing through this channel is not homogeneous across Member States as some countries likely benefit more from this
(13) Data on commuter workers that move in response to shocks are
unavailable in the Labour Force Survey
form of risk sharing than the rest In 2015 the share of workers that are citizens of another EU country varies between more than 10 in Ireland and Cyprus to as low as 06 in Portugal and below or close to 2 in France Finland the Netherlands Malta and Greece Luxembourg with its small size and high expatriate population is a clear outlier Workers from the new Member States are a clear majority of EU workers in Ireland Austria Spain and Italy This diversity among Member States suggests that the pattern of cross-border risk sharing through this channel is quite different depending on the country concerned
There is still quite a lot to be done to increase the impact of cross-border labour mobility on risk sharing among euro area Member States The line on Graph I4 clearly shows a pattern similar to the demand cycle during the crisis This means that the aggregate number of cross-border workers within the euro area is pro-cyclical This may help adjustment for example when cross-border workers return to their countries of origin after a negative shock in the host country (14) Yet at this stage given the lack of precise information on the number of cross-border commuters in the euro area it is difficult to arrive at more precise conclusions on the role of risk sharing through labour compensation in the various Member States
Financial integration
The rapid financial integration in the years between the EMUrsquos creation and the start of the global financial crisis undoubtedly provided conditions for better cross-border risk sharing in the euro area The increase in the importance and size of the financial services sector in the Member States followed similar developments in the other
(14) Putting this channel in a more comparative perspective is difficult
Annual interstate mobility in the US (a flow concept) is found to be 25 of working age population in 2005 This is a relatively high number compared to countries in Europe given that in 2006 29 of the euro area labour force had a citizenship of another EU country (a stock concept) See Bonin H W Eichhorst C Florman M Okkels Hansen L Skioumlld J Stuhler K Tatsiramos H Thomasen and K F Zimmermann (2008) lsquoGeographic mobility in the European Union optimising its economic and social benefitsrsquo IZA (Forschungsinstitut zur Zukunft der Arbeit) Research Report No 19 The crisis may have affected these estimates in a different way in the two blocs For evidence that the crisis has reduced the importance of migration across state borders as a labour market adjustment tool in the US see Foote A M Grosz and AH Stevens (2015) lsquoLocate your nearest exit mass layoffs and local labour market responsersquo NBER Working Paper Series No 21618 One possibility is that the Great Recession was unique given the role of the US housing crisis which impeded mobility
0
1
2
3
4
2006 2007 2008 2009 2010 2011 2012 2013 2014 2015
From the new Member States - BG CZ CYEE HU HR LV LT MT PL RO SK SL
From the old Member States - AT BE DKDE ES FI FR GR IE IT LU NL PT SEUK
12 | Quarterly Report on the Euro Area
advanced economies but in Europe the process was given an additional impetus by the creation of the common currency and linked to that the decrease in the costs of borrowing Previous analysis in this series has shown that financial market integration has supported cross-border risk sharing However this was less through equity markets and rather more through borrowing and saving on credit markets (15)
The crisis changed the perception about financial integration and the role of wholesale bank funding in a profound way The rapid cross-border expansion up until 2007 was followed by a retrenchment of financial intermediation behind state borders Moreover capital misallocation during the boom years appeared as a major destabilising factor after the crisis hit increasing the likelihood of asymmetries across Member States (16)
Not all cross-border financial instruments in the euro area have experienced the same deep fall since the crisis Graph I5 shows that in 2014 the cross-border deposits at euro area banks excluding positions vis-agrave-vis other banks stood at levels that were relatively close to those in the pre-crisis years despite localised drops in the immediate vicinity of the sovereign-debt crisis in 2008 (17)
Both cross-border loans and deposits expanded rapidly after the creation of the euro and judging from their level today the common currency plays an important role in risk sharing through cross-border provision of financial services However cross-border equity assets experienced a significant drop during the crisis and their recovery to pre-crisis levels has taken much longer than for cross-border deposits It is also important to stress that
(15) For an overview of increased pre-crisis financial integration and
its impact on risk sharing see lsquoCross-border risk sharing has it increased in the euro arearsquo in Quarterly Report on the Euro Area Vol 6 No3 (2007)
(16) For a presentation of the limits of shock absorption in the EMU since the crisis see Jevcak A and R Kuenzel lsquoRecent capital flow developments in the euro arearsquo in Quarterly Report on the Euro Area Vol 12 No2 (2013) Loublier A lsquoRecent developments in cross-border capital flows in the euro arearsquo in Quarterly Report on the Euro Area Vol 14 No1 (2015) and lsquoFinancial integration and risk-sharing in a monetary unionrsquo in Financial Integration in Europe (2016) ECB
(17) Naturally the share of large financial centres such as Ireland and Luxembourg as locations of cross-border financial positions in the euro area is disproportionately higher than their weight in the EMU population or GDP This is another example of the Member Statesrsquo uneven ability to share risk among each other through private channels
the size of the cross-border equity market is several times lower than the cross-border loan and deposit markets
Graph I5 Cross-border financial instruments in the euro area(1)
(2001-2014 Index 2001=100)
(1) For loans and deposits other bank counterparties are excluded Source Bank for International Settlements (BIS) reporting banks IMF Coordinated Portfolio Investment Survey (CPIS)
The euro facilitates private risk sharing through lowering transactions costs and deepening financial markets However as the crisis has shown appropriate measures to create a well-functioning Banking Union are also needed This includes in particular establishing a European Deposit Insurance Scheme (EDIS) thus building the third pillar of the Banking Union Given the current regime of country-based deposit insurance there are still differences in the regulatory treatment of banks Once operational the EDIS will work against country-specific shocks since it is likely to be fiscally neutral over time because insured risks will be spread and private contributions will be raised by a larger pool of banks In this way the EDIS together with a credible common backstop to the Single Resolution Fund will create further conditions for more cross-border presence of euro area banks by ensuring consistency in regulatory treatment and by shielding the financial sector from country-specific shocks It will therefore be another supporting factor in increasing competition in the financial sector lowering costs and increasing cross-border risk sharing
0
50
100
150
200
250
300
350
400
450
2001 2003 2005 2007 2009 2011 2013
Cross-border loansCross-border depositsCross-border equity assets
I Cross-border risk sharing after asymmetric shocks evidence from the euro area and the United States
Volume 15 No 2 | 13
I4 Empirical results of cross-state risk sharing in the euro area and the US
Econometric results on the relative weight of the different risk sharing channels among euro area Member States and US states are given below This sub-section updates findings of the canonical paper by Asdrubali et al (1996) (18) for the US states in the years since the crisis It next compares the US with the euro area and draws conclusions for the possible degree of risk sharing in the euro area had the latter possessed the capital and labour market characteristics of the former The comparison also acknowledges that the US is a federal state with a
(18) Asdrubali F B Sorensen and O Yosha (1996) lsquoChannels of
interstate risk sharing United States 1963-1990rsquo The Quarterly Journal of Economics November
sizeable budget while the EMU does not have common fiscal means to cope with asymmetric shocks
Cross-border risk sharing is measured using the system of national accounts The approach consists of sequential regressions of the balancing items in the primary and secondary distribution of income accounts and in the use of income account for the total economy (so including both the private and the public sector) in order to quantify the amount of co-movement of output income including after taxes and consumption after asymmetric shocks to output The method provides a breakdown of the relative size of the three different channels of cross-border risk sharing (net factor income fiscal transfers and credit markets) and the proportion of an asymmetric shock that remains unsmoothed
Graph I6 Channels of risk sharing 50 US States anchored-start regressions with rolling end dates (1)
(1990-2013 in of total asymmetric shock to output)
(1) Regressions cover 1964 until the year shown on the horizontal axis Regressions with rolling start and end dates did not give qualitatively different results Source US Bureau of Economic Analysis (BEA) US Office of Management and Budget (OMB) US Bureau of Labour Statistics (BLS) US Census Bureau DG ECFIN calculations
435
440
445
450
455
460
465
470
475
1990 1993 1996 1999 2002 2005 2008 2011
smoothed by net factor income
76
77
78
79
80
81
82
83
84
85
1990 1993 1996 1999 2002 2005 2008 2011
smoothed by federal taxes grants and transfers
235
240
245
250
255
260
265
270
275
280
285
1990 1993 1996 1999 2002 2005 2008 2011
smoothed by savings
160
165
170
175
180
185
1990 1993 1996 1999 2002 2005 2008 2011
not smoothed
14 | Quarterly Report on the Euro Area
See Box I1 for a full description of the model and its estimation
The Asdrubali et al (1996) methodology is applied to the 50 US states and to three sets of euro area Member States the euro area (EA) 19 except Malta Cyprus Luxembourg Lithuania Austria and Greece EA 12 except Luxembourg Austria and Greece and a set of euro area core and periphery countries (Germany Spain Ireland Netherlands and Portugal) The choice of euro area countries is partly based on data availability in the European System of Accounts 2010 and partly on the option to have a sample that excludes new Member States In this way it is possible to measure legacy effects from the closer integration even before the EMU and have a sample of countries in the EA12 core and periphery which are likely to experience more asymmetries
The time period chosen for the US is between 1964 and a rolling end date from 1990 until 2013 For the three different sets of euro area countries the time period is between 1999 and 2015 The time periods are chosen based on data availability while for the US it extends the period in Asdrubali et al (1996) The difference in the two time samples does not impair comparison between the two economies because risk sharing estimates for
an economy vary little depending on the period chosen (19) The main differences between two economies are driven by the legal institutional and economic structures that underpin risk sharing not by the different time samples
The most important result of the econometric exercise is that risk sharing among Member States is lower than across federal states in the US (20) The overall proportion of an asymmetric shock that is not smoothed in the euro area is more than four times larger than in the US (Table I1 last row) Naturally the gap comes from the different
(19) This is best illustrated when comparing estimates in the original
Asdrubali et al (1996) paper and its extension here See the small scale of the vertical axis in Graph II4 Note also that the econometric approaches in Asdrubali et al (1996) and the extension here are different 2-step generalised least squares vs panel-corrected ordinary least squares See Box II1 for more information
(20) The lower degree of risk sharing after asymmetric shocks in the euro area compared with the US was reported already after the first couple of years of the EMU For an overview see for example Demyanyk Y C Ostergaard and B Sorensen (2008) lsquoRisk sharing and portfolio allocation in EMUrsquo European Economy Economic Papers 334 and Sorensen B and O Yosha (1998) lsquoInternational risk sharing and European monetary unificationrsquo Journal of International Economics Vol 45 pp 211-238 On the other hand Furceri D and A Zdzienicka (2013) lsquoThe euro area crisis need for a supranational fiscal risk sharing mechanismrsquo IMF WP13198 point out that the crisis has hampered the ability of the euro area countries to share risk
Table I1 Cross-border risk sharing through different channels(1)(2) in of total asymmetric shock to output
(1) Time period for the euro area is between 2000q4 and 2015q4 while for the US it is between 1964 and 2013 To increase the number of observations risk sharing in the euro area is measured at a quarterly frequency (difference compared with the same quarter in the preceding year) However regressions with annual frequency did not produce qualitatively different results (2) Cross-border factor income includes property income such as income from cross-border ownership of equity rent income and cross-border labour compensation Source DG ECFIN calculations Asdrubali et al (1996)
Euro area
Euro area without the
New Member States
Core vs periphery US
Risk sharing throughall EA MS except CY MT LU LT
AT GR
EA12 except LU AT and
GR
DE ES IE NL and PT 50 states
00
56 20 34 448
02 -02 -01
757 617 631 176
cross-border factor income(2)
of which cross-border labour compensation
cross-border fiscal transfers
credit markets
unsmoothed
16 26 83
182 246 180 267
I Cross-border risk sharing after asymmetric shocks evidence from the euro area and the United States
Volume 15 No 2 | 15
political and institutional setups for sharing risks in the US and the euro area as well as the relatively big role of capital and labour markets for risk sharing in the US
Graph I6 shows the estimates of the amount of risk sharing through the different channels between the 50 US states following an asymmetric shock to output The lines report the evolution of the regression estimates depending on the end date of the time series starting with an end date in 1990 The goal is to evaluate how the different channels evolved since 1990 Table I1 compares the three euro area samples with the US
Cross-state risk sharing through net factor income remains the largest contributor to consumption smoothing following an asymmetric shock in the US This channel includes risk sharing through cross-state property income such as retained earnings and income streams from cross-state ownership of shares as well as smoothing through labour earnings by commuters across state borders It is natural that these income streams are hampered during recessions Graph II4 shows two steep drops in its relative weight which broadly correspond to the recessions in 2001 and 2008-9 (21)
The estimates in Table I1 show that there is a big difference between the role of cross-border net factor income among the euro area Member States and the US states This comes as a result of the higher degree of labour mobility and deeper and more integrated capital markets in the US Higher risk sharing through this channel is to be expected given the high annual interstate mobility and the high number of commuter workers across state border in the US (22) Better capital market development in the US is also well documented see Valiante (2016) (23) for evidence that Europersquos capital markets are poorly functioning and underdeveloped compared to the US
The relative share of fiscal redistribution across state borders in the US is lower than the shares of the private channels For the full time series
(21) Even though visually pronounced these drops are small in
absolute terms Note the scale of the vertical axes on Graph II4 again supporting the conclusion that the choice of a time period has a minor impact on the absolute value of the risk sharing coefficients while keeping their relative proportion constant
(22) See Bonin et al (2008) op cit (23) Valiante D (2016) lsquoEuropersquos untapped capital market rethinking
integration after the great financial crisisrsquo CEPS Paperback
between 1964 and 2013 the relative weight of fiscal support in risk sharing is around 85 Risk sharing through this channel has been at its highest level since the start of the crisis as the federal government provided support to struggling states
The role of cross-border public risk sharing in the euro area is smaller than in the US although the difference is less striking than for the cross-border private channels The largest role for the public channel comes up when the sample of euro area countries includes only those that benefited from official support during the crisis years This should come as no surprise given that the euro area does not have a common fiscal capacity to absorb shocks
The importance of credit markets for cross-border risk sharing is more similar in the euro area and the US than the other channels This includes borrowing by both the private and the public sector The role of public sector borrowing in risk sharing is likely smaller than the one of the private sector while stabilisation through purely domestic means is not considered here (24) The role of euro area credit markets in smoothing an asymmetric output shock is more similar to the one in the US in the pre-2004 euro area sample than in the other two euro area samples This reflects a very high degree of financial deepening in the old Member States compared to those that joined recently While encouraging at face value this result also needs to take into account that pre-crisis cross-border financial flows in some of the old Member States turned out to be unsustainable as a result of insufficient risk management and supervision
The overall proportion of an asymmetric shock that is not smoothed between the 50 US states is around 18 compared to more than 60 among the euro area Member States Given that the US is a federal country with a long history of fiscal redistribution and that it has well-developed capital markets with a large presence across state borders it is to be expected that the euro area could achieve a higher degree of cross-border risk sharing once
(24) Some authors have separated this channel into saving and
borrowing on the credit markets by private entities (households and non-financial corporations) and public entities (national and local governments) See for example Furceri and Zdzienicka (2013) they find that the role of public access to credit markets for cross-border risk sharing in the euro area is several times lower than the role of private savingborrowing That is to be expected given the provisions of the Stability and Growth Pact and the relative sizes of the private and public sectors
16 | Quarterly Report on the Euro Area
changes to its institutional setup towards more integration come into being (25) However shock absorption through fiscal redistribution in a fully-fledged fiscal union such as the US is not more than around 85 of the asymmetric shock (as measured by the rolling end date regressions) even though it has increased since the crisis
Therefore a much bigger part of cross-border risk sharing in the EMU could potentially come through private channels such as integrated capital markets once the Capital Markets Union is in place
I5 Conclusion
The econometric results presented in this section point to the great potential for improvement in smoothing asymmetric shocks in the euro area When comparing the amount of an asymmetric shock that remains unsmoothed by the private and public channels of cross-border risk sharing in the euro area and the US the importance of the recent initiatives to build a Capital Markets Union stand out The significance of factor income flows which include labour compensation and capital income generated across state borders in the US could serve as a model for a euro area where capital markets play an important role in cushioning asymmetric shocks across borders Also the creation of the Single Supervisory Mechanism and other innovations in the regulatory environment in
(25) The level of integration will probably not be of the same
magnitude since it is unlikely that the union between euro area member states will soon be politically and institutionally the same as the one between the 50 US states
the euro area are likely to make risk sharing through credit markets more sustainable going forward
Completion of the European Banking Union by establishing a European Deposit Insurance Scheme (EDIS) will also facilitate risk sharing among Member States The EDIS is expected to increase the cross-border presence of euro area banks by ensuring consistent regulatory treatment regardless of country of operation and will offer protection against country-specific shocks Completing the Banking Union will create conditions for more financial integration which is expected to increase competition among banks and thus lower intermediation costs and further increase cross-border risk sharing
The importance of the public channel of cross-border risk sharing in the euro area on the other hand should be seen in contrast with its role in the US a fully-fledged fiscal union where fiscal redistribution among states has an important role Even though the relative significance of this channel in the US has increased with the crisis taxes grants and fiscal transfers in the 50 states contribute relatively less to smoothing asymmetric shocks than the private channels Therefore policy efforts to achieve a higher degree of private cross-border risk sharing in the euro area especially through capital markets and equity holdings should remain the priority option
I Cross-border risk sharing after asymmetric shocks evidence from the euro area and the United States
Volume 15 No 2 | 17
(Continued on the next page)
Box I1 Empirical methods to estimate relative weights of cross-border risk sharing channels
This box presents the econometric methodology used to estimate the relative importance of the different cross-border risk sharing channels after an asymmetric shock in the euro area and the US
It is important to look at the balancing items in the primary and secondary distribution of income accounts and the use of income account in the European System of National Accounts 2010 (ESA 2010) in order to review the necessary variables for the estimation process Data for Belgium for 2014 can be used as an illustration to arrive at the required several balancing items (1) One channel of risk sharing is the difference between gross domestic product (GDP) and gross national income (GNI) ndash risk sharing through net international factor income The bigger this difference and the lower its correlation over time with GDP the more risk sharing there is through net international factor income In order to come up with this difference mdash EUR 6038 billion in this example mdash one has to add the net of several items For example there is a difference of EUR 5715 billion between compensation of employees paid by employers in Belgium including to workers who take their earnings abroad where they are domiciled and compensation of employees received by workers in Belgium including by workers who work in other countries but bring their earnings back to Belgium where they are domiciled This is a net positive inflow of income from a Belgian perspective Other items that are treated in the same way are production taxes paid (collected) by firms (governments) and subsidies on production earned (distributed) by firms (governments) Any cross-border net inflow here will be due to fewer of these taxes paid by Belgian firms abroad compared to foreign firms in Belgium and more of these subsidies earned by Belgian firms abroad compared to foreign firms in Belgium Finally property income which includes interest for example on debt securities equity dividends reinvested earnings and some other items is treated in the same way For example a net inflow occurs if Belgian citizens receive more dividends from foreign companies than foreigners from Belgian companies
Another channel of risk sharing is through cross-border fiscal redistribution This makes the difference between GNI and gross disposable income (GDI) Here a net inflow in Belgium will occur if social transfers received by Belgian persons and entities from foreign sources outweigh the transfers received by foreigners in Belgium The same will happen if income and wealth taxes paid by foreigners in Belgium are higher than income and wealth taxes paid by Belgians abroad
Finally the difference between GDI and consumption is gross savings through which consumption can be smoothed Borrowings and savings are channelled through domestic and foreign financial intermediaries
At the state level in the US some of these balancing items are not available Specifically state national income and state disposable income are constructed using the method in the Appendix in Asdrubali et al (1996) (2)
Asdrubali et al (1996) propose a series of regressions of these balancing items to estimate the relative
importance of each of the risk sharing channels Starting from the identity = ∙ ∙ ∙ it is
easy to show that a relationship 1 = + + + exists where the beta terms are the estimates of the regression coefficients in ∆ minus ∆ = + ∙ ∆ + ∆ minus ∆ = + ∙ ∆ + ∆ minus ∆ = + ∙ ∆ + ∆ = + ∙ ∆ + The beta terms are interpreted as the relative weights of cross-border risk sharing due to net factor income fiscal transfers savings and borrowings on credit markets The last beta coefficient shows the amount of an asymmetric shock that remains unsmoothed The panel regressions include time fixed effects μ and error terms u
18 | Quarterly Report on the Euro Area
Box (continued)
There are three sets of panels for the euro area EA19 except Malta Cyprus Luxembourg Lithuania Austria and Greece EA12 except Luxembourg Austria and Greece and a set of euro area core and periphery countries (Germany Spain Ireland Netherlands and Portugal) The choice of euro area countries is partly based on data availability in the European System of Accounts 2010 and partly on the option to have a sample that excludes new Member States to be able to measure legacy effects from the closer integration even before the EMU and to have a sample of countries in the EA12 core and periphery which are likely to experience more asymmetries The US sample includes the 50 US states
The time period chosen for the US is between 1964 and a rolling end date from 1990 until 2013 For the three different sets of euro area countries the time period is between 1999 and 2015 The time periods are chosen based on data availability while for the US it extends the period in Asdrubali et al (1996)
The regressions are estimated with 2-step generalised least squares (GLS) correcting for heteroscedasticity and cross-sectional correlation in the case of the euro area and ordinary least squares (OLS) with panel-corrected standard errors in the case of the US The latter method is better suited for panels with larger cross-sections while the former method is better in the opposite case (3) Both estimations include a common AR1 autocorrelation structure within panels The first differences in the quarterly euro area data are in terms of the same quarter of the preceding year The euro area regressions also include a further breakdown of GNI into one corrected only for cross-border labour compensation and one for the other elements of net factor income
Econometric results are in the table below All estimates marked with are statistically significant at the 99 confidence level Z-statistics are in parentheses
Table 1 Regression results
Source US Bureau of Economic Analysis (BEA) US Office of Management and Budget (OMB) US Bureau of Labour Statistics (BLS) US Census Bureau Eurostat DG ECFIN calculations (1) For more information see Box 2 in lsquoCross-border risk sharing has it increased in the euro arearsquo in QREA Vol 6 No3 (2007) (2) Asdrubali F B Sorensen and O Yosha (1996) lsquoChannels of interstate risk sharing United States 1963-1990rsquo The Quarterly Journal
of Economics November (3) These are standard econometric approaches in estimating cross-border risk sharing For a short discussion on the econometrics of
cross-border risk sharing see Hepp R and J von Hagen (2013) lsquoInterstate risk sharing in Germany 1970mdash2006rsquo Oxford Economic Papers Vol 65 No1 pps 1-24
(1) (2) (3) (4)Risk sharing through 2-step GLS 2-step GLS 2-step GLS PC-OLScross-border factor income 00552 00199 00343 04476
(722) (316) (568) (1198)of which cross-border labour compensation 00024 -00015 -00012
(281) (-414) (-282)cross-border fiscal transfers -00007 00156 00257 00832
(-039) (847) (761) (803)credit markets 01815 02459 01800 02668
(1738) (831) (478) (508)unsmoothed 07574 06171 06312 01760
(3784) (2505) (1838) (505)
Countries
Full panel - 13 countries BE
DE EE ES FI FR IE IT LV NL PT
SK SL
Old member states - 9
countries BE DE ES FI FR IE IT
NL PT
Core vs periphery - 5 countries DE ES IE NL PT
50 US states
Period 2000Q4-2015Q4 2000Q4-2015Q4 2000Q4-2015Q4 1964-2013No of observations 793 549 305 2500
II Financial channels and economic activity in the euro area
Volume 15 No 2 | 19
II1 Introduction
Since the global economic and financial crisis the linkages between macroeconomic and financial developments have been on the frontline of both research and policy making The massive dislocations observed during the crisis have forged a broad consensus that shocks originating in the financial sector can have profound effects on real economic activity and vice versa While the effect of macroeconomic developments on financial conditions is rather straightforward (27) the effect of financial developments on the macroeconomy is more complex and was (until recently) largely omitted in mainstream macroeconomic thinking The interest rate was the only financial variable included in standard macroeconomic models and only to the extent that it was assumed to influence the decisions of economic agents while no genuine role was assigned to the financial sector itself In reality financial intermediation is subject to numerous frictions that can affect macroeconomic developments via diverse transmission channels Given the decisive role of bank credit in financing the euro area economy shocks originating in the banking sector are of crucial importance
This section looks at macro-financial linkages in the euro area to shed light on how financial developments may have contributed to disappointing macroeconomic performance in the
(26) This section was prepared by Narcissa Balta and Bořek Vašiacuteček (27) Jacobson T J Linde and K Roszbach (2005) lsquoExploring
interactions between real activity and the financial stancersquo Journal of Financial Stability Vol 1 No 3 pp 308ndash41
recent past The methodology employed for this purpose is a large-scale Bayesian Vector Autoregression (VAR) that encompasses a wide set of macroeconomic and financial variables (28)
Subsection I2 discusses the importance of the financial system for the real economy and briefly reviews the relevant economic literature Subsection I3 describes the main transmission channels from financial markets to the real economy and defines specific variables that could be used to capture these transmission channels in the euro area Subsection I4 presents the results of the empirical analysis particularly some stylised facts on the co-movement between financial variables and economic activity since the crisis
II2 The financial system and the real economy
Market frictions are normally understood as a wide range of different bottlenecks that do not allow markets to efficiently clear demand and supply Financial frictions are impediments to the smooth functioning of the financial market that do not allow funds to be channelled effectively from creditors to borrowers Therefore they play an important role in the way the financial system affects the real economy Moreover the presence of frictions during periods of financial turmoil undermines the effectiveness of monetary policy
(28) Bańbura M D Giannone and M Lenza (2015) lsquoConditional
forecasts and scenario analysis with vector autoregressions for large cross-sectionsrsquo International Journal of Forecasting Vol 31 Issue 3 pp 739ndash756
This section discusses the nexus between financial and macroeconomic developments in the euro area It draws on key lessons from the literature and provides stylised facts on the main transmission channels through which financial developments have affected real economic activity since the crisis Macro-financial linkages are investigated from an empirical perspective for the euro area as a whole by looking at four key channels i) the interest rate channel ii) the borrower balance sheet channel iii) the bank balance sheet channel and iv) the uncertainty channel
Overall the results suggest that financial variables have significant impact on macroeconomic developments but also that the transmission seems to have changed since the crisis Notably the interest rate channel has helped the modest recovery since 2014 by supporting both private and public consumption The positive boost given to favourable financing conditions in 2015 has been somewhat compensating the adverse effects of the borrower balance sheet channel The bank balance sheet channel and the uncertainty channel play a particularly important role in capturing the weakness in the current rebound in investment (26)
20 | Quarterly Report on the Euro Area
transmission and financial sector stability which via feedback effects can have a detrimental impact on macroeconomic developments For instance hikes in bank funding costs when money markets stop functioning are likely to be transmitted to the lending rates applied to consumers which in turn can have a significant drag on both investment and consumption Also financial frictions increase the likelihood of financial shocks occurring both from the demand and the supply side
Financial shocks are usually deemed to be very persistent and have amplification effects in the sense that even small shocks can produce large and long-lasting effects (29) Graph II1 shows a clear negative correlation between GDP growth and financial distress in the euro area as measured by the Composite Indicator of Systemic Stress (CISS) (30)
Graph II1 Real GDP growth vs Composite indicators of systemic stress
(2000Q1-2016Q1)
Source ECB Eurostat
Since the key role of the financial sector consists in funding economic activity new credit is the main channel of transmission between the financial sector and the macroeconomy Financial shocks occurring on the demand side are usually triggered by an impairment of borrowers balance sheets
(29) Brunnermeier M K T Eisenbach and Y Sannikov (2012)
lsquoMacroeconomics with financial frictions A surveyrsquo National Bureau of Economic Research Working Paper No 18102
(30) The CISS measures contemporaneous stress in the financial system It is an aggregate of five market-specific sub-indices More weight is put when stress prevails in several market segments at the same time thus tracking financial stress of systemic nature
Holloacute D M Kremer and M Duca (2012) lsquoCISS-a composite indicator of systemic stress in the financial systemrsquo European Central Bank Working Paper No (No 1426)
which in turn undermines their creditworthiness and their capacity to invest and consume Financial shocks occurring on the supply side (ie those that originate from within the financial sector) normally manifest themselves through tightening of credit conditions andor credit rationing which again impact real economic activity via the investment behaviour of households and non-financial corporations Graph II2 shows the negative correlation between credit standards for firms and real investment (31)
Graph II2 Investment growth vs credit standards for NFC
(2003Q1-2016Q1)
Source ECB BLS Eurostat
Financial frictions have been fully embedded into macroeconomic models only recently
The neglect of financial sector effects in traditional macroeconomic thinking has its foundation in the famous Modigliani-Miller theorem (32) The theorem argues that the way a firm finances its investment (via debt or via equity) has no effect on its value and thus that their investment decisions are driven primarily by macroeconomic conditions (namely the real interest rate) rather than financial market developments However the validity of the theorem hinges on a set of very restrictive assumptions such as perfect information equal tax treatment for debt and equity etc which are generally not met in practice (33) Financial
(31) Credit standards are measured by the backward looking three
months index from ECB Bank Lending Survey (BLS) (32) Modiglini F and M Miller (1958) lsquoThe cost of capital
corporation finance and the theory of investmentrsquo The American Economic Review Vol 48 No 3 pp 261-297
(33) Morley J (2016) lsquoMacro-finance linkagesrsquo Journal of Economic Surveys forthcoming
-8
-6
-4
-2
0
2
4
6
0
10
20
30
40
50
60
70
80
2000Q1 2003Q1 2006Q1 2009Q1 2012Q1 2015Q1
CISS
GDP y-o-y change(rhs)
-15
-10
-5
0
5
10
-10
-5
0
5
10
15
20
25
30
35
40
2003Q1 2005Q1 2007Q1 2009Q1 2011Q1 2013Q1 2015Q1
Change in creditstandards for NFCInvestment y-o-y change (rhs)
II Financial channels and economic activity in the euro area
Volume 15 No 2 | 21
intermediation typically involves asymmetry of information between borrowers and lenders and potentially costly verification of the borrowers financial situation (34)
The first attempts to include financial frictions in macroeconomic models were based on the insight that the cost of external financing very much depends on the borrowers net worth (35) andor the market value of their collateral (36) In fact changes in asset prices turn out to be a crucial determinant of both the cost of external financing and the value of collateral Moreover a relatively small shock can have a major effect on economic activity through the so-called financial accelerator whereby negative feedback loops between lower assets prices restricted access to credit and lower consumption and investment significantly amplify and prolong the impact on the real economy (37) Real estate which is a typical asset used as collateral by both households and firms establishes a tight link between the housing market and the economy as a whole (38)
While the original theoretical contributions did not explicitly model financial intermediaries (assuming direct lending from investors to borrowers) the inclusion of financial intermediaries (ie the banking sector) implies that financial frictions can appear also on the lendersrsquo side (39) Specifically financial intermediaries can become balance sheet constrained in times of economic and financial stress which affects their funding costs Such shocks to the lendersrsquo side are usually mitigated by central bank intermediation during crisis times (40)
(34) Carlstrom C T and T S Fuerst (1997) lsquoAgency costs net worth
and business fluctuations A computable general equilibrium analysisrsquo The American Economic Review Vol 87 No 5 pp 893-910
(35) Bernanke B and M Gertler (1989) lsquoAgency costs net worth and business fluctuationsrsquo The American Economic Review Vol 79 No 1 pp 14-31
(36) Kiyotaki N and J Moore (1997) lsquoCredit cyclesrsquo Journal of Political Economy Vol 105 Issue 2 pp 211-248
(37) Bernanke B S M Gertler and S Gilchrist (1999) lsquoThe financial accelerator in a quantitative business cycle frameworkrsquo Handbook of Macroeconomics Vol 1 Part C pp 1341-1393
(38) Iacoviello M and S Neri (2010) lsquoHousing market spillovers evidence from an estimated DSGE modelrsquo American Economic Journal Macroeconomics Vol 2 No 2 pp 125-164
(39) Gertler M and N Kiyotaki (2010) lsquoFinancial intermediation and credit policy in business cycle analysisrsquo Handbook of Monetary Economics Vol 3 Issue 3 pp 547-599
(40) Gertler M and P Karadi (2011) lsquoA model of unconventional monetary policyrsquo Journal of Monetary Economics Vol 58 Issue 1 pp 17-34
Despite intensive efforts in recent years the financial sector is still not fully established as a consolidated part of conventional macroeconomic models Structural models augmented by a banking sector and financial markets (41) typically find that financial factors such as bank liquidity constraints are indeed the main drivers of economic fluctuations in both the US and the euro area and that they were the main shock propagator during the global financial crisis (42)
Empirical evidence on macro-financial linkages
There is now a wide consensus that financial cycles are crucial for understanding business cycle fluctuations (43) Numerous empirical studies evaluate the effects of financial shocks on macroeconomic fluctuations Importantly financial factors can both reinforce the transmission of other shocks and be a source of disturbance in their own right
Credit appears to be one of the most studied financial variables in empirical studies due to its established regularities in terms of boom-and-bust behaviour and its link to financial crises and economic downturns (44) Credit spreads play an important role for capital markets-based systems like the US economy For example corporate bond spreads usually increase disproportionately during periods of financial stress (so-called excess bond premiums) which in turn causes economic activity to contract (45) In the euro area where external financing is mostly bank based a crucial role is played by bank lending rates and bank lending volumes Credit supply shocks have been identified
(41) Christiano L J R Motto and M Rostagno (2010) lsquoFinancial
factors in economic fluctuationsrsquo European Central Bank Working Paper No 1192
(42) Gerke et al (2013) and Wieland et al (2015) provide detailed comparison exercise for different macrofinancial models
Gerke R M Jonsson M Kliem M Kolasa P Lafourcade A Locarno K Makarski and P McAdam (2013) lsquoAssessing macro-financial linkages A model comparison exercisersquo Economic Modelling Vol 31 pp 253-264
Wieland V E Afanasyeva M Kuete and J Yoo (2015) lsquoNew methods for macro-financial model comparison and policy analysisrsquo mimeo
(43) Borio C (2012) lsquoThe financial cycle and macroeconomics what have we learntrsquo Bank for International Settlements Working Papers No 395
(44) Balke N S (2000) lsquoCredit and economic activity credit regimes and nonlinear propagation of shocksrsquo Review of Economics and Statistics Vol 82 No 2 344-349
(45) Gilchrist S and E Zakrajšek (2012) lsquoCredit spreads and business cycle fluctuationsrsquo The American Economic Review Vol 102 No 4 pp 1692-1720
22 | Quarterly Report on the Euro Area
as important determinants of the increase in lending rates and the decline in lending volumes during the recent crisis (46) Bank lending represents the main transmission mechanism in the euro area
The evidence available indicates that the impact of financial shocks on the macroeconomy is lsquostate dependentrsquo ie the response of economic activity inflation and credit to financial shocks is stronger during periods of stress This is well documented for both the euro area and the US (47) Moreover during periods of high systemic stress financial shocks tend to have both a larger magnitude and a greater impact on real activity (48) Notably a single indicator of systemic stress such as the CISS for the euro area has been found to explain a significant part of macroeconomic developments especially due to episodes of elevated systemic stress such as the global financial crisis and the euro area debt crisis (49)
While studies on financial and business cycle have been popular for some time there has been much less investigation into macro-financial linkages between countries Existing evidence indicates that such linkages exist but their intensity varies both across time and across countries Specifically it has been documented that the observed heterogeneity is mainly due to country-specific characteristics which lead to international spillovers having a differentiated impact across countries (50) Such heterogeneity seems also to be present within the euro area
(46) Moccero D N M D Pariegraves and L Maurin (2014) lsquoFinancial
Conditions Index and identification of Credit Supply Shocks for the Euro Arearsquo International Finance Vol 17 Issue 3 pp 297-321
(47) Hubrich K and R J Tetlow (2015) lsquoFinancial stress and economic dynamics the transmission of crisesrsquo Journal of Monetary Economics Vol 70 pp 100-115
Prieto E S Eickmeier and M Marcellino (2016) lsquoTime variation in macro‐financial linkagesrsquo Journal of Applied Econometrics forthcoming
Silvestrini A and A Zaghini (2015) lsquoFinancial shocks and the real economy in a nonlinear world a survey of the theoretical and empirical literaturersquo Journal of Policy Modeling Vol 37 pp 915ndash929
(48) Hartmann P K Hubrich M Kremer and R J Tetlow (2015) lsquoMelting down Systemic financial instability and the macroeconomyrsquo mimeo
(49) Kremer M (2015) lsquoMacroeconomic effects of financial stress and the role of monetary policy a VAR analysis for the euro arearsquo International Economics and Economic Policy Vol 13 Issue 1 pp 1-34
(50) Ciccarelli M E Ortega and M T Valderrama (2016) lsquoCommonalities and cross-country spillovers in macroeconomic-financial linkagesrsquo The BE Journal of Macroeconomics Vol 16 Issue 1 pp 231-275
II3 Transmission channels from financial to macro developments
In spite of the broad consensus about the existence of macro-financial linkages the identification of the transmission channels is still a subject of debate There are different ways to classify the channels through which the financial sector might affect macroeconomic developments The important distinction applied in this section is whether the linkages are related to the balance sheets of borrowers or lenders At the same time the financial channels are also closely related to monetary transmission which affects their functioning (51) This subsection aims to better define the individual transmission channels in the euro area
The interest rate channel illustrates how money market rates affect the overall financing costs of the banking sector the price of credit and consequently consumption and investment decisions This channel is closely related to monetary policy decisions as they directly affect the funding costs of banks Moreover at the zero lower bound when the central bank uses other instruments besides short-term interest rates to conduct monetary policy this channel is more complex and difficult to assess
Thus in the analysis below the interest rate channel will be captured by variables that are affected by monetary policy decisions (Graph II3) In the euro area the most frequently used indicator directly affected by the ECBrsquos policy rates is the short-term interbank interest rate (EONIA) While the effect of monetary policy actions on short-term rates is rather quick there is also a delayed effect on long-term interest rates The long-term rates are of specific relevance in the current time as short-term rates are at the zero lower bound and monetary policy aims to affect long rates directly While long-term rates are commonly defined by the yield on respective sovereign bonds in the euro area this applies to a pool of euro area sovereigns As the yields diverge across sovereigns since the global financial crisis long-term rates in the euro area have become disconnected from short-term rates Since the ECB has employed diverse unconventional measures that affect the
(51) See for instance Basel Committee on Banking Supervision (2011)
lsquoThe transmission channels between the financial and real sectors a critical survey of the literaturersquo BCBS Working Paper No 18
II Financial channels and economic activity in the euro area
Volume 15 No 2 | 23
financial system additional measures need to be used to track their effect namely the shadow rate which is a factor model-based estimate of the short-term interest rate unconstrained by the ZLB (52) Likewise the excess liquidity defined as the liquidity held by the euro area banking sector in excess of the aggregate needs arising from minimum reserve requirements and autonomous factors is another quantitative-based indicator of the monetary policy stance as it is driven by the ECBrsquos refinancing operations
Graph II3 shows the dynamics of the variables described above in the period Q1-1996 - Q1-2016 which suggest that monetary conditions have been very supportive in recent years While short-term interest rates attained the ZLB monetary easing through unconventional measures is reflected in a significant decline in the shadow rate as well as long-term rates
Graph II3 Interest rate channel (2000Q1-2016Q1 )
Source Eurostat Bloomberg Reserve Bank of New Zealand
The borrower balance sheet channel reflects the fact that it is the net worth of borrowers that determines the external finance premium ie the opportunity cost of borrowing over using internal savings In other words it is the value of borrowersrsquo collateral that affects their credit conditions As indicated above fluctuations in
(52) There different shadow rates available all being subject of
significant model uncertainty The shadow rate used is based on Krippner (2012) and available from the Reserve Bank of New Zealand website
Krippner L (2012) lsquoMeasuring the stance of monetary policy in zero lower bound environmentsrsquo Economics Letters Vol 118 Issue 1 pp 135ndash138
asset prices can affect the ability of non-financial corporations and households to borrow and thus their investment and spending decisions While monetary policy commonly does not target asset prices its actions can affect the valuation of assets used as collateral which affects the credit available for investment and consumption spending (53) Whereas the previous discussion focuses on the demand side of credit the borrower balance sheet channel affects also the supply of credit Namely weak borrower balance sheets might induce credit rationing by the lenders and affect overall credit conditions
The borrower balance sheet channel can be captured mainly by variables that reflect the risks related to the balance sheets of firms and households as borrowers from the banking sector or from capital markets While there are no readily available direct measures of the quality of private balance sheets comparable across countries asset prices can be considered as indicative of their quality as they give the value of collateral for loans and of equity Therefore house prices and stock prices are generally used in the analysis to track this channel
Graph II4 Borrower balance sheet channel
(2000Q1-2016Q1)
Source Bloomberg BIS
Graph II4 suggests that developments in house prices and stock prices have been quite
(53) There is empirical evidence especially for the US stressing the
importance of asset prices and different credit spreads as leading indicator of economic activity eg Stock and Watson (2003) Stock J H and M W Watson (2003) lsquoForecasting output and inflation the role of asset pricesrsquo Journal of Economic Literature Vol 41 No 3 pp 788-829
-10
-5
0
5
10
15
20
25
2000Q1 2004Q1 2008Q1 2012Q1 2016Q1
Short-term interest rateLong-term interest rateShadow rate (Krippner)ECB Excess Liquidity Index
-6
-4
-2
0
2
4
6
8
10
-60
-40
-20
0
20
40
60
2000Q1 2002Q3 2005Q1 2007Q3 2010Q1 2012Q3 2015Q1
MSCI EURO Index y-o-y change
Housing prices y-o-y change
24 | Quarterly Report on the Euro Area
disconnected in recent years Specifically while house prices only started to recover in 2014 stock prices peaked in early 2015 and experienced a downward correction since then
The bank balance sheet channel relates to the fact that how much a bank lends depends on its own balance sheet and the different risks involved in its business model External developments (including monetary policy actions but also longer-term factors such as financial regulation and innovations in the banking sector) may affect bank liabilities (the supply of loanable funds and also bank funding costs) and in turn assets (supply of credit and the lending cost) (54) Bank lending is determined by banksrsquo business models it usually increases with the increase in leverage in the economy while deleveraging episodes may significantly hamper lending activities This makes leverage highly pro-cyclical (55) Importantly the impact of bank balance sheets on the real economy can be more pronounced in the euro area than in capital-market based systems as alternative forms of financing are relatively undeveloped
The bank balance sheet channel can thus be illustrated by variables such as banking leverage the stock of non-performing loans banksrsquo funding costs or the price of Credit Default Swaps (CDS) However reliable data for the euro area are relatively short available only for the period since the beginning of the crisis Indeed the lack of knowledge about the quality of bank balance sheets was an important aspect of the euro area financial crisis and a reason for the implementation of the Asset Quality Review (AQR) by the ECB in 2014 Therefore for the analysis in this section measures which directly track the supply of credit have been used instead (56) Namely the flow of credit as measured by the credit impulse (ie the change in new credit granted by the banking sector as a percentage of GDP) the stock of credit on banksrsquo balance sheet as measured by total economy credit as a percentage of GDP and the price of credit as measured by the Composite Financing Conditions Indicator (CFCI) for non-financial corporations
(54) Bernanke B and A Blinder (1988) lsquoCredit money and aggregate
demandrsquo the American Economic Review Vol78 No 2 pp 435ndash439 (55) Adrian T and H S Shin (2010) lsquoLiquidity and leveragersquo Journal of
Financial Intermediation Vol 19 Issue 3 pp 418-437 (56) In practice the lending volumes and rates can be affected both by
supply and demand side
which (assuming a constant mark-up) proxies bank funding costs (57)
Graph II5 shows that there is a negative correlation between the credit impulse and credit as a percentage of GDP Thus during downturns the flow of new credit declines while the ratio of credit to GDP increases due to the collapse of GDP The credit impulse indicator shows that the supply of new credit has been fairly limited since the onset of the global financial crisis The CFCI tracks the ECB policy rates rather closely with the exception of the euro area sovereign debt crisis episode (2011-2012) when financing costs increased due to idiosyncratic increases in some Member States reflecting financial market fragmentation
Graph II5 Bank balance sheet channel (2000Q1-2016Q1)
Source Capital Economics BIS DG ECFIN
While the previous channels are related to the quality of balance sheets either on the borrower or the lender side some shocks can originate in the overall financial system Examples are liquidity shocks or confidence shocks These shocks work both via the balance sheets but also by directly altering agents decisions through precautionary motives affecting both investment and consumption behaviour These mechanisms are defined as the uncertainty channel (58)
(57) For more details on CFCI calculations see European Commission
(2013) Drivers of diverging financing conditions across Member States Quarterly Report on the Euro Area Vol12 No1
(58) Bloom (2009) point to uncertainty shocks (that might be related but also unrelated to the financial system) as a crucial driver of economic dynamics Recently Caldara et al (2016) argue for the needs to distinguish uncertainty shocks from financial shocks while both of them are important source of macroeconomic
-8
-6
-4
-2
0
2
4
6
8
10
2000Q1 2003Q1 2006Q1 2009Q1 2012Q1 2015Q1
Total credit on GDP y-o-y change
Credit impulse (new crediton GDP y-o-y change)
Composite financingconditions indicator
II Financial channels and economic activity in the euro area
Volume 15 No 2 | 25
The uncertainty channel is captured by variables reflecting the different types of uncertainty that can affect the economy One type is commonly related to increased volatility in financial markets Given a high degree of global interconnectedness the euro area economy can be affected by uncertainty related to global financial developments which is usually measured by the implied volatility of SampP 500 index options (VIX) (59) The euro area specific stress in the financial system is measured through the ECBrsquos Composite Indicator of Systemic Stress (CISS)
Another type of uncertainty is linked to swings in business and consumer confidence Variations in the confidence of euro area households and non-financial firms are illustrated through the European Commissionrsquo confidence indicator the Economic Sentiment Indicator (ESI) which is based on data collected through business and consumer surveys However the indicator exhibits a very high contemporaneous correlation with actual GDP growth indicating that its dynamics are likely to reflect very accurately economic conditions rather than information related to exogenous changes in confidence
Finally unexpected outcomes of economic policy decisions can lead to policy uncertainty which in turn can have adverse effects on the savings and investment behaviour of firms and households Policy uncertainty is illustrated through an indicator based on newspaper coverage of uncertainty-generating events (60)
Graph II6 indicates that there is an apparent co-movement among these indicators even if they measure different types of uncertainty While economic sentiment has been gradually improving and uncertainty related to financial markets has eased the policy uncertainty affecting the euro area is still relatively high
fluctuations separately the Great Recession was likely outcome of the toxic interaction between the two
Bloom N (2009) lsquoThe impact of uncertainty shocksrsquo Econometrica Vol 77 Issue 3 pp 623-685
Caldara D C Fuentes-Albero S Gilchrist and E Zakrajšek (2014) lsquoThe macroeconomic impact of financial and uncertainty shocksrsquo European Economic Review forthcoming
(59) The VIX is calculated by the Chicago Board Options Exchange (CBOE)
(60) Baker S R N Bloom and S J Davis (2015) lsquoMeasuring economic policy uncertaintyrsquo National Bureau of Economic Research Working Paper No 21633 Data source wwwpolicyuncertaintycom
Graph II6 Uncertainty channel (2000Q1-2016Q1)
Source Chicago Board of Exchange ECB wwwpolicyuncertaintyorg
II4 Financial developments and economic activity
This sub-section provides stylised facts on the transmission channels defined above and show whether and how financial developments have affected the real side of the euro area economy since the crisis (namely consumption investment unemployment and long-term interest rates)
While financial variables are available in real time macroeconomic variables are normally released with lags Therefore conditioning macroeconomic forecasts on observed financial developments (ie a projection of macro variables on the observed paths of financial variables) can improve forecasts as more informative data are taken into account Several empirical studies have shown that financial variables can improve macroeconomic forecasts (61)
The methodology underlying this this section is a large-scale Bayesian VAR with 35 macroeconomic
(61) Stock and Watson (2003) provide a seminar contribution on the
role of financial variables namely asset prices for GDP and inflation forecast concluding that different financial variables allow macroeconomic forecasting in different times Espinosa et al (2012) document using standard VAR approach that financial variables improve GDP forecast for the euro area especially in the real time when numerous financial variables are available ahead of the macroeconomic releases
Stock J H and M W Watson (2003) lsquoForecasting output and inflation the role of asset pricesrsquo Journal of Economic Literature Vol 41 No 3 pp 788-829
Espinoza R F Fornari and M J Lombardi (2012) lsquoThe role of financial variables in predicting economic activityrsquo Journal of Forecasting Vol 31 No 1 pp 15-46
0
50
100
150
200
250
300
0
10
20
30
40
50
60
70
80
2000Q1 2002Q3 2005Q1 2007Q3 2010Q1 2012Q3 2015Q1
VIX
CISS
ESI (rhs)
Policy uncertainty (rhs)
26 | Quarterly Report on the Euro Area
and financial variables (62) The model is estimated for the sub-period Q1-2000 - Q4-2011 which covers both normal and crisis times but does not include some of the most important unconventional monetary policy measures Given the estimated past correlations a counterfactual path for the macroeconomic and financial variables (ie a distribution of conditional forecasts) can be obtained for the entire period Q1-2000 - Q4-2015 conditional on observed real GDP and inflation in the baseline case The deviations of the observed developments of financial variables from this counterfactual path can be interpreted as evidence of instability in the relationship between financial variables and economic activity (as measured by GDP growth and inflation) since the crisis
Subsequently the conditional set from the baseline case (including only real GDP and inflation) is extended by financial and uncertainty variables corresponding to each transmission channel described above (63)
Some recent developments are puzzling
Graph II7 shows the counterfactual paths of the main GDP components producer prices the unemployment rate and the long-term interest rate conditional on observed economic activity (real GDP and inflation) It also shows the conditional forecasts for the balance sheet variables of households and firms when only real GDP and inflation are taken into account in the conditioning set
(62) Alternative strand of literature using rich set of data in order to
nowcast or forecast employs dynamic factors models where data dimension is reduced in a first step by factor estimation with common factors being consequently used in the forecasting exercize see eg Giannone et al (2008) Bellego and Ferrara (2012) find using factor-augmented probit model that financial variables allow tracking better recession periods in the euro area (in the pre-crisis period) with optimal lead of financial variables over recession of around one year
Giannone D L Reichlin L and D Small (2008) lsquoNowcasting the real-time informational content of macroeconomic datarsquo Journal of Monetary Economics Vol 55 Issue 4 pp 665ndash676
Belleacutego C and L Ferrara (2012) lsquoMacro-financial linkages and business cycles A factor-augmented probit approachrsquo Economic Modelling Vol 29 pp 1793-1797
(63) For more details on the methodology see Box IV1 in European Commission (2015) lsquoInvestment dynamics in the euro area since the crisisrsquo Quarterly Report on the Euro Area Vol 14 No 1 pp 35-43
Bańbura M D Giannone and M Lenza (2015) lsquoConditional forecasts and scenario analysis with vector autoregressions for large cross-sectionsrsquo International Journal of Forecasting Vol 31 Issue 3 pp 739ndash756
The results suggest that private consumption was unusually low during the period of the euro area debt crisis and deleveraging (2012-2013) while it overshot during the recent recovery (from 2014 onward) Investment behaved in line with historical correlations during both downturn episodes (2008-2009 and 2012-2013) and was weak during the deleveraging phase because overall output growth was weak However its recent recovery (since 2014) has been more subdued than what the pace of economic activity would have predicted the observed investment path is positioned on the lower tail of the distribution of conditional forecasts) (64)
Large deleveraging pressures in the public sector have led to a significant decline in the euro area aggregate government consumption over the period 2011-2012 However this decline had almost been reversed by the end of 2014 with public consumption starting to overshoot from 2015 onwards (relative to its counterfactual path obtained through conditioning on output growth) reflecting the aggregate euro area fiscal stance which started to turn mildly expansionary
Moreover the results show that several variables capturing price and balance sheet developments are still at odds with historical patterns In particular producer prices house prices long-term interest rates and loans to firms and households undershoot the distribution of the conditional forecasts On one side this underlines that the recent recovery is characterized by a historically low inflation environment and loose monetary conditions pushing the long-term rates down On the other side the ongoing balance sheet adjustment is translating into very weak credit dynamics due to unprecedented deleveraging pressures
Graph II8 illustrates the zero lower bound constraint on monetary policy rates and the subsequent break in the correlation of economic activity with the two measures of monetary policy
(64) There is some relative instability in the estimated correlations over
the sample period notably pre-crisis vs crisis years However it does not significantly affect the result on the unusual weakness in investment recovery since 2014 The article lsquoInvestment dynamics in the euro area since the crisisrsquo Quarterly Report on the Euro Area Vol 14 No 1 pp 35-43 found that estimating the past correlations only with the sample for the pre-crisis period the amplitude of the investment fall during the first downturn (2008-2009) would also be slightly underestimated by the conditional forecasts
II Financial channels and economic activity in the euro area
Volume 15 No 2 | 27
rates since 2012 Among all variables the consumer and business confidence indicator (ESI) comes out as having the strongest contemporaneous correlation with economic activity during the crisis
In the consecutive analysis the conditioning dataset (including only real GDP and inflation in the baseline) is augmented by financial variables corresponding to each transmission channel
hellip different channels play an important role at different stages since the crisis
The interest rate channel (Graph II9 upper panel) seems to better account for the pattern of consumption during the recent recovery (compared to the baseline) This channel which reflects mainly monetary conditions suggests that monetary easing implemented since 2014 by means of additional unconventional measures (namely the targeted long-term refinancing operations (TLTRO) the asset-backed securities purchasing program (ABSPP) and the forthcoming public
securities purchase program (PSPP)) have translated into a further decline in the long-term interest rate and the shadow policy rate It also reflects an increase in excess liquidity which has had a very benign effect on the recent recovery However producer prices developments (PPI) still appear unusually subdued Likewise including information capturing the interest rate channel does not help explain the dismal performance of consumption during the deleveraging phase (2012-2013) or the persistent weakness of credit dynamics Therefore these developments seem to be determined also by drivers other than monetary conditions
The borrowers balance sheet channel (Graph II9 lower panel) captures in turn the exceptional deleveraging developments of 20122013 but clearly underestimates the pace of the recent recovery This finding suggests that strained balance sheets of households and firms represented the main weight on the recovery at the time of euro area sovereign debt crisis However whereas a mild recovery started in the euro area in 2014 private
Graph II7 Conditional forecasts based on real GDP and inflation (1) (2000Q1-2015Q4 y-o-y growth)
Misalignments of financial and real variables with output growth since the crisis
(1) Shades of orange distribution of the conditional forecasts in the BVAR in levels excluding the lower and higher 5 quantiles Green line actual values The variables are all reported in terms of annual percentage changes except for the unemployment rate and the long-term interest rate which are in levels Conditioning assumptions real GDP and HICP Source DG ECFIN MATLAB codes replication files of the methodological paper (Banbura et al 2015)
Government consumption
2005 2010 2015-2
0
2
4Real consumption
2005 2010 2015-5
0
5Real investment
2005 2010 2015-20
-10
0
10
Unemployment rate
2005 2010 20150
5
10
15PPI ex const
2005 2010 2015-50
0
50House prices
2005 2010 2015-10
0
10
Long-term i r
2005 2010 20150
5
10Loans to firms
2005 2010 2015-10
0
10
20Loans to households
2005 2010 2015-5
0
5
10
28 | Quarterly Report on the Euro Area
balance sheets still did not improve much In fact when the borrower balance sheet channel is taken into account observed consumption overshoots the conditional forecast even by a higher margin than in the baseline scenario and real investment seems to be on the upper side as well This suggests that the borrower balance sheet channel should have led to more subdued dynamics of both consumption and investment than what has been observed in 2014 and 2015 indicating that other channels have been somewhat compensating the adverse effects of this channel
The bank balance sheet channel (Graph II10 upper panel) improves the forecast of investment since 2014 and reduces the uncertainty around the median for some variables such as consumption unemployment and long-term interest rate The good fit of investment dynamics indicates a strong correlation of investment with total economy credit developments both in terms of flows and stocks
Interestingly the bank balance sheet information namely the total economy credit as percentage of GDP (including credit to public sector) the private sector credit impulse and the price of credit for the private sector cannot capture the weak observed dynamics of outstanding loans to firms and households This shows that the private deleveraging process has been much stronger than the public sector deleveraging making private credit developments disconnected from GDP
growth (65) Therefore while the recovery in real activity has been rather weak the private credit dynamics have been even weaker Furthermore the modest recovery does not facilitate passive deleveraging (a decrease in the relative debt burden due to a growing economy ie denominator effect) and feeds the active deleveraging (a decrease of absolute level of debt ie nominator effect)
Finally the current long-term interest rate seems very low even when the financing costs for non-financial corporations (which also attained historical minima) are taken into account This underlines the importance of the ECBrsquos measures that imply very easy financing conditions in the foreseeable future
Last but not least the uncertainty channel (Graph II10) seems to improve the conditional forecast over the baseline in the same spirit as the bank balance sheet channel For example there is a good fit of investment indicating a strong correlation of investment with confidence and financial stress measures Equally the rebound in private consumption seems to be well captured by the uncertainty channel indicating that the recent decrease in financial markets stress has also been an important driver for consumption However in general the uncertainty channel is likely to be implicitly included in the bank balance sheet
(65) GDP is a denominator of the credit indicators in bank balance
sheet channel
Graph II8 Conditional forecasts based on real GDP and inflation (1) (2000Q1-2015Q4 y-o-y growth)
Business and consumer confidence and short-term interest rates
(1) Shades of orange distribution of the conditional forecasts in the BVAR in levels excluding the lower and higher 5 quantiles Green line actual values The variables are all reported in terms of annual percentage changes except for the unemployment rate and the long-term interest rate which are in levels Conditioning assumptions real GDP and HICP Source DG ECFIN MATLAB codes replication files of the methodological paper (Banbura et al 2015)
Economic sentiment
2005 2010 2015-15
-10
-5
0
5
10Short-term i r
2005 2010 2015-4
-2
0
2
4
6
8Shadow short-term interest rate
2005 2010 2015-6
-4
-2
0
2
4
6
II Financial channels and economic activity in the euro area
Volume 15 No 2 | 29
channel For example in periods of high uncertainty bank funding costs increase (bank balance sheet channel) and firms with weaker balance sheets cannot obtain credit for new loans (borrower balance sheet channel)
Overall the findings above suggest that while there is clear evidence of the transmission of monetary policy measures on financial variables and from financial variables to consumer lending rates the evidence on the effects on real activity is more complex with different channels playing an important role at different stages of the crisis The interest rate channel has helped the modest recovery since 2014 by supporting both public and private consumption growth and by partially compensating the balance sheet channel for both borrowers and banks The results in Graph II9 (lower panel) can be interpreted as showing that in the absence of massive monetary easing given the high level of debt in the economy and the wealth effects associated with house and asset prices decreases both private and public consumption growth could have been much more subdued than what it is currently observed
Graph II10 (both panels) illustrate the importance of the bank balance sheet and the uncertainty channel for capturing investment dynamics Weak investment growth is well captured both by credit developments as captured through the bank balance sheet channel and confidence effects through the uncertainty channel Real economic activity as measured by GDP growth while playing an important role does not seem to fully explain the subdued growth in investment since 2014 (Graph II7)
II5 Conclusions
The section discusses the nexus between financial and macroeconomic developments drawing some
lessons from the literature and providing some stylised facts on the main transmission channels through which financial developments have affected real economic activity since the crisis
While there is clear evidence of the transmission of monetary policy measures on financial variables and from financial variables to consumer lending rates the evidence on the effects on real activity is more complex with different channels playing an important role at different stages of the crisis
The state of private balance sheets seems to have significantly contributed to the poor performance of consumption during the euro area debt crisis and high debt levels still weigh on growth However given the still high level of debt the current mild recovery should be seen as a rather positive outcome The analysis suggests that easy monetary conditions seem to represent an important driver of the current recovery Another driver seems to be the balance sheets of banks which have gradually improved and allow better transmission of easy monetary conditions to the lending rates
Given the still high levels of debt in the economy and the wealth and confidence effects associated with house and asset prices corrections both private and public consumption growth could have been much more subdued than what it is currently observed were it not for the exceptional easing of monetary conditions
Unfortunately the recovery is still not strong enough to facilitate the deleveraging process The stock of debt and the ongoing deleveraging combined with adverse confidence effects still represent major impediments for a stronger recovery in investment Consequently there is a need to implement policy measures that allow dealing effectively with the debt overhang notably an effective framework for non-performing loans resolution
30 | Quarterly Report on the Euro Area
Graph II9 Conditional forecasts based on variables capturing the interest rate channel and borrower balance sheet channel (1)
(2000Q1-2015Q4 y-o-y growth)
Interest rate channel
Borrower balance sheet channel
(1) Shades of orange distribution of the conditional forecasts in the BVAR in levels excluding the lower and higher 5 quantiles Green line actual values The variables are all reported in terms of annual percentage changes except for the unemployment rate and the long-term interest rate which are in levels Conditioning assumptions interest rate channel ESI HICP the short-term interest rate the long-term interest rate the shadow interest rate and the ECB excess liquidity measure Conditioning assumptions borrower balance sheet channel ESI HICP house prices stock prices and outstanding loans to households and firms Due to the high contemporaneous correlation between real GDP growth and the ESI indicator the ESI indicator contains the same forecasting information as real GDP ESI indicator is used in the conditioning set instead of real GDP variable in order to also illustrate conditional forecasts for real GDP Source DG ECFIN MATLAB codes replication files of the methodological paper (Banbura et al2015)
Real GDP
2005 2010 2015-10
-5
0
5Government consumption
2005 2010 2015-2
0
2
4Real consumption
2005 2010 2015-5
0
5
Real investment
2005 2010 2015-20
-10
0
10Unemployment rate
2005 2010 20150
10
20PPI ex const
2005 2010 2015-50
0
50
House prices
2005 2010 2015-10
0
10
20Loans to firms
2005 2010 2015-10
0
10
20Loans to households
2005 2010 2015-10
0
10
20
Real GDP
2005 2010 2015-10
-5
0
5Government consumption
2005 2010 2015-2
0
2
4Real consumption
2005 2010 2015-5
0
5
Real investment
2005 2010 2015-20
-10
0
10Unemployment rate
2005 2010 20150
5
10
15PPI ex const
2005 2010 2015-50
0
50
Shadow short-term interest rate
2005 2010 2015-5
0
5
10Short-term i r
2005 2010 2015-5
0
5
10Long-term i r
2005 2010 20150
5
10
II Financial channels and economic activity in the euro area
Volume 15 No 2 | 31
Graph II10 Conditional forecasts based on variables capturing the bank balance sheet channel and uncertainty channel (1)
(2000Q1-2015Q4 y-o-y growth) Bank balance sheet channel
Uncertainty channel
(1) Shades of orange distribution of the conditional forecasts in the BVAR in levels excluding the lower and higher 5 quantiles Solid black line point estimate of the conditional forecasts in the BVAR in differences which is computed as the median of the distribution of the conditional forecasts in this model Green line with crosses actual values The variables are all reported in terms of annual percentage changes except for the unemployment rate and the long-term interest rate which are in levels Conditioning assumptions for the bank balance sheet channel ESI HICP the credit impulse the private credit volumes (debt-to-GDP ratio) and bank lending rates for households and firms (CFCI) Conditioning assumptions uncertainty channel ESI HICP the policy uncertainty indicator the CISS and the VIX Due to the high contemporaneous correlation between real GDP growth and the ESI indicator the ESI indicator contains the same forecasting information as real GDP ESI indicator is used in the conditioning set instead of real GDP variable in order to also illustrate conditional forecasts for real GDP Source DG ECFIN MATLAB codes replication files of the methodological paper (Banbura et al 2015)
Real GDP
2005 2010 2015-10
-5
0
5Government consumption
2005 2010 2015-2
0
2
4Real consumption
2005 2010 2015-2
0
2
4
Real investment
2005 2010 2015-20
-10
0
10Unemployment rate
2005 2010 20150
5
10
15PPI ex const
2005 2010 2015-50
0
50
Loans to firms
2005 2010 2015-10
0
10
20Loans to households
2005 2010 2015-10
0
10
20Long-term i r
2005 2010 20150
2
4
6
Real GDP
2005 2010 2015-10
0
10Government consumption
2005 2010 2015-2
0
2
4Real consumption
2005 2010 2015-5
0
5
Real investment
2005 2010 2015-20
0
20Unemployment rate
2005 2010 20150
5
10
15PPI ex const
2005 2010 2015-50
0
50
Loans to firms
2005 2010 2015-10
0
10
20Loans to households
2005 2010 2015-10
0
10
20Long-term i r
2005 2010 20150
5
10
III Confidence spillovers in the euro area
Volume 15 No 2 | 33
III1 Introduction
During the recent crisis euro area private consumption fell substantially This was accompanied by a sharp decline in consumer confidence which many observers have identified as a key factor contributing to the persistence of the slowdown In fact the onset of the crisis coincided with an abrupt unwinding of imbalances that is of economic trends that turned out to be unsustainable and which led to a significant adjustment of expectations Both consumption growth rates and confidence levels have been improving since the start of 2013
There is some (mixed) evidence to suggest that fluctuations in consumer confidence affect the dynamics of private consumption (67) On the basis of this assumption and taking into account the unprecedented extent of the most recent crisis it is important to determine whether and to what extent confidence shocks spill over between countries This is particularly relevant in relation to the euro area where close trade and financial links and common institutional features can lead to the rapid propagation of shocks In addition confidence spillovers can be an important aspect to consider when discussing how to improve macroeconomic policymaking in a common currency area
This section reviews the evidence on the link between consumer confidence and private consumption and on cross-border confidence spillovers and presents some analysis of the transmission of confidence shocks across the euro area It is a follow-up to analysis discussed in
(66) This section was prepared by Francesca DrsquoAuria (67) See for a discussion Ludvigson SC 2004 lsquoConsumer
confidence and consumer spendingrsquo Journal of Economic Perspectives Vol 18(2) pp 29-50
previous issues of the Quarterly Report on the Euro Area (QREA) (68)
III2 Recent trends in consumer confidence and private consumption in the euro area
Graph III1 shows the evolution over the period 1995Q2-2016Q1 of euro area real private consumption and consumer confidence The latter is measured by the Consumer Confidence Indicator constructed by the European Commission as part of the Joint Harmonised EU Programme of Business and Consumer Surveys (BCS) (69)
There is close co-movement between the two variables Both real consumption growth and consumer confidence showed the greatest deterioration in the first quarter of 2009 and during the sovereign debt crisis They have been on a recovery path since early 2013 with consumer confidence reaching levels above the euro area long-term average since the first quarter of 2014
The relationship between consumer confidence and private consumption is much debated in the literature From a theoretical perspective there are two main competing theories One view is that confidence indicators can help predict the dynamics of consumption as they convey information about future economic conditions Another theory is that the link between the two variables can be interpreted in terms of lsquoanimal
(68) DrsquoAuria F lsquoCross-border spillovers in confidencersquo Quarterly
Report on the Euro Area (2013) Vol 12(3) pp26-30 DrsquoAuria F S Linden D Monteiro J in lsquot Veld and S Zeugner
lsquoCross-border spillovers in the euro arearsquo Quarterly Report on the Euro Area (2014) Vol 13(4) pp7-22
(69) See European Commission (2016) lsquoA user guide to the Joint Harmonised EU Programme of Business and Consumer Surveysrsquo for details on the construction of the indicators
In recent years there has been close co-movement between consumer confidence and private consumption in the euro area During the crisis in particular consumer confidence was identified by many commentators as a driving factor in its persistence as expectations about a sustainable path of economic growth were adjusted significantly In view of the unprecedented extent of the crisis the question of whether and to what extent changes in consumer confidence in one country could spill over to other countries was also raised This section discusses the relationship between consumer confidence and consumption and reviews the evidence of consumer confidence spillovers between euro area countries We conclude that there is some evidence to suggest that confidence shocks are transmitted between countries This conclusion is corroborated by results from the estimation of a Global Vector Autoregressive (GVAR) model for a number of euro area countries (66)
34 | Quarterly Report on the Euro Area
spiritsrsquo as confidence indicators capture fluctuations in beliefs which in turn affect consumption (70) In both cases the essence of confidence indicators is to gauge expectations ndash irrespective of how they are formed ndash about the future course of the economy which then have a knock-on effect on current consumer behaviour
Graph III1 Confidence and private consumption euro area
(1995Q2-2016Q1 q-o-q change)
Source Eurostat and DG ECFIN calculations based on EU Business and Consumer Surveys
Several studies test empirically the link between consumer confidence and private consumption A number of them find evidence in support of a strong correlation between consumer confidence and consumption (71)
However as confidence and consumption are to a large extent determined by the same factors other studies try to assess whether confidence indicators carry information beyond economic fundamentals The evidence on this issue is mixed although several studies conclude that confidence indicators play a significant role There is some evidence to suggest that while part of the information conveyed by confidence indicators is also captured by other variables (eg past consumption income and interest rates) confidence measures have an additional predictive power for the future path of
(70) See Barsky and Sims (2012) for a discussion of the different
theoretical approaches to the role of confidence Barsky R B and ER Sims (2012) lsquoInformation animal spirits and the meaning of innovations in consumer confidencersquo American Economic Review 102(4) pp 1343-1377
(71) See for example Carroll C J Fuhrer and D Wilcox (1994) lsquoDoes consumer sentiment forecast household spending If so whyrsquo American Economic Review Vol 84 pp 1397-1408
consumer spending (72) Moreover some papers find that confidence indicators have a stronger predictive power during periods of large economic fluctuations (73)
III3 The existing evidence on confidence spillovers
On the assumption that a causal relationship between consumer confidence and private consumption exists it is important to determine whether and to what extent changes in consumer confidence in one country affect confidence (and thus consumption) in others
There is some evidence to support the existence of confidence spillovers This pertains both to confidence shocks originating in the US and being transmitted to the euro area and shocks which occur in one euro area country and spill over to other euro area countries
Several studies provide evidence of a transmission channel of confidence shock to foreign confidence In particular evidence for G7 countries and Spain would suggest that variations in confidence generally spill over from large countries to smaller ones (74) Some studies support the idea that confidence shocks originating in US are transmitted to the euro area but not the other way round ie shocks to euro area confidence do not affect confidence in the US (75) Other studies show a transmission channel for confidence shocks
(72) Some authors eg Ludvigson (2004) Souleles (2004) and Lahiri
Monokroussos and Zhao (2016) conclude that including confidence indicators can reduce forecasting errors when predicting the dynamics of consumption while others reach the opposite conclusion (eg Claveria Pons and Ramos 2007)
Ludvigson S (2004) lsquoConsumer confidence and consumer spendingrsquo Journal of Economic Perspectives Vol 18(2) pp 29-50
Souleles NS (2004) lsquoExpectations heterogenous forecast errors and consumption Micro evidence from the Michigan Consumer Sentiment Surveysrsquo Journal of Money Credit and Banking Vol 36 pp 39-72
Lahiri K G Monokroussos and Y Zhao (2016) lsquoForecasting consumption the role of consumer confidence in real time with many predictorsrsquo Journal of Applied Econometrics forthcoming
Claveria O E Pons and R Ramos (2007) lsquoBusiness and consumer expectations and macroeconomic forecastsrsquo International Journal of Forecasting Vol 23 pp47-69
(73) For example Howrey E (2001) lsquoThe predictive power of the index of consumer sentimentrsquo Brookings Papers on Economic Activity Vol 1 pp 175-216
(74) Fei S (2011) lsquoThe confidence channel for the transmission of shocksrsquo Banque de France Working Paper No 314
(75) Deacutees S and P Soares-Brinca (2013) lsquoConsumer confidence as a predictor of consumption spending Evidence for the United States and the Euro Arearsquo International Economics Vol 134 pp 1-14
-40
-30
-20
-10
0
10
1995Q2 1998Q2 2001Q2 2004Q2 2007Q2 2010Q2 2013Q2-08
-04
00
04
08
12
16Consumption (rhs)Consumer Confidence Indicator
III Confidence spillovers in the euro area
Volume 15 No 2 | 35
(Continued on the next page)
Box III1 A GVAR model to assess confidence spillovers
The Global Vector Autoregressive (GVAR) methodology developed by Pesaran Schuermann and Weiner (2004) (1) combines individual vector error-correcting models where domestic variables are linked to country-specific foreign variables The latter combine the domestic variables using international trade financial or other relevant weights for each country This approach allows the analysis of interdependence across different economies providing a solution to the lsquocurse of dimensionalityrsquo (eg the high number of parameters as the dimension of the model increases) in global modelling
For a set of countries i=0 1 2 hellip N the individual VARX(pi qi) models take the following form
itqtiiqtiiitiiptiiptiiit uxxxxxxii
+Λ++Λ+Λ+Φ++Φ= minusminusminusminus
11
011
where xit is a vector of ki x 1 vector of domestic variables xit a ki x 1 vector of foreign variables and
00
===
iijt
N
jijit xx ωω
where ωij j=01hellipN is a set of weights such that 10
==
N
jijω The foreign variables xit are therefore a
weighted average of domestic variables for all countries included in the model The weights can be different in nature but are typically constructed using trade or capital flows data The GVAR model is then solved for the lsquoworldrsquo (ie all countries included in the model) as a whole considering all variables as endogenous to the system
The GVAR model has been applied to a variety of issues These include forecasting (eg Pesaran Schuermann and Smith 2009) credit risk (eg Pesaran Schuermann and Treutler 2007) oil price shocks (eg Galesi and Lombardi 2009) global imbalances (eg Bussiegravere Chudik and Sestieri 2012) business cycle synchronisation (eg Dreger and Zhang 2013) the impact of EU membership (eg Pesaran Smith and Smith 2007) the international effects of fiscal policy shocks (eg Favero Giavazzi and Perego 2011) (2) Chudik and Pesaran (2014) provide a detailed review of these and other recent applications (3)
In this section this approach is used to analyse the transmission of country-specific and global consumer confidence shocks in a model which includes eight euro area countries (Austria Belgium Finland France Germany Italy the Netherlands and Spain) using quarterly data over the period 1996Q2-2013Q1 The model is solved using the GVAR Toolbox developed by Smith and Galesi (2014) (4)
(1) Pesaran MH Schuermann T and Weiner S M (2004) lsquoModelling regional interdependencies using a global error-correcting
modelrsquo Journal of Business and Economic Statistics Vol 22 pp 129-162 (2) Pesaran M H Schuermann T and Smith LV (2009) lsquoForecasting economic and financial variables with global VARsrsquo
International Journal of Forecasting Vol 25(4) pp 642-675 Pesaran MH Schuermann T and Treutler B-J (2007) lsquoGlobal business cycles and credit riskrsquo in The Risks of Financial Institutions NBER Chapters pp 419-474 Bussiegravere M Chudik A and Sestieri G (2012) lsquoModelling global trade flows results from a GVAR modelrsquo Globalization and Monetary Policy Institute Working Paper 119 Federal Reserve Bank of Dallas Dreger C and Zhang Y (2013) lsquoDoes the economic integration of China affect growth and inflation in industrial countriesrsquo FIW Working Paper series 116 FIW Pesaran M H Smith L V and Smith R P (2007) lsquoWhat if the UK or Sweden had joined the euro in 1999 An empirical evaluation using a Global VARrsquo International Journal of Finance and Economics Vol 12(1) pp 55-87 Favero C Giavazzi F and Perego F (2011) lsquoCountry heterogeneity and the international evidence on the effects of fiscal policyrsquo IMF Economic Review 59(4) 652-682
(3) Chudik A and Pesaran MH (2014) lsquoTheory and Practice of GVAR Modelingrsquo Federal Reserve Bank of Dallas Globalization and Monetary Policy Institute Working Paper No 180
(4) Smith LV and Galesi A (2014) GVAR Toolbox 20 available at httpssitesgooglecomsitegvarmodellinggvar-toolbox
36 | Quarterly Report on the Euro Area
between the US the euro area as a whole and four EU countries taken individually (76)
In addition the role of consumer confidence spillovers in the euro area was assessed in a previous issue of the QREA (77) Consumption and confidence regressions were carried out for a panel of euro area countries over the period 1999-2012 The findings support the existence of confidence spillovers between euro area countries
III4 Confidence spillovers across the euro area
Table III1 shows simple correlations between the confidence indicators of eight euro area countries over the period 1995Q4-2016Q1 (78)The strength of the link between consumer confidence indicators across Member States is variable and in most cases is larger between neighbouring countries and between countries sharing similar macroeconomic environments (79)
Table III1 Consumer Confidence Indicator mdash Correlation Matrix
(1995Q4-2016Q1)
(1) Not statistically significant at conventional levels Source DG ECFIN calculations based on EU Business and Consumer Surveys
(76) Deacutees S and J Guntner (2014) lsquoThe international dimension of
confidence shockrsquo ECB Working Paper No 1669 (77) Op cit DrsquoAuria F (2013) (78) The very low and non-statistically significant correlation of the
Italian confidence indicator with the confidence indicators of a number of other euro area countries is somewhat puzzling and there is a need for further investigation into the reasons behind it
(79) The strong correlation between confidence indicators in countries sharing similar economic conditions can be indicative of larger confidence spillovers between them but can also be a reflection of the strong correlation between their economic fundamentals
The strength of the correlation also varies considerably over time Table III2 displays correlations between consumer confidence indicators in the same euro area countries over the period 2008Q1-2012Q4 During the crisis period the link between consumer confidence indicators is significantly tighter
Table III2 Consumer Confidence Indicator mdash Correlation Matrix
(2008Q1-2012Q4)
(1) Not statistically significant at conventional levels Source DG ECFIN calculations based on EU Business and Consumer Surveys
The presence of a correlation between confidence indicators may point to the existence of confidence spillover effects between countries but also be indicative of strong business cycle synchronisation To shed light on the nature of these correlations this section discusses confidence spillovers in the euro area on the basis of the findings from the estimation of a Global Vector Autoregressive (GVAR) model which includes data for eight euro area countries over the period 1996Q2-2013Q1 Box III1 describes the model in more detail
The model includes observations on consumption GDP the unemployment rate a short-term interest rate and consumer confidence The latter is measured by the BCS Consumer Confidence Indicator which is an arithmetic average of the balances of the answers to questions on the financial situation of households the general economic situation unemployment expectations and savings over the next 12 months It is therefore taken as a proxy for consumersrsquo expectations about their future economic situation
The results seem to support the existence of consumer confidence spillovers across the euro area As an illustration Graph III2 reports impulse
AT BE FI FR IT DE NL ES
AT 100 069 069 074 013(1) 054 043 022BE 069 100 067 088 055 057 068 066FI 069 067 100 068 039 028 075 055FR 074 088 068 100 046 055 066 060IT 013(1) 055 039 046 100 004(1) 063 081DE 054 057 028 055 004(1) 100 033 023NL 043 068 075 066 063 033 100 073ES 022 066 055 060 081 023 073 100
AT BE FI FR IT DE NL ES
AT 100 093 090 088 036(1) 079 086 063BE 093 100 081 080 034(1) 080 081 071FI 090 081 100 083 058 052 081 066FR 088 080 083 100 030(1) 066 074 061IT 036(1) 034(1) 058 030(1) 100 -016(1) 065 038DE 079 080 052 066 -016(1) 100 050 048NL 086 081 081 074 065 05 100 050ES 063 071 066 061 038 048 050 100
Box (continued)
by the European Commission Consumption and GDP enter the model in log differences while the other variables are in levels Some of the results are discussed in the main text
III Confidence spillovers in the euro area
Volume 15 No 2 | 37
response functions of consumer confidence in the euro area countries included in the GVAR model to a positive shock to consumer confidence in Germany over 24 quarters (80)
The largest effect appears to be in smaller neighbouring countries (Austria Belgium and the Netherlands) The response of consumer confidence is also relatively large in Finland France and Spain On the other hand spillovers to consumer confidence in Italy are very small and become negative after six quarters This is not a surprise given the statistically insignificant correlation between German and Italian consumer confidence emerging from the data reported in Table III1 The peak response occurs in the second or third quarter
Similar results although of a smaller magnitude were obtained for the other euro area countries included in the model Confidence spillovers appear to be larger across countries with stronger geographical and trade links Overall the evidence from the estimation of the model supports the existence of a transmission channel for consumer confidence shocks across the euro area However the effects of confidence shocks on foreign consumption are in most cases not statistically significant suggesting that the transmission channel is to foreign confidence rather than
(80) A caveat must be made about the difficulty of identifying truly
exogenous confidence shocks owing to the fact that confidence indicators are largely driven by the same factors which determine consumption
directly to foreign economic activity (81)
These results suggest that confidence shocks play a role in the international business cycle and that there are close interlinkages between confidence indicators across euro area countries This evidence supports the need for coordinated policy action able to boost confidence across euro area countries
III5 Conclusions
In recent years the dynamics of euro area consumer confidence and real private consumption have been very closely related Moreover consumer confidence indicators across the euro area appear to be strongly correlated The strength of the correlation was considerably greater during the crisis period
The evidence of a link between real consumption and consumer confidence is mixed but several studies are supportive of consumer confidence playing a role in determining consumption In addition there is evidence to suggest that shocks to consumer confidence in euro area countries affect confidence in other euro area Member States This is also borne out by results obtained from the estimation of a Global Vector Autoregressive (GVAR) model for eight euro area countries
(81) Similar conclusions are reached by op cit Deacutees and Soares-Brinca
(2013) and Deacutees and Guntner (2014)
38 | Quarterly Report on the Euro Area
Graph III2 Impulse response functions of foreign confidence to a one standard error confidence shock in Germany
Source DG ECFIN
000
005
010
015
020
025
030
035
1 2 3 4 5 6 7 8 9 10 11 12 13 14 15 16 17 18 19 20 21 22 23 24
AT
000
005
010
015
020
025
030
035
040
1 2 3 4 5 6 7 8 9 10 11 12 13 14 15 16 17 18 19 20 21 22 23 24
BE
000
005
010
015
020
025
030
1 2 3 4 5 6 7 8 9 10 11 12 13 14 15 16 17 18 19 20 21 22 23 24
FI
000
005
010
015
020
025
030
1 2 3 4 5 6 7 8 9 10 11 12 13 14 15 16 17 18 19 20 21 22 23 24
FR
-002
-001
000
001
002
003
004
005
006
007
1 2 3 4 5 6 7 8 9 10 11 12 13 14 15 16 17 18 19 20 21 22 23 24
IT
000
005
010
015
020
025
030
035
040
1 2 3 4 5 6 7 8 9 10 11 12 13 14 15 16 17 18 19 20 21 22 23 24
NL
000
005
010
015
020
025
030
035
1 2 3 4 5 6 7 8 9 10 11 12 13 14 15 16 17 18 19 20 21 22 23 24
ES
40 | Quarterly Report on the Euro Area
Editors Jose Eduardo Leandro and Martin Larch
Coordination Plamen Nikolov
Statistical and layout assistance Christos Zavos
Comments on the report would be gratefully received and should be sent to
Jose Eduardo Leandro Director ndash Policy strategy coordination and communication Directorate-General for Economic and Financial Affairs Office CHAR 1566
B-1049 Brussels
Email joseleandroeceuropaeu
or
Martin Larch Head of Unit ndash EMU deepening and macroeconomy of the euro area Directorate-General for Economic and Financial Affairs Office CHAR 1556
B-1049 Brussels
Email martinlarcheceuropaeu
EUROPEAN ECONOMY INSTITUTIONAL SERIES
European Economy Institutional series can be accessed and downloaded free of charge from the following address httpeceuropaeueconomy_financepublicationseeipindex_enhtm Titles published before July 2015 can be accessed and downloaded free of charge from bull httpeceuropaeueconomy_financepublicationseuropean_economyindex_enhtm
(the main reports eg Economic Forecasts) bull httpeceuropaeueconomy_financepublicationsoccasional_paperindex_enhtm
(the Occasional Papers) bull httpeceuropaeueconomy_financepublicationsqr_euro_areaindex_enhtm
(the Quarterly Reports on the Euro Area)
Alternatively hard copies may be ordered via the ldquoPrint-on-demandrdquo service offered by the EU Bookshop httpbookshopeuropaeu
HOW TO OBTAIN EU PUBLICATIONS Free publications bull one copy
via EU Bookshop (httpbookshopeuropaeu) bull more than one copy or postersmaps
- from the European Unionrsquos representations (httpeceuropaeurepresent_enhtm) - from the delegations in non-EU countries (httpeeaseuropaeudelegationsindex_enhtm) - by contacting the Europe Direct service (httpeuropaeueuropedirectindex_enhtm) or calling 00 800 6 7 8 9 10 11 (freephone number from anywhere in the EU) () () The information given is free as are most calls (though some operators phone boxes or hotels may charge you)
Priced publications bull via EU Bookshop (httpbookshopeuropaeu)
ISBN 978-92-79-54335-7
KC-BC-16-030-EN-N
- NEW_IP_index_enpdf
-
- EUROPEAN EconomY institutional SERIES
-

I Cross-border risk sharing after asymmetric shocks evidence from the euro area and the United States
Volume 15 No 2 | 9
a higher degree of political and institutional integration between them including a system of common decision-making that ensures democratic legitimacy and accountability
The initial EMU design did not envisage a substantial role for cross-border public risk sharing through common EMU fiscal support The EU budget remains quite small in comparison to the sum of the Member Statesrsquo national budgets and is mainly designed to support real convergence rather than smooth shocks across countries (8)
I3 Methods to measure cross-border risk sharing
Empirical facts on cross-border risk sharing among Member States support the view that the EMU likely helped the process of smoothing cross-border output shocks mainly through private channels Graph I1 shows the cross-country dispersion of output income (9) income after taxes and consumption in the euro area since the start of the EMU
(8) The amount of cross-border risk sharing in the EU through
common public channels such as spending through the multiannual financial framework (MFF) remains much lower than in federal states The EU budget accounts for 1 of the EUrsquos combined GDP while in the US it reaches 25 of GDP
(9) Income is derived from GDP adjusted for net factor income vis-agrave-vis rest of the world plus net taxes and subsidies on products and imports See also Box II1
The dispersion of output among Member States has remained quite stable since the launch of the euro despite a minor increase in the boom years before the crisis and a minor drop after the crisis hit Both income (including after-tax income) and consumption show a lower degree of dispersion among the Member States than output (10) This suggests that asymmetric shocks to output are being smoothed among countries as part of the general income and consumption convergence process in the euro area
Moreover the years after the introduction of the euro as a common currency seem to coincide with a visible even though slight reduction in the cross-country dispersion of income and consumption The trend is also visible when the sample excludes new Member States (right-hand panel) This suggests that the creation of the EMU has resulted in better convergence and possibly better cross-border risk sharing among Member States (11)
(10) Measured by the standard deviation in real per capita terms This
remains valid even when the sample excludes the countries that joined the euro area after 2004 See right-hand panel of Graph II1
(11) The fact that after-tax-income shows slightly more dispersion than pre-tax-income is hardly surprising given that fiscal policy in the euro area is decided at national level If there is a common system of risk sharing through cross-border transfers to smooth income and governments can borrow decentralised fiscal policy can also dampen variations in after tax income
Graph I1 Cross-country dispersion of output income and consumption in the euro area (1)(2)
(1999-2015 Index EA-19=100)
(1) Standard deviation of real per-capita terms output is measured by GDP income by gross national income (GNI) and income after taxes contributions and subsidies by gross disposable income (GDI)(2) New Member States (NMS) of the euro area are those that joined after 2004 Source AMECO
0
10
20
30
40
50
60
1999 2001 2003 2005 2007 2009 2011 2013 2015
OutputIncomeIncome after taxes contributions and transfersConsumption
0
10
20
30
40
50
60
1999 2001 2003 2005 2007 2009 2011 2013 2015
Output (exclNMS)
Income (exclNMS)
Income after taxes contributions and transfers(exclNMS)Consumption (exclNMS)
10 | Quarterly Report on the Euro Area
Looking at the same graph for the US reveals that the disparity of output income and consumption among the 50 US states is much lower than between the euro area Member States The crisis has affected divergence in the US as well with a sharp increase in the cross-state standard deviation of output and income in 2008 (Graph I2)
Another difference with the euro area is the smoothing role of taxes contributions and transfers with gross disposable state income having a much lower dispersion than unadjusted income in the US compared to the euro area This is to be expected given the larger size of the US federal budget
Graph I2 Cross-state dispersion of output income and consumption in the 50
US states (1) (1999-2014 in )
(1) Standard deviation of real per-capita terms output is measured by gross state product (GSP) income by gross state personal and non-personal income and income after taxes contributions and subsidies by gross disposable state income Source US Bureau of Economic Analysis (BEA) US Office of Management and Budget (OMB) US Bureau of Labour Statistics (BLS) US Census Bureau DG ECFIN calculations
A more concrete representation of the process of cross-border risk sharing within a single year can be obtained by looking at the dispersion of output and consumption growth among euro area Member States and US states shown on Graph I3 The vertical difference between the dispersions of output and consumption gives the amount of a change in output that is not picked up by the change in consumption over the course of the year and thus appears to be smoothed This is in contrast to dispersion of output income and consumption in levels presented above which contains in itself convergence irrespective of
shocks as well as smoothing of past shocks that takes more than one year
The graph shows that there were periods before the crisis when annual consumption growth within the euro area differed more than the growth in output Conversely between 2010 and 2013 the dispersion of consumption growth was clearly below the dispersion of output growth suggesting smoothing in the course of each of these years
The contrast with the US is visible here as well Both output and consumption growths among the US states vary less than among euro area Member States and in the US the variability of consumption growth is consistently lower than the variability of output growth suggesting a more consistent risk sharing process
Graph I3 Cross-border dispersion of output and consumption growth in the
euro area and the 50 US states (1) (1999-2015 in pps)
(1) Standard deviation of growth in real per-capita terms Source AMECO US Bureau of Economic Analysis (BEA) US Office of Management and Budget (OMB) US Bureau of Labour Statistics (BLS) US Census Bureau DG ECFIN calculations
Labour mobility
Looking at the specific channels of cross-border risk sharing Graph I4 attempts to illustrate the role of cross-border labour income with data from Eurostatrsquos Labour Force Survey (12) The graph
(12) The EU labour force survey is a large sample survey among
private households in Europe and an important source for European statistics about the situation and trends in the EU labour market
Visit httpeceuropaeueurostatwebmicrodataeuropean-union-labour-force-survey for more information
0
5
10
15
20
25
1999 2001 2003 2005 2007 2009 2011 2013
OutputIncomeIncome after taxes contributions and transfersConsumption
0
1
2
3
4
5
6
1999 2001 2003 2005 2007 2009 2011 2013 2015
Output growth in the euro areaConsumption growth in the euro areaOutput growth in the USConsumption growth in the US
I Cross-border risk sharing after asymmetric shocks evidence from the euro area and the United States
Volume 15 No 2 | 11
provides statistics on employment by citizenship and thus on the number of euro area workers who work in another Member State A caveat needs to be made here Employment by citizenship only approximates the number of cross-border commuter workers In the very narrow sense risk sharing through labour mobility is performed by commuter workers whose number fluctuates almost simultaneously with a shock in output while cross-border employment as presented in the graph also contains a structural pattern (13)
The share of euro area labour force that has an EU citizenship different from that of the reporting country has been increasing since the start of the survey There was a minor slowdown during the crisis but by 2015 the share of euro area workers who are citizens of another EU country had reached almost 4 Most of the increase since the beginning of the survey in 2006 can be attributed to workers from the new Member States By 2015 their number had surpassed the number of workers from the EU-15
Graph I4 Cross-border employment in the euro area (1)(2)
(2006-2015 y-o-y change)
(1) Employment by citizenship other than of the reporting country 15-64 year old of total employment (2) New Member States of the EU are those that joined after 2004 Source Eurostat
There is quite a disparity among Member States regarding the share of cross-border labour This means that cross-border risk sharing through this channel is not homogeneous across Member States as some countries likely benefit more from this
(13) Data on commuter workers that move in response to shocks are
unavailable in the Labour Force Survey
form of risk sharing than the rest In 2015 the share of workers that are citizens of another EU country varies between more than 10 in Ireland and Cyprus to as low as 06 in Portugal and below or close to 2 in France Finland the Netherlands Malta and Greece Luxembourg with its small size and high expatriate population is a clear outlier Workers from the new Member States are a clear majority of EU workers in Ireland Austria Spain and Italy This diversity among Member States suggests that the pattern of cross-border risk sharing through this channel is quite different depending on the country concerned
There is still quite a lot to be done to increase the impact of cross-border labour mobility on risk sharing among euro area Member States The line on Graph I4 clearly shows a pattern similar to the demand cycle during the crisis This means that the aggregate number of cross-border workers within the euro area is pro-cyclical This may help adjustment for example when cross-border workers return to their countries of origin after a negative shock in the host country (14) Yet at this stage given the lack of precise information on the number of cross-border commuters in the euro area it is difficult to arrive at more precise conclusions on the role of risk sharing through labour compensation in the various Member States
Financial integration
The rapid financial integration in the years between the EMUrsquos creation and the start of the global financial crisis undoubtedly provided conditions for better cross-border risk sharing in the euro area The increase in the importance and size of the financial services sector in the Member States followed similar developments in the other
(14) Putting this channel in a more comparative perspective is difficult
Annual interstate mobility in the US (a flow concept) is found to be 25 of working age population in 2005 This is a relatively high number compared to countries in Europe given that in 2006 29 of the euro area labour force had a citizenship of another EU country (a stock concept) See Bonin H W Eichhorst C Florman M Okkels Hansen L Skioumlld J Stuhler K Tatsiramos H Thomasen and K F Zimmermann (2008) lsquoGeographic mobility in the European Union optimising its economic and social benefitsrsquo IZA (Forschungsinstitut zur Zukunft der Arbeit) Research Report No 19 The crisis may have affected these estimates in a different way in the two blocs For evidence that the crisis has reduced the importance of migration across state borders as a labour market adjustment tool in the US see Foote A M Grosz and AH Stevens (2015) lsquoLocate your nearest exit mass layoffs and local labour market responsersquo NBER Working Paper Series No 21618 One possibility is that the Great Recession was unique given the role of the US housing crisis which impeded mobility
0
1
2
3
4
2006 2007 2008 2009 2010 2011 2012 2013 2014 2015
From the new Member States - BG CZ CYEE HU HR LV LT MT PL RO SK SL
From the old Member States - AT BE DKDE ES FI FR GR IE IT LU NL PT SEUK
12 | Quarterly Report on the Euro Area
advanced economies but in Europe the process was given an additional impetus by the creation of the common currency and linked to that the decrease in the costs of borrowing Previous analysis in this series has shown that financial market integration has supported cross-border risk sharing However this was less through equity markets and rather more through borrowing and saving on credit markets (15)
The crisis changed the perception about financial integration and the role of wholesale bank funding in a profound way The rapid cross-border expansion up until 2007 was followed by a retrenchment of financial intermediation behind state borders Moreover capital misallocation during the boom years appeared as a major destabilising factor after the crisis hit increasing the likelihood of asymmetries across Member States (16)
Not all cross-border financial instruments in the euro area have experienced the same deep fall since the crisis Graph I5 shows that in 2014 the cross-border deposits at euro area banks excluding positions vis-agrave-vis other banks stood at levels that were relatively close to those in the pre-crisis years despite localised drops in the immediate vicinity of the sovereign-debt crisis in 2008 (17)
Both cross-border loans and deposits expanded rapidly after the creation of the euro and judging from their level today the common currency plays an important role in risk sharing through cross-border provision of financial services However cross-border equity assets experienced a significant drop during the crisis and their recovery to pre-crisis levels has taken much longer than for cross-border deposits It is also important to stress that
(15) For an overview of increased pre-crisis financial integration and
its impact on risk sharing see lsquoCross-border risk sharing has it increased in the euro arearsquo in Quarterly Report on the Euro Area Vol 6 No3 (2007)
(16) For a presentation of the limits of shock absorption in the EMU since the crisis see Jevcak A and R Kuenzel lsquoRecent capital flow developments in the euro arearsquo in Quarterly Report on the Euro Area Vol 12 No2 (2013) Loublier A lsquoRecent developments in cross-border capital flows in the euro arearsquo in Quarterly Report on the Euro Area Vol 14 No1 (2015) and lsquoFinancial integration and risk-sharing in a monetary unionrsquo in Financial Integration in Europe (2016) ECB
(17) Naturally the share of large financial centres such as Ireland and Luxembourg as locations of cross-border financial positions in the euro area is disproportionately higher than their weight in the EMU population or GDP This is another example of the Member Statesrsquo uneven ability to share risk among each other through private channels
the size of the cross-border equity market is several times lower than the cross-border loan and deposit markets
Graph I5 Cross-border financial instruments in the euro area(1)
(2001-2014 Index 2001=100)
(1) For loans and deposits other bank counterparties are excluded Source Bank for International Settlements (BIS) reporting banks IMF Coordinated Portfolio Investment Survey (CPIS)
The euro facilitates private risk sharing through lowering transactions costs and deepening financial markets However as the crisis has shown appropriate measures to create a well-functioning Banking Union are also needed This includes in particular establishing a European Deposit Insurance Scheme (EDIS) thus building the third pillar of the Banking Union Given the current regime of country-based deposit insurance there are still differences in the regulatory treatment of banks Once operational the EDIS will work against country-specific shocks since it is likely to be fiscally neutral over time because insured risks will be spread and private contributions will be raised by a larger pool of banks In this way the EDIS together with a credible common backstop to the Single Resolution Fund will create further conditions for more cross-border presence of euro area banks by ensuring consistency in regulatory treatment and by shielding the financial sector from country-specific shocks It will therefore be another supporting factor in increasing competition in the financial sector lowering costs and increasing cross-border risk sharing
0
50
100
150
200
250
300
350
400
450
2001 2003 2005 2007 2009 2011 2013
Cross-border loansCross-border depositsCross-border equity assets
I Cross-border risk sharing after asymmetric shocks evidence from the euro area and the United States
Volume 15 No 2 | 13
I4 Empirical results of cross-state risk sharing in the euro area and the US
Econometric results on the relative weight of the different risk sharing channels among euro area Member States and US states are given below This sub-section updates findings of the canonical paper by Asdrubali et al (1996) (18) for the US states in the years since the crisis It next compares the US with the euro area and draws conclusions for the possible degree of risk sharing in the euro area had the latter possessed the capital and labour market characteristics of the former The comparison also acknowledges that the US is a federal state with a
(18) Asdrubali F B Sorensen and O Yosha (1996) lsquoChannels of
interstate risk sharing United States 1963-1990rsquo The Quarterly Journal of Economics November
sizeable budget while the EMU does not have common fiscal means to cope with asymmetric shocks
Cross-border risk sharing is measured using the system of national accounts The approach consists of sequential regressions of the balancing items in the primary and secondary distribution of income accounts and in the use of income account for the total economy (so including both the private and the public sector) in order to quantify the amount of co-movement of output income including after taxes and consumption after asymmetric shocks to output The method provides a breakdown of the relative size of the three different channels of cross-border risk sharing (net factor income fiscal transfers and credit markets) and the proportion of an asymmetric shock that remains unsmoothed
Graph I6 Channels of risk sharing 50 US States anchored-start regressions with rolling end dates (1)
(1990-2013 in of total asymmetric shock to output)
(1) Regressions cover 1964 until the year shown on the horizontal axis Regressions with rolling start and end dates did not give qualitatively different results Source US Bureau of Economic Analysis (BEA) US Office of Management and Budget (OMB) US Bureau of Labour Statistics (BLS) US Census Bureau DG ECFIN calculations
435
440
445
450
455
460
465
470
475
1990 1993 1996 1999 2002 2005 2008 2011
smoothed by net factor income
76
77
78
79
80
81
82
83
84
85
1990 1993 1996 1999 2002 2005 2008 2011
smoothed by federal taxes grants and transfers
235
240
245
250
255
260
265
270
275
280
285
1990 1993 1996 1999 2002 2005 2008 2011
smoothed by savings
160
165
170
175
180
185
1990 1993 1996 1999 2002 2005 2008 2011
not smoothed
14 | Quarterly Report on the Euro Area
See Box I1 for a full description of the model and its estimation
The Asdrubali et al (1996) methodology is applied to the 50 US states and to three sets of euro area Member States the euro area (EA) 19 except Malta Cyprus Luxembourg Lithuania Austria and Greece EA 12 except Luxembourg Austria and Greece and a set of euro area core and periphery countries (Germany Spain Ireland Netherlands and Portugal) The choice of euro area countries is partly based on data availability in the European System of Accounts 2010 and partly on the option to have a sample that excludes new Member States In this way it is possible to measure legacy effects from the closer integration even before the EMU and have a sample of countries in the EA12 core and periphery which are likely to experience more asymmetries
The time period chosen for the US is between 1964 and a rolling end date from 1990 until 2013 For the three different sets of euro area countries the time period is between 1999 and 2015 The time periods are chosen based on data availability while for the US it extends the period in Asdrubali et al (1996) The difference in the two time samples does not impair comparison between the two economies because risk sharing estimates for
an economy vary little depending on the period chosen (19) The main differences between two economies are driven by the legal institutional and economic structures that underpin risk sharing not by the different time samples
The most important result of the econometric exercise is that risk sharing among Member States is lower than across federal states in the US (20) The overall proportion of an asymmetric shock that is not smoothed in the euro area is more than four times larger than in the US (Table I1 last row) Naturally the gap comes from the different
(19) This is best illustrated when comparing estimates in the original
Asdrubali et al (1996) paper and its extension here See the small scale of the vertical axis in Graph II4 Note also that the econometric approaches in Asdrubali et al (1996) and the extension here are different 2-step generalised least squares vs panel-corrected ordinary least squares See Box II1 for more information
(20) The lower degree of risk sharing after asymmetric shocks in the euro area compared with the US was reported already after the first couple of years of the EMU For an overview see for example Demyanyk Y C Ostergaard and B Sorensen (2008) lsquoRisk sharing and portfolio allocation in EMUrsquo European Economy Economic Papers 334 and Sorensen B and O Yosha (1998) lsquoInternational risk sharing and European monetary unificationrsquo Journal of International Economics Vol 45 pp 211-238 On the other hand Furceri D and A Zdzienicka (2013) lsquoThe euro area crisis need for a supranational fiscal risk sharing mechanismrsquo IMF WP13198 point out that the crisis has hampered the ability of the euro area countries to share risk
Table I1 Cross-border risk sharing through different channels(1)(2) in of total asymmetric shock to output
(1) Time period for the euro area is between 2000q4 and 2015q4 while for the US it is between 1964 and 2013 To increase the number of observations risk sharing in the euro area is measured at a quarterly frequency (difference compared with the same quarter in the preceding year) However regressions with annual frequency did not produce qualitatively different results (2) Cross-border factor income includes property income such as income from cross-border ownership of equity rent income and cross-border labour compensation Source DG ECFIN calculations Asdrubali et al (1996)
Euro area
Euro area without the
New Member States
Core vs periphery US
Risk sharing throughall EA MS except CY MT LU LT
AT GR
EA12 except LU AT and
GR
DE ES IE NL and PT 50 states
00
56 20 34 448
02 -02 -01
757 617 631 176
cross-border factor income(2)
of which cross-border labour compensation
cross-border fiscal transfers
credit markets
unsmoothed
16 26 83
182 246 180 267
I Cross-border risk sharing after asymmetric shocks evidence from the euro area and the United States
Volume 15 No 2 | 15
political and institutional setups for sharing risks in the US and the euro area as well as the relatively big role of capital and labour markets for risk sharing in the US
Graph I6 shows the estimates of the amount of risk sharing through the different channels between the 50 US states following an asymmetric shock to output The lines report the evolution of the regression estimates depending on the end date of the time series starting with an end date in 1990 The goal is to evaluate how the different channels evolved since 1990 Table I1 compares the three euro area samples with the US
Cross-state risk sharing through net factor income remains the largest contributor to consumption smoothing following an asymmetric shock in the US This channel includes risk sharing through cross-state property income such as retained earnings and income streams from cross-state ownership of shares as well as smoothing through labour earnings by commuters across state borders It is natural that these income streams are hampered during recessions Graph II4 shows two steep drops in its relative weight which broadly correspond to the recessions in 2001 and 2008-9 (21)
The estimates in Table I1 show that there is a big difference between the role of cross-border net factor income among the euro area Member States and the US states This comes as a result of the higher degree of labour mobility and deeper and more integrated capital markets in the US Higher risk sharing through this channel is to be expected given the high annual interstate mobility and the high number of commuter workers across state border in the US (22) Better capital market development in the US is also well documented see Valiante (2016) (23) for evidence that Europersquos capital markets are poorly functioning and underdeveloped compared to the US
The relative share of fiscal redistribution across state borders in the US is lower than the shares of the private channels For the full time series
(21) Even though visually pronounced these drops are small in
absolute terms Note the scale of the vertical axes on Graph II4 again supporting the conclusion that the choice of a time period has a minor impact on the absolute value of the risk sharing coefficients while keeping their relative proportion constant
(22) See Bonin et al (2008) op cit (23) Valiante D (2016) lsquoEuropersquos untapped capital market rethinking
integration after the great financial crisisrsquo CEPS Paperback
between 1964 and 2013 the relative weight of fiscal support in risk sharing is around 85 Risk sharing through this channel has been at its highest level since the start of the crisis as the federal government provided support to struggling states
The role of cross-border public risk sharing in the euro area is smaller than in the US although the difference is less striking than for the cross-border private channels The largest role for the public channel comes up when the sample of euro area countries includes only those that benefited from official support during the crisis years This should come as no surprise given that the euro area does not have a common fiscal capacity to absorb shocks
The importance of credit markets for cross-border risk sharing is more similar in the euro area and the US than the other channels This includes borrowing by both the private and the public sector The role of public sector borrowing in risk sharing is likely smaller than the one of the private sector while stabilisation through purely domestic means is not considered here (24) The role of euro area credit markets in smoothing an asymmetric output shock is more similar to the one in the US in the pre-2004 euro area sample than in the other two euro area samples This reflects a very high degree of financial deepening in the old Member States compared to those that joined recently While encouraging at face value this result also needs to take into account that pre-crisis cross-border financial flows in some of the old Member States turned out to be unsustainable as a result of insufficient risk management and supervision
The overall proportion of an asymmetric shock that is not smoothed between the 50 US states is around 18 compared to more than 60 among the euro area Member States Given that the US is a federal country with a long history of fiscal redistribution and that it has well-developed capital markets with a large presence across state borders it is to be expected that the euro area could achieve a higher degree of cross-border risk sharing once
(24) Some authors have separated this channel into saving and
borrowing on the credit markets by private entities (households and non-financial corporations) and public entities (national and local governments) See for example Furceri and Zdzienicka (2013) they find that the role of public access to credit markets for cross-border risk sharing in the euro area is several times lower than the role of private savingborrowing That is to be expected given the provisions of the Stability and Growth Pact and the relative sizes of the private and public sectors
16 | Quarterly Report on the Euro Area
changes to its institutional setup towards more integration come into being (25) However shock absorption through fiscal redistribution in a fully-fledged fiscal union such as the US is not more than around 85 of the asymmetric shock (as measured by the rolling end date regressions) even though it has increased since the crisis
Therefore a much bigger part of cross-border risk sharing in the EMU could potentially come through private channels such as integrated capital markets once the Capital Markets Union is in place
I5 Conclusion
The econometric results presented in this section point to the great potential for improvement in smoothing asymmetric shocks in the euro area When comparing the amount of an asymmetric shock that remains unsmoothed by the private and public channels of cross-border risk sharing in the euro area and the US the importance of the recent initiatives to build a Capital Markets Union stand out The significance of factor income flows which include labour compensation and capital income generated across state borders in the US could serve as a model for a euro area where capital markets play an important role in cushioning asymmetric shocks across borders Also the creation of the Single Supervisory Mechanism and other innovations in the regulatory environment in
(25) The level of integration will probably not be of the same
magnitude since it is unlikely that the union between euro area member states will soon be politically and institutionally the same as the one between the 50 US states
the euro area are likely to make risk sharing through credit markets more sustainable going forward
Completion of the European Banking Union by establishing a European Deposit Insurance Scheme (EDIS) will also facilitate risk sharing among Member States The EDIS is expected to increase the cross-border presence of euro area banks by ensuring consistent regulatory treatment regardless of country of operation and will offer protection against country-specific shocks Completing the Banking Union will create conditions for more financial integration which is expected to increase competition among banks and thus lower intermediation costs and further increase cross-border risk sharing
The importance of the public channel of cross-border risk sharing in the euro area on the other hand should be seen in contrast with its role in the US a fully-fledged fiscal union where fiscal redistribution among states has an important role Even though the relative significance of this channel in the US has increased with the crisis taxes grants and fiscal transfers in the 50 states contribute relatively less to smoothing asymmetric shocks than the private channels Therefore policy efforts to achieve a higher degree of private cross-border risk sharing in the euro area especially through capital markets and equity holdings should remain the priority option
I Cross-border risk sharing after asymmetric shocks evidence from the euro area and the United States
Volume 15 No 2 | 17
(Continued on the next page)
Box I1 Empirical methods to estimate relative weights of cross-border risk sharing channels
This box presents the econometric methodology used to estimate the relative importance of the different cross-border risk sharing channels after an asymmetric shock in the euro area and the US
It is important to look at the balancing items in the primary and secondary distribution of income accounts and the use of income account in the European System of National Accounts 2010 (ESA 2010) in order to review the necessary variables for the estimation process Data for Belgium for 2014 can be used as an illustration to arrive at the required several balancing items (1) One channel of risk sharing is the difference between gross domestic product (GDP) and gross national income (GNI) ndash risk sharing through net international factor income The bigger this difference and the lower its correlation over time with GDP the more risk sharing there is through net international factor income In order to come up with this difference mdash EUR 6038 billion in this example mdash one has to add the net of several items For example there is a difference of EUR 5715 billion between compensation of employees paid by employers in Belgium including to workers who take their earnings abroad where they are domiciled and compensation of employees received by workers in Belgium including by workers who work in other countries but bring their earnings back to Belgium where they are domiciled This is a net positive inflow of income from a Belgian perspective Other items that are treated in the same way are production taxes paid (collected) by firms (governments) and subsidies on production earned (distributed) by firms (governments) Any cross-border net inflow here will be due to fewer of these taxes paid by Belgian firms abroad compared to foreign firms in Belgium and more of these subsidies earned by Belgian firms abroad compared to foreign firms in Belgium Finally property income which includes interest for example on debt securities equity dividends reinvested earnings and some other items is treated in the same way For example a net inflow occurs if Belgian citizens receive more dividends from foreign companies than foreigners from Belgian companies
Another channel of risk sharing is through cross-border fiscal redistribution This makes the difference between GNI and gross disposable income (GDI) Here a net inflow in Belgium will occur if social transfers received by Belgian persons and entities from foreign sources outweigh the transfers received by foreigners in Belgium The same will happen if income and wealth taxes paid by foreigners in Belgium are higher than income and wealth taxes paid by Belgians abroad
Finally the difference between GDI and consumption is gross savings through which consumption can be smoothed Borrowings and savings are channelled through domestic and foreign financial intermediaries
At the state level in the US some of these balancing items are not available Specifically state national income and state disposable income are constructed using the method in the Appendix in Asdrubali et al (1996) (2)
Asdrubali et al (1996) propose a series of regressions of these balancing items to estimate the relative
importance of each of the risk sharing channels Starting from the identity = ∙ ∙ ∙ it is
easy to show that a relationship 1 = + + + exists where the beta terms are the estimates of the regression coefficients in ∆ minus ∆ = + ∙ ∆ + ∆ minus ∆ = + ∙ ∆ + ∆ minus ∆ = + ∙ ∆ + ∆ = + ∙ ∆ + The beta terms are interpreted as the relative weights of cross-border risk sharing due to net factor income fiscal transfers savings and borrowings on credit markets The last beta coefficient shows the amount of an asymmetric shock that remains unsmoothed The panel regressions include time fixed effects μ and error terms u
18 | Quarterly Report on the Euro Area
Box (continued)
There are three sets of panels for the euro area EA19 except Malta Cyprus Luxembourg Lithuania Austria and Greece EA12 except Luxembourg Austria and Greece and a set of euro area core and periphery countries (Germany Spain Ireland Netherlands and Portugal) The choice of euro area countries is partly based on data availability in the European System of Accounts 2010 and partly on the option to have a sample that excludes new Member States to be able to measure legacy effects from the closer integration even before the EMU and to have a sample of countries in the EA12 core and periphery which are likely to experience more asymmetries The US sample includes the 50 US states
The time period chosen for the US is between 1964 and a rolling end date from 1990 until 2013 For the three different sets of euro area countries the time period is between 1999 and 2015 The time periods are chosen based on data availability while for the US it extends the period in Asdrubali et al (1996)
The regressions are estimated with 2-step generalised least squares (GLS) correcting for heteroscedasticity and cross-sectional correlation in the case of the euro area and ordinary least squares (OLS) with panel-corrected standard errors in the case of the US The latter method is better suited for panels with larger cross-sections while the former method is better in the opposite case (3) Both estimations include a common AR1 autocorrelation structure within panels The first differences in the quarterly euro area data are in terms of the same quarter of the preceding year The euro area regressions also include a further breakdown of GNI into one corrected only for cross-border labour compensation and one for the other elements of net factor income
Econometric results are in the table below All estimates marked with are statistically significant at the 99 confidence level Z-statistics are in parentheses
Table 1 Regression results
Source US Bureau of Economic Analysis (BEA) US Office of Management and Budget (OMB) US Bureau of Labour Statistics (BLS) US Census Bureau Eurostat DG ECFIN calculations (1) For more information see Box 2 in lsquoCross-border risk sharing has it increased in the euro arearsquo in QREA Vol 6 No3 (2007) (2) Asdrubali F B Sorensen and O Yosha (1996) lsquoChannels of interstate risk sharing United States 1963-1990rsquo The Quarterly Journal
of Economics November (3) These are standard econometric approaches in estimating cross-border risk sharing For a short discussion on the econometrics of
cross-border risk sharing see Hepp R and J von Hagen (2013) lsquoInterstate risk sharing in Germany 1970mdash2006rsquo Oxford Economic Papers Vol 65 No1 pps 1-24
(1) (2) (3) (4)Risk sharing through 2-step GLS 2-step GLS 2-step GLS PC-OLScross-border factor income 00552 00199 00343 04476
(722) (316) (568) (1198)of which cross-border labour compensation 00024 -00015 -00012
(281) (-414) (-282)cross-border fiscal transfers -00007 00156 00257 00832
(-039) (847) (761) (803)credit markets 01815 02459 01800 02668
(1738) (831) (478) (508)unsmoothed 07574 06171 06312 01760
(3784) (2505) (1838) (505)
Countries
Full panel - 13 countries BE
DE EE ES FI FR IE IT LV NL PT
SK SL
Old member states - 9
countries BE DE ES FI FR IE IT
NL PT
Core vs periphery - 5 countries DE ES IE NL PT
50 US states
Period 2000Q4-2015Q4 2000Q4-2015Q4 2000Q4-2015Q4 1964-2013No of observations 793 549 305 2500
II Financial channels and economic activity in the euro area
Volume 15 No 2 | 19
II1 Introduction
Since the global economic and financial crisis the linkages between macroeconomic and financial developments have been on the frontline of both research and policy making The massive dislocations observed during the crisis have forged a broad consensus that shocks originating in the financial sector can have profound effects on real economic activity and vice versa While the effect of macroeconomic developments on financial conditions is rather straightforward (27) the effect of financial developments on the macroeconomy is more complex and was (until recently) largely omitted in mainstream macroeconomic thinking The interest rate was the only financial variable included in standard macroeconomic models and only to the extent that it was assumed to influence the decisions of economic agents while no genuine role was assigned to the financial sector itself In reality financial intermediation is subject to numerous frictions that can affect macroeconomic developments via diverse transmission channels Given the decisive role of bank credit in financing the euro area economy shocks originating in the banking sector are of crucial importance
This section looks at macro-financial linkages in the euro area to shed light on how financial developments may have contributed to disappointing macroeconomic performance in the
(26) This section was prepared by Narcissa Balta and Bořek Vašiacuteček (27) Jacobson T J Linde and K Roszbach (2005) lsquoExploring
interactions between real activity and the financial stancersquo Journal of Financial Stability Vol 1 No 3 pp 308ndash41
recent past The methodology employed for this purpose is a large-scale Bayesian Vector Autoregression (VAR) that encompasses a wide set of macroeconomic and financial variables (28)
Subsection I2 discusses the importance of the financial system for the real economy and briefly reviews the relevant economic literature Subsection I3 describes the main transmission channels from financial markets to the real economy and defines specific variables that could be used to capture these transmission channels in the euro area Subsection I4 presents the results of the empirical analysis particularly some stylised facts on the co-movement between financial variables and economic activity since the crisis
II2 The financial system and the real economy
Market frictions are normally understood as a wide range of different bottlenecks that do not allow markets to efficiently clear demand and supply Financial frictions are impediments to the smooth functioning of the financial market that do not allow funds to be channelled effectively from creditors to borrowers Therefore they play an important role in the way the financial system affects the real economy Moreover the presence of frictions during periods of financial turmoil undermines the effectiveness of monetary policy
(28) Bańbura M D Giannone and M Lenza (2015) lsquoConditional
forecasts and scenario analysis with vector autoregressions for large cross-sectionsrsquo International Journal of Forecasting Vol 31 Issue 3 pp 739ndash756
This section discusses the nexus between financial and macroeconomic developments in the euro area It draws on key lessons from the literature and provides stylised facts on the main transmission channels through which financial developments have affected real economic activity since the crisis Macro-financial linkages are investigated from an empirical perspective for the euro area as a whole by looking at four key channels i) the interest rate channel ii) the borrower balance sheet channel iii) the bank balance sheet channel and iv) the uncertainty channel
Overall the results suggest that financial variables have significant impact on macroeconomic developments but also that the transmission seems to have changed since the crisis Notably the interest rate channel has helped the modest recovery since 2014 by supporting both private and public consumption The positive boost given to favourable financing conditions in 2015 has been somewhat compensating the adverse effects of the borrower balance sheet channel The bank balance sheet channel and the uncertainty channel play a particularly important role in capturing the weakness in the current rebound in investment (26)
20 | Quarterly Report on the Euro Area
transmission and financial sector stability which via feedback effects can have a detrimental impact on macroeconomic developments For instance hikes in bank funding costs when money markets stop functioning are likely to be transmitted to the lending rates applied to consumers which in turn can have a significant drag on both investment and consumption Also financial frictions increase the likelihood of financial shocks occurring both from the demand and the supply side
Financial shocks are usually deemed to be very persistent and have amplification effects in the sense that even small shocks can produce large and long-lasting effects (29) Graph II1 shows a clear negative correlation between GDP growth and financial distress in the euro area as measured by the Composite Indicator of Systemic Stress (CISS) (30)
Graph II1 Real GDP growth vs Composite indicators of systemic stress
(2000Q1-2016Q1)
Source ECB Eurostat
Since the key role of the financial sector consists in funding economic activity new credit is the main channel of transmission between the financial sector and the macroeconomy Financial shocks occurring on the demand side are usually triggered by an impairment of borrowers balance sheets
(29) Brunnermeier M K T Eisenbach and Y Sannikov (2012)
lsquoMacroeconomics with financial frictions A surveyrsquo National Bureau of Economic Research Working Paper No 18102
(30) The CISS measures contemporaneous stress in the financial system It is an aggregate of five market-specific sub-indices More weight is put when stress prevails in several market segments at the same time thus tracking financial stress of systemic nature
Holloacute D M Kremer and M Duca (2012) lsquoCISS-a composite indicator of systemic stress in the financial systemrsquo European Central Bank Working Paper No (No 1426)
which in turn undermines their creditworthiness and their capacity to invest and consume Financial shocks occurring on the supply side (ie those that originate from within the financial sector) normally manifest themselves through tightening of credit conditions andor credit rationing which again impact real economic activity via the investment behaviour of households and non-financial corporations Graph II2 shows the negative correlation between credit standards for firms and real investment (31)
Graph II2 Investment growth vs credit standards for NFC
(2003Q1-2016Q1)
Source ECB BLS Eurostat
Financial frictions have been fully embedded into macroeconomic models only recently
The neglect of financial sector effects in traditional macroeconomic thinking has its foundation in the famous Modigliani-Miller theorem (32) The theorem argues that the way a firm finances its investment (via debt or via equity) has no effect on its value and thus that their investment decisions are driven primarily by macroeconomic conditions (namely the real interest rate) rather than financial market developments However the validity of the theorem hinges on a set of very restrictive assumptions such as perfect information equal tax treatment for debt and equity etc which are generally not met in practice (33) Financial
(31) Credit standards are measured by the backward looking three
months index from ECB Bank Lending Survey (BLS) (32) Modiglini F and M Miller (1958) lsquoThe cost of capital
corporation finance and the theory of investmentrsquo The American Economic Review Vol 48 No 3 pp 261-297
(33) Morley J (2016) lsquoMacro-finance linkagesrsquo Journal of Economic Surveys forthcoming
-8
-6
-4
-2
0
2
4
6
0
10
20
30
40
50
60
70
80
2000Q1 2003Q1 2006Q1 2009Q1 2012Q1 2015Q1
CISS
GDP y-o-y change(rhs)
-15
-10
-5
0
5
10
-10
-5
0
5
10
15
20
25
30
35
40
2003Q1 2005Q1 2007Q1 2009Q1 2011Q1 2013Q1 2015Q1
Change in creditstandards for NFCInvestment y-o-y change (rhs)
II Financial channels and economic activity in the euro area
Volume 15 No 2 | 21
intermediation typically involves asymmetry of information between borrowers and lenders and potentially costly verification of the borrowers financial situation (34)
The first attempts to include financial frictions in macroeconomic models were based on the insight that the cost of external financing very much depends on the borrowers net worth (35) andor the market value of their collateral (36) In fact changes in asset prices turn out to be a crucial determinant of both the cost of external financing and the value of collateral Moreover a relatively small shock can have a major effect on economic activity through the so-called financial accelerator whereby negative feedback loops between lower assets prices restricted access to credit and lower consumption and investment significantly amplify and prolong the impact on the real economy (37) Real estate which is a typical asset used as collateral by both households and firms establishes a tight link between the housing market and the economy as a whole (38)
While the original theoretical contributions did not explicitly model financial intermediaries (assuming direct lending from investors to borrowers) the inclusion of financial intermediaries (ie the banking sector) implies that financial frictions can appear also on the lendersrsquo side (39) Specifically financial intermediaries can become balance sheet constrained in times of economic and financial stress which affects their funding costs Such shocks to the lendersrsquo side are usually mitigated by central bank intermediation during crisis times (40)
(34) Carlstrom C T and T S Fuerst (1997) lsquoAgency costs net worth
and business fluctuations A computable general equilibrium analysisrsquo The American Economic Review Vol 87 No 5 pp 893-910
(35) Bernanke B and M Gertler (1989) lsquoAgency costs net worth and business fluctuationsrsquo The American Economic Review Vol 79 No 1 pp 14-31
(36) Kiyotaki N and J Moore (1997) lsquoCredit cyclesrsquo Journal of Political Economy Vol 105 Issue 2 pp 211-248
(37) Bernanke B S M Gertler and S Gilchrist (1999) lsquoThe financial accelerator in a quantitative business cycle frameworkrsquo Handbook of Macroeconomics Vol 1 Part C pp 1341-1393
(38) Iacoviello M and S Neri (2010) lsquoHousing market spillovers evidence from an estimated DSGE modelrsquo American Economic Journal Macroeconomics Vol 2 No 2 pp 125-164
(39) Gertler M and N Kiyotaki (2010) lsquoFinancial intermediation and credit policy in business cycle analysisrsquo Handbook of Monetary Economics Vol 3 Issue 3 pp 547-599
(40) Gertler M and P Karadi (2011) lsquoA model of unconventional monetary policyrsquo Journal of Monetary Economics Vol 58 Issue 1 pp 17-34
Despite intensive efforts in recent years the financial sector is still not fully established as a consolidated part of conventional macroeconomic models Structural models augmented by a banking sector and financial markets (41) typically find that financial factors such as bank liquidity constraints are indeed the main drivers of economic fluctuations in both the US and the euro area and that they were the main shock propagator during the global financial crisis (42)
Empirical evidence on macro-financial linkages
There is now a wide consensus that financial cycles are crucial for understanding business cycle fluctuations (43) Numerous empirical studies evaluate the effects of financial shocks on macroeconomic fluctuations Importantly financial factors can both reinforce the transmission of other shocks and be a source of disturbance in their own right
Credit appears to be one of the most studied financial variables in empirical studies due to its established regularities in terms of boom-and-bust behaviour and its link to financial crises and economic downturns (44) Credit spreads play an important role for capital markets-based systems like the US economy For example corporate bond spreads usually increase disproportionately during periods of financial stress (so-called excess bond premiums) which in turn causes economic activity to contract (45) In the euro area where external financing is mostly bank based a crucial role is played by bank lending rates and bank lending volumes Credit supply shocks have been identified
(41) Christiano L J R Motto and M Rostagno (2010) lsquoFinancial
factors in economic fluctuationsrsquo European Central Bank Working Paper No 1192
(42) Gerke et al (2013) and Wieland et al (2015) provide detailed comparison exercise for different macrofinancial models
Gerke R M Jonsson M Kliem M Kolasa P Lafourcade A Locarno K Makarski and P McAdam (2013) lsquoAssessing macro-financial linkages A model comparison exercisersquo Economic Modelling Vol 31 pp 253-264
Wieland V E Afanasyeva M Kuete and J Yoo (2015) lsquoNew methods for macro-financial model comparison and policy analysisrsquo mimeo
(43) Borio C (2012) lsquoThe financial cycle and macroeconomics what have we learntrsquo Bank for International Settlements Working Papers No 395
(44) Balke N S (2000) lsquoCredit and economic activity credit regimes and nonlinear propagation of shocksrsquo Review of Economics and Statistics Vol 82 No 2 344-349
(45) Gilchrist S and E Zakrajšek (2012) lsquoCredit spreads and business cycle fluctuationsrsquo The American Economic Review Vol 102 No 4 pp 1692-1720
22 | Quarterly Report on the Euro Area
as important determinants of the increase in lending rates and the decline in lending volumes during the recent crisis (46) Bank lending represents the main transmission mechanism in the euro area
The evidence available indicates that the impact of financial shocks on the macroeconomy is lsquostate dependentrsquo ie the response of economic activity inflation and credit to financial shocks is stronger during periods of stress This is well documented for both the euro area and the US (47) Moreover during periods of high systemic stress financial shocks tend to have both a larger magnitude and a greater impact on real activity (48) Notably a single indicator of systemic stress such as the CISS for the euro area has been found to explain a significant part of macroeconomic developments especially due to episodes of elevated systemic stress such as the global financial crisis and the euro area debt crisis (49)
While studies on financial and business cycle have been popular for some time there has been much less investigation into macro-financial linkages between countries Existing evidence indicates that such linkages exist but their intensity varies both across time and across countries Specifically it has been documented that the observed heterogeneity is mainly due to country-specific characteristics which lead to international spillovers having a differentiated impact across countries (50) Such heterogeneity seems also to be present within the euro area
(46) Moccero D N M D Pariegraves and L Maurin (2014) lsquoFinancial
Conditions Index and identification of Credit Supply Shocks for the Euro Arearsquo International Finance Vol 17 Issue 3 pp 297-321
(47) Hubrich K and R J Tetlow (2015) lsquoFinancial stress and economic dynamics the transmission of crisesrsquo Journal of Monetary Economics Vol 70 pp 100-115
Prieto E S Eickmeier and M Marcellino (2016) lsquoTime variation in macro‐financial linkagesrsquo Journal of Applied Econometrics forthcoming
Silvestrini A and A Zaghini (2015) lsquoFinancial shocks and the real economy in a nonlinear world a survey of the theoretical and empirical literaturersquo Journal of Policy Modeling Vol 37 pp 915ndash929
(48) Hartmann P K Hubrich M Kremer and R J Tetlow (2015) lsquoMelting down Systemic financial instability and the macroeconomyrsquo mimeo
(49) Kremer M (2015) lsquoMacroeconomic effects of financial stress and the role of monetary policy a VAR analysis for the euro arearsquo International Economics and Economic Policy Vol 13 Issue 1 pp 1-34
(50) Ciccarelli M E Ortega and M T Valderrama (2016) lsquoCommonalities and cross-country spillovers in macroeconomic-financial linkagesrsquo The BE Journal of Macroeconomics Vol 16 Issue 1 pp 231-275
II3 Transmission channels from financial to macro developments
In spite of the broad consensus about the existence of macro-financial linkages the identification of the transmission channels is still a subject of debate There are different ways to classify the channels through which the financial sector might affect macroeconomic developments The important distinction applied in this section is whether the linkages are related to the balance sheets of borrowers or lenders At the same time the financial channels are also closely related to monetary transmission which affects their functioning (51) This subsection aims to better define the individual transmission channels in the euro area
The interest rate channel illustrates how money market rates affect the overall financing costs of the banking sector the price of credit and consequently consumption and investment decisions This channel is closely related to monetary policy decisions as they directly affect the funding costs of banks Moreover at the zero lower bound when the central bank uses other instruments besides short-term interest rates to conduct monetary policy this channel is more complex and difficult to assess
Thus in the analysis below the interest rate channel will be captured by variables that are affected by monetary policy decisions (Graph II3) In the euro area the most frequently used indicator directly affected by the ECBrsquos policy rates is the short-term interbank interest rate (EONIA) While the effect of monetary policy actions on short-term rates is rather quick there is also a delayed effect on long-term interest rates The long-term rates are of specific relevance in the current time as short-term rates are at the zero lower bound and monetary policy aims to affect long rates directly While long-term rates are commonly defined by the yield on respective sovereign bonds in the euro area this applies to a pool of euro area sovereigns As the yields diverge across sovereigns since the global financial crisis long-term rates in the euro area have become disconnected from short-term rates Since the ECB has employed diverse unconventional measures that affect the
(51) See for instance Basel Committee on Banking Supervision (2011)
lsquoThe transmission channels between the financial and real sectors a critical survey of the literaturersquo BCBS Working Paper No 18
II Financial channels and economic activity in the euro area
Volume 15 No 2 | 23
financial system additional measures need to be used to track their effect namely the shadow rate which is a factor model-based estimate of the short-term interest rate unconstrained by the ZLB (52) Likewise the excess liquidity defined as the liquidity held by the euro area banking sector in excess of the aggregate needs arising from minimum reserve requirements and autonomous factors is another quantitative-based indicator of the monetary policy stance as it is driven by the ECBrsquos refinancing operations
Graph II3 shows the dynamics of the variables described above in the period Q1-1996 - Q1-2016 which suggest that monetary conditions have been very supportive in recent years While short-term interest rates attained the ZLB monetary easing through unconventional measures is reflected in a significant decline in the shadow rate as well as long-term rates
Graph II3 Interest rate channel (2000Q1-2016Q1 )
Source Eurostat Bloomberg Reserve Bank of New Zealand
The borrower balance sheet channel reflects the fact that it is the net worth of borrowers that determines the external finance premium ie the opportunity cost of borrowing over using internal savings In other words it is the value of borrowersrsquo collateral that affects their credit conditions As indicated above fluctuations in
(52) There different shadow rates available all being subject of
significant model uncertainty The shadow rate used is based on Krippner (2012) and available from the Reserve Bank of New Zealand website
Krippner L (2012) lsquoMeasuring the stance of monetary policy in zero lower bound environmentsrsquo Economics Letters Vol 118 Issue 1 pp 135ndash138
asset prices can affect the ability of non-financial corporations and households to borrow and thus their investment and spending decisions While monetary policy commonly does not target asset prices its actions can affect the valuation of assets used as collateral which affects the credit available for investment and consumption spending (53) Whereas the previous discussion focuses on the demand side of credit the borrower balance sheet channel affects also the supply of credit Namely weak borrower balance sheets might induce credit rationing by the lenders and affect overall credit conditions
The borrower balance sheet channel can be captured mainly by variables that reflect the risks related to the balance sheets of firms and households as borrowers from the banking sector or from capital markets While there are no readily available direct measures of the quality of private balance sheets comparable across countries asset prices can be considered as indicative of their quality as they give the value of collateral for loans and of equity Therefore house prices and stock prices are generally used in the analysis to track this channel
Graph II4 Borrower balance sheet channel
(2000Q1-2016Q1)
Source Bloomberg BIS
Graph II4 suggests that developments in house prices and stock prices have been quite
(53) There is empirical evidence especially for the US stressing the
importance of asset prices and different credit spreads as leading indicator of economic activity eg Stock and Watson (2003) Stock J H and M W Watson (2003) lsquoForecasting output and inflation the role of asset pricesrsquo Journal of Economic Literature Vol 41 No 3 pp 788-829
-10
-5
0
5
10
15
20
25
2000Q1 2004Q1 2008Q1 2012Q1 2016Q1
Short-term interest rateLong-term interest rateShadow rate (Krippner)ECB Excess Liquidity Index
-6
-4
-2
0
2
4
6
8
10
-60
-40
-20
0
20
40
60
2000Q1 2002Q3 2005Q1 2007Q3 2010Q1 2012Q3 2015Q1
MSCI EURO Index y-o-y change
Housing prices y-o-y change
24 | Quarterly Report on the Euro Area
disconnected in recent years Specifically while house prices only started to recover in 2014 stock prices peaked in early 2015 and experienced a downward correction since then
The bank balance sheet channel relates to the fact that how much a bank lends depends on its own balance sheet and the different risks involved in its business model External developments (including monetary policy actions but also longer-term factors such as financial regulation and innovations in the banking sector) may affect bank liabilities (the supply of loanable funds and also bank funding costs) and in turn assets (supply of credit and the lending cost) (54) Bank lending is determined by banksrsquo business models it usually increases with the increase in leverage in the economy while deleveraging episodes may significantly hamper lending activities This makes leverage highly pro-cyclical (55) Importantly the impact of bank balance sheets on the real economy can be more pronounced in the euro area than in capital-market based systems as alternative forms of financing are relatively undeveloped
The bank balance sheet channel can thus be illustrated by variables such as banking leverage the stock of non-performing loans banksrsquo funding costs or the price of Credit Default Swaps (CDS) However reliable data for the euro area are relatively short available only for the period since the beginning of the crisis Indeed the lack of knowledge about the quality of bank balance sheets was an important aspect of the euro area financial crisis and a reason for the implementation of the Asset Quality Review (AQR) by the ECB in 2014 Therefore for the analysis in this section measures which directly track the supply of credit have been used instead (56) Namely the flow of credit as measured by the credit impulse (ie the change in new credit granted by the banking sector as a percentage of GDP) the stock of credit on banksrsquo balance sheet as measured by total economy credit as a percentage of GDP and the price of credit as measured by the Composite Financing Conditions Indicator (CFCI) for non-financial corporations
(54) Bernanke B and A Blinder (1988) lsquoCredit money and aggregate
demandrsquo the American Economic Review Vol78 No 2 pp 435ndash439 (55) Adrian T and H S Shin (2010) lsquoLiquidity and leveragersquo Journal of
Financial Intermediation Vol 19 Issue 3 pp 418-437 (56) In practice the lending volumes and rates can be affected both by
supply and demand side
which (assuming a constant mark-up) proxies bank funding costs (57)
Graph II5 shows that there is a negative correlation between the credit impulse and credit as a percentage of GDP Thus during downturns the flow of new credit declines while the ratio of credit to GDP increases due to the collapse of GDP The credit impulse indicator shows that the supply of new credit has been fairly limited since the onset of the global financial crisis The CFCI tracks the ECB policy rates rather closely with the exception of the euro area sovereign debt crisis episode (2011-2012) when financing costs increased due to idiosyncratic increases in some Member States reflecting financial market fragmentation
Graph II5 Bank balance sheet channel (2000Q1-2016Q1)
Source Capital Economics BIS DG ECFIN
While the previous channels are related to the quality of balance sheets either on the borrower or the lender side some shocks can originate in the overall financial system Examples are liquidity shocks or confidence shocks These shocks work both via the balance sheets but also by directly altering agents decisions through precautionary motives affecting both investment and consumption behaviour These mechanisms are defined as the uncertainty channel (58)
(57) For more details on CFCI calculations see European Commission
(2013) Drivers of diverging financing conditions across Member States Quarterly Report on the Euro Area Vol12 No1
(58) Bloom (2009) point to uncertainty shocks (that might be related but also unrelated to the financial system) as a crucial driver of economic dynamics Recently Caldara et al (2016) argue for the needs to distinguish uncertainty shocks from financial shocks while both of them are important source of macroeconomic
-8
-6
-4
-2
0
2
4
6
8
10
2000Q1 2003Q1 2006Q1 2009Q1 2012Q1 2015Q1
Total credit on GDP y-o-y change
Credit impulse (new crediton GDP y-o-y change)
Composite financingconditions indicator
II Financial channels and economic activity in the euro area
Volume 15 No 2 | 25
The uncertainty channel is captured by variables reflecting the different types of uncertainty that can affect the economy One type is commonly related to increased volatility in financial markets Given a high degree of global interconnectedness the euro area economy can be affected by uncertainty related to global financial developments which is usually measured by the implied volatility of SampP 500 index options (VIX) (59) The euro area specific stress in the financial system is measured through the ECBrsquos Composite Indicator of Systemic Stress (CISS)
Another type of uncertainty is linked to swings in business and consumer confidence Variations in the confidence of euro area households and non-financial firms are illustrated through the European Commissionrsquo confidence indicator the Economic Sentiment Indicator (ESI) which is based on data collected through business and consumer surveys However the indicator exhibits a very high contemporaneous correlation with actual GDP growth indicating that its dynamics are likely to reflect very accurately economic conditions rather than information related to exogenous changes in confidence
Finally unexpected outcomes of economic policy decisions can lead to policy uncertainty which in turn can have adverse effects on the savings and investment behaviour of firms and households Policy uncertainty is illustrated through an indicator based on newspaper coverage of uncertainty-generating events (60)
Graph II6 indicates that there is an apparent co-movement among these indicators even if they measure different types of uncertainty While economic sentiment has been gradually improving and uncertainty related to financial markets has eased the policy uncertainty affecting the euro area is still relatively high
fluctuations separately the Great Recession was likely outcome of the toxic interaction between the two
Bloom N (2009) lsquoThe impact of uncertainty shocksrsquo Econometrica Vol 77 Issue 3 pp 623-685
Caldara D C Fuentes-Albero S Gilchrist and E Zakrajšek (2014) lsquoThe macroeconomic impact of financial and uncertainty shocksrsquo European Economic Review forthcoming
(59) The VIX is calculated by the Chicago Board Options Exchange (CBOE)
(60) Baker S R N Bloom and S J Davis (2015) lsquoMeasuring economic policy uncertaintyrsquo National Bureau of Economic Research Working Paper No 21633 Data source wwwpolicyuncertaintycom
Graph II6 Uncertainty channel (2000Q1-2016Q1)
Source Chicago Board of Exchange ECB wwwpolicyuncertaintyorg
II4 Financial developments and economic activity
This sub-section provides stylised facts on the transmission channels defined above and show whether and how financial developments have affected the real side of the euro area economy since the crisis (namely consumption investment unemployment and long-term interest rates)
While financial variables are available in real time macroeconomic variables are normally released with lags Therefore conditioning macroeconomic forecasts on observed financial developments (ie a projection of macro variables on the observed paths of financial variables) can improve forecasts as more informative data are taken into account Several empirical studies have shown that financial variables can improve macroeconomic forecasts (61)
The methodology underlying this this section is a large-scale Bayesian VAR with 35 macroeconomic
(61) Stock and Watson (2003) provide a seminar contribution on the
role of financial variables namely asset prices for GDP and inflation forecast concluding that different financial variables allow macroeconomic forecasting in different times Espinosa et al (2012) document using standard VAR approach that financial variables improve GDP forecast for the euro area especially in the real time when numerous financial variables are available ahead of the macroeconomic releases
Stock J H and M W Watson (2003) lsquoForecasting output and inflation the role of asset pricesrsquo Journal of Economic Literature Vol 41 No 3 pp 788-829
Espinoza R F Fornari and M J Lombardi (2012) lsquoThe role of financial variables in predicting economic activityrsquo Journal of Forecasting Vol 31 No 1 pp 15-46
0
50
100
150
200
250
300
0
10
20
30
40
50
60
70
80
2000Q1 2002Q3 2005Q1 2007Q3 2010Q1 2012Q3 2015Q1
VIX
CISS
ESI (rhs)
Policy uncertainty (rhs)
26 | Quarterly Report on the Euro Area
and financial variables (62) The model is estimated for the sub-period Q1-2000 - Q4-2011 which covers both normal and crisis times but does not include some of the most important unconventional monetary policy measures Given the estimated past correlations a counterfactual path for the macroeconomic and financial variables (ie a distribution of conditional forecasts) can be obtained for the entire period Q1-2000 - Q4-2015 conditional on observed real GDP and inflation in the baseline case The deviations of the observed developments of financial variables from this counterfactual path can be interpreted as evidence of instability in the relationship between financial variables and economic activity (as measured by GDP growth and inflation) since the crisis
Subsequently the conditional set from the baseline case (including only real GDP and inflation) is extended by financial and uncertainty variables corresponding to each transmission channel described above (63)
Some recent developments are puzzling
Graph II7 shows the counterfactual paths of the main GDP components producer prices the unemployment rate and the long-term interest rate conditional on observed economic activity (real GDP and inflation) It also shows the conditional forecasts for the balance sheet variables of households and firms when only real GDP and inflation are taken into account in the conditioning set
(62) Alternative strand of literature using rich set of data in order to
nowcast or forecast employs dynamic factors models where data dimension is reduced in a first step by factor estimation with common factors being consequently used in the forecasting exercize see eg Giannone et al (2008) Bellego and Ferrara (2012) find using factor-augmented probit model that financial variables allow tracking better recession periods in the euro area (in the pre-crisis period) with optimal lead of financial variables over recession of around one year
Giannone D L Reichlin L and D Small (2008) lsquoNowcasting the real-time informational content of macroeconomic datarsquo Journal of Monetary Economics Vol 55 Issue 4 pp 665ndash676
Belleacutego C and L Ferrara (2012) lsquoMacro-financial linkages and business cycles A factor-augmented probit approachrsquo Economic Modelling Vol 29 pp 1793-1797
(63) For more details on the methodology see Box IV1 in European Commission (2015) lsquoInvestment dynamics in the euro area since the crisisrsquo Quarterly Report on the Euro Area Vol 14 No 1 pp 35-43
Bańbura M D Giannone and M Lenza (2015) lsquoConditional forecasts and scenario analysis with vector autoregressions for large cross-sectionsrsquo International Journal of Forecasting Vol 31 Issue 3 pp 739ndash756
The results suggest that private consumption was unusually low during the period of the euro area debt crisis and deleveraging (2012-2013) while it overshot during the recent recovery (from 2014 onward) Investment behaved in line with historical correlations during both downturn episodes (2008-2009 and 2012-2013) and was weak during the deleveraging phase because overall output growth was weak However its recent recovery (since 2014) has been more subdued than what the pace of economic activity would have predicted the observed investment path is positioned on the lower tail of the distribution of conditional forecasts) (64)
Large deleveraging pressures in the public sector have led to a significant decline in the euro area aggregate government consumption over the period 2011-2012 However this decline had almost been reversed by the end of 2014 with public consumption starting to overshoot from 2015 onwards (relative to its counterfactual path obtained through conditioning on output growth) reflecting the aggregate euro area fiscal stance which started to turn mildly expansionary
Moreover the results show that several variables capturing price and balance sheet developments are still at odds with historical patterns In particular producer prices house prices long-term interest rates and loans to firms and households undershoot the distribution of the conditional forecasts On one side this underlines that the recent recovery is characterized by a historically low inflation environment and loose monetary conditions pushing the long-term rates down On the other side the ongoing balance sheet adjustment is translating into very weak credit dynamics due to unprecedented deleveraging pressures
Graph II8 illustrates the zero lower bound constraint on monetary policy rates and the subsequent break in the correlation of economic activity with the two measures of monetary policy
(64) There is some relative instability in the estimated correlations over
the sample period notably pre-crisis vs crisis years However it does not significantly affect the result on the unusual weakness in investment recovery since 2014 The article lsquoInvestment dynamics in the euro area since the crisisrsquo Quarterly Report on the Euro Area Vol 14 No 1 pp 35-43 found that estimating the past correlations only with the sample for the pre-crisis period the amplitude of the investment fall during the first downturn (2008-2009) would also be slightly underestimated by the conditional forecasts
II Financial channels and economic activity in the euro area
Volume 15 No 2 | 27
rates since 2012 Among all variables the consumer and business confidence indicator (ESI) comes out as having the strongest contemporaneous correlation with economic activity during the crisis
In the consecutive analysis the conditioning dataset (including only real GDP and inflation in the baseline) is augmented by financial variables corresponding to each transmission channel
hellip different channels play an important role at different stages since the crisis
The interest rate channel (Graph II9 upper panel) seems to better account for the pattern of consumption during the recent recovery (compared to the baseline) This channel which reflects mainly monetary conditions suggests that monetary easing implemented since 2014 by means of additional unconventional measures (namely the targeted long-term refinancing operations (TLTRO) the asset-backed securities purchasing program (ABSPP) and the forthcoming public
securities purchase program (PSPP)) have translated into a further decline in the long-term interest rate and the shadow policy rate It also reflects an increase in excess liquidity which has had a very benign effect on the recent recovery However producer prices developments (PPI) still appear unusually subdued Likewise including information capturing the interest rate channel does not help explain the dismal performance of consumption during the deleveraging phase (2012-2013) or the persistent weakness of credit dynamics Therefore these developments seem to be determined also by drivers other than monetary conditions
The borrowers balance sheet channel (Graph II9 lower panel) captures in turn the exceptional deleveraging developments of 20122013 but clearly underestimates the pace of the recent recovery This finding suggests that strained balance sheets of households and firms represented the main weight on the recovery at the time of euro area sovereign debt crisis However whereas a mild recovery started in the euro area in 2014 private
Graph II7 Conditional forecasts based on real GDP and inflation (1) (2000Q1-2015Q4 y-o-y growth)
Misalignments of financial and real variables with output growth since the crisis
(1) Shades of orange distribution of the conditional forecasts in the BVAR in levels excluding the lower and higher 5 quantiles Green line actual values The variables are all reported in terms of annual percentage changes except for the unemployment rate and the long-term interest rate which are in levels Conditioning assumptions real GDP and HICP Source DG ECFIN MATLAB codes replication files of the methodological paper (Banbura et al 2015)
Government consumption
2005 2010 2015-2
0
2
4Real consumption
2005 2010 2015-5
0
5Real investment
2005 2010 2015-20
-10
0
10
Unemployment rate
2005 2010 20150
5
10
15PPI ex const
2005 2010 2015-50
0
50House prices
2005 2010 2015-10
0
10
Long-term i r
2005 2010 20150
5
10Loans to firms
2005 2010 2015-10
0
10
20Loans to households
2005 2010 2015-5
0
5
10
28 | Quarterly Report on the Euro Area
balance sheets still did not improve much In fact when the borrower balance sheet channel is taken into account observed consumption overshoots the conditional forecast even by a higher margin than in the baseline scenario and real investment seems to be on the upper side as well This suggests that the borrower balance sheet channel should have led to more subdued dynamics of both consumption and investment than what has been observed in 2014 and 2015 indicating that other channels have been somewhat compensating the adverse effects of this channel
The bank balance sheet channel (Graph II10 upper panel) improves the forecast of investment since 2014 and reduces the uncertainty around the median for some variables such as consumption unemployment and long-term interest rate The good fit of investment dynamics indicates a strong correlation of investment with total economy credit developments both in terms of flows and stocks
Interestingly the bank balance sheet information namely the total economy credit as percentage of GDP (including credit to public sector) the private sector credit impulse and the price of credit for the private sector cannot capture the weak observed dynamics of outstanding loans to firms and households This shows that the private deleveraging process has been much stronger than the public sector deleveraging making private credit developments disconnected from GDP
growth (65) Therefore while the recovery in real activity has been rather weak the private credit dynamics have been even weaker Furthermore the modest recovery does not facilitate passive deleveraging (a decrease in the relative debt burden due to a growing economy ie denominator effect) and feeds the active deleveraging (a decrease of absolute level of debt ie nominator effect)
Finally the current long-term interest rate seems very low even when the financing costs for non-financial corporations (which also attained historical minima) are taken into account This underlines the importance of the ECBrsquos measures that imply very easy financing conditions in the foreseeable future
Last but not least the uncertainty channel (Graph II10) seems to improve the conditional forecast over the baseline in the same spirit as the bank balance sheet channel For example there is a good fit of investment indicating a strong correlation of investment with confidence and financial stress measures Equally the rebound in private consumption seems to be well captured by the uncertainty channel indicating that the recent decrease in financial markets stress has also been an important driver for consumption However in general the uncertainty channel is likely to be implicitly included in the bank balance sheet
(65) GDP is a denominator of the credit indicators in bank balance
sheet channel
Graph II8 Conditional forecasts based on real GDP and inflation (1) (2000Q1-2015Q4 y-o-y growth)
Business and consumer confidence and short-term interest rates
(1) Shades of orange distribution of the conditional forecasts in the BVAR in levels excluding the lower and higher 5 quantiles Green line actual values The variables are all reported in terms of annual percentage changes except for the unemployment rate and the long-term interest rate which are in levels Conditioning assumptions real GDP and HICP Source DG ECFIN MATLAB codes replication files of the methodological paper (Banbura et al 2015)
Economic sentiment
2005 2010 2015-15
-10
-5
0
5
10Short-term i r
2005 2010 2015-4
-2
0
2
4
6
8Shadow short-term interest rate
2005 2010 2015-6
-4
-2
0
2
4
6
II Financial channels and economic activity in the euro area
Volume 15 No 2 | 29
channel For example in periods of high uncertainty bank funding costs increase (bank balance sheet channel) and firms with weaker balance sheets cannot obtain credit for new loans (borrower balance sheet channel)
Overall the findings above suggest that while there is clear evidence of the transmission of monetary policy measures on financial variables and from financial variables to consumer lending rates the evidence on the effects on real activity is more complex with different channels playing an important role at different stages of the crisis The interest rate channel has helped the modest recovery since 2014 by supporting both public and private consumption growth and by partially compensating the balance sheet channel for both borrowers and banks The results in Graph II9 (lower panel) can be interpreted as showing that in the absence of massive monetary easing given the high level of debt in the economy and the wealth effects associated with house and asset prices decreases both private and public consumption growth could have been much more subdued than what it is currently observed
Graph II10 (both panels) illustrate the importance of the bank balance sheet and the uncertainty channel for capturing investment dynamics Weak investment growth is well captured both by credit developments as captured through the bank balance sheet channel and confidence effects through the uncertainty channel Real economic activity as measured by GDP growth while playing an important role does not seem to fully explain the subdued growth in investment since 2014 (Graph II7)
II5 Conclusions
The section discusses the nexus between financial and macroeconomic developments drawing some
lessons from the literature and providing some stylised facts on the main transmission channels through which financial developments have affected real economic activity since the crisis
While there is clear evidence of the transmission of monetary policy measures on financial variables and from financial variables to consumer lending rates the evidence on the effects on real activity is more complex with different channels playing an important role at different stages of the crisis
The state of private balance sheets seems to have significantly contributed to the poor performance of consumption during the euro area debt crisis and high debt levels still weigh on growth However given the still high level of debt the current mild recovery should be seen as a rather positive outcome The analysis suggests that easy monetary conditions seem to represent an important driver of the current recovery Another driver seems to be the balance sheets of banks which have gradually improved and allow better transmission of easy monetary conditions to the lending rates
Given the still high levels of debt in the economy and the wealth and confidence effects associated with house and asset prices corrections both private and public consumption growth could have been much more subdued than what it is currently observed were it not for the exceptional easing of monetary conditions
Unfortunately the recovery is still not strong enough to facilitate the deleveraging process The stock of debt and the ongoing deleveraging combined with adverse confidence effects still represent major impediments for a stronger recovery in investment Consequently there is a need to implement policy measures that allow dealing effectively with the debt overhang notably an effective framework for non-performing loans resolution
30 | Quarterly Report on the Euro Area
Graph II9 Conditional forecasts based on variables capturing the interest rate channel and borrower balance sheet channel (1)
(2000Q1-2015Q4 y-o-y growth)
Interest rate channel
Borrower balance sheet channel
(1) Shades of orange distribution of the conditional forecasts in the BVAR in levels excluding the lower and higher 5 quantiles Green line actual values The variables are all reported in terms of annual percentage changes except for the unemployment rate and the long-term interest rate which are in levels Conditioning assumptions interest rate channel ESI HICP the short-term interest rate the long-term interest rate the shadow interest rate and the ECB excess liquidity measure Conditioning assumptions borrower balance sheet channel ESI HICP house prices stock prices and outstanding loans to households and firms Due to the high contemporaneous correlation between real GDP growth and the ESI indicator the ESI indicator contains the same forecasting information as real GDP ESI indicator is used in the conditioning set instead of real GDP variable in order to also illustrate conditional forecasts for real GDP Source DG ECFIN MATLAB codes replication files of the methodological paper (Banbura et al2015)
Real GDP
2005 2010 2015-10
-5
0
5Government consumption
2005 2010 2015-2
0
2
4Real consumption
2005 2010 2015-5
0
5
Real investment
2005 2010 2015-20
-10
0
10Unemployment rate
2005 2010 20150
10
20PPI ex const
2005 2010 2015-50
0
50
House prices
2005 2010 2015-10
0
10
20Loans to firms
2005 2010 2015-10
0
10
20Loans to households
2005 2010 2015-10
0
10
20
Real GDP
2005 2010 2015-10
-5
0
5Government consumption
2005 2010 2015-2
0
2
4Real consumption
2005 2010 2015-5
0
5
Real investment
2005 2010 2015-20
-10
0
10Unemployment rate
2005 2010 20150
5
10
15PPI ex const
2005 2010 2015-50
0
50
Shadow short-term interest rate
2005 2010 2015-5
0
5
10Short-term i r
2005 2010 2015-5
0
5
10Long-term i r
2005 2010 20150
5
10
II Financial channels and economic activity in the euro area
Volume 15 No 2 | 31
Graph II10 Conditional forecasts based on variables capturing the bank balance sheet channel and uncertainty channel (1)
(2000Q1-2015Q4 y-o-y growth) Bank balance sheet channel
Uncertainty channel
(1) Shades of orange distribution of the conditional forecasts in the BVAR in levels excluding the lower and higher 5 quantiles Solid black line point estimate of the conditional forecasts in the BVAR in differences which is computed as the median of the distribution of the conditional forecasts in this model Green line with crosses actual values The variables are all reported in terms of annual percentage changes except for the unemployment rate and the long-term interest rate which are in levels Conditioning assumptions for the bank balance sheet channel ESI HICP the credit impulse the private credit volumes (debt-to-GDP ratio) and bank lending rates for households and firms (CFCI) Conditioning assumptions uncertainty channel ESI HICP the policy uncertainty indicator the CISS and the VIX Due to the high contemporaneous correlation between real GDP growth and the ESI indicator the ESI indicator contains the same forecasting information as real GDP ESI indicator is used in the conditioning set instead of real GDP variable in order to also illustrate conditional forecasts for real GDP Source DG ECFIN MATLAB codes replication files of the methodological paper (Banbura et al 2015)
Real GDP
2005 2010 2015-10
-5
0
5Government consumption
2005 2010 2015-2
0
2
4Real consumption
2005 2010 2015-2
0
2
4
Real investment
2005 2010 2015-20
-10
0
10Unemployment rate
2005 2010 20150
5
10
15PPI ex const
2005 2010 2015-50
0
50
Loans to firms
2005 2010 2015-10
0
10
20Loans to households
2005 2010 2015-10
0
10
20Long-term i r
2005 2010 20150
2
4
6
Real GDP
2005 2010 2015-10
0
10Government consumption
2005 2010 2015-2
0
2
4Real consumption
2005 2010 2015-5
0
5
Real investment
2005 2010 2015-20
0
20Unemployment rate
2005 2010 20150
5
10
15PPI ex const
2005 2010 2015-50
0
50
Loans to firms
2005 2010 2015-10
0
10
20Loans to households
2005 2010 2015-10
0
10
20Long-term i r
2005 2010 20150
5
10
III Confidence spillovers in the euro area
Volume 15 No 2 | 33
III1 Introduction
During the recent crisis euro area private consumption fell substantially This was accompanied by a sharp decline in consumer confidence which many observers have identified as a key factor contributing to the persistence of the slowdown In fact the onset of the crisis coincided with an abrupt unwinding of imbalances that is of economic trends that turned out to be unsustainable and which led to a significant adjustment of expectations Both consumption growth rates and confidence levels have been improving since the start of 2013
There is some (mixed) evidence to suggest that fluctuations in consumer confidence affect the dynamics of private consumption (67) On the basis of this assumption and taking into account the unprecedented extent of the most recent crisis it is important to determine whether and to what extent confidence shocks spill over between countries This is particularly relevant in relation to the euro area where close trade and financial links and common institutional features can lead to the rapid propagation of shocks In addition confidence spillovers can be an important aspect to consider when discussing how to improve macroeconomic policymaking in a common currency area
This section reviews the evidence on the link between consumer confidence and private consumption and on cross-border confidence spillovers and presents some analysis of the transmission of confidence shocks across the euro area It is a follow-up to analysis discussed in
(66) This section was prepared by Francesca DrsquoAuria (67) See for a discussion Ludvigson SC 2004 lsquoConsumer
confidence and consumer spendingrsquo Journal of Economic Perspectives Vol 18(2) pp 29-50
previous issues of the Quarterly Report on the Euro Area (QREA) (68)
III2 Recent trends in consumer confidence and private consumption in the euro area
Graph III1 shows the evolution over the period 1995Q2-2016Q1 of euro area real private consumption and consumer confidence The latter is measured by the Consumer Confidence Indicator constructed by the European Commission as part of the Joint Harmonised EU Programme of Business and Consumer Surveys (BCS) (69)
There is close co-movement between the two variables Both real consumption growth and consumer confidence showed the greatest deterioration in the first quarter of 2009 and during the sovereign debt crisis They have been on a recovery path since early 2013 with consumer confidence reaching levels above the euro area long-term average since the first quarter of 2014
The relationship between consumer confidence and private consumption is much debated in the literature From a theoretical perspective there are two main competing theories One view is that confidence indicators can help predict the dynamics of consumption as they convey information about future economic conditions Another theory is that the link between the two variables can be interpreted in terms of lsquoanimal
(68) DrsquoAuria F lsquoCross-border spillovers in confidencersquo Quarterly
Report on the Euro Area (2013) Vol 12(3) pp26-30 DrsquoAuria F S Linden D Monteiro J in lsquot Veld and S Zeugner
lsquoCross-border spillovers in the euro arearsquo Quarterly Report on the Euro Area (2014) Vol 13(4) pp7-22
(69) See European Commission (2016) lsquoA user guide to the Joint Harmonised EU Programme of Business and Consumer Surveysrsquo for details on the construction of the indicators
In recent years there has been close co-movement between consumer confidence and private consumption in the euro area During the crisis in particular consumer confidence was identified by many commentators as a driving factor in its persistence as expectations about a sustainable path of economic growth were adjusted significantly In view of the unprecedented extent of the crisis the question of whether and to what extent changes in consumer confidence in one country could spill over to other countries was also raised This section discusses the relationship between consumer confidence and consumption and reviews the evidence of consumer confidence spillovers between euro area countries We conclude that there is some evidence to suggest that confidence shocks are transmitted between countries This conclusion is corroborated by results from the estimation of a Global Vector Autoregressive (GVAR) model for a number of euro area countries (66)
34 | Quarterly Report on the Euro Area
spiritsrsquo as confidence indicators capture fluctuations in beliefs which in turn affect consumption (70) In both cases the essence of confidence indicators is to gauge expectations ndash irrespective of how they are formed ndash about the future course of the economy which then have a knock-on effect on current consumer behaviour
Graph III1 Confidence and private consumption euro area
(1995Q2-2016Q1 q-o-q change)
Source Eurostat and DG ECFIN calculations based on EU Business and Consumer Surveys
Several studies test empirically the link between consumer confidence and private consumption A number of them find evidence in support of a strong correlation between consumer confidence and consumption (71)
However as confidence and consumption are to a large extent determined by the same factors other studies try to assess whether confidence indicators carry information beyond economic fundamentals The evidence on this issue is mixed although several studies conclude that confidence indicators play a significant role There is some evidence to suggest that while part of the information conveyed by confidence indicators is also captured by other variables (eg past consumption income and interest rates) confidence measures have an additional predictive power for the future path of
(70) See Barsky and Sims (2012) for a discussion of the different
theoretical approaches to the role of confidence Barsky R B and ER Sims (2012) lsquoInformation animal spirits and the meaning of innovations in consumer confidencersquo American Economic Review 102(4) pp 1343-1377
(71) See for example Carroll C J Fuhrer and D Wilcox (1994) lsquoDoes consumer sentiment forecast household spending If so whyrsquo American Economic Review Vol 84 pp 1397-1408
consumer spending (72) Moreover some papers find that confidence indicators have a stronger predictive power during periods of large economic fluctuations (73)
III3 The existing evidence on confidence spillovers
On the assumption that a causal relationship between consumer confidence and private consumption exists it is important to determine whether and to what extent changes in consumer confidence in one country affect confidence (and thus consumption) in others
There is some evidence to support the existence of confidence spillovers This pertains both to confidence shocks originating in the US and being transmitted to the euro area and shocks which occur in one euro area country and spill over to other euro area countries
Several studies provide evidence of a transmission channel of confidence shock to foreign confidence In particular evidence for G7 countries and Spain would suggest that variations in confidence generally spill over from large countries to smaller ones (74) Some studies support the idea that confidence shocks originating in US are transmitted to the euro area but not the other way round ie shocks to euro area confidence do not affect confidence in the US (75) Other studies show a transmission channel for confidence shocks
(72) Some authors eg Ludvigson (2004) Souleles (2004) and Lahiri
Monokroussos and Zhao (2016) conclude that including confidence indicators can reduce forecasting errors when predicting the dynamics of consumption while others reach the opposite conclusion (eg Claveria Pons and Ramos 2007)
Ludvigson S (2004) lsquoConsumer confidence and consumer spendingrsquo Journal of Economic Perspectives Vol 18(2) pp 29-50
Souleles NS (2004) lsquoExpectations heterogenous forecast errors and consumption Micro evidence from the Michigan Consumer Sentiment Surveysrsquo Journal of Money Credit and Banking Vol 36 pp 39-72
Lahiri K G Monokroussos and Y Zhao (2016) lsquoForecasting consumption the role of consumer confidence in real time with many predictorsrsquo Journal of Applied Econometrics forthcoming
Claveria O E Pons and R Ramos (2007) lsquoBusiness and consumer expectations and macroeconomic forecastsrsquo International Journal of Forecasting Vol 23 pp47-69
(73) For example Howrey E (2001) lsquoThe predictive power of the index of consumer sentimentrsquo Brookings Papers on Economic Activity Vol 1 pp 175-216
(74) Fei S (2011) lsquoThe confidence channel for the transmission of shocksrsquo Banque de France Working Paper No 314
(75) Deacutees S and P Soares-Brinca (2013) lsquoConsumer confidence as a predictor of consumption spending Evidence for the United States and the Euro Arearsquo International Economics Vol 134 pp 1-14
-40
-30
-20
-10
0
10
1995Q2 1998Q2 2001Q2 2004Q2 2007Q2 2010Q2 2013Q2-08
-04
00
04
08
12
16Consumption (rhs)Consumer Confidence Indicator
III Confidence spillovers in the euro area
Volume 15 No 2 | 35
(Continued on the next page)
Box III1 A GVAR model to assess confidence spillovers
The Global Vector Autoregressive (GVAR) methodology developed by Pesaran Schuermann and Weiner (2004) (1) combines individual vector error-correcting models where domestic variables are linked to country-specific foreign variables The latter combine the domestic variables using international trade financial or other relevant weights for each country This approach allows the analysis of interdependence across different economies providing a solution to the lsquocurse of dimensionalityrsquo (eg the high number of parameters as the dimension of the model increases) in global modelling
For a set of countries i=0 1 2 hellip N the individual VARX(pi qi) models take the following form
itqtiiqtiiitiiptiiptiiit uxxxxxxii
+Λ++Λ+Λ+Φ++Φ= minusminusminusminus
11
011
where xit is a vector of ki x 1 vector of domestic variables xit a ki x 1 vector of foreign variables and
00
===
iijt
N
jijit xx ωω
where ωij j=01hellipN is a set of weights such that 10
==
N
jijω The foreign variables xit are therefore a
weighted average of domestic variables for all countries included in the model The weights can be different in nature but are typically constructed using trade or capital flows data The GVAR model is then solved for the lsquoworldrsquo (ie all countries included in the model) as a whole considering all variables as endogenous to the system
The GVAR model has been applied to a variety of issues These include forecasting (eg Pesaran Schuermann and Smith 2009) credit risk (eg Pesaran Schuermann and Treutler 2007) oil price shocks (eg Galesi and Lombardi 2009) global imbalances (eg Bussiegravere Chudik and Sestieri 2012) business cycle synchronisation (eg Dreger and Zhang 2013) the impact of EU membership (eg Pesaran Smith and Smith 2007) the international effects of fiscal policy shocks (eg Favero Giavazzi and Perego 2011) (2) Chudik and Pesaran (2014) provide a detailed review of these and other recent applications (3)
In this section this approach is used to analyse the transmission of country-specific and global consumer confidence shocks in a model which includes eight euro area countries (Austria Belgium Finland France Germany Italy the Netherlands and Spain) using quarterly data over the period 1996Q2-2013Q1 The model is solved using the GVAR Toolbox developed by Smith and Galesi (2014) (4)
(1) Pesaran MH Schuermann T and Weiner S M (2004) lsquoModelling regional interdependencies using a global error-correcting
modelrsquo Journal of Business and Economic Statistics Vol 22 pp 129-162 (2) Pesaran M H Schuermann T and Smith LV (2009) lsquoForecasting economic and financial variables with global VARsrsquo
International Journal of Forecasting Vol 25(4) pp 642-675 Pesaran MH Schuermann T and Treutler B-J (2007) lsquoGlobal business cycles and credit riskrsquo in The Risks of Financial Institutions NBER Chapters pp 419-474 Bussiegravere M Chudik A and Sestieri G (2012) lsquoModelling global trade flows results from a GVAR modelrsquo Globalization and Monetary Policy Institute Working Paper 119 Federal Reserve Bank of Dallas Dreger C and Zhang Y (2013) lsquoDoes the economic integration of China affect growth and inflation in industrial countriesrsquo FIW Working Paper series 116 FIW Pesaran M H Smith L V and Smith R P (2007) lsquoWhat if the UK or Sweden had joined the euro in 1999 An empirical evaluation using a Global VARrsquo International Journal of Finance and Economics Vol 12(1) pp 55-87 Favero C Giavazzi F and Perego F (2011) lsquoCountry heterogeneity and the international evidence on the effects of fiscal policyrsquo IMF Economic Review 59(4) 652-682
(3) Chudik A and Pesaran MH (2014) lsquoTheory and Practice of GVAR Modelingrsquo Federal Reserve Bank of Dallas Globalization and Monetary Policy Institute Working Paper No 180
(4) Smith LV and Galesi A (2014) GVAR Toolbox 20 available at httpssitesgooglecomsitegvarmodellinggvar-toolbox
36 | Quarterly Report on the Euro Area
between the US the euro area as a whole and four EU countries taken individually (76)
In addition the role of consumer confidence spillovers in the euro area was assessed in a previous issue of the QREA (77) Consumption and confidence regressions were carried out for a panel of euro area countries over the period 1999-2012 The findings support the existence of confidence spillovers between euro area countries
III4 Confidence spillovers across the euro area
Table III1 shows simple correlations between the confidence indicators of eight euro area countries over the period 1995Q4-2016Q1 (78)The strength of the link between consumer confidence indicators across Member States is variable and in most cases is larger between neighbouring countries and between countries sharing similar macroeconomic environments (79)
Table III1 Consumer Confidence Indicator mdash Correlation Matrix
(1995Q4-2016Q1)
(1) Not statistically significant at conventional levels Source DG ECFIN calculations based on EU Business and Consumer Surveys
(76) Deacutees S and J Guntner (2014) lsquoThe international dimension of
confidence shockrsquo ECB Working Paper No 1669 (77) Op cit DrsquoAuria F (2013) (78) The very low and non-statistically significant correlation of the
Italian confidence indicator with the confidence indicators of a number of other euro area countries is somewhat puzzling and there is a need for further investigation into the reasons behind it
(79) The strong correlation between confidence indicators in countries sharing similar economic conditions can be indicative of larger confidence spillovers between them but can also be a reflection of the strong correlation between their economic fundamentals
The strength of the correlation also varies considerably over time Table III2 displays correlations between consumer confidence indicators in the same euro area countries over the period 2008Q1-2012Q4 During the crisis period the link between consumer confidence indicators is significantly tighter
Table III2 Consumer Confidence Indicator mdash Correlation Matrix
(2008Q1-2012Q4)
(1) Not statistically significant at conventional levels Source DG ECFIN calculations based on EU Business and Consumer Surveys
The presence of a correlation between confidence indicators may point to the existence of confidence spillover effects between countries but also be indicative of strong business cycle synchronisation To shed light on the nature of these correlations this section discusses confidence spillovers in the euro area on the basis of the findings from the estimation of a Global Vector Autoregressive (GVAR) model which includes data for eight euro area countries over the period 1996Q2-2013Q1 Box III1 describes the model in more detail
The model includes observations on consumption GDP the unemployment rate a short-term interest rate and consumer confidence The latter is measured by the BCS Consumer Confidence Indicator which is an arithmetic average of the balances of the answers to questions on the financial situation of households the general economic situation unemployment expectations and savings over the next 12 months It is therefore taken as a proxy for consumersrsquo expectations about their future economic situation
The results seem to support the existence of consumer confidence spillovers across the euro area As an illustration Graph III2 reports impulse
AT BE FI FR IT DE NL ES
AT 100 069 069 074 013(1) 054 043 022BE 069 100 067 088 055 057 068 066FI 069 067 100 068 039 028 075 055FR 074 088 068 100 046 055 066 060IT 013(1) 055 039 046 100 004(1) 063 081DE 054 057 028 055 004(1) 100 033 023NL 043 068 075 066 063 033 100 073ES 022 066 055 060 081 023 073 100
AT BE FI FR IT DE NL ES
AT 100 093 090 088 036(1) 079 086 063BE 093 100 081 080 034(1) 080 081 071FI 090 081 100 083 058 052 081 066FR 088 080 083 100 030(1) 066 074 061IT 036(1) 034(1) 058 030(1) 100 -016(1) 065 038DE 079 080 052 066 -016(1) 100 050 048NL 086 081 081 074 065 05 100 050ES 063 071 066 061 038 048 050 100
Box (continued)
by the European Commission Consumption and GDP enter the model in log differences while the other variables are in levels Some of the results are discussed in the main text
III Confidence spillovers in the euro area
Volume 15 No 2 | 37
response functions of consumer confidence in the euro area countries included in the GVAR model to a positive shock to consumer confidence in Germany over 24 quarters (80)
The largest effect appears to be in smaller neighbouring countries (Austria Belgium and the Netherlands) The response of consumer confidence is also relatively large in Finland France and Spain On the other hand spillovers to consumer confidence in Italy are very small and become negative after six quarters This is not a surprise given the statistically insignificant correlation between German and Italian consumer confidence emerging from the data reported in Table III1 The peak response occurs in the second or third quarter
Similar results although of a smaller magnitude were obtained for the other euro area countries included in the model Confidence spillovers appear to be larger across countries with stronger geographical and trade links Overall the evidence from the estimation of the model supports the existence of a transmission channel for consumer confidence shocks across the euro area However the effects of confidence shocks on foreign consumption are in most cases not statistically significant suggesting that the transmission channel is to foreign confidence rather than
(80) A caveat must be made about the difficulty of identifying truly
exogenous confidence shocks owing to the fact that confidence indicators are largely driven by the same factors which determine consumption
directly to foreign economic activity (81)
These results suggest that confidence shocks play a role in the international business cycle and that there are close interlinkages between confidence indicators across euro area countries This evidence supports the need for coordinated policy action able to boost confidence across euro area countries
III5 Conclusions
In recent years the dynamics of euro area consumer confidence and real private consumption have been very closely related Moreover consumer confidence indicators across the euro area appear to be strongly correlated The strength of the correlation was considerably greater during the crisis period
The evidence of a link between real consumption and consumer confidence is mixed but several studies are supportive of consumer confidence playing a role in determining consumption In addition there is evidence to suggest that shocks to consumer confidence in euro area countries affect confidence in other euro area Member States This is also borne out by results obtained from the estimation of a Global Vector Autoregressive (GVAR) model for eight euro area countries
(81) Similar conclusions are reached by op cit Deacutees and Soares-Brinca
(2013) and Deacutees and Guntner (2014)
38 | Quarterly Report on the Euro Area
Graph III2 Impulse response functions of foreign confidence to a one standard error confidence shock in Germany
Source DG ECFIN
000
005
010
015
020
025
030
035
1 2 3 4 5 6 7 8 9 10 11 12 13 14 15 16 17 18 19 20 21 22 23 24
AT
000
005
010
015
020
025
030
035
040
1 2 3 4 5 6 7 8 9 10 11 12 13 14 15 16 17 18 19 20 21 22 23 24
BE
000
005
010
015
020
025
030
1 2 3 4 5 6 7 8 9 10 11 12 13 14 15 16 17 18 19 20 21 22 23 24
FI
000
005
010
015
020
025
030
1 2 3 4 5 6 7 8 9 10 11 12 13 14 15 16 17 18 19 20 21 22 23 24
FR
-002
-001
000
001
002
003
004
005
006
007
1 2 3 4 5 6 7 8 9 10 11 12 13 14 15 16 17 18 19 20 21 22 23 24
IT
000
005
010
015
020
025
030
035
040
1 2 3 4 5 6 7 8 9 10 11 12 13 14 15 16 17 18 19 20 21 22 23 24
NL
000
005
010
015
020
025
030
035
1 2 3 4 5 6 7 8 9 10 11 12 13 14 15 16 17 18 19 20 21 22 23 24
ES
40 | Quarterly Report on the Euro Area
Editors Jose Eduardo Leandro and Martin Larch
Coordination Plamen Nikolov
Statistical and layout assistance Christos Zavos
Comments on the report would be gratefully received and should be sent to
Jose Eduardo Leandro Director ndash Policy strategy coordination and communication Directorate-General for Economic and Financial Affairs Office CHAR 1566
B-1049 Brussels
Email joseleandroeceuropaeu
or
Martin Larch Head of Unit ndash EMU deepening and macroeconomy of the euro area Directorate-General for Economic and Financial Affairs Office CHAR 1556
B-1049 Brussels
Email martinlarcheceuropaeu
EUROPEAN ECONOMY INSTITUTIONAL SERIES
European Economy Institutional series can be accessed and downloaded free of charge from the following address httpeceuropaeueconomy_financepublicationseeipindex_enhtm Titles published before July 2015 can be accessed and downloaded free of charge from bull httpeceuropaeueconomy_financepublicationseuropean_economyindex_enhtm
(the main reports eg Economic Forecasts) bull httpeceuropaeueconomy_financepublicationsoccasional_paperindex_enhtm
(the Occasional Papers) bull httpeceuropaeueconomy_financepublicationsqr_euro_areaindex_enhtm
(the Quarterly Reports on the Euro Area)
Alternatively hard copies may be ordered via the ldquoPrint-on-demandrdquo service offered by the EU Bookshop httpbookshopeuropaeu
HOW TO OBTAIN EU PUBLICATIONS Free publications bull one copy
via EU Bookshop (httpbookshopeuropaeu) bull more than one copy or postersmaps
- from the European Unionrsquos representations (httpeceuropaeurepresent_enhtm) - from the delegations in non-EU countries (httpeeaseuropaeudelegationsindex_enhtm) - by contacting the Europe Direct service (httpeuropaeueuropedirectindex_enhtm) or calling 00 800 6 7 8 9 10 11 (freephone number from anywhere in the EU) () () The information given is free as are most calls (though some operators phone boxes or hotels may charge you)
Priced publications bull via EU Bookshop (httpbookshopeuropaeu)
ISBN 978-92-79-54335-7
KC-BC-16-030-EN-N
- NEW_IP_index_enpdf
-
- EUROPEAN EconomY institutional SERIES
-

I Cross-border risk sharing after asymmetric shocks evidence from the euro area and the United States
Volume 15 No 2 | 11
provides statistics on employment by citizenship and thus on the number of euro area workers who work in another Member State A caveat needs to be made here Employment by citizenship only approximates the number of cross-border commuter workers In the very narrow sense risk sharing through labour mobility is performed by commuter workers whose number fluctuates almost simultaneously with a shock in output while cross-border employment as presented in the graph also contains a structural pattern (13)
The share of euro area labour force that has an EU citizenship different from that of the reporting country has been increasing since the start of the survey There was a minor slowdown during the crisis but by 2015 the share of euro area workers who are citizens of another EU country had reached almost 4 Most of the increase since the beginning of the survey in 2006 can be attributed to workers from the new Member States By 2015 their number had surpassed the number of workers from the EU-15
Graph I4 Cross-border employment in the euro area (1)(2)
(2006-2015 y-o-y change)
(1) Employment by citizenship other than of the reporting country 15-64 year old of total employment (2) New Member States of the EU are those that joined after 2004 Source Eurostat
There is quite a disparity among Member States regarding the share of cross-border labour This means that cross-border risk sharing through this channel is not homogeneous across Member States as some countries likely benefit more from this
(13) Data on commuter workers that move in response to shocks are
unavailable in the Labour Force Survey
form of risk sharing than the rest In 2015 the share of workers that are citizens of another EU country varies between more than 10 in Ireland and Cyprus to as low as 06 in Portugal and below or close to 2 in France Finland the Netherlands Malta and Greece Luxembourg with its small size and high expatriate population is a clear outlier Workers from the new Member States are a clear majority of EU workers in Ireland Austria Spain and Italy This diversity among Member States suggests that the pattern of cross-border risk sharing through this channel is quite different depending on the country concerned
There is still quite a lot to be done to increase the impact of cross-border labour mobility on risk sharing among euro area Member States The line on Graph I4 clearly shows a pattern similar to the demand cycle during the crisis This means that the aggregate number of cross-border workers within the euro area is pro-cyclical This may help adjustment for example when cross-border workers return to their countries of origin after a negative shock in the host country (14) Yet at this stage given the lack of precise information on the number of cross-border commuters in the euro area it is difficult to arrive at more precise conclusions on the role of risk sharing through labour compensation in the various Member States
Financial integration
The rapid financial integration in the years between the EMUrsquos creation and the start of the global financial crisis undoubtedly provided conditions for better cross-border risk sharing in the euro area The increase in the importance and size of the financial services sector in the Member States followed similar developments in the other
(14) Putting this channel in a more comparative perspective is difficult
Annual interstate mobility in the US (a flow concept) is found to be 25 of working age population in 2005 This is a relatively high number compared to countries in Europe given that in 2006 29 of the euro area labour force had a citizenship of another EU country (a stock concept) See Bonin H W Eichhorst C Florman M Okkels Hansen L Skioumlld J Stuhler K Tatsiramos H Thomasen and K F Zimmermann (2008) lsquoGeographic mobility in the European Union optimising its economic and social benefitsrsquo IZA (Forschungsinstitut zur Zukunft der Arbeit) Research Report No 19 The crisis may have affected these estimates in a different way in the two blocs For evidence that the crisis has reduced the importance of migration across state borders as a labour market adjustment tool in the US see Foote A M Grosz and AH Stevens (2015) lsquoLocate your nearest exit mass layoffs and local labour market responsersquo NBER Working Paper Series No 21618 One possibility is that the Great Recession was unique given the role of the US housing crisis which impeded mobility
0
1
2
3
4
2006 2007 2008 2009 2010 2011 2012 2013 2014 2015
From the new Member States - BG CZ CYEE HU HR LV LT MT PL RO SK SL
From the old Member States - AT BE DKDE ES FI FR GR IE IT LU NL PT SEUK
12 | Quarterly Report on the Euro Area
advanced economies but in Europe the process was given an additional impetus by the creation of the common currency and linked to that the decrease in the costs of borrowing Previous analysis in this series has shown that financial market integration has supported cross-border risk sharing However this was less through equity markets and rather more through borrowing and saving on credit markets (15)
The crisis changed the perception about financial integration and the role of wholesale bank funding in a profound way The rapid cross-border expansion up until 2007 was followed by a retrenchment of financial intermediation behind state borders Moreover capital misallocation during the boom years appeared as a major destabilising factor after the crisis hit increasing the likelihood of asymmetries across Member States (16)
Not all cross-border financial instruments in the euro area have experienced the same deep fall since the crisis Graph I5 shows that in 2014 the cross-border deposits at euro area banks excluding positions vis-agrave-vis other banks stood at levels that were relatively close to those in the pre-crisis years despite localised drops in the immediate vicinity of the sovereign-debt crisis in 2008 (17)
Both cross-border loans and deposits expanded rapidly after the creation of the euro and judging from their level today the common currency plays an important role in risk sharing through cross-border provision of financial services However cross-border equity assets experienced a significant drop during the crisis and their recovery to pre-crisis levels has taken much longer than for cross-border deposits It is also important to stress that
(15) For an overview of increased pre-crisis financial integration and
its impact on risk sharing see lsquoCross-border risk sharing has it increased in the euro arearsquo in Quarterly Report on the Euro Area Vol 6 No3 (2007)
(16) For a presentation of the limits of shock absorption in the EMU since the crisis see Jevcak A and R Kuenzel lsquoRecent capital flow developments in the euro arearsquo in Quarterly Report on the Euro Area Vol 12 No2 (2013) Loublier A lsquoRecent developments in cross-border capital flows in the euro arearsquo in Quarterly Report on the Euro Area Vol 14 No1 (2015) and lsquoFinancial integration and risk-sharing in a monetary unionrsquo in Financial Integration in Europe (2016) ECB
(17) Naturally the share of large financial centres such as Ireland and Luxembourg as locations of cross-border financial positions in the euro area is disproportionately higher than their weight in the EMU population or GDP This is another example of the Member Statesrsquo uneven ability to share risk among each other through private channels
the size of the cross-border equity market is several times lower than the cross-border loan and deposit markets
Graph I5 Cross-border financial instruments in the euro area(1)
(2001-2014 Index 2001=100)
(1) For loans and deposits other bank counterparties are excluded Source Bank for International Settlements (BIS) reporting banks IMF Coordinated Portfolio Investment Survey (CPIS)
The euro facilitates private risk sharing through lowering transactions costs and deepening financial markets However as the crisis has shown appropriate measures to create a well-functioning Banking Union are also needed This includes in particular establishing a European Deposit Insurance Scheme (EDIS) thus building the third pillar of the Banking Union Given the current regime of country-based deposit insurance there are still differences in the regulatory treatment of banks Once operational the EDIS will work against country-specific shocks since it is likely to be fiscally neutral over time because insured risks will be spread and private contributions will be raised by a larger pool of banks In this way the EDIS together with a credible common backstop to the Single Resolution Fund will create further conditions for more cross-border presence of euro area banks by ensuring consistency in regulatory treatment and by shielding the financial sector from country-specific shocks It will therefore be another supporting factor in increasing competition in the financial sector lowering costs and increasing cross-border risk sharing
0
50
100
150
200
250
300
350
400
450
2001 2003 2005 2007 2009 2011 2013
Cross-border loansCross-border depositsCross-border equity assets
I Cross-border risk sharing after asymmetric shocks evidence from the euro area and the United States
Volume 15 No 2 | 13
I4 Empirical results of cross-state risk sharing in the euro area and the US
Econometric results on the relative weight of the different risk sharing channels among euro area Member States and US states are given below This sub-section updates findings of the canonical paper by Asdrubali et al (1996) (18) for the US states in the years since the crisis It next compares the US with the euro area and draws conclusions for the possible degree of risk sharing in the euro area had the latter possessed the capital and labour market characteristics of the former The comparison also acknowledges that the US is a federal state with a
(18) Asdrubali F B Sorensen and O Yosha (1996) lsquoChannels of
interstate risk sharing United States 1963-1990rsquo The Quarterly Journal of Economics November
sizeable budget while the EMU does not have common fiscal means to cope with asymmetric shocks
Cross-border risk sharing is measured using the system of national accounts The approach consists of sequential regressions of the balancing items in the primary and secondary distribution of income accounts and in the use of income account for the total economy (so including both the private and the public sector) in order to quantify the amount of co-movement of output income including after taxes and consumption after asymmetric shocks to output The method provides a breakdown of the relative size of the three different channels of cross-border risk sharing (net factor income fiscal transfers and credit markets) and the proportion of an asymmetric shock that remains unsmoothed
Graph I6 Channels of risk sharing 50 US States anchored-start regressions with rolling end dates (1)
(1990-2013 in of total asymmetric shock to output)
(1) Regressions cover 1964 until the year shown on the horizontal axis Regressions with rolling start and end dates did not give qualitatively different results Source US Bureau of Economic Analysis (BEA) US Office of Management and Budget (OMB) US Bureau of Labour Statistics (BLS) US Census Bureau DG ECFIN calculations
435
440
445
450
455
460
465
470
475
1990 1993 1996 1999 2002 2005 2008 2011
smoothed by net factor income
76
77
78
79
80
81
82
83
84
85
1990 1993 1996 1999 2002 2005 2008 2011
smoothed by federal taxes grants and transfers
235
240
245
250
255
260
265
270
275
280
285
1990 1993 1996 1999 2002 2005 2008 2011
smoothed by savings
160
165
170
175
180
185
1990 1993 1996 1999 2002 2005 2008 2011
not smoothed
14 | Quarterly Report on the Euro Area
See Box I1 for a full description of the model and its estimation
The Asdrubali et al (1996) methodology is applied to the 50 US states and to three sets of euro area Member States the euro area (EA) 19 except Malta Cyprus Luxembourg Lithuania Austria and Greece EA 12 except Luxembourg Austria and Greece and a set of euro area core and periphery countries (Germany Spain Ireland Netherlands and Portugal) The choice of euro area countries is partly based on data availability in the European System of Accounts 2010 and partly on the option to have a sample that excludes new Member States In this way it is possible to measure legacy effects from the closer integration even before the EMU and have a sample of countries in the EA12 core and periphery which are likely to experience more asymmetries
The time period chosen for the US is between 1964 and a rolling end date from 1990 until 2013 For the three different sets of euro area countries the time period is between 1999 and 2015 The time periods are chosen based on data availability while for the US it extends the period in Asdrubali et al (1996) The difference in the two time samples does not impair comparison between the two economies because risk sharing estimates for
an economy vary little depending on the period chosen (19) The main differences between two economies are driven by the legal institutional and economic structures that underpin risk sharing not by the different time samples
The most important result of the econometric exercise is that risk sharing among Member States is lower than across federal states in the US (20) The overall proportion of an asymmetric shock that is not smoothed in the euro area is more than four times larger than in the US (Table I1 last row) Naturally the gap comes from the different
(19) This is best illustrated when comparing estimates in the original
Asdrubali et al (1996) paper and its extension here See the small scale of the vertical axis in Graph II4 Note also that the econometric approaches in Asdrubali et al (1996) and the extension here are different 2-step generalised least squares vs panel-corrected ordinary least squares See Box II1 for more information
(20) The lower degree of risk sharing after asymmetric shocks in the euro area compared with the US was reported already after the first couple of years of the EMU For an overview see for example Demyanyk Y C Ostergaard and B Sorensen (2008) lsquoRisk sharing and portfolio allocation in EMUrsquo European Economy Economic Papers 334 and Sorensen B and O Yosha (1998) lsquoInternational risk sharing and European monetary unificationrsquo Journal of International Economics Vol 45 pp 211-238 On the other hand Furceri D and A Zdzienicka (2013) lsquoThe euro area crisis need for a supranational fiscal risk sharing mechanismrsquo IMF WP13198 point out that the crisis has hampered the ability of the euro area countries to share risk
Table I1 Cross-border risk sharing through different channels(1)(2) in of total asymmetric shock to output
(1) Time period for the euro area is between 2000q4 and 2015q4 while for the US it is between 1964 and 2013 To increase the number of observations risk sharing in the euro area is measured at a quarterly frequency (difference compared with the same quarter in the preceding year) However regressions with annual frequency did not produce qualitatively different results (2) Cross-border factor income includes property income such as income from cross-border ownership of equity rent income and cross-border labour compensation Source DG ECFIN calculations Asdrubali et al (1996)
Euro area
Euro area without the
New Member States
Core vs periphery US
Risk sharing throughall EA MS except CY MT LU LT
AT GR
EA12 except LU AT and
GR
DE ES IE NL and PT 50 states
00
56 20 34 448
02 -02 -01
757 617 631 176
cross-border factor income(2)
of which cross-border labour compensation
cross-border fiscal transfers
credit markets
unsmoothed
16 26 83
182 246 180 267
I Cross-border risk sharing after asymmetric shocks evidence from the euro area and the United States
Volume 15 No 2 | 15
political and institutional setups for sharing risks in the US and the euro area as well as the relatively big role of capital and labour markets for risk sharing in the US
Graph I6 shows the estimates of the amount of risk sharing through the different channels between the 50 US states following an asymmetric shock to output The lines report the evolution of the regression estimates depending on the end date of the time series starting with an end date in 1990 The goal is to evaluate how the different channels evolved since 1990 Table I1 compares the three euro area samples with the US
Cross-state risk sharing through net factor income remains the largest contributor to consumption smoothing following an asymmetric shock in the US This channel includes risk sharing through cross-state property income such as retained earnings and income streams from cross-state ownership of shares as well as smoothing through labour earnings by commuters across state borders It is natural that these income streams are hampered during recessions Graph II4 shows two steep drops in its relative weight which broadly correspond to the recessions in 2001 and 2008-9 (21)
The estimates in Table I1 show that there is a big difference between the role of cross-border net factor income among the euro area Member States and the US states This comes as a result of the higher degree of labour mobility and deeper and more integrated capital markets in the US Higher risk sharing through this channel is to be expected given the high annual interstate mobility and the high number of commuter workers across state border in the US (22) Better capital market development in the US is also well documented see Valiante (2016) (23) for evidence that Europersquos capital markets are poorly functioning and underdeveloped compared to the US
The relative share of fiscal redistribution across state borders in the US is lower than the shares of the private channels For the full time series
(21) Even though visually pronounced these drops are small in
absolute terms Note the scale of the vertical axes on Graph II4 again supporting the conclusion that the choice of a time period has a minor impact on the absolute value of the risk sharing coefficients while keeping their relative proportion constant
(22) See Bonin et al (2008) op cit (23) Valiante D (2016) lsquoEuropersquos untapped capital market rethinking
integration after the great financial crisisrsquo CEPS Paperback
between 1964 and 2013 the relative weight of fiscal support in risk sharing is around 85 Risk sharing through this channel has been at its highest level since the start of the crisis as the federal government provided support to struggling states
The role of cross-border public risk sharing in the euro area is smaller than in the US although the difference is less striking than for the cross-border private channels The largest role for the public channel comes up when the sample of euro area countries includes only those that benefited from official support during the crisis years This should come as no surprise given that the euro area does not have a common fiscal capacity to absorb shocks
The importance of credit markets for cross-border risk sharing is more similar in the euro area and the US than the other channels This includes borrowing by both the private and the public sector The role of public sector borrowing in risk sharing is likely smaller than the one of the private sector while stabilisation through purely domestic means is not considered here (24) The role of euro area credit markets in smoothing an asymmetric output shock is more similar to the one in the US in the pre-2004 euro area sample than in the other two euro area samples This reflects a very high degree of financial deepening in the old Member States compared to those that joined recently While encouraging at face value this result also needs to take into account that pre-crisis cross-border financial flows in some of the old Member States turned out to be unsustainable as a result of insufficient risk management and supervision
The overall proportion of an asymmetric shock that is not smoothed between the 50 US states is around 18 compared to more than 60 among the euro area Member States Given that the US is a federal country with a long history of fiscal redistribution and that it has well-developed capital markets with a large presence across state borders it is to be expected that the euro area could achieve a higher degree of cross-border risk sharing once
(24) Some authors have separated this channel into saving and
borrowing on the credit markets by private entities (households and non-financial corporations) and public entities (national and local governments) See for example Furceri and Zdzienicka (2013) they find that the role of public access to credit markets for cross-border risk sharing in the euro area is several times lower than the role of private savingborrowing That is to be expected given the provisions of the Stability and Growth Pact and the relative sizes of the private and public sectors
16 | Quarterly Report on the Euro Area
changes to its institutional setup towards more integration come into being (25) However shock absorption through fiscal redistribution in a fully-fledged fiscal union such as the US is not more than around 85 of the asymmetric shock (as measured by the rolling end date regressions) even though it has increased since the crisis
Therefore a much bigger part of cross-border risk sharing in the EMU could potentially come through private channels such as integrated capital markets once the Capital Markets Union is in place
I5 Conclusion
The econometric results presented in this section point to the great potential for improvement in smoothing asymmetric shocks in the euro area When comparing the amount of an asymmetric shock that remains unsmoothed by the private and public channels of cross-border risk sharing in the euro area and the US the importance of the recent initiatives to build a Capital Markets Union stand out The significance of factor income flows which include labour compensation and capital income generated across state borders in the US could serve as a model for a euro area where capital markets play an important role in cushioning asymmetric shocks across borders Also the creation of the Single Supervisory Mechanism and other innovations in the regulatory environment in
(25) The level of integration will probably not be of the same
magnitude since it is unlikely that the union between euro area member states will soon be politically and institutionally the same as the one between the 50 US states
the euro area are likely to make risk sharing through credit markets more sustainable going forward
Completion of the European Banking Union by establishing a European Deposit Insurance Scheme (EDIS) will also facilitate risk sharing among Member States The EDIS is expected to increase the cross-border presence of euro area banks by ensuring consistent regulatory treatment regardless of country of operation and will offer protection against country-specific shocks Completing the Banking Union will create conditions for more financial integration which is expected to increase competition among banks and thus lower intermediation costs and further increase cross-border risk sharing
The importance of the public channel of cross-border risk sharing in the euro area on the other hand should be seen in contrast with its role in the US a fully-fledged fiscal union where fiscal redistribution among states has an important role Even though the relative significance of this channel in the US has increased with the crisis taxes grants and fiscal transfers in the 50 states contribute relatively less to smoothing asymmetric shocks than the private channels Therefore policy efforts to achieve a higher degree of private cross-border risk sharing in the euro area especially through capital markets and equity holdings should remain the priority option
I Cross-border risk sharing after asymmetric shocks evidence from the euro area and the United States
Volume 15 No 2 | 17
(Continued on the next page)
Box I1 Empirical methods to estimate relative weights of cross-border risk sharing channels
This box presents the econometric methodology used to estimate the relative importance of the different cross-border risk sharing channels after an asymmetric shock in the euro area and the US
It is important to look at the balancing items in the primary and secondary distribution of income accounts and the use of income account in the European System of National Accounts 2010 (ESA 2010) in order to review the necessary variables for the estimation process Data for Belgium for 2014 can be used as an illustration to arrive at the required several balancing items (1) One channel of risk sharing is the difference between gross domestic product (GDP) and gross national income (GNI) ndash risk sharing through net international factor income The bigger this difference and the lower its correlation over time with GDP the more risk sharing there is through net international factor income In order to come up with this difference mdash EUR 6038 billion in this example mdash one has to add the net of several items For example there is a difference of EUR 5715 billion between compensation of employees paid by employers in Belgium including to workers who take their earnings abroad where they are domiciled and compensation of employees received by workers in Belgium including by workers who work in other countries but bring their earnings back to Belgium where they are domiciled This is a net positive inflow of income from a Belgian perspective Other items that are treated in the same way are production taxes paid (collected) by firms (governments) and subsidies on production earned (distributed) by firms (governments) Any cross-border net inflow here will be due to fewer of these taxes paid by Belgian firms abroad compared to foreign firms in Belgium and more of these subsidies earned by Belgian firms abroad compared to foreign firms in Belgium Finally property income which includes interest for example on debt securities equity dividends reinvested earnings and some other items is treated in the same way For example a net inflow occurs if Belgian citizens receive more dividends from foreign companies than foreigners from Belgian companies
Another channel of risk sharing is through cross-border fiscal redistribution This makes the difference between GNI and gross disposable income (GDI) Here a net inflow in Belgium will occur if social transfers received by Belgian persons and entities from foreign sources outweigh the transfers received by foreigners in Belgium The same will happen if income and wealth taxes paid by foreigners in Belgium are higher than income and wealth taxes paid by Belgians abroad
Finally the difference between GDI and consumption is gross savings through which consumption can be smoothed Borrowings and savings are channelled through domestic and foreign financial intermediaries
At the state level in the US some of these balancing items are not available Specifically state national income and state disposable income are constructed using the method in the Appendix in Asdrubali et al (1996) (2)
Asdrubali et al (1996) propose a series of regressions of these balancing items to estimate the relative
importance of each of the risk sharing channels Starting from the identity = ∙ ∙ ∙ it is
easy to show that a relationship 1 = + + + exists where the beta terms are the estimates of the regression coefficients in ∆ minus ∆ = + ∙ ∆ + ∆ minus ∆ = + ∙ ∆ + ∆ minus ∆ = + ∙ ∆ + ∆ = + ∙ ∆ + The beta terms are interpreted as the relative weights of cross-border risk sharing due to net factor income fiscal transfers savings and borrowings on credit markets The last beta coefficient shows the amount of an asymmetric shock that remains unsmoothed The panel regressions include time fixed effects μ and error terms u
18 | Quarterly Report on the Euro Area
Box (continued)
There are three sets of panels for the euro area EA19 except Malta Cyprus Luxembourg Lithuania Austria and Greece EA12 except Luxembourg Austria and Greece and a set of euro area core and periphery countries (Germany Spain Ireland Netherlands and Portugal) The choice of euro area countries is partly based on data availability in the European System of Accounts 2010 and partly on the option to have a sample that excludes new Member States to be able to measure legacy effects from the closer integration even before the EMU and to have a sample of countries in the EA12 core and periphery which are likely to experience more asymmetries The US sample includes the 50 US states
The time period chosen for the US is between 1964 and a rolling end date from 1990 until 2013 For the three different sets of euro area countries the time period is between 1999 and 2015 The time periods are chosen based on data availability while for the US it extends the period in Asdrubali et al (1996)
The regressions are estimated with 2-step generalised least squares (GLS) correcting for heteroscedasticity and cross-sectional correlation in the case of the euro area and ordinary least squares (OLS) with panel-corrected standard errors in the case of the US The latter method is better suited for panels with larger cross-sections while the former method is better in the opposite case (3) Both estimations include a common AR1 autocorrelation structure within panels The first differences in the quarterly euro area data are in terms of the same quarter of the preceding year The euro area regressions also include a further breakdown of GNI into one corrected only for cross-border labour compensation and one for the other elements of net factor income
Econometric results are in the table below All estimates marked with are statistically significant at the 99 confidence level Z-statistics are in parentheses
Table 1 Regression results
Source US Bureau of Economic Analysis (BEA) US Office of Management and Budget (OMB) US Bureau of Labour Statistics (BLS) US Census Bureau Eurostat DG ECFIN calculations (1) For more information see Box 2 in lsquoCross-border risk sharing has it increased in the euro arearsquo in QREA Vol 6 No3 (2007) (2) Asdrubali F B Sorensen and O Yosha (1996) lsquoChannels of interstate risk sharing United States 1963-1990rsquo The Quarterly Journal
of Economics November (3) These are standard econometric approaches in estimating cross-border risk sharing For a short discussion on the econometrics of
cross-border risk sharing see Hepp R and J von Hagen (2013) lsquoInterstate risk sharing in Germany 1970mdash2006rsquo Oxford Economic Papers Vol 65 No1 pps 1-24
(1) (2) (3) (4)Risk sharing through 2-step GLS 2-step GLS 2-step GLS PC-OLScross-border factor income 00552 00199 00343 04476
(722) (316) (568) (1198)of which cross-border labour compensation 00024 -00015 -00012
(281) (-414) (-282)cross-border fiscal transfers -00007 00156 00257 00832
(-039) (847) (761) (803)credit markets 01815 02459 01800 02668
(1738) (831) (478) (508)unsmoothed 07574 06171 06312 01760
(3784) (2505) (1838) (505)
Countries
Full panel - 13 countries BE
DE EE ES FI FR IE IT LV NL PT
SK SL
Old member states - 9
countries BE DE ES FI FR IE IT
NL PT
Core vs periphery - 5 countries DE ES IE NL PT
50 US states
Period 2000Q4-2015Q4 2000Q4-2015Q4 2000Q4-2015Q4 1964-2013No of observations 793 549 305 2500
II Financial channels and economic activity in the euro area
Volume 15 No 2 | 19
II1 Introduction
Since the global economic and financial crisis the linkages between macroeconomic and financial developments have been on the frontline of both research and policy making The massive dislocations observed during the crisis have forged a broad consensus that shocks originating in the financial sector can have profound effects on real economic activity and vice versa While the effect of macroeconomic developments on financial conditions is rather straightforward (27) the effect of financial developments on the macroeconomy is more complex and was (until recently) largely omitted in mainstream macroeconomic thinking The interest rate was the only financial variable included in standard macroeconomic models and only to the extent that it was assumed to influence the decisions of economic agents while no genuine role was assigned to the financial sector itself In reality financial intermediation is subject to numerous frictions that can affect macroeconomic developments via diverse transmission channels Given the decisive role of bank credit in financing the euro area economy shocks originating in the banking sector are of crucial importance
This section looks at macro-financial linkages in the euro area to shed light on how financial developments may have contributed to disappointing macroeconomic performance in the
(26) This section was prepared by Narcissa Balta and Bořek Vašiacuteček (27) Jacobson T J Linde and K Roszbach (2005) lsquoExploring
interactions between real activity and the financial stancersquo Journal of Financial Stability Vol 1 No 3 pp 308ndash41
recent past The methodology employed for this purpose is a large-scale Bayesian Vector Autoregression (VAR) that encompasses a wide set of macroeconomic and financial variables (28)
Subsection I2 discusses the importance of the financial system for the real economy and briefly reviews the relevant economic literature Subsection I3 describes the main transmission channels from financial markets to the real economy and defines specific variables that could be used to capture these transmission channels in the euro area Subsection I4 presents the results of the empirical analysis particularly some stylised facts on the co-movement between financial variables and economic activity since the crisis
II2 The financial system and the real economy
Market frictions are normally understood as a wide range of different bottlenecks that do not allow markets to efficiently clear demand and supply Financial frictions are impediments to the smooth functioning of the financial market that do not allow funds to be channelled effectively from creditors to borrowers Therefore they play an important role in the way the financial system affects the real economy Moreover the presence of frictions during periods of financial turmoil undermines the effectiveness of monetary policy
(28) Bańbura M D Giannone and M Lenza (2015) lsquoConditional
forecasts and scenario analysis with vector autoregressions for large cross-sectionsrsquo International Journal of Forecasting Vol 31 Issue 3 pp 739ndash756
This section discusses the nexus between financial and macroeconomic developments in the euro area It draws on key lessons from the literature and provides stylised facts on the main transmission channels through which financial developments have affected real economic activity since the crisis Macro-financial linkages are investigated from an empirical perspective for the euro area as a whole by looking at four key channels i) the interest rate channel ii) the borrower balance sheet channel iii) the bank balance sheet channel and iv) the uncertainty channel
Overall the results suggest that financial variables have significant impact on macroeconomic developments but also that the transmission seems to have changed since the crisis Notably the interest rate channel has helped the modest recovery since 2014 by supporting both private and public consumption The positive boost given to favourable financing conditions in 2015 has been somewhat compensating the adverse effects of the borrower balance sheet channel The bank balance sheet channel and the uncertainty channel play a particularly important role in capturing the weakness in the current rebound in investment (26)
20 | Quarterly Report on the Euro Area
transmission and financial sector stability which via feedback effects can have a detrimental impact on macroeconomic developments For instance hikes in bank funding costs when money markets stop functioning are likely to be transmitted to the lending rates applied to consumers which in turn can have a significant drag on both investment and consumption Also financial frictions increase the likelihood of financial shocks occurring both from the demand and the supply side
Financial shocks are usually deemed to be very persistent and have amplification effects in the sense that even small shocks can produce large and long-lasting effects (29) Graph II1 shows a clear negative correlation between GDP growth and financial distress in the euro area as measured by the Composite Indicator of Systemic Stress (CISS) (30)
Graph II1 Real GDP growth vs Composite indicators of systemic stress
(2000Q1-2016Q1)
Source ECB Eurostat
Since the key role of the financial sector consists in funding economic activity new credit is the main channel of transmission between the financial sector and the macroeconomy Financial shocks occurring on the demand side are usually triggered by an impairment of borrowers balance sheets
(29) Brunnermeier M K T Eisenbach and Y Sannikov (2012)
lsquoMacroeconomics with financial frictions A surveyrsquo National Bureau of Economic Research Working Paper No 18102
(30) The CISS measures contemporaneous stress in the financial system It is an aggregate of five market-specific sub-indices More weight is put when stress prevails in several market segments at the same time thus tracking financial stress of systemic nature
Holloacute D M Kremer and M Duca (2012) lsquoCISS-a composite indicator of systemic stress in the financial systemrsquo European Central Bank Working Paper No (No 1426)
which in turn undermines their creditworthiness and their capacity to invest and consume Financial shocks occurring on the supply side (ie those that originate from within the financial sector) normally manifest themselves through tightening of credit conditions andor credit rationing which again impact real economic activity via the investment behaviour of households and non-financial corporations Graph II2 shows the negative correlation between credit standards for firms and real investment (31)
Graph II2 Investment growth vs credit standards for NFC
(2003Q1-2016Q1)
Source ECB BLS Eurostat
Financial frictions have been fully embedded into macroeconomic models only recently
The neglect of financial sector effects in traditional macroeconomic thinking has its foundation in the famous Modigliani-Miller theorem (32) The theorem argues that the way a firm finances its investment (via debt or via equity) has no effect on its value and thus that their investment decisions are driven primarily by macroeconomic conditions (namely the real interest rate) rather than financial market developments However the validity of the theorem hinges on a set of very restrictive assumptions such as perfect information equal tax treatment for debt and equity etc which are generally not met in practice (33) Financial
(31) Credit standards are measured by the backward looking three
months index from ECB Bank Lending Survey (BLS) (32) Modiglini F and M Miller (1958) lsquoThe cost of capital
corporation finance and the theory of investmentrsquo The American Economic Review Vol 48 No 3 pp 261-297
(33) Morley J (2016) lsquoMacro-finance linkagesrsquo Journal of Economic Surveys forthcoming
-8
-6
-4
-2
0
2
4
6
0
10
20
30
40
50
60
70
80
2000Q1 2003Q1 2006Q1 2009Q1 2012Q1 2015Q1
CISS
GDP y-o-y change(rhs)
-15
-10
-5
0
5
10
-10
-5
0
5
10
15
20
25
30
35
40
2003Q1 2005Q1 2007Q1 2009Q1 2011Q1 2013Q1 2015Q1
Change in creditstandards for NFCInvestment y-o-y change (rhs)
II Financial channels and economic activity in the euro area
Volume 15 No 2 | 21
intermediation typically involves asymmetry of information between borrowers and lenders and potentially costly verification of the borrowers financial situation (34)
The first attempts to include financial frictions in macroeconomic models were based on the insight that the cost of external financing very much depends on the borrowers net worth (35) andor the market value of their collateral (36) In fact changes in asset prices turn out to be a crucial determinant of both the cost of external financing and the value of collateral Moreover a relatively small shock can have a major effect on economic activity through the so-called financial accelerator whereby negative feedback loops between lower assets prices restricted access to credit and lower consumption and investment significantly amplify and prolong the impact on the real economy (37) Real estate which is a typical asset used as collateral by both households and firms establishes a tight link between the housing market and the economy as a whole (38)
While the original theoretical contributions did not explicitly model financial intermediaries (assuming direct lending from investors to borrowers) the inclusion of financial intermediaries (ie the banking sector) implies that financial frictions can appear also on the lendersrsquo side (39) Specifically financial intermediaries can become balance sheet constrained in times of economic and financial stress which affects their funding costs Such shocks to the lendersrsquo side are usually mitigated by central bank intermediation during crisis times (40)
(34) Carlstrom C T and T S Fuerst (1997) lsquoAgency costs net worth
and business fluctuations A computable general equilibrium analysisrsquo The American Economic Review Vol 87 No 5 pp 893-910
(35) Bernanke B and M Gertler (1989) lsquoAgency costs net worth and business fluctuationsrsquo The American Economic Review Vol 79 No 1 pp 14-31
(36) Kiyotaki N and J Moore (1997) lsquoCredit cyclesrsquo Journal of Political Economy Vol 105 Issue 2 pp 211-248
(37) Bernanke B S M Gertler and S Gilchrist (1999) lsquoThe financial accelerator in a quantitative business cycle frameworkrsquo Handbook of Macroeconomics Vol 1 Part C pp 1341-1393
(38) Iacoviello M and S Neri (2010) lsquoHousing market spillovers evidence from an estimated DSGE modelrsquo American Economic Journal Macroeconomics Vol 2 No 2 pp 125-164
(39) Gertler M and N Kiyotaki (2010) lsquoFinancial intermediation and credit policy in business cycle analysisrsquo Handbook of Monetary Economics Vol 3 Issue 3 pp 547-599
(40) Gertler M and P Karadi (2011) lsquoA model of unconventional monetary policyrsquo Journal of Monetary Economics Vol 58 Issue 1 pp 17-34
Despite intensive efforts in recent years the financial sector is still not fully established as a consolidated part of conventional macroeconomic models Structural models augmented by a banking sector and financial markets (41) typically find that financial factors such as bank liquidity constraints are indeed the main drivers of economic fluctuations in both the US and the euro area and that they were the main shock propagator during the global financial crisis (42)
Empirical evidence on macro-financial linkages
There is now a wide consensus that financial cycles are crucial for understanding business cycle fluctuations (43) Numerous empirical studies evaluate the effects of financial shocks on macroeconomic fluctuations Importantly financial factors can both reinforce the transmission of other shocks and be a source of disturbance in their own right
Credit appears to be one of the most studied financial variables in empirical studies due to its established regularities in terms of boom-and-bust behaviour and its link to financial crises and economic downturns (44) Credit spreads play an important role for capital markets-based systems like the US economy For example corporate bond spreads usually increase disproportionately during periods of financial stress (so-called excess bond premiums) which in turn causes economic activity to contract (45) In the euro area where external financing is mostly bank based a crucial role is played by bank lending rates and bank lending volumes Credit supply shocks have been identified
(41) Christiano L J R Motto and M Rostagno (2010) lsquoFinancial
factors in economic fluctuationsrsquo European Central Bank Working Paper No 1192
(42) Gerke et al (2013) and Wieland et al (2015) provide detailed comparison exercise for different macrofinancial models
Gerke R M Jonsson M Kliem M Kolasa P Lafourcade A Locarno K Makarski and P McAdam (2013) lsquoAssessing macro-financial linkages A model comparison exercisersquo Economic Modelling Vol 31 pp 253-264
Wieland V E Afanasyeva M Kuete and J Yoo (2015) lsquoNew methods for macro-financial model comparison and policy analysisrsquo mimeo
(43) Borio C (2012) lsquoThe financial cycle and macroeconomics what have we learntrsquo Bank for International Settlements Working Papers No 395
(44) Balke N S (2000) lsquoCredit and economic activity credit regimes and nonlinear propagation of shocksrsquo Review of Economics and Statistics Vol 82 No 2 344-349
(45) Gilchrist S and E Zakrajšek (2012) lsquoCredit spreads and business cycle fluctuationsrsquo The American Economic Review Vol 102 No 4 pp 1692-1720
22 | Quarterly Report on the Euro Area
as important determinants of the increase in lending rates and the decline in lending volumes during the recent crisis (46) Bank lending represents the main transmission mechanism in the euro area
The evidence available indicates that the impact of financial shocks on the macroeconomy is lsquostate dependentrsquo ie the response of economic activity inflation and credit to financial shocks is stronger during periods of stress This is well documented for both the euro area and the US (47) Moreover during periods of high systemic stress financial shocks tend to have both a larger magnitude and a greater impact on real activity (48) Notably a single indicator of systemic stress such as the CISS for the euro area has been found to explain a significant part of macroeconomic developments especially due to episodes of elevated systemic stress such as the global financial crisis and the euro area debt crisis (49)
While studies on financial and business cycle have been popular for some time there has been much less investigation into macro-financial linkages between countries Existing evidence indicates that such linkages exist but their intensity varies both across time and across countries Specifically it has been documented that the observed heterogeneity is mainly due to country-specific characteristics which lead to international spillovers having a differentiated impact across countries (50) Such heterogeneity seems also to be present within the euro area
(46) Moccero D N M D Pariegraves and L Maurin (2014) lsquoFinancial
Conditions Index and identification of Credit Supply Shocks for the Euro Arearsquo International Finance Vol 17 Issue 3 pp 297-321
(47) Hubrich K and R J Tetlow (2015) lsquoFinancial stress and economic dynamics the transmission of crisesrsquo Journal of Monetary Economics Vol 70 pp 100-115
Prieto E S Eickmeier and M Marcellino (2016) lsquoTime variation in macro‐financial linkagesrsquo Journal of Applied Econometrics forthcoming
Silvestrini A and A Zaghini (2015) lsquoFinancial shocks and the real economy in a nonlinear world a survey of the theoretical and empirical literaturersquo Journal of Policy Modeling Vol 37 pp 915ndash929
(48) Hartmann P K Hubrich M Kremer and R J Tetlow (2015) lsquoMelting down Systemic financial instability and the macroeconomyrsquo mimeo
(49) Kremer M (2015) lsquoMacroeconomic effects of financial stress and the role of monetary policy a VAR analysis for the euro arearsquo International Economics and Economic Policy Vol 13 Issue 1 pp 1-34
(50) Ciccarelli M E Ortega and M T Valderrama (2016) lsquoCommonalities and cross-country spillovers in macroeconomic-financial linkagesrsquo The BE Journal of Macroeconomics Vol 16 Issue 1 pp 231-275
II3 Transmission channels from financial to macro developments
In spite of the broad consensus about the existence of macro-financial linkages the identification of the transmission channels is still a subject of debate There are different ways to classify the channels through which the financial sector might affect macroeconomic developments The important distinction applied in this section is whether the linkages are related to the balance sheets of borrowers or lenders At the same time the financial channels are also closely related to monetary transmission which affects their functioning (51) This subsection aims to better define the individual transmission channels in the euro area
The interest rate channel illustrates how money market rates affect the overall financing costs of the banking sector the price of credit and consequently consumption and investment decisions This channel is closely related to monetary policy decisions as they directly affect the funding costs of banks Moreover at the zero lower bound when the central bank uses other instruments besides short-term interest rates to conduct monetary policy this channel is more complex and difficult to assess
Thus in the analysis below the interest rate channel will be captured by variables that are affected by monetary policy decisions (Graph II3) In the euro area the most frequently used indicator directly affected by the ECBrsquos policy rates is the short-term interbank interest rate (EONIA) While the effect of monetary policy actions on short-term rates is rather quick there is also a delayed effect on long-term interest rates The long-term rates are of specific relevance in the current time as short-term rates are at the zero lower bound and monetary policy aims to affect long rates directly While long-term rates are commonly defined by the yield on respective sovereign bonds in the euro area this applies to a pool of euro area sovereigns As the yields diverge across sovereigns since the global financial crisis long-term rates in the euro area have become disconnected from short-term rates Since the ECB has employed diverse unconventional measures that affect the
(51) See for instance Basel Committee on Banking Supervision (2011)
lsquoThe transmission channels between the financial and real sectors a critical survey of the literaturersquo BCBS Working Paper No 18
II Financial channels and economic activity in the euro area
Volume 15 No 2 | 23
financial system additional measures need to be used to track their effect namely the shadow rate which is a factor model-based estimate of the short-term interest rate unconstrained by the ZLB (52) Likewise the excess liquidity defined as the liquidity held by the euro area banking sector in excess of the aggregate needs arising from minimum reserve requirements and autonomous factors is another quantitative-based indicator of the monetary policy stance as it is driven by the ECBrsquos refinancing operations
Graph II3 shows the dynamics of the variables described above in the period Q1-1996 - Q1-2016 which suggest that monetary conditions have been very supportive in recent years While short-term interest rates attained the ZLB monetary easing through unconventional measures is reflected in a significant decline in the shadow rate as well as long-term rates
Graph II3 Interest rate channel (2000Q1-2016Q1 )
Source Eurostat Bloomberg Reserve Bank of New Zealand
The borrower balance sheet channel reflects the fact that it is the net worth of borrowers that determines the external finance premium ie the opportunity cost of borrowing over using internal savings In other words it is the value of borrowersrsquo collateral that affects their credit conditions As indicated above fluctuations in
(52) There different shadow rates available all being subject of
significant model uncertainty The shadow rate used is based on Krippner (2012) and available from the Reserve Bank of New Zealand website
Krippner L (2012) lsquoMeasuring the stance of monetary policy in zero lower bound environmentsrsquo Economics Letters Vol 118 Issue 1 pp 135ndash138
asset prices can affect the ability of non-financial corporations and households to borrow and thus their investment and spending decisions While monetary policy commonly does not target asset prices its actions can affect the valuation of assets used as collateral which affects the credit available for investment and consumption spending (53) Whereas the previous discussion focuses on the demand side of credit the borrower balance sheet channel affects also the supply of credit Namely weak borrower balance sheets might induce credit rationing by the lenders and affect overall credit conditions
The borrower balance sheet channel can be captured mainly by variables that reflect the risks related to the balance sheets of firms and households as borrowers from the banking sector or from capital markets While there are no readily available direct measures of the quality of private balance sheets comparable across countries asset prices can be considered as indicative of their quality as they give the value of collateral for loans and of equity Therefore house prices and stock prices are generally used in the analysis to track this channel
Graph II4 Borrower balance sheet channel
(2000Q1-2016Q1)
Source Bloomberg BIS
Graph II4 suggests that developments in house prices and stock prices have been quite
(53) There is empirical evidence especially for the US stressing the
importance of asset prices and different credit spreads as leading indicator of economic activity eg Stock and Watson (2003) Stock J H and M W Watson (2003) lsquoForecasting output and inflation the role of asset pricesrsquo Journal of Economic Literature Vol 41 No 3 pp 788-829
-10
-5
0
5
10
15
20
25
2000Q1 2004Q1 2008Q1 2012Q1 2016Q1
Short-term interest rateLong-term interest rateShadow rate (Krippner)ECB Excess Liquidity Index
-6
-4
-2
0
2
4
6
8
10
-60
-40
-20
0
20
40
60
2000Q1 2002Q3 2005Q1 2007Q3 2010Q1 2012Q3 2015Q1
MSCI EURO Index y-o-y change
Housing prices y-o-y change
24 | Quarterly Report on the Euro Area
disconnected in recent years Specifically while house prices only started to recover in 2014 stock prices peaked in early 2015 and experienced a downward correction since then
The bank balance sheet channel relates to the fact that how much a bank lends depends on its own balance sheet and the different risks involved in its business model External developments (including monetary policy actions but also longer-term factors such as financial regulation and innovations in the banking sector) may affect bank liabilities (the supply of loanable funds and also bank funding costs) and in turn assets (supply of credit and the lending cost) (54) Bank lending is determined by banksrsquo business models it usually increases with the increase in leverage in the economy while deleveraging episodes may significantly hamper lending activities This makes leverage highly pro-cyclical (55) Importantly the impact of bank balance sheets on the real economy can be more pronounced in the euro area than in capital-market based systems as alternative forms of financing are relatively undeveloped
The bank balance sheet channel can thus be illustrated by variables such as banking leverage the stock of non-performing loans banksrsquo funding costs or the price of Credit Default Swaps (CDS) However reliable data for the euro area are relatively short available only for the period since the beginning of the crisis Indeed the lack of knowledge about the quality of bank balance sheets was an important aspect of the euro area financial crisis and a reason for the implementation of the Asset Quality Review (AQR) by the ECB in 2014 Therefore for the analysis in this section measures which directly track the supply of credit have been used instead (56) Namely the flow of credit as measured by the credit impulse (ie the change in new credit granted by the banking sector as a percentage of GDP) the stock of credit on banksrsquo balance sheet as measured by total economy credit as a percentage of GDP and the price of credit as measured by the Composite Financing Conditions Indicator (CFCI) for non-financial corporations
(54) Bernanke B and A Blinder (1988) lsquoCredit money and aggregate
demandrsquo the American Economic Review Vol78 No 2 pp 435ndash439 (55) Adrian T and H S Shin (2010) lsquoLiquidity and leveragersquo Journal of
Financial Intermediation Vol 19 Issue 3 pp 418-437 (56) In practice the lending volumes and rates can be affected both by
supply and demand side
which (assuming a constant mark-up) proxies bank funding costs (57)
Graph II5 shows that there is a negative correlation between the credit impulse and credit as a percentage of GDP Thus during downturns the flow of new credit declines while the ratio of credit to GDP increases due to the collapse of GDP The credit impulse indicator shows that the supply of new credit has been fairly limited since the onset of the global financial crisis The CFCI tracks the ECB policy rates rather closely with the exception of the euro area sovereign debt crisis episode (2011-2012) when financing costs increased due to idiosyncratic increases in some Member States reflecting financial market fragmentation
Graph II5 Bank balance sheet channel (2000Q1-2016Q1)
Source Capital Economics BIS DG ECFIN
While the previous channels are related to the quality of balance sheets either on the borrower or the lender side some shocks can originate in the overall financial system Examples are liquidity shocks or confidence shocks These shocks work both via the balance sheets but also by directly altering agents decisions through precautionary motives affecting both investment and consumption behaviour These mechanisms are defined as the uncertainty channel (58)
(57) For more details on CFCI calculations see European Commission
(2013) Drivers of diverging financing conditions across Member States Quarterly Report on the Euro Area Vol12 No1
(58) Bloom (2009) point to uncertainty shocks (that might be related but also unrelated to the financial system) as a crucial driver of economic dynamics Recently Caldara et al (2016) argue for the needs to distinguish uncertainty shocks from financial shocks while both of them are important source of macroeconomic
-8
-6
-4
-2
0
2
4
6
8
10
2000Q1 2003Q1 2006Q1 2009Q1 2012Q1 2015Q1
Total credit on GDP y-o-y change
Credit impulse (new crediton GDP y-o-y change)
Composite financingconditions indicator
II Financial channels and economic activity in the euro area
Volume 15 No 2 | 25
The uncertainty channel is captured by variables reflecting the different types of uncertainty that can affect the economy One type is commonly related to increased volatility in financial markets Given a high degree of global interconnectedness the euro area economy can be affected by uncertainty related to global financial developments which is usually measured by the implied volatility of SampP 500 index options (VIX) (59) The euro area specific stress in the financial system is measured through the ECBrsquos Composite Indicator of Systemic Stress (CISS)
Another type of uncertainty is linked to swings in business and consumer confidence Variations in the confidence of euro area households and non-financial firms are illustrated through the European Commissionrsquo confidence indicator the Economic Sentiment Indicator (ESI) which is based on data collected through business and consumer surveys However the indicator exhibits a very high contemporaneous correlation with actual GDP growth indicating that its dynamics are likely to reflect very accurately economic conditions rather than information related to exogenous changes in confidence
Finally unexpected outcomes of economic policy decisions can lead to policy uncertainty which in turn can have adverse effects on the savings and investment behaviour of firms and households Policy uncertainty is illustrated through an indicator based on newspaper coverage of uncertainty-generating events (60)
Graph II6 indicates that there is an apparent co-movement among these indicators even if they measure different types of uncertainty While economic sentiment has been gradually improving and uncertainty related to financial markets has eased the policy uncertainty affecting the euro area is still relatively high
fluctuations separately the Great Recession was likely outcome of the toxic interaction between the two
Bloom N (2009) lsquoThe impact of uncertainty shocksrsquo Econometrica Vol 77 Issue 3 pp 623-685
Caldara D C Fuentes-Albero S Gilchrist and E Zakrajšek (2014) lsquoThe macroeconomic impact of financial and uncertainty shocksrsquo European Economic Review forthcoming
(59) The VIX is calculated by the Chicago Board Options Exchange (CBOE)
(60) Baker S R N Bloom and S J Davis (2015) lsquoMeasuring economic policy uncertaintyrsquo National Bureau of Economic Research Working Paper No 21633 Data source wwwpolicyuncertaintycom
Graph II6 Uncertainty channel (2000Q1-2016Q1)
Source Chicago Board of Exchange ECB wwwpolicyuncertaintyorg
II4 Financial developments and economic activity
This sub-section provides stylised facts on the transmission channels defined above and show whether and how financial developments have affected the real side of the euro area economy since the crisis (namely consumption investment unemployment and long-term interest rates)
While financial variables are available in real time macroeconomic variables are normally released with lags Therefore conditioning macroeconomic forecasts on observed financial developments (ie a projection of macro variables on the observed paths of financial variables) can improve forecasts as more informative data are taken into account Several empirical studies have shown that financial variables can improve macroeconomic forecasts (61)
The methodology underlying this this section is a large-scale Bayesian VAR with 35 macroeconomic
(61) Stock and Watson (2003) provide a seminar contribution on the
role of financial variables namely asset prices for GDP and inflation forecast concluding that different financial variables allow macroeconomic forecasting in different times Espinosa et al (2012) document using standard VAR approach that financial variables improve GDP forecast for the euro area especially in the real time when numerous financial variables are available ahead of the macroeconomic releases
Stock J H and M W Watson (2003) lsquoForecasting output and inflation the role of asset pricesrsquo Journal of Economic Literature Vol 41 No 3 pp 788-829
Espinoza R F Fornari and M J Lombardi (2012) lsquoThe role of financial variables in predicting economic activityrsquo Journal of Forecasting Vol 31 No 1 pp 15-46
0
50
100
150
200
250
300
0
10
20
30
40
50
60
70
80
2000Q1 2002Q3 2005Q1 2007Q3 2010Q1 2012Q3 2015Q1
VIX
CISS
ESI (rhs)
Policy uncertainty (rhs)
26 | Quarterly Report on the Euro Area
and financial variables (62) The model is estimated for the sub-period Q1-2000 - Q4-2011 which covers both normal and crisis times but does not include some of the most important unconventional monetary policy measures Given the estimated past correlations a counterfactual path for the macroeconomic and financial variables (ie a distribution of conditional forecasts) can be obtained for the entire period Q1-2000 - Q4-2015 conditional on observed real GDP and inflation in the baseline case The deviations of the observed developments of financial variables from this counterfactual path can be interpreted as evidence of instability in the relationship between financial variables and economic activity (as measured by GDP growth and inflation) since the crisis
Subsequently the conditional set from the baseline case (including only real GDP and inflation) is extended by financial and uncertainty variables corresponding to each transmission channel described above (63)
Some recent developments are puzzling
Graph II7 shows the counterfactual paths of the main GDP components producer prices the unemployment rate and the long-term interest rate conditional on observed economic activity (real GDP and inflation) It also shows the conditional forecasts for the balance sheet variables of households and firms when only real GDP and inflation are taken into account in the conditioning set
(62) Alternative strand of literature using rich set of data in order to
nowcast or forecast employs dynamic factors models where data dimension is reduced in a first step by factor estimation with common factors being consequently used in the forecasting exercize see eg Giannone et al (2008) Bellego and Ferrara (2012) find using factor-augmented probit model that financial variables allow tracking better recession periods in the euro area (in the pre-crisis period) with optimal lead of financial variables over recession of around one year
Giannone D L Reichlin L and D Small (2008) lsquoNowcasting the real-time informational content of macroeconomic datarsquo Journal of Monetary Economics Vol 55 Issue 4 pp 665ndash676
Belleacutego C and L Ferrara (2012) lsquoMacro-financial linkages and business cycles A factor-augmented probit approachrsquo Economic Modelling Vol 29 pp 1793-1797
(63) For more details on the methodology see Box IV1 in European Commission (2015) lsquoInvestment dynamics in the euro area since the crisisrsquo Quarterly Report on the Euro Area Vol 14 No 1 pp 35-43
Bańbura M D Giannone and M Lenza (2015) lsquoConditional forecasts and scenario analysis with vector autoregressions for large cross-sectionsrsquo International Journal of Forecasting Vol 31 Issue 3 pp 739ndash756
The results suggest that private consumption was unusually low during the period of the euro area debt crisis and deleveraging (2012-2013) while it overshot during the recent recovery (from 2014 onward) Investment behaved in line with historical correlations during both downturn episodes (2008-2009 and 2012-2013) and was weak during the deleveraging phase because overall output growth was weak However its recent recovery (since 2014) has been more subdued than what the pace of economic activity would have predicted the observed investment path is positioned on the lower tail of the distribution of conditional forecasts) (64)
Large deleveraging pressures in the public sector have led to a significant decline in the euro area aggregate government consumption over the period 2011-2012 However this decline had almost been reversed by the end of 2014 with public consumption starting to overshoot from 2015 onwards (relative to its counterfactual path obtained through conditioning on output growth) reflecting the aggregate euro area fiscal stance which started to turn mildly expansionary
Moreover the results show that several variables capturing price and balance sheet developments are still at odds with historical patterns In particular producer prices house prices long-term interest rates and loans to firms and households undershoot the distribution of the conditional forecasts On one side this underlines that the recent recovery is characterized by a historically low inflation environment and loose monetary conditions pushing the long-term rates down On the other side the ongoing balance sheet adjustment is translating into very weak credit dynamics due to unprecedented deleveraging pressures
Graph II8 illustrates the zero lower bound constraint on monetary policy rates and the subsequent break in the correlation of economic activity with the two measures of monetary policy
(64) There is some relative instability in the estimated correlations over
the sample period notably pre-crisis vs crisis years However it does not significantly affect the result on the unusual weakness in investment recovery since 2014 The article lsquoInvestment dynamics in the euro area since the crisisrsquo Quarterly Report on the Euro Area Vol 14 No 1 pp 35-43 found that estimating the past correlations only with the sample for the pre-crisis period the amplitude of the investment fall during the first downturn (2008-2009) would also be slightly underestimated by the conditional forecasts
II Financial channels and economic activity in the euro area
Volume 15 No 2 | 27
rates since 2012 Among all variables the consumer and business confidence indicator (ESI) comes out as having the strongest contemporaneous correlation with economic activity during the crisis
In the consecutive analysis the conditioning dataset (including only real GDP and inflation in the baseline) is augmented by financial variables corresponding to each transmission channel
hellip different channels play an important role at different stages since the crisis
The interest rate channel (Graph II9 upper panel) seems to better account for the pattern of consumption during the recent recovery (compared to the baseline) This channel which reflects mainly monetary conditions suggests that monetary easing implemented since 2014 by means of additional unconventional measures (namely the targeted long-term refinancing operations (TLTRO) the asset-backed securities purchasing program (ABSPP) and the forthcoming public
securities purchase program (PSPP)) have translated into a further decline in the long-term interest rate and the shadow policy rate It also reflects an increase in excess liquidity which has had a very benign effect on the recent recovery However producer prices developments (PPI) still appear unusually subdued Likewise including information capturing the interest rate channel does not help explain the dismal performance of consumption during the deleveraging phase (2012-2013) or the persistent weakness of credit dynamics Therefore these developments seem to be determined also by drivers other than monetary conditions
The borrowers balance sheet channel (Graph II9 lower panel) captures in turn the exceptional deleveraging developments of 20122013 but clearly underestimates the pace of the recent recovery This finding suggests that strained balance sheets of households and firms represented the main weight on the recovery at the time of euro area sovereign debt crisis However whereas a mild recovery started in the euro area in 2014 private
Graph II7 Conditional forecasts based on real GDP and inflation (1) (2000Q1-2015Q4 y-o-y growth)
Misalignments of financial and real variables with output growth since the crisis
(1) Shades of orange distribution of the conditional forecasts in the BVAR in levels excluding the lower and higher 5 quantiles Green line actual values The variables are all reported in terms of annual percentage changes except for the unemployment rate and the long-term interest rate which are in levels Conditioning assumptions real GDP and HICP Source DG ECFIN MATLAB codes replication files of the methodological paper (Banbura et al 2015)
Government consumption
2005 2010 2015-2
0
2
4Real consumption
2005 2010 2015-5
0
5Real investment
2005 2010 2015-20
-10
0
10
Unemployment rate
2005 2010 20150
5
10
15PPI ex const
2005 2010 2015-50
0
50House prices
2005 2010 2015-10
0
10
Long-term i r
2005 2010 20150
5
10Loans to firms
2005 2010 2015-10
0
10
20Loans to households
2005 2010 2015-5
0
5
10
28 | Quarterly Report on the Euro Area
balance sheets still did not improve much In fact when the borrower balance sheet channel is taken into account observed consumption overshoots the conditional forecast even by a higher margin than in the baseline scenario and real investment seems to be on the upper side as well This suggests that the borrower balance sheet channel should have led to more subdued dynamics of both consumption and investment than what has been observed in 2014 and 2015 indicating that other channels have been somewhat compensating the adverse effects of this channel
The bank balance sheet channel (Graph II10 upper panel) improves the forecast of investment since 2014 and reduces the uncertainty around the median for some variables such as consumption unemployment and long-term interest rate The good fit of investment dynamics indicates a strong correlation of investment with total economy credit developments both in terms of flows and stocks
Interestingly the bank balance sheet information namely the total economy credit as percentage of GDP (including credit to public sector) the private sector credit impulse and the price of credit for the private sector cannot capture the weak observed dynamics of outstanding loans to firms and households This shows that the private deleveraging process has been much stronger than the public sector deleveraging making private credit developments disconnected from GDP
growth (65) Therefore while the recovery in real activity has been rather weak the private credit dynamics have been even weaker Furthermore the modest recovery does not facilitate passive deleveraging (a decrease in the relative debt burden due to a growing economy ie denominator effect) and feeds the active deleveraging (a decrease of absolute level of debt ie nominator effect)
Finally the current long-term interest rate seems very low even when the financing costs for non-financial corporations (which also attained historical minima) are taken into account This underlines the importance of the ECBrsquos measures that imply very easy financing conditions in the foreseeable future
Last but not least the uncertainty channel (Graph II10) seems to improve the conditional forecast over the baseline in the same spirit as the bank balance sheet channel For example there is a good fit of investment indicating a strong correlation of investment with confidence and financial stress measures Equally the rebound in private consumption seems to be well captured by the uncertainty channel indicating that the recent decrease in financial markets stress has also been an important driver for consumption However in general the uncertainty channel is likely to be implicitly included in the bank balance sheet
(65) GDP is a denominator of the credit indicators in bank balance
sheet channel
Graph II8 Conditional forecasts based on real GDP and inflation (1) (2000Q1-2015Q4 y-o-y growth)
Business and consumer confidence and short-term interest rates
(1) Shades of orange distribution of the conditional forecasts in the BVAR in levels excluding the lower and higher 5 quantiles Green line actual values The variables are all reported in terms of annual percentage changes except for the unemployment rate and the long-term interest rate which are in levels Conditioning assumptions real GDP and HICP Source DG ECFIN MATLAB codes replication files of the methodological paper (Banbura et al 2015)
Economic sentiment
2005 2010 2015-15
-10
-5
0
5
10Short-term i r
2005 2010 2015-4
-2
0
2
4
6
8Shadow short-term interest rate
2005 2010 2015-6
-4
-2
0
2
4
6
II Financial channels and economic activity in the euro area
Volume 15 No 2 | 29
channel For example in periods of high uncertainty bank funding costs increase (bank balance sheet channel) and firms with weaker balance sheets cannot obtain credit for new loans (borrower balance sheet channel)
Overall the findings above suggest that while there is clear evidence of the transmission of monetary policy measures on financial variables and from financial variables to consumer lending rates the evidence on the effects on real activity is more complex with different channels playing an important role at different stages of the crisis The interest rate channel has helped the modest recovery since 2014 by supporting both public and private consumption growth and by partially compensating the balance sheet channel for both borrowers and banks The results in Graph II9 (lower panel) can be interpreted as showing that in the absence of massive monetary easing given the high level of debt in the economy and the wealth effects associated with house and asset prices decreases both private and public consumption growth could have been much more subdued than what it is currently observed
Graph II10 (both panels) illustrate the importance of the bank balance sheet and the uncertainty channel for capturing investment dynamics Weak investment growth is well captured both by credit developments as captured through the bank balance sheet channel and confidence effects through the uncertainty channel Real economic activity as measured by GDP growth while playing an important role does not seem to fully explain the subdued growth in investment since 2014 (Graph II7)
II5 Conclusions
The section discusses the nexus between financial and macroeconomic developments drawing some
lessons from the literature and providing some stylised facts on the main transmission channels through which financial developments have affected real economic activity since the crisis
While there is clear evidence of the transmission of monetary policy measures on financial variables and from financial variables to consumer lending rates the evidence on the effects on real activity is more complex with different channels playing an important role at different stages of the crisis
The state of private balance sheets seems to have significantly contributed to the poor performance of consumption during the euro area debt crisis and high debt levels still weigh on growth However given the still high level of debt the current mild recovery should be seen as a rather positive outcome The analysis suggests that easy monetary conditions seem to represent an important driver of the current recovery Another driver seems to be the balance sheets of banks which have gradually improved and allow better transmission of easy monetary conditions to the lending rates
Given the still high levels of debt in the economy and the wealth and confidence effects associated with house and asset prices corrections both private and public consumption growth could have been much more subdued than what it is currently observed were it not for the exceptional easing of monetary conditions
Unfortunately the recovery is still not strong enough to facilitate the deleveraging process The stock of debt and the ongoing deleveraging combined with adverse confidence effects still represent major impediments for a stronger recovery in investment Consequently there is a need to implement policy measures that allow dealing effectively with the debt overhang notably an effective framework for non-performing loans resolution
30 | Quarterly Report on the Euro Area
Graph II9 Conditional forecasts based on variables capturing the interest rate channel and borrower balance sheet channel (1)
(2000Q1-2015Q4 y-o-y growth)
Interest rate channel
Borrower balance sheet channel
(1) Shades of orange distribution of the conditional forecasts in the BVAR in levels excluding the lower and higher 5 quantiles Green line actual values The variables are all reported in terms of annual percentage changes except for the unemployment rate and the long-term interest rate which are in levels Conditioning assumptions interest rate channel ESI HICP the short-term interest rate the long-term interest rate the shadow interest rate and the ECB excess liquidity measure Conditioning assumptions borrower balance sheet channel ESI HICP house prices stock prices and outstanding loans to households and firms Due to the high contemporaneous correlation between real GDP growth and the ESI indicator the ESI indicator contains the same forecasting information as real GDP ESI indicator is used in the conditioning set instead of real GDP variable in order to also illustrate conditional forecasts for real GDP Source DG ECFIN MATLAB codes replication files of the methodological paper (Banbura et al2015)
Real GDP
2005 2010 2015-10
-5
0
5Government consumption
2005 2010 2015-2
0
2
4Real consumption
2005 2010 2015-5
0
5
Real investment
2005 2010 2015-20
-10
0
10Unemployment rate
2005 2010 20150
10
20PPI ex const
2005 2010 2015-50
0
50
House prices
2005 2010 2015-10
0
10
20Loans to firms
2005 2010 2015-10
0
10
20Loans to households
2005 2010 2015-10
0
10
20
Real GDP
2005 2010 2015-10
-5
0
5Government consumption
2005 2010 2015-2
0
2
4Real consumption
2005 2010 2015-5
0
5
Real investment
2005 2010 2015-20
-10
0
10Unemployment rate
2005 2010 20150
5
10
15PPI ex const
2005 2010 2015-50
0
50
Shadow short-term interest rate
2005 2010 2015-5
0
5
10Short-term i r
2005 2010 2015-5
0
5
10Long-term i r
2005 2010 20150
5
10
II Financial channels and economic activity in the euro area
Volume 15 No 2 | 31
Graph II10 Conditional forecasts based on variables capturing the bank balance sheet channel and uncertainty channel (1)
(2000Q1-2015Q4 y-o-y growth) Bank balance sheet channel
Uncertainty channel
(1) Shades of orange distribution of the conditional forecasts in the BVAR in levels excluding the lower and higher 5 quantiles Solid black line point estimate of the conditional forecasts in the BVAR in differences which is computed as the median of the distribution of the conditional forecasts in this model Green line with crosses actual values The variables are all reported in terms of annual percentage changes except for the unemployment rate and the long-term interest rate which are in levels Conditioning assumptions for the bank balance sheet channel ESI HICP the credit impulse the private credit volumes (debt-to-GDP ratio) and bank lending rates for households and firms (CFCI) Conditioning assumptions uncertainty channel ESI HICP the policy uncertainty indicator the CISS and the VIX Due to the high contemporaneous correlation between real GDP growth and the ESI indicator the ESI indicator contains the same forecasting information as real GDP ESI indicator is used in the conditioning set instead of real GDP variable in order to also illustrate conditional forecasts for real GDP Source DG ECFIN MATLAB codes replication files of the methodological paper (Banbura et al 2015)
Real GDP
2005 2010 2015-10
-5
0
5Government consumption
2005 2010 2015-2
0
2
4Real consumption
2005 2010 2015-2
0
2
4
Real investment
2005 2010 2015-20
-10
0
10Unemployment rate
2005 2010 20150
5
10
15PPI ex const
2005 2010 2015-50
0
50
Loans to firms
2005 2010 2015-10
0
10
20Loans to households
2005 2010 2015-10
0
10
20Long-term i r
2005 2010 20150
2
4
6
Real GDP
2005 2010 2015-10
0
10Government consumption
2005 2010 2015-2
0
2
4Real consumption
2005 2010 2015-5
0
5
Real investment
2005 2010 2015-20
0
20Unemployment rate
2005 2010 20150
5
10
15PPI ex const
2005 2010 2015-50
0
50
Loans to firms
2005 2010 2015-10
0
10
20Loans to households
2005 2010 2015-10
0
10
20Long-term i r
2005 2010 20150
5
10
III Confidence spillovers in the euro area
Volume 15 No 2 | 33
III1 Introduction
During the recent crisis euro area private consumption fell substantially This was accompanied by a sharp decline in consumer confidence which many observers have identified as a key factor contributing to the persistence of the slowdown In fact the onset of the crisis coincided with an abrupt unwinding of imbalances that is of economic trends that turned out to be unsustainable and which led to a significant adjustment of expectations Both consumption growth rates and confidence levels have been improving since the start of 2013
There is some (mixed) evidence to suggest that fluctuations in consumer confidence affect the dynamics of private consumption (67) On the basis of this assumption and taking into account the unprecedented extent of the most recent crisis it is important to determine whether and to what extent confidence shocks spill over between countries This is particularly relevant in relation to the euro area where close trade and financial links and common institutional features can lead to the rapid propagation of shocks In addition confidence spillovers can be an important aspect to consider when discussing how to improve macroeconomic policymaking in a common currency area
This section reviews the evidence on the link between consumer confidence and private consumption and on cross-border confidence spillovers and presents some analysis of the transmission of confidence shocks across the euro area It is a follow-up to analysis discussed in
(66) This section was prepared by Francesca DrsquoAuria (67) See for a discussion Ludvigson SC 2004 lsquoConsumer
confidence and consumer spendingrsquo Journal of Economic Perspectives Vol 18(2) pp 29-50
previous issues of the Quarterly Report on the Euro Area (QREA) (68)
III2 Recent trends in consumer confidence and private consumption in the euro area
Graph III1 shows the evolution over the period 1995Q2-2016Q1 of euro area real private consumption and consumer confidence The latter is measured by the Consumer Confidence Indicator constructed by the European Commission as part of the Joint Harmonised EU Programme of Business and Consumer Surveys (BCS) (69)
There is close co-movement between the two variables Both real consumption growth and consumer confidence showed the greatest deterioration in the first quarter of 2009 and during the sovereign debt crisis They have been on a recovery path since early 2013 with consumer confidence reaching levels above the euro area long-term average since the first quarter of 2014
The relationship between consumer confidence and private consumption is much debated in the literature From a theoretical perspective there are two main competing theories One view is that confidence indicators can help predict the dynamics of consumption as they convey information about future economic conditions Another theory is that the link between the two variables can be interpreted in terms of lsquoanimal
(68) DrsquoAuria F lsquoCross-border spillovers in confidencersquo Quarterly
Report on the Euro Area (2013) Vol 12(3) pp26-30 DrsquoAuria F S Linden D Monteiro J in lsquot Veld and S Zeugner
lsquoCross-border spillovers in the euro arearsquo Quarterly Report on the Euro Area (2014) Vol 13(4) pp7-22
(69) See European Commission (2016) lsquoA user guide to the Joint Harmonised EU Programme of Business and Consumer Surveysrsquo for details on the construction of the indicators
In recent years there has been close co-movement between consumer confidence and private consumption in the euro area During the crisis in particular consumer confidence was identified by many commentators as a driving factor in its persistence as expectations about a sustainable path of economic growth were adjusted significantly In view of the unprecedented extent of the crisis the question of whether and to what extent changes in consumer confidence in one country could spill over to other countries was also raised This section discusses the relationship between consumer confidence and consumption and reviews the evidence of consumer confidence spillovers between euro area countries We conclude that there is some evidence to suggest that confidence shocks are transmitted between countries This conclusion is corroborated by results from the estimation of a Global Vector Autoregressive (GVAR) model for a number of euro area countries (66)
34 | Quarterly Report on the Euro Area
spiritsrsquo as confidence indicators capture fluctuations in beliefs which in turn affect consumption (70) In both cases the essence of confidence indicators is to gauge expectations ndash irrespective of how they are formed ndash about the future course of the economy which then have a knock-on effect on current consumer behaviour
Graph III1 Confidence and private consumption euro area
(1995Q2-2016Q1 q-o-q change)
Source Eurostat and DG ECFIN calculations based on EU Business and Consumer Surveys
Several studies test empirically the link between consumer confidence and private consumption A number of them find evidence in support of a strong correlation between consumer confidence and consumption (71)
However as confidence and consumption are to a large extent determined by the same factors other studies try to assess whether confidence indicators carry information beyond economic fundamentals The evidence on this issue is mixed although several studies conclude that confidence indicators play a significant role There is some evidence to suggest that while part of the information conveyed by confidence indicators is also captured by other variables (eg past consumption income and interest rates) confidence measures have an additional predictive power for the future path of
(70) See Barsky and Sims (2012) for a discussion of the different
theoretical approaches to the role of confidence Barsky R B and ER Sims (2012) lsquoInformation animal spirits and the meaning of innovations in consumer confidencersquo American Economic Review 102(4) pp 1343-1377
(71) See for example Carroll C J Fuhrer and D Wilcox (1994) lsquoDoes consumer sentiment forecast household spending If so whyrsquo American Economic Review Vol 84 pp 1397-1408
consumer spending (72) Moreover some papers find that confidence indicators have a stronger predictive power during periods of large economic fluctuations (73)
III3 The existing evidence on confidence spillovers
On the assumption that a causal relationship between consumer confidence and private consumption exists it is important to determine whether and to what extent changes in consumer confidence in one country affect confidence (and thus consumption) in others
There is some evidence to support the existence of confidence spillovers This pertains both to confidence shocks originating in the US and being transmitted to the euro area and shocks which occur in one euro area country and spill over to other euro area countries
Several studies provide evidence of a transmission channel of confidence shock to foreign confidence In particular evidence for G7 countries and Spain would suggest that variations in confidence generally spill over from large countries to smaller ones (74) Some studies support the idea that confidence shocks originating in US are transmitted to the euro area but not the other way round ie shocks to euro area confidence do not affect confidence in the US (75) Other studies show a transmission channel for confidence shocks
(72) Some authors eg Ludvigson (2004) Souleles (2004) and Lahiri
Monokroussos and Zhao (2016) conclude that including confidence indicators can reduce forecasting errors when predicting the dynamics of consumption while others reach the opposite conclusion (eg Claveria Pons and Ramos 2007)
Ludvigson S (2004) lsquoConsumer confidence and consumer spendingrsquo Journal of Economic Perspectives Vol 18(2) pp 29-50
Souleles NS (2004) lsquoExpectations heterogenous forecast errors and consumption Micro evidence from the Michigan Consumer Sentiment Surveysrsquo Journal of Money Credit and Banking Vol 36 pp 39-72
Lahiri K G Monokroussos and Y Zhao (2016) lsquoForecasting consumption the role of consumer confidence in real time with many predictorsrsquo Journal of Applied Econometrics forthcoming
Claveria O E Pons and R Ramos (2007) lsquoBusiness and consumer expectations and macroeconomic forecastsrsquo International Journal of Forecasting Vol 23 pp47-69
(73) For example Howrey E (2001) lsquoThe predictive power of the index of consumer sentimentrsquo Brookings Papers on Economic Activity Vol 1 pp 175-216
(74) Fei S (2011) lsquoThe confidence channel for the transmission of shocksrsquo Banque de France Working Paper No 314
(75) Deacutees S and P Soares-Brinca (2013) lsquoConsumer confidence as a predictor of consumption spending Evidence for the United States and the Euro Arearsquo International Economics Vol 134 pp 1-14
-40
-30
-20
-10
0
10
1995Q2 1998Q2 2001Q2 2004Q2 2007Q2 2010Q2 2013Q2-08
-04
00
04
08
12
16Consumption (rhs)Consumer Confidence Indicator
III Confidence spillovers in the euro area
Volume 15 No 2 | 35
(Continued on the next page)
Box III1 A GVAR model to assess confidence spillovers
The Global Vector Autoregressive (GVAR) methodology developed by Pesaran Schuermann and Weiner (2004) (1) combines individual vector error-correcting models where domestic variables are linked to country-specific foreign variables The latter combine the domestic variables using international trade financial or other relevant weights for each country This approach allows the analysis of interdependence across different economies providing a solution to the lsquocurse of dimensionalityrsquo (eg the high number of parameters as the dimension of the model increases) in global modelling
For a set of countries i=0 1 2 hellip N the individual VARX(pi qi) models take the following form
itqtiiqtiiitiiptiiptiiit uxxxxxxii
+Λ++Λ+Λ+Φ++Φ= minusminusminusminus
11
011
where xit is a vector of ki x 1 vector of domestic variables xit a ki x 1 vector of foreign variables and
00
===
iijt
N
jijit xx ωω
where ωij j=01hellipN is a set of weights such that 10
==
N
jijω The foreign variables xit are therefore a
weighted average of domestic variables for all countries included in the model The weights can be different in nature but are typically constructed using trade or capital flows data The GVAR model is then solved for the lsquoworldrsquo (ie all countries included in the model) as a whole considering all variables as endogenous to the system
The GVAR model has been applied to a variety of issues These include forecasting (eg Pesaran Schuermann and Smith 2009) credit risk (eg Pesaran Schuermann and Treutler 2007) oil price shocks (eg Galesi and Lombardi 2009) global imbalances (eg Bussiegravere Chudik and Sestieri 2012) business cycle synchronisation (eg Dreger and Zhang 2013) the impact of EU membership (eg Pesaran Smith and Smith 2007) the international effects of fiscal policy shocks (eg Favero Giavazzi and Perego 2011) (2) Chudik and Pesaran (2014) provide a detailed review of these and other recent applications (3)
In this section this approach is used to analyse the transmission of country-specific and global consumer confidence shocks in a model which includes eight euro area countries (Austria Belgium Finland France Germany Italy the Netherlands and Spain) using quarterly data over the period 1996Q2-2013Q1 The model is solved using the GVAR Toolbox developed by Smith and Galesi (2014) (4)
(1) Pesaran MH Schuermann T and Weiner S M (2004) lsquoModelling regional interdependencies using a global error-correcting
modelrsquo Journal of Business and Economic Statistics Vol 22 pp 129-162 (2) Pesaran M H Schuermann T and Smith LV (2009) lsquoForecasting economic and financial variables with global VARsrsquo
International Journal of Forecasting Vol 25(4) pp 642-675 Pesaran MH Schuermann T and Treutler B-J (2007) lsquoGlobal business cycles and credit riskrsquo in The Risks of Financial Institutions NBER Chapters pp 419-474 Bussiegravere M Chudik A and Sestieri G (2012) lsquoModelling global trade flows results from a GVAR modelrsquo Globalization and Monetary Policy Institute Working Paper 119 Federal Reserve Bank of Dallas Dreger C and Zhang Y (2013) lsquoDoes the economic integration of China affect growth and inflation in industrial countriesrsquo FIW Working Paper series 116 FIW Pesaran M H Smith L V and Smith R P (2007) lsquoWhat if the UK or Sweden had joined the euro in 1999 An empirical evaluation using a Global VARrsquo International Journal of Finance and Economics Vol 12(1) pp 55-87 Favero C Giavazzi F and Perego F (2011) lsquoCountry heterogeneity and the international evidence on the effects of fiscal policyrsquo IMF Economic Review 59(4) 652-682
(3) Chudik A and Pesaran MH (2014) lsquoTheory and Practice of GVAR Modelingrsquo Federal Reserve Bank of Dallas Globalization and Monetary Policy Institute Working Paper No 180
(4) Smith LV and Galesi A (2014) GVAR Toolbox 20 available at httpssitesgooglecomsitegvarmodellinggvar-toolbox
36 | Quarterly Report on the Euro Area
between the US the euro area as a whole and four EU countries taken individually (76)
In addition the role of consumer confidence spillovers in the euro area was assessed in a previous issue of the QREA (77) Consumption and confidence regressions were carried out for a panel of euro area countries over the period 1999-2012 The findings support the existence of confidence spillovers between euro area countries
III4 Confidence spillovers across the euro area
Table III1 shows simple correlations between the confidence indicators of eight euro area countries over the period 1995Q4-2016Q1 (78)The strength of the link between consumer confidence indicators across Member States is variable and in most cases is larger between neighbouring countries and between countries sharing similar macroeconomic environments (79)
Table III1 Consumer Confidence Indicator mdash Correlation Matrix
(1995Q4-2016Q1)
(1) Not statistically significant at conventional levels Source DG ECFIN calculations based on EU Business and Consumer Surveys
(76) Deacutees S and J Guntner (2014) lsquoThe international dimension of
confidence shockrsquo ECB Working Paper No 1669 (77) Op cit DrsquoAuria F (2013) (78) The very low and non-statistically significant correlation of the
Italian confidence indicator with the confidence indicators of a number of other euro area countries is somewhat puzzling and there is a need for further investigation into the reasons behind it
(79) The strong correlation between confidence indicators in countries sharing similar economic conditions can be indicative of larger confidence spillovers between them but can also be a reflection of the strong correlation between their economic fundamentals
The strength of the correlation also varies considerably over time Table III2 displays correlations between consumer confidence indicators in the same euro area countries over the period 2008Q1-2012Q4 During the crisis period the link between consumer confidence indicators is significantly tighter
Table III2 Consumer Confidence Indicator mdash Correlation Matrix
(2008Q1-2012Q4)
(1) Not statistically significant at conventional levels Source DG ECFIN calculations based on EU Business and Consumer Surveys
The presence of a correlation between confidence indicators may point to the existence of confidence spillover effects between countries but also be indicative of strong business cycle synchronisation To shed light on the nature of these correlations this section discusses confidence spillovers in the euro area on the basis of the findings from the estimation of a Global Vector Autoregressive (GVAR) model which includes data for eight euro area countries over the period 1996Q2-2013Q1 Box III1 describes the model in more detail
The model includes observations on consumption GDP the unemployment rate a short-term interest rate and consumer confidence The latter is measured by the BCS Consumer Confidence Indicator which is an arithmetic average of the balances of the answers to questions on the financial situation of households the general economic situation unemployment expectations and savings over the next 12 months It is therefore taken as a proxy for consumersrsquo expectations about their future economic situation
The results seem to support the existence of consumer confidence spillovers across the euro area As an illustration Graph III2 reports impulse
AT BE FI FR IT DE NL ES
AT 100 069 069 074 013(1) 054 043 022BE 069 100 067 088 055 057 068 066FI 069 067 100 068 039 028 075 055FR 074 088 068 100 046 055 066 060IT 013(1) 055 039 046 100 004(1) 063 081DE 054 057 028 055 004(1) 100 033 023NL 043 068 075 066 063 033 100 073ES 022 066 055 060 081 023 073 100
AT BE FI FR IT DE NL ES
AT 100 093 090 088 036(1) 079 086 063BE 093 100 081 080 034(1) 080 081 071FI 090 081 100 083 058 052 081 066FR 088 080 083 100 030(1) 066 074 061IT 036(1) 034(1) 058 030(1) 100 -016(1) 065 038DE 079 080 052 066 -016(1) 100 050 048NL 086 081 081 074 065 05 100 050ES 063 071 066 061 038 048 050 100
Box (continued)
by the European Commission Consumption and GDP enter the model in log differences while the other variables are in levels Some of the results are discussed in the main text
III Confidence spillovers in the euro area
Volume 15 No 2 | 37
response functions of consumer confidence in the euro area countries included in the GVAR model to a positive shock to consumer confidence in Germany over 24 quarters (80)
The largest effect appears to be in smaller neighbouring countries (Austria Belgium and the Netherlands) The response of consumer confidence is also relatively large in Finland France and Spain On the other hand spillovers to consumer confidence in Italy are very small and become negative after six quarters This is not a surprise given the statistically insignificant correlation between German and Italian consumer confidence emerging from the data reported in Table III1 The peak response occurs in the second or third quarter
Similar results although of a smaller magnitude were obtained for the other euro area countries included in the model Confidence spillovers appear to be larger across countries with stronger geographical and trade links Overall the evidence from the estimation of the model supports the existence of a transmission channel for consumer confidence shocks across the euro area However the effects of confidence shocks on foreign consumption are in most cases not statistically significant suggesting that the transmission channel is to foreign confidence rather than
(80) A caveat must be made about the difficulty of identifying truly
exogenous confidence shocks owing to the fact that confidence indicators are largely driven by the same factors which determine consumption
directly to foreign economic activity (81)
These results suggest that confidence shocks play a role in the international business cycle and that there are close interlinkages between confidence indicators across euro area countries This evidence supports the need for coordinated policy action able to boost confidence across euro area countries
III5 Conclusions
In recent years the dynamics of euro area consumer confidence and real private consumption have been very closely related Moreover consumer confidence indicators across the euro area appear to be strongly correlated The strength of the correlation was considerably greater during the crisis period
The evidence of a link between real consumption and consumer confidence is mixed but several studies are supportive of consumer confidence playing a role in determining consumption In addition there is evidence to suggest that shocks to consumer confidence in euro area countries affect confidence in other euro area Member States This is also borne out by results obtained from the estimation of a Global Vector Autoregressive (GVAR) model for eight euro area countries
(81) Similar conclusions are reached by op cit Deacutees and Soares-Brinca
(2013) and Deacutees and Guntner (2014)
38 | Quarterly Report on the Euro Area
Graph III2 Impulse response functions of foreign confidence to a one standard error confidence shock in Germany
Source DG ECFIN
000
005
010
015
020
025
030
035
1 2 3 4 5 6 7 8 9 10 11 12 13 14 15 16 17 18 19 20 21 22 23 24
AT
000
005
010
015
020
025
030
035
040
1 2 3 4 5 6 7 8 9 10 11 12 13 14 15 16 17 18 19 20 21 22 23 24
BE
000
005
010
015
020
025
030
1 2 3 4 5 6 7 8 9 10 11 12 13 14 15 16 17 18 19 20 21 22 23 24
FI
000
005
010
015
020
025
030
1 2 3 4 5 6 7 8 9 10 11 12 13 14 15 16 17 18 19 20 21 22 23 24
FR
-002
-001
000
001
002
003
004
005
006
007
1 2 3 4 5 6 7 8 9 10 11 12 13 14 15 16 17 18 19 20 21 22 23 24
IT
000
005
010
015
020
025
030
035
040
1 2 3 4 5 6 7 8 9 10 11 12 13 14 15 16 17 18 19 20 21 22 23 24
NL
000
005
010
015
020
025
030
035
1 2 3 4 5 6 7 8 9 10 11 12 13 14 15 16 17 18 19 20 21 22 23 24
ES
40 | Quarterly Report on the Euro Area
Editors Jose Eduardo Leandro and Martin Larch
Coordination Plamen Nikolov
Statistical and layout assistance Christos Zavos
Comments on the report would be gratefully received and should be sent to
Jose Eduardo Leandro Director ndash Policy strategy coordination and communication Directorate-General for Economic and Financial Affairs Office CHAR 1566
B-1049 Brussels
Email joseleandroeceuropaeu
or
Martin Larch Head of Unit ndash EMU deepening and macroeconomy of the euro area Directorate-General for Economic and Financial Affairs Office CHAR 1556
B-1049 Brussels
Email martinlarcheceuropaeu
EUROPEAN ECONOMY INSTITUTIONAL SERIES
European Economy Institutional series can be accessed and downloaded free of charge from the following address httpeceuropaeueconomy_financepublicationseeipindex_enhtm Titles published before July 2015 can be accessed and downloaded free of charge from bull httpeceuropaeueconomy_financepublicationseuropean_economyindex_enhtm
(the main reports eg Economic Forecasts) bull httpeceuropaeueconomy_financepublicationsoccasional_paperindex_enhtm
(the Occasional Papers) bull httpeceuropaeueconomy_financepublicationsqr_euro_areaindex_enhtm
(the Quarterly Reports on the Euro Area)
Alternatively hard copies may be ordered via the ldquoPrint-on-demandrdquo service offered by the EU Bookshop httpbookshopeuropaeu
HOW TO OBTAIN EU PUBLICATIONS Free publications bull one copy
via EU Bookshop (httpbookshopeuropaeu) bull more than one copy or postersmaps
- from the European Unionrsquos representations (httpeceuropaeurepresent_enhtm) - from the delegations in non-EU countries (httpeeaseuropaeudelegationsindex_enhtm) - by contacting the Europe Direct service (httpeuropaeueuropedirectindex_enhtm) or calling 00 800 6 7 8 9 10 11 (freephone number from anywhere in the EU) () () The information given is free as are most calls (though some operators phone boxes or hotels may charge you)
Priced publications bull via EU Bookshop (httpbookshopeuropaeu)
ISBN 978-92-79-54335-7
KC-BC-16-030-EN-N
- NEW_IP_index_enpdf
-
- EUROPEAN EconomY institutional SERIES
-

I Cross-border risk sharing after asymmetric shocks evidence from the euro area and the United States
Volume 15 No 2 | 13
I4 Empirical results of cross-state risk sharing in the euro area and the US
Econometric results on the relative weight of the different risk sharing channels among euro area Member States and US states are given below This sub-section updates findings of the canonical paper by Asdrubali et al (1996) (18) for the US states in the years since the crisis It next compares the US with the euro area and draws conclusions for the possible degree of risk sharing in the euro area had the latter possessed the capital and labour market characteristics of the former The comparison also acknowledges that the US is a federal state with a
(18) Asdrubali F B Sorensen and O Yosha (1996) lsquoChannels of
interstate risk sharing United States 1963-1990rsquo The Quarterly Journal of Economics November
sizeable budget while the EMU does not have common fiscal means to cope with asymmetric shocks
Cross-border risk sharing is measured using the system of national accounts The approach consists of sequential regressions of the balancing items in the primary and secondary distribution of income accounts and in the use of income account for the total economy (so including both the private and the public sector) in order to quantify the amount of co-movement of output income including after taxes and consumption after asymmetric shocks to output The method provides a breakdown of the relative size of the three different channels of cross-border risk sharing (net factor income fiscal transfers and credit markets) and the proportion of an asymmetric shock that remains unsmoothed
Graph I6 Channels of risk sharing 50 US States anchored-start regressions with rolling end dates (1)
(1990-2013 in of total asymmetric shock to output)
(1) Regressions cover 1964 until the year shown on the horizontal axis Regressions with rolling start and end dates did not give qualitatively different results Source US Bureau of Economic Analysis (BEA) US Office of Management and Budget (OMB) US Bureau of Labour Statistics (BLS) US Census Bureau DG ECFIN calculations
435
440
445
450
455
460
465
470
475
1990 1993 1996 1999 2002 2005 2008 2011
smoothed by net factor income
76
77
78
79
80
81
82
83
84
85
1990 1993 1996 1999 2002 2005 2008 2011
smoothed by federal taxes grants and transfers
235
240
245
250
255
260
265
270
275
280
285
1990 1993 1996 1999 2002 2005 2008 2011
smoothed by savings
160
165
170
175
180
185
1990 1993 1996 1999 2002 2005 2008 2011
not smoothed
14 | Quarterly Report on the Euro Area
See Box I1 for a full description of the model and its estimation
The Asdrubali et al (1996) methodology is applied to the 50 US states and to three sets of euro area Member States the euro area (EA) 19 except Malta Cyprus Luxembourg Lithuania Austria and Greece EA 12 except Luxembourg Austria and Greece and a set of euro area core and periphery countries (Germany Spain Ireland Netherlands and Portugal) The choice of euro area countries is partly based on data availability in the European System of Accounts 2010 and partly on the option to have a sample that excludes new Member States In this way it is possible to measure legacy effects from the closer integration even before the EMU and have a sample of countries in the EA12 core and periphery which are likely to experience more asymmetries
The time period chosen for the US is between 1964 and a rolling end date from 1990 until 2013 For the three different sets of euro area countries the time period is between 1999 and 2015 The time periods are chosen based on data availability while for the US it extends the period in Asdrubali et al (1996) The difference in the two time samples does not impair comparison between the two economies because risk sharing estimates for
an economy vary little depending on the period chosen (19) The main differences between two economies are driven by the legal institutional and economic structures that underpin risk sharing not by the different time samples
The most important result of the econometric exercise is that risk sharing among Member States is lower than across federal states in the US (20) The overall proportion of an asymmetric shock that is not smoothed in the euro area is more than four times larger than in the US (Table I1 last row) Naturally the gap comes from the different
(19) This is best illustrated when comparing estimates in the original
Asdrubali et al (1996) paper and its extension here See the small scale of the vertical axis in Graph II4 Note also that the econometric approaches in Asdrubali et al (1996) and the extension here are different 2-step generalised least squares vs panel-corrected ordinary least squares See Box II1 for more information
(20) The lower degree of risk sharing after asymmetric shocks in the euro area compared with the US was reported already after the first couple of years of the EMU For an overview see for example Demyanyk Y C Ostergaard and B Sorensen (2008) lsquoRisk sharing and portfolio allocation in EMUrsquo European Economy Economic Papers 334 and Sorensen B and O Yosha (1998) lsquoInternational risk sharing and European monetary unificationrsquo Journal of International Economics Vol 45 pp 211-238 On the other hand Furceri D and A Zdzienicka (2013) lsquoThe euro area crisis need for a supranational fiscal risk sharing mechanismrsquo IMF WP13198 point out that the crisis has hampered the ability of the euro area countries to share risk
Table I1 Cross-border risk sharing through different channels(1)(2) in of total asymmetric shock to output
(1) Time period for the euro area is between 2000q4 and 2015q4 while for the US it is between 1964 and 2013 To increase the number of observations risk sharing in the euro area is measured at a quarterly frequency (difference compared with the same quarter in the preceding year) However regressions with annual frequency did not produce qualitatively different results (2) Cross-border factor income includes property income such as income from cross-border ownership of equity rent income and cross-border labour compensation Source DG ECFIN calculations Asdrubali et al (1996)
Euro area
Euro area without the
New Member States
Core vs periphery US
Risk sharing throughall EA MS except CY MT LU LT
AT GR
EA12 except LU AT and
GR
DE ES IE NL and PT 50 states
00
56 20 34 448
02 -02 -01
757 617 631 176
cross-border factor income(2)
of which cross-border labour compensation
cross-border fiscal transfers
credit markets
unsmoothed
16 26 83
182 246 180 267
I Cross-border risk sharing after asymmetric shocks evidence from the euro area and the United States
Volume 15 No 2 | 15
political and institutional setups for sharing risks in the US and the euro area as well as the relatively big role of capital and labour markets for risk sharing in the US
Graph I6 shows the estimates of the amount of risk sharing through the different channels between the 50 US states following an asymmetric shock to output The lines report the evolution of the regression estimates depending on the end date of the time series starting with an end date in 1990 The goal is to evaluate how the different channels evolved since 1990 Table I1 compares the three euro area samples with the US
Cross-state risk sharing through net factor income remains the largest contributor to consumption smoothing following an asymmetric shock in the US This channel includes risk sharing through cross-state property income such as retained earnings and income streams from cross-state ownership of shares as well as smoothing through labour earnings by commuters across state borders It is natural that these income streams are hampered during recessions Graph II4 shows two steep drops in its relative weight which broadly correspond to the recessions in 2001 and 2008-9 (21)
The estimates in Table I1 show that there is a big difference between the role of cross-border net factor income among the euro area Member States and the US states This comes as a result of the higher degree of labour mobility and deeper and more integrated capital markets in the US Higher risk sharing through this channel is to be expected given the high annual interstate mobility and the high number of commuter workers across state border in the US (22) Better capital market development in the US is also well documented see Valiante (2016) (23) for evidence that Europersquos capital markets are poorly functioning and underdeveloped compared to the US
The relative share of fiscal redistribution across state borders in the US is lower than the shares of the private channels For the full time series
(21) Even though visually pronounced these drops are small in
absolute terms Note the scale of the vertical axes on Graph II4 again supporting the conclusion that the choice of a time period has a minor impact on the absolute value of the risk sharing coefficients while keeping their relative proportion constant
(22) See Bonin et al (2008) op cit (23) Valiante D (2016) lsquoEuropersquos untapped capital market rethinking
integration after the great financial crisisrsquo CEPS Paperback
between 1964 and 2013 the relative weight of fiscal support in risk sharing is around 85 Risk sharing through this channel has been at its highest level since the start of the crisis as the federal government provided support to struggling states
The role of cross-border public risk sharing in the euro area is smaller than in the US although the difference is less striking than for the cross-border private channels The largest role for the public channel comes up when the sample of euro area countries includes only those that benefited from official support during the crisis years This should come as no surprise given that the euro area does not have a common fiscal capacity to absorb shocks
The importance of credit markets for cross-border risk sharing is more similar in the euro area and the US than the other channels This includes borrowing by both the private and the public sector The role of public sector borrowing in risk sharing is likely smaller than the one of the private sector while stabilisation through purely domestic means is not considered here (24) The role of euro area credit markets in smoothing an asymmetric output shock is more similar to the one in the US in the pre-2004 euro area sample than in the other two euro area samples This reflects a very high degree of financial deepening in the old Member States compared to those that joined recently While encouraging at face value this result also needs to take into account that pre-crisis cross-border financial flows in some of the old Member States turned out to be unsustainable as a result of insufficient risk management and supervision
The overall proportion of an asymmetric shock that is not smoothed between the 50 US states is around 18 compared to more than 60 among the euro area Member States Given that the US is a federal country with a long history of fiscal redistribution and that it has well-developed capital markets with a large presence across state borders it is to be expected that the euro area could achieve a higher degree of cross-border risk sharing once
(24) Some authors have separated this channel into saving and
borrowing on the credit markets by private entities (households and non-financial corporations) and public entities (national and local governments) See for example Furceri and Zdzienicka (2013) they find that the role of public access to credit markets for cross-border risk sharing in the euro area is several times lower than the role of private savingborrowing That is to be expected given the provisions of the Stability and Growth Pact and the relative sizes of the private and public sectors
16 | Quarterly Report on the Euro Area
changes to its institutional setup towards more integration come into being (25) However shock absorption through fiscal redistribution in a fully-fledged fiscal union such as the US is not more than around 85 of the asymmetric shock (as measured by the rolling end date regressions) even though it has increased since the crisis
Therefore a much bigger part of cross-border risk sharing in the EMU could potentially come through private channels such as integrated capital markets once the Capital Markets Union is in place
I5 Conclusion
The econometric results presented in this section point to the great potential for improvement in smoothing asymmetric shocks in the euro area When comparing the amount of an asymmetric shock that remains unsmoothed by the private and public channels of cross-border risk sharing in the euro area and the US the importance of the recent initiatives to build a Capital Markets Union stand out The significance of factor income flows which include labour compensation and capital income generated across state borders in the US could serve as a model for a euro area where capital markets play an important role in cushioning asymmetric shocks across borders Also the creation of the Single Supervisory Mechanism and other innovations in the regulatory environment in
(25) The level of integration will probably not be of the same
magnitude since it is unlikely that the union between euro area member states will soon be politically and institutionally the same as the one between the 50 US states
the euro area are likely to make risk sharing through credit markets more sustainable going forward
Completion of the European Banking Union by establishing a European Deposit Insurance Scheme (EDIS) will also facilitate risk sharing among Member States The EDIS is expected to increase the cross-border presence of euro area banks by ensuring consistent regulatory treatment regardless of country of operation and will offer protection against country-specific shocks Completing the Banking Union will create conditions for more financial integration which is expected to increase competition among banks and thus lower intermediation costs and further increase cross-border risk sharing
The importance of the public channel of cross-border risk sharing in the euro area on the other hand should be seen in contrast with its role in the US a fully-fledged fiscal union where fiscal redistribution among states has an important role Even though the relative significance of this channel in the US has increased with the crisis taxes grants and fiscal transfers in the 50 states contribute relatively less to smoothing asymmetric shocks than the private channels Therefore policy efforts to achieve a higher degree of private cross-border risk sharing in the euro area especially through capital markets and equity holdings should remain the priority option
I Cross-border risk sharing after asymmetric shocks evidence from the euro area and the United States
Volume 15 No 2 | 17
(Continued on the next page)
Box I1 Empirical methods to estimate relative weights of cross-border risk sharing channels
This box presents the econometric methodology used to estimate the relative importance of the different cross-border risk sharing channels after an asymmetric shock in the euro area and the US
It is important to look at the balancing items in the primary and secondary distribution of income accounts and the use of income account in the European System of National Accounts 2010 (ESA 2010) in order to review the necessary variables for the estimation process Data for Belgium for 2014 can be used as an illustration to arrive at the required several balancing items (1) One channel of risk sharing is the difference between gross domestic product (GDP) and gross national income (GNI) ndash risk sharing through net international factor income The bigger this difference and the lower its correlation over time with GDP the more risk sharing there is through net international factor income In order to come up with this difference mdash EUR 6038 billion in this example mdash one has to add the net of several items For example there is a difference of EUR 5715 billion between compensation of employees paid by employers in Belgium including to workers who take their earnings abroad where they are domiciled and compensation of employees received by workers in Belgium including by workers who work in other countries but bring their earnings back to Belgium where they are domiciled This is a net positive inflow of income from a Belgian perspective Other items that are treated in the same way are production taxes paid (collected) by firms (governments) and subsidies on production earned (distributed) by firms (governments) Any cross-border net inflow here will be due to fewer of these taxes paid by Belgian firms abroad compared to foreign firms in Belgium and more of these subsidies earned by Belgian firms abroad compared to foreign firms in Belgium Finally property income which includes interest for example on debt securities equity dividends reinvested earnings and some other items is treated in the same way For example a net inflow occurs if Belgian citizens receive more dividends from foreign companies than foreigners from Belgian companies
Another channel of risk sharing is through cross-border fiscal redistribution This makes the difference between GNI and gross disposable income (GDI) Here a net inflow in Belgium will occur if social transfers received by Belgian persons and entities from foreign sources outweigh the transfers received by foreigners in Belgium The same will happen if income and wealth taxes paid by foreigners in Belgium are higher than income and wealth taxes paid by Belgians abroad
Finally the difference between GDI and consumption is gross savings through which consumption can be smoothed Borrowings and savings are channelled through domestic and foreign financial intermediaries
At the state level in the US some of these balancing items are not available Specifically state national income and state disposable income are constructed using the method in the Appendix in Asdrubali et al (1996) (2)
Asdrubali et al (1996) propose a series of regressions of these balancing items to estimate the relative
importance of each of the risk sharing channels Starting from the identity = ∙ ∙ ∙ it is
easy to show that a relationship 1 = + + + exists where the beta terms are the estimates of the regression coefficients in ∆ minus ∆ = + ∙ ∆ + ∆ minus ∆ = + ∙ ∆ + ∆ minus ∆ = + ∙ ∆ + ∆ = + ∙ ∆ + The beta terms are interpreted as the relative weights of cross-border risk sharing due to net factor income fiscal transfers savings and borrowings on credit markets The last beta coefficient shows the amount of an asymmetric shock that remains unsmoothed The panel regressions include time fixed effects μ and error terms u
18 | Quarterly Report on the Euro Area
Box (continued)
There are three sets of panels for the euro area EA19 except Malta Cyprus Luxembourg Lithuania Austria and Greece EA12 except Luxembourg Austria and Greece and a set of euro area core and periphery countries (Germany Spain Ireland Netherlands and Portugal) The choice of euro area countries is partly based on data availability in the European System of Accounts 2010 and partly on the option to have a sample that excludes new Member States to be able to measure legacy effects from the closer integration even before the EMU and to have a sample of countries in the EA12 core and periphery which are likely to experience more asymmetries The US sample includes the 50 US states
The time period chosen for the US is between 1964 and a rolling end date from 1990 until 2013 For the three different sets of euro area countries the time period is between 1999 and 2015 The time periods are chosen based on data availability while for the US it extends the period in Asdrubali et al (1996)
The regressions are estimated with 2-step generalised least squares (GLS) correcting for heteroscedasticity and cross-sectional correlation in the case of the euro area and ordinary least squares (OLS) with panel-corrected standard errors in the case of the US The latter method is better suited for panels with larger cross-sections while the former method is better in the opposite case (3) Both estimations include a common AR1 autocorrelation structure within panels The first differences in the quarterly euro area data are in terms of the same quarter of the preceding year The euro area regressions also include a further breakdown of GNI into one corrected only for cross-border labour compensation and one for the other elements of net factor income
Econometric results are in the table below All estimates marked with are statistically significant at the 99 confidence level Z-statistics are in parentheses
Table 1 Regression results
Source US Bureau of Economic Analysis (BEA) US Office of Management and Budget (OMB) US Bureau of Labour Statistics (BLS) US Census Bureau Eurostat DG ECFIN calculations (1) For more information see Box 2 in lsquoCross-border risk sharing has it increased in the euro arearsquo in QREA Vol 6 No3 (2007) (2) Asdrubali F B Sorensen and O Yosha (1996) lsquoChannels of interstate risk sharing United States 1963-1990rsquo The Quarterly Journal
of Economics November (3) These are standard econometric approaches in estimating cross-border risk sharing For a short discussion on the econometrics of
cross-border risk sharing see Hepp R and J von Hagen (2013) lsquoInterstate risk sharing in Germany 1970mdash2006rsquo Oxford Economic Papers Vol 65 No1 pps 1-24
(1) (2) (3) (4)Risk sharing through 2-step GLS 2-step GLS 2-step GLS PC-OLScross-border factor income 00552 00199 00343 04476
(722) (316) (568) (1198)of which cross-border labour compensation 00024 -00015 -00012
(281) (-414) (-282)cross-border fiscal transfers -00007 00156 00257 00832
(-039) (847) (761) (803)credit markets 01815 02459 01800 02668
(1738) (831) (478) (508)unsmoothed 07574 06171 06312 01760
(3784) (2505) (1838) (505)
Countries
Full panel - 13 countries BE
DE EE ES FI FR IE IT LV NL PT
SK SL
Old member states - 9
countries BE DE ES FI FR IE IT
NL PT
Core vs periphery - 5 countries DE ES IE NL PT
50 US states
Period 2000Q4-2015Q4 2000Q4-2015Q4 2000Q4-2015Q4 1964-2013No of observations 793 549 305 2500
II Financial channels and economic activity in the euro area
Volume 15 No 2 | 19
II1 Introduction
Since the global economic and financial crisis the linkages between macroeconomic and financial developments have been on the frontline of both research and policy making The massive dislocations observed during the crisis have forged a broad consensus that shocks originating in the financial sector can have profound effects on real economic activity and vice versa While the effect of macroeconomic developments on financial conditions is rather straightforward (27) the effect of financial developments on the macroeconomy is more complex and was (until recently) largely omitted in mainstream macroeconomic thinking The interest rate was the only financial variable included in standard macroeconomic models and only to the extent that it was assumed to influence the decisions of economic agents while no genuine role was assigned to the financial sector itself In reality financial intermediation is subject to numerous frictions that can affect macroeconomic developments via diverse transmission channels Given the decisive role of bank credit in financing the euro area economy shocks originating in the banking sector are of crucial importance
This section looks at macro-financial linkages in the euro area to shed light on how financial developments may have contributed to disappointing macroeconomic performance in the
(26) This section was prepared by Narcissa Balta and Bořek Vašiacuteček (27) Jacobson T J Linde and K Roszbach (2005) lsquoExploring
interactions between real activity and the financial stancersquo Journal of Financial Stability Vol 1 No 3 pp 308ndash41
recent past The methodology employed for this purpose is a large-scale Bayesian Vector Autoregression (VAR) that encompasses a wide set of macroeconomic and financial variables (28)
Subsection I2 discusses the importance of the financial system for the real economy and briefly reviews the relevant economic literature Subsection I3 describes the main transmission channels from financial markets to the real economy and defines specific variables that could be used to capture these transmission channels in the euro area Subsection I4 presents the results of the empirical analysis particularly some stylised facts on the co-movement between financial variables and economic activity since the crisis
II2 The financial system and the real economy
Market frictions are normally understood as a wide range of different bottlenecks that do not allow markets to efficiently clear demand and supply Financial frictions are impediments to the smooth functioning of the financial market that do not allow funds to be channelled effectively from creditors to borrowers Therefore they play an important role in the way the financial system affects the real economy Moreover the presence of frictions during periods of financial turmoil undermines the effectiveness of monetary policy
(28) Bańbura M D Giannone and M Lenza (2015) lsquoConditional
forecasts and scenario analysis with vector autoregressions for large cross-sectionsrsquo International Journal of Forecasting Vol 31 Issue 3 pp 739ndash756
This section discusses the nexus between financial and macroeconomic developments in the euro area It draws on key lessons from the literature and provides stylised facts on the main transmission channels through which financial developments have affected real economic activity since the crisis Macro-financial linkages are investigated from an empirical perspective for the euro area as a whole by looking at four key channels i) the interest rate channel ii) the borrower balance sheet channel iii) the bank balance sheet channel and iv) the uncertainty channel
Overall the results suggest that financial variables have significant impact on macroeconomic developments but also that the transmission seems to have changed since the crisis Notably the interest rate channel has helped the modest recovery since 2014 by supporting both private and public consumption The positive boost given to favourable financing conditions in 2015 has been somewhat compensating the adverse effects of the borrower balance sheet channel The bank balance sheet channel and the uncertainty channel play a particularly important role in capturing the weakness in the current rebound in investment (26)
20 | Quarterly Report on the Euro Area
transmission and financial sector stability which via feedback effects can have a detrimental impact on macroeconomic developments For instance hikes in bank funding costs when money markets stop functioning are likely to be transmitted to the lending rates applied to consumers which in turn can have a significant drag on both investment and consumption Also financial frictions increase the likelihood of financial shocks occurring both from the demand and the supply side
Financial shocks are usually deemed to be very persistent and have amplification effects in the sense that even small shocks can produce large and long-lasting effects (29) Graph II1 shows a clear negative correlation between GDP growth and financial distress in the euro area as measured by the Composite Indicator of Systemic Stress (CISS) (30)
Graph II1 Real GDP growth vs Composite indicators of systemic stress
(2000Q1-2016Q1)
Source ECB Eurostat
Since the key role of the financial sector consists in funding economic activity new credit is the main channel of transmission between the financial sector and the macroeconomy Financial shocks occurring on the demand side are usually triggered by an impairment of borrowers balance sheets
(29) Brunnermeier M K T Eisenbach and Y Sannikov (2012)
lsquoMacroeconomics with financial frictions A surveyrsquo National Bureau of Economic Research Working Paper No 18102
(30) The CISS measures contemporaneous stress in the financial system It is an aggregate of five market-specific sub-indices More weight is put when stress prevails in several market segments at the same time thus tracking financial stress of systemic nature
Holloacute D M Kremer and M Duca (2012) lsquoCISS-a composite indicator of systemic stress in the financial systemrsquo European Central Bank Working Paper No (No 1426)
which in turn undermines their creditworthiness and their capacity to invest and consume Financial shocks occurring on the supply side (ie those that originate from within the financial sector) normally manifest themselves through tightening of credit conditions andor credit rationing which again impact real economic activity via the investment behaviour of households and non-financial corporations Graph II2 shows the negative correlation between credit standards for firms and real investment (31)
Graph II2 Investment growth vs credit standards for NFC
(2003Q1-2016Q1)
Source ECB BLS Eurostat
Financial frictions have been fully embedded into macroeconomic models only recently
The neglect of financial sector effects in traditional macroeconomic thinking has its foundation in the famous Modigliani-Miller theorem (32) The theorem argues that the way a firm finances its investment (via debt or via equity) has no effect on its value and thus that their investment decisions are driven primarily by macroeconomic conditions (namely the real interest rate) rather than financial market developments However the validity of the theorem hinges on a set of very restrictive assumptions such as perfect information equal tax treatment for debt and equity etc which are generally not met in practice (33) Financial
(31) Credit standards are measured by the backward looking three
months index from ECB Bank Lending Survey (BLS) (32) Modiglini F and M Miller (1958) lsquoThe cost of capital
corporation finance and the theory of investmentrsquo The American Economic Review Vol 48 No 3 pp 261-297
(33) Morley J (2016) lsquoMacro-finance linkagesrsquo Journal of Economic Surveys forthcoming
-8
-6
-4
-2
0
2
4
6
0
10
20
30
40
50
60
70
80
2000Q1 2003Q1 2006Q1 2009Q1 2012Q1 2015Q1
CISS
GDP y-o-y change(rhs)
-15
-10
-5
0
5
10
-10
-5
0
5
10
15
20
25
30
35
40
2003Q1 2005Q1 2007Q1 2009Q1 2011Q1 2013Q1 2015Q1
Change in creditstandards for NFCInvestment y-o-y change (rhs)
II Financial channels and economic activity in the euro area
Volume 15 No 2 | 21
intermediation typically involves asymmetry of information between borrowers and lenders and potentially costly verification of the borrowers financial situation (34)
The first attempts to include financial frictions in macroeconomic models were based on the insight that the cost of external financing very much depends on the borrowers net worth (35) andor the market value of their collateral (36) In fact changes in asset prices turn out to be a crucial determinant of both the cost of external financing and the value of collateral Moreover a relatively small shock can have a major effect on economic activity through the so-called financial accelerator whereby negative feedback loops between lower assets prices restricted access to credit and lower consumption and investment significantly amplify and prolong the impact on the real economy (37) Real estate which is a typical asset used as collateral by both households and firms establishes a tight link between the housing market and the economy as a whole (38)
While the original theoretical contributions did not explicitly model financial intermediaries (assuming direct lending from investors to borrowers) the inclusion of financial intermediaries (ie the banking sector) implies that financial frictions can appear also on the lendersrsquo side (39) Specifically financial intermediaries can become balance sheet constrained in times of economic and financial stress which affects their funding costs Such shocks to the lendersrsquo side are usually mitigated by central bank intermediation during crisis times (40)
(34) Carlstrom C T and T S Fuerst (1997) lsquoAgency costs net worth
and business fluctuations A computable general equilibrium analysisrsquo The American Economic Review Vol 87 No 5 pp 893-910
(35) Bernanke B and M Gertler (1989) lsquoAgency costs net worth and business fluctuationsrsquo The American Economic Review Vol 79 No 1 pp 14-31
(36) Kiyotaki N and J Moore (1997) lsquoCredit cyclesrsquo Journal of Political Economy Vol 105 Issue 2 pp 211-248
(37) Bernanke B S M Gertler and S Gilchrist (1999) lsquoThe financial accelerator in a quantitative business cycle frameworkrsquo Handbook of Macroeconomics Vol 1 Part C pp 1341-1393
(38) Iacoviello M and S Neri (2010) lsquoHousing market spillovers evidence from an estimated DSGE modelrsquo American Economic Journal Macroeconomics Vol 2 No 2 pp 125-164
(39) Gertler M and N Kiyotaki (2010) lsquoFinancial intermediation and credit policy in business cycle analysisrsquo Handbook of Monetary Economics Vol 3 Issue 3 pp 547-599
(40) Gertler M and P Karadi (2011) lsquoA model of unconventional monetary policyrsquo Journal of Monetary Economics Vol 58 Issue 1 pp 17-34
Despite intensive efforts in recent years the financial sector is still not fully established as a consolidated part of conventional macroeconomic models Structural models augmented by a banking sector and financial markets (41) typically find that financial factors such as bank liquidity constraints are indeed the main drivers of economic fluctuations in both the US and the euro area and that they were the main shock propagator during the global financial crisis (42)
Empirical evidence on macro-financial linkages
There is now a wide consensus that financial cycles are crucial for understanding business cycle fluctuations (43) Numerous empirical studies evaluate the effects of financial shocks on macroeconomic fluctuations Importantly financial factors can both reinforce the transmission of other shocks and be a source of disturbance in their own right
Credit appears to be one of the most studied financial variables in empirical studies due to its established regularities in terms of boom-and-bust behaviour and its link to financial crises and economic downturns (44) Credit spreads play an important role for capital markets-based systems like the US economy For example corporate bond spreads usually increase disproportionately during periods of financial stress (so-called excess bond premiums) which in turn causes economic activity to contract (45) In the euro area where external financing is mostly bank based a crucial role is played by bank lending rates and bank lending volumes Credit supply shocks have been identified
(41) Christiano L J R Motto and M Rostagno (2010) lsquoFinancial
factors in economic fluctuationsrsquo European Central Bank Working Paper No 1192
(42) Gerke et al (2013) and Wieland et al (2015) provide detailed comparison exercise for different macrofinancial models
Gerke R M Jonsson M Kliem M Kolasa P Lafourcade A Locarno K Makarski and P McAdam (2013) lsquoAssessing macro-financial linkages A model comparison exercisersquo Economic Modelling Vol 31 pp 253-264
Wieland V E Afanasyeva M Kuete and J Yoo (2015) lsquoNew methods for macro-financial model comparison and policy analysisrsquo mimeo
(43) Borio C (2012) lsquoThe financial cycle and macroeconomics what have we learntrsquo Bank for International Settlements Working Papers No 395
(44) Balke N S (2000) lsquoCredit and economic activity credit regimes and nonlinear propagation of shocksrsquo Review of Economics and Statistics Vol 82 No 2 344-349
(45) Gilchrist S and E Zakrajšek (2012) lsquoCredit spreads and business cycle fluctuationsrsquo The American Economic Review Vol 102 No 4 pp 1692-1720
22 | Quarterly Report on the Euro Area
as important determinants of the increase in lending rates and the decline in lending volumes during the recent crisis (46) Bank lending represents the main transmission mechanism in the euro area
The evidence available indicates that the impact of financial shocks on the macroeconomy is lsquostate dependentrsquo ie the response of economic activity inflation and credit to financial shocks is stronger during periods of stress This is well documented for both the euro area and the US (47) Moreover during periods of high systemic stress financial shocks tend to have both a larger magnitude and a greater impact on real activity (48) Notably a single indicator of systemic stress such as the CISS for the euro area has been found to explain a significant part of macroeconomic developments especially due to episodes of elevated systemic stress such as the global financial crisis and the euro area debt crisis (49)
While studies on financial and business cycle have been popular for some time there has been much less investigation into macro-financial linkages between countries Existing evidence indicates that such linkages exist but their intensity varies both across time and across countries Specifically it has been documented that the observed heterogeneity is mainly due to country-specific characteristics which lead to international spillovers having a differentiated impact across countries (50) Such heterogeneity seems also to be present within the euro area
(46) Moccero D N M D Pariegraves and L Maurin (2014) lsquoFinancial
Conditions Index and identification of Credit Supply Shocks for the Euro Arearsquo International Finance Vol 17 Issue 3 pp 297-321
(47) Hubrich K and R J Tetlow (2015) lsquoFinancial stress and economic dynamics the transmission of crisesrsquo Journal of Monetary Economics Vol 70 pp 100-115
Prieto E S Eickmeier and M Marcellino (2016) lsquoTime variation in macro‐financial linkagesrsquo Journal of Applied Econometrics forthcoming
Silvestrini A and A Zaghini (2015) lsquoFinancial shocks and the real economy in a nonlinear world a survey of the theoretical and empirical literaturersquo Journal of Policy Modeling Vol 37 pp 915ndash929
(48) Hartmann P K Hubrich M Kremer and R J Tetlow (2015) lsquoMelting down Systemic financial instability and the macroeconomyrsquo mimeo
(49) Kremer M (2015) lsquoMacroeconomic effects of financial stress and the role of monetary policy a VAR analysis for the euro arearsquo International Economics and Economic Policy Vol 13 Issue 1 pp 1-34
(50) Ciccarelli M E Ortega and M T Valderrama (2016) lsquoCommonalities and cross-country spillovers in macroeconomic-financial linkagesrsquo The BE Journal of Macroeconomics Vol 16 Issue 1 pp 231-275
II3 Transmission channels from financial to macro developments
In spite of the broad consensus about the existence of macro-financial linkages the identification of the transmission channels is still a subject of debate There are different ways to classify the channels through which the financial sector might affect macroeconomic developments The important distinction applied in this section is whether the linkages are related to the balance sheets of borrowers or lenders At the same time the financial channels are also closely related to monetary transmission which affects their functioning (51) This subsection aims to better define the individual transmission channels in the euro area
The interest rate channel illustrates how money market rates affect the overall financing costs of the banking sector the price of credit and consequently consumption and investment decisions This channel is closely related to monetary policy decisions as they directly affect the funding costs of banks Moreover at the zero lower bound when the central bank uses other instruments besides short-term interest rates to conduct monetary policy this channel is more complex and difficult to assess
Thus in the analysis below the interest rate channel will be captured by variables that are affected by monetary policy decisions (Graph II3) In the euro area the most frequently used indicator directly affected by the ECBrsquos policy rates is the short-term interbank interest rate (EONIA) While the effect of monetary policy actions on short-term rates is rather quick there is also a delayed effect on long-term interest rates The long-term rates are of specific relevance in the current time as short-term rates are at the zero lower bound and monetary policy aims to affect long rates directly While long-term rates are commonly defined by the yield on respective sovereign bonds in the euro area this applies to a pool of euro area sovereigns As the yields diverge across sovereigns since the global financial crisis long-term rates in the euro area have become disconnected from short-term rates Since the ECB has employed diverse unconventional measures that affect the
(51) See for instance Basel Committee on Banking Supervision (2011)
lsquoThe transmission channels between the financial and real sectors a critical survey of the literaturersquo BCBS Working Paper No 18
II Financial channels and economic activity in the euro area
Volume 15 No 2 | 23
financial system additional measures need to be used to track their effect namely the shadow rate which is a factor model-based estimate of the short-term interest rate unconstrained by the ZLB (52) Likewise the excess liquidity defined as the liquidity held by the euro area banking sector in excess of the aggregate needs arising from minimum reserve requirements and autonomous factors is another quantitative-based indicator of the monetary policy stance as it is driven by the ECBrsquos refinancing operations
Graph II3 shows the dynamics of the variables described above in the period Q1-1996 - Q1-2016 which suggest that monetary conditions have been very supportive in recent years While short-term interest rates attained the ZLB monetary easing through unconventional measures is reflected in a significant decline in the shadow rate as well as long-term rates
Graph II3 Interest rate channel (2000Q1-2016Q1 )
Source Eurostat Bloomberg Reserve Bank of New Zealand
The borrower balance sheet channel reflects the fact that it is the net worth of borrowers that determines the external finance premium ie the opportunity cost of borrowing over using internal savings In other words it is the value of borrowersrsquo collateral that affects their credit conditions As indicated above fluctuations in
(52) There different shadow rates available all being subject of
significant model uncertainty The shadow rate used is based on Krippner (2012) and available from the Reserve Bank of New Zealand website
Krippner L (2012) lsquoMeasuring the stance of monetary policy in zero lower bound environmentsrsquo Economics Letters Vol 118 Issue 1 pp 135ndash138
asset prices can affect the ability of non-financial corporations and households to borrow and thus their investment and spending decisions While monetary policy commonly does not target asset prices its actions can affect the valuation of assets used as collateral which affects the credit available for investment and consumption spending (53) Whereas the previous discussion focuses on the demand side of credit the borrower balance sheet channel affects also the supply of credit Namely weak borrower balance sheets might induce credit rationing by the lenders and affect overall credit conditions
The borrower balance sheet channel can be captured mainly by variables that reflect the risks related to the balance sheets of firms and households as borrowers from the banking sector or from capital markets While there are no readily available direct measures of the quality of private balance sheets comparable across countries asset prices can be considered as indicative of their quality as they give the value of collateral for loans and of equity Therefore house prices and stock prices are generally used in the analysis to track this channel
Graph II4 Borrower balance sheet channel
(2000Q1-2016Q1)
Source Bloomberg BIS
Graph II4 suggests that developments in house prices and stock prices have been quite
(53) There is empirical evidence especially for the US stressing the
importance of asset prices and different credit spreads as leading indicator of economic activity eg Stock and Watson (2003) Stock J H and M W Watson (2003) lsquoForecasting output and inflation the role of asset pricesrsquo Journal of Economic Literature Vol 41 No 3 pp 788-829
-10
-5
0
5
10
15
20
25
2000Q1 2004Q1 2008Q1 2012Q1 2016Q1
Short-term interest rateLong-term interest rateShadow rate (Krippner)ECB Excess Liquidity Index
-6
-4
-2
0
2
4
6
8
10
-60
-40
-20
0
20
40
60
2000Q1 2002Q3 2005Q1 2007Q3 2010Q1 2012Q3 2015Q1
MSCI EURO Index y-o-y change
Housing prices y-o-y change
24 | Quarterly Report on the Euro Area
disconnected in recent years Specifically while house prices only started to recover in 2014 stock prices peaked in early 2015 and experienced a downward correction since then
The bank balance sheet channel relates to the fact that how much a bank lends depends on its own balance sheet and the different risks involved in its business model External developments (including monetary policy actions but also longer-term factors such as financial regulation and innovations in the banking sector) may affect bank liabilities (the supply of loanable funds and also bank funding costs) and in turn assets (supply of credit and the lending cost) (54) Bank lending is determined by banksrsquo business models it usually increases with the increase in leverage in the economy while deleveraging episodes may significantly hamper lending activities This makes leverage highly pro-cyclical (55) Importantly the impact of bank balance sheets on the real economy can be more pronounced in the euro area than in capital-market based systems as alternative forms of financing are relatively undeveloped
The bank balance sheet channel can thus be illustrated by variables such as banking leverage the stock of non-performing loans banksrsquo funding costs or the price of Credit Default Swaps (CDS) However reliable data for the euro area are relatively short available only for the period since the beginning of the crisis Indeed the lack of knowledge about the quality of bank balance sheets was an important aspect of the euro area financial crisis and a reason for the implementation of the Asset Quality Review (AQR) by the ECB in 2014 Therefore for the analysis in this section measures which directly track the supply of credit have been used instead (56) Namely the flow of credit as measured by the credit impulse (ie the change in new credit granted by the banking sector as a percentage of GDP) the stock of credit on banksrsquo balance sheet as measured by total economy credit as a percentage of GDP and the price of credit as measured by the Composite Financing Conditions Indicator (CFCI) for non-financial corporations
(54) Bernanke B and A Blinder (1988) lsquoCredit money and aggregate
demandrsquo the American Economic Review Vol78 No 2 pp 435ndash439 (55) Adrian T and H S Shin (2010) lsquoLiquidity and leveragersquo Journal of
Financial Intermediation Vol 19 Issue 3 pp 418-437 (56) In practice the lending volumes and rates can be affected both by
supply and demand side
which (assuming a constant mark-up) proxies bank funding costs (57)
Graph II5 shows that there is a negative correlation between the credit impulse and credit as a percentage of GDP Thus during downturns the flow of new credit declines while the ratio of credit to GDP increases due to the collapse of GDP The credit impulse indicator shows that the supply of new credit has been fairly limited since the onset of the global financial crisis The CFCI tracks the ECB policy rates rather closely with the exception of the euro area sovereign debt crisis episode (2011-2012) when financing costs increased due to idiosyncratic increases in some Member States reflecting financial market fragmentation
Graph II5 Bank balance sheet channel (2000Q1-2016Q1)
Source Capital Economics BIS DG ECFIN
While the previous channels are related to the quality of balance sheets either on the borrower or the lender side some shocks can originate in the overall financial system Examples are liquidity shocks or confidence shocks These shocks work both via the balance sheets but also by directly altering agents decisions through precautionary motives affecting both investment and consumption behaviour These mechanisms are defined as the uncertainty channel (58)
(57) For more details on CFCI calculations see European Commission
(2013) Drivers of diverging financing conditions across Member States Quarterly Report on the Euro Area Vol12 No1
(58) Bloom (2009) point to uncertainty shocks (that might be related but also unrelated to the financial system) as a crucial driver of economic dynamics Recently Caldara et al (2016) argue for the needs to distinguish uncertainty shocks from financial shocks while both of them are important source of macroeconomic
-8
-6
-4
-2
0
2
4
6
8
10
2000Q1 2003Q1 2006Q1 2009Q1 2012Q1 2015Q1
Total credit on GDP y-o-y change
Credit impulse (new crediton GDP y-o-y change)
Composite financingconditions indicator
II Financial channels and economic activity in the euro area
Volume 15 No 2 | 25
The uncertainty channel is captured by variables reflecting the different types of uncertainty that can affect the economy One type is commonly related to increased volatility in financial markets Given a high degree of global interconnectedness the euro area economy can be affected by uncertainty related to global financial developments which is usually measured by the implied volatility of SampP 500 index options (VIX) (59) The euro area specific stress in the financial system is measured through the ECBrsquos Composite Indicator of Systemic Stress (CISS)
Another type of uncertainty is linked to swings in business and consumer confidence Variations in the confidence of euro area households and non-financial firms are illustrated through the European Commissionrsquo confidence indicator the Economic Sentiment Indicator (ESI) which is based on data collected through business and consumer surveys However the indicator exhibits a very high contemporaneous correlation with actual GDP growth indicating that its dynamics are likely to reflect very accurately economic conditions rather than information related to exogenous changes in confidence
Finally unexpected outcomes of economic policy decisions can lead to policy uncertainty which in turn can have adverse effects on the savings and investment behaviour of firms and households Policy uncertainty is illustrated through an indicator based on newspaper coverage of uncertainty-generating events (60)
Graph II6 indicates that there is an apparent co-movement among these indicators even if they measure different types of uncertainty While economic sentiment has been gradually improving and uncertainty related to financial markets has eased the policy uncertainty affecting the euro area is still relatively high
fluctuations separately the Great Recession was likely outcome of the toxic interaction between the two
Bloom N (2009) lsquoThe impact of uncertainty shocksrsquo Econometrica Vol 77 Issue 3 pp 623-685
Caldara D C Fuentes-Albero S Gilchrist and E Zakrajšek (2014) lsquoThe macroeconomic impact of financial and uncertainty shocksrsquo European Economic Review forthcoming
(59) The VIX is calculated by the Chicago Board Options Exchange (CBOE)
(60) Baker S R N Bloom and S J Davis (2015) lsquoMeasuring economic policy uncertaintyrsquo National Bureau of Economic Research Working Paper No 21633 Data source wwwpolicyuncertaintycom
Graph II6 Uncertainty channel (2000Q1-2016Q1)
Source Chicago Board of Exchange ECB wwwpolicyuncertaintyorg
II4 Financial developments and economic activity
This sub-section provides stylised facts on the transmission channels defined above and show whether and how financial developments have affected the real side of the euro area economy since the crisis (namely consumption investment unemployment and long-term interest rates)
While financial variables are available in real time macroeconomic variables are normally released with lags Therefore conditioning macroeconomic forecasts on observed financial developments (ie a projection of macro variables on the observed paths of financial variables) can improve forecasts as more informative data are taken into account Several empirical studies have shown that financial variables can improve macroeconomic forecasts (61)
The methodology underlying this this section is a large-scale Bayesian VAR with 35 macroeconomic
(61) Stock and Watson (2003) provide a seminar contribution on the
role of financial variables namely asset prices for GDP and inflation forecast concluding that different financial variables allow macroeconomic forecasting in different times Espinosa et al (2012) document using standard VAR approach that financial variables improve GDP forecast for the euro area especially in the real time when numerous financial variables are available ahead of the macroeconomic releases
Stock J H and M W Watson (2003) lsquoForecasting output and inflation the role of asset pricesrsquo Journal of Economic Literature Vol 41 No 3 pp 788-829
Espinoza R F Fornari and M J Lombardi (2012) lsquoThe role of financial variables in predicting economic activityrsquo Journal of Forecasting Vol 31 No 1 pp 15-46
0
50
100
150
200
250
300
0
10
20
30
40
50
60
70
80
2000Q1 2002Q3 2005Q1 2007Q3 2010Q1 2012Q3 2015Q1
VIX
CISS
ESI (rhs)
Policy uncertainty (rhs)
26 | Quarterly Report on the Euro Area
and financial variables (62) The model is estimated for the sub-period Q1-2000 - Q4-2011 which covers both normal and crisis times but does not include some of the most important unconventional monetary policy measures Given the estimated past correlations a counterfactual path for the macroeconomic and financial variables (ie a distribution of conditional forecasts) can be obtained for the entire period Q1-2000 - Q4-2015 conditional on observed real GDP and inflation in the baseline case The deviations of the observed developments of financial variables from this counterfactual path can be interpreted as evidence of instability in the relationship between financial variables and economic activity (as measured by GDP growth and inflation) since the crisis
Subsequently the conditional set from the baseline case (including only real GDP and inflation) is extended by financial and uncertainty variables corresponding to each transmission channel described above (63)
Some recent developments are puzzling
Graph II7 shows the counterfactual paths of the main GDP components producer prices the unemployment rate and the long-term interest rate conditional on observed economic activity (real GDP and inflation) It also shows the conditional forecasts for the balance sheet variables of households and firms when only real GDP and inflation are taken into account in the conditioning set
(62) Alternative strand of literature using rich set of data in order to
nowcast or forecast employs dynamic factors models where data dimension is reduced in a first step by factor estimation with common factors being consequently used in the forecasting exercize see eg Giannone et al (2008) Bellego and Ferrara (2012) find using factor-augmented probit model that financial variables allow tracking better recession periods in the euro area (in the pre-crisis period) with optimal lead of financial variables over recession of around one year
Giannone D L Reichlin L and D Small (2008) lsquoNowcasting the real-time informational content of macroeconomic datarsquo Journal of Monetary Economics Vol 55 Issue 4 pp 665ndash676
Belleacutego C and L Ferrara (2012) lsquoMacro-financial linkages and business cycles A factor-augmented probit approachrsquo Economic Modelling Vol 29 pp 1793-1797
(63) For more details on the methodology see Box IV1 in European Commission (2015) lsquoInvestment dynamics in the euro area since the crisisrsquo Quarterly Report on the Euro Area Vol 14 No 1 pp 35-43
Bańbura M D Giannone and M Lenza (2015) lsquoConditional forecasts and scenario analysis with vector autoregressions for large cross-sectionsrsquo International Journal of Forecasting Vol 31 Issue 3 pp 739ndash756
The results suggest that private consumption was unusually low during the period of the euro area debt crisis and deleveraging (2012-2013) while it overshot during the recent recovery (from 2014 onward) Investment behaved in line with historical correlations during both downturn episodes (2008-2009 and 2012-2013) and was weak during the deleveraging phase because overall output growth was weak However its recent recovery (since 2014) has been more subdued than what the pace of economic activity would have predicted the observed investment path is positioned on the lower tail of the distribution of conditional forecasts) (64)
Large deleveraging pressures in the public sector have led to a significant decline in the euro area aggregate government consumption over the period 2011-2012 However this decline had almost been reversed by the end of 2014 with public consumption starting to overshoot from 2015 onwards (relative to its counterfactual path obtained through conditioning on output growth) reflecting the aggregate euro area fiscal stance which started to turn mildly expansionary
Moreover the results show that several variables capturing price and balance sheet developments are still at odds with historical patterns In particular producer prices house prices long-term interest rates and loans to firms and households undershoot the distribution of the conditional forecasts On one side this underlines that the recent recovery is characterized by a historically low inflation environment and loose monetary conditions pushing the long-term rates down On the other side the ongoing balance sheet adjustment is translating into very weak credit dynamics due to unprecedented deleveraging pressures
Graph II8 illustrates the zero lower bound constraint on monetary policy rates and the subsequent break in the correlation of economic activity with the two measures of monetary policy
(64) There is some relative instability in the estimated correlations over
the sample period notably pre-crisis vs crisis years However it does not significantly affect the result on the unusual weakness in investment recovery since 2014 The article lsquoInvestment dynamics in the euro area since the crisisrsquo Quarterly Report on the Euro Area Vol 14 No 1 pp 35-43 found that estimating the past correlations only with the sample for the pre-crisis period the amplitude of the investment fall during the first downturn (2008-2009) would also be slightly underestimated by the conditional forecasts
II Financial channels and economic activity in the euro area
Volume 15 No 2 | 27
rates since 2012 Among all variables the consumer and business confidence indicator (ESI) comes out as having the strongest contemporaneous correlation with economic activity during the crisis
In the consecutive analysis the conditioning dataset (including only real GDP and inflation in the baseline) is augmented by financial variables corresponding to each transmission channel
hellip different channels play an important role at different stages since the crisis
The interest rate channel (Graph II9 upper panel) seems to better account for the pattern of consumption during the recent recovery (compared to the baseline) This channel which reflects mainly monetary conditions suggests that monetary easing implemented since 2014 by means of additional unconventional measures (namely the targeted long-term refinancing operations (TLTRO) the asset-backed securities purchasing program (ABSPP) and the forthcoming public
securities purchase program (PSPP)) have translated into a further decline in the long-term interest rate and the shadow policy rate It also reflects an increase in excess liquidity which has had a very benign effect on the recent recovery However producer prices developments (PPI) still appear unusually subdued Likewise including information capturing the interest rate channel does not help explain the dismal performance of consumption during the deleveraging phase (2012-2013) or the persistent weakness of credit dynamics Therefore these developments seem to be determined also by drivers other than monetary conditions
The borrowers balance sheet channel (Graph II9 lower panel) captures in turn the exceptional deleveraging developments of 20122013 but clearly underestimates the pace of the recent recovery This finding suggests that strained balance sheets of households and firms represented the main weight on the recovery at the time of euro area sovereign debt crisis However whereas a mild recovery started in the euro area in 2014 private
Graph II7 Conditional forecasts based on real GDP and inflation (1) (2000Q1-2015Q4 y-o-y growth)
Misalignments of financial and real variables with output growth since the crisis
(1) Shades of orange distribution of the conditional forecasts in the BVAR in levels excluding the lower and higher 5 quantiles Green line actual values The variables are all reported in terms of annual percentage changes except for the unemployment rate and the long-term interest rate which are in levels Conditioning assumptions real GDP and HICP Source DG ECFIN MATLAB codes replication files of the methodological paper (Banbura et al 2015)
Government consumption
2005 2010 2015-2
0
2
4Real consumption
2005 2010 2015-5
0
5Real investment
2005 2010 2015-20
-10
0
10
Unemployment rate
2005 2010 20150
5
10
15PPI ex const
2005 2010 2015-50
0
50House prices
2005 2010 2015-10
0
10
Long-term i r
2005 2010 20150
5
10Loans to firms
2005 2010 2015-10
0
10
20Loans to households
2005 2010 2015-5
0
5
10
28 | Quarterly Report on the Euro Area
balance sheets still did not improve much In fact when the borrower balance sheet channel is taken into account observed consumption overshoots the conditional forecast even by a higher margin than in the baseline scenario and real investment seems to be on the upper side as well This suggests that the borrower balance sheet channel should have led to more subdued dynamics of both consumption and investment than what has been observed in 2014 and 2015 indicating that other channels have been somewhat compensating the adverse effects of this channel
The bank balance sheet channel (Graph II10 upper panel) improves the forecast of investment since 2014 and reduces the uncertainty around the median for some variables such as consumption unemployment and long-term interest rate The good fit of investment dynamics indicates a strong correlation of investment with total economy credit developments both in terms of flows and stocks
Interestingly the bank balance sheet information namely the total economy credit as percentage of GDP (including credit to public sector) the private sector credit impulse and the price of credit for the private sector cannot capture the weak observed dynamics of outstanding loans to firms and households This shows that the private deleveraging process has been much stronger than the public sector deleveraging making private credit developments disconnected from GDP
growth (65) Therefore while the recovery in real activity has been rather weak the private credit dynamics have been even weaker Furthermore the modest recovery does not facilitate passive deleveraging (a decrease in the relative debt burden due to a growing economy ie denominator effect) and feeds the active deleveraging (a decrease of absolute level of debt ie nominator effect)
Finally the current long-term interest rate seems very low even when the financing costs for non-financial corporations (which also attained historical minima) are taken into account This underlines the importance of the ECBrsquos measures that imply very easy financing conditions in the foreseeable future
Last but not least the uncertainty channel (Graph II10) seems to improve the conditional forecast over the baseline in the same spirit as the bank balance sheet channel For example there is a good fit of investment indicating a strong correlation of investment with confidence and financial stress measures Equally the rebound in private consumption seems to be well captured by the uncertainty channel indicating that the recent decrease in financial markets stress has also been an important driver for consumption However in general the uncertainty channel is likely to be implicitly included in the bank balance sheet
(65) GDP is a denominator of the credit indicators in bank balance
sheet channel
Graph II8 Conditional forecasts based on real GDP and inflation (1) (2000Q1-2015Q4 y-o-y growth)
Business and consumer confidence and short-term interest rates
(1) Shades of orange distribution of the conditional forecasts in the BVAR in levels excluding the lower and higher 5 quantiles Green line actual values The variables are all reported in terms of annual percentage changes except for the unemployment rate and the long-term interest rate which are in levels Conditioning assumptions real GDP and HICP Source DG ECFIN MATLAB codes replication files of the methodological paper (Banbura et al 2015)
Economic sentiment
2005 2010 2015-15
-10
-5
0
5
10Short-term i r
2005 2010 2015-4
-2
0
2
4
6
8Shadow short-term interest rate
2005 2010 2015-6
-4
-2
0
2
4
6
II Financial channels and economic activity in the euro area
Volume 15 No 2 | 29
channel For example in periods of high uncertainty bank funding costs increase (bank balance sheet channel) and firms with weaker balance sheets cannot obtain credit for new loans (borrower balance sheet channel)
Overall the findings above suggest that while there is clear evidence of the transmission of monetary policy measures on financial variables and from financial variables to consumer lending rates the evidence on the effects on real activity is more complex with different channels playing an important role at different stages of the crisis The interest rate channel has helped the modest recovery since 2014 by supporting both public and private consumption growth and by partially compensating the balance sheet channel for both borrowers and banks The results in Graph II9 (lower panel) can be interpreted as showing that in the absence of massive monetary easing given the high level of debt in the economy and the wealth effects associated with house and asset prices decreases both private and public consumption growth could have been much more subdued than what it is currently observed
Graph II10 (both panels) illustrate the importance of the bank balance sheet and the uncertainty channel for capturing investment dynamics Weak investment growth is well captured both by credit developments as captured through the bank balance sheet channel and confidence effects through the uncertainty channel Real economic activity as measured by GDP growth while playing an important role does not seem to fully explain the subdued growth in investment since 2014 (Graph II7)
II5 Conclusions
The section discusses the nexus between financial and macroeconomic developments drawing some
lessons from the literature and providing some stylised facts on the main transmission channels through which financial developments have affected real economic activity since the crisis
While there is clear evidence of the transmission of monetary policy measures on financial variables and from financial variables to consumer lending rates the evidence on the effects on real activity is more complex with different channels playing an important role at different stages of the crisis
The state of private balance sheets seems to have significantly contributed to the poor performance of consumption during the euro area debt crisis and high debt levels still weigh on growth However given the still high level of debt the current mild recovery should be seen as a rather positive outcome The analysis suggests that easy monetary conditions seem to represent an important driver of the current recovery Another driver seems to be the balance sheets of banks which have gradually improved and allow better transmission of easy monetary conditions to the lending rates
Given the still high levels of debt in the economy and the wealth and confidence effects associated with house and asset prices corrections both private and public consumption growth could have been much more subdued than what it is currently observed were it not for the exceptional easing of monetary conditions
Unfortunately the recovery is still not strong enough to facilitate the deleveraging process The stock of debt and the ongoing deleveraging combined with adverse confidence effects still represent major impediments for a stronger recovery in investment Consequently there is a need to implement policy measures that allow dealing effectively with the debt overhang notably an effective framework for non-performing loans resolution
30 | Quarterly Report on the Euro Area
Graph II9 Conditional forecasts based on variables capturing the interest rate channel and borrower balance sheet channel (1)
(2000Q1-2015Q4 y-o-y growth)
Interest rate channel
Borrower balance sheet channel
(1) Shades of orange distribution of the conditional forecasts in the BVAR in levels excluding the lower and higher 5 quantiles Green line actual values The variables are all reported in terms of annual percentage changes except for the unemployment rate and the long-term interest rate which are in levels Conditioning assumptions interest rate channel ESI HICP the short-term interest rate the long-term interest rate the shadow interest rate and the ECB excess liquidity measure Conditioning assumptions borrower balance sheet channel ESI HICP house prices stock prices and outstanding loans to households and firms Due to the high contemporaneous correlation between real GDP growth and the ESI indicator the ESI indicator contains the same forecasting information as real GDP ESI indicator is used in the conditioning set instead of real GDP variable in order to also illustrate conditional forecasts for real GDP Source DG ECFIN MATLAB codes replication files of the methodological paper (Banbura et al2015)
Real GDP
2005 2010 2015-10
-5
0
5Government consumption
2005 2010 2015-2
0
2
4Real consumption
2005 2010 2015-5
0
5
Real investment
2005 2010 2015-20
-10
0
10Unemployment rate
2005 2010 20150
10
20PPI ex const
2005 2010 2015-50
0
50
House prices
2005 2010 2015-10
0
10
20Loans to firms
2005 2010 2015-10
0
10
20Loans to households
2005 2010 2015-10
0
10
20
Real GDP
2005 2010 2015-10
-5
0
5Government consumption
2005 2010 2015-2
0
2
4Real consumption
2005 2010 2015-5
0
5
Real investment
2005 2010 2015-20
-10
0
10Unemployment rate
2005 2010 20150
5
10
15PPI ex const
2005 2010 2015-50
0
50
Shadow short-term interest rate
2005 2010 2015-5
0
5
10Short-term i r
2005 2010 2015-5
0
5
10Long-term i r
2005 2010 20150
5
10
II Financial channels and economic activity in the euro area
Volume 15 No 2 | 31
Graph II10 Conditional forecasts based on variables capturing the bank balance sheet channel and uncertainty channel (1)
(2000Q1-2015Q4 y-o-y growth) Bank balance sheet channel
Uncertainty channel
(1) Shades of orange distribution of the conditional forecasts in the BVAR in levels excluding the lower and higher 5 quantiles Solid black line point estimate of the conditional forecasts in the BVAR in differences which is computed as the median of the distribution of the conditional forecasts in this model Green line with crosses actual values The variables are all reported in terms of annual percentage changes except for the unemployment rate and the long-term interest rate which are in levels Conditioning assumptions for the bank balance sheet channel ESI HICP the credit impulse the private credit volumes (debt-to-GDP ratio) and bank lending rates for households and firms (CFCI) Conditioning assumptions uncertainty channel ESI HICP the policy uncertainty indicator the CISS and the VIX Due to the high contemporaneous correlation between real GDP growth and the ESI indicator the ESI indicator contains the same forecasting information as real GDP ESI indicator is used in the conditioning set instead of real GDP variable in order to also illustrate conditional forecasts for real GDP Source DG ECFIN MATLAB codes replication files of the methodological paper (Banbura et al 2015)
Real GDP
2005 2010 2015-10
-5
0
5Government consumption
2005 2010 2015-2
0
2
4Real consumption
2005 2010 2015-2
0
2
4
Real investment
2005 2010 2015-20
-10
0
10Unemployment rate
2005 2010 20150
5
10
15PPI ex const
2005 2010 2015-50
0
50
Loans to firms
2005 2010 2015-10
0
10
20Loans to households
2005 2010 2015-10
0
10
20Long-term i r
2005 2010 20150
2
4
6
Real GDP
2005 2010 2015-10
0
10Government consumption
2005 2010 2015-2
0
2
4Real consumption
2005 2010 2015-5
0
5
Real investment
2005 2010 2015-20
0
20Unemployment rate
2005 2010 20150
5
10
15PPI ex const
2005 2010 2015-50
0
50
Loans to firms
2005 2010 2015-10
0
10
20Loans to households
2005 2010 2015-10
0
10
20Long-term i r
2005 2010 20150
5
10
III Confidence spillovers in the euro area
Volume 15 No 2 | 33
III1 Introduction
During the recent crisis euro area private consumption fell substantially This was accompanied by a sharp decline in consumer confidence which many observers have identified as a key factor contributing to the persistence of the slowdown In fact the onset of the crisis coincided with an abrupt unwinding of imbalances that is of economic trends that turned out to be unsustainable and which led to a significant adjustment of expectations Both consumption growth rates and confidence levels have been improving since the start of 2013
There is some (mixed) evidence to suggest that fluctuations in consumer confidence affect the dynamics of private consumption (67) On the basis of this assumption and taking into account the unprecedented extent of the most recent crisis it is important to determine whether and to what extent confidence shocks spill over between countries This is particularly relevant in relation to the euro area where close trade and financial links and common institutional features can lead to the rapid propagation of shocks In addition confidence spillovers can be an important aspect to consider when discussing how to improve macroeconomic policymaking in a common currency area
This section reviews the evidence on the link between consumer confidence and private consumption and on cross-border confidence spillovers and presents some analysis of the transmission of confidence shocks across the euro area It is a follow-up to analysis discussed in
(66) This section was prepared by Francesca DrsquoAuria (67) See for a discussion Ludvigson SC 2004 lsquoConsumer
confidence and consumer spendingrsquo Journal of Economic Perspectives Vol 18(2) pp 29-50
previous issues of the Quarterly Report on the Euro Area (QREA) (68)
III2 Recent trends in consumer confidence and private consumption in the euro area
Graph III1 shows the evolution over the period 1995Q2-2016Q1 of euro area real private consumption and consumer confidence The latter is measured by the Consumer Confidence Indicator constructed by the European Commission as part of the Joint Harmonised EU Programme of Business and Consumer Surveys (BCS) (69)
There is close co-movement between the two variables Both real consumption growth and consumer confidence showed the greatest deterioration in the first quarter of 2009 and during the sovereign debt crisis They have been on a recovery path since early 2013 with consumer confidence reaching levels above the euro area long-term average since the first quarter of 2014
The relationship between consumer confidence and private consumption is much debated in the literature From a theoretical perspective there are two main competing theories One view is that confidence indicators can help predict the dynamics of consumption as they convey information about future economic conditions Another theory is that the link between the two variables can be interpreted in terms of lsquoanimal
(68) DrsquoAuria F lsquoCross-border spillovers in confidencersquo Quarterly
Report on the Euro Area (2013) Vol 12(3) pp26-30 DrsquoAuria F S Linden D Monteiro J in lsquot Veld and S Zeugner
lsquoCross-border spillovers in the euro arearsquo Quarterly Report on the Euro Area (2014) Vol 13(4) pp7-22
(69) See European Commission (2016) lsquoA user guide to the Joint Harmonised EU Programme of Business and Consumer Surveysrsquo for details on the construction of the indicators
In recent years there has been close co-movement between consumer confidence and private consumption in the euro area During the crisis in particular consumer confidence was identified by many commentators as a driving factor in its persistence as expectations about a sustainable path of economic growth were adjusted significantly In view of the unprecedented extent of the crisis the question of whether and to what extent changes in consumer confidence in one country could spill over to other countries was also raised This section discusses the relationship between consumer confidence and consumption and reviews the evidence of consumer confidence spillovers between euro area countries We conclude that there is some evidence to suggest that confidence shocks are transmitted between countries This conclusion is corroborated by results from the estimation of a Global Vector Autoregressive (GVAR) model for a number of euro area countries (66)
34 | Quarterly Report on the Euro Area
spiritsrsquo as confidence indicators capture fluctuations in beliefs which in turn affect consumption (70) In both cases the essence of confidence indicators is to gauge expectations ndash irrespective of how they are formed ndash about the future course of the economy which then have a knock-on effect on current consumer behaviour
Graph III1 Confidence and private consumption euro area
(1995Q2-2016Q1 q-o-q change)
Source Eurostat and DG ECFIN calculations based on EU Business and Consumer Surveys
Several studies test empirically the link between consumer confidence and private consumption A number of them find evidence in support of a strong correlation between consumer confidence and consumption (71)
However as confidence and consumption are to a large extent determined by the same factors other studies try to assess whether confidence indicators carry information beyond economic fundamentals The evidence on this issue is mixed although several studies conclude that confidence indicators play a significant role There is some evidence to suggest that while part of the information conveyed by confidence indicators is also captured by other variables (eg past consumption income and interest rates) confidence measures have an additional predictive power for the future path of
(70) See Barsky and Sims (2012) for a discussion of the different
theoretical approaches to the role of confidence Barsky R B and ER Sims (2012) lsquoInformation animal spirits and the meaning of innovations in consumer confidencersquo American Economic Review 102(4) pp 1343-1377
(71) See for example Carroll C J Fuhrer and D Wilcox (1994) lsquoDoes consumer sentiment forecast household spending If so whyrsquo American Economic Review Vol 84 pp 1397-1408
consumer spending (72) Moreover some papers find that confidence indicators have a stronger predictive power during periods of large economic fluctuations (73)
III3 The existing evidence on confidence spillovers
On the assumption that a causal relationship between consumer confidence and private consumption exists it is important to determine whether and to what extent changes in consumer confidence in one country affect confidence (and thus consumption) in others
There is some evidence to support the existence of confidence spillovers This pertains both to confidence shocks originating in the US and being transmitted to the euro area and shocks which occur in one euro area country and spill over to other euro area countries
Several studies provide evidence of a transmission channel of confidence shock to foreign confidence In particular evidence for G7 countries and Spain would suggest that variations in confidence generally spill over from large countries to smaller ones (74) Some studies support the idea that confidence shocks originating in US are transmitted to the euro area but not the other way round ie shocks to euro area confidence do not affect confidence in the US (75) Other studies show a transmission channel for confidence shocks
(72) Some authors eg Ludvigson (2004) Souleles (2004) and Lahiri
Monokroussos and Zhao (2016) conclude that including confidence indicators can reduce forecasting errors when predicting the dynamics of consumption while others reach the opposite conclusion (eg Claveria Pons and Ramos 2007)
Ludvigson S (2004) lsquoConsumer confidence and consumer spendingrsquo Journal of Economic Perspectives Vol 18(2) pp 29-50
Souleles NS (2004) lsquoExpectations heterogenous forecast errors and consumption Micro evidence from the Michigan Consumer Sentiment Surveysrsquo Journal of Money Credit and Banking Vol 36 pp 39-72
Lahiri K G Monokroussos and Y Zhao (2016) lsquoForecasting consumption the role of consumer confidence in real time with many predictorsrsquo Journal of Applied Econometrics forthcoming
Claveria O E Pons and R Ramos (2007) lsquoBusiness and consumer expectations and macroeconomic forecastsrsquo International Journal of Forecasting Vol 23 pp47-69
(73) For example Howrey E (2001) lsquoThe predictive power of the index of consumer sentimentrsquo Brookings Papers on Economic Activity Vol 1 pp 175-216
(74) Fei S (2011) lsquoThe confidence channel for the transmission of shocksrsquo Banque de France Working Paper No 314
(75) Deacutees S and P Soares-Brinca (2013) lsquoConsumer confidence as a predictor of consumption spending Evidence for the United States and the Euro Arearsquo International Economics Vol 134 pp 1-14
-40
-30
-20
-10
0
10
1995Q2 1998Q2 2001Q2 2004Q2 2007Q2 2010Q2 2013Q2-08
-04
00
04
08
12
16Consumption (rhs)Consumer Confidence Indicator
III Confidence spillovers in the euro area
Volume 15 No 2 | 35
(Continued on the next page)
Box III1 A GVAR model to assess confidence spillovers
The Global Vector Autoregressive (GVAR) methodology developed by Pesaran Schuermann and Weiner (2004) (1) combines individual vector error-correcting models where domestic variables are linked to country-specific foreign variables The latter combine the domestic variables using international trade financial or other relevant weights for each country This approach allows the analysis of interdependence across different economies providing a solution to the lsquocurse of dimensionalityrsquo (eg the high number of parameters as the dimension of the model increases) in global modelling
For a set of countries i=0 1 2 hellip N the individual VARX(pi qi) models take the following form
itqtiiqtiiitiiptiiptiiit uxxxxxxii
+Λ++Λ+Λ+Φ++Φ= minusminusminusminus
11
011
where xit is a vector of ki x 1 vector of domestic variables xit a ki x 1 vector of foreign variables and
00
===
iijt
N
jijit xx ωω
where ωij j=01hellipN is a set of weights such that 10
==
N
jijω The foreign variables xit are therefore a
weighted average of domestic variables for all countries included in the model The weights can be different in nature but are typically constructed using trade or capital flows data The GVAR model is then solved for the lsquoworldrsquo (ie all countries included in the model) as a whole considering all variables as endogenous to the system
The GVAR model has been applied to a variety of issues These include forecasting (eg Pesaran Schuermann and Smith 2009) credit risk (eg Pesaran Schuermann and Treutler 2007) oil price shocks (eg Galesi and Lombardi 2009) global imbalances (eg Bussiegravere Chudik and Sestieri 2012) business cycle synchronisation (eg Dreger and Zhang 2013) the impact of EU membership (eg Pesaran Smith and Smith 2007) the international effects of fiscal policy shocks (eg Favero Giavazzi and Perego 2011) (2) Chudik and Pesaran (2014) provide a detailed review of these and other recent applications (3)
In this section this approach is used to analyse the transmission of country-specific and global consumer confidence shocks in a model which includes eight euro area countries (Austria Belgium Finland France Germany Italy the Netherlands and Spain) using quarterly data over the period 1996Q2-2013Q1 The model is solved using the GVAR Toolbox developed by Smith and Galesi (2014) (4)
(1) Pesaran MH Schuermann T and Weiner S M (2004) lsquoModelling regional interdependencies using a global error-correcting
modelrsquo Journal of Business and Economic Statistics Vol 22 pp 129-162 (2) Pesaran M H Schuermann T and Smith LV (2009) lsquoForecasting economic and financial variables with global VARsrsquo
International Journal of Forecasting Vol 25(4) pp 642-675 Pesaran MH Schuermann T and Treutler B-J (2007) lsquoGlobal business cycles and credit riskrsquo in The Risks of Financial Institutions NBER Chapters pp 419-474 Bussiegravere M Chudik A and Sestieri G (2012) lsquoModelling global trade flows results from a GVAR modelrsquo Globalization and Monetary Policy Institute Working Paper 119 Federal Reserve Bank of Dallas Dreger C and Zhang Y (2013) lsquoDoes the economic integration of China affect growth and inflation in industrial countriesrsquo FIW Working Paper series 116 FIW Pesaran M H Smith L V and Smith R P (2007) lsquoWhat if the UK or Sweden had joined the euro in 1999 An empirical evaluation using a Global VARrsquo International Journal of Finance and Economics Vol 12(1) pp 55-87 Favero C Giavazzi F and Perego F (2011) lsquoCountry heterogeneity and the international evidence on the effects of fiscal policyrsquo IMF Economic Review 59(4) 652-682
(3) Chudik A and Pesaran MH (2014) lsquoTheory and Practice of GVAR Modelingrsquo Federal Reserve Bank of Dallas Globalization and Monetary Policy Institute Working Paper No 180
(4) Smith LV and Galesi A (2014) GVAR Toolbox 20 available at httpssitesgooglecomsitegvarmodellinggvar-toolbox
36 | Quarterly Report on the Euro Area
between the US the euro area as a whole and four EU countries taken individually (76)
In addition the role of consumer confidence spillovers in the euro area was assessed in a previous issue of the QREA (77) Consumption and confidence regressions were carried out for a panel of euro area countries over the period 1999-2012 The findings support the existence of confidence spillovers between euro area countries
III4 Confidence spillovers across the euro area
Table III1 shows simple correlations between the confidence indicators of eight euro area countries over the period 1995Q4-2016Q1 (78)The strength of the link between consumer confidence indicators across Member States is variable and in most cases is larger between neighbouring countries and between countries sharing similar macroeconomic environments (79)
Table III1 Consumer Confidence Indicator mdash Correlation Matrix
(1995Q4-2016Q1)
(1) Not statistically significant at conventional levels Source DG ECFIN calculations based on EU Business and Consumer Surveys
(76) Deacutees S and J Guntner (2014) lsquoThe international dimension of
confidence shockrsquo ECB Working Paper No 1669 (77) Op cit DrsquoAuria F (2013) (78) The very low and non-statistically significant correlation of the
Italian confidence indicator with the confidence indicators of a number of other euro area countries is somewhat puzzling and there is a need for further investigation into the reasons behind it
(79) The strong correlation between confidence indicators in countries sharing similar economic conditions can be indicative of larger confidence spillovers between them but can also be a reflection of the strong correlation between their economic fundamentals
The strength of the correlation also varies considerably over time Table III2 displays correlations between consumer confidence indicators in the same euro area countries over the period 2008Q1-2012Q4 During the crisis period the link between consumer confidence indicators is significantly tighter
Table III2 Consumer Confidence Indicator mdash Correlation Matrix
(2008Q1-2012Q4)
(1) Not statistically significant at conventional levels Source DG ECFIN calculations based on EU Business and Consumer Surveys
The presence of a correlation between confidence indicators may point to the existence of confidence spillover effects between countries but also be indicative of strong business cycle synchronisation To shed light on the nature of these correlations this section discusses confidence spillovers in the euro area on the basis of the findings from the estimation of a Global Vector Autoregressive (GVAR) model which includes data for eight euro area countries over the period 1996Q2-2013Q1 Box III1 describes the model in more detail
The model includes observations on consumption GDP the unemployment rate a short-term interest rate and consumer confidence The latter is measured by the BCS Consumer Confidence Indicator which is an arithmetic average of the balances of the answers to questions on the financial situation of households the general economic situation unemployment expectations and savings over the next 12 months It is therefore taken as a proxy for consumersrsquo expectations about their future economic situation
The results seem to support the existence of consumer confidence spillovers across the euro area As an illustration Graph III2 reports impulse
AT BE FI FR IT DE NL ES
AT 100 069 069 074 013(1) 054 043 022BE 069 100 067 088 055 057 068 066FI 069 067 100 068 039 028 075 055FR 074 088 068 100 046 055 066 060IT 013(1) 055 039 046 100 004(1) 063 081DE 054 057 028 055 004(1) 100 033 023NL 043 068 075 066 063 033 100 073ES 022 066 055 060 081 023 073 100
AT BE FI FR IT DE NL ES
AT 100 093 090 088 036(1) 079 086 063BE 093 100 081 080 034(1) 080 081 071FI 090 081 100 083 058 052 081 066FR 088 080 083 100 030(1) 066 074 061IT 036(1) 034(1) 058 030(1) 100 -016(1) 065 038DE 079 080 052 066 -016(1) 100 050 048NL 086 081 081 074 065 05 100 050ES 063 071 066 061 038 048 050 100
Box (continued)
by the European Commission Consumption and GDP enter the model in log differences while the other variables are in levels Some of the results are discussed in the main text
III Confidence spillovers in the euro area
Volume 15 No 2 | 37
response functions of consumer confidence in the euro area countries included in the GVAR model to a positive shock to consumer confidence in Germany over 24 quarters (80)
The largest effect appears to be in smaller neighbouring countries (Austria Belgium and the Netherlands) The response of consumer confidence is also relatively large in Finland France and Spain On the other hand spillovers to consumer confidence in Italy are very small and become negative after six quarters This is not a surprise given the statistically insignificant correlation between German and Italian consumer confidence emerging from the data reported in Table III1 The peak response occurs in the second or third quarter
Similar results although of a smaller magnitude were obtained for the other euro area countries included in the model Confidence spillovers appear to be larger across countries with stronger geographical and trade links Overall the evidence from the estimation of the model supports the existence of a transmission channel for consumer confidence shocks across the euro area However the effects of confidence shocks on foreign consumption are in most cases not statistically significant suggesting that the transmission channel is to foreign confidence rather than
(80) A caveat must be made about the difficulty of identifying truly
exogenous confidence shocks owing to the fact that confidence indicators are largely driven by the same factors which determine consumption
directly to foreign economic activity (81)
These results suggest that confidence shocks play a role in the international business cycle and that there are close interlinkages between confidence indicators across euro area countries This evidence supports the need for coordinated policy action able to boost confidence across euro area countries
III5 Conclusions
In recent years the dynamics of euro area consumer confidence and real private consumption have been very closely related Moreover consumer confidence indicators across the euro area appear to be strongly correlated The strength of the correlation was considerably greater during the crisis period
The evidence of a link between real consumption and consumer confidence is mixed but several studies are supportive of consumer confidence playing a role in determining consumption In addition there is evidence to suggest that shocks to consumer confidence in euro area countries affect confidence in other euro area Member States This is also borne out by results obtained from the estimation of a Global Vector Autoregressive (GVAR) model for eight euro area countries
(81) Similar conclusions are reached by op cit Deacutees and Soares-Brinca
(2013) and Deacutees and Guntner (2014)
38 | Quarterly Report on the Euro Area
Graph III2 Impulse response functions of foreign confidence to a one standard error confidence shock in Germany
Source DG ECFIN
000
005
010
015
020
025
030
035
1 2 3 4 5 6 7 8 9 10 11 12 13 14 15 16 17 18 19 20 21 22 23 24
AT
000
005
010
015
020
025
030
035
040
1 2 3 4 5 6 7 8 9 10 11 12 13 14 15 16 17 18 19 20 21 22 23 24
BE
000
005
010
015
020
025
030
1 2 3 4 5 6 7 8 9 10 11 12 13 14 15 16 17 18 19 20 21 22 23 24
FI
000
005
010
015
020
025
030
1 2 3 4 5 6 7 8 9 10 11 12 13 14 15 16 17 18 19 20 21 22 23 24
FR
-002
-001
000
001
002
003
004
005
006
007
1 2 3 4 5 6 7 8 9 10 11 12 13 14 15 16 17 18 19 20 21 22 23 24
IT
000
005
010
015
020
025
030
035
040
1 2 3 4 5 6 7 8 9 10 11 12 13 14 15 16 17 18 19 20 21 22 23 24
NL
000
005
010
015
020
025
030
035
1 2 3 4 5 6 7 8 9 10 11 12 13 14 15 16 17 18 19 20 21 22 23 24
ES
40 | Quarterly Report on the Euro Area
Editors Jose Eduardo Leandro and Martin Larch
Coordination Plamen Nikolov
Statistical and layout assistance Christos Zavos
Comments on the report would be gratefully received and should be sent to
Jose Eduardo Leandro Director ndash Policy strategy coordination and communication Directorate-General for Economic and Financial Affairs Office CHAR 1566
B-1049 Brussels
Email joseleandroeceuropaeu
or
Martin Larch Head of Unit ndash EMU deepening and macroeconomy of the euro area Directorate-General for Economic and Financial Affairs Office CHAR 1556
B-1049 Brussels
Email martinlarcheceuropaeu
EUROPEAN ECONOMY INSTITUTIONAL SERIES
European Economy Institutional series can be accessed and downloaded free of charge from the following address httpeceuropaeueconomy_financepublicationseeipindex_enhtm Titles published before July 2015 can be accessed and downloaded free of charge from bull httpeceuropaeueconomy_financepublicationseuropean_economyindex_enhtm
(the main reports eg Economic Forecasts) bull httpeceuropaeueconomy_financepublicationsoccasional_paperindex_enhtm
(the Occasional Papers) bull httpeceuropaeueconomy_financepublicationsqr_euro_areaindex_enhtm
(the Quarterly Reports on the Euro Area)
Alternatively hard copies may be ordered via the ldquoPrint-on-demandrdquo service offered by the EU Bookshop httpbookshopeuropaeu
HOW TO OBTAIN EU PUBLICATIONS Free publications bull one copy
via EU Bookshop (httpbookshopeuropaeu) bull more than one copy or postersmaps
- from the European Unionrsquos representations (httpeceuropaeurepresent_enhtm) - from the delegations in non-EU countries (httpeeaseuropaeudelegationsindex_enhtm) - by contacting the Europe Direct service (httpeuropaeueuropedirectindex_enhtm) or calling 00 800 6 7 8 9 10 11 (freephone number from anywhere in the EU) () () The information given is free as are most calls (though some operators phone boxes or hotels may charge you)
Priced publications bull via EU Bookshop (httpbookshopeuropaeu)
ISBN 978-92-79-54335-7
KC-BC-16-030-EN-N
- NEW_IP_index_enpdf
-
- EUROPEAN EconomY institutional SERIES
-
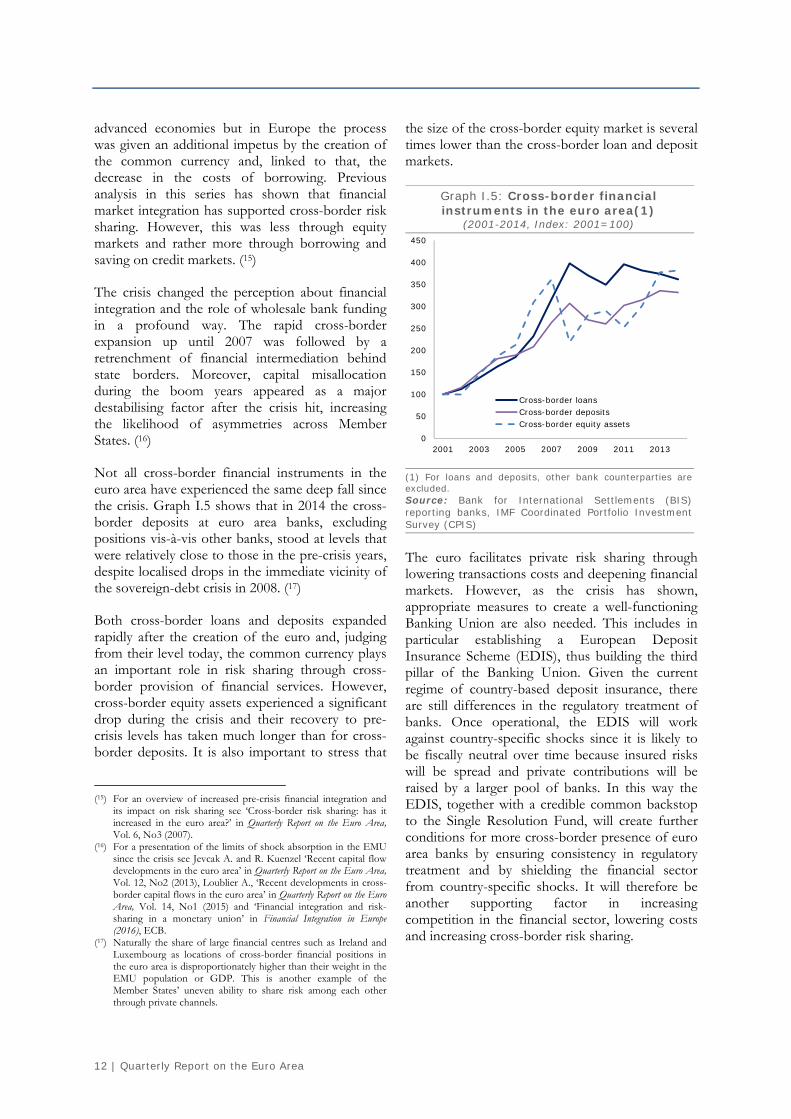
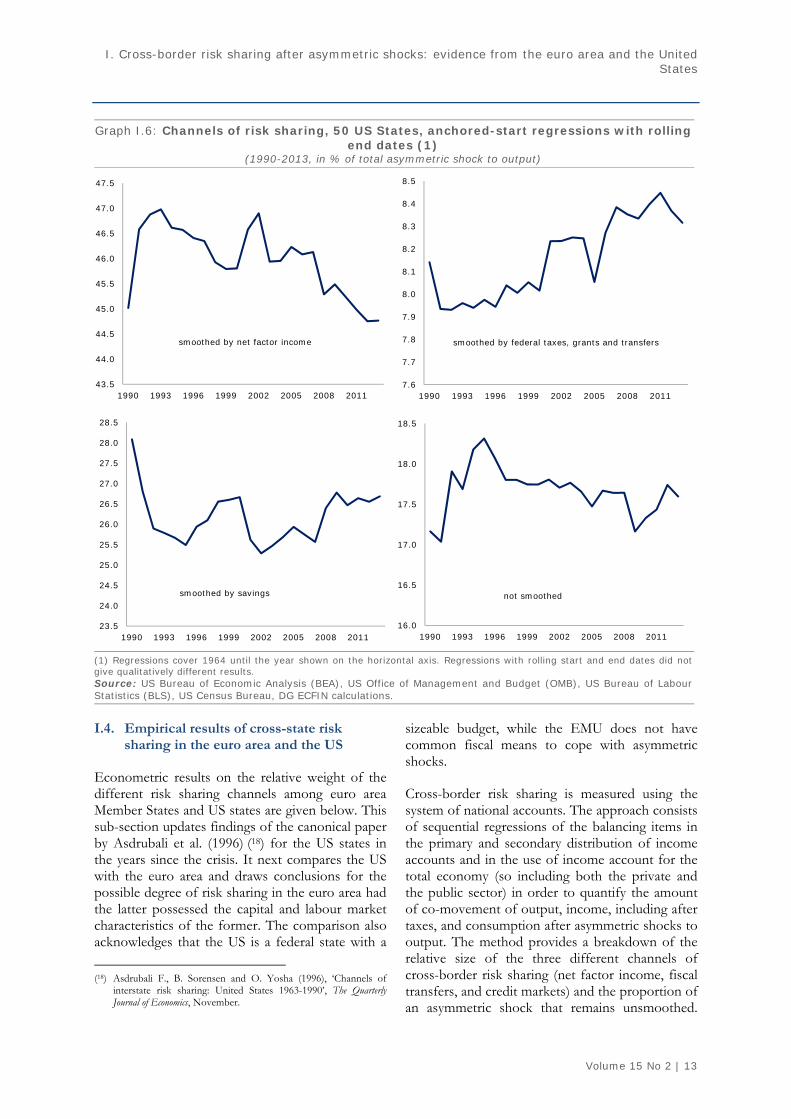
I Cross-border risk sharing after asymmetric shocks evidence from the euro area and the United States
Volume 15 No 2 | 15
political and institutional setups for sharing risks in the US and the euro area as well as the relatively big role of capital and labour markets for risk sharing in the US
Graph I6 shows the estimates of the amount of risk sharing through the different channels between the 50 US states following an asymmetric shock to output The lines report the evolution of the regression estimates depending on the end date of the time series starting with an end date in 1990 The goal is to evaluate how the different channels evolved since 1990 Table I1 compares the three euro area samples with the US
Cross-state risk sharing through net factor income remains the largest contributor to consumption smoothing following an asymmetric shock in the US This channel includes risk sharing through cross-state property income such as retained earnings and income streams from cross-state ownership of shares as well as smoothing through labour earnings by commuters across state borders It is natural that these income streams are hampered during recessions Graph II4 shows two steep drops in its relative weight which broadly correspond to the recessions in 2001 and 2008-9 (21)
The estimates in Table I1 show that there is a big difference between the role of cross-border net factor income among the euro area Member States and the US states This comes as a result of the higher degree of labour mobility and deeper and more integrated capital markets in the US Higher risk sharing through this channel is to be expected given the high annual interstate mobility and the high number of commuter workers across state border in the US (22) Better capital market development in the US is also well documented see Valiante (2016) (23) for evidence that Europersquos capital markets are poorly functioning and underdeveloped compared to the US
The relative share of fiscal redistribution across state borders in the US is lower than the shares of the private channels For the full time series
(21) Even though visually pronounced these drops are small in
absolute terms Note the scale of the vertical axes on Graph II4 again supporting the conclusion that the choice of a time period has a minor impact on the absolute value of the risk sharing coefficients while keeping their relative proportion constant
(22) See Bonin et al (2008) op cit (23) Valiante D (2016) lsquoEuropersquos untapped capital market rethinking
integration after the great financial crisisrsquo CEPS Paperback
between 1964 and 2013 the relative weight of fiscal support in risk sharing is around 85 Risk sharing through this channel has been at its highest level since the start of the crisis as the federal government provided support to struggling states
The role of cross-border public risk sharing in the euro area is smaller than in the US although the difference is less striking than for the cross-border private channels The largest role for the public channel comes up when the sample of euro area countries includes only those that benefited from official support during the crisis years This should come as no surprise given that the euro area does not have a common fiscal capacity to absorb shocks
The importance of credit markets for cross-border risk sharing is more similar in the euro area and the US than the other channels This includes borrowing by both the private and the public sector The role of public sector borrowing in risk sharing is likely smaller than the one of the private sector while stabilisation through purely domestic means is not considered here (24) The role of euro area credit markets in smoothing an asymmetric output shock is more similar to the one in the US in the pre-2004 euro area sample than in the other two euro area samples This reflects a very high degree of financial deepening in the old Member States compared to those that joined recently While encouraging at face value this result also needs to take into account that pre-crisis cross-border financial flows in some of the old Member States turned out to be unsustainable as a result of insufficient risk management and supervision
The overall proportion of an asymmetric shock that is not smoothed between the 50 US states is around 18 compared to more than 60 among the euro area Member States Given that the US is a federal country with a long history of fiscal redistribution and that it has well-developed capital markets with a large presence across state borders it is to be expected that the euro area could achieve a higher degree of cross-border risk sharing once
(24) Some authors have separated this channel into saving and
borrowing on the credit markets by private entities (households and non-financial corporations) and public entities (national and local governments) See for example Furceri and Zdzienicka (2013) they find that the role of public access to credit markets for cross-border risk sharing in the euro area is several times lower than the role of private savingborrowing That is to be expected given the provisions of the Stability and Growth Pact and the relative sizes of the private and public sectors
16 | Quarterly Report on the Euro Area
changes to its institutional setup towards more integration come into being (25) However shock absorption through fiscal redistribution in a fully-fledged fiscal union such as the US is not more than around 85 of the asymmetric shock (as measured by the rolling end date regressions) even though it has increased since the crisis
Therefore a much bigger part of cross-border risk sharing in the EMU could potentially come through private channels such as integrated capital markets once the Capital Markets Union is in place
I5 Conclusion
The econometric results presented in this section point to the great potential for improvement in smoothing asymmetric shocks in the euro area When comparing the amount of an asymmetric shock that remains unsmoothed by the private and public channels of cross-border risk sharing in the euro area and the US the importance of the recent initiatives to build a Capital Markets Union stand out The significance of factor income flows which include labour compensation and capital income generated across state borders in the US could serve as a model for a euro area where capital markets play an important role in cushioning asymmetric shocks across borders Also the creation of the Single Supervisory Mechanism and other innovations in the regulatory environment in
(25) The level of integration will probably not be of the same
magnitude since it is unlikely that the union between euro area member states will soon be politically and institutionally the same as the one between the 50 US states
the euro area are likely to make risk sharing through credit markets more sustainable going forward
Completion of the European Banking Union by establishing a European Deposit Insurance Scheme (EDIS) will also facilitate risk sharing among Member States The EDIS is expected to increase the cross-border presence of euro area banks by ensuring consistent regulatory treatment regardless of country of operation and will offer protection against country-specific shocks Completing the Banking Union will create conditions for more financial integration which is expected to increase competition among banks and thus lower intermediation costs and further increase cross-border risk sharing
The importance of the public channel of cross-border risk sharing in the euro area on the other hand should be seen in contrast with its role in the US a fully-fledged fiscal union where fiscal redistribution among states has an important role Even though the relative significance of this channel in the US has increased with the crisis taxes grants and fiscal transfers in the 50 states contribute relatively less to smoothing asymmetric shocks than the private channels Therefore policy efforts to achieve a higher degree of private cross-border risk sharing in the euro area especially through capital markets and equity holdings should remain the priority option
I Cross-border risk sharing after asymmetric shocks evidence from the euro area and the United States
Volume 15 No 2 | 17
(Continued on the next page)
Box I1 Empirical methods to estimate relative weights of cross-border risk sharing channels
This box presents the econometric methodology used to estimate the relative importance of the different cross-border risk sharing channels after an asymmetric shock in the euro area and the US
It is important to look at the balancing items in the primary and secondary distribution of income accounts and the use of income account in the European System of National Accounts 2010 (ESA 2010) in order to review the necessary variables for the estimation process Data for Belgium for 2014 can be used as an illustration to arrive at the required several balancing items (1) One channel of risk sharing is the difference between gross domestic product (GDP) and gross national income (GNI) ndash risk sharing through net international factor income The bigger this difference and the lower its correlation over time with GDP the more risk sharing there is through net international factor income In order to come up with this difference mdash EUR 6038 billion in this example mdash one has to add the net of several items For example there is a difference of EUR 5715 billion between compensation of employees paid by employers in Belgium including to workers who take their earnings abroad where they are domiciled and compensation of employees received by workers in Belgium including by workers who work in other countries but bring their earnings back to Belgium where they are domiciled This is a net positive inflow of income from a Belgian perspective Other items that are treated in the same way are production taxes paid (collected) by firms (governments) and subsidies on production earned (distributed) by firms (governments) Any cross-border net inflow here will be due to fewer of these taxes paid by Belgian firms abroad compared to foreign firms in Belgium and more of these subsidies earned by Belgian firms abroad compared to foreign firms in Belgium Finally property income which includes interest for example on debt securities equity dividends reinvested earnings and some other items is treated in the same way For example a net inflow occurs if Belgian citizens receive more dividends from foreign companies than foreigners from Belgian companies
Another channel of risk sharing is through cross-border fiscal redistribution This makes the difference between GNI and gross disposable income (GDI) Here a net inflow in Belgium will occur if social transfers received by Belgian persons and entities from foreign sources outweigh the transfers received by foreigners in Belgium The same will happen if income and wealth taxes paid by foreigners in Belgium are higher than income and wealth taxes paid by Belgians abroad
Finally the difference between GDI and consumption is gross savings through which consumption can be smoothed Borrowings and savings are channelled through domestic and foreign financial intermediaries
At the state level in the US some of these balancing items are not available Specifically state national income and state disposable income are constructed using the method in the Appendix in Asdrubali et al (1996) (2)
Asdrubali et al (1996) propose a series of regressions of these balancing items to estimate the relative
importance of each of the risk sharing channels Starting from the identity = ∙ ∙ ∙ it is
easy to show that a relationship 1 = + + + exists where the beta terms are the estimates of the regression coefficients in ∆ minus ∆ = + ∙ ∆ + ∆ minus ∆ = + ∙ ∆ + ∆ minus ∆ = + ∙ ∆ + ∆ = + ∙ ∆ + The beta terms are interpreted as the relative weights of cross-border risk sharing due to net factor income fiscal transfers savings and borrowings on credit markets The last beta coefficient shows the amount of an asymmetric shock that remains unsmoothed The panel regressions include time fixed effects μ and error terms u
18 | Quarterly Report on the Euro Area
Box (continued)
There are three sets of panels for the euro area EA19 except Malta Cyprus Luxembourg Lithuania Austria and Greece EA12 except Luxembourg Austria and Greece and a set of euro area core and periphery countries (Germany Spain Ireland Netherlands and Portugal) The choice of euro area countries is partly based on data availability in the European System of Accounts 2010 and partly on the option to have a sample that excludes new Member States to be able to measure legacy effects from the closer integration even before the EMU and to have a sample of countries in the EA12 core and periphery which are likely to experience more asymmetries The US sample includes the 50 US states
The time period chosen for the US is between 1964 and a rolling end date from 1990 until 2013 For the three different sets of euro area countries the time period is between 1999 and 2015 The time periods are chosen based on data availability while for the US it extends the period in Asdrubali et al (1996)
The regressions are estimated with 2-step generalised least squares (GLS) correcting for heteroscedasticity and cross-sectional correlation in the case of the euro area and ordinary least squares (OLS) with panel-corrected standard errors in the case of the US The latter method is better suited for panels with larger cross-sections while the former method is better in the opposite case (3) Both estimations include a common AR1 autocorrelation structure within panels The first differences in the quarterly euro area data are in terms of the same quarter of the preceding year The euro area regressions also include a further breakdown of GNI into one corrected only for cross-border labour compensation and one for the other elements of net factor income
Econometric results are in the table below All estimates marked with are statistically significant at the 99 confidence level Z-statistics are in parentheses
Table 1 Regression results
Source US Bureau of Economic Analysis (BEA) US Office of Management and Budget (OMB) US Bureau of Labour Statistics (BLS) US Census Bureau Eurostat DG ECFIN calculations (1) For more information see Box 2 in lsquoCross-border risk sharing has it increased in the euro arearsquo in QREA Vol 6 No3 (2007) (2) Asdrubali F B Sorensen and O Yosha (1996) lsquoChannels of interstate risk sharing United States 1963-1990rsquo The Quarterly Journal
of Economics November (3) These are standard econometric approaches in estimating cross-border risk sharing For a short discussion on the econometrics of
cross-border risk sharing see Hepp R and J von Hagen (2013) lsquoInterstate risk sharing in Germany 1970mdash2006rsquo Oxford Economic Papers Vol 65 No1 pps 1-24
(1) (2) (3) (4)Risk sharing through 2-step GLS 2-step GLS 2-step GLS PC-OLScross-border factor income 00552 00199 00343 04476
(722) (316) (568) (1198)of which cross-border labour compensation 00024 -00015 -00012
(281) (-414) (-282)cross-border fiscal transfers -00007 00156 00257 00832
(-039) (847) (761) (803)credit markets 01815 02459 01800 02668
(1738) (831) (478) (508)unsmoothed 07574 06171 06312 01760
(3784) (2505) (1838) (505)
Countries
Full panel - 13 countries BE
DE EE ES FI FR IE IT LV NL PT
SK SL
Old member states - 9
countries BE DE ES FI FR IE IT
NL PT
Core vs periphery - 5 countries DE ES IE NL PT
50 US states
Period 2000Q4-2015Q4 2000Q4-2015Q4 2000Q4-2015Q4 1964-2013No of observations 793 549 305 2500
II Financial channels and economic activity in the euro area
Volume 15 No 2 | 19
II1 Introduction
Since the global economic and financial crisis the linkages between macroeconomic and financial developments have been on the frontline of both research and policy making The massive dislocations observed during the crisis have forged a broad consensus that shocks originating in the financial sector can have profound effects on real economic activity and vice versa While the effect of macroeconomic developments on financial conditions is rather straightforward (27) the effect of financial developments on the macroeconomy is more complex and was (until recently) largely omitted in mainstream macroeconomic thinking The interest rate was the only financial variable included in standard macroeconomic models and only to the extent that it was assumed to influence the decisions of economic agents while no genuine role was assigned to the financial sector itself In reality financial intermediation is subject to numerous frictions that can affect macroeconomic developments via diverse transmission channels Given the decisive role of bank credit in financing the euro area economy shocks originating in the banking sector are of crucial importance
This section looks at macro-financial linkages in the euro area to shed light on how financial developments may have contributed to disappointing macroeconomic performance in the
(26) This section was prepared by Narcissa Balta and Bořek Vašiacuteček (27) Jacobson T J Linde and K Roszbach (2005) lsquoExploring
interactions between real activity and the financial stancersquo Journal of Financial Stability Vol 1 No 3 pp 308ndash41
recent past The methodology employed for this purpose is a large-scale Bayesian Vector Autoregression (VAR) that encompasses a wide set of macroeconomic and financial variables (28)
Subsection I2 discusses the importance of the financial system for the real economy and briefly reviews the relevant economic literature Subsection I3 describes the main transmission channels from financial markets to the real economy and defines specific variables that could be used to capture these transmission channels in the euro area Subsection I4 presents the results of the empirical analysis particularly some stylised facts on the co-movement between financial variables and economic activity since the crisis
II2 The financial system and the real economy
Market frictions are normally understood as a wide range of different bottlenecks that do not allow markets to efficiently clear demand and supply Financial frictions are impediments to the smooth functioning of the financial market that do not allow funds to be channelled effectively from creditors to borrowers Therefore they play an important role in the way the financial system affects the real economy Moreover the presence of frictions during periods of financial turmoil undermines the effectiveness of monetary policy
(28) Bańbura M D Giannone and M Lenza (2015) lsquoConditional
forecasts and scenario analysis with vector autoregressions for large cross-sectionsrsquo International Journal of Forecasting Vol 31 Issue 3 pp 739ndash756
This section discusses the nexus between financial and macroeconomic developments in the euro area It draws on key lessons from the literature and provides stylised facts on the main transmission channels through which financial developments have affected real economic activity since the crisis Macro-financial linkages are investigated from an empirical perspective for the euro area as a whole by looking at four key channels i) the interest rate channel ii) the borrower balance sheet channel iii) the bank balance sheet channel and iv) the uncertainty channel
Overall the results suggest that financial variables have significant impact on macroeconomic developments but also that the transmission seems to have changed since the crisis Notably the interest rate channel has helped the modest recovery since 2014 by supporting both private and public consumption The positive boost given to favourable financing conditions in 2015 has been somewhat compensating the adverse effects of the borrower balance sheet channel The bank balance sheet channel and the uncertainty channel play a particularly important role in capturing the weakness in the current rebound in investment (26)
20 | Quarterly Report on the Euro Area
transmission and financial sector stability which via feedback effects can have a detrimental impact on macroeconomic developments For instance hikes in bank funding costs when money markets stop functioning are likely to be transmitted to the lending rates applied to consumers which in turn can have a significant drag on both investment and consumption Also financial frictions increase the likelihood of financial shocks occurring both from the demand and the supply side
Financial shocks are usually deemed to be very persistent and have amplification effects in the sense that even small shocks can produce large and long-lasting effects (29) Graph II1 shows a clear negative correlation between GDP growth and financial distress in the euro area as measured by the Composite Indicator of Systemic Stress (CISS) (30)
Graph II1 Real GDP growth vs Composite indicators of systemic stress
(2000Q1-2016Q1)
Source ECB Eurostat
Since the key role of the financial sector consists in funding economic activity new credit is the main channel of transmission between the financial sector and the macroeconomy Financial shocks occurring on the demand side are usually triggered by an impairment of borrowers balance sheets
(29) Brunnermeier M K T Eisenbach and Y Sannikov (2012)
lsquoMacroeconomics with financial frictions A surveyrsquo National Bureau of Economic Research Working Paper No 18102
(30) The CISS measures contemporaneous stress in the financial system It is an aggregate of five market-specific sub-indices More weight is put when stress prevails in several market segments at the same time thus tracking financial stress of systemic nature
Holloacute D M Kremer and M Duca (2012) lsquoCISS-a composite indicator of systemic stress in the financial systemrsquo European Central Bank Working Paper No (No 1426)
which in turn undermines their creditworthiness and their capacity to invest and consume Financial shocks occurring on the supply side (ie those that originate from within the financial sector) normally manifest themselves through tightening of credit conditions andor credit rationing which again impact real economic activity via the investment behaviour of households and non-financial corporations Graph II2 shows the negative correlation between credit standards for firms and real investment (31)
Graph II2 Investment growth vs credit standards for NFC
(2003Q1-2016Q1)
Source ECB BLS Eurostat
Financial frictions have been fully embedded into macroeconomic models only recently
The neglect of financial sector effects in traditional macroeconomic thinking has its foundation in the famous Modigliani-Miller theorem (32) The theorem argues that the way a firm finances its investment (via debt or via equity) has no effect on its value and thus that their investment decisions are driven primarily by macroeconomic conditions (namely the real interest rate) rather than financial market developments However the validity of the theorem hinges on a set of very restrictive assumptions such as perfect information equal tax treatment for debt and equity etc which are generally not met in practice (33) Financial
(31) Credit standards are measured by the backward looking three
months index from ECB Bank Lending Survey (BLS) (32) Modiglini F and M Miller (1958) lsquoThe cost of capital
corporation finance and the theory of investmentrsquo The American Economic Review Vol 48 No 3 pp 261-297
(33) Morley J (2016) lsquoMacro-finance linkagesrsquo Journal of Economic Surveys forthcoming
-8
-6
-4
-2
0
2
4
6
0
10
20
30
40
50
60
70
80
2000Q1 2003Q1 2006Q1 2009Q1 2012Q1 2015Q1
CISS
GDP y-o-y change(rhs)
-15
-10
-5
0
5
10
-10
-5
0
5
10
15
20
25
30
35
40
2003Q1 2005Q1 2007Q1 2009Q1 2011Q1 2013Q1 2015Q1
Change in creditstandards for NFCInvestment y-o-y change (rhs)
II Financial channels and economic activity in the euro area
Volume 15 No 2 | 21
intermediation typically involves asymmetry of information between borrowers and lenders and potentially costly verification of the borrowers financial situation (34)
The first attempts to include financial frictions in macroeconomic models were based on the insight that the cost of external financing very much depends on the borrowers net worth (35) andor the market value of their collateral (36) In fact changes in asset prices turn out to be a crucial determinant of both the cost of external financing and the value of collateral Moreover a relatively small shock can have a major effect on economic activity through the so-called financial accelerator whereby negative feedback loops between lower assets prices restricted access to credit and lower consumption and investment significantly amplify and prolong the impact on the real economy (37) Real estate which is a typical asset used as collateral by both households and firms establishes a tight link between the housing market and the economy as a whole (38)
While the original theoretical contributions did not explicitly model financial intermediaries (assuming direct lending from investors to borrowers) the inclusion of financial intermediaries (ie the banking sector) implies that financial frictions can appear also on the lendersrsquo side (39) Specifically financial intermediaries can become balance sheet constrained in times of economic and financial stress which affects their funding costs Such shocks to the lendersrsquo side are usually mitigated by central bank intermediation during crisis times (40)
(34) Carlstrom C T and T S Fuerst (1997) lsquoAgency costs net worth
and business fluctuations A computable general equilibrium analysisrsquo The American Economic Review Vol 87 No 5 pp 893-910
(35) Bernanke B and M Gertler (1989) lsquoAgency costs net worth and business fluctuationsrsquo The American Economic Review Vol 79 No 1 pp 14-31
(36) Kiyotaki N and J Moore (1997) lsquoCredit cyclesrsquo Journal of Political Economy Vol 105 Issue 2 pp 211-248
(37) Bernanke B S M Gertler and S Gilchrist (1999) lsquoThe financial accelerator in a quantitative business cycle frameworkrsquo Handbook of Macroeconomics Vol 1 Part C pp 1341-1393
(38) Iacoviello M and S Neri (2010) lsquoHousing market spillovers evidence from an estimated DSGE modelrsquo American Economic Journal Macroeconomics Vol 2 No 2 pp 125-164
(39) Gertler M and N Kiyotaki (2010) lsquoFinancial intermediation and credit policy in business cycle analysisrsquo Handbook of Monetary Economics Vol 3 Issue 3 pp 547-599
(40) Gertler M and P Karadi (2011) lsquoA model of unconventional monetary policyrsquo Journal of Monetary Economics Vol 58 Issue 1 pp 17-34
Despite intensive efforts in recent years the financial sector is still not fully established as a consolidated part of conventional macroeconomic models Structural models augmented by a banking sector and financial markets (41) typically find that financial factors such as bank liquidity constraints are indeed the main drivers of economic fluctuations in both the US and the euro area and that they were the main shock propagator during the global financial crisis (42)
Empirical evidence on macro-financial linkages
There is now a wide consensus that financial cycles are crucial for understanding business cycle fluctuations (43) Numerous empirical studies evaluate the effects of financial shocks on macroeconomic fluctuations Importantly financial factors can both reinforce the transmission of other shocks and be a source of disturbance in their own right
Credit appears to be one of the most studied financial variables in empirical studies due to its established regularities in terms of boom-and-bust behaviour and its link to financial crises and economic downturns (44) Credit spreads play an important role for capital markets-based systems like the US economy For example corporate bond spreads usually increase disproportionately during periods of financial stress (so-called excess bond premiums) which in turn causes economic activity to contract (45) In the euro area where external financing is mostly bank based a crucial role is played by bank lending rates and bank lending volumes Credit supply shocks have been identified
(41) Christiano L J R Motto and M Rostagno (2010) lsquoFinancial
factors in economic fluctuationsrsquo European Central Bank Working Paper No 1192
(42) Gerke et al (2013) and Wieland et al (2015) provide detailed comparison exercise for different macrofinancial models
Gerke R M Jonsson M Kliem M Kolasa P Lafourcade A Locarno K Makarski and P McAdam (2013) lsquoAssessing macro-financial linkages A model comparison exercisersquo Economic Modelling Vol 31 pp 253-264
Wieland V E Afanasyeva M Kuete and J Yoo (2015) lsquoNew methods for macro-financial model comparison and policy analysisrsquo mimeo
(43) Borio C (2012) lsquoThe financial cycle and macroeconomics what have we learntrsquo Bank for International Settlements Working Papers No 395
(44) Balke N S (2000) lsquoCredit and economic activity credit regimes and nonlinear propagation of shocksrsquo Review of Economics and Statistics Vol 82 No 2 344-349
(45) Gilchrist S and E Zakrajšek (2012) lsquoCredit spreads and business cycle fluctuationsrsquo The American Economic Review Vol 102 No 4 pp 1692-1720
22 | Quarterly Report on the Euro Area
as important determinants of the increase in lending rates and the decline in lending volumes during the recent crisis (46) Bank lending represents the main transmission mechanism in the euro area
The evidence available indicates that the impact of financial shocks on the macroeconomy is lsquostate dependentrsquo ie the response of economic activity inflation and credit to financial shocks is stronger during periods of stress This is well documented for both the euro area and the US (47) Moreover during periods of high systemic stress financial shocks tend to have both a larger magnitude and a greater impact on real activity (48) Notably a single indicator of systemic stress such as the CISS for the euro area has been found to explain a significant part of macroeconomic developments especially due to episodes of elevated systemic stress such as the global financial crisis and the euro area debt crisis (49)
While studies on financial and business cycle have been popular for some time there has been much less investigation into macro-financial linkages between countries Existing evidence indicates that such linkages exist but their intensity varies both across time and across countries Specifically it has been documented that the observed heterogeneity is mainly due to country-specific characteristics which lead to international spillovers having a differentiated impact across countries (50) Such heterogeneity seems also to be present within the euro area
(46) Moccero D N M D Pariegraves and L Maurin (2014) lsquoFinancial
Conditions Index and identification of Credit Supply Shocks for the Euro Arearsquo International Finance Vol 17 Issue 3 pp 297-321
(47) Hubrich K and R J Tetlow (2015) lsquoFinancial stress and economic dynamics the transmission of crisesrsquo Journal of Monetary Economics Vol 70 pp 100-115
Prieto E S Eickmeier and M Marcellino (2016) lsquoTime variation in macro‐financial linkagesrsquo Journal of Applied Econometrics forthcoming
Silvestrini A and A Zaghini (2015) lsquoFinancial shocks and the real economy in a nonlinear world a survey of the theoretical and empirical literaturersquo Journal of Policy Modeling Vol 37 pp 915ndash929
(48) Hartmann P K Hubrich M Kremer and R J Tetlow (2015) lsquoMelting down Systemic financial instability and the macroeconomyrsquo mimeo
(49) Kremer M (2015) lsquoMacroeconomic effects of financial stress and the role of monetary policy a VAR analysis for the euro arearsquo International Economics and Economic Policy Vol 13 Issue 1 pp 1-34
(50) Ciccarelli M E Ortega and M T Valderrama (2016) lsquoCommonalities and cross-country spillovers in macroeconomic-financial linkagesrsquo The BE Journal of Macroeconomics Vol 16 Issue 1 pp 231-275
II3 Transmission channels from financial to macro developments
In spite of the broad consensus about the existence of macro-financial linkages the identification of the transmission channels is still a subject of debate There are different ways to classify the channels through which the financial sector might affect macroeconomic developments The important distinction applied in this section is whether the linkages are related to the balance sheets of borrowers or lenders At the same time the financial channels are also closely related to monetary transmission which affects their functioning (51) This subsection aims to better define the individual transmission channels in the euro area
The interest rate channel illustrates how money market rates affect the overall financing costs of the banking sector the price of credit and consequently consumption and investment decisions This channel is closely related to monetary policy decisions as they directly affect the funding costs of banks Moreover at the zero lower bound when the central bank uses other instruments besides short-term interest rates to conduct monetary policy this channel is more complex and difficult to assess
Thus in the analysis below the interest rate channel will be captured by variables that are affected by monetary policy decisions (Graph II3) In the euro area the most frequently used indicator directly affected by the ECBrsquos policy rates is the short-term interbank interest rate (EONIA) While the effect of monetary policy actions on short-term rates is rather quick there is also a delayed effect on long-term interest rates The long-term rates are of specific relevance in the current time as short-term rates are at the zero lower bound and monetary policy aims to affect long rates directly While long-term rates are commonly defined by the yield on respective sovereign bonds in the euro area this applies to a pool of euro area sovereigns As the yields diverge across sovereigns since the global financial crisis long-term rates in the euro area have become disconnected from short-term rates Since the ECB has employed diverse unconventional measures that affect the
(51) See for instance Basel Committee on Banking Supervision (2011)
lsquoThe transmission channels between the financial and real sectors a critical survey of the literaturersquo BCBS Working Paper No 18
II Financial channels and economic activity in the euro area
Volume 15 No 2 | 23
financial system additional measures need to be used to track their effect namely the shadow rate which is a factor model-based estimate of the short-term interest rate unconstrained by the ZLB (52) Likewise the excess liquidity defined as the liquidity held by the euro area banking sector in excess of the aggregate needs arising from minimum reserve requirements and autonomous factors is another quantitative-based indicator of the monetary policy stance as it is driven by the ECBrsquos refinancing operations
Graph II3 shows the dynamics of the variables described above in the period Q1-1996 - Q1-2016 which suggest that monetary conditions have been very supportive in recent years While short-term interest rates attained the ZLB monetary easing through unconventional measures is reflected in a significant decline in the shadow rate as well as long-term rates
Graph II3 Interest rate channel (2000Q1-2016Q1 )
Source Eurostat Bloomberg Reserve Bank of New Zealand
The borrower balance sheet channel reflects the fact that it is the net worth of borrowers that determines the external finance premium ie the opportunity cost of borrowing over using internal savings In other words it is the value of borrowersrsquo collateral that affects their credit conditions As indicated above fluctuations in
(52) There different shadow rates available all being subject of
significant model uncertainty The shadow rate used is based on Krippner (2012) and available from the Reserve Bank of New Zealand website
Krippner L (2012) lsquoMeasuring the stance of monetary policy in zero lower bound environmentsrsquo Economics Letters Vol 118 Issue 1 pp 135ndash138
asset prices can affect the ability of non-financial corporations and households to borrow and thus their investment and spending decisions While monetary policy commonly does not target asset prices its actions can affect the valuation of assets used as collateral which affects the credit available for investment and consumption spending (53) Whereas the previous discussion focuses on the demand side of credit the borrower balance sheet channel affects also the supply of credit Namely weak borrower balance sheets might induce credit rationing by the lenders and affect overall credit conditions
The borrower balance sheet channel can be captured mainly by variables that reflect the risks related to the balance sheets of firms and households as borrowers from the banking sector or from capital markets While there are no readily available direct measures of the quality of private balance sheets comparable across countries asset prices can be considered as indicative of their quality as they give the value of collateral for loans and of equity Therefore house prices and stock prices are generally used in the analysis to track this channel
Graph II4 Borrower balance sheet channel
(2000Q1-2016Q1)
Source Bloomberg BIS
Graph II4 suggests that developments in house prices and stock prices have been quite
(53) There is empirical evidence especially for the US stressing the
importance of asset prices and different credit spreads as leading indicator of economic activity eg Stock and Watson (2003) Stock J H and M W Watson (2003) lsquoForecasting output and inflation the role of asset pricesrsquo Journal of Economic Literature Vol 41 No 3 pp 788-829
-10
-5
0
5
10
15
20
25
2000Q1 2004Q1 2008Q1 2012Q1 2016Q1
Short-term interest rateLong-term interest rateShadow rate (Krippner)ECB Excess Liquidity Index
-6
-4
-2
0
2
4
6
8
10
-60
-40
-20
0
20
40
60
2000Q1 2002Q3 2005Q1 2007Q3 2010Q1 2012Q3 2015Q1
MSCI EURO Index y-o-y change
Housing prices y-o-y change
24 | Quarterly Report on the Euro Area
disconnected in recent years Specifically while house prices only started to recover in 2014 stock prices peaked in early 2015 and experienced a downward correction since then
The bank balance sheet channel relates to the fact that how much a bank lends depends on its own balance sheet and the different risks involved in its business model External developments (including monetary policy actions but also longer-term factors such as financial regulation and innovations in the banking sector) may affect bank liabilities (the supply of loanable funds and also bank funding costs) and in turn assets (supply of credit and the lending cost) (54) Bank lending is determined by banksrsquo business models it usually increases with the increase in leverage in the economy while deleveraging episodes may significantly hamper lending activities This makes leverage highly pro-cyclical (55) Importantly the impact of bank balance sheets on the real economy can be more pronounced in the euro area than in capital-market based systems as alternative forms of financing are relatively undeveloped
The bank balance sheet channel can thus be illustrated by variables such as banking leverage the stock of non-performing loans banksrsquo funding costs or the price of Credit Default Swaps (CDS) However reliable data for the euro area are relatively short available only for the period since the beginning of the crisis Indeed the lack of knowledge about the quality of bank balance sheets was an important aspect of the euro area financial crisis and a reason for the implementation of the Asset Quality Review (AQR) by the ECB in 2014 Therefore for the analysis in this section measures which directly track the supply of credit have been used instead (56) Namely the flow of credit as measured by the credit impulse (ie the change in new credit granted by the banking sector as a percentage of GDP) the stock of credit on banksrsquo balance sheet as measured by total economy credit as a percentage of GDP and the price of credit as measured by the Composite Financing Conditions Indicator (CFCI) for non-financial corporations
(54) Bernanke B and A Blinder (1988) lsquoCredit money and aggregate
demandrsquo the American Economic Review Vol78 No 2 pp 435ndash439 (55) Adrian T and H S Shin (2010) lsquoLiquidity and leveragersquo Journal of
Financial Intermediation Vol 19 Issue 3 pp 418-437 (56) In practice the lending volumes and rates can be affected both by
supply and demand side
which (assuming a constant mark-up) proxies bank funding costs (57)
Graph II5 shows that there is a negative correlation between the credit impulse and credit as a percentage of GDP Thus during downturns the flow of new credit declines while the ratio of credit to GDP increases due to the collapse of GDP The credit impulse indicator shows that the supply of new credit has been fairly limited since the onset of the global financial crisis The CFCI tracks the ECB policy rates rather closely with the exception of the euro area sovereign debt crisis episode (2011-2012) when financing costs increased due to idiosyncratic increases in some Member States reflecting financial market fragmentation
Graph II5 Bank balance sheet channel (2000Q1-2016Q1)
Source Capital Economics BIS DG ECFIN
While the previous channels are related to the quality of balance sheets either on the borrower or the lender side some shocks can originate in the overall financial system Examples are liquidity shocks or confidence shocks These shocks work both via the balance sheets but also by directly altering agents decisions through precautionary motives affecting both investment and consumption behaviour These mechanisms are defined as the uncertainty channel (58)
(57) For more details on CFCI calculations see European Commission
(2013) Drivers of diverging financing conditions across Member States Quarterly Report on the Euro Area Vol12 No1
(58) Bloom (2009) point to uncertainty shocks (that might be related but also unrelated to the financial system) as a crucial driver of economic dynamics Recently Caldara et al (2016) argue for the needs to distinguish uncertainty shocks from financial shocks while both of them are important source of macroeconomic
-8
-6
-4
-2
0
2
4
6
8
10
2000Q1 2003Q1 2006Q1 2009Q1 2012Q1 2015Q1
Total credit on GDP y-o-y change
Credit impulse (new crediton GDP y-o-y change)
Composite financingconditions indicator
II Financial channels and economic activity in the euro area
Volume 15 No 2 | 25
The uncertainty channel is captured by variables reflecting the different types of uncertainty that can affect the economy One type is commonly related to increased volatility in financial markets Given a high degree of global interconnectedness the euro area economy can be affected by uncertainty related to global financial developments which is usually measured by the implied volatility of SampP 500 index options (VIX) (59) The euro area specific stress in the financial system is measured through the ECBrsquos Composite Indicator of Systemic Stress (CISS)
Another type of uncertainty is linked to swings in business and consumer confidence Variations in the confidence of euro area households and non-financial firms are illustrated through the European Commissionrsquo confidence indicator the Economic Sentiment Indicator (ESI) which is based on data collected through business and consumer surveys However the indicator exhibits a very high contemporaneous correlation with actual GDP growth indicating that its dynamics are likely to reflect very accurately economic conditions rather than information related to exogenous changes in confidence
Finally unexpected outcomes of economic policy decisions can lead to policy uncertainty which in turn can have adverse effects on the savings and investment behaviour of firms and households Policy uncertainty is illustrated through an indicator based on newspaper coverage of uncertainty-generating events (60)
Graph II6 indicates that there is an apparent co-movement among these indicators even if they measure different types of uncertainty While economic sentiment has been gradually improving and uncertainty related to financial markets has eased the policy uncertainty affecting the euro area is still relatively high
fluctuations separately the Great Recession was likely outcome of the toxic interaction between the two
Bloom N (2009) lsquoThe impact of uncertainty shocksrsquo Econometrica Vol 77 Issue 3 pp 623-685
Caldara D C Fuentes-Albero S Gilchrist and E Zakrajšek (2014) lsquoThe macroeconomic impact of financial and uncertainty shocksrsquo European Economic Review forthcoming
(59) The VIX is calculated by the Chicago Board Options Exchange (CBOE)
(60) Baker S R N Bloom and S J Davis (2015) lsquoMeasuring economic policy uncertaintyrsquo National Bureau of Economic Research Working Paper No 21633 Data source wwwpolicyuncertaintycom
Graph II6 Uncertainty channel (2000Q1-2016Q1)
Source Chicago Board of Exchange ECB wwwpolicyuncertaintyorg
II4 Financial developments and economic activity
This sub-section provides stylised facts on the transmission channels defined above and show whether and how financial developments have affected the real side of the euro area economy since the crisis (namely consumption investment unemployment and long-term interest rates)
While financial variables are available in real time macroeconomic variables are normally released with lags Therefore conditioning macroeconomic forecasts on observed financial developments (ie a projection of macro variables on the observed paths of financial variables) can improve forecasts as more informative data are taken into account Several empirical studies have shown that financial variables can improve macroeconomic forecasts (61)
The methodology underlying this this section is a large-scale Bayesian VAR with 35 macroeconomic
(61) Stock and Watson (2003) provide a seminar contribution on the
role of financial variables namely asset prices for GDP and inflation forecast concluding that different financial variables allow macroeconomic forecasting in different times Espinosa et al (2012) document using standard VAR approach that financial variables improve GDP forecast for the euro area especially in the real time when numerous financial variables are available ahead of the macroeconomic releases
Stock J H and M W Watson (2003) lsquoForecasting output and inflation the role of asset pricesrsquo Journal of Economic Literature Vol 41 No 3 pp 788-829
Espinoza R F Fornari and M J Lombardi (2012) lsquoThe role of financial variables in predicting economic activityrsquo Journal of Forecasting Vol 31 No 1 pp 15-46
0
50
100
150
200
250
300
0
10
20
30
40
50
60
70
80
2000Q1 2002Q3 2005Q1 2007Q3 2010Q1 2012Q3 2015Q1
VIX
CISS
ESI (rhs)
Policy uncertainty (rhs)
26 | Quarterly Report on the Euro Area
and financial variables (62) The model is estimated for the sub-period Q1-2000 - Q4-2011 which covers both normal and crisis times but does not include some of the most important unconventional monetary policy measures Given the estimated past correlations a counterfactual path for the macroeconomic and financial variables (ie a distribution of conditional forecasts) can be obtained for the entire period Q1-2000 - Q4-2015 conditional on observed real GDP and inflation in the baseline case The deviations of the observed developments of financial variables from this counterfactual path can be interpreted as evidence of instability in the relationship between financial variables and economic activity (as measured by GDP growth and inflation) since the crisis
Subsequently the conditional set from the baseline case (including only real GDP and inflation) is extended by financial and uncertainty variables corresponding to each transmission channel described above (63)
Some recent developments are puzzling
Graph II7 shows the counterfactual paths of the main GDP components producer prices the unemployment rate and the long-term interest rate conditional on observed economic activity (real GDP and inflation) It also shows the conditional forecasts for the balance sheet variables of households and firms when only real GDP and inflation are taken into account in the conditioning set
(62) Alternative strand of literature using rich set of data in order to
nowcast or forecast employs dynamic factors models where data dimension is reduced in a first step by factor estimation with common factors being consequently used in the forecasting exercize see eg Giannone et al (2008) Bellego and Ferrara (2012) find using factor-augmented probit model that financial variables allow tracking better recession periods in the euro area (in the pre-crisis period) with optimal lead of financial variables over recession of around one year
Giannone D L Reichlin L and D Small (2008) lsquoNowcasting the real-time informational content of macroeconomic datarsquo Journal of Monetary Economics Vol 55 Issue 4 pp 665ndash676
Belleacutego C and L Ferrara (2012) lsquoMacro-financial linkages and business cycles A factor-augmented probit approachrsquo Economic Modelling Vol 29 pp 1793-1797
(63) For more details on the methodology see Box IV1 in European Commission (2015) lsquoInvestment dynamics in the euro area since the crisisrsquo Quarterly Report on the Euro Area Vol 14 No 1 pp 35-43
Bańbura M D Giannone and M Lenza (2015) lsquoConditional forecasts and scenario analysis with vector autoregressions for large cross-sectionsrsquo International Journal of Forecasting Vol 31 Issue 3 pp 739ndash756
The results suggest that private consumption was unusually low during the period of the euro area debt crisis and deleveraging (2012-2013) while it overshot during the recent recovery (from 2014 onward) Investment behaved in line with historical correlations during both downturn episodes (2008-2009 and 2012-2013) and was weak during the deleveraging phase because overall output growth was weak However its recent recovery (since 2014) has been more subdued than what the pace of economic activity would have predicted the observed investment path is positioned on the lower tail of the distribution of conditional forecasts) (64)
Large deleveraging pressures in the public sector have led to a significant decline in the euro area aggregate government consumption over the period 2011-2012 However this decline had almost been reversed by the end of 2014 with public consumption starting to overshoot from 2015 onwards (relative to its counterfactual path obtained through conditioning on output growth) reflecting the aggregate euro area fiscal stance which started to turn mildly expansionary
Moreover the results show that several variables capturing price and balance sheet developments are still at odds with historical patterns In particular producer prices house prices long-term interest rates and loans to firms and households undershoot the distribution of the conditional forecasts On one side this underlines that the recent recovery is characterized by a historically low inflation environment and loose monetary conditions pushing the long-term rates down On the other side the ongoing balance sheet adjustment is translating into very weak credit dynamics due to unprecedented deleveraging pressures
Graph II8 illustrates the zero lower bound constraint on monetary policy rates and the subsequent break in the correlation of economic activity with the two measures of monetary policy
(64) There is some relative instability in the estimated correlations over
the sample period notably pre-crisis vs crisis years However it does not significantly affect the result on the unusual weakness in investment recovery since 2014 The article lsquoInvestment dynamics in the euro area since the crisisrsquo Quarterly Report on the Euro Area Vol 14 No 1 pp 35-43 found that estimating the past correlations only with the sample for the pre-crisis period the amplitude of the investment fall during the first downturn (2008-2009) would also be slightly underestimated by the conditional forecasts
II Financial channels and economic activity in the euro area
Volume 15 No 2 | 27
rates since 2012 Among all variables the consumer and business confidence indicator (ESI) comes out as having the strongest contemporaneous correlation with economic activity during the crisis
In the consecutive analysis the conditioning dataset (including only real GDP and inflation in the baseline) is augmented by financial variables corresponding to each transmission channel
hellip different channels play an important role at different stages since the crisis
The interest rate channel (Graph II9 upper panel) seems to better account for the pattern of consumption during the recent recovery (compared to the baseline) This channel which reflects mainly monetary conditions suggests that monetary easing implemented since 2014 by means of additional unconventional measures (namely the targeted long-term refinancing operations (TLTRO) the asset-backed securities purchasing program (ABSPP) and the forthcoming public
securities purchase program (PSPP)) have translated into a further decline in the long-term interest rate and the shadow policy rate It also reflects an increase in excess liquidity which has had a very benign effect on the recent recovery However producer prices developments (PPI) still appear unusually subdued Likewise including information capturing the interest rate channel does not help explain the dismal performance of consumption during the deleveraging phase (2012-2013) or the persistent weakness of credit dynamics Therefore these developments seem to be determined also by drivers other than monetary conditions
The borrowers balance sheet channel (Graph II9 lower panel) captures in turn the exceptional deleveraging developments of 20122013 but clearly underestimates the pace of the recent recovery This finding suggests that strained balance sheets of households and firms represented the main weight on the recovery at the time of euro area sovereign debt crisis However whereas a mild recovery started in the euro area in 2014 private
Graph II7 Conditional forecasts based on real GDP and inflation (1) (2000Q1-2015Q4 y-o-y growth)
Misalignments of financial and real variables with output growth since the crisis
(1) Shades of orange distribution of the conditional forecasts in the BVAR in levels excluding the lower and higher 5 quantiles Green line actual values The variables are all reported in terms of annual percentage changes except for the unemployment rate and the long-term interest rate which are in levels Conditioning assumptions real GDP and HICP Source DG ECFIN MATLAB codes replication files of the methodological paper (Banbura et al 2015)
Government consumption
2005 2010 2015-2
0
2
4Real consumption
2005 2010 2015-5
0
5Real investment
2005 2010 2015-20
-10
0
10
Unemployment rate
2005 2010 20150
5
10
15PPI ex const
2005 2010 2015-50
0
50House prices
2005 2010 2015-10
0
10
Long-term i r
2005 2010 20150
5
10Loans to firms
2005 2010 2015-10
0
10
20Loans to households
2005 2010 2015-5
0
5
10
28 | Quarterly Report on the Euro Area
balance sheets still did not improve much In fact when the borrower balance sheet channel is taken into account observed consumption overshoots the conditional forecast even by a higher margin than in the baseline scenario and real investment seems to be on the upper side as well This suggests that the borrower balance sheet channel should have led to more subdued dynamics of both consumption and investment than what has been observed in 2014 and 2015 indicating that other channels have been somewhat compensating the adverse effects of this channel
The bank balance sheet channel (Graph II10 upper panel) improves the forecast of investment since 2014 and reduces the uncertainty around the median for some variables such as consumption unemployment and long-term interest rate The good fit of investment dynamics indicates a strong correlation of investment with total economy credit developments both in terms of flows and stocks
Interestingly the bank balance sheet information namely the total economy credit as percentage of GDP (including credit to public sector) the private sector credit impulse and the price of credit for the private sector cannot capture the weak observed dynamics of outstanding loans to firms and households This shows that the private deleveraging process has been much stronger than the public sector deleveraging making private credit developments disconnected from GDP
growth (65) Therefore while the recovery in real activity has been rather weak the private credit dynamics have been even weaker Furthermore the modest recovery does not facilitate passive deleveraging (a decrease in the relative debt burden due to a growing economy ie denominator effect) and feeds the active deleveraging (a decrease of absolute level of debt ie nominator effect)
Finally the current long-term interest rate seems very low even when the financing costs for non-financial corporations (which also attained historical minima) are taken into account This underlines the importance of the ECBrsquos measures that imply very easy financing conditions in the foreseeable future
Last but not least the uncertainty channel (Graph II10) seems to improve the conditional forecast over the baseline in the same spirit as the bank balance sheet channel For example there is a good fit of investment indicating a strong correlation of investment with confidence and financial stress measures Equally the rebound in private consumption seems to be well captured by the uncertainty channel indicating that the recent decrease in financial markets stress has also been an important driver for consumption However in general the uncertainty channel is likely to be implicitly included in the bank balance sheet
(65) GDP is a denominator of the credit indicators in bank balance
sheet channel
Graph II8 Conditional forecasts based on real GDP and inflation (1) (2000Q1-2015Q4 y-o-y growth)
Business and consumer confidence and short-term interest rates
(1) Shades of orange distribution of the conditional forecasts in the BVAR in levels excluding the lower and higher 5 quantiles Green line actual values The variables are all reported in terms of annual percentage changes except for the unemployment rate and the long-term interest rate which are in levels Conditioning assumptions real GDP and HICP Source DG ECFIN MATLAB codes replication files of the methodological paper (Banbura et al 2015)
Economic sentiment
2005 2010 2015-15
-10
-5
0
5
10Short-term i r
2005 2010 2015-4
-2
0
2
4
6
8Shadow short-term interest rate
2005 2010 2015-6
-4
-2
0
2
4
6
II Financial channels and economic activity in the euro area
Volume 15 No 2 | 29
channel For example in periods of high uncertainty bank funding costs increase (bank balance sheet channel) and firms with weaker balance sheets cannot obtain credit for new loans (borrower balance sheet channel)
Overall the findings above suggest that while there is clear evidence of the transmission of monetary policy measures on financial variables and from financial variables to consumer lending rates the evidence on the effects on real activity is more complex with different channels playing an important role at different stages of the crisis The interest rate channel has helped the modest recovery since 2014 by supporting both public and private consumption growth and by partially compensating the balance sheet channel for both borrowers and banks The results in Graph II9 (lower panel) can be interpreted as showing that in the absence of massive monetary easing given the high level of debt in the economy and the wealth effects associated with house and asset prices decreases both private and public consumption growth could have been much more subdued than what it is currently observed
Graph II10 (both panels) illustrate the importance of the bank balance sheet and the uncertainty channel for capturing investment dynamics Weak investment growth is well captured both by credit developments as captured through the bank balance sheet channel and confidence effects through the uncertainty channel Real economic activity as measured by GDP growth while playing an important role does not seem to fully explain the subdued growth in investment since 2014 (Graph II7)
II5 Conclusions
The section discusses the nexus between financial and macroeconomic developments drawing some
lessons from the literature and providing some stylised facts on the main transmission channels through which financial developments have affected real economic activity since the crisis
While there is clear evidence of the transmission of monetary policy measures on financial variables and from financial variables to consumer lending rates the evidence on the effects on real activity is more complex with different channels playing an important role at different stages of the crisis
The state of private balance sheets seems to have significantly contributed to the poor performance of consumption during the euro area debt crisis and high debt levels still weigh on growth However given the still high level of debt the current mild recovery should be seen as a rather positive outcome The analysis suggests that easy monetary conditions seem to represent an important driver of the current recovery Another driver seems to be the balance sheets of banks which have gradually improved and allow better transmission of easy monetary conditions to the lending rates
Given the still high levels of debt in the economy and the wealth and confidence effects associated with house and asset prices corrections both private and public consumption growth could have been much more subdued than what it is currently observed were it not for the exceptional easing of monetary conditions
Unfortunately the recovery is still not strong enough to facilitate the deleveraging process The stock of debt and the ongoing deleveraging combined with adverse confidence effects still represent major impediments for a stronger recovery in investment Consequently there is a need to implement policy measures that allow dealing effectively with the debt overhang notably an effective framework for non-performing loans resolution
30 | Quarterly Report on the Euro Area
Graph II9 Conditional forecasts based on variables capturing the interest rate channel and borrower balance sheet channel (1)
(2000Q1-2015Q4 y-o-y growth)
Interest rate channel
Borrower balance sheet channel
(1) Shades of orange distribution of the conditional forecasts in the BVAR in levels excluding the lower and higher 5 quantiles Green line actual values The variables are all reported in terms of annual percentage changes except for the unemployment rate and the long-term interest rate which are in levels Conditioning assumptions interest rate channel ESI HICP the short-term interest rate the long-term interest rate the shadow interest rate and the ECB excess liquidity measure Conditioning assumptions borrower balance sheet channel ESI HICP house prices stock prices and outstanding loans to households and firms Due to the high contemporaneous correlation between real GDP growth and the ESI indicator the ESI indicator contains the same forecasting information as real GDP ESI indicator is used in the conditioning set instead of real GDP variable in order to also illustrate conditional forecasts for real GDP Source DG ECFIN MATLAB codes replication files of the methodological paper (Banbura et al2015)
Real GDP
2005 2010 2015-10
-5
0
5Government consumption
2005 2010 2015-2
0
2
4Real consumption
2005 2010 2015-5
0
5
Real investment
2005 2010 2015-20
-10
0
10Unemployment rate
2005 2010 20150
10
20PPI ex const
2005 2010 2015-50
0
50
House prices
2005 2010 2015-10
0
10
20Loans to firms
2005 2010 2015-10
0
10
20Loans to households
2005 2010 2015-10
0
10
20
Real GDP
2005 2010 2015-10
-5
0
5Government consumption
2005 2010 2015-2
0
2
4Real consumption
2005 2010 2015-5
0
5
Real investment
2005 2010 2015-20
-10
0
10Unemployment rate
2005 2010 20150
5
10
15PPI ex const
2005 2010 2015-50
0
50
Shadow short-term interest rate
2005 2010 2015-5
0
5
10Short-term i r
2005 2010 2015-5
0
5
10Long-term i r
2005 2010 20150
5
10
II Financial channels and economic activity in the euro area
Volume 15 No 2 | 31
Graph II10 Conditional forecasts based on variables capturing the bank balance sheet channel and uncertainty channel (1)
(2000Q1-2015Q4 y-o-y growth) Bank balance sheet channel
Uncertainty channel
(1) Shades of orange distribution of the conditional forecasts in the BVAR in levels excluding the lower and higher 5 quantiles Solid black line point estimate of the conditional forecasts in the BVAR in differences which is computed as the median of the distribution of the conditional forecasts in this model Green line with crosses actual values The variables are all reported in terms of annual percentage changes except for the unemployment rate and the long-term interest rate which are in levels Conditioning assumptions for the bank balance sheet channel ESI HICP the credit impulse the private credit volumes (debt-to-GDP ratio) and bank lending rates for households and firms (CFCI) Conditioning assumptions uncertainty channel ESI HICP the policy uncertainty indicator the CISS and the VIX Due to the high contemporaneous correlation between real GDP growth and the ESI indicator the ESI indicator contains the same forecasting information as real GDP ESI indicator is used in the conditioning set instead of real GDP variable in order to also illustrate conditional forecasts for real GDP Source DG ECFIN MATLAB codes replication files of the methodological paper (Banbura et al 2015)
Real GDP
2005 2010 2015-10
-5
0
5Government consumption
2005 2010 2015-2
0
2
4Real consumption
2005 2010 2015-2
0
2
4
Real investment
2005 2010 2015-20
-10
0
10Unemployment rate
2005 2010 20150
5
10
15PPI ex const
2005 2010 2015-50
0
50
Loans to firms
2005 2010 2015-10
0
10
20Loans to households
2005 2010 2015-10
0
10
20Long-term i r
2005 2010 20150
2
4
6
Real GDP
2005 2010 2015-10
0
10Government consumption
2005 2010 2015-2
0
2
4Real consumption
2005 2010 2015-5
0
5
Real investment
2005 2010 2015-20
0
20Unemployment rate
2005 2010 20150
5
10
15PPI ex const
2005 2010 2015-50
0
50
Loans to firms
2005 2010 2015-10
0
10
20Loans to households
2005 2010 2015-10
0
10
20Long-term i r
2005 2010 20150
5
10
III Confidence spillovers in the euro area
Volume 15 No 2 | 33
III1 Introduction
During the recent crisis euro area private consumption fell substantially This was accompanied by a sharp decline in consumer confidence which many observers have identified as a key factor contributing to the persistence of the slowdown In fact the onset of the crisis coincided with an abrupt unwinding of imbalances that is of economic trends that turned out to be unsustainable and which led to a significant adjustment of expectations Both consumption growth rates and confidence levels have been improving since the start of 2013
There is some (mixed) evidence to suggest that fluctuations in consumer confidence affect the dynamics of private consumption (67) On the basis of this assumption and taking into account the unprecedented extent of the most recent crisis it is important to determine whether and to what extent confidence shocks spill over between countries This is particularly relevant in relation to the euro area where close trade and financial links and common institutional features can lead to the rapid propagation of shocks In addition confidence spillovers can be an important aspect to consider when discussing how to improve macroeconomic policymaking in a common currency area
This section reviews the evidence on the link between consumer confidence and private consumption and on cross-border confidence spillovers and presents some analysis of the transmission of confidence shocks across the euro area It is a follow-up to analysis discussed in
(66) This section was prepared by Francesca DrsquoAuria (67) See for a discussion Ludvigson SC 2004 lsquoConsumer
confidence and consumer spendingrsquo Journal of Economic Perspectives Vol 18(2) pp 29-50
previous issues of the Quarterly Report on the Euro Area (QREA) (68)
III2 Recent trends in consumer confidence and private consumption in the euro area
Graph III1 shows the evolution over the period 1995Q2-2016Q1 of euro area real private consumption and consumer confidence The latter is measured by the Consumer Confidence Indicator constructed by the European Commission as part of the Joint Harmonised EU Programme of Business and Consumer Surveys (BCS) (69)
There is close co-movement between the two variables Both real consumption growth and consumer confidence showed the greatest deterioration in the first quarter of 2009 and during the sovereign debt crisis They have been on a recovery path since early 2013 with consumer confidence reaching levels above the euro area long-term average since the first quarter of 2014
The relationship between consumer confidence and private consumption is much debated in the literature From a theoretical perspective there are two main competing theories One view is that confidence indicators can help predict the dynamics of consumption as they convey information about future economic conditions Another theory is that the link between the two variables can be interpreted in terms of lsquoanimal
(68) DrsquoAuria F lsquoCross-border spillovers in confidencersquo Quarterly
Report on the Euro Area (2013) Vol 12(3) pp26-30 DrsquoAuria F S Linden D Monteiro J in lsquot Veld and S Zeugner
lsquoCross-border spillovers in the euro arearsquo Quarterly Report on the Euro Area (2014) Vol 13(4) pp7-22
(69) See European Commission (2016) lsquoA user guide to the Joint Harmonised EU Programme of Business and Consumer Surveysrsquo for details on the construction of the indicators
In recent years there has been close co-movement between consumer confidence and private consumption in the euro area During the crisis in particular consumer confidence was identified by many commentators as a driving factor in its persistence as expectations about a sustainable path of economic growth were adjusted significantly In view of the unprecedented extent of the crisis the question of whether and to what extent changes in consumer confidence in one country could spill over to other countries was also raised This section discusses the relationship between consumer confidence and consumption and reviews the evidence of consumer confidence spillovers between euro area countries We conclude that there is some evidence to suggest that confidence shocks are transmitted between countries This conclusion is corroborated by results from the estimation of a Global Vector Autoregressive (GVAR) model for a number of euro area countries (66)
34 | Quarterly Report on the Euro Area
spiritsrsquo as confidence indicators capture fluctuations in beliefs which in turn affect consumption (70) In both cases the essence of confidence indicators is to gauge expectations ndash irrespective of how they are formed ndash about the future course of the economy which then have a knock-on effect on current consumer behaviour
Graph III1 Confidence and private consumption euro area
(1995Q2-2016Q1 q-o-q change)
Source Eurostat and DG ECFIN calculations based on EU Business and Consumer Surveys
Several studies test empirically the link between consumer confidence and private consumption A number of them find evidence in support of a strong correlation between consumer confidence and consumption (71)
However as confidence and consumption are to a large extent determined by the same factors other studies try to assess whether confidence indicators carry information beyond economic fundamentals The evidence on this issue is mixed although several studies conclude that confidence indicators play a significant role There is some evidence to suggest that while part of the information conveyed by confidence indicators is also captured by other variables (eg past consumption income and interest rates) confidence measures have an additional predictive power for the future path of
(70) See Barsky and Sims (2012) for a discussion of the different
theoretical approaches to the role of confidence Barsky R B and ER Sims (2012) lsquoInformation animal spirits and the meaning of innovations in consumer confidencersquo American Economic Review 102(4) pp 1343-1377
(71) See for example Carroll C J Fuhrer and D Wilcox (1994) lsquoDoes consumer sentiment forecast household spending If so whyrsquo American Economic Review Vol 84 pp 1397-1408
consumer spending (72) Moreover some papers find that confidence indicators have a stronger predictive power during periods of large economic fluctuations (73)
III3 The existing evidence on confidence spillovers
On the assumption that a causal relationship between consumer confidence and private consumption exists it is important to determine whether and to what extent changes in consumer confidence in one country affect confidence (and thus consumption) in others
There is some evidence to support the existence of confidence spillovers This pertains both to confidence shocks originating in the US and being transmitted to the euro area and shocks which occur in one euro area country and spill over to other euro area countries
Several studies provide evidence of a transmission channel of confidence shock to foreign confidence In particular evidence for G7 countries and Spain would suggest that variations in confidence generally spill over from large countries to smaller ones (74) Some studies support the idea that confidence shocks originating in US are transmitted to the euro area but not the other way round ie shocks to euro area confidence do not affect confidence in the US (75) Other studies show a transmission channel for confidence shocks
(72) Some authors eg Ludvigson (2004) Souleles (2004) and Lahiri
Monokroussos and Zhao (2016) conclude that including confidence indicators can reduce forecasting errors when predicting the dynamics of consumption while others reach the opposite conclusion (eg Claveria Pons and Ramos 2007)
Ludvigson S (2004) lsquoConsumer confidence and consumer spendingrsquo Journal of Economic Perspectives Vol 18(2) pp 29-50
Souleles NS (2004) lsquoExpectations heterogenous forecast errors and consumption Micro evidence from the Michigan Consumer Sentiment Surveysrsquo Journal of Money Credit and Banking Vol 36 pp 39-72
Lahiri K G Monokroussos and Y Zhao (2016) lsquoForecasting consumption the role of consumer confidence in real time with many predictorsrsquo Journal of Applied Econometrics forthcoming
Claveria O E Pons and R Ramos (2007) lsquoBusiness and consumer expectations and macroeconomic forecastsrsquo International Journal of Forecasting Vol 23 pp47-69
(73) For example Howrey E (2001) lsquoThe predictive power of the index of consumer sentimentrsquo Brookings Papers on Economic Activity Vol 1 pp 175-216
(74) Fei S (2011) lsquoThe confidence channel for the transmission of shocksrsquo Banque de France Working Paper No 314
(75) Deacutees S and P Soares-Brinca (2013) lsquoConsumer confidence as a predictor of consumption spending Evidence for the United States and the Euro Arearsquo International Economics Vol 134 pp 1-14
-40
-30
-20
-10
0
10
1995Q2 1998Q2 2001Q2 2004Q2 2007Q2 2010Q2 2013Q2-08
-04
00
04
08
12
16Consumption (rhs)Consumer Confidence Indicator
III Confidence spillovers in the euro area
Volume 15 No 2 | 35
(Continued on the next page)
Box III1 A GVAR model to assess confidence spillovers
The Global Vector Autoregressive (GVAR) methodology developed by Pesaran Schuermann and Weiner (2004) (1) combines individual vector error-correcting models where domestic variables are linked to country-specific foreign variables The latter combine the domestic variables using international trade financial or other relevant weights for each country This approach allows the analysis of interdependence across different economies providing a solution to the lsquocurse of dimensionalityrsquo (eg the high number of parameters as the dimension of the model increases) in global modelling
For a set of countries i=0 1 2 hellip N the individual VARX(pi qi) models take the following form
itqtiiqtiiitiiptiiptiiit uxxxxxxii
+Λ++Λ+Λ+Φ++Φ= minusminusminusminus
11
011
where xit is a vector of ki x 1 vector of domestic variables xit a ki x 1 vector of foreign variables and
00
===
iijt
N
jijit xx ωω
where ωij j=01hellipN is a set of weights such that 10
==
N
jijω The foreign variables xit are therefore a
weighted average of domestic variables for all countries included in the model The weights can be different in nature but are typically constructed using trade or capital flows data The GVAR model is then solved for the lsquoworldrsquo (ie all countries included in the model) as a whole considering all variables as endogenous to the system
The GVAR model has been applied to a variety of issues These include forecasting (eg Pesaran Schuermann and Smith 2009) credit risk (eg Pesaran Schuermann and Treutler 2007) oil price shocks (eg Galesi and Lombardi 2009) global imbalances (eg Bussiegravere Chudik and Sestieri 2012) business cycle synchronisation (eg Dreger and Zhang 2013) the impact of EU membership (eg Pesaran Smith and Smith 2007) the international effects of fiscal policy shocks (eg Favero Giavazzi and Perego 2011) (2) Chudik and Pesaran (2014) provide a detailed review of these and other recent applications (3)
In this section this approach is used to analyse the transmission of country-specific and global consumer confidence shocks in a model which includes eight euro area countries (Austria Belgium Finland France Germany Italy the Netherlands and Spain) using quarterly data over the period 1996Q2-2013Q1 The model is solved using the GVAR Toolbox developed by Smith and Galesi (2014) (4)
(1) Pesaran MH Schuermann T and Weiner S M (2004) lsquoModelling regional interdependencies using a global error-correcting
modelrsquo Journal of Business and Economic Statistics Vol 22 pp 129-162 (2) Pesaran M H Schuermann T and Smith LV (2009) lsquoForecasting economic and financial variables with global VARsrsquo
International Journal of Forecasting Vol 25(4) pp 642-675 Pesaran MH Schuermann T and Treutler B-J (2007) lsquoGlobal business cycles and credit riskrsquo in The Risks of Financial Institutions NBER Chapters pp 419-474 Bussiegravere M Chudik A and Sestieri G (2012) lsquoModelling global trade flows results from a GVAR modelrsquo Globalization and Monetary Policy Institute Working Paper 119 Federal Reserve Bank of Dallas Dreger C and Zhang Y (2013) lsquoDoes the economic integration of China affect growth and inflation in industrial countriesrsquo FIW Working Paper series 116 FIW Pesaran M H Smith L V and Smith R P (2007) lsquoWhat if the UK or Sweden had joined the euro in 1999 An empirical evaluation using a Global VARrsquo International Journal of Finance and Economics Vol 12(1) pp 55-87 Favero C Giavazzi F and Perego F (2011) lsquoCountry heterogeneity and the international evidence on the effects of fiscal policyrsquo IMF Economic Review 59(4) 652-682
(3) Chudik A and Pesaran MH (2014) lsquoTheory and Practice of GVAR Modelingrsquo Federal Reserve Bank of Dallas Globalization and Monetary Policy Institute Working Paper No 180
(4) Smith LV and Galesi A (2014) GVAR Toolbox 20 available at httpssitesgooglecomsitegvarmodellinggvar-toolbox
36 | Quarterly Report on the Euro Area
between the US the euro area as a whole and four EU countries taken individually (76)
In addition the role of consumer confidence spillovers in the euro area was assessed in a previous issue of the QREA (77) Consumption and confidence regressions were carried out for a panel of euro area countries over the period 1999-2012 The findings support the existence of confidence spillovers between euro area countries
III4 Confidence spillovers across the euro area
Table III1 shows simple correlations between the confidence indicators of eight euro area countries over the period 1995Q4-2016Q1 (78)The strength of the link between consumer confidence indicators across Member States is variable and in most cases is larger between neighbouring countries and between countries sharing similar macroeconomic environments (79)
Table III1 Consumer Confidence Indicator mdash Correlation Matrix
(1995Q4-2016Q1)
(1) Not statistically significant at conventional levels Source DG ECFIN calculations based on EU Business and Consumer Surveys
(76) Deacutees S and J Guntner (2014) lsquoThe international dimension of
confidence shockrsquo ECB Working Paper No 1669 (77) Op cit DrsquoAuria F (2013) (78) The very low and non-statistically significant correlation of the
Italian confidence indicator with the confidence indicators of a number of other euro area countries is somewhat puzzling and there is a need for further investigation into the reasons behind it
(79) The strong correlation between confidence indicators in countries sharing similar economic conditions can be indicative of larger confidence spillovers between them but can also be a reflection of the strong correlation between their economic fundamentals
The strength of the correlation also varies considerably over time Table III2 displays correlations between consumer confidence indicators in the same euro area countries over the period 2008Q1-2012Q4 During the crisis period the link between consumer confidence indicators is significantly tighter
Table III2 Consumer Confidence Indicator mdash Correlation Matrix
(2008Q1-2012Q4)
(1) Not statistically significant at conventional levels Source DG ECFIN calculations based on EU Business and Consumer Surveys
The presence of a correlation between confidence indicators may point to the existence of confidence spillover effects between countries but also be indicative of strong business cycle synchronisation To shed light on the nature of these correlations this section discusses confidence spillovers in the euro area on the basis of the findings from the estimation of a Global Vector Autoregressive (GVAR) model which includes data for eight euro area countries over the period 1996Q2-2013Q1 Box III1 describes the model in more detail
The model includes observations on consumption GDP the unemployment rate a short-term interest rate and consumer confidence The latter is measured by the BCS Consumer Confidence Indicator which is an arithmetic average of the balances of the answers to questions on the financial situation of households the general economic situation unemployment expectations and savings over the next 12 months It is therefore taken as a proxy for consumersrsquo expectations about their future economic situation
The results seem to support the existence of consumer confidence spillovers across the euro area As an illustration Graph III2 reports impulse
AT BE FI FR IT DE NL ES
AT 100 069 069 074 013(1) 054 043 022BE 069 100 067 088 055 057 068 066FI 069 067 100 068 039 028 075 055FR 074 088 068 100 046 055 066 060IT 013(1) 055 039 046 100 004(1) 063 081DE 054 057 028 055 004(1) 100 033 023NL 043 068 075 066 063 033 100 073ES 022 066 055 060 081 023 073 100
AT BE FI FR IT DE NL ES
AT 100 093 090 088 036(1) 079 086 063BE 093 100 081 080 034(1) 080 081 071FI 090 081 100 083 058 052 081 066FR 088 080 083 100 030(1) 066 074 061IT 036(1) 034(1) 058 030(1) 100 -016(1) 065 038DE 079 080 052 066 -016(1) 100 050 048NL 086 081 081 074 065 05 100 050ES 063 071 066 061 038 048 050 100
Box (continued)
by the European Commission Consumption and GDP enter the model in log differences while the other variables are in levels Some of the results are discussed in the main text
III Confidence spillovers in the euro area
Volume 15 No 2 | 37
response functions of consumer confidence in the euro area countries included in the GVAR model to a positive shock to consumer confidence in Germany over 24 quarters (80)
The largest effect appears to be in smaller neighbouring countries (Austria Belgium and the Netherlands) The response of consumer confidence is also relatively large in Finland France and Spain On the other hand spillovers to consumer confidence in Italy are very small and become negative after six quarters This is not a surprise given the statistically insignificant correlation between German and Italian consumer confidence emerging from the data reported in Table III1 The peak response occurs in the second or third quarter
Similar results although of a smaller magnitude were obtained for the other euro area countries included in the model Confidence spillovers appear to be larger across countries with stronger geographical and trade links Overall the evidence from the estimation of the model supports the existence of a transmission channel for consumer confidence shocks across the euro area However the effects of confidence shocks on foreign consumption are in most cases not statistically significant suggesting that the transmission channel is to foreign confidence rather than
(80) A caveat must be made about the difficulty of identifying truly
exogenous confidence shocks owing to the fact that confidence indicators are largely driven by the same factors which determine consumption
directly to foreign economic activity (81)
These results suggest that confidence shocks play a role in the international business cycle and that there are close interlinkages between confidence indicators across euro area countries This evidence supports the need for coordinated policy action able to boost confidence across euro area countries
III5 Conclusions
In recent years the dynamics of euro area consumer confidence and real private consumption have been very closely related Moreover consumer confidence indicators across the euro area appear to be strongly correlated The strength of the correlation was considerably greater during the crisis period
The evidence of a link between real consumption and consumer confidence is mixed but several studies are supportive of consumer confidence playing a role in determining consumption In addition there is evidence to suggest that shocks to consumer confidence in euro area countries affect confidence in other euro area Member States This is also borne out by results obtained from the estimation of a Global Vector Autoregressive (GVAR) model for eight euro area countries
(81) Similar conclusions are reached by op cit Deacutees and Soares-Brinca
(2013) and Deacutees and Guntner (2014)
38 | Quarterly Report on the Euro Area
Graph III2 Impulse response functions of foreign confidence to a one standard error confidence shock in Germany
Source DG ECFIN
000
005
010
015
020
025
030
035
1 2 3 4 5 6 7 8 9 10 11 12 13 14 15 16 17 18 19 20 21 22 23 24
AT
000
005
010
015
020
025
030
035
040
1 2 3 4 5 6 7 8 9 10 11 12 13 14 15 16 17 18 19 20 21 22 23 24
BE
000
005
010
015
020
025
030
1 2 3 4 5 6 7 8 9 10 11 12 13 14 15 16 17 18 19 20 21 22 23 24
FI
000
005
010
015
020
025
030
1 2 3 4 5 6 7 8 9 10 11 12 13 14 15 16 17 18 19 20 21 22 23 24
FR
-002
-001
000
001
002
003
004
005
006
007
1 2 3 4 5 6 7 8 9 10 11 12 13 14 15 16 17 18 19 20 21 22 23 24
IT
000
005
010
015
020
025
030
035
040
1 2 3 4 5 6 7 8 9 10 11 12 13 14 15 16 17 18 19 20 21 22 23 24
NL
000
005
010
015
020
025
030
035
1 2 3 4 5 6 7 8 9 10 11 12 13 14 15 16 17 18 19 20 21 22 23 24
ES
40 | Quarterly Report on the Euro Area
Editors Jose Eduardo Leandro and Martin Larch
Coordination Plamen Nikolov
Statistical and layout assistance Christos Zavos
Comments on the report would be gratefully received and should be sent to
Jose Eduardo Leandro Director ndash Policy strategy coordination and communication Directorate-General for Economic and Financial Affairs Office CHAR 1566
B-1049 Brussels
Email joseleandroeceuropaeu
or
Martin Larch Head of Unit ndash EMU deepening and macroeconomy of the euro area Directorate-General for Economic and Financial Affairs Office CHAR 1556
B-1049 Brussels
Email martinlarcheceuropaeu
EUROPEAN ECONOMY INSTITUTIONAL SERIES
European Economy Institutional series can be accessed and downloaded free of charge from the following address httpeceuropaeueconomy_financepublicationseeipindex_enhtm Titles published before July 2015 can be accessed and downloaded free of charge from bull httpeceuropaeueconomy_financepublicationseuropean_economyindex_enhtm
(the main reports eg Economic Forecasts) bull httpeceuropaeueconomy_financepublicationsoccasional_paperindex_enhtm
(the Occasional Papers) bull httpeceuropaeueconomy_financepublicationsqr_euro_areaindex_enhtm
(the Quarterly Reports on the Euro Area)
Alternatively hard copies may be ordered via the ldquoPrint-on-demandrdquo service offered by the EU Bookshop httpbookshopeuropaeu
HOW TO OBTAIN EU PUBLICATIONS Free publications bull one copy
via EU Bookshop (httpbookshopeuropaeu) bull more than one copy or postersmaps
- from the European Unionrsquos representations (httpeceuropaeurepresent_enhtm) - from the delegations in non-EU countries (httpeeaseuropaeudelegationsindex_enhtm) - by contacting the Europe Direct service (httpeuropaeueuropedirectindex_enhtm) or calling 00 800 6 7 8 9 10 11 (freephone number from anywhere in the EU) () () The information given is free as are most calls (though some operators phone boxes or hotels may charge you)
Priced publications bull via EU Bookshop (httpbookshopeuropaeu)
ISBN 978-92-79-54335-7
KC-BC-16-030-EN-N
- NEW_IP_index_enpdf
-
- EUROPEAN EconomY institutional SERIES
-
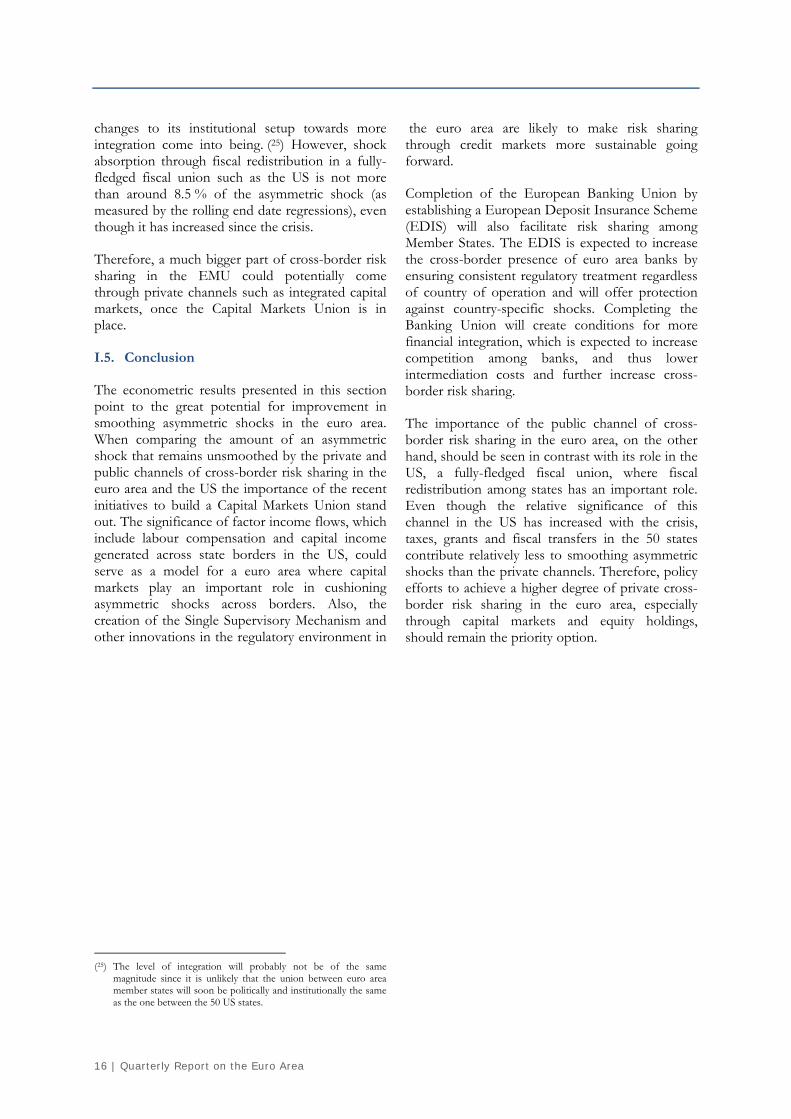

II Financial channels and economic activity in the euro area
Volume 15 No 2 | 19
II1 Introduction
Since the global economic and financial crisis the linkages between macroeconomic and financial developments have been on the frontline of both research and policy making The massive dislocations observed during the crisis have forged a broad consensus that shocks originating in the financial sector can have profound effects on real economic activity and vice versa While the effect of macroeconomic developments on financial conditions is rather straightforward (27) the effect of financial developments on the macroeconomy is more complex and was (until recently) largely omitted in mainstream macroeconomic thinking The interest rate was the only financial variable included in standard macroeconomic models and only to the extent that it was assumed to influence the decisions of economic agents while no genuine role was assigned to the financial sector itself In reality financial intermediation is subject to numerous frictions that can affect macroeconomic developments via diverse transmission channels Given the decisive role of bank credit in financing the euro area economy shocks originating in the banking sector are of crucial importance
This section looks at macro-financial linkages in the euro area to shed light on how financial developments may have contributed to disappointing macroeconomic performance in the
(26) This section was prepared by Narcissa Balta and Bořek Vašiacuteček (27) Jacobson T J Linde and K Roszbach (2005) lsquoExploring
interactions between real activity and the financial stancersquo Journal of Financial Stability Vol 1 No 3 pp 308ndash41
recent past The methodology employed for this purpose is a large-scale Bayesian Vector Autoregression (VAR) that encompasses a wide set of macroeconomic and financial variables (28)
Subsection I2 discusses the importance of the financial system for the real economy and briefly reviews the relevant economic literature Subsection I3 describes the main transmission channels from financial markets to the real economy and defines specific variables that could be used to capture these transmission channels in the euro area Subsection I4 presents the results of the empirical analysis particularly some stylised facts on the co-movement between financial variables and economic activity since the crisis
II2 The financial system and the real economy
Market frictions are normally understood as a wide range of different bottlenecks that do not allow markets to efficiently clear demand and supply Financial frictions are impediments to the smooth functioning of the financial market that do not allow funds to be channelled effectively from creditors to borrowers Therefore they play an important role in the way the financial system affects the real economy Moreover the presence of frictions during periods of financial turmoil undermines the effectiveness of monetary policy
(28) Bańbura M D Giannone and M Lenza (2015) lsquoConditional
forecasts and scenario analysis with vector autoregressions for large cross-sectionsrsquo International Journal of Forecasting Vol 31 Issue 3 pp 739ndash756
This section discusses the nexus between financial and macroeconomic developments in the euro area It draws on key lessons from the literature and provides stylised facts on the main transmission channels through which financial developments have affected real economic activity since the crisis Macro-financial linkages are investigated from an empirical perspective for the euro area as a whole by looking at four key channels i) the interest rate channel ii) the borrower balance sheet channel iii) the bank balance sheet channel and iv) the uncertainty channel
Overall the results suggest that financial variables have significant impact on macroeconomic developments but also that the transmission seems to have changed since the crisis Notably the interest rate channel has helped the modest recovery since 2014 by supporting both private and public consumption The positive boost given to favourable financing conditions in 2015 has been somewhat compensating the adverse effects of the borrower balance sheet channel The bank balance sheet channel and the uncertainty channel play a particularly important role in capturing the weakness in the current rebound in investment (26)
20 | Quarterly Report on the Euro Area
transmission and financial sector stability which via feedback effects can have a detrimental impact on macroeconomic developments For instance hikes in bank funding costs when money markets stop functioning are likely to be transmitted to the lending rates applied to consumers which in turn can have a significant drag on both investment and consumption Also financial frictions increase the likelihood of financial shocks occurring both from the demand and the supply side
Financial shocks are usually deemed to be very persistent and have amplification effects in the sense that even small shocks can produce large and long-lasting effects (29) Graph II1 shows a clear negative correlation between GDP growth and financial distress in the euro area as measured by the Composite Indicator of Systemic Stress (CISS) (30)
Graph II1 Real GDP growth vs Composite indicators of systemic stress
(2000Q1-2016Q1)
Source ECB Eurostat
Since the key role of the financial sector consists in funding economic activity new credit is the main channel of transmission between the financial sector and the macroeconomy Financial shocks occurring on the demand side are usually triggered by an impairment of borrowers balance sheets
(29) Brunnermeier M K T Eisenbach and Y Sannikov (2012)
lsquoMacroeconomics with financial frictions A surveyrsquo National Bureau of Economic Research Working Paper No 18102
(30) The CISS measures contemporaneous stress in the financial system It is an aggregate of five market-specific sub-indices More weight is put when stress prevails in several market segments at the same time thus tracking financial stress of systemic nature
Holloacute D M Kremer and M Duca (2012) lsquoCISS-a composite indicator of systemic stress in the financial systemrsquo European Central Bank Working Paper No (No 1426)
which in turn undermines their creditworthiness and their capacity to invest and consume Financial shocks occurring on the supply side (ie those that originate from within the financial sector) normally manifest themselves through tightening of credit conditions andor credit rationing which again impact real economic activity via the investment behaviour of households and non-financial corporations Graph II2 shows the negative correlation between credit standards for firms and real investment (31)
Graph II2 Investment growth vs credit standards for NFC
(2003Q1-2016Q1)
Source ECB BLS Eurostat
Financial frictions have been fully embedded into macroeconomic models only recently
The neglect of financial sector effects in traditional macroeconomic thinking has its foundation in the famous Modigliani-Miller theorem (32) The theorem argues that the way a firm finances its investment (via debt or via equity) has no effect on its value and thus that their investment decisions are driven primarily by macroeconomic conditions (namely the real interest rate) rather than financial market developments However the validity of the theorem hinges on a set of very restrictive assumptions such as perfect information equal tax treatment for debt and equity etc which are generally not met in practice (33) Financial
(31) Credit standards are measured by the backward looking three
months index from ECB Bank Lending Survey (BLS) (32) Modiglini F and M Miller (1958) lsquoThe cost of capital
corporation finance and the theory of investmentrsquo The American Economic Review Vol 48 No 3 pp 261-297
(33) Morley J (2016) lsquoMacro-finance linkagesrsquo Journal of Economic Surveys forthcoming
-8
-6
-4
-2
0
2
4
6
0
10
20
30
40
50
60
70
80
2000Q1 2003Q1 2006Q1 2009Q1 2012Q1 2015Q1
CISS
GDP y-o-y change(rhs)
-15
-10
-5
0
5
10
-10
-5
0
5
10
15
20
25
30
35
40
2003Q1 2005Q1 2007Q1 2009Q1 2011Q1 2013Q1 2015Q1
Change in creditstandards for NFCInvestment y-o-y change (rhs)
II Financial channels and economic activity in the euro area
Volume 15 No 2 | 21
intermediation typically involves asymmetry of information between borrowers and lenders and potentially costly verification of the borrowers financial situation (34)
The first attempts to include financial frictions in macroeconomic models were based on the insight that the cost of external financing very much depends on the borrowers net worth (35) andor the market value of their collateral (36) In fact changes in asset prices turn out to be a crucial determinant of both the cost of external financing and the value of collateral Moreover a relatively small shock can have a major effect on economic activity through the so-called financial accelerator whereby negative feedback loops between lower assets prices restricted access to credit and lower consumption and investment significantly amplify and prolong the impact on the real economy (37) Real estate which is a typical asset used as collateral by both households and firms establishes a tight link between the housing market and the economy as a whole (38)
While the original theoretical contributions did not explicitly model financial intermediaries (assuming direct lending from investors to borrowers) the inclusion of financial intermediaries (ie the banking sector) implies that financial frictions can appear also on the lendersrsquo side (39) Specifically financial intermediaries can become balance sheet constrained in times of economic and financial stress which affects their funding costs Such shocks to the lendersrsquo side are usually mitigated by central bank intermediation during crisis times (40)
(34) Carlstrom C T and T S Fuerst (1997) lsquoAgency costs net worth
and business fluctuations A computable general equilibrium analysisrsquo The American Economic Review Vol 87 No 5 pp 893-910
(35) Bernanke B and M Gertler (1989) lsquoAgency costs net worth and business fluctuationsrsquo The American Economic Review Vol 79 No 1 pp 14-31
(36) Kiyotaki N and J Moore (1997) lsquoCredit cyclesrsquo Journal of Political Economy Vol 105 Issue 2 pp 211-248
(37) Bernanke B S M Gertler and S Gilchrist (1999) lsquoThe financial accelerator in a quantitative business cycle frameworkrsquo Handbook of Macroeconomics Vol 1 Part C pp 1341-1393
(38) Iacoviello M and S Neri (2010) lsquoHousing market spillovers evidence from an estimated DSGE modelrsquo American Economic Journal Macroeconomics Vol 2 No 2 pp 125-164
(39) Gertler M and N Kiyotaki (2010) lsquoFinancial intermediation and credit policy in business cycle analysisrsquo Handbook of Monetary Economics Vol 3 Issue 3 pp 547-599
(40) Gertler M and P Karadi (2011) lsquoA model of unconventional monetary policyrsquo Journal of Monetary Economics Vol 58 Issue 1 pp 17-34
Despite intensive efforts in recent years the financial sector is still not fully established as a consolidated part of conventional macroeconomic models Structural models augmented by a banking sector and financial markets (41) typically find that financial factors such as bank liquidity constraints are indeed the main drivers of economic fluctuations in both the US and the euro area and that they were the main shock propagator during the global financial crisis (42)
Empirical evidence on macro-financial linkages
There is now a wide consensus that financial cycles are crucial for understanding business cycle fluctuations (43) Numerous empirical studies evaluate the effects of financial shocks on macroeconomic fluctuations Importantly financial factors can both reinforce the transmission of other shocks and be a source of disturbance in their own right
Credit appears to be one of the most studied financial variables in empirical studies due to its established regularities in terms of boom-and-bust behaviour and its link to financial crises and economic downturns (44) Credit spreads play an important role for capital markets-based systems like the US economy For example corporate bond spreads usually increase disproportionately during periods of financial stress (so-called excess bond premiums) which in turn causes economic activity to contract (45) In the euro area where external financing is mostly bank based a crucial role is played by bank lending rates and bank lending volumes Credit supply shocks have been identified
(41) Christiano L J R Motto and M Rostagno (2010) lsquoFinancial
factors in economic fluctuationsrsquo European Central Bank Working Paper No 1192
(42) Gerke et al (2013) and Wieland et al (2015) provide detailed comparison exercise for different macrofinancial models
Gerke R M Jonsson M Kliem M Kolasa P Lafourcade A Locarno K Makarski and P McAdam (2013) lsquoAssessing macro-financial linkages A model comparison exercisersquo Economic Modelling Vol 31 pp 253-264
Wieland V E Afanasyeva M Kuete and J Yoo (2015) lsquoNew methods for macro-financial model comparison and policy analysisrsquo mimeo
(43) Borio C (2012) lsquoThe financial cycle and macroeconomics what have we learntrsquo Bank for International Settlements Working Papers No 395
(44) Balke N S (2000) lsquoCredit and economic activity credit regimes and nonlinear propagation of shocksrsquo Review of Economics and Statistics Vol 82 No 2 344-349
(45) Gilchrist S and E Zakrajšek (2012) lsquoCredit spreads and business cycle fluctuationsrsquo The American Economic Review Vol 102 No 4 pp 1692-1720
22 | Quarterly Report on the Euro Area
as important determinants of the increase in lending rates and the decline in lending volumes during the recent crisis (46) Bank lending represents the main transmission mechanism in the euro area
The evidence available indicates that the impact of financial shocks on the macroeconomy is lsquostate dependentrsquo ie the response of economic activity inflation and credit to financial shocks is stronger during periods of stress This is well documented for both the euro area and the US (47) Moreover during periods of high systemic stress financial shocks tend to have both a larger magnitude and a greater impact on real activity (48) Notably a single indicator of systemic stress such as the CISS for the euro area has been found to explain a significant part of macroeconomic developments especially due to episodes of elevated systemic stress such as the global financial crisis and the euro area debt crisis (49)
While studies on financial and business cycle have been popular for some time there has been much less investigation into macro-financial linkages between countries Existing evidence indicates that such linkages exist but their intensity varies both across time and across countries Specifically it has been documented that the observed heterogeneity is mainly due to country-specific characteristics which lead to international spillovers having a differentiated impact across countries (50) Such heterogeneity seems also to be present within the euro area
(46) Moccero D N M D Pariegraves and L Maurin (2014) lsquoFinancial
Conditions Index and identification of Credit Supply Shocks for the Euro Arearsquo International Finance Vol 17 Issue 3 pp 297-321
(47) Hubrich K and R J Tetlow (2015) lsquoFinancial stress and economic dynamics the transmission of crisesrsquo Journal of Monetary Economics Vol 70 pp 100-115
Prieto E S Eickmeier and M Marcellino (2016) lsquoTime variation in macro‐financial linkagesrsquo Journal of Applied Econometrics forthcoming
Silvestrini A and A Zaghini (2015) lsquoFinancial shocks and the real economy in a nonlinear world a survey of the theoretical and empirical literaturersquo Journal of Policy Modeling Vol 37 pp 915ndash929
(48) Hartmann P K Hubrich M Kremer and R J Tetlow (2015) lsquoMelting down Systemic financial instability and the macroeconomyrsquo mimeo
(49) Kremer M (2015) lsquoMacroeconomic effects of financial stress and the role of monetary policy a VAR analysis for the euro arearsquo International Economics and Economic Policy Vol 13 Issue 1 pp 1-34
(50) Ciccarelli M E Ortega and M T Valderrama (2016) lsquoCommonalities and cross-country spillovers in macroeconomic-financial linkagesrsquo The BE Journal of Macroeconomics Vol 16 Issue 1 pp 231-275
II3 Transmission channels from financial to macro developments
In spite of the broad consensus about the existence of macro-financial linkages the identification of the transmission channels is still a subject of debate There are different ways to classify the channels through which the financial sector might affect macroeconomic developments The important distinction applied in this section is whether the linkages are related to the balance sheets of borrowers or lenders At the same time the financial channels are also closely related to monetary transmission which affects their functioning (51) This subsection aims to better define the individual transmission channels in the euro area
The interest rate channel illustrates how money market rates affect the overall financing costs of the banking sector the price of credit and consequently consumption and investment decisions This channel is closely related to monetary policy decisions as they directly affect the funding costs of banks Moreover at the zero lower bound when the central bank uses other instruments besides short-term interest rates to conduct monetary policy this channel is more complex and difficult to assess
Thus in the analysis below the interest rate channel will be captured by variables that are affected by monetary policy decisions (Graph II3) In the euro area the most frequently used indicator directly affected by the ECBrsquos policy rates is the short-term interbank interest rate (EONIA) While the effect of monetary policy actions on short-term rates is rather quick there is also a delayed effect on long-term interest rates The long-term rates are of specific relevance in the current time as short-term rates are at the zero lower bound and monetary policy aims to affect long rates directly While long-term rates are commonly defined by the yield on respective sovereign bonds in the euro area this applies to a pool of euro area sovereigns As the yields diverge across sovereigns since the global financial crisis long-term rates in the euro area have become disconnected from short-term rates Since the ECB has employed diverse unconventional measures that affect the
(51) See for instance Basel Committee on Banking Supervision (2011)
lsquoThe transmission channels between the financial and real sectors a critical survey of the literaturersquo BCBS Working Paper No 18
II Financial channels and economic activity in the euro area
Volume 15 No 2 | 23
financial system additional measures need to be used to track their effect namely the shadow rate which is a factor model-based estimate of the short-term interest rate unconstrained by the ZLB (52) Likewise the excess liquidity defined as the liquidity held by the euro area banking sector in excess of the aggregate needs arising from minimum reserve requirements and autonomous factors is another quantitative-based indicator of the monetary policy stance as it is driven by the ECBrsquos refinancing operations
Graph II3 shows the dynamics of the variables described above in the period Q1-1996 - Q1-2016 which suggest that monetary conditions have been very supportive in recent years While short-term interest rates attained the ZLB monetary easing through unconventional measures is reflected in a significant decline in the shadow rate as well as long-term rates
Graph II3 Interest rate channel (2000Q1-2016Q1 )
Source Eurostat Bloomberg Reserve Bank of New Zealand
The borrower balance sheet channel reflects the fact that it is the net worth of borrowers that determines the external finance premium ie the opportunity cost of borrowing over using internal savings In other words it is the value of borrowersrsquo collateral that affects their credit conditions As indicated above fluctuations in
(52) There different shadow rates available all being subject of
significant model uncertainty The shadow rate used is based on Krippner (2012) and available from the Reserve Bank of New Zealand website
Krippner L (2012) lsquoMeasuring the stance of monetary policy in zero lower bound environmentsrsquo Economics Letters Vol 118 Issue 1 pp 135ndash138
asset prices can affect the ability of non-financial corporations and households to borrow and thus their investment and spending decisions While monetary policy commonly does not target asset prices its actions can affect the valuation of assets used as collateral which affects the credit available for investment and consumption spending (53) Whereas the previous discussion focuses on the demand side of credit the borrower balance sheet channel affects also the supply of credit Namely weak borrower balance sheets might induce credit rationing by the lenders and affect overall credit conditions
The borrower balance sheet channel can be captured mainly by variables that reflect the risks related to the balance sheets of firms and households as borrowers from the banking sector or from capital markets While there are no readily available direct measures of the quality of private balance sheets comparable across countries asset prices can be considered as indicative of their quality as they give the value of collateral for loans and of equity Therefore house prices and stock prices are generally used in the analysis to track this channel
Graph II4 Borrower balance sheet channel
(2000Q1-2016Q1)
Source Bloomberg BIS
Graph II4 suggests that developments in house prices and stock prices have been quite
(53) There is empirical evidence especially for the US stressing the
importance of asset prices and different credit spreads as leading indicator of economic activity eg Stock and Watson (2003) Stock J H and M W Watson (2003) lsquoForecasting output and inflation the role of asset pricesrsquo Journal of Economic Literature Vol 41 No 3 pp 788-829
-10
-5
0
5
10
15
20
25
2000Q1 2004Q1 2008Q1 2012Q1 2016Q1
Short-term interest rateLong-term interest rateShadow rate (Krippner)ECB Excess Liquidity Index
-6
-4
-2
0
2
4
6
8
10
-60
-40
-20
0
20
40
60
2000Q1 2002Q3 2005Q1 2007Q3 2010Q1 2012Q3 2015Q1
MSCI EURO Index y-o-y change
Housing prices y-o-y change
24 | Quarterly Report on the Euro Area
disconnected in recent years Specifically while house prices only started to recover in 2014 stock prices peaked in early 2015 and experienced a downward correction since then
The bank balance sheet channel relates to the fact that how much a bank lends depends on its own balance sheet and the different risks involved in its business model External developments (including monetary policy actions but also longer-term factors such as financial regulation and innovations in the banking sector) may affect bank liabilities (the supply of loanable funds and also bank funding costs) and in turn assets (supply of credit and the lending cost) (54) Bank lending is determined by banksrsquo business models it usually increases with the increase in leverage in the economy while deleveraging episodes may significantly hamper lending activities This makes leverage highly pro-cyclical (55) Importantly the impact of bank balance sheets on the real economy can be more pronounced in the euro area than in capital-market based systems as alternative forms of financing are relatively undeveloped
The bank balance sheet channel can thus be illustrated by variables such as banking leverage the stock of non-performing loans banksrsquo funding costs or the price of Credit Default Swaps (CDS) However reliable data for the euro area are relatively short available only for the period since the beginning of the crisis Indeed the lack of knowledge about the quality of bank balance sheets was an important aspect of the euro area financial crisis and a reason for the implementation of the Asset Quality Review (AQR) by the ECB in 2014 Therefore for the analysis in this section measures which directly track the supply of credit have been used instead (56) Namely the flow of credit as measured by the credit impulse (ie the change in new credit granted by the banking sector as a percentage of GDP) the stock of credit on banksrsquo balance sheet as measured by total economy credit as a percentage of GDP and the price of credit as measured by the Composite Financing Conditions Indicator (CFCI) for non-financial corporations
(54) Bernanke B and A Blinder (1988) lsquoCredit money and aggregate
demandrsquo the American Economic Review Vol78 No 2 pp 435ndash439 (55) Adrian T and H S Shin (2010) lsquoLiquidity and leveragersquo Journal of
Financial Intermediation Vol 19 Issue 3 pp 418-437 (56) In practice the lending volumes and rates can be affected both by
supply and demand side
which (assuming a constant mark-up) proxies bank funding costs (57)
Graph II5 shows that there is a negative correlation between the credit impulse and credit as a percentage of GDP Thus during downturns the flow of new credit declines while the ratio of credit to GDP increases due to the collapse of GDP The credit impulse indicator shows that the supply of new credit has been fairly limited since the onset of the global financial crisis The CFCI tracks the ECB policy rates rather closely with the exception of the euro area sovereign debt crisis episode (2011-2012) when financing costs increased due to idiosyncratic increases in some Member States reflecting financial market fragmentation
Graph II5 Bank balance sheet channel (2000Q1-2016Q1)
Source Capital Economics BIS DG ECFIN
While the previous channels are related to the quality of balance sheets either on the borrower or the lender side some shocks can originate in the overall financial system Examples are liquidity shocks or confidence shocks These shocks work both via the balance sheets but also by directly altering agents decisions through precautionary motives affecting both investment and consumption behaviour These mechanisms are defined as the uncertainty channel (58)
(57) For more details on CFCI calculations see European Commission
(2013) Drivers of diverging financing conditions across Member States Quarterly Report on the Euro Area Vol12 No1
(58) Bloom (2009) point to uncertainty shocks (that might be related but also unrelated to the financial system) as a crucial driver of economic dynamics Recently Caldara et al (2016) argue for the needs to distinguish uncertainty shocks from financial shocks while both of them are important source of macroeconomic
-8
-6
-4
-2
0
2
4
6
8
10
2000Q1 2003Q1 2006Q1 2009Q1 2012Q1 2015Q1
Total credit on GDP y-o-y change
Credit impulse (new crediton GDP y-o-y change)
Composite financingconditions indicator
II Financial channels and economic activity in the euro area
Volume 15 No 2 | 25
The uncertainty channel is captured by variables reflecting the different types of uncertainty that can affect the economy One type is commonly related to increased volatility in financial markets Given a high degree of global interconnectedness the euro area economy can be affected by uncertainty related to global financial developments which is usually measured by the implied volatility of SampP 500 index options (VIX) (59) The euro area specific stress in the financial system is measured through the ECBrsquos Composite Indicator of Systemic Stress (CISS)
Another type of uncertainty is linked to swings in business and consumer confidence Variations in the confidence of euro area households and non-financial firms are illustrated through the European Commissionrsquo confidence indicator the Economic Sentiment Indicator (ESI) which is based on data collected through business and consumer surveys However the indicator exhibits a very high contemporaneous correlation with actual GDP growth indicating that its dynamics are likely to reflect very accurately economic conditions rather than information related to exogenous changes in confidence
Finally unexpected outcomes of economic policy decisions can lead to policy uncertainty which in turn can have adverse effects on the savings and investment behaviour of firms and households Policy uncertainty is illustrated through an indicator based on newspaper coverage of uncertainty-generating events (60)
Graph II6 indicates that there is an apparent co-movement among these indicators even if they measure different types of uncertainty While economic sentiment has been gradually improving and uncertainty related to financial markets has eased the policy uncertainty affecting the euro area is still relatively high
fluctuations separately the Great Recession was likely outcome of the toxic interaction between the two
Bloom N (2009) lsquoThe impact of uncertainty shocksrsquo Econometrica Vol 77 Issue 3 pp 623-685
Caldara D C Fuentes-Albero S Gilchrist and E Zakrajšek (2014) lsquoThe macroeconomic impact of financial and uncertainty shocksrsquo European Economic Review forthcoming
(59) The VIX is calculated by the Chicago Board Options Exchange (CBOE)
(60) Baker S R N Bloom and S J Davis (2015) lsquoMeasuring economic policy uncertaintyrsquo National Bureau of Economic Research Working Paper No 21633 Data source wwwpolicyuncertaintycom
Graph II6 Uncertainty channel (2000Q1-2016Q1)
Source Chicago Board of Exchange ECB wwwpolicyuncertaintyorg
II4 Financial developments and economic activity
This sub-section provides stylised facts on the transmission channels defined above and show whether and how financial developments have affected the real side of the euro area economy since the crisis (namely consumption investment unemployment and long-term interest rates)
While financial variables are available in real time macroeconomic variables are normally released with lags Therefore conditioning macroeconomic forecasts on observed financial developments (ie a projection of macro variables on the observed paths of financial variables) can improve forecasts as more informative data are taken into account Several empirical studies have shown that financial variables can improve macroeconomic forecasts (61)
The methodology underlying this this section is a large-scale Bayesian VAR with 35 macroeconomic
(61) Stock and Watson (2003) provide a seminar contribution on the
role of financial variables namely asset prices for GDP and inflation forecast concluding that different financial variables allow macroeconomic forecasting in different times Espinosa et al (2012) document using standard VAR approach that financial variables improve GDP forecast for the euro area especially in the real time when numerous financial variables are available ahead of the macroeconomic releases
Stock J H and M W Watson (2003) lsquoForecasting output and inflation the role of asset pricesrsquo Journal of Economic Literature Vol 41 No 3 pp 788-829
Espinoza R F Fornari and M J Lombardi (2012) lsquoThe role of financial variables in predicting economic activityrsquo Journal of Forecasting Vol 31 No 1 pp 15-46
0
50
100
150
200
250
300
0
10
20
30
40
50
60
70
80
2000Q1 2002Q3 2005Q1 2007Q3 2010Q1 2012Q3 2015Q1
VIX
CISS
ESI (rhs)
Policy uncertainty (rhs)
26 | Quarterly Report on the Euro Area
and financial variables (62) The model is estimated for the sub-period Q1-2000 - Q4-2011 which covers both normal and crisis times but does not include some of the most important unconventional monetary policy measures Given the estimated past correlations a counterfactual path for the macroeconomic and financial variables (ie a distribution of conditional forecasts) can be obtained for the entire period Q1-2000 - Q4-2015 conditional on observed real GDP and inflation in the baseline case The deviations of the observed developments of financial variables from this counterfactual path can be interpreted as evidence of instability in the relationship between financial variables and economic activity (as measured by GDP growth and inflation) since the crisis
Subsequently the conditional set from the baseline case (including only real GDP and inflation) is extended by financial and uncertainty variables corresponding to each transmission channel described above (63)
Some recent developments are puzzling
Graph II7 shows the counterfactual paths of the main GDP components producer prices the unemployment rate and the long-term interest rate conditional on observed economic activity (real GDP and inflation) It also shows the conditional forecasts for the balance sheet variables of households and firms when only real GDP and inflation are taken into account in the conditioning set
(62) Alternative strand of literature using rich set of data in order to
nowcast or forecast employs dynamic factors models where data dimension is reduced in a first step by factor estimation with common factors being consequently used in the forecasting exercize see eg Giannone et al (2008) Bellego and Ferrara (2012) find using factor-augmented probit model that financial variables allow tracking better recession periods in the euro area (in the pre-crisis period) with optimal lead of financial variables over recession of around one year
Giannone D L Reichlin L and D Small (2008) lsquoNowcasting the real-time informational content of macroeconomic datarsquo Journal of Monetary Economics Vol 55 Issue 4 pp 665ndash676
Belleacutego C and L Ferrara (2012) lsquoMacro-financial linkages and business cycles A factor-augmented probit approachrsquo Economic Modelling Vol 29 pp 1793-1797
(63) For more details on the methodology see Box IV1 in European Commission (2015) lsquoInvestment dynamics in the euro area since the crisisrsquo Quarterly Report on the Euro Area Vol 14 No 1 pp 35-43
Bańbura M D Giannone and M Lenza (2015) lsquoConditional forecasts and scenario analysis with vector autoregressions for large cross-sectionsrsquo International Journal of Forecasting Vol 31 Issue 3 pp 739ndash756
The results suggest that private consumption was unusually low during the period of the euro area debt crisis and deleveraging (2012-2013) while it overshot during the recent recovery (from 2014 onward) Investment behaved in line with historical correlations during both downturn episodes (2008-2009 and 2012-2013) and was weak during the deleveraging phase because overall output growth was weak However its recent recovery (since 2014) has been more subdued than what the pace of economic activity would have predicted the observed investment path is positioned on the lower tail of the distribution of conditional forecasts) (64)
Large deleveraging pressures in the public sector have led to a significant decline in the euro area aggregate government consumption over the period 2011-2012 However this decline had almost been reversed by the end of 2014 with public consumption starting to overshoot from 2015 onwards (relative to its counterfactual path obtained through conditioning on output growth) reflecting the aggregate euro area fiscal stance which started to turn mildly expansionary
Moreover the results show that several variables capturing price and balance sheet developments are still at odds with historical patterns In particular producer prices house prices long-term interest rates and loans to firms and households undershoot the distribution of the conditional forecasts On one side this underlines that the recent recovery is characterized by a historically low inflation environment and loose monetary conditions pushing the long-term rates down On the other side the ongoing balance sheet adjustment is translating into very weak credit dynamics due to unprecedented deleveraging pressures
Graph II8 illustrates the zero lower bound constraint on monetary policy rates and the subsequent break in the correlation of economic activity with the two measures of monetary policy
(64) There is some relative instability in the estimated correlations over
the sample period notably pre-crisis vs crisis years However it does not significantly affect the result on the unusual weakness in investment recovery since 2014 The article lsquoInvestment dynamics in the euro area since the crisisrsquo Quarterly Report on the Euro Area Vol 14 No 1 pp 35-43 found that estimating the past correlations only with the sample for the pre-crisis period the amplitude of the investment fall during the first downturn (2008-2009) would also be slightly underestimated by the conditional forecasts
II Financial channels and economic activity in the euro area
Volume 15 No 2 | 27
rates since 2012 Among all variables the consumer and business confidence indicator (ESI) comes out as having the strongest contemporaneous correlation with economic activity during the crisis
In the consecutive analysis the conditioning dataset (including only real GDP and inflation in the baseline) is augmented by financial variables corresponding to each transmission channel
hellip different channels play an important role at different stages since the crisis
The interest rate channel (Graph II9 upper panel) seems to better account for the pattern of consumption during the recent recovery (compared to the baseline) This channel which reflects mainly monetary conditions suggests that monetary easing implemented since 2014 by means of additional unconventional measures (namely the targeted long-term refinancing operations (TLTRO) the asset-backed securities purchasing program (ABSPP) and the forthcoming public
securities purchase program (PSPP)) have translated into a further decline in the long-term interest rate and the shadow policy rate It also reflects an increase in excess liquidity which has had a very benign effect on the recent recovery However producer prices developments (PPI) still appear unusually subdued Likewise including information capturing the interest rate channel does not help explain the dismal performance of consumption during the deleveraging phase (2012-2013) or the persistent weakness of credit dynamics Therefore these developments seem to be determined also by drivers other than monetary conditions
The borrowers balance sheet channel (Graph II9 lower panel) captures in turn the exceptional deleveraging developments of 20122013 but clearly underestimates the pace of the recent recovery This finding suggests that strained balance sheets of households and firms represented the main weight on the recovery at the time of euro area sovereign debt crisis However whereas a mild recovery started in the euro area in 2014 private
Graph II7 Conditional forecasts based on real GDP and inflation (1) (2000Q1-2015Q4 y-o-y growth)
Misalignments of financial and real variables with output growth since the crisis
(1) Shades of orange distribution of the conditional forecasts in the BVAR in levels excluding the lower and higher 5 quantiles Green line actual values The variables are all reported in terms of annual percentage changes except for the unemployment rate and the long-term interest rate which are in levels Conditioning assumptions real GDP and HICP Source DG ECFIN MATLAB codes replication files of the methodological paper (Banbura et al 2015)
Government consumption
2005 2010 2015-2
0
2
4Real consumption
2005 2010 2015-5
0
5Real investment
2005 2010 2015-20
-10
0
10
Unemployment rate
2005 2010 20150
5
10
15PPI ex const
2005 2010 2015-50
0
50House prices
2005 2010 2015-10
0
10
Long-term i r
2005 2010 20150
5
10Loans to firms
2005 2010 2015-10
0
10
20Loans to households
2005 2010 2015-5
0
5
10
28 | Quarterly Report on the Euro Area
balance sheets still did not improve much In fact when the borrower balance sheet channel is taken into account observed consumption overshoots the conditional forecast even by a higher margin than in the baseline scenario and real investment seems to be on the upper side as well This suggests that the borrower balance sheet channel should have led to more subdued dynamics of both consumption and investment than what has been observed in 2014 and 2015 indicating that other channels have been somewhat compensating the adverse effects of this channel
The bank balance sheet channel (Graph II10 upper panel) improves the forecast of investment since 2014 and reduces the uncertainty around the median for some variables such as consumption unemployment and long-term interest rate The good fit of investment dynamics indicates a strong correlation of investment with total economy credit developments both in terms of flows and stocks
Interestingly the bank balance sheet information namely the total economy credit as percentage of GDP (including credit to public sector) the private sector credit impulse and the price of credit for the private sector cannot capture the weak observed dynamics of outstanding loans to firms and households This shows that the private deleveraging process has been much stronger than the public sector deleveraging making private credit developments disconnected from GDP
growth (65) Therefore while the recovery in real activity has been rather weak the private credit dynamics have been even weaker Furthermore the modest recovery does not facilitate passive deleveraging (a decrease in the relative debt burden due to a growing economy ie denominator effect) and feeds the active deleveraging (a decrease of absolute level of debt ie nominator effect)
Finally the current long-term interest rate seems very low even when the financing costs for non-financial corporations (which also attained historical minima) are taken into account This underlines the importance of the ECBrsquos measures that imply very easy financing conditions in the foreseeable future
Last but not least the uncertainty channel (Graph II10) seems to improve the conditional forecast over the baseline in the same spirit as the bank balance sheet channel For example there is a good fit of investment indicating a strong correlation of investment with confidence and financial stress measures Equally the rebound in private consumption seems to be well captured by the uncertainty channel indicating that the recent decrease in financial markets stress has also been an important driver for consumption However in general the uncertainty channel is likely to be implicitly included in the bank balance sheet
(65) GDP is a denominator of the credit indicators in bank balance
sheet channel
Graph II8 Conditional forecasts based on real GDP and inflation (1) (2000Q1-2015Q4 y-o-y growth)
Business and consumer confidence and short-term interest rates
(1) Shades of orange distribution of the conditional forecasts in the BVAR in levels excluding the lower and higher 5 quantiles Green line actual values The variables are all reported in terms of annual percentage changes except for the unemployment rate and the long-term interest rate which are in levels Conditioning assumptions real GDP and HICP Source DG ECFIN MATLAB codes replication files of the methodological paper (Banbura et al 2015)
Economic sentiment
2005 2010 2015-15
-10
-5
0
5
10Short-term i r
2005 2010 2015-4
-2
0
2
4
6
8Shadow short-term interest rate
2005 2010 2015-6
-4
-2
0
2
4
6
II Financial channels and economic activity in the euro area
Volume 15 No 2 | 29
channel For example in periods of high uncertainty bank funding costs increase (bank balance sheet channel) and firms with weaker balance sheets cannot obtain credit for new loans (borrower balance sheet channel)
Overall the findings above suggest that while there is clear evidence of the transmission of monetary policy measures on financial variables and from financial variables to consumer lending rates the evidence on the effects on real activity is more complex with different channels playing an important role at different stages of the crisis The interest rate channel has helped the modest recovery since 2014 by supporting both public and private consumption growth and by partially compensating the balance sheet channel for both borrowers and banks The results in Graph II9 (lower panel) can be interpreted as showing that in the absence of massive monetary easing given the high level of debt in the economy and the wealth effects associated with house and asset prices decreases both private and public consumption growth could have been much more subdued than what it is currently observed
Graph II10 (both panels) illustrate the importance of the bank balance sheet and the uncertainty channel for capturing investment dynamics Weak investment growth is well captured both by credit developments as captured through the bank balance sheet channel and confidence effects through the uncertainty channel Real economic activity as measured by GDP growth while playing an important role does not seem to fully explain the subdued growth in investment since 2014 (Graph II7)
II5 Conclusions
The section discusses the nexus between financial and macroeconomic developments drawing some
lessons from the literature and providing some stylised facts on the main transmission channels through which financial developments have affected real economic activity since the crisis
While there is clear evidence of the transmission of monetary policy measures on financial variables and from financial variables to consumer lending rates the evidence on the effects on real activity is more complex with different channels playing an important role at different stages of the crisis
The state of private balance sheets seems to have significantly contributed to the poor performance of consumption during the euro area debt crisis and high debt levels still weigh on growth However given the still high level of debt the current mild recovery should be seen as a rather positive outcome The analysis suggests that easy monetary conditions seem to represent an important driver of the current recovery Another driver seems to be the balance sheets of banks which have gradually improved and allow better transmission of easy monetary conditions to the lending rates
Given the still high levels of debt in the economy and the wealth and confidence effects associated with house and asset prices corrections both private and public consumption growth could have been much more subdued than what it is currently observed were it not for the exceptional easing of monetary conditions
Unfortunately the recovery is still not strong enough to facilitate the deleveraging process The stock of debt and the ongoing deleveraging combined with adverse confidence effects still represent major impediments for a stronger recovery in investment Consequently there is a need to implement policy measures that allow dealing effectively with the debt overhang notably an effective framework for non-performing loans resolution
30 | Quarterly Report on the Euro Area
Graph II9 Conditional forecasts based on variables capturing the interest rate channel and borrower balance sheet channel (1)
(2000Q1-2015Q4 y-o-y growth)
Interest rate channel
Borrower balance sheet channel
(1) Shades of orange distribution of the conditional forecasts in the BVAR in levels excluding the lower and higher 5 quantiles Green line actual values The variables are all reported in terms of annual percentage changes except for the unemployment rate and the long-term interest rate which are in levels Conditioning assumptions interest rate channel ESI HICP the short-term interest rate the long-term interest rate the shadow interest rate and the ECB excess liquidity measure Conditioning assumptions borrower balance sheet channel ESI HICP house prices stock prices and outstanding loans to households and firms Due to the high contemporaneous correlation between real GDP growth and the ESI indicator the ESI indicator contains the same forecasting information as real GDP ESI indicator is used in the conditioning set instead of real GDP variable in order to also illustrate conditional forecasts for real GDP Source DG ECFIN MATLAB codes replication files of the methodological paper (Banbura et al2015)
Real GDP
2005 2010 2015-10
-5
0
5Government consumption
2005 2010 2015-2
0
2
4Real consumption
2005 2010 2015-5
0
5
Real investment
2005 2010 2015-20
-10
0
10Unemployment rate
2005 2010 20150
10
20PPI ex const
2005 2010 2015-50
0
50
House prices
2005 2010 2015-10
0
10
20Loans to firms
2005 2010 2015-10
0
10
20Loans to households
2005 2010 2015-10
0
10
20
Real GDP
2005 2010 2015-10
-5
0
5Government consumption
2005 2010 2015-2
0
2
4Real consumption
2005 2010 2015-5
0
5
Real investment
2005 2010 2015-20
-10
0
10Unemployment rate
2005 2010 20150
5
10
15PPI ex const
2005 2010 2015-50
0
50
Shadow short-term interest rate
2005 2010 2015-5
0
5
10Short-term i r
2005 2010 2015-5
0
5
10Long-term i r
2005 2010 20150
5
10
II Financial channels and economic activity in the euro area
Volume 15 No 2 | 31
Graph II10 Conditional forecasts based on variables capturing the bank balance sheet channel and uncertainty channel (1)
(2000Q1-2015Q4 y-o-y growth) Bank balance sheet channel
Uncertainty channel
(1) Shades of orange distribution of the conditional forecasts in the BVAR in levels excluding the lower and higher 5 quantiles Solid black line point estimate of the conditional forecasts in the BVAR in differences which is computed as the median of the distribution of the conditional forecasts in this model Green line with crosses actual values The variables are all reported in terms of annual percentage changes except for the unemployment rate and the long-term interest rate which are in levels Conditioning assumptions for the bank balance sheet channel ESI HICP the credit impulse the private credit volumes (debt-to-GDP ratio) and bank lending rates for households and firms (CFCI) Conditioning assumptions uncertainty channel ESI HICP the policy uncertainty indicator the CISS and the VIX Due to the high contemporaneous correlation between real GDP growth and the ESI indicator the ESI indicator contains the same forecasting information as real GDP ESI indicator is used in the conditioning set instead of real GDP variable in order to also illustrate conditional forecasts for real GDP Source DG ECFIN MATLAB codes replication files of the methodological paper (Banbura et al 2015)
Real GDP
2005 2010 2015-10
-5
0
5Government consumption
2005 2010 2015-2
0
2
4Real consumption
2005 2010 2015-2
0
2
4
Real investment
2005 2010 2015-20
-10
0
10Unemployment rate
2005 2010 20150
5
10
15PPI ex const
2005 2010 2015-50
0
50
Loans to firms
2005 2010 2015-10
0
10
20Loans to households
2005 2010 2015-10
0
10
20Long-term i r
2005 2010 20150
2
4
6
Real GDP
2005 2010 2015-10
0
10Government consumption
2005 2010 2015-2
0
2
4Real consumption
2005 2010 2015-5
0
5
Real investment
2005 2010 2015-20
0
20Unemployment rate
2005 2010 20150
5
10
15PPI ex const
2005 2010 2015-50
0
50
Loans to firms
2005 2010 2015-10
0
10
20Loans to households
2005 2010 2015-10
0
10
20Long-term i r
2005 2010 20150
5
10
III Confidence spillovers in the euro area
Volume 15 No 2 | 33
III1 Introduction
During the recent crisis euro area private consumption fell substantially This was accompanied by a sharp decline in consumer confidence which many observers have identified as a key factor contributing to the persistence of the slowdown In fact the onset of the crisis coincided with an abrupt unwinding of imbalances that is of economic trends that turned out to be unsustainable and which led to a significant adjustment of expectations Both consumption growth rates and confidence levels have been improving since the start of 2013
There is some (mixed) evidence to suggest that fluctuations in consumer confidence affect the dynamics of private consumption (67) On the basis of this assumption and taking into account the unprecedented extent of the most recent crisis it is important to determine whether and to what extent confidence shocks spill over between countries This is particularly relevant in relation to the euro area where close trade and financial links and common institutional features can lead to the rapid propagation of shocks In addition confidence spillovers can be an important aspect to consider when discussing how to improve macroeconomic policymaking in a common currency area
This section reviews the evidence on the link between consumer confidence and private consumption and on cross-border confidence spillovers and presents some analysis of the transmission of confidence shocks across the euro area It is a follow-up to analysis discussed in
(66) This section was prepared by Francesca DrsquoAuria (67) See for a discussion Ludvigson SC 2004 lsquoConsumer
confidence and consumer spendingrsquo Journal of Economic Perspectives Vol 18(2) pp 29-50
previous issues of the Quarterly Report on the Euro Area (QREA) (68)
III2 Recent trends in consumer confidence and private consumption in the euro area
Graph III1 shows the evolution over the period 1995Q2-2016Q1 of euro area real private consumption and consumer confidence The latter is measured by the Consumer Confidence Indicator constructed by the European Commission as part of the Joint Harmonised EU Programme of Business and Consumer Surveys (BCS) (69)
There is close co-movement between the two variables Both real consumption growth and consumer confidence showed the greatest deterioration in the first quarter of 2009 and during the sovereign debt crisis They have been on a recovery path since early 2013 with consumer confidence reaching levels above the euro area long-term average since the first quarter of 2014
The relationship between consumer confidence and private consumption is much debated in the literature From a theoretical perspective there are two main competing theories One view is that confidence indicators can help predict the dynamics of consumption as they convey information about future economic conditions Another theory is that the link between the two variables can be interpreted in terms of lsquoanimal
(68) DrsquoAuria F lsquoCross-border spillovers in confidencersquo Quarterly
Report on the Euro Area (2013) Vol 12(3) pp26-30 DrsquoAuria F S Linden D Monteiro J in lsquot Veld and S Zeugner
lsquoCross-border spillovers in the euro arearsquo Quarterly Report on the Euro Area (2014) Vol 13(4) pp7-22
(69) See European Commission (2016) lsquoA user guide to the Joint Harmonised EU Programme of Business and Consumer Surveysrsquo for details on the construction of the indicators
In recent years there has been close co-movement between consumer confidence and private consumption in the euro area During the crisis in particular consumer confidence was identified by many commentators as a driving factor in its persistence as expectations about a sustainable path of economic growth were adjusted significantly In view of the unprecedented extent of the crisis the question of whether and to what extent changes in consumer confidence in one country could spill over to other countries was also raised This section discusses the relationship between consumer confidence and consumption and reviews the evidence of consumer confidence spillovers between euro area countries We conclude that there is some evidence to suggest that confidence shocks are transmitted between countries This conclusion is corroborated by results from the estimation of a Global Vector Autoregressive (GVAR) model for a number of euro area countries (66)
34 | Quarterly Report on the Euro Area
spiritsrsquo as confidence indicators capture fluctuations in beliefs which in turn affect consumption (70) In both cases the essence of confidence indicators is to gauge expectations ndash irrespective of how they are formed ndash about the future course of the economy which then have a knock-on effect on current consumer behaviour
Graph III1 Confidence and private consumption euro area
(1995Q2-2016Q1 q-o-q change)
Source Eurostat and DG ECFIN calculations based on EU Business and Consumer Surveys
Several studies test empirically the link between consumer confidence and private consumption A number of them find evidence in support of a strong correlation between consumer confidence and consumption (71)
However as confidence and consumption are to a large extent determined by the same factors other studies try to assess whether confidence indicators carry information beyond economic fundamentals The evidence on this issue is mixed although several studies conclude that confidence indicators play a significant role There is some evidence to suggest that while part of the information conveyed by confidence indicators is also captured by other variables (eg past consumption income and interest rates) confidence measures have an additional predictive power for the future path of
(70) See Barsky and Sims (2012) for a discussion of the different
theoretical approaches to the role of confidence Barsky R B and ER Sims (2012) lsquoInformation animal spirits and the meaning of innovations in consumer confidencersquo American Economic Review 102(4) pp 1343-1377
(71) See for example Carroll C J Fuhrer and D Wilcox (1994) lsquoDoes consumer sentiment forecast household spending If so whyrsquo American Economic Review Vol 84 pp 1397-1408
consumer spending (72) Moreover some papers find that confidence indicators have a stronger predictive power during periods of large economic fluctuations (73)
III3 The existing evidence on confidence spillovers
On the assumption that a causal relationship between consumer confidence and private consumption exists it is important to determine whether and to what extent changes in consumer confidence in one country affect confidence (and thus consumption) in others
There is some evidence to support the existence of confidence spillovers This pertains both to confidence shocks originating in the US and being transmitted to the euro area and shocks which occur in one euro area country and spill over to other euro area countries
Several studies provide evidence of a transmission channel of confidence shock to foreign confidence In particular evidence for G7 countries and Spain would suggest that variations in confidence generally spill over from large countries to smaller ones (74) Some studies support the idea that confidence shocks originating in US are transmitted to the euro area but not the other way round ie shocks to euro area confidence do not affect confidence in the US (75) Other studies show a transmission channel for confidence shocks
(72) Some authors eg Ludvigson (2004) Souleles (2004) and Lahiri
Monokroussos and Zhao (2016) conclude that including confidence indicators can reduce forecasting errors when predicting the dynamics of consumption while others reach the opposite conclusion (eg Claveria Pons and Ramos 2007)
Ludvigson S (2004) lsquoConsumer confidence and consumer spendingrsquo Journal of Economic Perspectives Vol 18(2) pp 29-50
Souleles NS (2004) lsquoExpectations heterogenous forecast errors and consumption Micro evidence from the Michigan Consumer Sentiment Surveysrsquo Journal of Money Credit and Banking Vol 36 pp 39-72
Lahiri K G Monokroussos and Y Zhao (2016) lsquoForecasting consumption the role of consumer confidence in real time with many predictorsrsquo Journal of Applied Econometrics forthcoming
Claveria O E Pons and R Ramos (2007) lsquoBusiness and consumer expectations and macroeconomic forecastsrsquo International Journal of Forecasting Vol 23 pp47-69
(73) For example Howrey E (2001) lsquoThe predictive power of the index of consumer sentimentrsquo Brookings Papers on Economic Activity Vol 1 pp 175-216
(74) Fei S (2011) lsquoThe confidence channel for the transmission of shocksrsquo Banque de France Working Paper No 314
(75) Deacutees S and P Soares-Brinca (2013) lsquoConsumer confidence as a predictor of consumption spending Evidence for the United States and the Euro Arearsquo International Economics Vol 134 pp 1-14
-40
-30
-20
-10
0
10
1995Q2 1998Q2 2001Q2 2004Q2 2007Q2 2010Q2 2013Q2-08
-04
00
04
08
12
16Consumption (rhs)Consumer Confidence Indicator
III Confidence spillovers in the euro area
Volume 15 No 2 | 35
(Continued on the next page)
Box III1 A GVAR model to assess confidence spillovers
The Global Vector Autoregressive (GVAR) methodology developed by Pesaran Schuermann and Weiner (2004) (1) combines individual vector error-correcting models where domestic variables are linked to country-specific foreign variables The latter combine the domestic variables using international trade financial or other relevant weights for each country This approach allows the analysis of interdependence across different economies providing a solution to the lsquocurse of dimensionalityrsquo (eg the high number of parameters as the dimension of the model increases) in global modelling
For a set of countries i=0 1 2 hellip N the individual VARX(pi qi) models take the following form
itqtiiqtiiitiiptiiptiiit uxxxxxxii
+Λ++Λ+Λ+Φ++Φ= minusminusminusminus
11
011
where xit is a vector of ki x 1 vector of domestic variables xit a ki x 1 vector of foreign variables and
00
===
iijt
N
jijit xx ωω
where ωij j=01hellipN is a set of weights such that 10
==
N
jijω The foreign variables xit are therefore a
weighted average of domestic variables for all countries included in the model The weights can be different in nature but are typically constructed using trade or capital flows data The GVAR model is then solved for the lsquoworldrsquo (ie all countries included in the model) as a whole considering all variables as endogenous to the system
The GVAR model has been applied to a variety of issues These include forecasting (eg Pesaran Schuermann and Smith 2009) credit risk (eg Pesaran Schuermann and Treutler 2007) oil price shocks (eg Galesi and Lombardi 2009) global imbalances (eg Bussiegravere Chudik and Sestieri 2012) business cycle synchronisation (eg Dreger and Zhang 2013) the impact of EU membership (eg Pesaran Smith and Smith 2007) the international effects of fiscal policy shocks (eg Favero Giavazzi and Perego 2011) (2) Chudik and Pesaran (2014) provide a detailed review of these and other recent applications (3)
In this section this approach is used to analyse the transmission of country-specific and global consumer confidence shocks in a model which includes eight euro area countries (Austria Belgium Finland France Germany Italy the Netherlands and Spain) using quarterly data over the period 1996Q2-2013Q1 The model is solved using the GVAR Toolbox developed by Smith and Galesi (2014) (4)
(1) Pesaran MH Schuermann T and Weiner S M (2004) lsquoModelling regional interdependencies using a global error-correcting
modelrsquo Journal of Business and Economic Statistics Vol 22 pp 129-162 (2) Pesaran M H Schuermann T and Smith LV (2009) lsquoForecasting economic and financial variables with global VARsrsquo
International Journal of Forecasting Vol 25(4) pp 642-675 Pesaran MH Schuermann T and Treutler B-J (2007) lsquoGlobal business cycles and credit riskrsquo in The Risks of Financial Institutions NBER Chapters pp 419-474 Bussiegravere M Chudik A and Sestieri G (2012) lsquoModelling global trade flows results from a GVAR modelrsquo Globalization and Monetary Policy Institute Working Paper 119 Federal Reserve Bank of Dallas Dreger C and Zhang Y (2013) lsquoDoes the economic integration of China affect growth and inflation in industrial countriesrsquo FIW Working Paper series 116 FIW Pesaran M H Smith L V and Smith R P (2007) lsquoWhat if the UK or Sweden had joined the euro in 1999 An empirical evaluation using a Global VARrsquo International Journal of Finance and Economics Vol 12(1) pp 55-87 Favero C Giavazzi F and Perego F (2011) lsquoCountry heterogeneity and the international evidence on the effects of fiscal policyrsquo IMF Economic Review 59(4) 652-682
(3) Chudik A and Pesaran MH (2014) lsquoTheory and Practice of GVAR Modelingrsquo Federal Reserve Bank of Dallas Globalization and Monetary Policy Institute Working Paper No 180
(4) Smith LV and Galesi A (2014) GVAR Toolbox 20 available at httpssitesgooglecomsitegvarmodellinggvar-toolbox
36 | Quarterly Report on the Euro Area
between the US the euro area as a whole and four EU countries taken individually (76)
In addition the role of consumer confidence spillovers in the euro area was assessed in a previous issue of the QREA (77) Consumption and confidence regressions were carried out for a panel of euro area countries over the period 1999-2012 The findings support the existence of confidence spillovers between euro area countries
III4 Confidence spillovers across the euro area
Table III1 shows simple correlations between the confidence indicators of eight euro area countries over the period 1995Q4-2016Q1 (78)The strength of the link between consumer confidence indicators across Member States is variable and in most cases is larger between neighbouring countries and between countries sharing similar macroeconomic environments (79)
Table III1 Consumer Confidence Indicator mdash Correlation Matrix
(1995Q4-2016Q1)
(1) Not statistically significant at conventional levels Source DG ECFIN calculations based on EU Business and Consumer Surveys
(76) Deacutees S and J Guntner (2014) lsquoThe international dimension of
confidence shockrsquo ECB Working Paper No 1669 (77) Op cit DrsquoAuria F (2013) (78) The very low and non-statistically significant correlation of the
Italian confidence indicator with the confidence indicators of a number of other euro area countries is somewhat puzzling and there is a need for further investigation into the reasons behind it
(79) The strong correlation between confidence indicators in countries sharing similar economic conditions can be indicative of larger confidence spillovers between them but can also be a reflection of the strong correlation between their economic fundamentals
The strength of the correlation also varies considerably over time Table III2 displays correlations between consumer confidence indicators in the same euro area countries over the period 2008Q1-2012Q4 During the crisis period the link between consumer confidence indicators is significantly tighter
Table III2 Consumer Confidence Indicator mdash Correlation Matrix
(2008Q1-2012Q4)
(1) Not statistically significant at conventional levels Source DG ECFIN calculations based on EU Business and Consumer Surveys
The presence of a correlation between confidence indicators may point to the existence of confidence spillover effects between countries but also be indicative of strong business cycle synchronisation To shed light on the nature of these correlations this section discusses confidence spillovers in the euro area on the basis of the findings from the estimation of a Global Vector Autoregressive (GVAR) model which includes data for eight euro area countries over the period 1996Q2-2013Q1 Box III1 describes the model in more detail
The model includes observations on consumption GDP the unemployment rate a short-term interest rate and consumer confidence The latter is measured by the BCS Consumer Confidence Indicator which is an arithmetic average of the balances of the answers to questions on the financial situation of households the general economic situation unemployment expectations and savings over the next 12 months It is therefore taken as a proxy for consumersrsquo expectations about their future economic situation
The results seem to support the existence of consumer confidence spillovers across the euro area As an illustration Graph III2 reports impulse
AT BE FI FR IT DE NL ES
AT 100 069 069 074 013(1) 054 043 022BE 069 100 067 088 055 057 068 066FI 069 067 100 068 039 028 075 055FR 074 088 068 100 046 055 066 060IT 013(1) 055 039 046 100 004(1) 063 081DE 054 057 028 055 004(1) 100 033 023NL 043 068 075 066 063 033 100 073ES 022 066 055 060 081 023 073 100
AT BE FI FR IT DE NL ES
AT 100 093 090 088 036(1) 079 086 063BE 093 100 081 080 034(1) 080 081 071FI 090 081 100 083 058 052 081 066FR 088 080 083 100 030(1) 066 074 061IT 036(1) 034(1) 058 030(1) 100 -016(1) 065 038DE 079 080 052 066 -016(1) 100 050 048NL 086 081 081 074 065 05 100 050ES 063 071 066 061 038 048 050 100
Box (continued)
by the European Commission Consumption and GDP enter the model in log differences while the other variables are in levels Some of the results are discussed in the main text
III Confidence spillovers in the euro area
Volume 15 No 2 | 37
response functions of consumer confidence in the euro area countries included in the GVAR model to a positive shock to consumer confidence in Germany over 24 quarters (80)
The largest effect appears to be in smaller neighbouring countries (Austria Belgium and the Netherlands) The response of consumer confidence is also relatively large in Finland France and Spain On the other hand spillovers to consumer confidence in Italy are very small and become negative after six quarters This is not a surprise given the statistically insignificant correlation between German and Italian consumer confidence emerging from the data reported in Table III1 The peak response occurs in the second or third quarter
Similar results although of a smaller magnitude were obtained for the other euro area countries included in the model Confidence spillovers appear to be larger across countries with stronger geographical and trade links Overall the evidence from the estimation of the model supports the existence of a transmission channel for consumer confidence shocks across the euro area However the effects of confidence shocks on foreign consumption are in most cases not statistically significant suggesting that the transmission channel is to foreign confidence rather than
(80) A caveat must be made about the difficulty of identifying truly
exogenous confidence shocks owing to the fact that confidence indicators are largely driven by the same factors which determine consumption
directly to foreign economic activity (81)
These results suggest that confidence shocks play a role in the international business cycle and that there are close interlinkages between confidence indicators across euro area countries This evidence supports the need for coordinated policy action able to boost confidence across euro area countries
III5 Conclusions
In recent years the dynamics of euro area consumer confidence and real private consumption have been very closely related Moreover consumer confidence indicators across the euro area appear to be strongly correlated The strength of the correlation was considerably greater during the crisis period
The evidence of a link between real consumption and consumer confidence is mixed but several studies are supportive of consumer confidence playing a role in determining consumption In addition there is evidence to suggest that shocks to consumer confidence in euro area countries affect confidence in other euro area Member States This is also borne out by results obtained from the estimation of a Global Vector Autoregressive (GVAR) model for eight euro area countries
(81) Similar conclusions are reached by op cit Deacutees and Soares-Brinca
(2013) and Deacutees and Guntner (2014)
38 | Quarterly Report on the Euro Area
Graph III2 Impulse response functions of foreign confidence to a one standard error confidence shock in Germany
Source DG ECFIN
000
005
010
015
020
025
030
035
1 2 3 4 5 6 7 8 9 10 11 12 13 14 15 16 17 18 19 20 21 22 23 24
AT
000
005
010
015
020
025
030
035
040
1 2 3 4 5 6 7 8 9 10 11 12 13 14 15 16 17 18 19 20 21 22 23 24
BE
000
005
010
015
020
025
030
1 2 3 4 5 6 7 8 9 10 11 12 13 14 15 16 17 18 19 20 21 22 23 24
FI
000
005
010
015
020
025
030
1 2 3 4 5 6 7 8 9 10 11 12 13 14 15 16 17 18 19 20 21 22 23 24
FR
-002
-001
000
001
002
003
004
005
006
007
1 2 3 4 5 6 7 8 9 10 11 12 13 14 15 16 17 18 19 20 21 22 23 24
IT
000
005
010
015
020
025
030
035
040
1 2 3 4 5 6 7 8 9 10 11 12 13 14 15 16 17 18 19 20 21 22 23 24
NL
000
005
010
015
020
025
030
035
1 2 3 4 5 6 7 8 9 10 11 12 13 14 15 16 17 18 19 20 21 22 23 24
ES
40 | Quarterly Report on the Euro Area
Editors Jose Eduardo Leandro and Martin Larch
Coordination Plamen Nikolov
Statistical and layout assistance Christos Zavos
Comments on the report would be gratefully received and should be sent to
Jose Eduardo Leandro Director ndash Policy strategy coordination and communication Directorate-General for Economic and Financial Affairs Office CHAR 1566
B-1049 Brussels
Email joseleandroeceuropaeu
or
Martin Larch Head of Unit ndash EMU deepening and macroeconomy of the euro area Directorate-General for Economic and Financial Affairs Office CHAR 1556
B-1049 Brussels
Email martinlarcheceuropaeu
EUROPEAN ECONOMY INSTITUTIONAL SERIES
European Economy Institutional series can be accessed and downloaded free of charge from the following address httpeceuropaeueconomy_financepublicationseeipindex_enhtm Titles published before July 2015 can be accessed and downloaded free of charge from bull httpeceuropaeueconomy_financepublicationseuropean_economyindex_enhtm
(the main reports eg Economic Forecasts) bull httpeceuropaeueconomy_financepublicationsoccasional_paperindex_enhtm
(the Occasional Papers) bull httpeceuropaeueconomy_financepublicationsqr_euro_areaindex_enhtm
(the Quarterly Reports on the Euro Area)
Alternatively hard copies may be ordered via the ldquoPrint-on-demandrdquo service offered by the EU Bookshop httpbookshopeuropaeu
HOW TO OBTAIN EU PUBLICATIONS Free publications bull one copy
via EU Bookshop (httpbookshopeuropaeu) bull more than one copy or postersmaps
- from the European Unionrsquos representations (httpeceuropaeurepresent_enhtm) - from the delegations in non-EU countries (httpeeaseuropaeudelegationsindex_enhtm) - by contacting the Europe Direct service (httpeuropaeueuropedirectindex_enhtm) or calling 00 800 6 7 8 9 10 11 (freephone number from anywhere in the EU) () () The information given is free as are most calls (though some operators phone boxes or hotels may charge you)
Priced publications bull via EU Bookshop (httpbookshopeuropaeu)
ISBN 978-92-79-54335-7
KC-BC-16-030-EN-N
- NEW_IP_index_enpdf
-
- EUROPEAN EconomY institutional SERIES
-

II Financial channels and economic activity in the euro area
Volume 15 No 2 | 21
intermediation typically involves asymmetry of information between borrowers and lenders and potentially costly verification of the borrowers financial situation (34)
The first attempts to include financial frictions in macroeconomic models were based on the insight that the cost of external financing very much depends on the borrowers net worth (35) andor the market value of their collateral (36) In fact changes in asset prices turn out to be a crucial determinant of both the cost of external financing and the value of collateral Moreover a relatively small shock can have a major effect on economic activity through the so-called financial accelerator whereby negative feedback loops between lower assets prices restricted access to credit and lower consumption and investment significantly amplify and prolong the impact on the real economy (37) Real estate which is a typical asset used as collateral by both households and firms establishes a tight link between the housing market and the economy as a whole (38)
While the original theoretical contributions did not explicitly model financial intermediaries (assuming direct lending from investors to borrowers) the inclusion of financial intermediaries (ie the banking sector) implies that financial frictions can appear also on the lendersrsquo side (39) Specifically financial intermediaries can become balance sheet constrained in times of economic and financial stress which affects their funding costs Such shocks to the lendersrsquo side are usually mitigated by central bank intermediation during crisis times (40)
(34) Carlstrom C T and T S Fuerst (1997) lsquoAgency costs net worth
and business fluctuations A computable general equilibrium analysisrsquo The American Economic Review Vol 87 No 5 pp 893-910
(35) Bernanke B and M Gertler (1989) lsquoAgency costs net worth and business fluctuationsrsquo The American Economic Review Vol 79 No 1 pp 14-31
(36) Kiyotaki N and J Moore (1997) lsquoCredit cyclesrsquo Journal of Political Economy Vol 105 Issue 2 pp 211-248
(37) Bernanke B S M Gertler and S Gilchrist (1999) lsquoThe financial accelerator in a quantitative business cycle frameworkrsquo Handbook of Macroeconomics Vol 1 Part C pp 1341-1393
(38) Iacoviello M and S Neri (2010) lsquoHousing market spillovers evidence from an estimated DSGE modelrsquo American Economic Journal Macroeconomics Vol 2 No 2 pp 125-164
(39) Gertler M and N Kiyotaki (2010) lsquoFinancial intermediation and credit policy in business cycle analysisrsquo Handbook of Monetary Economics Vol 3 Issue 3 pp 547-599
(40) Gertler M and P Karadi (2011) lsquoA model of unconventional monetary policyrsquo Journal of Monetary Economics Vol 58 Issue 1 pp 17-34
Despite intensive efforts in recent years the financial sector is still not fully established as a consolidated part of conventional macroeconomic models Structural models augmented by a banking sector and financial markets (41) typically find that financial factors such as bank liquidity constraints are indeed the main drivers of economic fluctuations in both the US and the euro area and that they were the main shock propagator during the global financial crisis (42)
Empirical evidence on macro-financial linkages
There is now a wide consensus that financial cycles are crucial for understanding business cycle fluctuations (43) Numerous empirical studies evaluate the effects of financial shocks on macroeconomic fluctuations Importantly financial factors can both reinforce the transmission of other shocks and be a source of disturbance in their own right
Credit appears to be one of the most studied financial variables in empirical studies due to its established regularities in terms of boom-and-bust behaviour and its link to financial crises and economic downturns (44) Credit spreads play an important role for capital markets-based systems like the US economy For example corporate bond spreads usually increase disproportionately during periods of financial stress (so-called excess bond premiums) which in turn causes economic activity to contract (45) In the euro area where external financing is mostly bank based a crucial role is played by bank lending rates and bank lending volumes Credit supply shocks have been identified
(41) Christiano L J R Motto and M Rostagno (2010) lsquoFinancial
factors in economic fluctuationsrsquo European Central Bank Working Paper No 1192
(42) Gerke et al (2013) and Wieland et al (2015) provide detailed comparison exercise for different macrofinancial models
Gerke R M Jonsson M Kliem M Kolasa P Lafourcade A Locarno K Makarski and P McAdam (2013) lsquoAssessing macro-financial linkages A model comparison exercisersquo Economic Modelling Vol 31 pp 253-264
Wieland V E Afanasyeva M Kuete and J Yoo (2015) lsquoNew methods for macro-financial model comparison and policy analysisrsquo mimeo
(43) Borio C (2012) lsquoThe financial cycle and macroeconomics what have we learntrsquo Bank for International Settlements Working Papers No 395
(44) Balke N S (2000) lsquoCredit and economic activity credit regimes and nonlinear propagation of shocksrsquo Review of Economics and Statistics Vol 82 No 2 344-349
(45) Gilchrist S and E Zakrajšek (2012) lsquoCredit spreads and business cycle fluctuationsrsquo The American Economic Review Vol 102 No 4 pp 1692-1720
22 | Quarterly Report on the Euro Area
as important determinants of the increase in lending rates and the decline in lending volumes during the recent crisis (46) Bank lending represents the main transmission mechanism in the euro area
The evidence available indicates that the impact of financial shocks on the macroeconomy is lsquostate dependentrsquo ie the response of economic activity inflation and credit to financial shocks is stronger during periods of stress This is well documented for both the euro area and the US (47) Moreover during periods of high systemic stress financial shocks tend to have both a larger magnitude and a greater impact on real activity (48) Notably a single indicator of systemic stress such as the CISS for the euro area has been found to explain a significant part of macroeconomic developments especially due to episodes of elevated systemic stress such as the global financial crisis and the euro area debt crisis (49)
While studies on financial and business cycle have been popular for some time there has been much less investigation into macro-financial linkages between countries Existing evidence indicates that such linkages exist but their intensity varies both across time and across countries Specifically it has been documented that the observed heterogeneity is mainly due to country-specific characteristics which lead to international spillovers having a differentiated impact across countries (50) Such heterogeneity seems also to be present within the euro area
(46) Moccero D N M D Pariegraves and L Maurin (2014) lsquoFinancial
Conditions Index and identification of Credit Supply Shocks for the Euro Arearsquo International Finance Vol 17 Issue 3 pp 297-321
(47) Hubrich K and R J Tetlow (2015) lsquoFinancial stress and economic dynamics the transmission of crisesrsquo Journal of Monetary Economics Vol 70 pp 100-115
Prieto E S Eickmeier and M Marcellino (2016) lsquoTime variation in macro‐financial linkagesrsquo Journal of Applied Econometrics forthcoming
Silvestrini A and A Zaghini (2015) lsquoFinancial shocks and the real economy in a nonlinear world a survey of the theoretical and empirical literaturersquo Journal of Policy Modeling Vol 37 pp 915ndash929
(48) Hartmann P K Hubrich M Kremer and R J Tetlow (2015) lsquoMelting down Systemic financial instability and the macroeconomyrsquo mimeo
(49) Kremer M (2015) lsquoMacroeconomic effects of financial stress and the role of monetary policy a VAR analysis for the euro arearsquo International Economics and Economic Policy Vol 13 Issue 1 pp 1-34
(50) Ciccarelli M E Ortega and M T Valderrama (2016) lsquoCommonalities and cross-country spillovers in macroeconomic-financial linkagesrsquo The BE Journal of Macroeconomics Vol 16 Issue 1 pp 231-275
II3 Transmission channels from financial to macro developments
In spite of the broad consensus about the existence of macro-financial linkages the identification of the transmission channels is still a subject of debate There are different ways to classify the channels through which the financial sector might affect macroeconomic developments The important distinction applied in this section is whether the linkages are related to the balance sheets of borrowers or lenders At the same time the financial channels are also closely related to monetary transmission which affects their functioning (51) This subsection aims to better define the individual transmission channels in the euro area
The interest rate channel illustrates how money market rates affect the overall financing costs of the banking sector the price of credit and consequently consumption and investment decisions This channel is closely related to monetary policy decisions as they directly affect the funding costs of banks Moreover at the zero lower bound when the central bank uses other instruments besides short-term interest rates to conduct monetary policy this channel is more complex and difficult to assess
Thus in the analysis below the interest rate channel will be captured by variables that are affected by monetary policy decisions (Graph II3) In the euro area the most frequently used indicator directly affected by the ECBrsquos policy rates is the short-term interbank interest rate (EONIA) While the effect of monetary policy actions on short-term rates is rather quick there is also a delayed effect on long-term interest rates The long-term rates are of specific relevance in the current time as short-term rates are at the zero lower bound and monetary policy aims to affect long rates directly While long-term rates are commonly defined by the yield on respective sovereign bonds in the euro area this applies to a pool of euro area sovereigns As the yields diverge across sovereigns since the global financial crisis long-term rates in the euro area have become disconnected from short-term rates Since the ECB has employed diverse unconventional measures that affect the
(51) See for instance Basel Committee on Banking Supervision (2011)
lsquoThe transmission channels between the financial and real sectors a critical survey of the literaturersquo BCBS Working Paper No 18
II Financial channels and economic activity in the euro area
Volume 15 No 2 | 23
financial system additional measures need to be used to track their effect namely the shadow rate which is a factor model-based estimate of the short-term interest rate unconstrained by the ZLB (52) Likewise the excess liquidity defined as the liquidity held by the euro area banking sector in excess of the aggregate needs arising from minimum reserve requirements and autonomous factors is another quantitative-based indicator of the monetary policy stance as it is driven by the ECBrsquos refinancing operations
Graph II3 shows the dynamics of the variables described above in the period Q1-1996 - Q1-2016 which suggest that monetary conditions have been very supportive in recent years While short-term interest rates attained the ZLB monetary easing through unconventional measures is reflected in a significant decline in the shadow rate as well as long-term rates
Graph II3 Interest rate channel (2000Q1-2016Q1 )
Source Eurostat Bloomberg Reserve Bank of New Zealand
The borrower balance sheet channel reflects the fact that it is the net worth of borrowers that determines the external finance premium ie the opportunity cost of borrowing over using internal savings In other words it is the value of borrowersrsquo collateral that affects their credit conditions As indicated above fluctuations in
(52) There different shadow rates available all being subject of
significant model uncertainty The shadow rate used is based on Krippner (2012) and available from the Reserve Bank of New Zealand website
Krippner L (2012) lsquoMeasuring the stance of monetary policy in zero lower bound environmentsrsquo Economics Letters Vol 118 Issue 1 pp 135ndash138
asset prices can affect the ability of non-financial corporations and households to borrow and thus their investment and spending decisions While monetary policy commonly does not target asset prices its actions can affect the valuation of assets used as collateral which affects the credit available for investment and consumption spending (53) Whereas the previous discussion focuses on the demand side of credit the borrower balance sheet channel affects also the supply of credit Namely weak borrower balance sheets might induce credit rationing by the lenders and affect overall credit conditions
The borrower balance sheet channel can be captured mainly by variables that reflect the risks related to the balance sheets of firms and households as borrowers from the banking sector or from capital markets While there are no readily available direct measures of the quality of private balance sheets comparable across countries asset prices can be considered as indicative of their quality as they give the value of collateral for loans and of equity Therefore house prices and stock prices are generally used in the analysis to track this channel
Graph II4 Borrower balance sheet channel
(2000Q1-2016Q1)
Source Bloomberg BIS
Graph II4 suggests that developments in house prices and stock prices have been quite
(53) There is empirical evidence especially for the US stressing the
importance of asset prices and different credit spreads as leading indicator of economic activity eg Stock and Watson (2003) Stock J H and M W Watson (2003) lsquoForecasting output and inflation the role of asset pricesrsquo Journal of Economic Literature Vol 41 No 3 pp 788-829
-10
-5
0
5
10
15
20
25
2000Q1 2004Q1 2008Q1 2012Q1 2016Q1
Short-term interest rateLong-term interest rateShadow rate (Krippner)ECB Excess Liquidity Index
-6
-4
-2
0
2
4
6
8
10
-60
-40
-20
0
20
40
60
2000Q1 2002Q3 2005Q1 2007Q3 2010Q1 2012Q3 2015Q1
MSCI EURO Index y-o-y change
Housing prices y-o-y change
24 | Quarterly Report on the Euro Area
disconnected in recent years Specifically while house prices only started to recover in 2014 stock prices peaked in early 2015 and experienced a downward correction since then
The bank balance sheet channel relates to the fact that how much a bank lends depends on its own balance sheet and the different risks involved in its business model External developments (including monetary policy actions but also longer-term factors such as financial regulation and innovations in the banking sector) may affect bank liabilities (the supply of loanable funds and also bank funding costs) and in turn assets (supply of credit and the lending cost) (54) Bank lending is determined by banksrsquo business models it usually increases with the increase in leverage in the economy while deleveraging episodes may significantly hamper lending activities This makes leverage highly pro-cyclical (55) Importantly the impact of bank balance sheets on the real economy can be more pronounced in the euro area than in capital-market based systems as alternative forms of financing are relatively undeveloped
The bank balance sheet channel can thus be illustrated by variables such as banking leverage the stock of non-performing loans banksrsquo funding costs or the price of Credit Default Swaps (CDS) However reliable data for the euro area are relatively short available only for the period since the beginning of the crisis Indeed the lack of knowledge about the quality of bank balance sheets was an important aspect of the euro area financial crisis and a reason for the implementation of the Asset Quality Review (AQR) by the ECB in 2014 Therefore for the analysis in this section measures which directly track the supply of credit have been used instead (56) Namely the flow of credit as measured by the credit impulse (ie the change in new credit granted by the banking sector as a percentage of GDP) the stock of credit on banksrsquo balance sheet as measured by total economy credit as a percentage of GDP and the price of credit as measured by the Composite Financing Conditions Indicator (CFCI) for non-financial corporations
(54) Bernanke B and A Blinder (1988) lsquoCredit money and aggregate
demandrsquo the American Economic Review Vol78 No 2 pp 435ndash439 (55) Adrian T and H S Shin (2010) lsquoLiquidity and leveragersquo Journal of
Financial Intermediation Vol 19 Issue 3 pp 418-437 (56) In practice the lending volumes and rates can be affected both by
supply and demand side
which (assuming a constant mark-up) proxies bank funding costs (57)
Graph II5 shows that there is a negative correlation between the credit impulse and credit as a percentage of GDP Thus during downturns the flow of new credit declines while the ratio of credit to GDP increases due to the collapse of GDP The credit impulse indicator shows that the supply of new credit has been fairly limited since the onset of the global financial crisis The CFCI tracks the ECB policy rates rather closely with the exception of the euro area sovereign debt crisis episode (2011-2012) when financing costs increased due to idiosyncratic increases in some Member States reflecting financial market fragmentation
Graph II5 Bank balance sheet channel (2000Q1-2016Q1)
Source Capital Economics BIS DG ECFIN
While the previous channels are related to the quality of balance sheets either on the borrower or the lender side some shocks can originate in the overall financial system Examples are liquidity shocks or confidence shocks These shocks work both via the balance sheets but also by directly altering agents decisions through precautionary motives affecting both investment and consumption behaviour These mechanisms are defined as the uncertainty channel (58)
(57) For more details on CFCI calculations see European Commission
(2013) Drivers of diverging financing conditions across Member States Quarterly Report on the Euro Area Vol12 No1
(58) Bloom (2009) point to uncertainty shocks (that might be related but also unrelated to the financial system) as a crucial driver of economic dynamics Recently Caldara et al (2016) argue for the needs to distinguish uncertainty shocks from financial shocks while both of them are important source of macroeconomic
-8
-6
-4
-2
0
2
4
6
8
10
2000Q1 2003Q1 2006Q1 2009Q1 2012Q1 2015Q1
Total credit on GDP y-o-y change
Credit impulse (new crediton GDP y-o-y change)
Composite financingconditions indicator
II Financial channels and economic activity in the euro area
Volume 15 No 2 | 25
The uncertainty channel is captured by variables reflecting the different types of uncertainty that can affect the economy One type is commonly related to increased volatility in financial markets Given a high degree of global interconnectedness the euro area economy can be affected by uncertainty related to global financial developments which is usually measured by the implied volatility of SampP 500 index options (VIX) (59) The euro area specific stress in the financial system is measured through the ECBrsquos Composite Indicator of Systemic Stress (CISS)
Another type of uncertainty is linked to swings in business and consumer confidence Variations in the confidence of euro area households and non-financial firms are illustrated through the European Commissionrsquo confidence indicator the Economic Sentiment Indicator (ESI) which is based on data collected through business and consumer surveys However the indicator exhibits a very high contemporaneous correlation with actual GDP growth indicating that its dynamics are likely to reflect very accurately economic conditions rather than information related to exogenous changes in confidence
Finally unexpected outcomes of economic policy decisions can lead to policy uncertainty which in turn can have adverse effects on the savings and investment behaviour of firms and households Policy uncertainty is illustrated through an indicator based on newspaper coverage of uncertainty-generating events (60)
Graph II6 indicates that there is an apparent co-movement among these indicators even if they measure different types of uncertainty While economic sentiment has been gradually improving and uncertainty related to financial markets has eased the policy uncertainty affecting the euro area is still relatively high
fluctuations separately the Great Recession was likely outcome of the toxic interaction between the two
Bloom N (2009) lsquoThe impact of uncertainty shocksrsquo Econometrica Vol 77 Issue 3 pp 623-685
Caldara D C Fuentes-Albero S Gilchrist and E Zakrajšek (2014) lsquoThe macroeconomic impact of financial and uncertainty shocksrsquo European Economic Review forthcoming
(59) The VIX is calculated by the Chicago Board Options Exchange (CBOE)
(60) Baker S R N Bloom and S J Davis (2015) lsquoMeasuring economic policy uncertaintyrsquo National Bureau of Economic Research Working Paper No 21633 Data source wwwpolicyuncertaintycom
Graph II6 Uncertainty channel (2000Q1-2016Q1)
Source Chicago Board of Exchange ECB wwwpolicyuncertaintyorg
II4 Financial developments and economic activity
This sub-section provides stylised facts on the transmission channels defined above and show whether and how financial developments have affected the real side of the euro area economy since the crisis (namely consumption investment unemployment and long-term interest rates)
While financial variables are available in real time macroeconomic variables are normally released with lags Therefore conditioning macroeconomic forecasts on observed financial developments (ie a projection of macro variables on the observed paths of financial variables) can improve forecasts as more informative data are taken into account Several empirical studies have shown that financial variables can improve macroeconomic forecasts (61)
The methodology underlying this this section is a large-scale Bayesian VAR with 35 macroeconomic
(61) Stock and Watson (2003) provide a seminar contribution on the
role of financial variables namely asset prices for GDP and inflation forecast concluding that different financial variables allow macroeconomic forecasting in different times Espinosa et al (2012) document using standard VAR approach that financial variables improve GDP forecast for the euro area especially in the real time when numerous financial variables are available ahead of the macroeconomic releases
Stock J H and M W Watson (2003) lsquoForecasting output and inflation the role of asset pricesrsquo Journal of Economic Literature Vol 41 No 3 pp 788-829
Espinoza R F Fornari and M J Lombardi (2012) lsquoThe role of financial variables in predicting economic activityrsquo Journal of Forecasting Vol 31 No 1 pp 15-46
0
50
100
150
200
250
300
0
10
20
30
40
50
60
70
80
2000Q1 2002Q3 2005Q1 2007Q3 2010Q1 2012Q3 2015Q1
VIX
CISS
ESI (rhs)
Policy uncertainty (rhs)
26 | Quarterly Report on the Euro Area
and financial variables (62) The model is estimated for the sub-period Q1-2000 - Q4-2011 which covers both normal and crisis times but does not include some of the most important unconventional monetary policy measures Given the estimated past correlations a counterfactual path for the macroeconomic and financial variables (ie a distribution of conditional forecasts) can be obtained for the entire period Q1-2000 - Q4-2015 conditional on observed real GDP and inflation in the baseline case The deviations of the observed developments of financial variables from this counterfactual path can be interpreted as evidence of instability in the relationship between financial variables and economic activity (as measured by GDP growth and inflation) since the crisis
Subsequently the conditional set from the baseline case (including only real GDP and inflation) is extended by financial and uncertainty variables corresponding to each transmission channel described above (63)
Some recent developments are puzzling
Graph II7 shows the counterfactual paths of the main GDP components producer prices the unemployment rate and the long-term interest rate conditional on observed economic activity (real GDP and inflation) It also shows the conditional forecasts for the balance sheet variables of households and firms when only real GDP and inflation are taken into account in the conditioning set
(62) Alternative strand of literature using rich set of data in order to
nowcast or forecast employs dynamic factors models where data dimension is reduced in a first step by factor estimation with common factors being consequently used in the forecasting exercize see eg Giannone et al (2008) Bellego and Ferrara (2012) find using factor-augmented probit model that financial variables allow tracking better recession periods in the euro area (in the pre-crisis period) with optimal lead of financial variables over recession of around one year
Giannone D L Reichlin L and D Small (2008) lsquoNowcasting the real-time informational content of macroeconomic datarsquo Journal of Monetary Economics Vol 55 Issue 4 pp 665ndash676
Belleacutego C and L Ferrara (2012) lsquoMacro-financial linkages and business cycles A factor-augmented probit approachrsquo Economic Modelling Vol 29 pp 1793-1797
(63) For more details on the methodology see Box IV1 in European Commission (2015) lsquoInvestment dynamics in the euro area since the crisisrsquo Quarterly Report on the Euro Area Vol 14 No 1 pp 35-43
Bańbura M D Giannone and M Lenza (2015) lsquoConditional forecasts and scenario analysis with vector autoregressions for large cross-sectionsrsquo International Journal of Forecasting Vol 31 Issue 3 pp 739ndash756
The results suggest that private consumption was unusually low during the period of the euro area debt crisis and deleveraging (2012-2013) while it overshot during the recent recovery (from 2014 onward) Investment behaved in line with historical correlations during both downturn episodes (2008-2009 and 2012-2013) and was weak during the deleveraging phase because overall output growth was weak However its recent recovery (since 2014) has been more subdued than what the pace of economic activity would have predicted the observed investment path is positioned on the lower tail of the distribution of conditional forecasts) (64)
Large deleveraging pressures in the public sector have led to a significant decline in the euro area aggregate government consumption over the period 2011-2012 However this decline had almost been reversed by the end of 2014 with public consumption starting to overshoot from 2015 onwards (relative to its counterfactual path obtained through conditioning on output growth) reflecting the aggregate euro area fiscal stance which started to turn mildly expansionary
Moreover the results show that several variables capturing price and balance sheet developments are still at odds with historical patterns In particular producer prices house prices long-term interest rates and loans to firms and households undershoot the distribution of the conditional forecasts On one side this underlines that the recent recovery is characterized by a historically low inflation environment and loose monetary conditions pushing the long-term rates down On the other side the ongoing balance sheet adjustment is translating into very weak credit dynamics due to unprecedented deleveraging pressures
Graph II8 illustrates the zero lower bound constraint on monetary policy rates and the subsequent break in the correlation of economic activity with the two measures of monetary policy
(64) There is some relative instability in the estimated correlations over
the sample period notably pre-crisis vs crisis years However it does not significantly affect the result on the unusual weakness in investment recovery since 2014 The article lsquoInvestment dynamics in the euro area since the crisisrsquo Quarterly Report on the Euro Area Vol 14 No 1 pp 35-43 found that estimating the past correlations only with the sample for the pre-crisis period the amplitude of the investment fall during the first downturn (2008-2009) would also be slightly underestimated by the conditional forecasts
II Financial channels and economic activity in the euro area
Volume 15 No 2 | 27
rates since 2012 Among all variables the consumer and business confidence indicator (ESI) comes out as having the strongest contemporaneous correlation with economic activity during the crisis
In the consecutive analysis the conditioning dataset (including only real GDP and inflation in the baseline) is augmented by financial variables corresponding to each transmission channel
hellip different channels play an important role at different stages since the crisis
The interest rate channel (Graph II9 upper panel) seems to better account for the pattern of consumption during the recent recovery (compared to the baseline) This channel which reflects mainly monetary conditions suggests that monetary easing implemented since 2014 by means of additional unconventional measures (namely the targeted long-term refinancing operations (TLTRO) the asset-backed securities purchasing program (ABSPP) and the forthcoming public
securities purchase program (PSPP)) have translated into a further decline in the long-term interest rate and the shadow policy rate It also reflects an increase in excess liquidity which has had a very benign effect on the recent recovery However producer prices developments (PPI) still appear unusually subdued Likewise including information capturing the interest rate channel does not help explain the dismal performance of consumption during the deleveraging phase (2012-2013) or the persistent weakness of credit dynamics Therefore these developments seem to be determined also by drivers other than monetary conditions
The borrowers balance sheet channel (Graph II9 lower panel) captures in turn the exceptional deleveraging developments of 20122013 but clearly underestimates the pace of the recent recovery This finding suggests that strained balance sheets of households and firms represented the main weight on the recovery at the time of euro area sovereign debt crisis However whereas a mild recovery started in the euro area in 2014 private
Graph II7 Conditional forecasts based on real GDP and inflation (1) (2000Q1-2015Q4 y-o-y growth)
Misalignments of financial and real variables with output growth since the crisis
(1) Shades of orange distribution of the conditional forecasts in the BVAR in levels excluding the lower and higher 5 quantiles Green line actual values The variables are all reported in terms of annual percentage changes except for the unemployment rate and the long-term interest rate which are in levels Conditioning assumptions real GDP and HICP Source DG ECFIN MATLAB codes replication files of the methodological paper (Banbura et al 2015)
Government consumption
2005 2010 2015-2
0
2
4Real consumption
2005 2010 2015-5
0
5Real investment
2005 2010 2015-20
-10
0
10
Unemployment rate
2005 2010 20150
5
10
15PPI ex const
2005 2010 2015-50
0
50House prices
2005 2010 2015-10
0
10
Long-term i r
2005 2010 20150
5
10Loans to firms
2005 2010 2015-10
0
10
20Loans to households
2005 2010 2015-5
0
5
10
28 | Quarterly Report on the Euro Area
balance sheets still did not improve much In fact when the borrower balance sheet channel is taken into account observed consumption overshoots the conditional forecast even by a higher margin than in the baseline scenario and real investment seems to be on the upper side as well This suggests that the borrower balance sheet channel should have led to more subdued dynamics of both consumption and investment than what has been observed in 2014 and 2015 indicating that other channels have been somewhat compensating the adverse effects of this channel
The bank balance sheet channel (Graph II10 upper panel) improves the forecast of investment since 2014 and reduces the uncertainty around the median for some variables such as consumption unemployment and long-term interest rate The good fit of investment dynamics indicates a strong correlation of investment with total economy credit developments both in terms of flows and stocks
Interestingly the bank balance sheet information namely the total economy credit as percentage of GDP (including credit to public sector) the private sector credit impulse and the price of credit for the private sector cannot capture the weak observed dynamics of outstanding loans to firms and households This shows that the private deleveraging process has been much stronger than the public sector deleveraging making private credit developments disconnected from GDP
growth (65) Therefore while the recovery in real activity has been rather weak the private credit dynamics have been even weaker Furthermore the modest recovery does not facilitate passive deleveraging (a decrease in the relative debt burden due to a growing economy ie denominator effect) and feeds the active deleveraging (a decrease of absolute level of debt ie nominator effect)
Finally the current long-term interest rate seems very low even when the financing costs for non-financial corporations (which also attained historical minima) are taken into account This underlines the importance of the ECBrsquos measures that imply very easy financing conditions in the foreseeable future
Last but not least the uncertainty channel (Graph II10) seems to improve the conditional forecast over the baseline in the same spirit as the bank balance sheet channel For example there is a good fit of investment indicating a strong correlation of investment with confidence and financial stress measures Equally the rebound in private consumption seems to be well captured by the uncertainty channel indicating that the recent decrease in financial markets stress has also been an important driver for consumption However in general the uncertainty channel is likely to be implicitly included in the bank balance sheet
(65) GDP is a denominator of the credit indicators in bank balance
sheet channel
Graph II8 Conditional forecasts based on real GDP and inflation (1) (2000Q1-2015Q4 y-o-y growth)
Business and consumer confidence and short-term interest rates
(1) Shades of orange distribution of the conditional forecasts in the BVAR in levels excluding the lower and higher 5 quantiles Green line actual values The variables are all reported in terms of annual percentage changes except for the unemployment rate and the long-term interest rate which are in levels Conditioning assumptions real GDP and HICP Source DG ECFIN MATLAB codes replication files of the methodological paper (Banbura et al 2015)
Economic sentiment
2005 2010 2015-15
-10
-5
0
5
10Short-term i r
2005 2010 2015-4
-2
0
2
4
6
8Shadow short-term interest rate
2005 2010 2015-6
-4
-2
0
2
4
6
II Financial channels and economic activity in the euro area
Volume 15 No 2 | 29
channel For example in periods of high uncertainty bank funding costs increase (bank balance sheet channel) and firms with weaker balance sheets cannot obtain credit for new loans (borrower balance sheet channel)
Overall the findings above suggest that while there is clear evidence of the transmission of monetary policy measures on financial variables and from financial variables to consumer lending rates the evidence on the effects on real activity is more complex with different channels playing an important role at different stages of the crisis The interest rate channel has helped the modest recovery since 2014 by supporting both public and private consumption growth and by partially compensating the balance sheet channel for both borrowers and banks The results in Graph II9 (lower panel) can be interpreted as showing that in the absence of massive monetary easing given the high level of debt in the economy and the wealth effects associated with house and asset prices decreases both private and public consumption growth could have been much more subdued than what it is currently observed
Graph II10 (both panels) illustrate the importance of the bank balance sheet and the uncertainty channel for capturing investment dynamics Weak investment growth is well captured both by credit developments as captured through the bank balance sheet channel and confidence effects through the uncertainty channel Real economic activity as measured by GDP growth while playing an important role does not seem to fully explain the subdued growth in investment since 2014 (Graph II7)
II5 Conclusions
The section discusses the nexus between financial and macroeconomic developments drawing some
lessons from the literature and providing some stylised facts on the main transmission channels through which financial developments have affected real economic activity since the crisis
While there is clear evidence of the transmission of monetary policy measures on financial variables and from financial variables to consumer lending rates the evidence on the effects on real activity is more complex with different channels playing an important role at different stages of the crisis
The state of private balance sheets seems to have significantly contributed to the poor performance of consumption during the euro area debt crisis and high debt levels still weigh on growth However given the still high level of debt the current mild recovery should be seen as a rather positive outcome The analysis suggests that easy monetary conditions seem to represent an important driver of the current recovery Another driver seems to be the balance sheets of banks which have gradually improved and allow better transmission of easy monetary conditions to the lending rates
Given the still high levels of debt in the economy and the wealth and confidence effects associated with house and asset prices corrections both private and public consumption growth could have been much more subdued than what it is currently observed were it not for the exceptional easing of monetary conditions
Unfortunately the recovery is still not strong enough to facilitate the deleveraging process The stock of debt and the ongoing deleveraging combined with adverse confidence effects still represent major impediments for a stronger recovery in investment Consequently there is a need to implement policy measures that allow dealing effectively with the debt overhang notably an effective framework for non-performing loans resolution
30 | Quarterly Report on the Euro Area
Graph II9 Conditional forecasts based on variables capturing the interest rate channel and borrower balance sheet channel (1)
(2000Q1-2015Q4 y-o-y growth)
Interest rate channel
Borrower balance sheet channel
(1) Shades of orange distribution of the conditional forecasts in the BVAR in levels excluding the lower and higher 5 quantiles Green line actual values The variables are all reported in terms of annual percentage changes except for the unemployment rate and the long-term interest rate which are in levels Conditioning assumptions interest rate channel ESI HICP the short-term interest rate the long-term interest rate the shadow interest rate and the ECB excess liquidity measure Conditioning assumptions borrower balance sheet channel ESI HICP house prices stock prices and outstanding loans to households and firms Due to the high contemporaneous correlation between real GDP growth and the ESI indicator the ESI indicator contains the same forecasting information as real GDP ESI indicator is used in the conditioning set instead of real GDP variable in order to also illustrate conditional forecasts for real GDP Source DG ECFIN MATLAB codes replication files of the methodological paper (Banbura et al2015)
Real GDP
2005 2010 2015-10
-5
0
5Government consumption
2005 2010 2015-2
0
2
4Real consumption
2005 2010 2015-5
0
5
Real investment
2005 2010 2015-20
-10
0
10Unemployment rate
2005 2010 20150
10
20PPI ex const
2005 2010 2015-50
0
50
House prices
2005 2010 2015-10
0
10
20Loans to firms
2005 2010 2015-10
0
10
20Loans to households
2005 2010 2015-10
0
10
20
Real GDP
2005 2010 2015-10
-5
0
5Government consumption
2005 2010 2015-2
0
2
4Real consumption
2005 2010 2015-5
0
5
Real investment
2005 2010 2015-20
-10
0
10Unemployment rate
2005 2010 20150
5
10
15PPI ex const
2005 2010 2015-50
0
50
Shadow short-term interest rate
2005 2010 2015-5
0
5
10Short-term i r
2005 2010 2015-5
0
5
10Long-term i r
2005 2010 20150
5
10
II Financial channels and economic activity in the euro area
Volume 15 No 2 | 31
Graph II10 Conditional forecasts based on variables capturing the bank balance sheet channel and uncertainty channel (1)
(2000Q1-2015Q4 y-o-y growth) Bank balance sheet channel
Uncertainty channel
(1) Shades of orange distribution of the conditional forecasts in the BVAR in levels excluding the lower and higher 5 quantiles Solid black line point estimate of the conditional forecasts in the BVAR in differences which is computed as the median of the distribution of the conditional forecasts in this model Green line with crosses actual values The variables are all reported in terms of annual percentage changes except for the unemployment rate and the long-term interest rate which are in levels Conditioning assumptions for the bank balance sheet channel ESI HICP the credit impulse the private credit volumes (debt-to-GDP ratio) and bank lending rates for households and firms (CFCI) Conditioning assumptions uncertainty channel ESI HICP the policy uncertainty indicator the CISS and the VIX Due to the high contemporaneous correlation between real GDP growth and the ESI indicator the ESI indicator contains the same forecasting information as real GDP ESI indicator is used in the conditioning set instead of real GDP variable in order to also illustrate conditional forecasts for real GDP Source DG ECFIN MATLAB codes replication files of the methodological paper (Banbura et al 2015)
Real GDP
2005 2010 2015-10
-5
0
5Government consumption
2005 2010 2015-2
0
2
4Real consumption
2005 2010 2015-2
0
2
4
Real investment
2005 2010 2015-20
-10
0
10Unemployment rate
2005 2010 20150
5
10
15PPI ex const
2005 2010 2015-50
0
50
Loans to firms
2005 2010 2015-10
0
10
20Loans to households
2005 2010 2015-10
0
10
20Long-term i r
2005 2010 20150
2
4
6
Real GDP
2005 2010 2015-10
0
10Government consumption
2005 2010 2015-2
0
2
4Real consumption
2005 2010 2015-5
0
5
Real investment
2005 2010 2015-20
0
20Unemployment rate
2005 2010 20150
5
10
15PPI ex const
2005 2010 2015-50
0
50
Loans to firms
2005 2010 2015-10
0
10
20Loans to households
2005 2010 2015-10
0
10
20Long-term i r
2005 2010 20150
5
10
III Confidence spillovers in the euro area
Volume 15 No 2 | 33
III1 Introduction
During the recent crisis euro area private consumption fell substantially This was accompanied by a sharp decline in consumer confidence which many observers have identified as a key factor contributing to the persistence of the slowdown In fact the onset of the crisis coincided with an abrupt unwinding of imbalances that is of economic trends that turned out to be unsustainable and which led to a significant adjustment of expectations Both consumption growth rates and confidence levels have been improving since the start of 2013
There is some (mixed) evidence to suggest that fluctuations in consumer confidence affect the dynamics of private consumption (67) On the basis of this assumption and taking into account the unprecedented extent of the most recent crisis it is important to determine whether and to what extent confidence shocks spill over between countries This is particularly relevant in relation to the euro area where close trade and financial links and common institutional features can lead to the rapid propagation of shocks In addition confidence spillovers can be an important aspect to consider when discussing how to improve macroeconomic policymaking in a common currency area
This section reviews the evidence on the link between consumer confidence and private consumption and on cross-border confidence spillovers and presents some analysis of the transmission of confidence shocks across the euro area It is a follow-up to analysis discussed in
(66) This section was prepared by Francesca DrsquoAuria (67) See for a discussion Ludvigson SC 2004 lsquoConsumer
confidence and consumer spendingrsquo Journal of Economic Perspectives Vol 18(2) pp 29-50
previous issues of the Quarterly Report on the Euro Area (QREA) (68)
III2 Recent trends in consumer confidence and private consumption in the euro area
Graph III1 shows the evolution over the period 1995Q2-2016Q1 of euro area real private consumption and consumer confidence The latter is measured by the Consumer Confidence Indicator constructed by the European Commission as part of the Joint Harmonised EU Programme of Business and Consumer Surveys (BCS) (69)
There is close co-movement between the two variables Both real consumption growth and consumer confidence showed the greatest deterioration in the first quarter of 2009 and during the sovereign debt crisis They have been on a recovery path since early 2013 with consumer confidence reaching levels above the euro area long-term average since the first quarter of 2014
The relationship between consumer confidence and private consumption is much debated in the literature From a theoretical perspective there are two main competing theories One view is that confidence indicators can help predict the dynamics of consumption as they convey information about future economic conditions Another theory is that the link between the two variables can be interpreted in terms of lsquoanimal
(68) DrsquoAuria F lsquoCross-border spillovers in confidencersquo Quarterly
Report on the Euro Area (2013) Vol 12(3) pp26-30 DrsquoAuria F S Linden D Monteiro J in lsquot Veld and S Zeugner
lsquoCross-border spillovers in the euro arearsquo Quarterly Report on the Euro Area (2014) Vol 13(4) pp7-22
(69) See European Commission (2016) lsquoA user guide to the Joint Harmonised EU Programme of Business and Consumer Surveysrsquo for details on the construction of the indicators
In recent years there has been close co-movement between consumer confidence and private consumption in the euro area During the crisis in particular consumer confidence was identified by many commentators as a driving factor in its persistence as expectations about a sustainable path of economic growth were adjusted significantly In view of the unprecedented extent of the crisis the question of whether and to what extent changes in consumer confidence in one country could spill over to other countries was also raised This section discusses the relationship between consumer confidence and consumption and reviews the evidence of consumer confidence spillovers between euro area countries We conclude that there is some evidence to suggest that confidence shocks are transmitted between countries This conclusion is corroborated by results from the estimation of a Global Vector Autoregressive (GVAR) model for a number of euro area countries (66)
34 | Quarterly Report on the Euro Area
spiritsrsquo as confidence indicators capture fluctuations in beliefs which in turn affect consumption (70) In both cases the essence of confidence indicators is to gauge expectations ndash irrespective of how they are formed ndash about the future course of the economy which then have a knock-on effect on current consumer behaviour
Graph III1 Confidence and private consumption euro area
(1995Q2-2016Q1 q-o-q change)
Source Eurostat and DG ECFIN calculations based on EU Business and Consumer Surveys
Several studies test empirically the link between consumer confidence and private consumption A number of them find evidence in support of a strong correlation between consumer confidence and consumption (71)
However as confidence and consumption are to a large extent determined by the same factors other studies try to assess whether confidence indicators carry information beyond economic fundamentals The evidence on this issue is mixed although several studies conclude that confidence indicators play a significant role There is some evidence to suggest that while part of the information conveyed by confidence indicators is also captured by other variables (eg past consumption income and interest rates) confidence measures have an additional predictive power for the future path of
(70) See Barsky and Sims (2012) for a discussion of the different
theoretical approaches to the role of confidence Barsky R B and ER Sims (2012) lsquoInformation animal spirits and the meaning of innovations in consumer confidencersquo American Economic Review 102(4) pp 1343-1377
(71) See for example Carroll C J Fuhrer and D Wilcox (1994) lsquoDoes consumer sentiment forecast household spending If so whyrsquo American Economic Review Vol 84 pp 1397-1408
consumer spending (72) Moreover some papers find that confidence indicators have a stronger predictive power during periods of large economic fluctuations (73)
III3 The existing evidence on confidence spillovers
On the assumption that a causal relationship between consumer confidence and private consumption exists it is important to determine whether and to what extent changes in consumer confidence in one country affect confidence (and thus consumption) in others
There is some evidence to support the existence of confidence spillovers This pertains both to confidence shocks originating in the US and being transmitted to the euro area and shocks which occur in one euro area country and spill over to other euro area countries
Several studies provide evidence of a transmission channel of confidence shock to foreign confidence In particular evidence for G7 countries and Spain would suggest that variations in confidence generally spill over from large countries to smaller ones (74) Some studies support the idea that confidence shocks originating in US are transmitted to the euro area but not the other way round ie shocks to euro area confidence do not affect confidence in the US (75) Other studies show a transmission channel for confidence shocks
(72) Some authors eg Ludvigson (2004) Souleles (2004) and Lahiri
Monokroussos and Zhao (2016) conclude that including confidence indicators can reduce forecasting errors when predicting the dynamics of consumption while others reach the opposite conclusion (eg Claveria Pons and Ramos 2007)
Ludvigson S (2004) lsquoConsumer confidence and consumer spendingrsquo Journal of Economic Perspectives Vol 18(2) pp 29-50
Souleles NS (2004) lsquoExpectations heterogenous forecast errors and consumption Micro evidence from the Michigan Consumer Sentiment Surveysrsquo Journal of Money Credit and Banking Vol 36 pp 39-72
Lahiri K G Monokroussos and Y Zhao (2016) lsquoForecasting consumption the role of consumer confidence in real time with many predictorsrsquo Journal of Applied Econometrics forthcoming
Claveria O E Pons and R Ramos (2007) lsquoBusiness and consumer expectations and macroeconomic forecastsrsquo International Journal of Forecasting Vol 23 pp47-69
(73) For example Howrey E (2001) lsquoThe predictive power of the index of consumer sentimentrsquo Brookings Papers on Economic Activity Vol 1 pp 175-216
(74) Fei S (2011) lsquoThe confidence channel for the transmission of shocksrsquo Banque de France Working Paper No 314
(75) Deacutees S and P Soares-Brinca (2013) lsquoConsumer confidence as a predictor of consumption spending Evidence for the United States and the Euro Arearsquo International Economics Vol 134 pp 1-14
-40
-30
-20
-10
0
10
1995Q2 1998Q2 2001Q2 2004Q2 2007Q2 2010Q2 2013Q2-08
-04
00
04
08
12
16Consumption (rhs)Consumer Confidence Indicator
III Confidence spillovers in the euro area
Volume 15 No 2 | 35
(Continued on the next page)
Box III1 A GVAR model to assess confidence spillovers
The Global Vector Autoregressive (GVAR) methodology developed by Pesaran Schuermann and Weiner (2004) (1) combines individual vector error-correcting models where domestic variables are linked to country-specific foreign variables The latter combine the domestic variables using international trade financial or other relevant weights for each country This approach allows the analysis of interdependence across different economies providing a solution to the lsquocurse of dimensionalityrsquo (eg the high number of parameters as the dimension of the model increases) in global modelling
For a set of countries i=0 1 2 hellip N the individual VARX(pi qi) models take the following form
itqtiiqtiiitiiptiiptiiit uxxxxxxii
+Λ++Λ+Λ+Φ++Φ= minusminusminusminus
11
011
where xit is a vector of ki x 1 vector of domestic variables xit a ki x 1 vector of foreign variables and
00
===
iijt
N
jijit xx ωω
where ωij j=01hellipN is a set of weights such that 10
==
N
jijω The foreign variables xit are therefore a
weighted average of domestic variables for all countries included in the model The weights can be different in nature but are typically constructed using trade or capital flows data The GVAR model is then solved for the lsquoworldrsquo (ie all countries included in the model) as a whole considering all variables as endogenous to the system
The GVAR model has been applied to a variety of issues These include forecasting (eg Pesaran Schuermann and Smith 2009) credit risk (eg Pesaran Schuermann and Treutler 2007) oil price shocks (eg Galesi and Lombardi 2009) global imbalances (eg Bussiegravere Chudik and Sestieri 2012) business cycle synchronisation (eg Dreger and Zhang 2013) the impact of EU membership (eg Pesaran Smith and Smith 2007) the international effects of fiscal policy shocks (eg Favero Giavazzi and Perego 2011) (2) Chudik and Pesaran (2014) provide a detailed review of these and other recent applications (3)
In this section this approach is used to analyse the transmission of country-specific and global consumer confidence shocks in a model which includes eight euro area countries (Austria Belgium Finland France Germany Italy the Netherlands and Spain) using quarterly data over the period 1996Q2-2013Q1 The model is solved using the GVAR Toolbox developed by Smith and Galesi (2014) (4)
(1) Pesaran MH Schuermann T and Weiner S M (2004) lsquoModelling regional interdependencies using a global error-correcting
modelrsquo Journal of Business and Economic Statistics Vol 22 pp 129-162 (2) Pesaran M H Schuermann T and Smith LV (2009) lsquoForecasting economic and financial variables with global VARsrsquo
International Journal of Forecasting Vol 25(4) pp 642-675 Pesaran MH Schuermann T and Treutler B-J (2007) lsquoGlobal business cycles and credit riskrsquo in The Risks of Financial Institutions NBER Chapters pp 419-474 Bussiegravere M Chudik A and Sestieri G (2012) lsquoModelling global trade flows results from a GVAR modelrsquo Globalization and Monetary Policy Institute Working Paper 119 Federal Reserve Bank of Dallas Dreger C and Zhang Y (2013) lsquoDoes the economic integration of China affect growth and inflation in industrial countriesrsquo FIW Working Paper series 116 FIW Pesaran M H Smith L V and Smith R P (2007) lsquoWhat if the UK or Sweden had joined the euro in 1999 An empirical evaluation using a Global VARrsquo International Journal of Finance and Economics Vol 12(1) pp 55-87 Favero C Giavazzi F and Perego F (2011) lsquoCountry heterogeneity and the international evidence on the effects of fiscal policyrsquo IMF Economic Review 59(4) 652-682
(3) Chudik A and Pesaran MH (2014) lsquoTheory and Practice of GVAR Modelingrsquo Federal Reserve Bank of Dallas Globalization and Monetary Policy Institute Working Paper No 180
(4) Smith LV and Galesi A (2014) GVAR Toolbox 20 available at httpssitesgooglecomsitegvarmodellinggvar-toolbox
36 | Quarterly Report on the Euro Area
between the US the euro area as a whole and four EU countries taken individually (76)
In addition the role of consumer confidence spillovers in the euro area was assessed in a previous issue of the QREA (77) Consumption and confidence regressions were carried out for a panel of euro area countries over the period 1999-2012 The findings support the existence of confidence spillovers between euro area countries
III4 Confidence spillovers across the euro area
Table III1 shows simple correlations between the confidence indicators of eight euro area countries over the period 1995Q4-2016Q1 (78)The strength of the link between consumer confidence indicators across Member States is variable and in most cases is larger between neighbouring countries and between countries sharing similar macroeconomic environments (79)
Table III1 Consumer Confidence Indicator mdash Correlation Matrix
(1995Q4-2016Q1)
(1) Not statistically significant at conventional levels Source DG ECFIN calculations based on EU Business and Consumer Surveys
(76) Deacutees S and J Guntner (2014) lsquoThe international dimension of
confidence shockrsquo ECB Working Paper No 1669 (77) Op cit DrsquoAuria F (2013) (78) The very low and non-statistically significant correlation of the
Italian confidence indicator with the confidence indicators of a number of other euro area countries is somewhat puzzling and there is a need for further investigation into the reasons behind it
(79) The strong correlation between confidence indicators in countries sharing similar economic conditions can be indicative of larger confidence spillovers between them but can also be a reflection of the strong correlation between their economic fundamentals
The strength of the correlation also varies considerably over time Table III2 displays correlations between consumer confidence indicators in the same euro area countries over the period 2008Q1-2012Q4 During the crisis period the link between consumer confidence indicators is significantly tighter
Table III2 Consumer Confidence Indicator mdash Correlation Matrix
(2008Q1-2012Q4)
(1) Not statistically significant at conventional levels Source DG ECFIN calculations based on EU Business and Consumer Surveys
The presence of a correlation between confidence indicators may point to the existence of confidence spillover effects between countries but also be indicative of strong business cycle synchronisation To shed light on the nature of these correlations this section discusses confidence spillovers in the euro area on the basis of the findings from the estimation of a Global Vector Autoregressive (GVAR) model which includes data for eight euro area countries over the period 1996Q2-2013Q1 Box III1 describes the model in more detail
The model includes observations on consumption GDP the unemployment rate a short-term interest rate and consumer confidence The latter is measured by the BCS Consumer Confidence Indicator which is an arithmetic average of the balances of the answers to questions on the financial situation of households the general economic situation unemployment expectations and savings over the next 12 months It is therefore taken as a proxy for consumersrsquo expectations about their future economic situation
The results seem to support the existence of consumer confidence spillovers across the euro area As an illustration Graph III2 reports impulse
AT BE FI FR IT DE NL ES
AT 100 069 069 074 013(1) 054 043 022BE 069 100 067 088 055 057 068 066FI 069 067 100 068 039 028 075 055FR 074 088 068 100 046 055 066 060IT 013(1) 055 039 046 100 004(1) 063 081DE 054 057 028 055 004(1) 100 033 023NL 043 068 075 066 063 033 100 073ES 022 066 055 060 081 023 073 100
AT BE FI FR IT DE NL ES
AT 100 093 090 088 036(1) 079 086 063BE 093 100 081 080 034(1) 080 081 071FI 090 081 100 083 058 052 081 066FR 088 080 083 100 030(1) 066 074 061IT 036(1) 034(1) 058 030(1) 100 -016(1) 065 038DE 079 080 052 066 -016(1) 100 050 048NL 086 081 081 074 065 05 100 050ES 063 071 066 061 038 048 050 100
Box (continued)
by the European Commission Consumption and GDP enter the model in log differences while the other variables are in levels Some of the results are discussed in the main text
III Confidence spillovers in the euro area
Volume 15 No 2 | 37
response functions of consumer confidence in the euro area countries included in the GVAR model to a positive shock to consumer confidence in Germany over 24 quarters (80)
The largest effect appears to be in smaller neighbouring countries (Austria Belgium and the Netherlands) The response of consumer confidence is also relatively large in Finland France and Spain On the other hand spillovers to consumer confidence in Italy are very small and become negative after six quarters This is not a surprise given the statistically insignificant correlation between German and Italian consumer confidence emerging from the data reported in Table III1 The peak response occurs in the second or third quarter
Similar results although of a smaller magnitude were obtained for the other euro area countries included in the model Confidence spillovers appear to be larger across countries with stronger geographical and trade links Overall the evidence from the estimation of the model supports the existence of a transmission channel for consumer confidence shocks across the euro area However the effects of confidence shocks on foreign consumption are in most cases not statistically significant suggesting that the transmission channel is to foreign confidence rather than
(80) A caveat must be made about the difficulty of identifying truly
exogenous confidence shocks owing to the fact that confidence indicators are largely driven by the same factors which determine consumption
directly to foreign economic activity (81)
These results suggest that confidence shocks play a role in the international business cycle and that there are close interlinkages between confidence indicators across euro area countries This evidence supports the need for coordinated policy action able to boost confidence across euro area countries
III5 Conclusions
In recent years the dynamics of euro area consumer confidence and real private consumption have been very closely related Moreover consumer confidence indicators across the euro area appear to be strongly correlated The strength of the correlation was considerably greater during the crisis period
The evidence of a link between real consumption and consumer confidence is mixed but several studies are supportive of consumer confidence playing a role in determining consumption In addition there is evidence to suggest that shocks to consumer confidence in euro area countries affect confidence in other euro area Member States This is also borne out by results obtained from the estimation of a Global Vector Autoregressive (GVAR) model for eight euro area countries
(81) Similar conclusions are reached by op cit Deacutees and Soares-Brinca
(2013) and Deacutees and Guntner (2014)
38 | Quarterly Report on the Euro Area
Graph III2 Impulse response functions of foreign confidence to a one standard error confidence shock in Germany
Source DG ECFIN
000
005
010
015
020
025
030
035
1 2 3 4 5 6 7 8 9 10 11 12 13 14 15 16 17 18 19 20 21 22 23 24
AT
000
005
010
015
020
025
030
035
040
1 2 3 4 5 6 7 8 9 10 11 12 13 14 15 16 17 18 19 20 21 22 23 24
BE
000
005
010
015
020
025
030
1 2 3 4 5 6 7 8 9 10 11 12 13 14 15 16 17 18 19 20 21 22 23 24
FI
000
005
010
015
020
025
030
1 2 3 4 5 6 7 8 9 10 11 12 13 14 15 16 17 18 19 20 21 22 23 24
FR
-002
-001
000
001
002
003
004
005
006
007
1 2 3 4 5 6 7 8 9 10 11 12 13 14 15 16 17 18 19 20 21 22 23 24
IT
000
005
010
015
020
025
030
035
040
1 2 3 4 5 6 7 8 9 10 11 12 13 14 15 16 17 18 19 20 21 22 23 24
NL
000
005
010
015
020
025
030
035
1 2 3 4 5 6 7 8 9 10 11 12 13 14 15 16 17 18 19 20 21 22 23 24
ES
40 | Quarterly Report on the Euro Area
Editors Jose Eduardo Leandro and Martin Larch
Coordination Plamen Nikolov
Statistical and layout assistance Christos Zavos
Comments on the report would be gratefully received and should be sent to
Jose Eduardo Leandro Director ndash Policy strategy coordination and communication Directorate-General for Economic and Financial Affairs Office CHAR 1566
B-1049 Brussels
Email joseleandroeceuropaeu
or
Martin Larch Head of Unit ndash EMU deepening and macroeconomy of the euro area Directorate-General for Economic and Financial Affairs Office CHAR 1556
B-1049 Brussels
Email martinlarcheceuropaeu
EUROPEAN ECONOMY INSTITUTIONAL SERIES
European Economy Institutional series can be accessed and downloaded free of charge from the following address httpeceuropaeueconomy_financepublicationseeipindex_enhtm Titles published before July 2015 can be accessed and downloaded free of charge from bull httpeceuropaeueconomy_financepublicationseuropean_economyindex_enhtm
(the main reports eg Economic Forecasts) bull httpeceuropaeueconomy_financepublicationsoccasional_paperindex_enhtm
(the Occasional Papers) bull httpeceuropaeueconomy_financepublicationsqr_euro_areaindex_enhtm
(the Quarterly Reports on the Euro Area)
Alternatively hard copies may be ordered via the ldquoPrint-on-demandrdquo service offered by the EU Bookshop httpbookshopeuropaeu
HOW TO OBTAIN EU PUBLICATIONS Free publications bull one copy
via EU Bookshop (httpbookshopeuropaeu) bull more than one copy or postersmaps
- from the European Unionrsquos representations (httpeceuropaeurepresent_enhtm) - from the delegations in non-EU countries (httpeeaseuropaeudelegationsindex_enhtm) - by contacting the Europe Direct service (httpeuropaeueuropedirectindex_enhtm) or calling 00 800 6 7 8 9 10 11 (freephone number from anywhere in the EU) () () The information given is free as are most calls (though some operators phone boxes or hotels may charge you)
Priced publications bull via EU Bookshop (httpbookshopeuropaeu)
ISBN 978-92-79-54335-7
KC-BC-16-030-EN-N
- NEW_IP_index_enpdf
-
- EUROPEAN EconomY institutional SERIES
-

II Financial channels and economic activity in the euro area
Volume 15 No 2 | 23
financial system additional measures need to be used to track their effect namely the shadow rate which is a factor model-based estimate of the short-term interest rate unconstrained by the ZLB (52) Likewise the excess liquidity defined as the liquidity held by the euro area banking sector in excess of the aggregate needs arising from minimum reserve requirements and autonomous factors is another quantitative-based indicator of the monetary policy stance as it is driven by the ECBrsquos refinancing operations
Graph II3 shows the dynamics of the variables described above in the period Q1-1996 - Q1-2016 which suggest that monetary conditions have been very supportive in recent years While short-term interest rates attained the ZLB monetary easing through unconventional measures is reflected in a significant decline in the shadow rate as well as long-term rates
Graph II3 Interest rate channel (2000Q1-2016Q1 )
Source Eurostat Bloomberg Reserve Bank of New Zealand
The borrower balance sheet channel reflects the fact that it is the net worth of borrowers that determines the external finance premium ie the opportunity cost of borrowing over using internal savings In other words it is the value of borrowersrsquo collateral that affects their credit conditions As indicated above fluctuations in
(52) There different shadow rates available all being subject of
significant model uncertainty The shadow rate used is based on Krippner (2012) and available from the Reserve Bank of New Zealand website
Krippner L (2012) lsquoMeasuring the stance of monetary policy in zero lower bound environmentsrsquo Economics Letters Vol 118 Issue 1 pp 135ndash138
asset prices can affect the ability of non-financial corporations and households to borrow and thus their investment and spending decisions While monetary policy commonly does not target asset prices its actions can affect the valuation of assets used as collateral which affects the credit available for investment and consumption spending (53) Whereas the previous discussion focuses on the demand side of credit the borrower balance sheet channel affects also the supply of credit Namely weak borrower balance sheets might induce credit rationing by the lenders and affect overall credit conditions
The borrower balance sheet channel can be captured mainly by variables that reflect the risks related to the balance sheets of firms and households as borrowers from the banking sector or from capital markets While there are no readily available direct measures of the quality of private balance sheets comparable across countries asset prices can be considered as indicative of their quality as they give the value of collateral for loans and of equity Therefore house prices and stock prices are generally used in the analysis to track this channel
Graph II4 Borrower balance sheet channel
(2000Q1-2016Q1)
Source Bloomberg BIS
Graph II4 suggests that developments in house prices and stock prices have been quite
(53) There is empirical evidence especially for the US stressing the
importance of asset prices and different credit spreads as leading indicator of economic activity eg Stock and Watson (2003) Stock J H and M W Watson (2003) lsquoForecasting output and inflation the role of asset pricesrsquo Journal of Economic Literature Vol 41 No 3 pp 788-829
-10
-5
0
5
10
15
20
25
2000Q1 2004Q1 2008Q1 2012Q1 2016Q1
Short-term interest rateLong-term interest rateShadow rate (Krippner)ECB Excess Liquidity Index
-6
-4
-2
0
2
4
6
8
10
-60
-40
-20
0
20
40
60
2000Q1 2002Q3 2005Q1 2007Q3 2010Q1 2012Q3 2015Q1
MSCI EURO Index y-o-y change
Housing prices y-o-y change
24 | Quarterly Report on the Euro Area
disconnected in recent years Specifically while house prices only started to recover in 2014 stock prices peaked in early 2015 and experienced a downward correction since then
The bank balance sheet channel relates to the fact that how much a bank lends depends on its own balance sheet and the different risks involved in its business model External developments (including monetary policy actions but also longer-term factors such as financial regulation and innovations in the banking sector) may affect bank liabilities (the supply of loanable funds and also bank funding costs) and in turn assets (supply of credit and the lending cost) (54) Bank lending is determined by banksrsquo business models it usually increases with the increase in leverage in the economy while deleveraging episodes may significantly hamper lending activities This makes leverage highly pro-cyclical (55) Importantly the impact of bank balance sheets on the real economy can be more pronounced in the euro area than in capital-market based systems as alternative forms of financing are relatively undeveloped
The bank balance sheet channel can thus be illustrated by variables such as banking leverage the stock of non-performing loans banksrsquo funding costs or the price of Credit Default Swaps (CDS) However reliable data for the euro area are relatively short available only for the period since the beginning of the crisis Indeed the lack of knowledge about the quality of bank balance sheets was an important aspect of the euro area financial crisis and a reason for the implementation of the Asset Quality Review (AQR) by the ECB in 2014 Therefore for the analysis in this section measures which directly track the supply of credit have been used instead (56) Namely the flow of credit as measured by the credit impulse (ie the change in new credit granted by the banking sector as a percentage of GDP) the stock of credit on banksrsquo balance sheet as measured by total economy credit as a percentage of GDP and the price of credit as measured by the Composite Financing Conditions Indicator (CFCI) for non-financial corporations
(54) Bernanke B and A Blinder (1988) lsquoCredit money and aggregate
demandrsquo the American Economic Review Vol78 No 2 pp 435ndash439 (55) Adrian T and H S Shin (2010) lsquoLiquidity and leveragersquo Journal of
Financial Intermediation Vol 19 Issue 3 pp 418-437 (56) In practice the lending volumes and rates can be affected both by
supply and demand side
which (assuming a constant mark-up) proxies bank funding costs (57)
Graph II5 shows that there is a negative correlation between the credit impulse and credit as a percentage of GDP Thus during downturns the flow of new credit declines while the ratio of credit to GDP increases due to the collapse of GDP The credit impulse indicator shows that the supply of new credit has been fairly limited since the onset of the global financial crisis The CFCI tracks the ECB policy rates rather closely with the exception of the euro area sovereign debt crisis episode (2011-2012) when financing costs increased due to idiosyncratic increases in some Member States reflecting financial market fragmentation
Graph II5 Bank balance sheet channel (2000Q1-2016Q1)
Source Capital Economics BIS DG ECFIN
While the previous channels are related to the quality of balance sheets either on the borrower or the lender side some shocks can originate in the overall financial system Examples are liquidity shocks or confidence shocks These shocks work both via the balance sheets but also by directly altering agents decisions through precautionary motives affecting both investment and consumption behaviour These mechanisms are defined as the uncertainty channel (58)
(57) For more details on CFCI calculations see European Commission
(2013) Drivers of diverging financing conditions across Member States Quarterly Report on the Euro Area Vol12 No1
(58) Bloom (2009) point to uncertainty shocks (that might be related but also unrelated to the financial system) as a crucial driver of economic dynamics Recently Caldara et al (2016) argue for the needs to distinguish uncertainty shocks from financial shocks while both of them are important source of macroeconomic
-8
-6
-4
-2
0
2
4
6
8
10
2000Q1 2003Q1 2006Q1 2009Q1 2012Q1 2015Q1
Total credit on GDP y-o-y change
Credit impulse (new crediton GDP y-o-y change)
Composite financingconditions indicator
II Financial channels and economic activity in the euro area
Volume 15 No 2 | 25
The uncertainty channel is captured by variables reflecting the different types of uncertainty that can affect the economy One type is commonly related to increased volatility in financial markets Given a high degree of global interconnectedness the euro area economy can be affected by uncertainty related to global financial developments which is usually measured by the implied volatility of SampP 500 index options (VIX) (59) The euro area specific stress in the financial system is measured through the ECBrsquos Composite Indicator of Systemic Stress (CISS)
Another type of uncertainty is linked to swings in business and consumer confidence Variations in the confidence of euro area households and non-financial firms are illustrated through the European Commissionrsquo confidence indicator the Economic Sentiment Indicator (ESI) which is based on data collected through business and consumer surveys However the indicator exhibits a very high contemporaneous correlation with actual GDP growth indicating that its dynamics are likely to reflect very accurately economic conditions rather than information related to exogenous changes in confidence
Finally unexpected outcomes of economic policy decisions can lead to policy uncertainty which in turn can have adverse effects on the savings and investment behaviour of firms and households Policy uncertainty is illustrated through an indicator based on newspaper coverage of uncertainty-generating events (60)
Graph II6 indicates that there is an apparent co-movement among these indicators even if they measure different types of uncertainty While economic sentiment has been gradually improving and uncertainty related to financial markets has eased the policy uncertainty affecting the euro area is still relatively high
fluctuations separately the Great Recession was likely outcome of the toxic interaction between the two
Bloom N (2009) lsquoThe impact of uncertainty shocksrsquo Econometrica Vol 77 Issue 3 pp 623-685
Caldara D C Fuentes-Albero S Gilchrist and E Zakrajšek (2014) lsquoThe macroeconomic impact of financial and uncertainty shocksrsquo European Economic Review forthcoming
(59) The VIX is calculated by the Chicago Board Options Exchange (CBOE)
(60) Baker S R N Bloom and S J Davis (2015) lsquoMeasuring economic policy uncertaintyrsquo National Bureau of Economic Research Working Paper No 21633 Data source wwwpolicyuncertaintycom
Graph II6 Uncertainty channel (2000Q1-2016Q1)
Source Chicago Board of Exchange ECB wwwpolicyuncertaintyorg
II4 Financial developments and economic activity
This sub-section provides stylised facts on the transmission channels defined above and show whether and how financial developments have affected the real side of the euro area economy since the crisis (namely consumption investment unemployment and long-term interest rates)
While financial variables are available in real time macroeconomic variables are normally released with lags Therefore conditioning macroeconomic forecasts on observed financial developments (ie a projection of macro variables on the observed paths of financial variables) can improve forecasts as more informative data are taken into account Several empirical studies have shown that financial variables can improve macroeconomic forecasts (61)
The methodology underlying this this section is a large-scale Bayesian VAR with 35 macroeconomic
(61) Stock and Watson (2003) provide a seminar contribution on the
role of financial variables namely asset prices for GDP and inflation forecast concluding that different financial variables allow macroeconomic forecasting in different times Espinosa et al (2012) document using standard VAR approach that financial variables improve GDP forecast for the euro area especially in the real time when numerous financial variables are available ahead of the macroeconomic releases
Stock J H and M W Watson (2003) lsquoForecasting output and inflation the role of asset pricesrsquo Journal of Economic Literature Vol 41 No 3 pp 788-829
Espinoza R F Fornari and M J Lombardi (2012) lsquoThe role of financial variables in predicting economic activityrsquo Journal of Forecasting Vol 31 No 1 pp 15-46
0
50
100
150
200
250
300
0
10
20
30
40
50
60
70
80
2000Q1 2002Q3 2005Q1 2007Q3 2010Q1 2012Q3 2015Q1
VIX
CISS
ESI (rhs)
Policy uncertainty (rhs)
26 | Quarterly Report on the Euro Area
and financial variables (62) The model is estimated for the sub-period Q1-2000 - Q4-2011 which covers both normal and crisis times but does not include some of the most important unconventional monetary policy measures Given the estimated past correlations a counterfactual path for the macroeconomic and financial variables (ie a distribution of conditional forecasts) can be obtained for the entire period Q1-2000 - Q4-2015 conditional on observed real GDP and inflation in the baseline case The deviations of the observed developments of financial variables from this counterfactual path can be interpreted as evidence of instability in the relationship between financial variables and economic activity (as measured by GDP growth and inflation) since the crisis
Subsequently the conditional set from the baseline case (including only real GDP and inflation) is extended by financial and uncertainty variables corresponding to each transmission channel described above (63)
Some recent developments are puzzling
Graph II7 shows the counterfactual paths of the main GDP components producer prices the unemployment rate and the long-term interest rate conditional on observed economic activity (real GDP and inflation) It also shows the conditional forecasts for the balance sheet variables of households and firms when only real GDP and inflation are taken into account in the conditioning set
(62) Alternative strand of literature using rich set of data in order to
nowcast or forecast employs dynamic factors models where data dimension is reduced in a first step by factor estimation with common factors being consequently used in the forecasting exercize see eg Giannone et al (2008) Bellego and Ferrara (2012) find using factor-augmented probit model that financial variables allow tracking better recession periods in the euro area (in the pre-crisis period) with optimal lead of financial variables over recession of around one year
Giannone D L Reichlin L and D Small (2008) lsquoNowcasting the real-time informational content of macroeconomic datarsquo Journal of Monetary Economics Vol 55 Issue 4 pp 665ndash676
Belleacutego C and L Ferrara (2012) lsquoMacro-financial linkages and business cycles A factor-augmented probit approachrsquo Economic Modelling Vol 29 pp 1793-1797
(63) For more details on the methodology see Box IV1 in European Commission (2015) lsquoInvestment dynamics in the euro area since the crisisrsquo Quarterly Report on the Euro Area Vol 14 No 1 pp 35-43
Bańbura M D Giannone and M Lenza (2015) lsquoConditional forecasts and scenario analysis with vector autoregressions for large cross-sectionsrsquo International Journal of Forecasting Vol 31 Issue 3 pp 739ndash756
The results suggest that private consumption was unusually low during the period of the euro area debt crisis and deleveraging (2012-2013) while it overshot during the recent recovery (from 2014 onward) Investment behaved in line with historical correlations during both downturn episodes (2008-2009 and 2012-2013) and was weak during the deleveraging phase because overall output growth was weak However its recent recovery (since 2014) has been more subdued than what the pace of economic activity would have predicted the observed investment path is positioned on the lower tail of the distribution of conditional forecasts) (64)
Large deleveraging pressures in the public sector have led to a significant decline in the euro area aggregate government consumption over the period 2011-2012 However this decline had almost been reversed by the end of 2014 with public consumption starting to overshoot from 2015 onwards (relative to its counterfactual path obtained through conditioning on output growth) reflecting the aggregate euro area fiscal stance which started to turn mildly expansionary
Moreover the results show that several variables capturing price and balance sheet developments are still at odds with historical patterns In particular producer prices house prices long-term interest rates and loans to firms and households undershoot the distribution of the conditional forecasts On one side this underlines that the recent recovery is characterized by a historically low inflation environment and loose monetary conditions pushing the long-term rates down On the other side the ongoing balance sheet adjustment is translating into very weak credit dynamics due to unprecedented deleveraging pressures
Graph II8 illustrates the zero lower bound constraint on monetary policy rates and the subsequent break in the correlation of economic activity with the two measures of monetary policy
(64) There is some relative instability in the estimated correlations over
the sample period notably pre-crisis vs crisis years However it does not significantly affect the result on the unusual weakness in investment recovery since 2014 The article lsquoInvestment dynamics in the euro area since the crisisrsquo Quarterly Report on the Euro Area Vol 14 No 1 pp 35-43 found that estimating the past correlations only with the sample for the pre-crisis period the amplitude of the investment fall during the first downturn (2008-2009) would also be slightly underestimated by the conditional forecasts
II Financial channels and economic activity in the euro area
Volume 15 No 2 | 27
rates since 2012 Among all variables the consumer and business confidence indicator (ESI) comes out as having the strongest contemporaneous correlation with economic activity during the crisis
In the consecutive analysis the conditioning dataset (including only real GDP and inflation in the baseline) is augmented by financial variables corresponding to each transmission channel
hellip different channels play an important role at different stages since the crisis
The interest rate channel (Graph II9 upper panel) seems to better account for the pattern of consumption during the recent recovery (compared to the baseline) This channel which reflects mainly monetary conditions suggests that monetary easing implemented since 2014 by means of additional unconventional measures (namely the targeted long-term refinancing operations (TLTRO) the asset-backed securities purchasing program (ABSPP) and the forthcoming public
securities purchase program (PSPP)) have translated into a further decline in the long-term interest rate and the shadow policy rate It also reflects an increase in excess liquidity which has had a very benign effect on the recent recovery However producer prices developments (PPI) still appear unusually subdued Likewise including information capturing the interest rate channel does not help explain the dismal performance of consumption during the deleveraging phase (2012-2013) or the persistent weakness of credit dynamics Therefore these developments seem to be determined also by drivers other than monetary conditions
The borrowers balance sheet channel (Graph II9 lower panel) captures in turn the exceptional deleveraging developments of 20122013 but clearly underestimates the pace of the recent recovery This finding suggests that strained balance sheets of households and firms represented the main weight on the recovery at the time of euro area sovereign debt crisis However whereas a mild recovery started in the euro area in 2014 private
Graph II7 Conditional forecasts based on real GDP and inflation (1) (2000Q1-2015Q4 y-o-y growth)
Misalignments of financial and real variables with output growth since the crisis
(1) Shades of orange distribution of the conditional forecasts in the BVAR in levels excluding the lower and higher 5 quantiles Green line actual values The variables are all reported in terms of annual percentage changes except for the unemployment rate and the long-term interest rate which are in levels Conditioning assumptions real GDP and HICP Source DG ECFIN MATLAB codes replication files of the methodological paper (Banbura et al 2015)
Government consumption
2005 2010 2015-2
0
2
4Real consumption
2005 2010 2015-5
0
5Real investment
2005 2010 2015-20
-10
0
10
Unemployment rate
2005 2010 20150
5
10
15PPI ex const
2005 2010 2015-50
0
50House prices
2005 2010 2015-10
0
10
Long-term i r
2005 2010 20150
5
10Loans to firms
2005 2010 2015-10
0
10
20Loans to households
2005 2010 2015-5
0
5
10
28 | Quarterly Report on the Euro Area
balance sheets still did not improve much In fact when the borrower balance sheet channel is taken into account observed consumption overshoots the conditional forecast even by a higher margin than in the baseline scenario and real investment seems to be on the upper side as well This suggests that the borrower balance sheet channel should have led to more subdued dynamics of both consumption and investment than what has been observed in 2014 and 2015 indicating that other channels have been somewhat compensating the adverse effects of this channel
The bank balance sheet channel (Graph II10 upper panel) improves the forecast of investment since 2014 and reduces the uncertainty around the median for some variables such as consumption unemployment and long-term interest rate The good fit of investment dynamics indicates a strong correlation of investment with total economy credit developments both in terms of flows and stocks
Interestingly the bank balance sheet information namely the total economy credit as percentage of GDP (including credit to public sector) the private sector credit impulse and the price of credit for the private sector cannot capture the weak observed dynamics of outstanding loans to firms and households This shows that the private deleveraging process has been much stronger than the public sector deleveraging making private credit developments disconnected from GDP
growth (65) Therefore while the recovery in real activity has been rather weak the private credit dynamics have been even weaker Furthermore the modest recovery does not facilitate passive deleveraging (a decrease in the relative debt burden due to a growing economy ie denominator effect) and feeds the active deleveraging (a decrease of absolute level of debt ie nominator effect)
Finally the current long-term interest rate seems very low even when the financing costs for non-financial corporations (which also attained historical minima) are taken into account This underlines the importance of the ECBrsquos measures that imply very easy financing conditions in the foreseeable future
Last but not least the uncertainty channel (Graph II10) seems to improve the conditional forecast over the baseline in the same spirit as the bank balance sheet channel For example there is a good fit of investment indicating a strong correlation of investment with confidence and financial stress measures Equally the rebound in private consumption seems to be well captured by the uncertainty channel indicating that the recent decrease in financial markets stress has also been an important driver for consumption However in general the uncertainty channel is likely to be implicitly included in the bank balance sheet
(65) GDP is a denominator of the credit indicators in bank balance
sheet channel
Graph II8 Conditional forecasts based on real GDP and inflation (1) (2000Q1-2015Q4 y-o-y growth)
Business and consumer confidence and short-term interest rates
(1) Shades of orange distribution of the conditional forecasts in the BVAR in levels excluding the lower and higher 5 quantiles Green line actual values The variables are all reported in terms of annual percentage changes except for the unemployment rate and the long-term interest rate which are in levels Conditioning assumptions real GDP and HICP Source DG ECFIN MATLAB codes replication files of the methodological paper (Banbura et al 2015)
Economic sentiment
2005 2010 2015-15
-10
-5
0
5
10Short-term i r
2005 2010 2015-4
-2
0
2
4
6
8Shadow short-term interest rate
2005 2010 2015-6
-4
-2
0
2
4
6
II Financial channels and economic activity in the euro area
Volume 15 No 2 | 29
channel For example in periods of high uncertainty bank funding costs increase (bank balance sheet channel) and firms with weaker balance sheets cannot obtain credit for new loans (borrower balance sheet channel)
Overall the findings above suggest that while there is clear evidence of the transmission of monetary policy measures on financial variables and from financial variables to consumer lending rates the evidence on the effects on real activity is more complex with different channels playing an important role at different stages of the crisis The interest rate channel has helped the modest recovery since 2014 by supporting both public and private consumption growth and by partially compensating the balance sheet channel for both borrowers and banks The results in Graph II9 (lower panel) can be interpreted as showing that in the absence of massive monetary easing given the high level of debt in the economy and the wealth effects associated with house and asset prices decreases both private and public consumption growth could have been much more subdued than what it is currently observed
Graph II10 (both panels) illustrate the importance of the bank balance sheet and the uncertainty channel for capturing investment dynamics Weak investment growth is well captured both by credit developments as captured through the bank balance sheet channel and confidence effects through the uncertainty channel Real economic activity as measured by GDP growth while playing an important role does not seem to fully explain the subdued growth in investment since 2014 (Graph II7)
II5 Conclusions
The section discusses the nexus between financial and macroeconomic developments drawing some
lessons from the literature and providing some stylised facts on the main transmission channels through which financial developments have affected real economic activity since the crisis
While there is clear evidence of the transmission of monetary policy measures on financial variables and from financial variables to consumer lending rates the evidence on the effects on real activity is more complex with different channels playing an important role at different stages of the crisis
The state of private balance sheets seems to have significantly contributed to the poor performance of consumption during the euro area debt crisis and high debt levels still weigh on growth However given the still high level of debt the current mild recovery should be seen as a rather positive outcome The analysis suggests that easy monetary conditions seem to represent an important driver of the current recovery Another driver seems to be the balance sheets of banks which have gradually improved and allow better transmission of easy monetary conditions to the lending rates
Given the still high levels of debt in the economy and the wealth and confidence effects associated with house and asset prices corrections both private and public consumption growth could have been much more subdued than what it is currently observed were it not for the exceptional easing of monetary conditions
Unfortunately the recovery is still not strong enough to facilitate the deleveraging process The stock of debt and the ongoing deleveraging combined with adverse confidence effects still represent major impediments for a stronger recovery in investment Consequently there is a need to implement policy measures that allow dealing effectively with the debt overhang notably an effective framework for non-performing loans resolution
30 | Quarterly Report on the Euro Area
Graph II9 Conditional forecasts based on variables capturing the interest rate channel and borrower balance sheet channel (1)
(2000Q1-2015Q4 y-o-y growth)
Interest rate channel
Borrower balance sheet channel
(1) Shades of orange distribution of the conditional forecasts in the BVAR in levels excluding the lower and higher 5 quantiles Green line actual values The variables are all reported in terms of annual percentage changes except for the unemployment rate and the long-term interest rate which are in levels Conditioning assumptions interest rate channel ESI HICP the short-term interest rate the long-term interest rate the shadow interest rate and the ECB excess liquidity measure Conditioning assumptions borrower balance sheet channel ESI HICP house prices stock prices and outstanding loans to households and firms Due to the high contemporaneous correlation between real GDP growth and the ESI indicator the ESI indicator contains the same forecasting information as real GDP ESI indicator is used in the conditioning set instead of real GDP variable in order to also illustrate conditional forecasts for real GDP Source DG ECFIN MATLAB codes replication files of the methodological paper (Banbura et al2015)
Real GDP
2005 2010 2015-10
-5
0
5Government consumption
2005 2010 2015-2
0
2
4Real consumption
2005 2010 2015-5
0
5
Real investment
2005 2010 2015-20
-10
0
10Unemployment rate
2005 2010 20150
10
20PPI ex const
2005 2010 2015-50
0
50
House prices
2005 2010 2015-10
0
10
20Loans to firms
2005 2010 2015-10
0
10
20Loans to households
2005 2010 2015-10
0
10
20
Real GDP
2005 2010 2015-10
-5
0
5Government consumption
2005 2010 2015-2
0
2
4Real consumption
2005 2010 2015-5
0
5
Real investment
2005 2010 2015-20
-10
0
10Unemployment rate
2005 2010 20150
5
10
15PPI ex const
2005 2010 2015-50
0
50
Shadow short-term interest rate
2005 2010 2015-5
0
5
10Short-term i r
2005 2010 2015-5
0
5
10Long-term i r
2005 2010 20150
5
10
II Financial channels and economic activity in the euro area
Volume 15 No 2 | 31
Graph II10 Conditional forecasts based on variables capturing the bank balance sheet channel and uncertainty channel (1)
(2000Q1-2015Q4 y-o-y growth) Bank balance sheet channel
Uncertainty channel
(1) Shades of orange distribution of the conditional forecasts in the BVAR in levels excluding the lower and higher 5 quantiles Solid black line point estimate of the conditional forecasts in the BVAR in differences which is computed as the median of the distribution of the conditional forecasts in this model Green line with crosses actual values The variables are all reported in terms of annual percentage changes except for the unemployment rate and the long-term interest rate which are in levels Conditioning assumptions for the bank balance sheet channel ESI HICP the credit impulse the private credit volumes (debt-to-GDP ratio) and bank lending rates for households and firms (CFCI) Conditioning assumptions uncertainty channel ESI HICP the policy uncertainty indicator the CISS and the VIX Due to the high contemporaneous correlation between real GDP growth and the ESI indicator the ESI indicator contains the same forecasting information as real GDP ESI indicator is used in the conditioning set instead of real GDP variable in order to also illustrate conditional forecasts for real GDP Source DG ECFIN MATLAB codes replication files of the methodological paper (Banbura et al 2015)
Real GDP
2005 2010 2015-10
-5
0
5Government consumption
2005 2010 2015-2
0
2
4Real consumption
2005 2010 2015-2
0
2
4
Real investment
2005 2010 2015-20
-10
0
10Unemployment rate
2005 2010 20150
5
10
15PPI ex const
2005 2010 2015-50
0
50
Loans to firms
2005 2010 2015-10
0
10
20Loans to households
2005 2010 2015-10
0
10
20Long-term i r
2005 2010 20150
2
4
6
Real GDP
2005 2010 2015-10
0
10Government consumption
2005 2010 2015-2
0
2
4Real consumption
2005 2010 2015-5
0
5
Real investment
2005 2010 2015-20
0
20Unemployment rate
2005 2010 20150
5
10
15PPI ex const
2005 2010 2015-50
0
50
Loans to firms
2005 2010 2015-10
0
10
20Loans to households
2005 2010 2015-10
0
10
20Long-term i r
2005 2010 20150
5
10
III Confidence spillovers in the euro area
Volume 15 No 2 | 33
III1 Introduction
During the recent crisis euro area private consumption fell substantially This was accompanied by a sharp decline in consumer confidence which many observers have identified as a key factor contributing to the persistence of the slowdown In fact the onset of the crisis coincided with an abrupt unwinding of imbalances that is of economic trends that turned out to be unsustainable and which led to a significant adjustment of expectations Both consumption growth rates and confidence levels have been improving since the start of 2013
There is some (mixed) evidence to suggest that fluctuations in consumer confidence affect the dynamics of private consumption (67) On the basis of this assumption and taking into account the unprecedented extent of the most recent crisis it is important to determine whether and to what extent confidence shocks spill over between countries This is particularly relevant in relation to the euro area where close trade and financial links and common institutional features can lead to the rapid propagation of shocks In addition confidence spillovers can be an important aspect to consider when discussing how to improve macroeconomic policymaking in a common currency area
This section reviews the evidence on the link between consumer confidence and private consumption and on cross-border confidence spillovers and presents some analysis of the transmission of confidence shocks across the euro area It is a follow-up to analysis discussed in
(66) This section was prepared by Francesca DrsquoAuria (67) See for a discussion Ludvigson SC 2004 lsquoConsumer
confidence and consumer spendingrsquo Journal of Economic Perspectives Vol 18(2) pp 29-50
previous issues of the Quarterly Report on the Euro Area (QREA) (68)
III2 Recent trends in consumer confidence and private consumption in the euro area
Graph III1 shows the evolution over the period 1995Q2-2016Q1 of euro area real private consumption and consumer confidence The latter is measured by the Consumer Confidence Indicator constructed by the European Commission as part of the Joint Harmonised EU Programme of Business and Consumer Surveys (BCS) (69)
There is close co-movement between the two variables Both real consumption growth and consumer confidence showed the greatest deterioration in the first quarter of 2009 and during the sovereign debt crisis They have been on a recovery path since early 2013 with consumer confidence reaching levels above the euro area long-term average since the first quarter of 2014
The relationship between consumer confidence and private consumption is much debated in the literature From a theoretical perspective there are two main competing theories One view is that confidence indicators can help predict the dynamics of consumption as they convey information about future economic conditions Another theory is that the link between the two variables can be interpreted in terms of lsquoanimal
(68) DrsquoAuria F lsquoCross-border spillovers in confidencersquo Quarterly
Report on the Euro Area (2013) Vol 12(3) pp26-30 DrsquoAuria F S Linden D Monteiro J in lsquot Veld and S Zeugner
lsquoCross-border spillovers in the euro arearsquo Quarterly Report on the Euro Area (2014) Vol 13(4) pp7-22
(69) See European Commission (2016) lsquoA user guide to the Joint Harmonised EU Programme of Business and Consumer Surveysrsquo for details on the construction of the indicators
In recent years there has been close co-movement between consumer confidence and private consumption in the euro area During the crisis in particular consumer confidence was identified by many commentators as a driving factor in its persistence as expectations about a sustainable path of economic growth were adjusted significantly In view of the unprecedented extent of the crisis the question of whether and to what extent changes in consumer confidence in one country could spill over to other countries was also raised This section discusses the relationship between consumer confidence and consumption and reviews the evidence of consumer confidence spillovers between euro area countries We conclude that there is some evidence to suggest that confidence shocks are transmitted between countries This conclusion is corroborated by results from the estimation of a Global Vector Autoregressive (GVAR) model for a number of euro area countries (66)
34 | Quarterly Report on the Euro Area
spiritsrsquo as confidence indicators capture fluctuations in beliefs which in turn affect consumption (70) In both cases the essence of confidence indicators is to gauge expectations ndash irrespective of how they are formed ndash about the future course of the economy which then have a knock-on effect on current consumer behaviour
Graph III1 Confidence and private consumption euro area
(1995Q2-2016Q1 q-o-q change)
Source Eurostat and DG ECFIN calculations based on EU Business and Consumer Surveys
Several studies test empirically the link between consumer confidence and private consumption A number of them find evidence in support of a strong correlation between consumer confidence and consumption (71)
However as confidence and consumption are to a large extent determined by the same factors other studies try to assess whether confidence indicators carry information beyond economic fundamentals The evidence on this issue is mixed although several studies conclude that confidence indicators play a significant role There is some evidence to suggest that while part of the information conveyed by confidence indicators is also captured by other variables (eg past consumption income and interest rates) confidence measures have an additional predictive power for the future path of
(70) See Barsky and Sims (2012) for a discussion of the different
theoretical approaches to the role of confidence Barsky R B and ER Sims (2012) lsquoInformation animal spirits and the meaning of innovations in consumer confidencersquo American Economic Review 102(4) pp 1343-1377
(71) See for example Carroll C J Fuhrer and D Wilcox (1994) lsquoDoes consumer sentiment forecast household spending If so whyrsquo American Economic Review Vol 84 pp 1397-1408
consumer spending (72) Moreover some papers find that confidence indicators have a stronger predictive power during periods of large economic fluctuations (73)
III3 The existing evidence on confidence spillovers
On the assumption that a causal relationship between consumer confidence and private consumption exists it is important to determine whether and to what extent changes in consumer confidence in one country affect confidence (and thus consumption) in others
There is some evidence to support the existence of confidence spillovers This pertains both to confidence shocks originating in the US and being transmitted to the euro area and shocks which occur in one euro area country and spill over to other euro area countries
Several studies provide evidence of a transmission channel of confidence shock to foreign confidence In particular evidence for G7 countries and Spain would suggest that variations in confidence generally spill over from large countries to smaller ones (74) Some studies support the idea that confidence shocks originating in US are transmitted to the euro area but not the other way round ie shocks to euro area confidence do not affect confidence in the US (75) Other studies show a transmission channel for confidence shocks
(72) Some authors eg Ludvigson (2004) Souleles (2004) and Lahiri
Monokroussos and Zhao (2016) conclude that including confidence indicators can reduce forecasting errors when predicting the dynamics of consumption while others reach the opposite conclusion (eg Claveria Pons and Ramos 2007)
Ludvigson S (2004) lsquoConsumer confidence and consumer spendingrsquo Journal of Economic Perspectives Vol 18(2) pp 29-50
Souleles NS (2004) lsquoExpectations heterogenous forecast errors and consumption Micro evidence from the Michigan Consumer Sentiment Surveysrsquo Journal of Money Credit and Banking Vol 36 pp 39-72
Lahiri K G Monokroussos and Y Zhao (2016) lsquoForecasting consumption the role of consumer confidence in real time with many predictorsrsquo Journal of Applied Econometrics forthcoming
Claveria O E Pons and R Ramos (2007) lsquoBusiness and consumer expectations and macroeconomic forecastsrsquo International Journal of Forecasting Vol 23 pp47-69
(73) For example Howrey E (2001) lsquoThe predictive power of the index of consumer sentimentrsquo Brookings Papers on Economic Activity Vol 1 pp 175-216
(74) Fei S (2011) lsquoThe confidence channel for the transmission of shocksrsquo Banque de France Working Paper No 314
(75) Deacutees S and P Soares-Brinca (2013) lsquoConsumer confidence as a predictor of consumption spending Evidence for the United States and the Euro Arearsquo International Economics Vol 134 pp 1-14
-40
-30
-20
-10
0
10
1995Q2 1998Q2 2001Q2 2004Q2 2007Q2 2010Q2 2013Q2-08
-04
00
04
08
12
16Consumption (rhs)Consumer Confidence Indicator
III Confidence spillovers in the euro area
Volume 15 No 2 | 35
(Continued on the next page)
Box III1 A GVAR model to assess confidence spillovers
The Global Vector Autoregressive (GVAR) methodology developed by Pesaran Schuermann and Weiner (2004) (1) combines individual vector error-correcting models where domestic variables are linked to country-specific foreign variables The latter combine the domestic variables using international trade financial or other relevant weights for each country This approach allows the analysis of interdependence across different economies providing a solution to the lsquocurse of dimensionalityrsquo (eg the high number of parameters as the dimension of the model increases) in global modelling
For a set of countries i=0 1 2 hellip N the individual VARX(pi qi) models take the following form
itqtiiqtiiitiiptiiptiiit uxxxxxxii
+Λ++Λ+Λ+Φ++Φ= minusminusminusminus
11
011
where xit is a vector of ki x 1 vector of domestic variables xit a ki x 1 vector of foreign variables and
00
===
iijt
N
jijit xx ωω
where ωij j=01hellipN is a set of weights such that 10
==
N
jijω The foreign variables xit are therefore a
weighted average of domestic variables for all countries included in the model The weights can be different in nature but are typically constructed using trade or capital flows data The GVAR model is then solved for the lsquoworldrsquo (ie all countries included in the model) as a whole considering all variables as endogenous to the system
The GVAR model has been applied to a variety of issues These include forecasting (eg Pesaran Schuermann and Smith 2009) credit risk (eg Pesaran Schuermann and Treutler 2007) oil price shocks (eg Galesi and Lombardi 2009) global imbalances (eg Bussiegravere Chudik and Sestieri 2012) business cycle synchronisation (eg Dreger and Zhang 2013) the impact of EU membership (eg Pesaran Smith and Smith 2007) the international effects of fiscal policy shocks (eg Favero Giavazzi and Perego 2011) (2) Chudik and Pesaran (2014) provide a detailed review of these and other recent applications (3)
In this section this approach is used to analyse the transmission of country-specific and global consumer confidence shocks in a model which includes eight euro area countries (Austria Belgium Finland France Germany Italy the Netherlands and Spain) using quarterly data over the period 1996Q2-2013Q1 The model is solved using the GVAR Toolbox developed by Smith and Galesi (2014) (4)
(1) Pesaran MH Schuermann T and Weiner S M (2004) lsquoModelling regional interdependencies using a global error-correcting
modelrsquo Journal of Business and Economic Statistics Vol 22 pp 129-162 (2) Pesaran M H Schuermann T and Smith LV (2009) lsquoForecasting economic and financial variables with global VARsrsquo
International Journal of Forecasting Vol 25(4) pp 642-675 Pesaran MH Schuermann T and Treutler B-J (2007) lsquoGlobal business cycles and credit riskrsquo in The Risks of Financial Institutions NBER Chapters pp 419-474 Bussiegravere M Chudik A and Sestieri G (2012) lsquoModelling global trade flows results from a GVAR modelrsquo Globalization and Monetary Policy Institute Working Paper 119 Federal Reserve Bank of Dallas Dreger C and Zhang Y (2013) lsquoDoes the economic integration of China affect growth and inflation in industrial countriesrsquo FIW Working Paper series 116 FIW Pesaran M H Smith L V and Smith R P (2007) lsquoWhat if the UK or Sweden had joined the euro in 1999 An empirical evaluation using a Global VARrsquo International Journal of Finance and Economics Vol 12(1) pp 55-87 Favero C Giavazzi F and Perego F (2011) lsquoCountry heterogeneity and the international evidence on the effects of fiscal policyrsquo IMF Economic Review 59(4) 652-682
(3) Chudik A and Pesaran MH (2014) lsquoTheory and Practice of GVAR Modelingrsquo Federal Reserve Bank of Dallas Globalization and Monetary Policy Institute Working Paper No 180
(4) Smith LV and Galesi A (2014) GVAR Toolbox 20 available at httpssitesgooglecomsitegvarmodellinggvar-toolbox
36 | Quarterly Report on the Euro Area
between the US the euro area as a whole and four EU countries taken individually (76)
In addition the role of consumer confidence spillovers in the euro area was assessed in a previous issue of the QREA (77) Consumption and confidence regressions were carried out for a panel of euro area countries over the period 1999-2012 The findings support the existence of confidence spillovers between euro area countries
III4 Confidence spillovers across the euro area
Table III1 shows simple correlations between the confidence indicators of eight euro area countries over the period 1995Q4-2016Q1 (78)The strength of the link between consumer confidence indicators across Member States is variable and in most cases is larger between neighbouring countries and between countries sharing similar macroeconomic environments (79)
Table III1 Consumer Confidence Indicator mdash Correlation Matrix
(1995Q4-2016Q1)
(1) Not statistically significant at conventional levels Source DG ECFIN calculations based on EU Business and Consumer Surveys
(76) Deacutees S and J Guntner (2014) lsquoThe international dimension of
confidence shockrsquo ECB Working Paper No 1669 (77) Op cit DrsquoAuria F (2013) (78) The very low and non-statistically significant correlation of the
Italian confidence indicator with the confidence indicators of a number of other euro area countries is somewhat puzzling and there is a need for further investigation into the reasons behind it
(79) The strong correlation between confidence indicators in countries sharing similar economic conditions can be indicative of larger confidence spillovers between them but can also be a reflection of the strong correlation between their economic fundamentals
The strength of the correlation also varies considerably over time Table III2 displays correlations between consumer confidence indicators in the same euro area countries over the period 2008Q1-2012Q4 During the crisis period the link between consumer confidence indicators is significantly tighter
Table III2 Consumer Confidence Indicator mdash Correlation Matrix
(2008Q1-2012Q4)
(1) Not statistically significant at conventional levels Source DG ECFIN calculations based on EU Business and Consumer Surveys
The presence of a correlation between confidence indicators may point to the existence of confidence spillover effects between countries but also be indicative of strong business cycle synchronisation To shed light on the nature of these correlations this section discusses confidence spillovers in the euro area on the basis of the findings from the estimation of a Global Vector Autoregressive (GVAR) model which includes data for eight euro area countries over the period 1996Q2-2013Q1 Box III1 describes the model in more detail
The model includes observations on consumption GDP the unemployment rate a short-term interest rate and consumer confidence The latter is measured by the BCS Consumer Confidence Indicator which is an arithmetic average of the balances of the answers to questions on the financial situation of households the general economic situation unemployment expectations and savings over the next 12 months It is therefore taken as a proxy for consumersrsquo expectations about their future economic situation
The results seem to support the existence of consumer confidence spillovers across the euro area As an illustration Graph III2 reports impulse
AT BE FI FR IT DE NL ES
AT 100 069 069 074 013(1) 054 043 022BE 069 100 067 088 055 057 068 066FI 069 067 100 068 039 028 075 055FR 074 088 068 100 046 055 066 060IT 013(1) 055 039 046 100 004(1) 063 081DE 054 057 028 055 004(1) 100 033 023NL 043 068 075 066 063 033 100 073ES 022 066 055 060 081 023 073 100
AT BE FI FR IT DE NL ES
AT 100 093 090 088 036(1) 079 086 063BE 093 100 081 080 034(1) 080 081 071FI 090 081 100 083 058 052 081 066FR 088 080 083 100 030(1) 066 074 061IT 036(1) 034(1) 058 030(1) 100 -016(1) 065 038DE 079 080 052 066 -016(1) 100 050 048NL 086 081 081 074 065 05 100 050ES 063 071 066 061 038 048 050 100
Box (continued)
by the European Commission Consumption and GDP enter the model in log differences while the other variables are in levels Some of the results are discussed in the main text
III Confidence spillovers in the euro area
Volume 15 No 2 | 37
response functions of consumer confidence in the euro area countries included in the GVAR model to a positive shock to consumer confidence in Germany over 24 quarters (80)
The largest effect appears to be in smaller neighbouring countries (Austria Belgium and the Netherlands) The response of consumer confidence is also relatively large in Finland France and Spain On the other hand spillovers to consumer confidence in Italy are very small and become negative after six quarters This is not a surprise given the statistically insignificant correlation between German and Italian consumer confidence emerging from the data reported in Table III1 The peak response occurs in the second or third quarter
Similar results although of a smaller magnitude were obtained for the other euro area countries included in the model Confidence spillovers appear to be larger across countries with stronger geographical and trade links Overall the evidence from the estimation of the model supports the existence of a transmission channel for consumer confidence shocks across the euro area However the effects of confidence shocks on foreign consumption are in most cases not statistically significant suggesting that the transmission channel is to foreign confidence rather than
(80) A caveat must be made about the difficulty of identifying truly
exogenous confidence shocks owing to the fact that confidence indicators are largely driven by the same factors which determine consumption
directly to foreign economic activity (81)
These results suggest that confidence shocks play a role in the international business cycle and that there are close interlinkages between confidence indicators across euro area countries This evidence supports the need for coordinated policy action able to boost confidence across euro area countries
III5 Conclusions
In recent years the dynamics of euro area consumer confidence and real private consumption have been very closely related Moreover consumer confidence indicators across the euro area appear to be strongly correlated The strength of the correlation was considerably greater during the crisis period
The evidence of a link between real consumption and consumer confidence is mixed but several studies are supportive of consumer confidence playing a role in determining consumption In addition there is evidence to suggest that shocks to consumer confidence in euro area countries affect confidence in other euro area Member States This is also borne out by results obtained from the estimation of a Global Vector Autoregressive (GVAR) model for eight euro area countries
(81) Similar conclusions are reached by op cit Deacutees and Soares-Brinca
(2013) and Deacutees and Guntner (2014)
38 | Quarterly Report on the Euro Area
Graph III2 Impulse response functions of foreign confidence to a one standard error confidence shock in Germany
Source DG ECFIN
000
005
010
015
020
025
030
035
1 2 3 4 5 6 7 8 9 10 11 12 13 14 15 16 17 18 19 20 21 22 23 24
AT
000
005
010
015
020
025
030
035
040
1 2 3 4 5 6 7 8 9 10 11 12 13 14 15 16 17 18 19 20 21 22 23 24
BE
000
005
010
015
020
025
030
1 2 3 4 5 6 7 8 9 10 11 12 13 14 15 16 17 18 19 20 21 22 23 24
FI
000
005
010
015
020
025
030
1 2 3 4 5 6 7 8 9 10 11 12 13 14 15 16 17 18 19 20 21 22 23 24
FR
-002
-001
000
001
002
003
004
005
006
007
1 2 3 4 5 6 7 8 9 10 11 12 13 14 15 16 17 18 19 20 21 22 23 24
IT
000
005
010
015
020
025
030
035
040
1 2 3 4 5 6 7 8 9 10 11 12 13 14 15 16 17 18 19 20 21 22 23 24
NL
000
005
010
015
020
025
030
035
1 2 3 4 5 6 7 8 9 10 11 12 13 14 15 16 17 18 19 20 21 22 23 24
ES
40 | Quarterly Report on the Euro Area
Editors Jose Eduardo Leandro and Martin Larch
Coordination Plamen Nikolov
Statistical and layout assistance Christos Zavos
Comments on the report would be gratefully received and should be sent to
Jose Eduardo Leandro Director ndash Policy strategy coordination and communication Directorate-General for Economic and Financial Affairs Office CHAR 1566
B-1049 Brussels
Email joseleandroeceuropaeu
or
Martin Larch Head of Unit ndash EMU deepening and macroeconomy of the euro area Directorate-General for Economic and Financial Affairs Office CHAR 1556
B-1049 Brussels
Email martinlarcheceuropaeu
EUROPEAN ECONOMY INSTITUTIONAL SERIES
European Economy Institutional series can be accessed and downloaded free of charge from the following address httpeceuropaeueconomy_financepublicationseeipindex_enhtm Titles published before July 2015 can be accessed and downloaded free of charge from bull httpeceuropaeueconomy_financepublicationseuropean_economyindex_enhtm
(the main reports eg Economic Forecasts) bull httpeceuropaeueconomy_financepublicationsoccasional_paperindex_enhtm
(the Occasional Papers) bull httpeceuropaeueconomy_financepublicationsqr_euro_areaindex_enhtm
(the Quarterly Reports on the Euro Area)
Alternatively hard copies may be ordered via the ldquoPrint-on-demandrdquo service offered by the EU Bookshop httpbookshopeuropaeu
HOW TO OBTAIN EU PUBLICATIONS Free publications bull one copy
via EU Bookshop (httpbookshopeuropaeu) bull more than one copy or postersmaps
- from the European Unionrsquos representations (httpeceuropaeurepresent_enhtm) - from the delegations in non-EU countries (httpeeaseuropaeudelegationsindex_enhtm) - by contacting the Europe Direct service (httpeuropaeueuropedirectindex_enhtm) or calling 00 800 6 7 8 9 10 11 (freephone number from anywhere in the EU) () () The information given is free as are most calls (though some operators phone boxes or hotels may charge you)
Priced publications bull via EU Bookshop (httpbookshopeuropaeu)
ISBN 978-92-79-54335-7
KC-BC-16-030-EN-N
- NEW_IP_index_enpdf
-
- EUROPEAN EconomY institutional SERIES
-

II Financial channels and economic activity in the euro area
Volume 15 No 2 | 25
The uncertainty channel is captured by variables reflecting the different types of uncertainty that can affect the economy One type is commonly related to increased volatility in financial markets Given a high degree of global interconnectedness the euro area economy can be affected by uncertainty related to global financial developments which is usually measured by the implied volatility of SampP 500 index options (VIX) (59) The euro area specific stress in the financial system is measured through the ECBrsquos Composite Indicator of Systemic Stress (CISS)
Another type of uncertainty is linked to swings in business and consumer confidence Variations in the confidence of euro area households and non-financial firms are illustrated through the European Commissionrsquo confidence indicator the Economic Sentiment Indicator (ESI) which is based on data collected through business and consumer surveys However the indicator exhibits a very high contemporaneous correlation with actual GDP growth indicating that its dynamics are likely to reflect very accurately economic conditions rather than information related to exogenous changes in confidence
Finally unexpected outcomes of economic policy decisions can lead to policy uncertainty which in turn can have adverse effects on the savings and investment behaviour of firms and households Policy uncertainty is illustrated through an indicator based on newspaper coverage of uncertainty-generating events (60)
Graph II6 indicates that there is an apparent co-movement among these indicators even if they measure different types of uncertainty While economic sentiment has been gradually improving and uncertainty related to financial markets has eased the policy uncertainty affecting the euro area is still relatively high
fluctuations separately the Great Recession was likely outcome of the toxic interaction between the two
Bloom N (2009) lsquoThe impact of uncertainty shocksrsquo Econometrica Vol 77 Issue 3 pp 623-685
Caldara D C Fuentes-Albero S Gilchrist and E Zakrajšek (2014) lsquoThe macroeconomic impact of financial and uncertainty shocksrsquo European Economic Review forthcoming
(59) The VIX is calculated by the Chicago Board Options Exchange (CBOE)
(60) Baker S R N Bloom and S J Davis (2015) lsquoMeasuring economic policy uncertaintyrsquo National Bureau of Economic Research Working Paper No 21633 Data source wwwpolicyuncertaintycom
Graph II6 Uncertainty channel (2000Q1-2016Q1)
Source Chicago Board of Exchange ECB wwwpolicyuncertaintyorg
II4 Financial developments and economic activity
This sub-section provides stylised facts on the transmission channels defined above and show whether and how financial developments have affected the real side of the euro area economy since the crisis (namely consumption investment unemployment and long-term interest rates)
While financial variables are available in real time macroeconomic variables are normally released with lags Therefore conditioning macroeconomic forecasts on observed financial developments (ie a projection of macro variables on the observed paths of financial variables) can improve forecasts as more informative data are taken into account Several empirical studies have shown that financial variables can improve macroeconomic forecasts (61)
The methodology underlying this this section is a large-scale Bayesian VAR with 35 macroeconomic
(61) Stock and Watson (2003) provide a seminar contribution on the
role of financial variables namely asset prices for GDP and inflation forecast concluding that different financial variables allow macroeconomic forecasting in different times Espinosa et al (2012) document using standard VAR approach that financial variables improve GDP forecast for the euro area especially in the real time when numerous financial variables are available ahead of the macroeconomic releases
Stock J H and M W Watson (2003) lsquoForecasting output and inflation the role of asset pricesrsquo Journal of Economic Literature Vol 41 No 3 pp 788-829
Espinoza R F Fornari and M J Lombardi (2012) lsquoThe role of financial variables in predicting economic activityrsquo Journal of Forecasting Vol 31 No 1 pp 15-46
0
50
100
150
200
250
300
0
10
20
30
40
50
60
70
80
2000Q1 2002Q3 2005Q1 2007Q3 2010Q1 2012Q3 2015Q1
VIX
CISS
ESI (rhs)
Policy uncertainty (rhs)
26 | Quarterly Report on the Euro Area
and financial variables (62) The model is estimated for the sub-period Q1-2000 - Q4-2011 which covers both normal and crisis times but does not include some of the most important unconventional monetary policy measures Given the estimated past correlations a counterfactual path for the macroeconomic and financial variables (ie a distribution of conditional forecasts) can be obtained for the entire period Q1-2000 - Q4-2015 conditional on observed real GDP and inflation in the baseline case The deviations of the observed developments of financial variables from this counterfactual path can be interpreted as evidence of instability in the relationship between financial variables and economic activity (as measured by GDP growth and inflation) since the crisis
Subsequently the conditional set from the baseline case (including only real GDP and inflation) is extended by financial and uncertainty variables corresponding to each transmission channel described above (63)
Some recent developments are puzzling
Graph II7 shows the counterfactual paths of the main GDP components producer prices the unemployment rate and the long-term interest rate conditional on observed economic activity (real GDP and inflation) It also shows the conditional forecasts for the balance sheet variables of households and firms when only real GDP and inflation are taken into account in the conditioning set
(62) Alternative strand of literature using rich set of data in order to
nowcast or forecast employs dynamic factors models where data dimension is reduced in a first step by factor estimation with common factors being consequently used in the forecasting exercize see eg Giannone et al (2008) Bellego and Ferrara (2012) find using factor-augmented probit model that financial variables allow tracking better recession periods in the euro area (in the pre-crisis period) with optimal lead of financial variables over recession of around one year
Giannone D L Reichlin L and D Small (2008) lsquoNowcasting the real-time informational content of macroeconomic datarsquo Journal of Monetary Economics Vol 55 Issue 4 pp 665ndash676
Belleacutego C and L Ferrara (2012) lsquoMacro-financial linkages and business cycles A factor-augmented probit approachrsquo Economic Modelling Vol 29 pp 1793-1797
(63) For more details on the methodology see Box IV1 in European Commission (2015) lsquoInvestment dynamics in the euro area since the crisisrsquo Quarterly Report on the Euro Area Vol 14 No 1 pp 35-43
Bańbura M D Giannone and M Lenza (2015) lsquoConditional forecasts and scenario analysis with vector autoregressions for large cross-sectionsrsquo International Journal of Forecasting Vol 31 Issue 3 pp 739ndash756
The results suggest that private consumption was unusually low during the period of the euro area debt crisis and deleveraging (2012-2013) while it overshot during the recent recovery (from 2014 onward) Investment behaved in line with historical correlations during both downturn episodes (2008-2009 and 2012-2013) and was weak during the deleveraging phase because overall output growth was weak However its recent recovery (since 2014) has been more subdued than what the pace of economic activity would have predicted the observed investment path is positioned on the lower tail of the distribution of conditional forecasts) (64)
Large deleveraging pressures in the public sector have led to a significant decline in the euro area aggregate government consumption over the period 2011-2012 However this decline had almost been reversed by the end of 2014 with public consumption starting to overshoot from 2015 onwards (relative to its counterfactual path obtained through conditioning on output growth) reflecting the aggregate euro area fiscal stance which started to turn mildly expansionary
Moreover the results show that several variables capturing price and balance sheet developments are still at odds with historical patterns In particular producer prices house prices long-term interest rates and loans to firms and households undershoot the distribution of the conditional forecasts On one side this underlines that the recent recovery is characterized by a historically low inflation environment and loose monetary conditions pushing the long-term rates down On the other side the ongoing balance sheet adjustment is translating into very weak credit dynamics due to unprecedented deleveraging pressures
Graph II8 illustrates the zero lower bound constraint on monetary policy rates and the subsequent break in the correlation of economic activity with the two measures of monetary policy
(64) There is some relative instability in the estimated correlations over
the sample period notably pre-crisis vs crisis years However it does not significantly affect the result on the unusual weakness in investment recovery since 2014 The article lsquoInvestment dynamics in the euro area since the crisisrsquo Quarterly Report on the Euro Area Vol 14 No 1 pp 35-43 found that estimating the past correlations only with the sample for the pre-crisis period the amplitude of the investment fall during the first downturn (2008-2009) would also be slightly underestimated by the conditional forecasts
II Financial channels and economic activity in the euro area
Volume 15 No 2 | 27
rates since 2012 Among all variables the consumer and business confidence indicator (ESI) comes out as having the strongest contemporaneous correlation with economic activity during the crisis
In the consecutive analysis the conditioning dataset (including only real GDP and inflation in the baseline) is augmented by financial variables corresponding to each transmission channel
hellip different channels play an important role at different stages since the crisis
The interest rate channel (Graph II9 upper panel) seems to better account for the pattern of consumption during the recent recovery (compared to the baseline) This channel which reflects mainly monetary conditions suggests that monetary easing implemented since 2014 by means of additional unconventional measures (namely the targeted long-term refinancing operations (TLTRO) the asset-backed securities purchasing program (ABSPP) and the forthcoming public
securities purchase program (PSPP)) have translated into a further decline in the long-term interest rate and the shadow policy rate It also reflects an increase in excess liquidity which has had a very benign effect on the recent recovery However producer prices developments (PPI) still appear unusually subdued Likewise including information capturing the interest rate channel does not help explain the dismal performance of consumption during the deleveraging phase (2012-2013) or the persistent weakness of credit dynamics Therefore these developments seem to be determined also by drivers other than monetary conditions
The borrowers balance sheet channel (Graph II9 lower panel) captures in turn the exceptional deleveraging developments of 20122013 but clearly underestimates the pace of the recent recovery This finding suggests that strained balance sheets of households and firms represented the main weight on the recovery at the time of euro area sovereign debt crisis However whereas a mild recovery started in the euro area in 2014 private
Graph II7 Conditional forecasts based on real GDP and inflation (1) (2000Q1-2015Q4 y-o-y growth)
Misalignments of financial and real variables with output growth since the crisis
(1) Shades of orange distribution of the conditional forecasts in the BVAR in levels excluding the lower and higher 5 quantiles Green line actual values The variables are all reported in terms of annual percentage changes except for the unemployment rate and the long-term interest rate which are in levels Conditioning assumptions real GDP and HICP Source DG ECFIN MATLAB codes replication files of the methodological paper (Banbura et al 2015)
Government consumption
2005 2010 2015-2
0
2
4Real consumption
2005 2010 2015-5
0
5Real investment
2005 2010 2015-20
-10
0
10
Unemployment rate
2005 2010 20150
5
10
15PPI ex const
2005 2010 2015-50
0
50House prices
2005 2010 2015-10
0
10
Long-term i r
2005 2010 20150
5
10Loans to firms
2005 2010 2015-10
0
10
20Loans to households
2005 2010 2015-5
0
5
10
28 | Quarterly Report on the Euro Area
balance sheets still did not improve much In fact when the borrower balance sheet channel is taken into account observed consumption overshoots the conditional forecast even by a higher margin than in the baseline scenario and real investment seems to be on the upper side as well This suggests that the borrower balance sheet channel should have led to more subdued dynamics of both consumption and investment than what has been observed in 2014 and 2015 indicating that other channels have been somewhat compensating the adverse effects of this channel
The bank balance sheet channel (Graph II10 upper panel) improves the forecast of investment since 2014 and reduces the uncertainty around the median for some variables such as consumption unemployment and long-term interest rate The good fit of investment dynamics indicates a strong correlation of investment with total economy credit developments both in terms of flows and stocks
Interestingly the bank balance sheet information namely the total economy credit as percentage of GDP (including credit to public sector) the private sector credit impulse and the price of credit for the private sector cannot capture the weak observed dynamics of outstanding loans to firms and households This shows that the private deleveraging process has been much stronger than the public sector deleveraging making private credit developments disconnected from GDP
growth (65) Therefore while the recovery in real activity has been rather weak the private credit dynamics have been even weaker Furthermore the modest recovery does not facilitate passive deleveraging (a decrease in the relative debt burden due to a growing economy ie denominator effect) and feeds the active deleveraging (a decrease of absolute level of debt ie nominator effect)
Finally the current long-term interest rate seems very low even when the financing costs for non-financial corporations (which also attained historical minima) are taken into account This underlines the importance of the ECBrsquos measures that imply very easy financing conditions in the foreseeable future
Last but not least the uncertainty channel (Graph II10) seems to improve the conditional forecast over the baseline in the same spirit as the bank balance sheet channel For example there is a good fit of investment indicating a strong correlation of investment with confidence and financial stress measures Equally the rebound in private consumption seems to be well captured by the uncertainty channel indicating that the recent decrease in financial markets stress has also been an important driver for consumption However in general the uncertainty channel is likely to be implicitly included in the bank balance sheet
(65) GDP is a denominator of the credit indicators in bank balance
sheet channel
Graph II8 Conditional forecasts based on real GDP and inflation (1) (2000Q1-2015Q4 y-o-y growth)
Business and consumer confidence and short-term interest rates
(1) Shades of orange distribution of the conditional forecasts in the BVAR in levels excluding the lower and higher 5 quantiles Green line actual values The variables are all reported in terms of annual percentage changes except for the unemployment rate and the long-term interest rate which are in levels Conditioning assumptions real GDP and HICP Source DG ECFIN MATLAB codes replication files of the methodological paper (Banbura et al 2015)
Economic sentiment
2005 2010 2015-15
-10
-5
0
5
10Short-term i r
2005 2010 2015-4
-2
0
2
4
6
8Shadow short-term interest rate
2005 2010 2015-6
-4
-2
0
2
4
6
II Financial channels and economic activity in the euro area
Volume 15 No 2 | 29
channel For example in periods of high uncertainty bank funding costs increase (bank balance sheet channel) and firms with weaker balance sheets cannot obtain credit for new loans (borrower balance sheet channel)
Overall the findings above suggest that while there is clear evidence of the transmission of monetary policy measures on financial variables and from financial variables to consumer lending rates the evidence on the effects on real activity is more complex with different channels playing an important role at different stages of the crisis The interest rate channel has helped the modest recovery since 2014 by supporting both public and private consumption growth and by partially compensating the balance sheet channel for both borrowers and banks The results in Graph II9 (lower panel) can be interpreted as showing that in the absence of massive monetary easing given the high level of debt in the economy and the wealth effects associated with house and asset prices decreases both private and public consumption growth could have been much more subdued than what it is currently observed
Graph II10 (both panels) illustrate the importance of the bank balance sheet and the uncertainty channel for capturing investment dynamics Weak investment growth is well captured both by credit developments as captured through the bank balance sheet channel and confidence effects through the uncertainty channel Real economic activity as measured by GDP growth while playing an important role does not seem to fully explain the subdued growth in investment since 2014 (Graph II7)
II5 Conclusions
The section discusses the nexus between financial and macroeconomic developments drawing some
lessons from the literature and providing some stylised facts on the main transmission channels through which financial developments have affected real economic activity since the crisis
While there is clear evidence of the transmission of monetary policy measures on financial variables and from financial variables to consumer lending rates the evidence on the effects on real activity is more complex with different channels playing an important role at different stages of the crisis
The state of private balance sheets seems to have significantly contributed to the poor performance of consumption during the euro area debt crisis and high debt levels still weigh on growth However given the still high level of debt the current mild recovery should be seen as a rather positive outcome The analysis suggests that easy monetary conditions seem to represent an important driver of the current recovery Another driver seems to be the balance sheets of banks which have gradually improved and allow better transmission of easy monetary conditions to the lending rates
Given the still high levels of debt in the economy and the wealth and confidence effects associated with house and asset prices corrections both private and public consumption growth could have been much more subdued than what it is currently observed were it not for the exceptional easing of monetary conditions
Unfortunately the recovery is still not strong enough to facilitate the deleveraging process The stock of debt and the ongoing deleveraging combined with adverse confidence effects still represent major impediments for a stronger recovery in investment Consequently there is a need to implement policy measures that allow dealing effectively with the debt overhang notably an effective framework for non-performing loans resolution
30 | Quarterly Report on the Euro Area
Graph II9 Conditional forecasts based on variables capturing the interest rate channel and borrower balance sheet channel (1)
(2000Q1-2015Q4 y-o-y growth)
Interest rate channel
Borrower balance sheet channel
(1) Shades of orange distribution of the conditional forecasts in the BVAR in levels excluding the lower and higher 5 quantiles Green line actual values The variables are all reported in terms of annual percentage changes except for the unemployment rate and the long-term interest rate which are in levels Conditioning assumptions interest rate channel ESI HICP the short-term interest rate the long-term interest rate the shadow interest rate and the ECB excess liquidity measure Conditioning assumptions borrower balance sheet channel ESI HICP house prices stock prices and outstanding loans to households and firms Due to the high contemporaneous correlation between real GDP growth and the ESI indicator the ESI indicator contains the same forecasting information as real GDP ESI indicator is used in the conditioning set instead of real GDP variable in order to also illustrate conditional forecasts for real GDP Source DG ECFIN MATLAB codes replication files of the methodological paper (Banbura et al2015)
Real GDP
2005 2010 2015-10
-5
0
5Government consumption
2005 2010 2015-2
0
2
4Real consumption
2005 2010 2015-5
0
5
Real investment
2005 2010 2015-20
-10
0
10Unemployment rate
2005 2010 20150
10
20PPI ex const
2005 2010 2015-50
0
50
House prices
2005 2010 2015-10
0
10
20Loans to firms
2005 2010 2015-10
0
10
20Loans to households
2005 2010 2015-10
0
10
20
Real GDP
2005 2010 2015-10
-5
0
5Government consumption
2005 2010 2015-2
0
2
4Real consumption
2005 2010 2015-5
0
5
Real investment
2005 2010 2015-20
-10
0
10Unemployment rate
2005 2010 20150
5
10
15PPI ex const
2005 2010 2015-50
0
50
Shadow short-term interest rate
2005 2010 2015-5
0
5
10Short-term i r
2005 2010 2015-5
0
5
10Long-term i r
2005 2010 20150
5
10
II Financial channels and economic activity in the euro area
Volume 15 No 2 | 31
Graph II10 Conditional forecasts based on variables capturing the bank balance sheet channel and uncertainty channel (1)
(2000Q1-2015Q4 y-o-y growth) Bank balance sheet channel
Uncertainty channel
(1) Shades of orange distribution of the conditional forecasts in the BVAR in levels excluding the lower and higher 5 quantiles Solid black line point estimate of the conditional forecasts in the BVAR in differences which is computed as the median of the distribution of the conditional forecasts in this model Green line with crosses actual values The variables are all reported in terms of annual percentage changes except for the unemployment rate and the long-term interest rate which are in levels Conditioning assumptions for the bank balance sheet channel ESI HICP the credit impulse the private credit volumes (debt-to-GDP ratio) and bank lending rates for households and firms (CFCI) Conditioning assumptions uncertainty channel ESI HICP the policy uncertainty indicator the CISS and the VIX Due to the high contemporaneous correlation between real GDP growth and the ESI indicator the ESI indicator contains the same forecasting information as real GDP ESI indicator is used in the conditioning set instead of real GDP variable in order to also illustrate conditional forecasts for real GDP Source DG ECFIN MATLAB codes replication files of the methodological paper (Banbura et al 2015)
Real GDP
2005 2010 2015-10
-5
0
5Government consumption
2005 2010 2015-2
0
2
4Real consumption
2005 2010 2015-2
0
2
4
Real investment
2005 2010 2015-20
-10
0
10Unemployment rate
2005 2010 20150
5
10
15PPI ex const
2005 2010 2015-50
0
50
Loans to firms
2005 2010 2015-10
0
10
20Loans to households
2005 2010 2015-10
0
10
20Long-term i r
2005 2010 20150
2
4
6
Real GDP
2005 2010 2015-10
0
10Government consumption
2005 2010 2015-2
0
2
4Real consumption
2005 2010 2015-5
0
5
Real investment
2005 2010 2015-20
0
20Unemployment rate
2005 2010 20150
5
10
15PPI ex const
2005 2010 2015-50
0
50
Loans to firms
2005 2010 2015-10
0
10
20Loans to households
2005 2010 2015-10
0
10
20Long-term i r
2005 2010 20150
5
10
III Confidence spillovers in the euro area
Volume 15 No 2 | 33
III1 Introduction
During the recent crisis euro area private consumption fell substantially This was accompanied by a sharp decline in consumer confidence which many observers have identified as a key factor contributing to the persistence of the slowdown In fact the onset of the crisis coincided with an abrupt unwinding of imbalances that is of economic trends that turned out to be unsustainable and which led to a significant adjustment of expectations Both consumption growth rates and confidence levels have been improving since the start of 2013
There is some (mixed) evidence to suggest that fluctuations in consumer confidence affect the dynamics of private consumption (67) On the basis of this assumption and taking into account the unprecedented extent of the most recent crisis it is important to determine whether and to what extent confidence shocks spill over between countries This is particularly relevant in relation to the euro area where close trade and financial links and common institutional features can lead to the rapid propagation of shocks In addition confidence spillovers can be an important aspect to consider when discussing how to improve macroeconomic policymaking in a common currency area
This section reviews the evidence on the link between consumer confidence and private consumption and on cross-border confidence spillovers and presents some analysis of the transmission of confidence shocks across the euro area It is a follow-up to analysis discussed in
(66) This section was prepared by Francesca DrsquoAuria (67) See for a discussion Ludvigson SC 2004 lsquoConsumer
confidence and consumer spendingrsquo Journal of Economic Perspectives Vol 18(2) pp 29-50
previous issues of the Quarterly Report on the Euro Area (QREA) (68)
III2 Recent trends in consumer confidence and private consumption in the euro area
Graph III1 shows the evolution over the period 1995Q2-2016Q1 of euro area real private consumption and consumer confidence The latter is measured by the Consumer Confidence Indicator constructed by the European Commission as part of the Joint Harmonised EU Programme of Business and Consumer Surveys (BCS) (69)
There is close co-movement between the two variables Both real consumption growth and consumer confidence showed the greatest deterioration in the first quarter of 2009 and during the sovereign debt crisis They have been on a recovery path since early 2013 with consumer confidence reaching levels above the euro area long-term average since the first quarter of 2014
The relationship between consumer confidence and private consumption is much debated in the literature From a theoretical perspective there are two main competing theories One view is that confidence indicators can help predict the dynamics of consumption as they convey information about future economic conditions Another theory is that the link between the two variables can be interpreted in terms of lsquoanimal
(68) DrsquoAuria F lsquoCross-border spillovers in confidencersquo Quarterly
Report on the Euro Area (2013) Vol 12(3) pp26-30 DrsquoAuria F S Linden D Monteiro J in lsquot Veld and S Zeugner
lsquoCross-border spillovers in the euro arearsquo Quarterly Report on the Euro Area (2014) Vol 13(4) pp7-22
(69) See European Commission (2016) lsquoA user guide to the Joint Harmonised EU Programme of Business and Consumer Surveysrsquo for details on the construction of the indicators
In recent years there has been close co-movement between consumer confidence and private consumption in the euro area During the crisis in particular consumer confidence was identified by many commentators as a driving factor in its persistence as expectations about a sustainable path of economic growth were adjusted significantly In view of the unprecedented extent of the crisis the question of whether and to what extent changes in consumer confidence in one country could spill over to other countries was also raised This section discusses the relationship between consumer confidence and consumption and reviews the evidence of consumer confidence spillovers between euro area countries We conclude that there is some evidence to suggest that confidence shocks are transmitted between countries This conclusion is corroborated by results from the estimation of a Global Vector Autoregressive (GVAR) model for a number of euro area countries (66)
34 | Quarterly Report on the Euro Area
spiritsrsquo as confidence indicators capture fluctuations in beliefs which in turn affect consumption (70) In both cases the essence of confidence indicators is to gauge expectations ndash irrespective of how they are formed ndash about the future course of the economy which then have a knock-on effect on current consumer behaviour
Graph III1 Confidence and private consumption euro area
(1995Q2-2016Q1 q-o-q change)
Source Eurostat and DG ECFIN calculations based on EU Business and Consumer Surveys
Several studies test empirically the link between consumer confidence and private consumption A number of them find evidence in support of a strong correlation between consumer confidence and consumption (71)
However as confidence and consumption are to a large extent determined by the same factors other studies try to assess whether confidence indicators carry information beyond economic fundamentals The evidence on this issue is mixed although several studies conclude that confidence indicators play a significant role There is some evidence to suggest that while part of the information conveyed by confidence indicators is also captured by other variables (eg past consumption income and interest rates) confidence measures have an additional predictive power for the future path of
(70) See Barsky and Sims (2012) for a discussion of the different
theoretical approaches to the role of confidence Barsky R B and ER Sims (2012) lsquoInformation animal spirits and the meaning of innovations in consumer confidencersquo American Economic Review 102(4) pp 1343-1377
(71) See for example Carroll C J Fuhrer and D Wilcox (1994) lsquoDoes consumer sentiment forecast household spending If so whyrsquo American Economic Review Vol 84 pp 1397-1408
consumer spending (72) Moreover some papers find that confidence indicators have a stronger predictive power during periods of large economic fluctuations (73)
III3 The existing evidence on confidence spillovers
On the assumption that a causal relationship between consumer confidence and private consumption exists it is important to determine whether and to what extent changes in consumer confidence in one country affect confidence (and thus consumption) in others
There is some evidence to support the existence of confidence spillovers This pertains both to confidence shocks originating in the US and being transmitted to the euro area and shocks which occur in one euro area country and spill over to other euro area countries
Several studies provide evidence of a transmission channel of confidence shock to foreign confidence In particular evidence for G7 countries and Spain would suggest that variations in confidence generally spill over from large countries to smaller ones (74) Some studies support the idea that confidence shocks originating in US are transmitted to the euro area but not the other way round ie shocks to euro area confidence do not affect confidence in the US (75) Other studies show a transmission channel for confidence shocks
(72) Some authors eg Ludvigson (2004) Souleles (2004) and Lahiri
Monokroussos and Zhao (2016) conclude that including confidence indicators can reduce forecasting errors when predicting the dynamics of consumption while others reach the opposite conclusion (eg Claveria Pons and Ramos 2007)
Ludvigson S (2004) lsquoConsumer confidence and consumer spendingrsquo Journal of Economic Perspectives Vol 18(2) pp 29-50
Souleles NS (2004) lsquoExpectations heterogenous forecast errors and consumption Micro evidence from the Michigan Consumer Sentiment Surveysrsquo Journal of Money Credit and Banking Vol 36 pp 39-72
Lahiri K G Monokroussos and Y Zhao (2016) lsquoForecasting consumption the role of consumer confidence in real time with many predictorsrsquo Journal of Applied Econometrics forthcoming
Claveria O E Pons and R Ramos (2007) lsquoBusiness and consumer expectations and macroeconomic forecastsrsquo International Journal of Forecasting Vol 23 pp47-69
(73) For example Howrey E (2001) lsquoThe predictive power of the index of consumer sentimentrsquo Brookings Papers on Economic Activity Vol 1 pp 175-216
(74) Fei S (2011) lsquoThe confidence channel for the transmission of shocksrsquo Banque de France Working Paper No 314
(75) Deacutees S and P Soares-Brinca (2013) lsquoConsumer confidence as a predictor of consumption spending Evidence for the United States and the Euro Arearsquo International Economics Vol 134 pp 1-14
-40
-30
-20
-10
0
10
1995Q2 1998Q2 2001Q2 2004Q2 2007Q2 2010Q2 2013Q2-08
-04
00
04
08
12
16Consumption (rhs)Consumer Confidence Indicator
III Confidence spillovers in the euro area
Volume 15 No 2 | 35
(Continued on the next page)
Box III1 A GVAR model to assess confidence spillovers
The Global Vector Autoregressive (GVAR) methodology developed by Pesaran Schuermann and Weiner (2004) (1) combines individual vector error-correcting models where domestic variables are linked to country-specific foreign variables The latter combine the domestic variables using international trade financial or other relevant weights for each country This approach allows the analysis of interdependence across different economies providing a solution to the lsquocurse of dimensionalityrsquo (eg the high number of parameters as the dimension of the model increases) in global modelling
For a set of countries i=0 1 2 hellip N the individual VARX(pi qi) models take the following form
itqtiiqtiiitiiptiiptiiit uxxxxxxii
+Λ++Λ+Λ+Φ++Φ= minusminusminusminus
11
011
where xit is a vector of ki x 1 vector of domestic variables xit a ki x 1 vector of foreign variables and
00
===
iijt
N
jijit xx ωω
where ωij j=01hellipN is a set of weights such that 10
==
N
jijω The foreign variables xit are therefore a
weighted average of domestic variables for all countries included in the model The weights can be different in nature but are typically constructed using trade or capital flows data The GVAR model is then solved for the lsquoworldrsquo (ie all countries included in the model) as a whole considering all variables as endogenous to the system
The GVAR model has been applied to a variety of issues These include forecasting (eg Pesaran Schuermann and Smith 2009) credit risk (eg Pesaran Schuermann and Treutler 2007) oil price shocks (eg Galesi and Lombardi 2009) global imbalances (eg Bussiegravere Chudik and Sestieri 2012) business cycle synchronisation (eg Dreger and Zhang 2013) the impact of EU membership (eg Pesaran Smith and Smith 2007) the international effects of fiscal policy shocks (eg Favero Giavazzi and Perego 2011) (2) Chudik and Pesaran (2014) provide a detailed review of these and other recent applications (3)
In this section this approach is used to analyse the transmission of country-specific and global consumer confidence shocks in a model which includes eight euro area countries (Austria Belgium Finland France Germany Italy the Netherlands and Spain) using quarterly data over the period 1996Q2-2013Q1 The model is solved using the GVAR Toolbox developed by Smith and Galesi (2014) (4)
(1) Pesaran MH Schuermann T and Weiner S M (2004) lsquoModelling regional interdependencies using a global error-correcting
modelrsquo Journal of Business and Economic Statistics Vol 22 pp 129-162 (2) Pesaran M H Schuermann T and Smith LV (2009) lsquoForecasting economic and financial variables with global VARsrsquo
International Journal of Forecasting Vol 25(4) pp 642-675 Pesaran MH Schuermann T and Treutler B-J (2007) lsquoGlobal business cycles and credit riskrsquo in The Risks of Financial Institutions NBER Chapters pp 419-474 Bussiegravere M Chudik A and Sestieri G (2012) lsquoModelling global trade flows results from a GVAR modelrsquo Globalization and Monetary Policy Institute Working Paper 119 Federal Reserve Bank of Dallas Dreger C and Zhang Y (2013) lsquoDoes the economic integration of China affect growth and inflation in industrial countriesrsquo FIW Working Paper series 116 FIW Pesaran M H Smith L V and Smith R P (2007) lsquoWhat if the UK or Sweden had joined the euro in 1999 An empirical evaluation using a Global VARrsquo International Journal of Finance and Economics Vol 12(1) pp 55-87 Favero C Giavazzi F and Perego F (2011) lsquoCountry heterogeneity and the international evidence on the effects of fiscal policyrsquo IMF Economic Review 59(4) 652-682
(3) Chudik A and Pesaran MH (2014) lsquoTheory and Practice of GVAR Modelingrsquo Federal Reserve Bank of Dallas Globalization and Monetary Policy Institute Working Paper No 180
(4) Smith LV and Galesi A (2014) GVAR Toolbox 20 available at httpssitesgooglecomsitegvarmodellinggvar-toolbox
36 | Quarterly Report on the Euro Area
between the US the euro area as a whole and four EU countries taken individually (76)
In addition the role of consumer confidence spillovers in the euro area was assessed in a previous issue of the QREA (77) Consumption and confidence regressions were carried out for a panel of euro area countries over the period 1999-2012 The findings support the existence of confidence spillovers between euro area countries
III4 Confidence spillovers across the euro area
Table III1 shows simple correlations between the confidence indicators of eight euro area countries over the period 1995Q4-2016Q1 (78)The strength of the link between consumer confidence indicators across Member States is variable and in most cases is larger between neighbouring countries and between countries sharing similar macroeconomic environments (79)
Table III1 Consumer Confidence Indicator mdash Correlation Matrix
(1995Q4-2016Q1)
(1) Not statistically significant at conventional levels Source DG ECFIN calculations based on EU Business and Consumer Surveys
(76) Deacutees S and J Guntner (2014) lsquoThe international dimension of
confidence shockrsquo ECB Working Paper No 1669 (77) Op cit DrsquoAuria F (2013) (78) The very low and non-statistically significant correlation of the
Italian confidence indicator with the confidence indicators of a number of other euro area countries is somewhat puzzling and there is a need for further investigation into the reasons behind it
(79) The strong correlation between confidence indicators in countries sharing similar economic conditions can be indicative of larger confidence spillovers between them but can also be a reflection of the strong correlation between their economic fundamentals
The strength of the correlation also varies considerably over time Table III2 displays correlations between consumer confidence indicators in the same euro area countries over the period 2008Q1-2012Q4 During the crisis period the link between consumer confidence indicators is significantly tighter
Table III2 Consumer Confidence Indicator mdash Correlation Matrix
(2008Q1-2012Q4)
(1) Not statistically significant at conventional levels Source DG ECFIN calculations based on EU Business and Consumer Surveys
The presence of a correlation between confidence indicators may point to the existence of confidence spillover effects between countries but also be indicative of strong business cycle synchronisation To shed light on the nature of these correlations this section discusses confidence spillovers in the euro area on the basis of the findings from the estimation of a Global Vector Autoregressive (GVAR) model which includes data for eight euro area countries over the period 1996Q2-2013Q1 Box III1 describes the model in more detail
The model includes observations on consumption GDP the unemployment rate a short-term interest rate and consumer confidence The latter is measured by the BCS Consumer Confidence Indicator which is an arithmetic average of the balances of the answers to questions on the financial situation of households the general economic situation unemployment expectations and savings over the next 12 months It is therefore taken as a proxy for consumersrsquo expectations about their future economic situation
The results seem to support the existence of consumer confidence spillovers across the euro area As an illustration Graph III2 reports impulse
AT BE FI FR IT DE NL ES
AT 100 069 069 074 013(1) 054 043 022BE 069 100 067 088 055 057 068 066FI 069 067 100 068 039 028 075 055FR 074 088 068 100 046 055 066 060IT 013(1) 055 039 046 100 004(1) 063 081DE 054 057 028 055 004(1) 100 033 023NL 043 068 075 066 063 033 100 073ES 022 066 055 060 081 023 073 100
AT BE FI FR IT DE NL ES
AT 100 093 090 088 036(1) 079 086 063BE 093 100 081 080 034(1) 080 081 071FI 090 081 100 083 058 052 081 066FR 088 080 083 100 030(1) 066 074 061IT 036(1) 034(1) 058 030(1) 100 -016(1) 065 038DE 079 080 052 066 -016(1) 100 050 048NL 086 081 081 074 065 05 100 050ES 063 071 066 061 038 048 050 100
Box (continued)
by the European Commission Consumption and GDP enter the model in log differences while the other variables are in levels Some of the results are discussed in the main text
III Confidence spillovers in the euro area
Volume 15 No 2 | 37
response functions of consumer confidence in the euro area countries included in the GVAR model to a positive shock to consumer confidence in Germany over 24 quarters (80)
The largest effect appears to be in smaller neighbouring countries (Austria Belgium and the Netherlands) The response of consumer confidence is also relatively large in Finland France and Spain On the other hand spillovers to consumer confidence in Italy are very small and become negative after six quarters This is not a surprise given the statistically insignificant correlation between German and Italian consumer confidence emerging from the data reported in Table III1 The peak response occurs in the second or third quarter
Similar results although of a smaller magnitude were obtained for the other euro area countries included in the model Confidence spillovers appear to be larger across countries with stronger geographical and trade links Overall the evidence from the estimation of the model supports the existence of a transmission channel for consumer confidence shocks across the euro area However the effects of confidence shocks on foreign consumption are in most cases not statistically significant suggesting that the transmission channel is to foreign confidence rather than
(80) A caveat must be made about the difficulty of identifying truly
exogenous confidence shocks owing to the fact that confidence indicators are largely driven by the same factors which determine consumption
directly to foreign economic activity (81)
These results suggest that confidence shocks play a role in the international business cycle and that there are close interlinkages between confidence indicators across euro area countries This evidence supports the need for coordinated policy action able to boost confidence across euro area countries
III5 Conclusions
In recent years the dynamics of euro area consumer confidence and real private consumption have been very closely related Moreover consumer confidence indicators across the euro area appear to be strongly correlated The strength of the correlation was considerably greater during the crisis period
The evidence of a link between real consumption and consumer confidence is mixed but several studies are supportive of consumer confidence playing a role in determining consumption In addition there is evidence to suggest that shocks to consumer confidence in euro area countries affect confidence in other euro area Member States This is also borne out by results obtained from the estimation of a Global Vector Autoregressive (GVAR) model for eight euro area countries
(81) Similar conclusions are reached by op cit Deacutees and Soares-Brinca
(2013) and Deacutees and Guntner (2014)
38 | Quarterly Report on the Euro Area
Graph III2 Impulse response functions of foreign confidence to a one standard error confidence shock in Germany
Source DG ECFIN
000
005
010
015
020
025
030
035
1 2 3 4 5 6 7 8 9 10 11 12 13 14 15 16 17 18 19 20 21 22 23 24
AT
000
005
010
015
020
025
030
035
040
1 2 3 4 5 6 7 8 9 10 11 12 13 14 15 16 17 18 19 20 21 22 23 24
BE
000
005
010
015
020
025
030
1 2 3 4 5 6 7 8 9 10 11 12 13 14 15 16 17 18 19 20 21 22 23 24
FI
000
005
010
015
020
025
030
1 2 3 4 5 6 7 8 9 10 11 12 13 14 15 16 17 18 19 20 21 22 23 24
FR
-002
-001
000
001
002
003
004
005
006
007
1 2 3 4 5 6 7 8 9 10 11 12 13 14 15 16 17 18 19 20 21 22 23 24
IT
000
005
010
015
020
025
030
035
040
1 2 3 4 5 6 7 8 9 10 11 12 13 14 15 16 17 18 19 20 21 22 23 24
NL
000
005
010
015
020
025
030
035
1 2 3 4 5 6 7 8 9 10 11 12 13 14 15 16 17 18 19 20 21 22 23 24
ES
40 | Quarterly Report on the Euro Area
Editors Jose Eduardo Leandro and Martin Larch
Coordination Plamen Nikolov
Statistical and layout assistance Christos Zavos
Comments on the report would be gratefully received and should be sent to
Jose Eduardo Leandro Director ndash Policy strategy coordination and communication Directorate-General for Economic and Financial Affairs Office CHAR 1566
B-1049 Brussels
Email joseleandroeceuropaeu
or
Martin Larch Head of Unit ndash EMU deepening and macroeconomy of the euro area Directorate-General for Economic and Financial Affairs Office CHAR 1556
B-1049 Brussels
Email martinlarcheceuropaeu
EUROPEAN ECONOMY INSTITUTIONAL SERIES
European Economy Institutional series can be accessed and downloaded free of charge from the following address httpeceuropaeueconomy_financepublicationseeipindex_enhtm Titles published before July 2015 can be accessed and downloaded free of charge from bull httpeceuropaeueconomy_financepublicationseuropean_economyindex_enhtm
(the main reports eg Economic Forecasts) bull httpeceuropaeueconomy_financepublicationsoccasional_paperindex_enhtm
(the Occasional Papers) bull httpeceuropaeueconomy_financepublicationsqr_euro_areaindex_enhtm
(the Quarterly Reports on the Euro Area)
Alternatively hard copies may be ordered via the ldquoPrint-on-demandrdquo service offered by the EU Bookshop httpbookshopeuropaeu
HOW TO OBTAIN EU PUBLICATIONS Free publications bull one copy
via EU Bookshop (httpbookshopeuropaeu) bull more than one copy or postersmaps
- from the European Unionrsquos representations (httpeceuropaeurepresent_enhtm) - from the delegations in non-EU countries (httpeeaseuropaeudelegationsindex_enhtm) - by contacting the Europe Direct service (httpeuropaeueuropedirectindex_enhtm) or calling 00 800 6 7 8 9 10 11 (freephone number from anywhere in the EU) () () The information given is free as are most calls (though some operators phone boxes or hotels may charge you)
Priced publications bull via EU Bookshop (httpbookshopeuropaeu)
ISBN 978-92-79-54335-7
KC-BC-16-030-EN-N
- NEW_IP_index_enpdf
-
- EUROPEAN EconomY institutional SERIES
-

II Financial channels and economic activity in the euro area
Volume 15 No 2 | 27
rates since 2012 Among all variables the consumer and business confidence indicator (ESI) comes out as having the strongest contemporaneous correlation with economic activity during the crisis
In the consecutive analysis the conditioning dataset (including only real GDP and inflation in the baseline) is augmented by financial variables corresponding to each transmission channel
hellip different channels play an important role at different stages since the crisis
The interest rate channel (Graph II9 upper panel) seems to better account for the pattern of consumption during the recent recovery (compared to the baseline) This channel which reflects mainly monetary conditions suggests that monetary easing implemented since 2014 by means of additional unconventional measures (namely the targeted long-term refinancing operations (TLTRO) the asset-backed securities purchasing program (ABSPP) and the forthcoming public
securities purchase program (PSPP)) have translated into a further decline in the long-term interest rate and the shadow policy rate It also reflects an increase in excess liquidity which has had a very benign effect on the recent recovery However producer prices developments (PPI) still appear unusually subdued Likewise including information capturing the interest rate channel does not help explain the dismal performance of consumption during the deleveraging phase (2012-2013) or the persistent weakness of credit dynamics Therefore these developments seem to be determined also by drivers other than monetary conditions
The borrowers balance sheet channel (Graph II9 lower panel) captures in turn the exceptional deleveraging developments of 20122013 but clearly underestimates the pace of the recent recovery This finding suggests that strained balance sheets of households and firms represented the main weight on the recovery at the time of euro area sovereign debt crisis However whereas a mild recovery started in the euro area in 2014 private
Graph II7 Conditional forecasts based on real GDP and inflation (1) (2000Q1-2015Q4 y-o-y growth)
Misalignments of financial and real variables with output growth since the crisis
(1) Shades of orange distribution of the conditional forecasts in the BVAR in levels excluding the lower and higher 5 quantiles Green line actual values The variables are all reported in terms of annual percentage changes except for the unemployment rate and the long-term interest rate which are in levels Conditioning assumptions real GDP and HICP Source DG ECFIN MATLAB codes replication files of the methodological paper (Banbura et al 2015)
Government consumption
2005 2010 2015-2
0
2
4Real consumption
2005 2010 2015-5
0
5Real investment
2005 2010 2015-20
-10
0
10
Unemployment rate
2005 2010 20150
5
10
15PPI ex const
2005 2010 2015-50
0
50House prices
2005 2010 2015-10
0
10
Long-term i r
2005 2010 20150
5
10Loans to firms
2005 2010 2015-10
0
10
20Loans to households
2005 2010 2015-5
0
5
10
28 | Quarterly Report on the Euro Area
balance sheets still did not improve much In fact when the borrower balance sheet channel is taken into account observed consumption overshoots the conditional forecast even by a higher margin than in the baseline scenario and real investment seems to be on the upper side as well This suggests that the borrower balance sheet channel should have led to more subdued dynamics of both consumption and investment than what has been observed in 2014 and 2015 indicating that other channels have been somewhat compensating the adverse effects of this channel
The bank balance sheet channel (Graph II10 upper panel) improves the forecast of investment since 2014 and reduces the uncertainty around the median for some variables such as consumption unemployment and long-term interest rate The good fit of investment dynamics indicates a strong correlation of investment with total economy credit developments both in terms of flows and stocks
Interestingly the bank balance sheet information namely the total economy credit as percentage of GDP (including credit to public sector) the private sector credit impulse and the price of credit for the private sector cannot capture the weak observed dynamics of outstanding loans to firms and households This shows that the private deleveraging process has been much stronger than the public sector deleveraging making private credit developments disconnected from GDP
growth (65) Therefore while the recovery in real activity has been rather weak the private credit dynamics have been even weaker Furthermore the modest recovery does not facilitate passive deleveraging (a decrease in the relative debt burden due to a growing economy ie denominator effect) and feeds the active deleveraging (a decrease of absolute level of debt ie nominator effect)
Finally the current long-term interest rate seems very low even when the financing costs for non-financial corporations (which also attained historical minima) are taken into account This underlines the importance of the ECBrsquos measures that imply very easy financing conditions in the foreseeable future
Last but not least the uncertainty channel (Graph II10) seems to improve the conditional forecast over the baseline in the same spirit as the bank balance sheet channel For example there is a good fit of investment indicating a strong correlation of investment with confidence and financial stress measures Equally the rebound in private consumption seems to be well captured by the uncertainty channel indicating that the recent decrease in financial markets stress has also been an important driver for consumption However in general the uncertainty channel is likely to be implicitly included in the bank balance sheet
(65) GDP is a denominator of the credit indicators in bank balance
sheet channel
Graph II8 Conditional forecasts based on real GDP and inflation (1) (2000Q1-2015Q4 y-o-y growth)
Business and consumer confidence and short-term interest rates
(1) Shades of orange distribution of the conditional forecasts in the BVAR in levels excluding the lower and higher 5 quantiles Green line actual values The variables are all reported in terms of annual percentage changes except for the unemployment rate and the long-term interest rate which are in levels Conditioning assumptions real GDP and HICP Source DG ECFIN MATLAB codes replication files of the methodological paper (Banbura et al 2015)
Economic sentiment
2005 2010 2015-15
-10
-5
0
5
10Short-term i r
2005 2010 2015-4
-2
0
2
4
6
8Shadow short-term interest rate
2005 2010 2015-6
-4
-2
0
2
4
6
II Financial channels and economic activity in the euro area
Volume 15 No 2 | 29
channel For example in periods of high uncertainty bank funding costs increase (bank balance sheet channel) and firms with weaker balance sheets cannot obtain credit for new loans (borrower balance sheet channel)
Overall the findings above suggest that while there is clear evidence of the transmission of monetary policy measures on financial variables and from financial variables to consumer lending rates the evidence on the effects on real activity is more complex with different channels playing an important role at different stages of the crisis The interest rate channel has helped the modest recovery since 2014 by supporting both public and private consumption growth and by partially compensating the balance sheet channel for both borrowers and banks The results in Graph II9 (lower panel) can be interpreted as showing that in the absence of massive monetary easing given the high level of debt in the economy and the wealth effects associated with house and asset prices decreases both private and public consumption growth could have been much more subdued than what it is currently observed
Graph II10 (both panels) illustrate the importance of the bank balance sheet and the uncertainty channel for capturing investment dynamics Weak investment growth is well captured both by credit developments as captured through the bank balance sheet channel and confidence effects through the uncertainty channel Real economic activity as measured by GDP growth while playing an important role does not seem to fully explain the subdued growth in investment since 2014 (Graph II7)
II5 Conclusions
The section discusses the nexus between financial and macroeconomic developments drawing some
lessons from the literature and providing some stylised facts on the main transmission channels through which financial developments have affected real economic activity since the crisis
While there is clear evidence of the transmission of monetary policy measures on financial variables and from financial variables to consumer lending rates the evidence on the effects on real activity is more complex with different channels playing an important role at different stages of the crisis
The state of private balance sheets seems to have significantly contributed to the poor performance of consumption during the euro area debt crisis and high debt levels still weigh on growth However given the still high level of debt the current mild recovery should be seen as a rather positive outcome The analysis suggests that easy monetary conditions seem to represent an important driver of the current recovery Another driver seems to be the balance sheets of banks which have gradually improved and allow better transmission of easy monetary conditions to the lending rates
Given the still high levels of debt in the economy and the wealth and confidence effects associated with house and asset prices corrections both private and public consumption growth could have been much more subdued than what it is currently observed were it not for the exceptional easing of monetary conditions
Unfortunately the recovery is still not strong enough to facilitate the deleveraging process The stock of debt and the ongoing deleveraging combined with adverse confidence effects still represent major impediments for a stronger recovery in investment Consequently there is a need to implement policy measures that allow dealing effectively with the debt overhang notably an effective framework for non-performing loans resolution
30 | Quarterly Report on the Euro Area
Graph II9 Conditional forecasts based on variables capturing the interest rate channel and borrower balance sheet channel (1)
(2000Q1-2015Q4 y-o-y growth)
Interest rate channel
Borrower balance sheet channel
(1) Shades of orange distribution of the conditional forecasts in the BVAR in levels excluding the lower and higher 5 quantiles Green line actual values The variables are all reported in terms of annual percentage changes except for the unemployment rate and the long-term interest rate which are in levels Conditioning assumptions interest rate channel ESI HICP the short-term interest rate the long-term interest rate the shadow interest rate and the ECB excess liquidity measure Conditioning assumptions borrower balance sheet channel ESI HICP house prices stock prices and outstanding loans to households and firms Due to the high contemporaneous correlation between real GDP growth and the ESI indicator the ESI indicator contains the same forecasting information as real GDP ESI indicator is used in the conditioning set instead of real GDP variable in order to also illustrate conditional forecasts for real GDP Source DG ECFIN MATLAB codes replication files of the methodological paper (Banbura et al2015)
Real GDP
2005 2010 2015-10
-5
0
5Government consumption
2005 2010 2015-2
0
2
4Real consumption
2005 2010 2015-5
0
5
Real investment
2005 2010 2015-20
-10
0
10Unemployment rate
2005 2010 20150
10
20PPI ex const
2005 2010 2015-50
0
50
House prices
2005 2010 2015-10
0
10
20Loans to firms
2005 2010 2015-10
0
10
20Loans to households
2005 2010 2015-10
0
10
20
Real GDP
2005 2010 2015-10
-5
0
5Government consumption
2005 2010 2015-2
0
2
4Real consumption
2005 2010 2015-5
0
5
Real investment
2005 2010 2015-20
-10
0
10Unemployment rate
2005 2010 20150
5
10
15PPI ex const
2005 2010 2015-50
0
50
Shadow short-term interest rate
2005 2010 2015-5
0
5
10Short-term i r
2005 2010 2015-5
0
5
10Long-term i r
2005 2010 20150
5
10
II Financial channels and economic activity in the euro area
Volume 15 No 2 | 31
Graph II10 Conditional forecasts based on variables capturing the bank balance sheet channel and uncertainty channel (1)
(2000Q1-2015Q4 y-o-y growth) Bank balance sheet channel
Uncertainty channel
(1) Shades of orange distribution of the conditional forecasts in the BVAR in levels excluding the lower and higher 5 quantiles Solid black line point estimate of the conditional forecasts in the BVAR in differences which is computed as the median of the distribution of the conditional forecasts in this model Green line with crosses actual values The variables are all reported in terms of annual percentage changes except for the unemployment rate and the long-term interest rate which are in levels Conditioning assumptions for the bank balance sheet channel ESI HICP the credit impulse the private credit volumes (debt-to-GDP ratio) and bank lending rates for households and firms (CFCI) Conditioning assumptions uncertainty channel ESI HICP the policy uncertainty indicator the CISS and the VIX Due to the high contemporaneous correlation between real GDP growth and the ESI indicator the ESI indicator contains the same forecasting information as real GDP ESI indicator is used in the conditioning set instead of real GDP variable in order to also illustrate conditional forecasts for real GDP Source DG ECFIN MATLAB codes replication files of the methodological paper (Banbura et al 2015)
Real GDP
2005 2010 2015-10
-5
0
5Government consumption
2005 2010 2015-2
0
2
4Real consumption
2005 2010 2015-2
0
2
4
Real investment
2005 2010 2015-20
-10
0
10Unemployment rate
2005 2010 20150
5
10
15PPI ex const
2005 2010 2015-50
0
50
Loans to firms
2005 2010 2015-10
0
10
20Loans to households
2005 2010 2015-10
0
10
20Long-term i r
2005 2010 20150
2
4
6
Real GDP
2005 2010 2015-10
0
10Government consumption
2005 2010 2015-2
0
2
4Real consumption
2005 2010 2015-5
0
5
Real investment
2005 2010 2015-20
0
20Unemployment rate
2005 2010 20150
5
10
15PPI ex const
2005 2010 2015-50
0
50
Loans to firms
2005 2010 2015-10
0
10
20Loans to households
2005 2010 2015-10
0
10
20Long-term i r
2005 2010 20150
5
10
III Confidence spillovers in the euro area
Volume 15 No 2 | 33
III1 Introduction
During the recent crisis euro area private consumption fell substantially This was accompanied by a sharp decline in consumer confidence which many observers have identified as a key factor contributing to the persistence of the slowdown In fact the onset of the crisis coincided with an abrupt unwinding of imbalances that is of economic trends that turned out to be unsustainable and which led to a significant adjustment of expectations Both consumption growth rates and confidence levels have been improving since the start of 2013
There is some (mixed) evidence to suggest that fluctuations in consumer confidence affect the dynamics of private consumption (67) On the basis of this assumption and taking into account the unprecedented extent of the most recent crisis it is important to determine whether and to what extent confidence shocks spill over between countries This is particularly relevant in relation to the euro area where close trade and financial links and common institutional features can lead to the rapid propagation of shocks In addition confidence spillovers can be an important aspect to consider when discussing how to improve macroeconomic policymaking in a common currency area
This section reviews the evidence on the link between consumer confidence and private consumption and on cross-border confidence spillovers and presents some analysis of the transmission of confidence shocks across the euro area It is a follow-up to analysis discussed in
(66) This section was prepared by Francesca DrsquoAuria (67) See for a discussion Ludvigson SC 2004 lsquoConsumer
confidence and consumer spendingrsquo Journal of Economic Perspectives Vol 18(2) pp 29-50
previous issues of the Quarterly Report on the Euro Area (QREA) (68)
III2 Recent trends in consumer confidence and private consumption in the euro area
Graph III1 shows the evolution over the period 1995Q2-2016Q1 of euro area real private consumption and consumer confidence The latter is measured by the Consumer Confidence Indicator constructed by the European Commission as part of the Joint Harmonised EU Programme of Business and Consumer Surveys (BCS) (69)
There is close co-movement between the two variables Both real consumption growth and consumer confidence showed the greatest deterioration in the first quarter of 2009 and during the sovereign debt crisis They have been on a recovery path since early 2013 with consumer confidence reaching levels above the euro area long-term average since the first quarter of 2014
The relationship between consumer confidence and private consumption is much debated in the literature From a theoretical perspective there are two main competing theories One view is that confidence indicators can help predict the dynamics of consumption as they convey information about future economic conditions Another theory is that the link between the two variables can be interpreted in terms of lsquoanimal
(68) DrsquoAuria F lsquoCross-border spillovers in confidencersquo Quarterly
Report on the Euro Area (2013) Vol 12(3) pp26-30 DrsquoAuria F S Linden D Monteiro J in lsquot Veld and S Zeugner
lsquoCross-border spillovers in the euro arearsquo Quarterly Report on the Euro Area (2014) Vol 13(4) pp7-22
(69) See European Commission (2016) lsquoA user guide to the Joint Harmonised EU Programme of Business and Consumer Surveysrsquo for details on the construction of the indicators
In recent years there has been close co-movement between consumer confidence and private consumption in the euro area During the crisis in particular consumer confidence was identified by many commentators as a driving factor in its persistence as expectations about a sustainable path of economic growth were adjusted significantly In view of the unprecedented extent of the crisis the question of whether and to what extent changes in consumer confidence in one country could spill over to other countries was also raised This section discusses the relationship between consumer confidence and consumption and reviews the evidence of consumer confidence spillovers between euro area countries We conclude that there is some evidence to suggest that confidence shocks are transmitted between countries This conclusion is corroborated by results from the estimation of a Global Vector Autoregressive (GVAR) model for a number of euro area countries (66)
34 | Quarterly Report on the Euro Area
spiritsrsquo as confidence indicators capture fluctuations in beliefs which in turn affect consumption (70) In both cases the essence of confidence indicators is to gauge expectations ndash irrespective of how they are formed ndash about the future course of the economy which then have a knock-on effect on current consumer behaviour
Graph III1 Confidence and private consumption euro area
(1995Q2-2016Q1 q-o-q change)
Source Eurostat and DG ECFIN calculations based on EU Business and Consumer Surveys
Several studies test empirically the link between consumer confidence and private consumption A number of them find evidence in support of a strong correlation between consumer confidence and consumption (71)
However as confidence and consumption are to a large extent determined by the same factors other studies try to assess whether confidence indicators carry information beyond economic fundamentals The evidence on this issue is mixed although several studies conclude that confidence indicators play a significant role There is some evidence to suggest that while part of the information conveyed by confidence indicators is also captured by other variables (eg past consumption income and interest rates) confidence measures have an additional predictive power for the future path of
(70) See Barsky and Sims (2012) for a discussion of the different
theoretical approaches to the role of confidence Barsky R B and ER Sims (2012) lsquoInformation animal spirits and the meaning of innovations in consumer confidencersquo American Economic Review 102(4) pp 1343-1377
(71) See for example Carroll C J Fuhrer and D Wilcox (1994) lsquoDoes consumer sentiment forecast household spending If so whyrsquo American Economic Review Vol 84 pp 1397-1408
consumer spending (72) Moreover some papers find that confidence indicators have a stronger predictive power during periods of large economic fluctuations (73)
III3 The existing evidence on confidence spillovers
On the assumption that a causal relationship between consumer confidence and private consumption exists it is important to determine whether and to what extent changes in consumer confidence in one country affect confidence (and thus consumption) in others
There is some evidence to support the existence of confidence spillovers This pertains both to confidence shocks originating in the US and being transmitted to the euro area and shocks which occur in one euro area country and spill over to other euro area countries
Several studies provide evidence of a transmission channel of confidence shock to foreign confidence In particular evidence for G7 countries and Spain would suggest that variations in confidence generally spill over from large countries to smaller ones (74) Some studies support the idea that confidence shocks originating in US are transmitted to the euro area but not the other way round ie shocks to euro area confidence do not affect confidence in the US (75) Other studies show a transmission channel for confidence shocks
(72) Some authors eg Ludvigson (2004) Souleles (2004) and Lahiri
Monokroussos and Zhao (2016) conclude that including confidence indicators can reduce forecasting errors when predicting the dynamics of consumption while others reach the opposite conclusion (eg Claveria Pons and Ramos 2007)
Ludvigson S (2004) lsquoConsumer confidence and consumer spendingrsquo Journal of Economic Perspectives Vol 18(2) pp 29-50
Souleles NS (2004) lsquoExpectations heterogenous forecast errors and consumption Micro evidence from the Michigan Consumer Sentiment Surveysrsquo Journal of Money Credit and Banking Vol 36 pp 39-72
Lahiri K G Monokroussos and Y Zhao (2016) lsquoForecasting consumption the role of consumer confidence in real time with many predictorsrsquo Journal of Applied Econometrics forthcoming
Claveria O E Pons and R Ramos (2007) lsquoBusiness and consumer expectations and macroeconomic forecastsrsquo International Journal of Forecasting Vol 23 pp47-69
(73) For example Howrey E (2001) lsquoThe predictive power of the index of consumer sentimentrsquo Brookings Papers on Economic Activity Vol 1 pp 175-216
(74) Fei S (2011) lsquoThe confidence channel for the transmission of shocksrsquo Banque de France Working Paper No 314
(75) Deacutees S and P Soares-Brinca (2013) lsquoConsumer confidence as a predictor of consumption spending Evidence for the United States and the Euro Arearsquo International Economics Vol 134 pp 1-14
-40
-30
-20
-10
0
10
1995Q2 1998Q2 2001Q2 2004Q2 2007Q2 2010Q2 2013Q2-08
-04
00
04
08
12
16Consumption (rhs)Consumer Confidence Indicator
III Confidence spillovers in the euro area
Volume 15 No 2 | 35
(Continued on the next page)
Box III1 A GVAR model to assess confidence spillovers
The Global Vector Autoregressive (GVAR) methodology developed by Pesaran Schuermann and Weiner (2004) (1) combines individual vector error-correcting models where domestic variables are linked to country-specific foreign variables The latter combine the domestic variables using international trade financial or other relevant weights for each country This approach allows the analysis of interdependence across different economies providing a solution to the lsquocurse of dimensionalityrsquo (eg the high number of parameters as the dimension of the model increases) in global modelling
For a set of countries i=0 1 2 hellip N the individual VARX(pi qi) models take the following form
itqtiiqtiiitiiptiiptiiit uxxxxxxii
+Λ++Λ+Λ+Φ++Φ= minusminusminusminus
11
011
where xit is a vector of ki x 1 vector of domestic variables xit a ki x 1 vector of foreign variables and
00
===
iijt
N
jijit xx ωω
where ωij j=01hellipN is a set of weights such that 10
==
N
jijω The foreign variables xit are therefore a
weighted average of domestic variables for all countries included in the model The weights can be different in nature but are typically constructed using trade or capital flows data The GVAR model is then solved for the lsquoworldrsquo (ie all countries included in the model) as a whole considering all variables as endogenous to the system
The GVAR model has been applied to a variety of issues These include forecasting (eg Pesaran Schuermann and Smith 2009) credit risk (eg Pesaran Schuermann and Treutler 2007) oil price shocks (eg Galesi and Lombardi 2009) global imbalances (eg Bussiegravere Chudik and Sestieri 2012) business cycle synchronisation (eg Dreger and Zhang 2013) the impact of EU membership (eg Pesaran Smith and Smith 2007) the international effects of fiscal policy shocks (eg Favero Giavazzi and Perego 2011) (2) Chudik and Pesaran (2014) provide a detailed review of these and other recent applications (3)
In this section this approach is used to analyse the transmission of country-specific and global consumer confidence shocks in a model which includes eight euro area countries (Austria Belgium Finland France Germany Italy the Netherlands and Spain) using quarterly data over the period 1996Q2-2013Q1 The model is solved using the GVAR Toolbox developed by Smith and Galesi (2014) (4)
(1) Pesaran MH Schuermann T and Weiner S M (2004) lsquoModelling regional interdependencies using a global error-correcting
modelrsquo Journal of Business and Economic Statistics Vol 22 pp 129-162 (2) Pesaran M H Schuermann T and Smith LV (2009) lsquoForecasting economic and financial variables with global VARsrsquo
International Journal of Forecasting Vol 25(4) pp 642-675 Pesaran MH Schuermann T and Treutler B-J (2007) lsquoGlobal business cycles and credit riskrsquo in The Risks of Financial Institutions NBER Chapters pp 419-474 Bussiegravere M Chudik A and Sestieri G (2012) lsquoModelling global trade flows results from a GVAR modelrsquo Globalization and Monetary Policy Institute Working Paper 119 Federal Reserve Bank of Dallas Dreger C and Zhang Y (2013) lsquoDoes the economic integration of China affect growth and inflation in industrial countriesrsquo FIW Working Paper series 116 FIW Pesaran M H Smith L V and Smith R P (2007) lsquoWhat if the UK or Sweden had joined the euro in 1999 An empirical evaluation using a Global VARrsquo International Journal of Finance and Economics Vol 12(1) pp 55-87 Favero C Giavazzi F and Perego F (2011) lsquoCountry heterogeneity and the international evidence on the effects of fiscal policyrsquo IMF Economic Review 59(4) 652-682
(3) Chudik A and Pesaran MH (2014) lsquoTheory and Practice of GVAR Modelingrsquo Federal Reserve Bank of Dallas Globalization and Monetary Policy Institute Working Paper No 180
(4) Smith LV and Galesi A (2014) GVAR Toolbox 20 available at httpssitesgooglecomsitegvarmodellinggvar-toolbox
36 | Quarterly Report on the Euro Area
between the US the euro area as a whole and four EU countries taken individually (76)
In addition the role of consumer confidence spillovers in the euro area was assessed in a previous issue of the QREA (77) Consumption and confidence regressions were carried out for a panel of euro area countries over the period 1999-2012 The findings support the existence of confidence spillovers between euro area countries
III4 Confidence spillovers across the euro area
Table III1 shows simple correlations between the confidence indicators of eight euro area countries over the period 1995Q4-2016Q1 (78)The strength of the link between consumer confidence indicators across Member States is variable and in most cases is larger between neighbouring countries and between countries sharing similar macroeconomic environments (79)
Table III1 Consumer Confidence Indicator mdash Correlation Matrix
(1995Q4-2016Q1)
(1) Not statistically significant at conventional levels Source DG ECFIN calculations based on EU Business and Consumer Surveys
(76) Deacutees S and J Guntner (2014) lsquoThe international dimension of
confidence shockrsquo ECB Working Paper No 1669 (77) Op cit DrsquoAuria F (2013) (78) The very low and non-statistically significant correlation of the
Italian confidence indicator with the confidence indicators of a number of other euro area countries is somewhat puzzling and there is a need for further investigation into the reasons behind it
(79) The strong correlation between confidence indicators in countries sharing similar economic conditions can be indicative of larger confidence spillovers between them but can also be a reflection of the strong correlation between their economic fundamentals
The strength of the correlation also varies considerably over time Table III2 displays correlations between consumer confidence indicators in the same euro area countries over the period 2008Q1-2012Q4 During the crisis period the link between consumer confidence indicators is significantly tighter
Table III2 Consumer Confidence Indicator mdash Correlation Matrix
(2008Q1-2012Q4)
(1) Not statistically significant at conventional levels Source DG ECFIN calculations based on EU Business and Consumer Surveys
The presence of a correlation between confidence indicators may point to the existence of confidence spillover effects between countries but also be indicative of strong business cycle synchronisation To shed light on the nature of these correlations this section discusses confidence spillovers in the euro area on the basis of the findings from the estimation of a Global Vector Autoregressive (GVAR) model which includes data for eight euro area countries over the period 1996Q2-2013Q1 Box III1 describes the model in more detail
The model includes observations on consumption GDP the unemployment rate a short-term interest rate and consumer confidence The latter is measured by the BCS Consumer Confidence Indicator which is an arithmetic average of the balances of the answers to questions on the financial situation of households the general economic situation unemployment expectations and savings over the next 12 months It is therefore taken as a proxy for consumersrsquo expectations about their future economic situation
The results seem to support the existence of consumer confidence spillovers across the euro area As an illustration Graph III2 reports impulse
AT BE FI FR IT DE NL ES
AT 100 069 069 074 013(1) 054 043 022BE 069 100 067 088 055 057 068 066FI 069 067 100 068 039 028 075 055FR 074 088 068 100 046 055 066 060IT 013(1) 055 039 046 100 004(1) 063 081DE 054 057 028 055 004(1) 100 033 023NL 043 068 075 066 063 033 100 073ES 022 066 055 060 081 023 073 100
AT BE FI FR IT DE NL ES
AT 100 093 090 088 036(1) 079 086 063BE 093 100 081 080 034(1) 080 081 071FI 090 081 100 083 058 052 081 066FR 088 080 083 100 030(1) 066 074 061IT 036(1) 034(1) 058 030(1) 100 -016(1) 065 038DE 079 080 052 066 -016(1) 100 050 048NL 086 081 081 074 065 05 100 050ES 063 071 066 061 038 048 050 100
Box (continued)
by the European Commission Consumption and GDP enter the model in log differences while the other variables are in levels Some of the results are discussed in the main text
III Confidence spillovers in the euro area
Volume 15 No 2 | 37
response functions of consumer confidence in the euro area countries included in the GVAR model to a positive shock to consumer confidence in Germany over 24 quarters (80)
The largest effect appears to be in smaller neighbouring countries (Austria Belgium and the Netherlands) The response of consumer confidence is also relatively large in Finland France and Spain On the other hand spillovers to consumer confidence in Italy are very small and become negative after six quarters This is not a surprise given the statistically insignificant correlation between German and Italian consumer confidence emerging from the data reported in Table III1 The peak response occurs in the second or third quarter
Similar results although of a smaller magnitude were obtained for the other euro area countries included in the model Confidence spillovers appear to be larger across countries with stronger geographical and trade links Overall the evidence from the estimation of the model supports the existence of a transmission channel for consumer confidence shocks across the euro area However the effects of confidence shocks on foreign consumption are in most cases not statistically significant suggesting that the transmission channel is to foreign confidence rather than
(80) A caveat must be made about the difficulty of identifying truly
exogenous confidence shocks owing to the fact that confidence indicators are largely driven by the same factors which determine consumption
directly to foreign economic activity (81)
These results suggest that confidence shocks play a role in the international business cycle and that there are close interlinkages between confidence indicators across euro area countries This evidence supports the need for coordinated policy action able to boost confidence across euro area countries
III5 Conclusions
In recent years the dynamics of euro area consumer confidence and real private consumption have been very closely related Moreover consumer confidence indicators across the euro area appear to be strongly correlated The strength of the correlation was considerably greater during the crisis period
The evidence of a link between real consumption and consumer confidence is mixed but several studies are supportive of consumer confidence playing a role in determining consumption In addition there is evidence to suggest that shocks to consumer confidence in euro area countries affect confidence in other euro area Member States This is also borne out by results obtained from the estimation of a Global Vector Autoregressive (GVAR) model for eight euro area countries
(81) Similar conclusions are reached by op cit Deacutees and Soares-Brinca
(2013) and Deacutees and Guntner (2014)
38 | Quarterly Report on the Euro Area
Graph III2 Impulse response functions of foreign confidence to a one standard error confidence shock in Germany
Source DG ECFIN
000
005
010
015
020
025
030
035
1 2 3 4 5 6 7 8 9 10 11 12 13 14 15 16 17 18 19 20 21 22 23 24
AT
000
005
010
015
020
025
030
035
040
1 2 3 4 5 6 7 8 9 10 11 12 13 14 15 16 17 18 19 20 21 22 23 24
BE
000
005
010
015
020
025
030
1 2 3 4 5 6 7 8 9 10 11 12 13 14 15 16 17 18 19 20 21 22 23 24
FI
000
005
010
015
020
025
030
1 2 3 4 5 6 7 8 9 10 11 12 13 14 15 16 17 18 19 20 21 22 23 24
FR
-002
-001
000
001
002
003
004
005
006
007
1 2 3 4 5 6 7 8 9 10 11 12 13 14 15 16 17 18 19 20 21 22 23 24
IT
000
005
010
015
020
025
030
035
040
1 2 3 4 5 6 7 8 9 10 11 12 13 14 15 16 17 18 19 20 21 22 23 24
NL
000
005
010
015
020
025
030
035
1 2 3 4 5 6 7 8 9 10 11 12 13 14 15 16 17 18 19 20 21 22 23 24
ES
40 | Quarterly Report on the Euro Area
Editors Jose Eduardo Leandro and Martin Larch
Coordination Plamen Nikolov
Statistical and layout assistance Christos Zavos
Comments on the report would be gratefully received and should be sent to
Jose Eduardo Leandro Director ndash Policy strategy coordination and communication Directorate-General for Economic and Financial Affairs Office CHAR 1566
B-1049 Brussels
Email joseleandroeceuropaeu
or
Martin Larch Head of Unit ndash EMU deepening and macroeconomy of the euro area Directorate-General for Economic and Financial Affairs Office CHAR 1556
B-1049 Brussels
Email martinlarcheceuropaeu
EUROPEAN ECONOMY INSTITUTIONAL SERIES
European Economy Institutional series can be accessed and downloaded free of charge from the following address httpeceuropaeueconomy_financepublicationseeipindex_enhtm Titles published before July 2015 can be accessed and downloaded free of charge from bull httpeceuropaeueconomy_financepublicationseuropean_economyindex_enhtm
(the main reports eg Economic Forecasts) bull httpeceuropaeueconomy_financepublicationsoccasional_paperindex_enhtm
(the Occasional Papers) bull httpeceuropaeueconomy_financepublicationsqr_euro_areaindex_enhtm
(the Quarterly Reports on the Euro Area)
Alternatively hard copies may be ordered via the ldquoPrint-on-demandrdquo service offered by the EU Bookshop httpbookshopeuropaeu
HOW TO OBTAIN EU PUBLICATIONS Free publications bull one copy
via EU Bookshop (httpbookshopeuropaeu) bull more than one copy or postersmaps
- from the European Unionrsquos representations (httpeceuropaeurepresent_enhtm) - from the delegations in non-EU countries (httpeeaseuropaeudelegationsindex_enhtm) - by contacting the Europe Direct service (httpeuropaeueuropedirectindex_enhtm) or calling 00 800 6 7 8 9 10 11 (freephone number from anywhere in the EU) () () The information given is free as are most calls (though some operators phone boxes or hotels may charge you)
Priced publications bull via EU Bookshop (httpbookshopeuropaeu)
ISBN 978-92-79-54335-7
KC-BC-16-030-EN-N
- NEW_IP_index_enpdf
-
- EUROPEAN EconomY institutional SERIES
-

II Financial channels and economic activity in the euro area
Volume 15 No 2 | 29
channel For example in periods of high uncertainty bank funding costs increase (bank balance sheet channel) and firms with weaker balance sheets cannot obtain credit for new loans (borrower balance sheet channel)
Overall the findings above suggest that while there is clear evidence of the transmission of monetary policy measures on financial variables and from financial variables to consumer lending rates the evidence on the effects on real activity is more complex with different channels playing an important role at different stages of the crisis The interest rate channel has helped the modest recovery since 2014 by supporting both public and private consumption growth and by partially compensating the balance sheet channel for both borrowers and banks The results in Graph II9 (lower panel) can be interpreted as showing that in the absence of massive monetary easing given the high level of debt in the economy and the wealth effects associated with house and asset prices decreases both private and public consumption growth could have been much more subdued than what it is currently observed
Graph II10 (both panels) illustrate the importance of the bank balance sheet and the uncertainty channel for capturing investment dynamics Weak investment growth is well captured both by credit developments as captured through the bank balance sheet channel and confidence effects through the uncertainty channel Real economic activity as measured by GDP growth while playing an important role does not seem to fully explain the subdued growth in investment since 2014 (Graph II7)
II5 Conclusions
The section discusses the nexus between financial and macroeconomic developments drawing some
lessons from the literature and providing some stylised facts on the main transmission channels through which financial developments have affected real economic activity since the crisis
While there is clear evidence of the transmission of monetary policy measures on financial variables and from financial variables to consumer lending rates the evidence on the effects on real activity is more complex with different channels playing an important role at different stages of the crisis
The state of private balance sheets seems to have significantly contributed to the poor performance of consumption during the euro area debt crisis and high debt levels still weigh on growth However given the still high level of debt the current mild recovery should be seen as a rather positive outcome The analysis suggests that easy monetary conditions seem to represent an important driver of the current recovery Another driver seems to be the balance sheets of banks which have gradually improved and allow better transmission of easy monetary conditions to the lending rates
Given the still high levels of debt in the economy and the wealth and confidence effects associated with house and asset prices corrections both private and public consumption growth could have been much more subdued than what it is currently observed were it not for the exceptional easing of monetary conditions
Unfortunately the recovery is still not strong enough to facilitate the deleveraging process The stock of debt and the ongoing deleveraging combined with adverse confidence effects still represent major impediments for a stronger recovery in investment Consequently there is a need to implement policy measures that allow dealing effectively with the debt overhang notably an effective framework for non-performing loans resolution
30 | Quarterly Report on the Euro Area
Graph II9 Conditional forecasts based on variables capturing the interest rate channel and borrower balance sheet channel (1)
(2000Q1-2015Q4 y-o-y growth)
Interest rate channel
Borrower balance sheet channel
(1) Shades of orange distribution of the conditional forecasts in the BVAR in levels excluding the lower and higher 5 quantiles Green line actual values The variables are all reported in terms of annual percentage changes except for the unemployment rate and the long-term interest rate which are in levels Conditioning assumptions interest rate channel ESI HICP the short-term interest rate the long-term interest rate the shadow interest rate and the ECB excess liquidity measure Conditioning assumptions borrower balance sheet channel ESI HICP house prices stock prices and outstanding loans to households and firms Due to the high contemporaneous correlation between real GDP growth and the ESI indicator the ESI indicator contains the same forecasting information as real GDP ESI indicator is used in the conditioning set instead of real GDP variable in order to also illustrate conditional forecasts for real GDP Source DG ECFIN MATLAB codes replication files of the methodological paper (Banbura et al2015)
Real GDP
2005 2010 2015-10
-5
0
5Government consumption
2005 2010 2015-2
0
2
4Real consumption
2005 2010 2015-5
0
5
Real investment
2005 2010 2015-20
-10
0
10Unemployment rate
2005 2010 20150
10
20PPI ex const
2005 2010 2015-50
0
50
House prices
2005 2010 2015-10
0
10
20Loans to firms
2005 2010 2015-10
0
10
20Loans to households
2005 2010 2015-10
0
10
20
Real GDP
2005 2010 2015-10
-5
0
5Government consumption
2005 2010 2015-2
0
2
4Real consumption
2005 2010 2015-5
0
5
Real investment
2005 2010 2015-20
-10
0
10Unemployment rate
2005 2010 20150
5
10
15PPI ex const
2005 2010 2015-50
0
50
Shadow short-term interest rate
2005 2010 2015-5
0
5
10Short-term i r
2005 2010 2015-5
0
5
10Long-term i r
2005 2010 20150
5
10
II Financial channels and economic activity in the euro area
Volume 15 No 2 | 31
Graph II10 Conditional forecasts based on variables capturing the bank balance sheet channel and uncertainty channel (1)
(2000Q1-2015Q4 y-o-y growth) Bank balance sheet channel
Uncertainty channel
(1) Shades of orange distribution of the conditional forecasts in the BVAR in levels excluding the lower and higher 5 quantiles Solid black line point estimate of the conditional forecasts in the BVAR in differences which is computed as the median of the distribution of the conditional forecasts in this model Green line with crosses actual values The variables are all reported in terms of annual percentage changes except for the unemployment rate and the long-term interest rate which are in levels Conditioning assumptions for the bank balance sheet channel ESI HICP the credit impulse the private credit volumes (debt-to-GDP ratio) and bank lending rates for households and firms (CFCI) Conditioning assumptions uncertainty channel ESI HICP the policy uncertainty indicator the CISS and the VIX Due to the high contemporaneous correlation between real GDP growth and the ESI indicator the ESI indicator contains the same forecasting information as real GDP ESI indicator is used in the conditioning set instead of real GDP variable in order to also illustrate conditional forecasts for real GDP Source DG ECFIN MATLAB codes replication files of the methodological paper (Banbura et al 2015)
Real GDP
2005 2010 2015-10
-5
0
5Government consumption
2005 2010 2015-2
0
2
4Real consumption
2005 2010 2015-2
0
2
4
Real investment
2005 2010 2015-20
-10
0
10Unemployment rate
2005 2010 20150
5
10
15PPI ex const
2005 2010 2015-50
0
50
Loans to firms
2005 2010 2015-10
0
10
20Loans to households
2005 2010 2015-10
0
10
20Long-term i r
2005 2010 20150
2
4
6
Real GDP
2005 2010 2015-10
0
10Government consumption
2005 2010 2015-2
0
2
4Real consumption
2005 2010 2015-5
0
5
Real investment
2005 2010 2015-20
0
20Unemployment rate
2005 2010 20150
5
10
15PPI ex const
2005 2010 2015-50
0
50
Loans to firms
2005 2010 2015-10
0
10
20Loans to households
2005 2010 2015-10
0
10
20Long-term i r
2005 2010 20150
5
10
III Confidence spillovers in the euro area
Volume 15 No 2 | 33
III1 Introduction
During the recent crisis euro area private consumption fell substantially This was accompanied by a sharp decline in consumer confidence which many observers have identified as a key factor contributing to the persistence of the slowdown In fact the onset of the crisis coincided with an abrupt unwinding of imbalances that is of economic trends that turned out to be unsustainable and which led to a significant adjustment of expectations Both consumption growth rates and confidence levels have been improving since the start of 2013
There is some (mixed) evidence to suggest that fluctuations in consumer confidence affect the dynamics of private consumption (67) On the basis of this assumption and taking into account the unprecedented extent of the most recent crisis it is important to determine whether and to what extent confidence shocks spill over between countries This is particularly relevant in relation to the euro area where close trade and financial links and common institutional features can lead to the rapid propagation of shocks In addition confidence spillovers can be an important aspect to consider when discussing how to improve macroeconomic policymaking in a common currency area
This section reviews the evidence on the link between consumer confidence and private consumption and on cross-border confidence spillovers and presents some analysis of the transmission of confidence shocks across the euro area It is a follow-up to analysis discussed in
(66) This section was prepared by Francesca DrsquoAuria (67) See for a discussion Ludvigson SC 2004 lsquoConsumer
confidence and consumer spendingrsquo Journal of Economic Perspectives Vol 18(2) pp 29-50
previous issues of the Quarterly Report on the Euro Area (QREA) (68)
III2 Recent trends in consumer confidence and private consumption in the euro area
Graph III1 shows the evolution over the period 1995Q2-2016Q1 of euro area real private consumption and consumer confidence The latter is measured by the Consumer Confidence Indicator constructed by the European Commission as part of the Joint Harmonised EU Programme of Business and Consumer Surveys (BCS) (69)
There is close co-movement between the two variables Both real consumption growth and consumer confidence showed the greatest deterioration in the first quarter of 2009 and during the sovereign debt crisis They have been on a recovery path since early 2013 with consumer confidence reaching levels above the euro area long-term average since the first quarter of 2014
The relationship between consumer confidence and private consumption is much debated in the literature From a theoretical perspective there are two main competing theories One view is that confidence indicators can help predict the dynamics of consumption as they convey information about future economic conditions Another theory is that the link between the two variables can be interpreted in terms of lsquoanimal
(68) DrsquoAuria F lsquoCross-border spillovers in confidencersquo Quarterly
Report on the Euro Area (2013) Vol 12(3) pp26-30 DrsquoAuria F S Linden D Monteiro J in lsquot Veld and S Zeugner
lsquoCross-border spillovers in the euro arearsquo Quarterly Report on the Euro Area (2014) Vol 13(4) pp7-22
(69) See European Commission (2016) lsquoA user guide to the Joint Harmonised EU Programme of Business and Consumer Surveysrsquo for details on the construction of the indicators
In recent years there has been close co-movement between consumer confidence and private consumption in the euro area During the crisis in particular consumer confidence was identified by many commentators as a driving factor in its persistence as expectations about a sustainable path of economic growth were adjusted significantly In view of the unprecedented extent of the crisis the question of whether and to what extent changes in consumer confidence in one country could spill over to other countries was also raised This section discusses the relationship between consumer confidence and consumption and reviews the evidence of consumer confidence spillovers between euro area countries We conclude that there is some evidence to suggest that confidence shocks are transmitted between countries This conclusion is corroborated by results from the estimation of a Global Vector Autoregressive (GVAR) model for a number of euro area countries (66)
34 | Quarterly Report on the Euro Area
spiritsrsquo as confidence indicators capture fluctuations in beliefs which in turn affect consumption (70) In both cases the essence of confidence indicators is to gauge expectations ndash irrespective of how they are formed ndash about the future course of the economy which then have a knock-on effect on current consumer behaviour
Graph III1 Confidence and private consumption euro area
(1995Q2-2016Q1 q-o-q change)
Source Eurostat and DG ECFIN calculations based on EU Business and Consumer Surveys
Several studies test empirically the link between consumer confidence and private consumption A number of them find evidence in support of a strong correlation between consumer confidence and consumption (71)
However as confidence and consumption are to a large extent determined by the same factors other studies try to assess whether confidence indicators carry information beyond economic fundamentals The evidence on this issue is mixed although several studies conclude that confidence indicators play a significant role There is some evidence to suggest that while part of the information conveyed by confidence indicators is also captured by other variables (eg past consumption income and interest rates) confidence measures have an additional predictive power for the future path of
(70) See Barsky and Sims (2012) for a discussion of the different
theoretical approaches to the role of confidence Barsky R B and ER Sims (2012) lsquoInformation animal spirits and the meaning of innovations in consumer confidencersquo American Economic Review 102(4) pp 1343-1377
(71) See for example Carroll C J Fuhrer and D Wilcox (1994) lsquoDoes consumer sentiment forecast household spending If so whyrsquo American Economic Review Vol 84 pp 1397-1408
consumer spending (72) Moreover some papers find that confidence indicators have a stronger predictive power during periods of large economic fluctuations (73)
III3 The existing evidence on confidence spillovers
On the assumption that a causal relationship between consumer confidence and private consumption exists it is important to determine whether and to what extent changes in consumer confidence in one country affect confidence (and thus consumption) in others
There is some evidence to support the existence of confidence spillovers This pertains both to confidence shocks originating in the US and being transmitted to the euro area and shocks which occur in one euro area country and spill over to other euro area countries
Several studies provide evidence of a transmission channel of confidence shock to foreign confidence In particular evidence for G7 countries and Spain would suggest that variations in confidence generally spill over from large countries to smaller ones (74) Some studies support the idea that confidence shocks originating in US are transmitted to the euro area but not the other way round ie shocks to euro area confidence do not affect confidence in the US (75) Other studies show a transmission channel for confidence shocks
(72) Some authors eg Ludvigson (2004) Souleles (2004) and Lahiri
Monokroussos and Zhao (2016) conclude that including confidence indicators can reduce forecasting errors when predicting the dynamics of consumption while others reach the opposite conclusion (eg Claveria Pons and Ramos 2007)
Ludvigson S (2004) lsquoConsumer confidence and consumer spendingrsquo Journal of Economic Perspectives Vol 18(2) pp 29-50
Souleles NS (2004) lsquoExpectations heterogenous forecast errors and consumption Micro evidence from the Michigan Consumer Sentiment Surveysrsquo Journal of Money Credit and Banking Vol 36 pp 39-72
Lahiri K G Monokroussos and Y Zhao (2016) lsquoForecasting consumption the role of consumer confidence in real time with many predictorsrsquo Journal of Applied Econometrics forthcoming
Claveria O E Pons and R Ramos (2007) lsquoBusiness and consumer expectations and macroeconomic forecastsrsquo International Journal of Forecasting Vol 23 pp47-69
(73) For example Howrey E (2001) lsquoThe predictive power of the index of consumer sentimentrsquo Brookings Papers on Economic Activity Vol 1 pp 175-216
(74) Fei S (2011) lsquoThe confidence channel for the transmission of shocksrsquo Banque de France Working Paper No 314
(75) Deacutees S and P Soares-Brinca (2013) lsquoConsumer confidence as a predictor of consumption spending Evidence for the United States and the Euro Arearsquo International Economics Vol 134 pp 1-14
-40
-30
-20
-10
0
10
1995Q2 1998Q2 2001Q2 2004Q2 2007Q2 2010Q2 2013Q2-08
-04
00
04
08
12
16Consumption (rhs)Consumer Confidence Indicator
III Confidence spillovers in the euro area
Volume 15 No 2 | 35
(Continued on the next page)
Box III1 A GVAR model to assess confidence spillovers
The Global Vector Autoregressive (GVAR) methodology developed by Pesaran Schuermann and Weiner (2004) (1) combines individual vector error-correcting models where domestic variables are linked to country-specific foreign variables The latter combine the domestic variables using international trade financial or other relevant weights for each country This approach allows the analysis of interdependence across different economies providing a solution to the lsquocurse of dimensionalityrsquo (eg the high number of parameters as the dimension of the model increases) in global modelling
For a set of countries i=0 1 2 hellip N the individual VARX(pi qi) models take the following form
itqtiiqtiiitiiptiiptiiit uxxxxxxii
+Λ++Λ+Λ+Φ++Φ= minusminusminusminus
11
011
where xit is a vector of ki x 1 vector of domestic variables xit a ki x 1 vector of foreign variables and
00
===
iijt
N
jijit xx ωω
where ωij j=01hellipN is a set of weights such that 10
==
N
jijω The foreign variables xit are therefore a
weighted average of domestic variables for all countries included in the model The weights can be different in nature but are typically constructed using trade or capital flows data The GVAR model is then solved for the lsquoworldrsquo (ie all countries included in the model) as a whole considering all variables as endogenous to the system
The GVAR model has been applied to a variety of issues These include forecasting (eg Pesaran Schuermann and Smith 2009) credit risk (eg Pesaran Schuermann and Treutler 2007) oil price shocks (eg Galesi and Lombardi 2009) global imbalances (eg Bussiegravere Chudik and Sestieri 2012) business cycle synchronisation (eg Dreger and Zhang 2013) the impact of EU membership (eg Pesaran Smith and Smith 2007) the international effects of fiscal policy shocks (eg Favero Giavazzi and Perego 2011) (2) Chudik and Pesaran (2014) provide a detailed review of these and other recent applications (3)
In this section this approach is used to analyse the transmission of country-specific and global consumer confidence shocks in a model which includes eight euro area countries (Austria Belgium Finland France Germany Italy the Netherlands and Spain) using quarterly data over the period 1996Q2-2013Q1 The model is solved using the GVAR Toolbox developed by Smith and Galesi (2014) (4)
(1) Pesaran MH Schuermann T and Weiner S M (2004) lsquoModelling regional interdependencies using a global error-correcting
modelrsquo Journal of Business and Economic Statistics Vol 22 pp 129-162 (2) Pesaran M H Schuermann T and Smith LV (2009) lsquoForecasting economic and financial variables with global VARsrsquo
International Journal of Forecasting Vol 25(4) pp 642-675 Pesaran MH Schuermann T and Treutler B-J (2007) lsquoGlobal business cycles and credit riskrsquo in The Risks of Financial Institutions NBER Chapters pp 419-474 Bussiegravere M Chudik A and Sestieri G (2012) lsquoModelling global trade flows results from a GVAR modelrsquo Globalization and Monetary Policy Institute Working Paper 119 Federal Reserve Bank of Dallas Dreger C and Zhang Y (2013) lsquoDoes the economic integration of China affect growth and inflation in industrial countriesrsquo FIW Working Paper series 116 FIW Pesaran M H Smith L V and Smith R P (2007) lsquoWhat if the UK or Sweden had joined the euro in 1999 An empirical evaluation using a Global VARrsquo International Journal of Finance and Economics Vol 12(1) pp 55-87 Favero C Giavazzi F and Perego F (2011) lsquoCountry heterogeneity and the international evidence on the effects of fiscal policyrsquo IMF Economic Review 59(4) 652-682
(3) Chudik A and Pesaran MH (2014) lsquoTheory and Practice of GVAR Modelingrsquo Federal Reserve Bank of Dallas Globalization and Monetary Policy Institute Working Paper No 180
(4) Smith LV and Galesi A (2014) GVAR Toolbox 20 available at httpssitesgooglecomsitegvarmodellinggvar-toolbox
36 | Quarterly Report on the Euro Area
between the US the euro area as a whole and four EU countries taken individually (76)
In addition the role of consumer confidence spillovers in the euro area was assessed in a previous issue of the QREA (77) Consumption and confidence regressions were carried out for a panel of euro area countries over the period 1999-2012 The findings support the existence of confidence spillovers between euro area countries
III4 Confidence spillovers across the euro area
Table III1 shows simple correlations between the confidence indicators of eight euro area countries over the period 1995Q4-2016Q1 (78)The strength of the link between consumer confidence indicators across Member States is variable and in most cases is larger between neighbouring countries and between countries sharing similar macroeconomic environments (79)
Table III1 Consumer Confidence Indicator mdash Correlation Matrix
(1995Q4-2016Q1)
(1) Not statistically significant at conventional levels Source DG ECFIN calculations based on EU Business and Consumer Surveys
(76) Deacutees S and J Guntner (2014) lsquoThe international dimension of
confidence shockrsquo ECB Working Paper No 1669 (77) Op cit DrsquoAuria F (2013) (78) The very low and non-statistically significant correlation of the
Italian confidence indicator with the confidence indicators of a number of other euro area countries is somewhat puzzling and there is a need for further investigation into the reasons behind it
(79) The strong correlation between confidence indicators in countries sharing similar economic conditions can be indicative of larger confidence spillovers between them but can also be a reflection of the strong correlation between their economic fundamentals
The strength of the correlation also varies considerably over time Table III2 displays correlations between consumer confidence indicators in the same euro area countries over the period 2008Q1-2012Q4 During the crisis period the link between consumer confidence indicators is significantly tighter
Table III2 Consumer Confidence Indicator mdash Correlation Matrix
(2008Q1-2012Q4)
(1) Not statistically significant at conventional levels Source DG ECFIN calculations based on EU Business and Consumer Surveys
The presence of a correlation between confidence indicators may point to the existence of confidence spillover effects between countries but also be indicative of strong business cycle synchronisation To shed light on the nature of these correlations this section discusses confidence spillovers in the euro area on the basis of the findings from the estimation of a Global Vector Autoregressive (GVAR) model which includes data for eight euro area countries over the period 1996Q2-2013Q1 Box III1 describes the model in more detail
The model includes observations on consumption GDP the unemployment rate a short-term interest rate and consumer confidence The latter is measured by the BCS Consumer Confidence Indicator which is an arithmetic average of the balances of the answers to questions on the financial situation of households the general economic situation unemployment expectations and savings over the next 12 months It is therefore taken as a proxy for consumersrsquo expectations about their future economic situation
The results seem to support the existence of consumer confidence spillovers across the euro area As an illustration Graph III2 reports impulse
AT BE FI FR IT DE NL ES
AT 100 069 069 074 013(1) 054 043 022BE 069 100 067 088 055 057 068 066FI 069 067 100 068 039 028 075 055FR 074 088 068 100 046 055 066 060IT 013(1) 055 039 046 100 004(1) 063 081DE 054 057 028 055 004(1) 100 033 023NL 043 068 075 066 063 033 100 073ES 022 066 055 060 081 023 073 100
AT BE FI FR IT DE NL ES
AT 100 093 090 088 036(1) 079 086 063BE 093 100 081 080 034(1) 080 081 071FI 090 081 100 083 058 052 081 066FR 088 080 083 100 030(1) 066 074 061IT 036(1) 034(1) 058 030(1) 100 -016(1) 065 038DE 079 080 052 066 -016(1) 100 050 048NL 086 081 081 074 065 05 100 050ES 063 071 066 061 038 048 050 100
Box (continued)
by the European Commission Consumption and GDP enter the model in log differences while the other variables are in levels Some of the results are discussed in the main text
III Confidence spillovers in the euro area
Volume 15 No 2 | 37
response functions of consumer confidence in the euro area countries included in the GVAR model to a positive shock to consumer confidence in Germany over 24 quarters (80)
The largest effect appears to be in smaller neighbouring countries (Austria Belgium and the Netherlands) The response of consumer confidence is also relatively large in Finland France and Spain On the other hand spillovers to consumer confidence in Italy are very small and become negative after six quarters This is not a surprise given the statistically insignificant correlation between German and Italian consumer confidence emerging from the data reported in Table III1 The peak response occurs in the second or third quarter
Similar results although of a smaller magnitude were obtained for the other euro area countries included in the model Confidence spillovers appear to be larger across countries with stronger geographical and trade links Overall the evidence from the estimation of the model supports the existence of a transmission channel for consumer confidence shocks across the euro area However the effects of confidence shocks on foreign consumption are in most cases not statistically significant suggesting that the transmission channel is to foreign confidence rather than
(80) A caveat must be made about the difficulty of identifying truly
exogenous confidence shocks owing to the fact that confidence indicators are largely driven by the same factors which determine consumption
directly to foreign economic activity (81)
These results suggest that confidence shocks play a role in the international business cycle and that there are close interlinkages between confidence indicators across euro area countries This evidence supports the need for coordinated policy action able to boost confidence across euro area countries
III5 Conclusions
In recent years the dynamics of euro area consumer confidence and real private consumption have been very closely related Moreover consumer confidence indicators across the euro area appear to be strongly correlated The strength of the correlation was considerably greater during the crisis period
The evidence of a link between real consumption and consumer confidence is mixed but several studies are supportive of consumer confidence playing a role in determining consumption In addition there is evidence to suggest that shocks to consumer confidence in euro area countries affect confidence in other euro area Member States This is also borne out by results obtained from the estimation of a Global Vector Autoregressive (GVAR) model for eight euro area countries
(81) Similar conclusions are reached by op cit Deacutees and Soares-Brinca
(2013) and Deacutees and Guntner (2014)
38 | Quarterly Report on the Euro Area
Graph III2 Impulse response functions of foreign confidence to a one standard error confidence shock in Germany
Source DG ECFIN
000
005
010
015
020
025
030
035
1 2 3 4 5 6 7 8 9 10 11 12 13 14 15 16 17 18 19 20 21 22 23 24
AT
000
005
010
015
020
025
030
035
040
1 2 3 4 5 6 7 8 9 10 11 12 13 14 15 16 17 18 19 20 21 22 23 24
BE
000
005
010
015
020
025
030
1 2 3 4 5 6 7 8 9 10 11 12 13 14 15 16 17 18 19 20 21 22 23 24
FI
000
005
010
015
020
025
030
1 2 3 4 5 6 7 8 9 10 11 12 13 14 15 16 17 18 19 20 21 22 23 24
FR
-002
-001
000
001
002
003
004
005
006
007
1 2 3 4 5 6 7 8 9 10 11 12 13 14 15 16 17 18 19 20 21 22 23 24
IT
000
005
010
015
020
025
030
035
040
1 2 3 4 5 6 7 8 9 10 11 12 13 14 15 16 17 18 19 20 21 22 23 24
NL
000
005
010
015
020
025
030
035
1 2 3 4 5 6 7 8 9 10 11 12 13 14 15 16 17 18 19 20 21 22 23 24
ES
40 | Quarterly Report on the Euro Area
Editors Jose Eduardo Leandro and Martin Larch
Coordination Plamen Nikolov
Statistical and layout assistance Christos Zavos
Comments on the report would be gratefully received and should be sent to
Jose Eduardo Leandro Director ndash Policy strategy coordination and communication Directorate-General for Economic and Financial Affairs Office CHAR 1566
B-1049 Brussels
Email joseleandroeceuropaeu
or
Martin Larch Head of Unit ndash EMU deepening and macroeconomy of the euro area Directorate-General for Economic and Financial Affairs Office CHAR 1556
B-1049 Brussels
Email martinlarcheceuropaeu
EUROPEAN ECONOMY INSTITUTIONAL SERIES
European Economy Institutional series can be accessed and downloaded free of charge from the following address httpeceuropaeueconomy_financepublicationseeipindex_enhtm Titles published before July 2015 can be accessed and downloaded free of charge from bull httpeceuropaeueconomy_financepublicationseuropean_economyindex_enhtm
(the main reports eg Economic Forecasts) bull httpeceuropaeueconomy_financepublicationsoccasional_paperindex_enhtm
(the Occasional Papers) bull httpeceuropaeueconomy_financepublicationsqr_euro_areaindex_enhtm
(the Quarterly Reports on the Euro Area)
Alternatively hard copies may be ordered via the ldquoPrint-on-demandrdquo service offered by the EU Bookshop httpbookshopeuropaeu
HOW TO OBTAIN EU PUBLICATIONS Free publications bull one copy
via EU Bookshop (httpbookshopeuropaeu) bull more than one copy or postersmaps
- from the European Unionrsquos representations (httpeceuropaeurepresent_enhtm) - from the delegations in non-EU countries (httpeeaseuropaeudelegationsindex_enhtm) - by contacting the Europe Direct service (httpeuropaeueuropedirectindex_enhtm) or calling 00 800 6 7 8 9 10 11 (freephone number from anywhere in the EU) () () The information given is free as are most calls (though some operators phone boxes or hotels may charge you)
Priced publications bull via EU Bookshop (httpbookshopeuropaeu)
ISBN 978-92-79-54335-7
KC-BC-16-030-EN-N
- NEW_IP_index_enpdf
-
- EUROPEAN EconomY institutional SERIES
-

III Confidence spillovers in the euro area
Volume 15 No 2 | 33
III1 Introduction
During the recent crisis euro area private consumption fell substantially This was accompanied by a sharp decline in consumer confidence which many observers have identified as a key factor contributing to the persistence of the slowdown In fact the onset of the crisis coincided with an abrupt unwinding of imbalances that is of economic trends that turned out to be unsustainable and which led to a significant adjustment of expectations Both consumption growth rates and confidence levels have been improving since the start of 2013
There is some (mixed) evidence to suggest that fluctuations in consumer confidence affect the dynamics of private consumption (67) On the basis of this assumption and taking into account the unprecedented extent of the most recent crisis it is important to determine whether and to what extent confidence shocks spill over between countries This is particularly relevant in relation to the euro area where close trade and financial links and common institutional features can lead to the rapid propagation of shocks In addition confidence spillovers can be an important aspect to consider when discussing how to improve macroeconomic policymaking in a common currency area
This section reviews the evidence on the link between consumer confidence and private consumption and on cross-border confidence spillovers and presents some analysis of the transmission of confidence shocks across the euro area It is a follow-up to analysis discussed in
(66) This section was prepared by Francesca DrsquoAuria (67) See for a discussion Ludvigson SC 2004 lsquoConsumer
confidence and consumer spendingrsquo Journal of Economic Perspectives Vol 18(2) pp 29-50
previous issues of the Quarterly Report on the Euro Area (QREA) (68)
III2 Recent trends in consumer confidence and private consumption in the euro area
Graph III1 shows the evolution over the period 1995Q2-2016Q1 of euro area real private consumption and consumer confidence The latter is measured by the Consumer Confidence Indicator constructed by the European Commission as part of the Joint Harmonised EU Programme of Business and Consumer Surveys (BCS) (69)
There is close co-movement between the two variables Both real consumption growth and consumer confidence showed the greatest deterioration in the first quarter of 2009 and during the sovereign debt crisis They have been on a recovery path since early 2013 with consumer confidence reaching levels above the euro area long-term average since the first quarter of 2014
The relationship between consumer confidence and private consumption is much debated in the literature From a theoretical perspective there are two main competing theories One view is that confidence indicators can help predict the dynamics of consumption as they convey information about future economic conditions Another theory is that the link between the two variables can be interpreted in terms of lsquoanimal
(68) DrsquoAuria F lsquoCross-border spillovers in confidencersquo Quarterly
Report on the Euro Area (2013) Vol 12(3) pp26-30 DrsquoAuria F S Linden D Monteiro J in lsquot Veld and S Zeugner
lsquoCross-border spillovers in the euro arearsquo Quarterly Report on the Euro Area (2014) Vol 13(4) pp7-22
(69) See European Commission (2016) lsquoA user guide to the Joint Harmonised EU Programme of Business and Consumer Surveysrsquo for details on the construction of the indicators
In recent years there has been close co-movement between consumer confidence and private consumption in the euro area During the crisis in particular consumer confidence was identified by many commentators as a driving factor in its persistence as expectations about a sustainable path of economic growth were adjusted significantly In view of the unprecedented extent of the crisis the question of whether and to what extent changes in consumer confidence in one country could spill over to other countries was also raised This section discusses the relationship between consumer confidence and consumption and reviews the evidence of consumer confidence spillovers between euro area countries We conclude that there is some evidence to suggest that confidence shocks are transmitted between countries This conclusion is corroborated by results from the estimation of a Global Vector Autoregressive (GVAR) model for a number of euro area countries (66)
34 | Quarterly Report on the Euro Area
spiritsrsquo as confidence indicators capture fluctuations in beliefs which in turn affect consumption (70) In both cases the essence of confidence indicators is to gauge expectations ndash irrespective of how they are formed ndash about the future course of the economy which then have a knock-on effect on current consumer behaviour
Graph III1 Confidence and private consumption euro area
(1995Q2-2016Q1 q-o-q change)
Source Eurostat and DG ECFIN calculations based on EU Business and Consumer Surveys
Several studies test empirically the link between consumer confidence and private consumption A number of them find evidence in support of a strong correlation between consumer confidence and consumption (71)
However as confidence and consumption are to a large extent determined by the same factors other studies try to assess whether confidence indicators carry information beyond economic fundamentals The evidence on this issue is mixed although several studies conclude that confidence indicators play a significant role There is some evidence to suggest that while part of the information conveyed by confidence indicators is also captured by other variables (eg past consumption income and interest rates) confidence measures have an additional predictive power for the future path of
(70) See Barsky and Sims (2012) for a discussion of the different
theoretical approaches to the role of confidence Barsky R B and ER Sims (2012) lsquoInformation animal spirits and the meaning of innovations in consumer confidencersquo American Economic Review 102(4) pp 1343-1377
(71) See for example Carroll C J Fuhrer and D Wilcox (1994) lsquoDoes consumer sentiment forecast household spending If so whyrsquo American Economic Review Vol 84 pp 1397-1408
consumer spending (72) Moreover some papers find that confidence indicators have a stronger predictive power during periods of large economic fluctuations (73)
III3 The existing evidence on confidence spillovers
On the assumption that a causal relationship between consumer confidence and private consumption exists it is important to determine whether and to what extent changes in consumer confidence in one country affect confidence (and thus consumption) in others
There is some evidence to support the existence of confidence spillovers This pertains both to confidence shocks originating in the US and being transmitted to the euro area and shocks which occur in one euro area country and spill over to other euro area countries
Several studies provide evidence of a transmission channel of confidence shock to foreign confidence In particular evidence for G7 countries and Spain would suggest that variations in confidence generally spill over from large countries to smaller ones (74) Some studies support the idea that confidence shocks originating in US are transmitted to the euro area but not the other way round ie shocks to euro area confidence do not affect confidence in the US (75) Other studies show a transmission channel for confidence shocks
(72) Some authors eg Ludvigson (2004) Souleles (2004) and Lahiri
Monokroussos and Zhao (2016) conclude that including confidence indicators can reduce forecasting errors when predicting the dynamics of consumption while others reach the opposite conclusion (eg Claveria Pons and Ramos 2007)
Ludvigson S (2004) lsquoConsumer confidence and consumer spendingrsquo Journal of Economic Perspectives Vol 18(2) pp 29-50
Souleles NS (2004) lsquoExpectations heterogenous forecast errors and consumption Micro evidence from the Michigan Consumer Sentiment Surveysrsquo Journal of Money Credit and Banking Vol 36 pp 39-72
Lahiri K G Monokroussos and Y Zhao (2016) lsquoForecasting consumption the role of consumer confidence in real time with many predictorsrsquo Journal of Applied Econometrics forthcoming
Claveria O E Pons and R Ramos (2007) lsquoBusiness and consumer expectations and macroeconomic forecastsrsquo International Journal of Forecasting Vol 23 pp47-69
(73) For example Howrey E (2001) lsquoThe predictive power of the index of consumer sentimentrsquo Brookings Papers on Economic Activity Vol 1 pp 175-216
(74) Fei S (2011) lsquoThe confidence channel for the transmission of shocksrsquo Banque de France Working Paper No 314
(75) Deacutees S and P Soares-Brinca (2013) lsquoConsumer confidence as a predictor of consumption spending Evidence for the United States and the Euro Arearsquo International Economics Vol 134 pp 1-14
-40
-30
-20
-10
0
10
1995Q2 1998Q2 2001Q2 2004Q2 2007Q2 2010Q2 2013Q2-08
-04
00
04
08
12
16Consumption (rhs)Consumer Confidence Indicator
III Confidence spillovers in the euro area
Volume 15 No 2 | 35
(Continued on the next page)
Box III1 A GVAR model to assess confidence spillovers
The Global Vector Autoregressive (GVAR) methodology developed by Pesaran Schuermann and Weiner (2004) (1) combines individual vector error-correcting models where domestic variables are linked to country-specific foreign variables The latter combine the domestic variables using international trade financial or other relevant weights for each country This approach allows the analysis of interdependence across different economies providing a solution to the lsquocurse of dimensionalityrsquo (eg the high number of parameters as the dimension of the model increases) in global modelling
For a set of countries i=0 1 2 hellip N the individual VARX(pi qi) models take the following form
itqtiiqtiiitiiptiiptiiit uxxxxxxii
+Λ++Λ+Λ+Φ++Φ= minusminusminusminus
11
011
where xit is a vector of ki x 1 vector of domestic variables xit a ki x 1 vector of foreign variables and
00
===
iijt
N
jijit xx ωω
where ωij j=01hellipN is a set of weights such that 10
==
N
jijω The foreign variables xit are therefore a
weighted average of domestic variables for all countries included in the model The weights can be different in nature but are typically constructed using trade or capital flows data The GVAR model is then solved for the lsquoworldrsquo (ie all countries included in the model) as a whole considering all variables as endogenous to the system
The GVAR model has been applied to a variety of issues These include forecasting (eg Pesaran Schuermann and Smith 2009) credit risk (eg Pesaran Schuermann and Treutler 2007) oil price shocks (eg Galesi and Lombardi 2009) global imbalances (eg Bussiegravere Chudik and Sestieri 2012) business cycle synchronisation (eg Dreger and Zhang 2013) the impact of EU membership (eg Pesaran Smith and Smith 2007) the international effects of fiscal policy shocks (eg Favero Giavazzi and Perego 2011) (2) Chudik and Pesaran (2014) provide a detailed review of these and other recent applications (3)
In this section this approach is used to analyse the transmission of country-specific and global consumer confidence shocks in a model which includes eight euro area countries (Austria Belgium Finland France Germany Italy the Netherlands and Spain) using quarterly data over the period 1996Q2-2013Q1 The model is solved using the GVAR Toolbox developed by Smith and Galesi (2014) (4)
(1) Pesaran MH Schuermann T and Weiner S M (2004) lsquoModelling regional interdependencies using a global error-correcting
modelrsquo Journal of Business and Economic Statistics Vol 22 pp 129-162 (2) Pesaran M H Schuermann T and Smith LV (2009) lsquoForecasting economic and financial variables with global VARsrsquo
International Journal of Forecasting Vol 25(4) pp 642-675 Pesaran MH Schuermann T and Treutler B-J (2007) lsquoGlobal business cycles and credit riskrsquo in The Risks of Financial Institutions NBER Chapters pp 419-474 Bussiegravere M Chudik A and Sestieri G (2012) lsquoModelling global trade flows results from a GVAR modelrsquo Globalization and Monetary Policy Institute Working Paper 119 Federal Reserve Bank of Dallas Dreger C and Zhang Y (2013) lsquoDoes the economic integration of China affect growth and inflation in industrial countriesrsquo FIW Working Paper series 116 FIW Pesaran M H Smith L V and Smith R P (2007) lsquoWhat if the UK or Sweden had joined the euro in 1999 An empirical evaluation using a Global VARrsquo International Journal of Finance and Economics Vol 12(1) pp 55-87 Favero C Giavazzi F and Perego F (2011) lsquoCountry heterogeneity and the international evidence on the effects of fiscal policyrsquo IMF Economic Review 59(4) 652-682
(3) Chudik A and Pesaran MH (2014) lsquoTheory and Practice of GVAR Modelingrsquo Federal Reserve Bank of Dallas Globalization and Monetary Policy Institute Working Paper No 180
(4) Smith LV and Galesi A (2014) GVAR Toolbox 20 available at httpssitesgooglecomsitegvarmodellinggvar-toolbox
36 | Quarterly Report on the Euro Area
between the US the euro area as a whole and four EU countries taken individually (76)
In addition the role of consumer confidence spillovers in the euro area was assessed in a previous issue of the QREA (77) Consumption and confidence regressions were carried out for a panel of euro area countries over the period 1999-2012 The findings support the existence of confidence spillovers between euro area countries
III4 Confidence spillovers across the euro area
Table III1 shows simple correlations between the confidence indicators of eight euro area countries over the period 1995Q4-2016Q1 (78)The strength of the link between consumer confidence indicators across Member States is variable and in most cases is larger between neighbouring countries and between countries sharing similar macroeconomic environments (79)
Table III1 Consumer Confidence Indicator mdash Correlation Matrix
(1995Q4-2016Q1)
(1) Not statistically significant at conventional levels Source DG ECFIN calculations based on EU Business and Consumer Surveys
(76) Deacutees S and J Guntner (2014) lsquoThe international dimension of
confidence shockrsquo ECB Working Paper No 1669 (77) Op cit DrsquoAuria F (2013) (78) The very low and non-statistically significant correlation of the
Italian confidence indicator with the confidence indicators of a number of other euro area countries is somewhat puzzling and there is a need for further investigation into the reasons behind it
(79) The strong correlation between confidence indicators in countries sharing similar economic conditions can be indicative of larger confidence spillovers between them but can also be a reflection of the strong correlation between their economic fundamentals
The strength of the correlation also varies considerably over time Table III2 displays correlations between consumer confidence indicators in the same euro area countries over the period 2008Q1-2012Q4 During the crisis period the link between consumer confidence indicators is significantly tighter
Table III2 Consumer Confidence Indicator mdash Correlation Matrix
(2008Q1-2012Q4)
(1) Not statistically significant at conventional levels Source DG ECFIN calculations based on EU Business and Consumer Surveys
The presence of a correlation between confidence indicators may point to the existence of confidence spillover effects between countries but also be indicative of strong business cycle synchronisation To shed light on the nature of these correlations this section discusses confidence spillovers in the euro area on the basis of the findings from the estimation of a Global Vector Autoregressive (GVAR) model which includes data for eight euro area countries over the period 1996Q2-2013Q1 Box III1 describes the model in more detail
The model includes observations on consumption GDP the unemployment rate a short-term interest rate and consumer confidence The latter is measured by the BCS Consumer Confidence Indicator which is an arithmetic average of the balances of the answers to questions on the financial situation of households the general economic situation unemployment expectations and savings over the next 12 months It is therefore taken as a proxy for consumersrsquo expectations about their future economic situation
The results seem to support the existence of consumer confidence spillovers across the euro area As an illustration Graph III2 reports impulse
AT BE FI FR IT DE NL ES
AT 100 069 069 074 013(1) 054 043 022BE 069 100 067 088 055 057 068 066FI 069 067 100 068 039 028 075 055FR 074 088 068 100 046 055 066 060IT 013(1) 055 039 046 100 004(1) 063 081DE 054 057 028 055 004(1) 100 033 023NL 043 068 075 066 063 033 100 073ES 022 066 055 060 081 023 073 100
AT BE FI FR IT DE NL ES
AT 100 093 090 088 036(1) 079 086 063BE 093 100 081 080 034(1) 080 081 071FI 090 081 100 083 058 052 081 066FR 088 080 083 100 030(1) 066 074 061IT 036(1) 034(1) 058 030(1) 100 -016(1) 065 038DE 079 080 052 066 -016(1) 100 050 048NL 086 081 081 074 065 05 100 050ES 063 071 066 061 038 048 050 100
Box (continued)
by the European Commission Consumption and GDP enter the model in log differences while the other variables are in levels Some of the results are discussed in the main text
III Confidence spillovers in the euro area
Volume 15 No 2 | 37
response functions of consumer confidence in the euro area countries included in the GVAR model to a positive shock to consumer confidence in Germany over 24 quarters (80)
The largest effect appears to be in smaller neighbouring countries (Austria Belgium and the Netherlands) The response of consumer confidence is also relatively large in Finland France and Spain On the other hand spillovers to consumer confidence in Italy are very small and become negative after six quarters This is not a surprise given the statistically insignificant correlation between German and Italian consumer confidence emerging from the data reported in Table III1 The peak response occurs in the second or third quarter
Similar results although of a smaller magnitude were obtained for the other euro area countries included in the model Confidence spillovers appear to be larger across countries with stronger geographical and trade links Overall the evidence from the estimation of the model supports the existence of a transmission channel for consumer confidence shocks across the euro area However the effects of confidence shocks on foreign consumption are in most cases not statistically significant suggesting that the transmission channel is to foreign confidence rather than
(80) A caveat must be made about the difficulty of identifying truly
exogenous confidence shocks owing to the fact that confidence indicators are largely driven by the same factors which determine consumption
directly to foreign economic activity (81)
These results suggest that confidence shocks play a role in the international business cycle and that there are close interlinkages between confidence indicators across euro area countries This evidence supports the need for coordinated policy action able to boost confidence across euro area countries
III5 Conclusions
In recent years the dynamics of euro area consumer confidence and real private consumption have been very closely related Moreover consumer confidence indicators across the euro area appear to be strongly correlated The strength of the correlation was considerably greater during the crisis period
The evidence of a link between real consumption and consumer confidence is mixed but several studies are supportive of consumer confidence playing a role in determining consumption In addition there is evidence to suggest that shocks to consumer confidence in euro area countries affect confidence in other euro area Member States This is also borne out by results obtained from the estimation of a Global Vector Autoregressive (GVAR) model for eight euro area countries
(81) Similar conclusions are reached by op cit Deacutees and Soares-Brinca
(2013) and Deacutees and Guntner (2014)
38 | Quarterly Report on the Euro Area
Graph III2 Impulse response functions of foreign confidence to a one standard error confidence shock in Germany
Source DG ECFIN
000
005
010
015
020
025
030
035
1 2 3 4 5 6 7 8 9 10 11 12 13 14 15 16 17 18 19 20 21 22 23 24
AT
000
005
010
015
020
025
030
035
040
1 2 3 4 5 6 7 8 9 10 11 12 13 14 15 16 17 18 19 20 21 22 23 24
BE
000
005
010
015
020
025
030
1 2 3 4 5 6 7 8 9 10 11 12 13 14 15 16 17 18 19 20 21 22 23 24
FI
000
005
010
015
020
025
030
1 2 3 4 5 6 7 8 9 10 11 12 13 14 15 16 17 18 19 20 21 22 23 24
FR
-002
-001
000
001
002
003
004
005
006
007
1 2 3 4 5 6 7 8 9 10 11 12 13 14 15 16 17 18 19 20 21 22 23 24
IT
000
005
010
015
020
025
030
035
040
1 2 3 4 5 6 7 8 9 10 11 12 13 14 15 16 17 18 19 20 21 22 23 24
NL
000
005
010
015
020
025
030
035
1 2 3 4 5 6 7 8 9 10 11 12 13 14 15 16 17 18 19 20 21 22 23 24
ES
40 | Quarterly Report on the Euro Area
Editors Jose Eduardo Leandro and Martin Larch
Coordination Plamen Nikolov
Statistical and layout assistance Christos Zavos
Comments on the report would be gratefully received and should be sent to
Jose Eduardo Leandro Director ndash Policy strategy coordination and communication Directorate-General for Economic and Financial Affairs Office CHAR 1566
B-1049 Brussels
Email joseleandroeceuropaeu
or
Martin Larch Head of Unit ndash EMU deepening and macroeconomy of the euro area Directorate-General for Economic and Financial Affairs Office CHAR 1556
B-1049 Brussels
Email martinlarcheceuropaeu
EUROPEAN ECONOMY INSTITUTIONAL SERIES
European Economy Institutional series can be accessed and downloaded free of charge from the following address httpeceuropaeueconomy_financepublicationseeipindex_enhtm Titles published before July 2015 can be accessed and downloaded free of charge from bull httpeceuropaeueconomy_financepublicationseuropean_economyindex_enhtm
(the main reports eg Economic Forecasts) bull httpeceuropaeueconomy_financepublicationsoccasional_paperindex_enhtm
(the Occasional Papers) bull httpeceuropaeueconomy_financepublicationsqr_euro_areaindex_enhtm
(the Quarterly Reports on the Euro Area)
Alternatively hard copies may be ordered via the ldquoPrint-on-demandrdquo service offered by the EU Bookshop httpbookshopeuropaeu
HOW TO OBTAIN EU PUBLICATIONS Free publications bull one copy
via EU Bookshop (httpbookshopeuropaeu) bull more than one copy or postersmaps
- from the European Unionrsquos representations (httpeceuropaeurepresent_enhtm) - from the delegations in non-EU countries (httpeeaseuropaeudelegationsindex_enhtm) - by contacting the Europe Direct service (httpeuropaeueuropedirectindex_enhtm) or calling 00 800 6 7 8 9 10 11 (freephone number from anywhere in the EU) () () The information given is free as are most calls (though some operators phone boxes or hotels may charge you)
Priced publications bull via EU Bookshop (httpbookshopeuropaeu)
ISBN 978-92-79-54335-7
KC-BC-16-030-EN-N
- NEW_IP_index_enpdf
-
- EUROPEAN EconomY institutional SERIES
-

III Confidence spillovers in the euro area
Volume 15 No 2 | 35
(Continued on the next page)
Box III1 A GVAR model to assess confidence spillovers
The Global Vector Autoregressive (GVAR) methodology developed by Pesaran Schuermann and Weiner (2004) (1) combines individual vector error-correcting models where domestic variables are linked to country-specific foreign variables The latter combine the domestic variables using international trade financial or other relevant weights for each country This approach allows the analysis of interdependence across different economies providing a solution to the lsquocurse of dimensionalityrsquo (eg the high number of parameters as the dimension of the model increases) in global modelling
For a set of countries i=0 1 2 hellip N the individual VARX(pi qi) models take the following form
itqtiiqtiiitiiptiiptiiit uxxxxxxii
+Λ++Λ+Λ+Φ++Φ= minusminusminusminus
11
011
where xit is a vector of ki x 1 vector of domestic variables xit a ki x 1 vector of foreign variables and
00
===
iijt
N
jijit xx ωω
where ωij j=01hellipN is a set of weights such that 10
==
N
jijω The foreign variables xit are therefore a
weighted average of domestic variables for all countries included in the model The weights can be different in nature but are typically constructed using trade or capital flows data The GVAR model is then solved for the lsquoworldrsquo (ie all countries included in the model) as a whole considering all variables as endogenous to the system
The GVAR model has been applied to a variety of issues These include forecasting (eg Pesaran Schuermann and Smith 2009) credit risk (eg Pesaran Schuermann and Treutler 2007) oil price shocks (eg Galesi and Lombardi 2009) global imbalances (eg Bussiegravere Chudik and Sestieri 2012) business cycle synchronisation (eg Dreger and Zhang 2013) the impact of EU membership (eg Pesaran Smith and Smith 2007) the international effects of fiscal policy shocks (eg Favero Giavazzi and Perego 2011) (2) Chudik and Pesaran (2014) provide a detailed review of these and other recent applications (3)
In this section this approach is used to analyse the transmission of country-specific and global consumer confidence shocks in a model which includes eight euro area countries (Austria Belgium Finland France Germany Italy the Netherlands and Spain) using quarterly data over the period 1996Q2-2013Q1 The model is solved using the GVAR Toolbox developed by Smith and Galesi (2014) (4)
(1) Pesaran MH Schuermann T and Weiner S M (2004) lsquoModelling regional interdependencies using a global error-correcting
modelrsquo Journal of Business and Economic Statistics Vol 22 pp 129-162 (2) Pesaran M H Schuermann T and Smith LV (2009) lsquoForecasting economic and financial variables with global VARsrsquo
International Journal of Forecasting Vol 25(4) pp 642-675 Pesaran MH Schuermann T and Treutler B-J (2007) lsquoGlobal business cycles and credit riskrsquo in The Risks of Financial Institutions NBER Chapters pp 419-474 Bussiegravere M Chudik A and Sestieri G (2012) lsquoModelling global trade flows results from a GVAR modelrsquo Globalization and Monetary Policy Institute Working Paper 119 Federal Reserve Bank of Dallas Dreger C and Zhang Y (2013) lsquoDoes the economic integration of China affect growth and inflation in industrial countriesrsquo FIW Working Paper series 116 FIW Pesaran M H Smith L V and Smith R P (2007) lsquoWhat if the UK or Sweden had joined the euro in 1999 An empirical evaluation using a Global VARrsquo International Journal of Finance and Economics Vol 12(1) pp 55-87 Favero C Giavazzi F and Perego F (2011) lsquoCountry heterogeneity and the international evidence on the effects of fiscal policyrsquo IMF Economic Review 59(4) 652-682
(3) Chudik A and Pesaran MH (2014) lsquoTheory and Practice of GVAR Modelingrsquo Federal Reserve Bank of Dallas Globalization and Monetary Policy Institute Working Paper No 180
(4) Smith LV and Galesi A (2014) GVAR Toolbox 20 available at httpssitesgooglecomsitegvarmodellinggvar-toolbox
36 | Quarterly Report on the Euro Area
between the US the euro area as a whole and four EU countries taken individually (76)
In addition the role of consumer confidence spillovers in the euro area was assessed in a previous issue of the QREA (77) Consumption and confidence regressions were carried out for a panel of euro area countries over the period 1999-2012 The findings support the existence of confidence spillovers between euro area countries
III4 Confidence spillovers across the euro area
Table III1 shows simple correlations between the confidence indicators of eight euro area countries over the period 1995Q4-2016Q1 (78)The strength of the link between consumer confidence indicators across Member States is variable and in most cases is larger between neighbouring countries and between countries sharing similar macroeconomic environments (79)
Table III1 Consumer Confidence Indicator mdash Correlation Matrix
(1995Q4-2016Q1)
(1) Not statistically significant at conventional levels Source DG ECFIN calculations based on EU Business and Consumer Surveys
(76) Deacutees S and J Guntner (2014) lsquoThe international dimension of
confidence shockrsquo ECB Working Paper No 1669 (77) Op cit DrsquoAuria F (2013) (78) The very low and non-statistically significant correlation of the
Italian confidence indicator with the confidence indicators of a number of other euro area countries is somewhat puzzling and there is a need for further investigation into the reasons behind it
(79) The strong correlation between confidence indicators in countries sharing similar economic conditions can be indicative of larger confidence spillovers between them but can also be a reflection of the strong correlation between their economic fundamentals
The strength of the correlation also varies considerably over time Table III2 displays correlations between consumer confidence indicators in the same euro area countries over the period 2008Q1-2012Q4 During the crisis period the link between consumer confidence indicators is significantly tighter
Table III2 Consumer Confidence Indicator mdash Correlation Matrix
(2008Q1-2012Q4)
(1) Not statistically significant at conventional levels Source DG ECFIN calculations based on EU Business and Consumer Surveys
The presence of a correlation between confidence indicators may point to the existence of confidence spillover effects between countries but also be indicative of strong business cycle synchronisation To shed light on the nature of these correlations this section discusses confidence spillovers in the euro area on the basis of the findings from the estimation of a Global Vector Autoregressive (GVAR) model which includes data for eight euro area countries over the period 1996Q2-2013Q1 Box III1 describes the model in more detail
The model includes observations on consumption GDP the unemployment rate a short-term interest rate and consumer confidence The latter is measured by the BCS Consumer Confidence Indicator which is an arithmetic average of the balances of the answers to questions on the financial situation of households the general economic situation unemployment expectations and savings over the next 12 months It is therefore taken as a proxy for consumersrsquo expectations about their future economic situation
The results seem to support the existence of consumer confidence spillovers across the euro area As an illustration Graph III2 reports impulse
AT BE FI FR IT DE NL ES
AT 100 069 069 074 013(1) 054 043 022BE 069 100 067 088 055 057 068 066FI 069 067 100 068 039 028 075 055FR 074 088 068 100 046 055 066 060IT 013(1) 055 039 046 100 004(1) 063 081DE 054 057 028 055 004(1) 100 033 023NL 043 068 075 066 063 033 100 073ES 022 066 055 060 081 023 073 100
AT BE FI FR IT DE NL ES
AT 100 093 090 088 036(1) 079 086 063BE 093 100 081 080 034(1) 080 081 071FI 090 081 100 083 058 052 081 066FR 088 080 083 100 030(1) 066 074 061IT 036(1) 034(1) 058 030(1) 100 -016(1) 065 038DE 079 080 052 066 -016(1) 100 050 048NL 086 081 081 074 065 05 100 050ES 063 071 066 061 038 048 050 100
Box (continued)
by the European Commission Consumption and GDP enter the model in log differences while the other variables are in levels Some of the results are discussed in the main text
III Confidence spillovers in the euro area
Volume 15 No 2 | 37
response functions of consumer confidence in the euro area countries included in the GVAR model to a positive shock to consumer confidence in Germany over 24 quarters (80)
The largest effect appears to be in smaller neighbouring countries (Austria Belgium and the Netherlands) The response of consumer confidence is also relatively large in Finland France and Spain On the other hand spillovers to consumer confidence in Italy are very small and become negative after six quarters This is not a surprise given the statistically insignificant correlation between German and Italian consumer confidence emerging from the data reported in Table III1 The peak response occurs in the second or third quarter
Similar results although of a smaller magnitude were obtained for the other euro area countries included in the model Confidence spillovers appear to be larger across countries with stronger geographical and trade links Overall the evidence from the estimation of the model supports the existence of a transmission channel for consumer confidence shocks across the euro area However the effects of confidence shocks on foreign consumption are in most cases not statistically significant suggesting that the transmission channel is to foreign confidence rather than
(80) A caveat must be made about the difficulty of identifying truly
exogenous confidence shocks owing to the fact that confidence indicators are largely driven by the same factors which determine consumption
directly to foreign economic activity (81)
These results suggest that confidence shocks play a role in the international business cycle and that there are close interlinkages between confidence indicators across euro area countries This evidence supports the need for coordinated policy action able to boost confidence across euro area countries
III5 Conclusions
In recent years the dynamics of euro area consumer confidence and real private consumption have been very closely related Moreover consumer confidence indicators across the euro area appear to be strongly correlated The strength of the correlation was considerably greater during the crisis period
The evidence of a link between real consumption and consumer confidence is mixed but several studies are supportive of consumer confidence playing a role in determining consumption In addition there is evidence to suggest that shocks to consumer confidence in euro area countries affect confidence in other euro area Member States This is also borne out by results obtained from the estimation of a Global Vector Autoregressive (GVAR) model for eight euro area countries
(81) Similar conclusions are reached by op cit Deacutees and Soares-Brinca
(2013) and Deacutees and Guntner (2014)
38 | Quarterly Report on the Euro Area
Graph III2 Impulse response functions of foreign confidence to a one standard error confidence shock in Germany
Source DG ECFIN
000
005
010
015
020
025
030
035
1 2 3 4 5 6 7 8 9 10 11 12 13 14 15 16 17 18 19 20 21 22 23 24
AT
000
005
010
015
020
025
030
035
040
1 2 3 4 5 6 7 8 9 10 11 12 13 14 15 16 17 18 19 20 21 22 23 24
BE
000
005
010
015
020
025
030
1 2 3 4 5 6 7 8 9 10 11 12 13 14 15 16 17 18 19 20 21 22 23 24
FI
000
005
010
015
020
025
030
1 2 3 4 5 6 7 8 9 10 11 12 13 14 15 16 17 18 19 20 21 22 23 24
FR
-002
-001
000
001
002
003
004
005
006
007
1 2 3 4 5 6 7 8 9 10 11 12 13 14 15 16 17 18 19 20 21 22 23 24
IT
000
005
010
015
020
025
030
035
040
1 2 3 4 5 6 7 8 9 10 11 12 13 14 15 16 17 18 19 20 21 22 23 24
NL
000
005
010
015
020
025
030
035
1 2 3 4 5 6 7 8 9 10 11 12 13 14 15 16 17 18 19 20 21 22 23 24
ES
40 | Quarterly Report on the Euro Area
Editors Jose Eduardo Leandro and Martin Larch
Coordination Plamen Nikolov
Statistical and layout assistance Christos Zavos
Comments on the report would be gratefully received and should be sent to
Jose Eduardo Leandro Director ndash Policy strategy coordination and communication Directorate-General for Economic and Financial Affairs Office CHAR 1566
B-1049 Brussels
Email joseleandroeceuropaeu
or
Martin Larch Head of Unit ndash EMU deepening and macroeconomy of the euro area Directorate-General for Economic and Financial Affairs Office CHAR 1556
B-1049 Brussels
Email martinlarcheceuropaeu
EUROPEAN ECONOMY INSTITUTIONAL SERIES
European Economy Institutional series can be accessed and downloaded free of charge from the following address httpeceuropaeueconomy_financepublicationseeipindex_enhtm Titles published before July 2015 can be accessed and downloaded free of charge from bull httpeceuropaeueconomy_financepublicationseuropean_economyindex_enhtm
(the main reports eg Economic Forecasts) bull httpeceuropaeueconomy_financepublicationsoccasional_paperindex_enhtm
(the Occasional Papers) bull httpeceuropaeueconomy_financepublicationsqr_euro_areaindex_enhtm
(the Quarterly Reports on the Euro Area)
Alternatively hard copies may be ordered via the ldquoPrint-on-demandrdquo service offered by the EU Bookshop httpbookshopeuropaeu
HOW TO OBTAIN EU PUBLICATIONS Free publications bull one copy
via EU Bookshop (httpbookshopeuropaeu) bull more than one copy or postersmaps
- from the European Unionrsquos representations (httpeceuropaeurepresent_enhtm) - from the delegations in non-EU countries (httpeeaseuropaeudelegationsindex_enhtm) - by contacting the Europe Direct service (httpeuropaeueuropedirectindex_enhtm) or calling 00 800 6 7 8 9 10 11 (freephone number from anywhere in the EU) () () The information given is free as are most calls (though some operators phone boxes or hotels may charge you)
Priced publications bull via EU Bookshop (httpbookshopeuropaeu)
ISBN 978-92-79-54335-7
KC-BC-16-030-EN-N
- NEW_IP_index_enpdf
-
- EUROPEAN EconomY institutional SERIES
-

ISBN 978-92-79-54335-7
KC-BC-16-030-EN-N
- NEW_IP_index_enpdf
-
- EUROPEAN EconomY institutional SERIES
-