the common monetary area in southern africa: shocks, … · the common monetary area in southern...
TRANSCRIPT
WP/07/158
The Common Monetary Area in Southern Africa: Shocks, Adjustment, and Policy
Challenges
Jian-Ye Wang, Iyabo Masha, Kazuko Shirono, and Leighton Harris


© 2007 International Monetary Fund WP/07/158 IMF Working Paper African Department
The Common Monetary Area in Southern Africa: Shocks, Adjustment, and Policy Challenges
Prepared by Jian-Ye Wang, with Iyabo Masha, Kazuko Shirono, and Leighton Harris
Authorized for distribution by Benedicte Vibe Christensen
July 2007
Abstract
This study assesses the experience of the Common Monetary Area (CMA) based on available empirical evidence over the last two decades. It pays particular attention to member countries’ adjustment to economic shocks in recent years and the inter-country linkages, including the spillover effects of policies. The paper draws the main lessons from the CMA experience, identifies key policy challenges, and discusses the issues facing the member countries in their efforts to achieve sustained growth. Implications for further economic integration in a broader regional context are also noted.
This Working Paper should not be reported as representing the views of the IMF. The views expressed in this Working Paper are those of the author(s) and do not necessarily represent those of the IMF or IMF policy. Working Papers describe research in progress by the author(s) and are published to elicit comments and to further debate.
JEL Classification Numbers: E42, F33, F36 Keywords: Exchange Rate, Monetary Union, Shocks, Policy Adjustment Author’s E-Mail Address: [email protected], [email protected], [email protected],
2
Contents Pages
Abbreviations and Acronyms ....................................................................................................4
I. Introduction ............................................................................................................................5
II. Historical Background and Institutional Setting ...................................................................7 The History of the Current CMA Arrangement.............................................................7 Institutional Framework.................................................................................................8 Comparison with Other Monetary Unions...................................................................11
III. Long-Term Trends, Integration, and Convergence............................................................13 GDP Growth and Per Capita Income...........................................................................13 Inflation and Intra-regional Trade................................................................................16 Interest Rates and the Financial Sector........................................................................21 Wages and the Labor Market.......................................................................................25 Tax and Regulatory Regime ........................................................................................28
IV. Shocks and Adjustment .....................................................................................................29 Are Shocks Asymmetric? ............................................................................................29 The Role of SACU Revenue........................................................................................30 Policy Adjustment in South Africa ..............................................................................33 Policy Adjustment in Small CMA Countries...............................................................34
V. Key Policy Challenges and Issues ......................................................................................38 Do the LNS Countries Benefit from the CMA? ..........................................................38 Other Lessons of the CMA Experience .......................................................................38 Key Policy Challenges.................................................................................................39 Issues Facing the CMA Countries ...............................................................................41
VI. Conclusion .........................................................................................................................44 Appendices I. Regional Comparison of Economic Performance....................................................... 52 II. Principal Component Analysis of Price Convergence in the CMA............................ 54 III. CMA Countries: Comparative Tax Rates and Incentives............................................58 IV. The Southern African Customs Union: Revenue Distribution.................................... 61 Tables 1.1. CMA Countries: Selected Economic and Social Indicators, 2004-05...........................6 2.1. Main Features of Selected Monetary Unions...............................................................13 3.1. CMA Countries: Foreign Trade Indicators, 2003........................................................ 15 3.2. CMA Countries: CPI Weights..................................................................................... 16 3.3. Banking Sector Structure in the CMA......................................................................... 24 3.4. CMA Countries: Selected Banking Sector Indicators, 2004–05................................. 25
3
3.5. Monthly Minimum Wages in the Manufacturing Sector, 1990–2003......................... 28 4.1. CMA Countries: Terms of Trade Correlations, 1980–2005........................................ 30 Figures 3.1. CMA: Average Real GDP Growth Rate, 1980–2005.................................................. 14 3.2. CMA: Real GDP Per Capita........................................................................................ 15 3.3. Per Capita Income Relative to South Africa................................................................ 16 3.4. CMA: Consumer Price Indexes, 1980–2005............................................................... 16 3.5. CMA: Average Inflation and Exchange Rate Volatility, 1996-2005.......................... 18 3.6. CMA: Exchange Rate Developments, 1980–2005...................................................... 19 3.7. CMA Countries: Interest Rates, 1990–2005................................................................ 21 3.8. Commercial Bank Prime Lending Rates, 1996–2005..................................................22 3.9. Small CMA Countries: Number of Migrants (Net), 1950–2005................................. 26 3.10. Lesotho: Migrant Workers in South African Mines, 1990–2004................................ 27 3.11. Lesotho and Swaziland: Remittances, 1990–2004...................................................... 27 4.1. CMA: Terms of Trade, 1995–2005............................................................................. 29 4.2. Commodity Prices, 1995–2005............................................................................ 29 4.3. CMA Small Countries: SACU Revenue, 1995–2004.................................................. 32 4.4. Small CMA Countries: Selected Economic Indicators, 2001/02–2005/06................. 35 4.5. CMA Countries: Selected Fiscal Indicators, 2003/04–2004/05.................................. 36 4.6. Swaziland and Namibia: Central Bank Net Domestic Assets and
Foreign Reserves, 2001–05.......................................................................................... 37 Boxes 1. CMA and SACU: Major Events in History...................................................................9 2. Short-Term Adjustment and Long-Term Convergence of Consumer Prices in CMA
Countries...................................................................................................................... 20 3. Monetary Convergence Among CMA Member Countries.......................................... 23 4. Are Shocks to Real Output in CMA Symmetric.......................................................... 31 5. Reserve Adequacy Under the CMA Arrangement.......................................................40
4
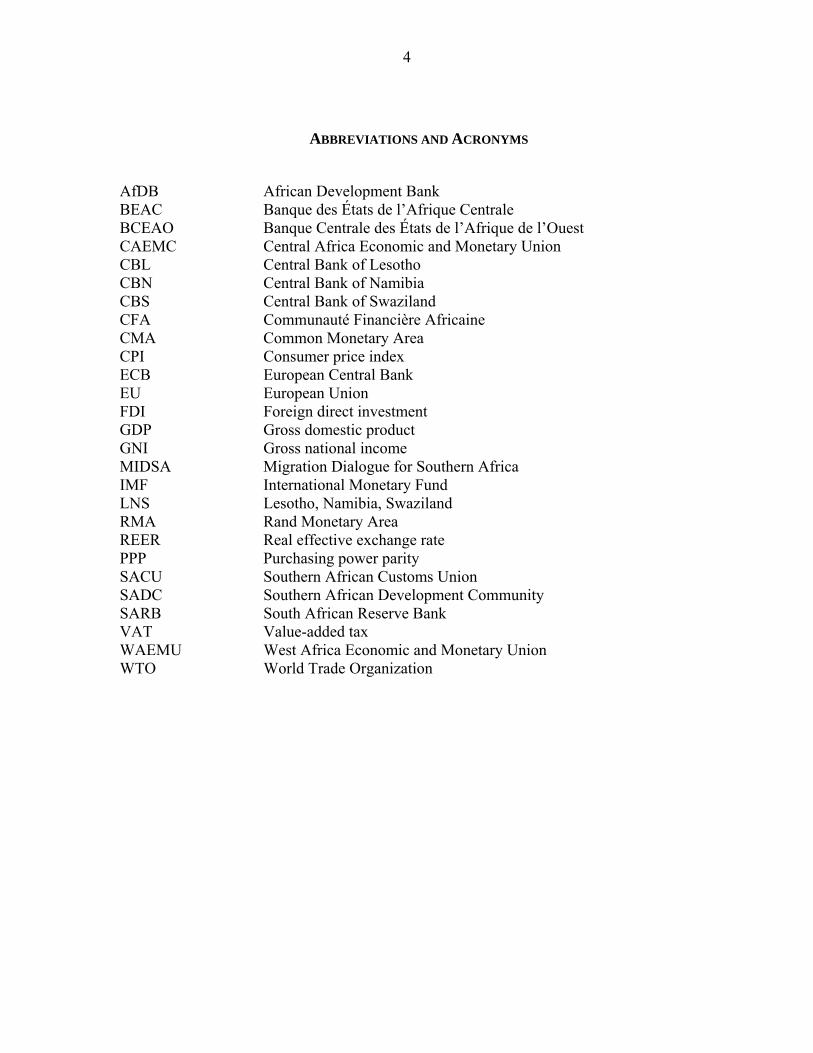
ABBREVIATIONS AND ACRONYMS
AfDB African Development Bank BEAC Banque des États de l’Afrique Centrale BCEAO Banque Centrale des États de l’Afrique de l’Ouest CAEMC Central Africa Economic and Monetary Union CBL Central Bank of Lesotho CBN Central Bank of Namibia CBS Central Bank of Swaziland CFA Communauté Financière Africaine CMA Common Monetary Area CPI Consumer price index ECB European Central Bank EU European Union FDI Foreign direct investment GDP Gross domestic product GNI Gross national income MIDSA Migration Dialogue for Southern Africa IMF International Monetary Fund LNS Lesotho, Namibia, Swaziland RMA Rand Monetary Area REER Real effective exchange rate PPP Purchasing power parity SACU Southern African Customs Union SADC Southern African Development Community SARB South African Reserve Bank VAT Value-added tax WAEMU West Africa Economic and Monetary Union WTO World Trade Organization

5
The Common Monetary Area in Southern Africa: Shocks, Adjustment, and Policy Options 1
I. INTRODUCTION
1. On April 1, 1986, the Trilateral Monetary Agreement among the governments of the Kingdom of Lesotho, the Kingdom of Swaziland, and the Republic of South Africa came into force, establishing the Common Monetary Area (CMA). This agreement and the associated bilateral agreements between South Africa and each of the two smaller members provide a framework for exchange rate and monetary policies in these countries. The broad objectives of the CMA are set out in the preamble of the trilateral agreement (Article 2): “the monetary arrangements should provide for the sustained economic development of the Common Monetary Area as a whole,” and “the arrangements should encourage the advancement of the less developed members of the Common Monetary Area and should afford to all parties equitable benefits arising from the maintenance and development of the Common Monetary Area as a whole.”
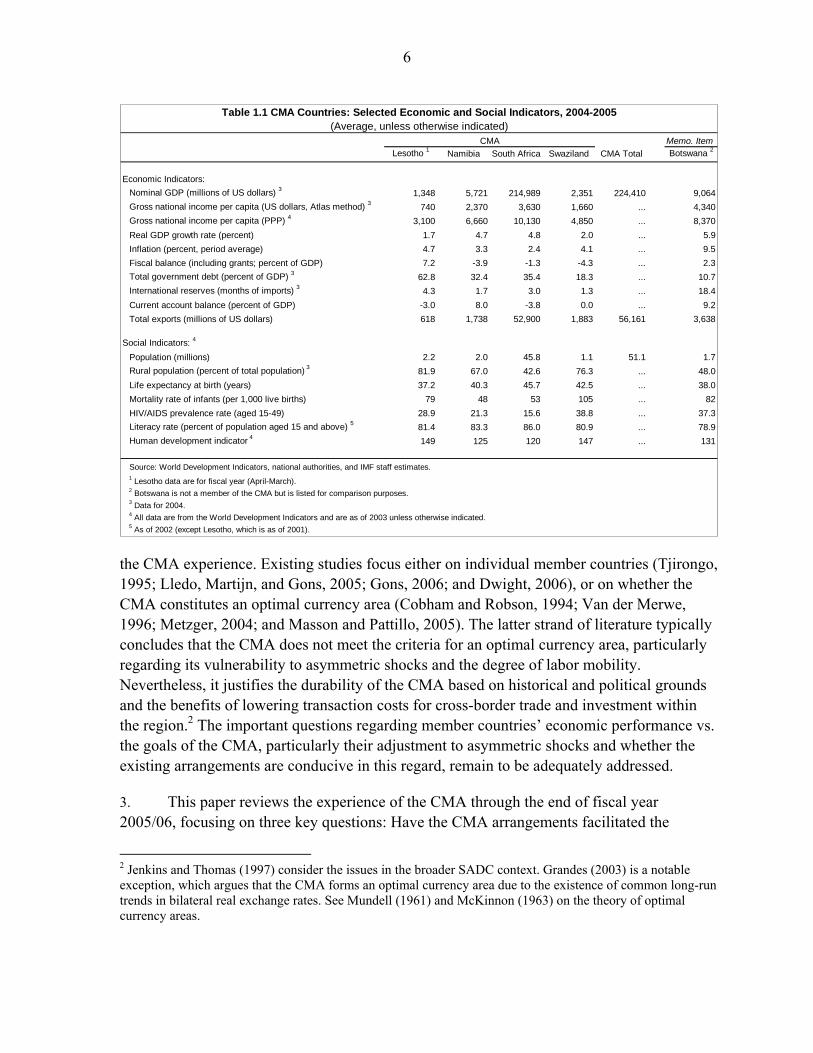
2. In the ensuing two decades, significant changes have taken place both inside and outside the CMA including the joining of Namibia, the end of apartheid in South Africa, and, at times, drastic developments in the global environment affecting CMA members’ external trade and financial flows. The CMA represents a large regional entity: In 2004, it had an estimated combined GDP of US$224 billion, about 43 percent of that of sub-Saharan Africa. However, economic and social developments have remained uneven among the member states (Table 1.1). While other monetary unions, such as WAEMU and CAEMC in Western and Central Africa, have attracted academic interest and have been the subject of International Monetary Fund’s surveillance, relatively little has been done in taking stock of
1 This study is the product of a team effort led by Jian-Ye Wang of the African Department, with Iyabo Masha, Kazuko Shirono, and Leighton Harris, who were all of the African Department at the time the paper was prepared. The authors are particularly grateful for their very helpful suggestions and comments to Timothy T. Thahane, Minister of Finance and Development Planning of Lesotho; Martin Dlamini, Governor of the Central Bank of Swaziland; Moeketsi Senaoana, Acting Governor of the Central of Bank of Lesotho; R. Matlanyane, Deputy Governor of the Central Bank of Lesotho; Paul Hartmann, Deputy Governor of the Bank of Namibia; Peter Gakunu, Executive Director of the IMF, and participants in seminars on the CMA experience conducted by the staff team in Lesotho and Swaziland. The authors would also like to thank the leadership of the African Department, particularly Benedicte Christensen and Samuel Itam for their encouragement and support. They are grateful for constructive comments from Saul Lizondo, Thomas Krueger, Michael Nowak, Sean Nolan, Johannes Mueller, Brian Ames, Wipada Soonthornsima, Janet Stotsky, Jacob Gons, Robert Burgess, Thomas Harjes, Lawrence Dwight, Ken Miyajima, Atsushi Iimi, Markus Haacker, and colleagues in the Fund’s Monetary and Capital Markets Department, the Fiscal Affair Department, the Policy Development and Review Department, and the Research Department. The authors thank Anne Grant for editorial assistance, and Yun Ki Min and Felicité Adjahouinou for secretarial support.
6
Table 1.1 CMA Countries: Selected Economic and Social Indicators, 2004-2005
Memo. ItemLesotho 1 Namibia South Africa Swaziland CMA Total Botswana 2
Economic Indicators:Nominal GDP (millions of US dollars) 3 1,348 5,721 214,989 2,351 224,410 9,064Gross national income per capita (US dollars, Atlas method) 3 740 2,370 3,630 1,660 ... 4,340Gross national income per capita (PPP) 4 3,100 6,660 10,130 4,850 ... 8,370Real GDP growth rate (percent) 1.7 4.7 4.8 2.0 ... 5.9Inflation (percent, period average) 4.7 3.3 2.4 4.1 ... 9.5Fiscal balance (including grants; percent of GDP) 7.2 -3.9 -1.3 -4.3 ... 2.3Total government debt (percent of GDP) 3 62.8 32.4 35.4 18.3 ... 10.7International reserves (months of imports) 3 4.3 1.7 3.0 1.3 ... 18.4Current account balance (percent of GDP) -3.0 8.0 -3.8 0.0 ... 9.2Total exports (millions of US dollars) 618 1,738 52,900 1,883 56,161 3,638
Social Indicators: 4
Population (millions) 2.2 2.0 45.8 1.1 51.1 1.7Rural population (percent of total population) 3 81.9 67.0 42.6 76.3 ... 48.0Life expectancy at birth (years) 37.2 40.3 45.7 42.5 ... 38.0Mortality rate of infants (per 1,000 live births) 79 48 53 105 ... 82HIV/AIDS prevalence rate (aged 15-49) 28.9 21.3 15.6 38.8 ... 37.3Literacy rate (percent of population aged 15 and above) 5 81.4 83.3 86.0 80.9 ... 78.9Human development indicator 4 149 125 120 147 ... 131
Source: World Development Indicators, national authorities, and IMF staff estimates.1 Lesotho data are for fiscal year (April-March).2 Botswana is not a member of the CMA but is listed for comparison purposes.3 Data for 2004.4 All data are from the World Development Indicators and are as of 2003 unless otherwise indicated.5 As of 2002 (except Lesotho, which is as of 2001).
CMA(Average, unless otherwise indicated)
the CMA experience. Existing studies focus either on individual member countries (Tjirongo, 1995; Lledo, Martijn, and Gons, 2005; Gons, 2006; and Dwight, 2006), or on whether the CMA constitutes an optimal currency area (Cobham and Robson, 1994; Van der Merwe, 1996; Metzger, 2004; and Masson and Pattillo, 2005). The latter strand of literature typically concludes that the CMA does not meet the criteria for an optimal currency area, particularly regarding its vulnerability to asymmetric shocks and the degree of labor mobility. Nevertheless, it justifies the durability of the CMA based on historical and political grounds and the benefits of lowering transaction costs for cross-border trade and investment within the region.2 The important questions regarding member countries’ economic performance vs. the goals of the CMA, particularly their adjustment to asymmetric shocks and whether the existing arrangements are conducive in this regard, remain to be adequately addressed.
3. This paper reviews the experience of the CMA through the end of fiscal year 2005/06, focusing on three key questions: Have the CMA arrangements facilitated the
2 Jenkins and Thomas (1997) consider the issues in the broader SADC context. Grandes (2003) is a notable exception, which argues that the CMA forms an optimal currency area due to the existence of common long-run trends in bilateral real exchange rates. See Mundell (1961) and McKinnon (1963) on the theory of optimal currency areas.
7
achievement of their growth and development objectives? What are the key policy challenges facing the member countries in an increasingly integrated world economic environment? And what are the main issues and possible options to address these challenges? These questions are of particular relevance for the small member countries (Lesotho, Namibia, and Swaziland) as South Africa, which has had a decisive influence on the exchange rate and monetary policies of the rest of the CMA, has in recent years moved from a pegged exchange rate to a policy regime based on inflation targeting and a more flexible exchange rate. This study also examines the economic adjustment and policies of the CMA countries against a broader African context. Comparator countries include Botswana, which exited from the CMA but remains a member of the Southern African Customs Union (SACU), and non-SACU members of the South African Development Community (SADC). The SADC’s Regional Indicative Strategic Development Plan has set the goal of establishing a SADC monetary union by 2016, and a common currency by 2018.3
4. The rest of the paper is organized as follows. Chapter II recounts the evolution of monetary arrangements in Southern Africa, noting the origins of the CMA arrangements and key differences in comparison with other monetary unions in the world. Chapter III reviews long-term trends in income, consumer prices, interest rates, and available data on the financial and labor markets to assess whether the CMA’s objectives of regional integration and growth are being achieved over the long term. Chapter IV focuses on external shocks, and member countries’ policy responses. Based on analysis in the preceding two chapters, Chapter V draws the main lessons from the CMA experience and discusses the issues facing the member countries in addressing key policy challenges. The last chapter concludes with a brief summary of the main findings of the paper.
II. HISTORICAL BACKGROUND AND INSTITUTIONAL SETTING
The History of the Current CMA Arrangement
5. The CMA arrangement has its roots in a de facto currency union. In 1921, after the establishment of the South African Reserve Bank (SARB), the South African currency (initially the pound, since 1961 the rand) became effectively the sole medium of exchange and legal tender in South Africa, Bechuanaland (now Botswana), Lesotho, Namibia, and Swaziland. There were no internal restrictions on movements of funds within the area and virtually all external transactions were effected through banks in South Africa and subject to South African exchange controls. This situation continued after Botswana, Lesotho, and Swaziland gained political independence in the 1960s. The currency union was formally 3 Regional Indicative Strategic Development Plan, SADC, Chapter 4, Section 4.10. http://www.sadc.int. SADC, established in 1992, includes Angola, Botswana, the Democratic Republic of Congo, Madagascar (joined in 2005), Malawi, Mauritius, Mozambique, Tanzania, Zambia, Zimbabwe, and the CMA countries. In August 2006, leaders of the SADC countries signed a protocol, reaffirming their commitment to achieve a monetary union.

8
established on December 5, 1974, with the signing of the Rand Monetary Area (RMA) agreement. Botswana, however, opted to withdraw from the RMA in 1975.4
6. The RMA agreement was revised in April 1986 to establish the Common Monetary Area of Lesotho, Swaziland, and South Africa. Under the terms of the CMA Agreement, Lesotho and Swaziland would also have the right to issue their own national currencies. Swaziland issued its national currency, the lilangeni, in 1974, followed by Lesotho introducing the loti in 1980. Namibia, which became independent in 1990, joined the CMA in 1992 and issued its own national currency, the Namibian dollar, in the following year. The national currencies of Lesotho, Namibia and Swaziland (the LNS countries) have been pegged at par to the rand since their introduction. When these countries issued their own currencies, they became responsible—albeit to a very limited extent—for their own monetary policy and assumed control of their own financial institutions. Bilateral agreements governed their access to the South African foreign exchange market.
7. In terms of membership, the monetary arrangements in Southern Africa were closely associated with a common customs area, the Southern African Customs Union (SACU). The SACU, established in 1910, comprises South Africa, Botswana, Namibia, Lesotho, and Swaziland. As the external trade of land-locked Botswana, Lesotho, and Swaziland is directed through South Africa, as well as much of Namibia’s international trade, South Africa collects a substantial portion of customs duties and excise taxes for the SACU. Over the years, new agreements were reached and old ones amended (see Box 1 and Appendix IV) on such matters as revenue allocation rules. These changes were not necessarily designed to complement monetary arrangements under the CMA.
Institutional Framework
8. Currency Arrangements. Article 2 of the CMA (Multilateral) Agreement gives the three small member countries the right to issue national currencies, and their bilateral agreements with South Africa define the areas where their currencies are legal tender. The local currencies issued by the three members are legal tender only in their own countries.5 The South African rand, however, is legal tender throughout the CMA.6 The bilateral
4 Botswana withdrew from the RMA mainly because it wanted to retain the ability to formulate and implement its own monetary policy and to adjust the exchange rate, if necessary, in response to shocks affecting its economy. However, Botswana has maintained a close link between its national currency, the pula, and the rand through a currency basket, with the rand taking 60-70 percent of the weight (see Collings, et al (1978) and Guma (1985)). See also Zaidi (2004) who illustrates the evolution of the exchange rate regime in Botswana. 5 However, the Lesotho loti is widely accepted as a medium of exchange in South African towns on the border with Lesotho (Foulo, 2003).
6 Swaziland suspended the use of the rand as legal tender in 1986 despite the fact that the rand continued to be widely accepted in the country. In the fall of 2003, the Swazi authorities re-authorized the use of the rand as legal tender alongside the lilangeni.

9
Box 1. CMA and SACU: Major Events in History
Year/period Monetary Arrangements Customs Union
Before 1960 Informal monetary union. Following establishment of the South African Reserve Bank in 1921, the South African pound became the common currency.
Arrangement became effective in 1910.
The 1960s Countries became independent (except Namibia). The rand replaced the pound in 1961.
New agreement reached on December 11, 1969; the shares of the smaller members were determined based on a revenue-sharing formula, with the residual allocated to South Africa.
1974-75
South Africa, Botswana, Lesotho, and Swaziland signed the Rand Monetary Area treaty on December 5, 1974. Swaziland set up its own monetary authority and introduced its national currency, the lilangeni, pegged at par to the rand. Botswana opted to withdraw from the RMA in 1975.
1980 Lesotho established its own central bank and issued its national currency, at a one-to-one rate to the rand, in January 1980.
1986 South Africa, Lesotho, and Swaziland signed the CMA Trilateral Agreement in April 1986, replacing the RMA. Additional provisions concerning capital account, intra-CMA fund transfers, and seigniorage compensation were made. Swaziland discontinued the use of rand as legal tender within its borders.
1989 The CMA was amended to remove exchange restrictions arising from the limitations on conversion of balances upon termination of the agreement or withdrawal of one party.
1992-93 Namibia became independent in 1990. The Multilateral Agreement replaced the Trilateral Agreement when Namibia joined the CMA in 1992. It issued its national currency, the dollar, in 1993.
2002 New revenue-sharing formula had a development component.
2003 After 17 years of interruption, Swaziland reauthorized the use of the rand as legal tender alongside the lilangeni in the country.

10
agreements also require the LNS countries to permit authorized dealers within their territories to convert, at par, notes issued by their central banks or the South African Reserve Bank without restriction and subject only to normal handling charges.
9. Under the Lesotho-South Africa and Namibia-South Africa bilateral agreements, the central banks of Lesotho and Namibia are required to maintain foreign reserves at least equivalent to the total amount of local currencies they issue.7 Such reserves may comprise the central bank’s holdings of rand balances, the rand currency the central bank holds in a Special Rand Deposit Account with the SARB, South African government stock (up to a certain proportion of total reserves), and investments in the Corporation for Public Deposit in South Africa.8
10. Movement of Funds within the CMA. Under the terms of the CMA Agreement (Article 3), no restrictions can be imposed on the transfer of funds, whether for current or capital transactions, to or from any member country. The only exceptions result from the member countries’ investment or liquidity requirements prescribed for financial institutions. The small member countries view the investment and liquidity requirements as a measure of savings mobilization for development purposes. The regulations requiring the investment of funds by financial institutions in domestic securities or credits to local businesses or individuals are, in effect, minimum local asset requirements.9 These regulations are meant to address the concern of the three small, less developed, CMA members that funds generated in their territories and deposited with local financial institutions tended to flow to the more developed capital markets of South Africa.
11. Access to South African Financial Markets. The CMA Agreement provides for the three small member countries to have access to the South African capital and money markets, but only through prescribed investments or approved securities that can be held by financial institutions in South Africa, in accordance with prudential regulations in the LNS countries.10 The terms and timing of such issues are subject to consultation and agreement with the South African government, and the issues have the same rating as South African municipal bonds.
7 This provision was not included in the Swaziland-South Africa bilateral agreement of April 1986, in part for reasons detailed in footnote 5. However, the CBS has maintained foreign reserves larger than the total amount of local currencies it issued throughout the past two decades.
8 Non-rand reserves (e.g., U.S. dollars) are also counted for the reserve-money coverage rule.
9 For instance, the minimum local asset to total deposits ratio in Lesotho, which has been reduced in recent years, was 5 percent in 2005.
10 Access to the South African capital market is, however, made subject to a ceiling in terms of a share in the required minimum amount that such institutions hold as prescribed investments and approved securities. In Namibia, the limit applies to institutional investors, such as pension funds, insurance companies, and medical aid schemes, but not to banking institutions.

11
As for the short-term money market, there are no regular arrangements for the taking up in South Africa of treasury bills issued by the LNS countries. However, the CMA Agreement recognizes the right of the other member countries, in special circumstances, to enter into bilateral negotiations with South Africa to obtain temporary central bank credit.11
12. Gold and Foreign Exchange Transactions. Although the LNS countries have the right to authorize foreign transactions of local origin, and are responsible for doing so, the CMA Agreement (Article 5) requires their exchange control regulations to be—in all material aspects—similar to those in effect in South Africa. Gold and foreign exchange receipts of residents are subject to a surrender requirement.12 There are no exchange restrictions on current international transactions and for non-residents.
13. Compensation Payments. Since the rand is legal tender in all CMA countries (but the currencies of the three small CMA members are not legal tender in South Africa), South Africa compensates them for forgone seigniorage. Compensation is based on a formula equal to the product of (i) two-thirds of the annual yield on the most recently issued long-term South African government stock, and (ii) the volume of rand estimated to be in circulation in the member country concerned. The ratio of two-thirds was established on the assumption that it approximated the yield of a portfolio of reserve assets comprising both long-term and short-term maturities, assuming that the average yield would be less than the full long-term yield.
14. Consultation and other Provisions. To facilitate implementation of the CMA Agreement, the member countries have established a commission in which each of them has one representative (along with advisors as needed). The commission holds regular consultations—at least once a year—with the aim of reconciling the interests of member countries on common issues pertaining to monetary and foreign exchange policies. It also convenes at other times at the request of a member country. Article 9 of the CMA Agreement provides for the establishment of a tribunal to arbitrate disputes that might arise between member countries regarding the interpretation or application of the agreement.
Comparison with Other Monetary Unions
15. Several features of the CMA stand out in comparison with other monetary unions (Table 2.1):
11 This borrowing facility has not been used so far.
12 Under such a requirement, a member country’s residents have to surrender their gold and foreign exchange receipts to an authorized dealer appointed by that country. At the same time, the authorized dealers are required to sell the gold and foreign exchange they purchase to the national central bank, although they may maintain minimum working balances within limits determined by the central bank.

12
• One of the most striking features of the CMA is the dominance of a single large country. South Africa accounts for over 90 percent of the CMA’s GDP, trade, and population. Like the monetary union in Central Africa, per capita income differs widely among the member countries.
• The CMA is not a full monetary union. There is no common central bank, no common pool of reserves, and no regional surveillance of domestic, particularly fiscal and structural policies. While national currencies circulate in small countries, there is a de facto common currency—the currency of the core country, South Africa. Under the current parity arrangements, national currencies of the small countries and the rand are perfect substitutes; there is no transaction cost in conversion.13
• The exchange rate arrangements of the small countries under the CMA share certain characteristics of a currency board—domestic currency issues are required to be fully backed by foreign reserves. However, unlike a typical currency board, there is no legal restriction prohibiting the central bank of a small member country from acquiring domestic assets.14 The small member countries have not made an irrevocable commitment to keep a given parity. There is no arrangement that member countries provide mutual support if the exchange rate peg comes under pressure.
• The CMA is based on a free trade area with very high capital mobility. Such an area long preceded the CMA. In this regard, the CMA is more similar to the euro area than the other two monetary unions in Africa which do not have free trade, nor high degree of capital mobility within the region (see Masson and Pattillo, 2001).
• There is no formal mechanism for fiscal transfers to cushion the impact of asymmetric shocks on member states.
13 Foulo (2003) provides a vivid account of the use of foreign currencies in the CMA.
14 See Humpage and McIntire (1995) on currency board arrangements.

13
WAEMU CAEMC Euro Area CMANumber of countries 8 6 12 4
Single currency? Yes Yes Yes No, but a de facto common currency
Common central bank? Yes (BCEAO) Yes (BEAC) Yes (ECB) but national central banks execute monetary policy.
No (but SARB has considerable influence)
Common pool of reserves? Yes Yes Yes No
Regional surveillance of fiscal policy?
Yes Yes Yes No
Free trade area? No No Yes Yes
Common external tariff? Yes Yes, in principle Yes Yes
External current account convertibility?
Yes Yes Yes Yes
Degree of capital mobility within region?
Low (in principle free)
Low (in principle free)
High High
External exchange rate anchor?
Yes (peg to euro) Yes (peg to euro) No No
Ratio of per capita GDP of richest to poorest country in the area (2004)
4.8 16.9 4.2 7.7
Source: Modified and updated from Table 3.1 in Fasano (2003)
Table 2.1. Main Features of Selected Monetary Unions
III. LONG-TERM TRENDS, INTEGRATION, AND CONVERGENCE
16. This chapter reviews developments in the CMA economies, including in the markets for goods and services, capital, and labor. This review aims to assess whether progress has been made by the CMA toward the objectives initially envisaged by its membership and whether the CMA has afforded to its member countries the benefits of lowering transaction costs for regional trade and investment and of price and monetary stability. Issues related to cross-border labor mobility are also discussed in light of available data.
GDP Growth and Per Capita Income
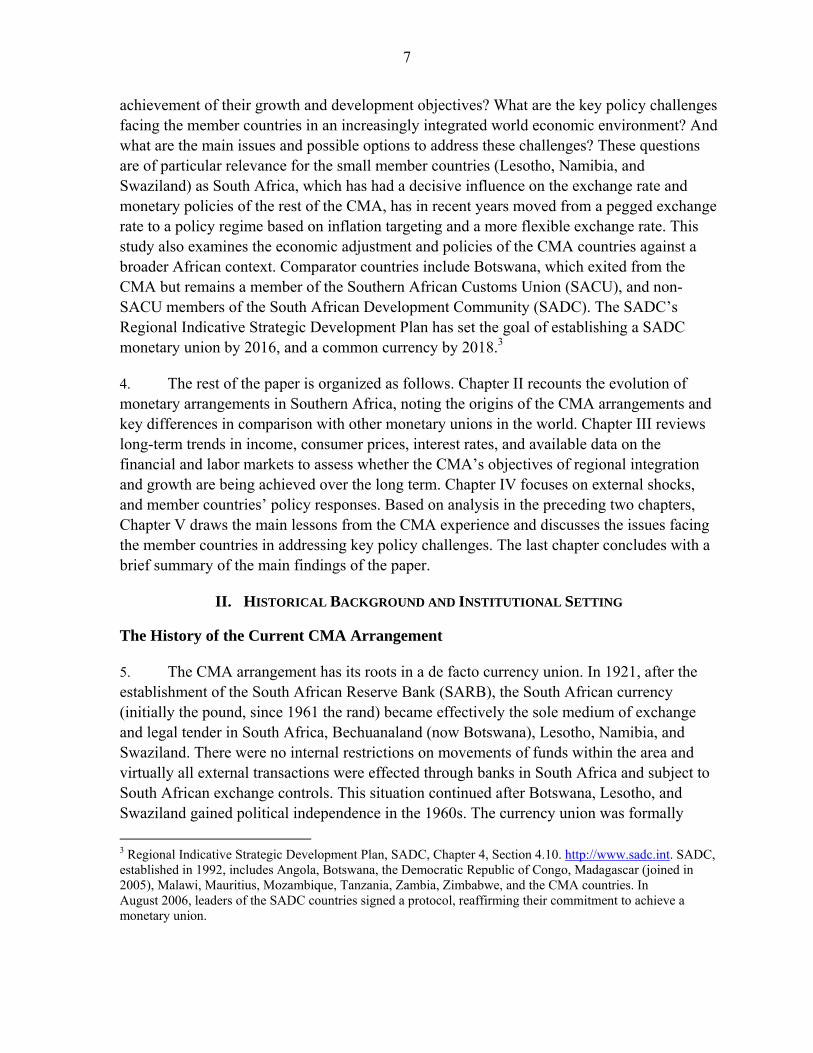
17. Economic growth in the CMA as a whole has accelerated since the end of apartheid in South Africa in 1994. The average annual GDP growth rate of the CMA, reflecting largely developments in South Africa, rose from 1.1 percent in 1980-1992 to 2.7 percent in 1993-
14
Figure 3.1. CMA: Average Real GDP Growth Rate, 1980-2005(Percent)
0
2
4
6
8
1980-1993 1994-2001 2002-2005
Lesotho Namibia
Swaziland South Africa
Source: National authorities and IMF staff estimates.1 Data starts in 1991.
1
2000 and 3.7 percent in 2001-2005. Compared with other parts of Africa, the CMA, by tripling its average growth rate, has achieved a more significant improvement in its trend growth performance over the period (Appendix I).
18. However, the growth performance varies across CMA countries (Fig. 3.1). Trend growth rates of CMA countries in 1980-2005 reflected the differential impact of South Africa’s reintegration into the world economy and CMA countries’ very different economic structures. The immediate post-apartheid period (1994-2001) was one of adjustment for Lesotho and Swaziland as foreign investors who were attracted to these countries by their proximity to the South African market moved to invest in South Africa directly. This diversion of foreign direct investment affected Swaziland more seriously than Lesotho. Both saw their real GDP growth fall, which was compounded by a decline in remittances (relative to GDP) from migrant workers in South African mines. Namibia, newly independent at that time, was less affected in this regard. During the period, South Africa more than doubled its growth rate under apartheid, benefiting from expanded trade and foreign investment. With regard to the structures of production and exports, mining and minerals exports are important for both South Africa and Namibia while agriculture is important for Swaziland and Lesotho. Garments have become a key export item in Lesotho in recent years (Table 3.1). With the recent shifts in world market demand, both the South African and Namibian economies got boosted by surging exports. During the same period, Lesotho and Swaziland suffered from a persistent drought and the loss of trade preferences for their textile products after the removal of textile quotas by industrial countries.
19. Data on real per capita income measured in purchasing power parity show evidence of convergence within the CMA over the last two decades (Fig. 3.2 and 3.3). During the period, South Africa remained the richest and Lesotho the poorest in per capita terms but the gap had narrowed from over 80 percent of South African per capita income to about 70 percent by 2003. The income gaps between South Africa and Namibia and Swaziland have also been reduced. The CMA thus appears to form “a convergence club” (Masson and

15
Source: World Bank, World Development Indicators.1 Botswana is not a member of the CMA but is listed for comparison purposes.
(Purchasing power parity, 2000 U.S. dollars)Figure 3.2. CMA: Real GDP per Capita 1
0
2000
4000
6000
8000
10000
12000
14000
16000
1980 1984 1988 1992 1996 2000 2004
Botswana Lesotho Namibia South Africa Swaziland
Table 3.1. CMA Countries: Foreign Trade Indicators, 2003
Memo. itemLesotho Namibia Swaziland South Africa Botswana 1
Direction of TradeExports to: 2
South Africa 19.4 28.6 68.2 7.3 3 10.4Europe 0.1 49.7 1.9 30.6 84.7United States 79.8 5.9 9.1 9.7 0.7Rest of the world 0.7 15.8 20.9 59.7 4.2
Imports from: 2
South Africa 86.0 81.5 89.0 1.3 3 72.5Europe 0.1 6.2 1.2 43.4 9.2United States 0.2 0.8 0.3 9.7 1.8Rest of the world 13.7 11.5 9.6 46.9 16.5
Trade to GDP ratios 3
Total exports 46.8 29.5 72.4 27.4 38.5Total imports 91.9 36.6 75.0 28.5 31.0
Main export commodities Garments Diamonds and other minerals
Sugar and drink
concentrates
Gold, iron ore, platinum, and other minerals
Diamonds
As a share of total exports (percent) 70 56 59 33 78
Source: National authorities and IMF staff estimates.1 Botswana is not a member of the CMA but is listed for comparison purposes.2 Excludes re-exports. Trade with South Africa is the total with the CMA based on SACU data.3 2004-2005 average.4 Trade with CMA countries.
(Percent of total exports)
(Percent of total imports)
(Percent)
CMA
Pattillo, 2005, p. 67).15 However, the convergence of per capita income has slowed down in recent years as economic growth accelerated in South Africa but faltered in some other countries, such as Swaziland. Indeed, the gap in per capita income between Swaziland and South Africa widened slightly between 1995 and 2003. As a result, large income disparities still remain among the CMA countries, although it should be noted that there are also dramatic income inequalities within South Africa itself, reflecting the historical legacy.
20. A statistical analysis of the growth rates of gross national income per capita (Atlas method) in the CMA countries confirms the convergence in per capita income over the last two decades but also points to varying performance across countries. All three small countries achieved higher average annual growth in per capita GNI in 1994-2005 than in 1980-1993.
15 Convergence is even more evident when Botswana is included. This may suggest that free trade under the arrangements of SACU play an important role in promoting growth in less developed countries in the region.

16
Source: World Bank, World Development Indicators.
Figure 3.3. Per Capita Income Relative to South Africa (Purchasing power parity, percent)
0
10
20
30
40
50
60
70
80
1983-85 1993-95 2003-05
Lesotho Namibia Swaziland
Source: National authorities and IMF staff calculations.1 Log level of the consumer price index.
Tradables 2 Non-Tradables 3
Lesotho 67.2 32.8Namibia 70.4 29.6South Africa 59.4 40.6Swaziland 74.1 25.9
Memorandum item:Botswana 4 70.8 29.2
Source: National authorities and IMF staff estimates.1 Weights used in compiling consumer price index (CPI). Proportion of tradables and non-tradables is calculated by IMF staff except for South Africa, which is calculated by the authorities.2 Tradables broadly equate to the sum of food and beverages, alcohol and tobacco, clothing and footwear, fuel and power, and furniture and equipment.3 Non tradables broadly equate to the sum of housing, household operations, medical care, transportation, communication, and education.4 Botswana is not a member of the CMA but is listed for comparison purposes.
Table 3.2. CMA Countries: CPI Weights 1
(Percent)
Figure 3.4. CMA: Consumer Price Indexes, 1980-2005 1
1.00
1.25
1.50
1.75
2.00
2.25
2.50
1980 1985 1990 1995 2000 2005
Lesotho Namibia
South Africa Swaziland
However, per capita GNI growth rates varied in a wider range, especially in Swaziland and Lesotho, with higher standard deviations in 1994-2005 than the preceding decade.
Inflation and Intra-regional Trade
21. Price developments in the LNS countries are linked to that of South Africa through cross-border trade. The LNS countries are highly open. Imports amounted to over 90 percent of GDP in Lesotho, about 75 percent of GDP in Swaziland, and some 36 percent in Namibia in 2004-05 (Table 3.1). South Africa on average, provides 85 percent of the LNS countries’ imports, which are free from tariffs and virtually all other trade barriers, as well as transaction costs for currency conversion. For the LNS countries, however, the direction of exports is quite different from the source of imports. The bulk of Lesotho and Namibia’s exports are destined for markets outside the CMA.
22. A common trend is evident by visual inspection of the consumer price indexes (CPI) of the four CMA countries (Fig. 3.4). It should be noted that even if the law of one price prevails for all tradable goods and services throughout the CMA, CMA members’ consumer price indexes may not move in perfect synchronization because these countries, in light of different per capita income and household expenditure patterns, attach different weights to non-tradable goods and services in compiling their consumer price indexes and the prices of non-tradables are not necessarily moving together across countries (Table 3.2).
17
23. CPI measurement differences notwithstanding, a principal components analysis reveals that over 99 percent of the year-on-year movements of the consumer price indexes in CMA countries can be summarized by a single, CMA-wide factor. Country specific factors account for at most 1 percent of the total variation in the 1980-2005 data. Granger causality tests further confirm that inflation in the smaller countries is Granger-caused by inflation in South Africa; and there is no reverse causality (Appendix II).
24. Price convergence in the CMA can be further investigated by estimating a dynamic price adjustment model. Building on the results of the principal components analysis and the causality tests, the model postulates that the long-run relationship between the price levels in the LNS countries and that in South Africa is one of proportionality, and that short-term adjustment to changes in South African inflation follows a gradual catching-up or “error correction” process. The estimation results, using quarterly data from 1980 to 2005, provide clear statistical evidence that the goods markets in the CMA are highly integrated: a substantial immediate adjustment is found in LNS countries’ prices to changes in South African prices; and the convergence coefficient is negative and statistically significant for all three small countries (Box 2).
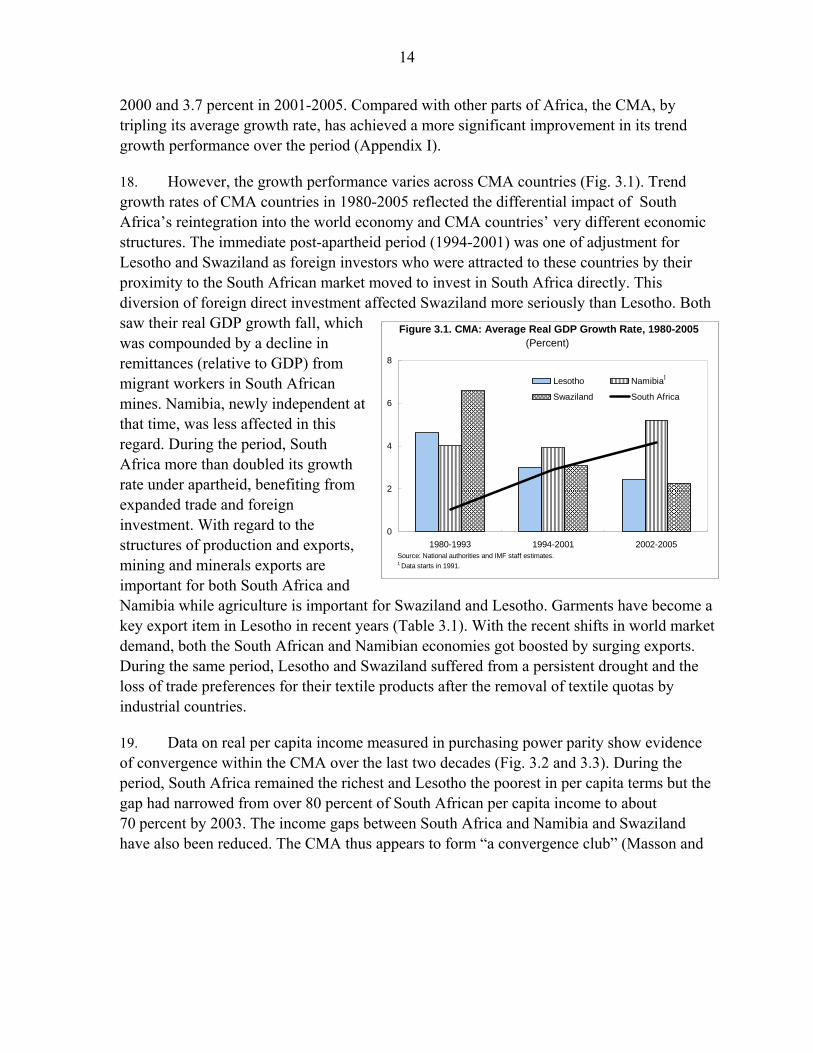
25. Average annual inflation rates for the period 1996-2005 suggest that the CMA, anchored by price developments in South Africa, has had lower inflation than neighboring countries in the SADC (Fig. 3.5). Its inflation rate, on average, was also less volatile in 1996-2000, but the volatility increased in 2001-2005. During the same period, average exchange rate volatility, measured by the standard deviation of monthly changes in the log level of real effective exchange rates, also increased in the CMA. Volatility in consumer price inflation in South Africa in recent years may to some extent have reflected a more flexible exchange rate of the rand vis-à-vis other major currencies (Fig. 3.6).16 With their economies more open than South Africa, the higher exchange rate volatility may have passed through relatively quickly to domestic prices in the LNS countries.
16 Bhundia (2002) reports that the level of consumer price index excluding interest on mortgage bonds (CPIX) in South Africa increases by 0.12 percent eight quarters after a one percent shock to the nominal effective exchange rate.

18
Figure 3.5. CMA: Average Inflation and Exchange Rate Volatility, 1996-2005 1
Source: National authorities, IMF Information Notice System, and IMF staff estimates.1 The mean is a simple average of the monthly year-on-year change in inflation or the real effective exchange rate. Volatility is calculated by taking the standard deviation of the time series. 2 SADC series represents SADC members excluding the CMA countries and Angola, Democratic Republic of Congo, and Zimbabwe. The latter three countries are excluded because of their very high inflation rates during the period. If they were included, the SADC average inflation would be 214 percent for 1996-2000 and 56.8 percent for 2001-2005, and volatility would exceed the standard deviations in both time frames. Madagascar is also excluded from the series because it joined the SADC only in 2005.
0
2
4
6
8
10
12
14
16
18
20
Lesotho Namibia South Africa Swaziland
Per
cent
CMA Average Inflation
0
2
4
6
8
10
12
14
16
18
20
CMA Botswana SADC 2/
Regional Average Inflation
SADC 2
0
1
2
3
4
5
6
7
8
9
10
Lesotho Namibia South Africa Swaziland
Std.
Dev
iatio
n
CMA Inflation Volatility
0
1
2
3
4
5
6
7
8
9
10
CMA Botswana SADC 2
Regional Inflation Volatility
SADC 2
0
4
8
12
16
20
24
28
Lesotho Namibia South Africa Swaziland
Std
. Dev
iatio
n
CMA Real Effective Exchange Rate Volatility
0
4
8
12
16
20
24
28
CMA Botswana SADC 2/
Regional Real Effective Exchange Rate Volatility
SADC 2
Average inflation rate declined... ...and was lower than in neighboring countries.
Volatility of inflation increased... ...while volatility decreased in the SADC.
Volatility in the real effective exchange increased...
...but was still below that of neighboring countries.
1996-2000 2001-2005

19
Figure 3.6. CMA: Exchange Rate Developments, 1980-2005(1990=100)
Source: IMF Information Notice System.
1 IMF trade-weighted index of nominal exchange rates deflated by seasonally adjusted relative consumer prices; increase means appreciation.
South Africa
40
60
80
100
120
140
160
1980 1985 1990 1995 2000 2005
0
2
4
6
8
10
12
14
Lesotho
40
60
80
100
120
140
160
1980 1985 1990 1995 2000 2005
0
2
4
6
8
10
12
14
Namibia
40
60
80
100
120
140
160
1980 1985 1990 1995 2000 2005
0
2
4
6
8
10
12
14
Swaziland
40
60
80
100
120
140
160
1980 1985 1990 1995 2000 2005
0
2
4
6
8
10
12
14
Real effective exchange rate 1 Nominal exchange rate (per US dollar, right scale)
20
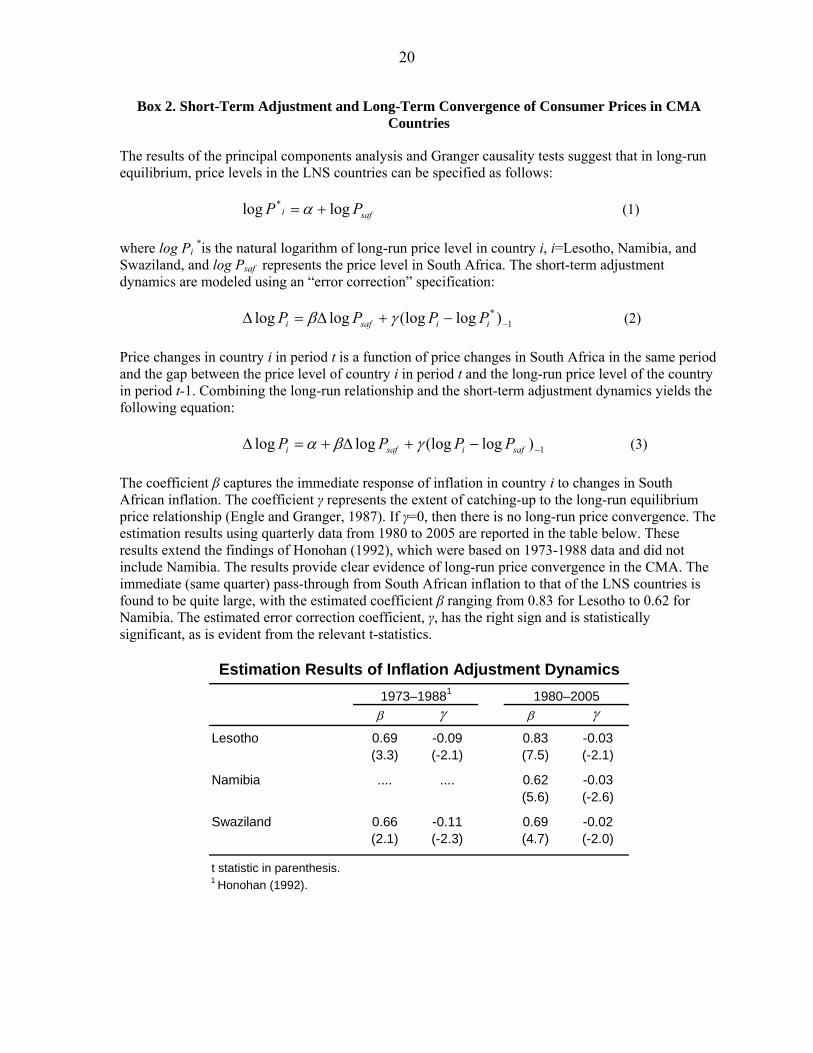
Box 2. Short-Term Adjustment and Long-Term Convergence of Consumer Prices in CMA Countries
The results of the principal components analysis and Granger causality tests suggest that in long-run equilibrium, price levels in the LNS countries can be specified as follows:
safi PP loglog * += α (1)
where log Pi *is the natural logarithm of long-run price level in country i, i=Lesotho, Namibia, and Swaziland, and log Psaf represents the price level in South Africa. The short-term adjustment dynamics are modeled using an “error correction” specification:
1* )log(logloglog −−+Δ=Δ iisafi PPPP γβ (2)
Price changes in country i in period t is a function of price changes in South Africa in the same period and the gap between the price level of country i in period t and the long-run price level of the country in period t-1. Combining the long-run relationship and the short-term adjustment dynamics yields the following equation:
1)log(logloglog −−+Δ+=Δ safisafi PPPP γβα (3)
The coefficient β captures the immediate response of inflation in country i to changes in South African inflation. The coefficient γ represents the extent of catching-up to the long-run equilibrium price relationship (Engle and Granger, 1987). If γ=0, then there is no long-run price convergence. The estimation results using quarterly data from 1980 to 2005 are reported in the table below. These results extend the findings of Honohan (1992), which were based on 1973-1988 data and did not include Namibia. The results provide clear evidence of long-run price convergence in the CMA. The immediate (same quarter) pass-through from South African inflation to that of the LNS countries is found to be quite large, with the estimated coefficient β ranging from 0.83 for Lesotho to 0.62 for Namibia. The estimated error correction coefficient, γ, has the right sign and is statistically significant, as is evident from the relevant t-statistics.
Lesotho 0.69 -0.09 0.83 -0.03(3.3) (-2.1) (7.5) (-2.1)
Namibia .... .... 0.62 -0.03(5.6) (-2.6)
Swaziland 0.66 -0.11 0.69 -0.02(2.1) (-2.3) (4.7) (-2.0)
t statistic in parenthesis.1 Honohan (1992).
1980–20051973–19881
Estimation Results of Inflation Adjustment Dynamics
β γ β γ
21
Source: National authorities, and IMF staff estimates.1 Botswana is not a member of the CMA but is listed for comparison purposes.2 91-day treasury bill rates except Botswana data which reflects three month Bank of Botswana certificates.
Figure 3.7. CMA Countries: Interest Rates, 1990-2005 1
(Percent)
Central Bank Rates
5
7
9
11
13
15
17
19
21
23
1990 1993 1996 1999 2002 2005
Botswana Lesotho Namibia South Africa Swaziland
Treasury Bill Rates 2
0
5
10
15
20
25
1990 1993 1996 1999 2002 2005
Botswana Lesotho Namibia South Africa Swaziland
Commercial Bank Prime Lending Rates
5
7
9
11
13
15
17
19
21
23
25
1990 1993 1996 1999 2002 2005
Botswana Lesotho Namibia South Africa Swaziland
Interest Rates and the Financial Sector
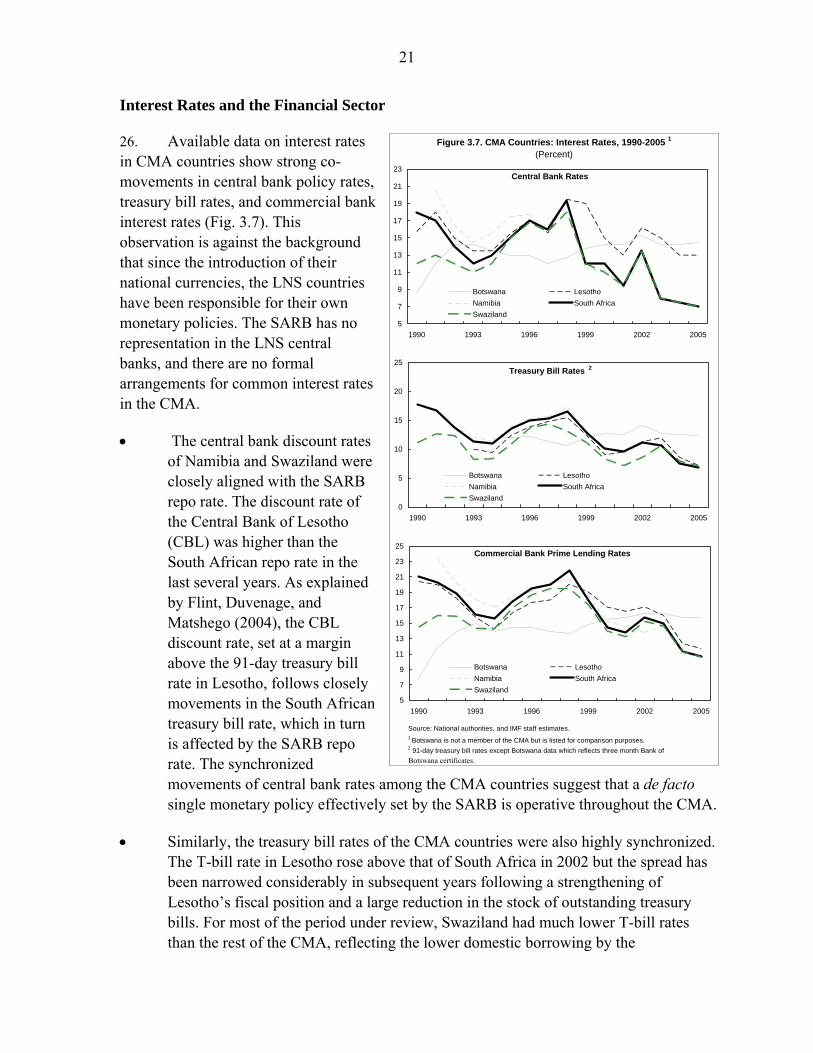
26. Available data on interest rates in CMA countries show strong co-movements in central bank policy rates, treasury bill rates, and commercial bank interest rates (Fig. 3.7). This observation is against the background that since the introduction of their national currencies, the LNS countries have been responsible for their own monetary policies. The SARB has no representation in the LNS central banks, and there are no formal arrangements for common interest rates in the CMA.
• The central bank discount rates of Namibia and Swaziland were closely aligned with the SARB repo rate. The discount rate of the Central Bank of Lesotho (CBL) was higher than the South African repo rate in the last several years. As explained by Flint, Duvenage, and Matshego (2004), the CBL discount rate, set at a margin above the 91-day treasury bill rate in Lesotho, follows closely movements in the South African treasury bill rate, which in turn is affected by the SARB repo rate. The synchronized movements of central bank rates among the CMA countries suggest that a de facto single monetary policy effectively set by the SARB is operative throughout the CMA.
• Similarly, the treasury bill rates of the CMA countries were also highly synchronized. The T-bill rate in Lesotho rose above that of South Africa in 2002 but the spread has been narrowed considerably in subsequent years following a strengthening of Lesotho’s fiscal position and a large reduction in the stock of outstanding treasury bills. For most of the period under review, Swaziland had much lower T-bill rates than the rest of the CMA, reflecting the lower domestic borrowing by the
22
government. Beginning in 2003, with rising financing needs, government borrowing ceiling was raised and the T-bill rates rose to the regional average levels.
• Bank lending rates moved in tandem with the central bank and the T-bill rates in CMA countries. The World Bank (2004) notes that lending rate spreads between Lesotho and South Africa can be explained largely by the higher default risks and weaker legal and judicial protection for lenders in Lesotho. It is worth noting that the interest rate spreads have been narrowing in recent years.
27. The intuition of monetary convergence in the CMA is supported by the estimation results of an interest rate adjustment model. Bank lending rates in the LNS countries are assumed to be a linear function of the rates in South Africa over the long run. Any disturbances to this relation would trigger an adjustment process: Rates in the LNS countries would rise (fall) over time should they be lower (higher) than the long-run equilibrium rates. The results, based on quarterly data for 1980-2005, confirm the existence of such a convergence in the CMA interest rate data (Box 3). In sum, the data suggest a high degree of financial market integration in the CMA. In contrast, no such correlations are observed between the interest rates in Botswana and CMA countries, despite the close trade relations between Botswana and South Africa.17
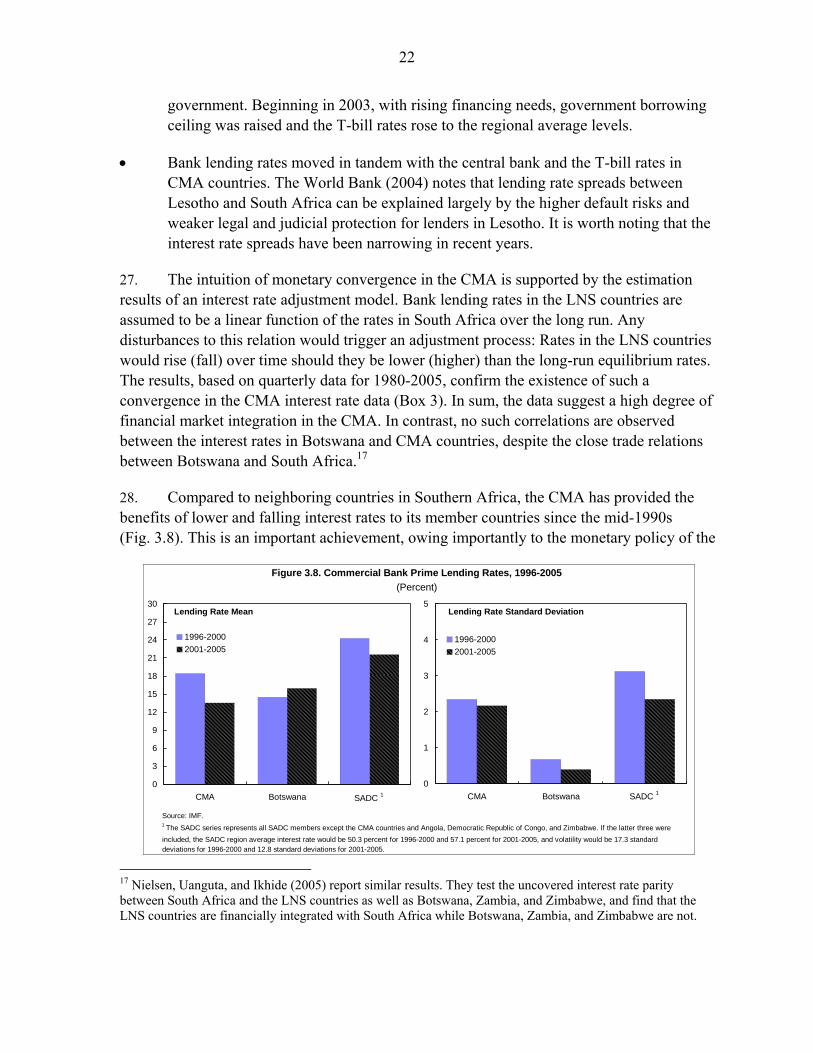
28. Compared to neighboring countries in Southern Africa, the CMA has provided the benefits of lower and falling interest rates to its member countries since the mid-1990s (Fig. 3.8). This is an important achievement, owing importantly to the monetary policy of the
Figure 3.8. Commercial Bank Prime Lending Rates, 1996-2005(Percent)
Source: IMF.1 The SADC series represents all SADC members except the CMA countries and Angola, Democratic Republic of Congo, and Zimbabwe. If the latter three wereincluded, the SADC region average interest rate would be 50.3 percent for 1996-2000 and 57.1 percent for 2001-2005, and volatility would be 17.3 standard deviations for 1996-2000 and 12.8 standard deviations for 2001-2005.
Lending Rate Mean
0
3
6
9
12
15
18
21
24
27
30
CMA Botswana SADC 1/
1996-20002001-2005
SADC 1
Lending Rate Standard Deviation
0
1
2
3
4
5
CMA Botswana SADC 1/
1996-20002001-2005
SADC 1
17 Nielsen, Uanguta, and Ikhide (2005) report similar results. They test the uncovered interest rate parity between South Africa and the LNS countries as well as Botswana, Zambia, and Zimbabwe, and find that the LNS countries are financially integrated with South Africa while Botswana, Zambia, and Zimbabwe are not.
23
SARB. Financial stabilization in South Africa has successfully brought down inflation expectations, contributing to lower interest rates throughout the region.
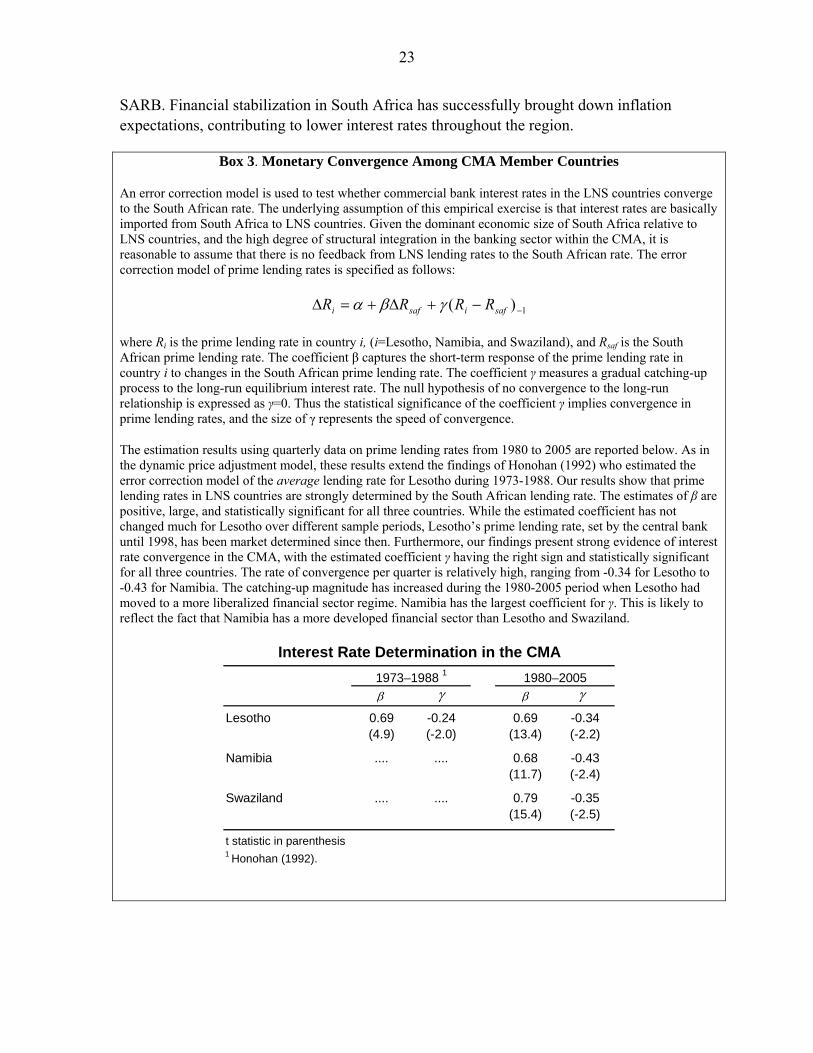
Box 3. Monetary Convergence Among CMA Member Countries
An error correction model is used to test whether commercial bank interest rates in the LNS countries converge to the South African rate. The underlying assumption of this empirical exercise is that interest rates are basically imported from South Africa to LNS countries. Given the dominant economic size of South Africa relative to LNS countries, and the high degree of structural integration in the banking sector within the CMA, it is reasonable to assume that there is no feedback from LNS lending rates to the South African rate. The error correction model of prime lending rates is specified as follows:
1)( −−+Δ+=Δ safisafi RRRR γβα where Ri is the prime lending rate in country i, (i=Lesotho, Namibia, and Swaziland), and Rsaf is the South African prime lending rate. The coefficient β captures the short-term response of the prime lending rate in country i to changes in the South African prime lending rate. The coefficient γ measures a gradual catching-up process to the long-run equilibrium interest rate. The null hypothesis of no convergence to the long-run relationship is expressed as γ=0. Thus the statistical significance of the coefficient γ implies convergence in prime lending rates, and the size of γ represents the speed of convergence.
The estimation results using quarterly data on prime lending rates from 1980 to 2005 are reported below. As in the dynamic price adjustment model, these results extend the findings of Honohan (1992) who estimated the error correction model of the average lending rate for Lesotho during 1973-1988. Our results show that prime lending rates in LNS countries are strongly determined by the South African lending rate. The estimates of β are positive, large, and statistically significant for all three countries. While the estimated coefficient has not changed much for Lesotho over different sample periods, Lesotho’s prime lending rate, set by the central bank until 1998, has been market determined since then. Furthermore, our findings present strong evidence of interest rate convergence in the CMA, with the estimated coefficient γ having the right sign and statistically significant for all three countries. The rate of convergence per quarter is relatively high, ranging from -0.34 for Lesotho to -0.43 for Namibia. The catching-up magnitude has increased during the 1980-2005 period when Lesotho had moved to a more liberalized financial sector regime. Namibia has the largest coefficient for γ. This is likely to reflect the fact that Namibia has a more developed financial sector than Lesotho and Swaziland.
Lesotho 0.69 -0.24 0.69 -0.34(4.9) (-2.0) (13.4) (-2.2)
Namibia .... .... 0.68 -0.43(11.7) (-2.4)
Swaziland .... .... 0.79 -0.35(15.4) (-2.5)
t statistic in parenthesis1 Honohan (1992).
Interest Rate Determination in the CMA1973–1988 1 1980–2005β γ β γ
24
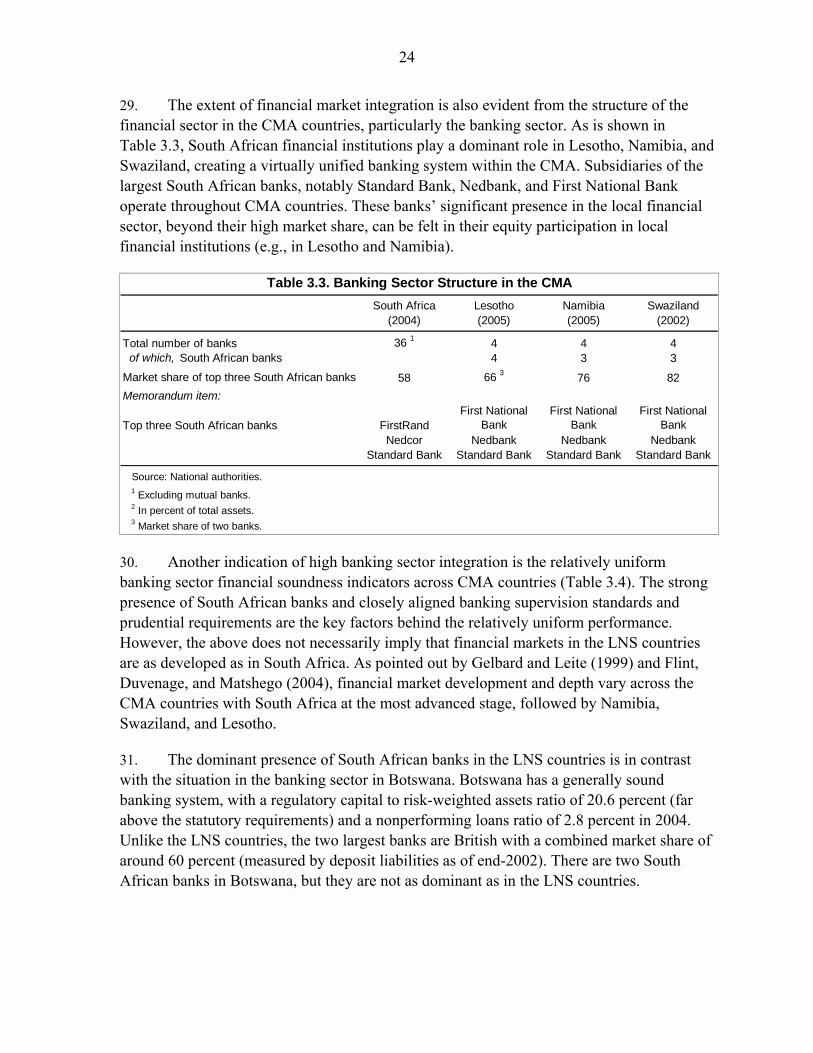
29. The extent of financial market integration is also evident from the structure of the financial sector in the CMA countries, particularly the banking sector. As is shown in Table 3.3, South African financial institutions play a dominant role in Lesotho, Namibia, and Swaziland, creating a virtually unified banking system within the CMA. Subsidiaries of the largest South African banks, notably Standard Bank, Nedbank, and First National Bank operate throughout CMA countries. These banks’ significant presence in the local financial sector, beyond their high market share, can be felt in their equity participation in local financial institutions (e.g., in Lesotho and Namibia).
South Africa Lesotho Namibia Swaziland(2004) (2005) (2005) (2002)
Total number of banks 36 1 4 4 4 of which, South African banks 4 3 3
Market share of top three South African banks 58 66 3 76 82Memorandum item:
Top three South African banks FirstRandFirst National
BankFirst National
BankFirst National
BankNedcor Nedbank Nedbank Nedbank
Standard Bank Standard Bank Standard Bank Standard Bank
Source: National authorities.1 Excluding mutual banks.2 In percent of total assets.3 Market share of two banks.
Table 3.3. Banking Sector Structure in the CMA
30. Another indication of high banking sector integration is the relatively uniform banking sector financial soundness indicators across CMA countries (Table 3.4). The strong presence of South African banks and closely aligned banking supervision standards and prudential requirements are the key factors behind the relatively uniform performance. However, the above does not necessarily imply that financial markets in the LNS countries are as developed as in South Africa. As pointed out by Gelbard and Leite (1999) and Flint, Duvenage, and Matshego (2004), financial market development and depth vary across the CMA countries with South Africa at the most advanced stage, followed by Namibia, Swaziland, and Lesotho.
31. The dominant presence of South African banks in the LNS countries is in contrast with the situation in the banking sector in Botswana. Botswana has a generally sound banking system, with a regulatory capital to risk-weighted assets ratio of 20.6 percent (far above the statutory requirements) and a nonperforming loans ratio of 2.8 percent in 2004. Unlike the LNS countries, the two largest banks are British with a combined market share of around 60 percent (measured by deposit liabilities as of end-2002). There are two South African banks in Botswana, but they are not as dominant as in the LNS countries.

25
South Africa Namibia Swaziland Lesotho(2005) (2004) (2005) (2004)
Capital adequacy Regulatory capital to risk-weighted assets 12.9 15.4 15.0 2 22.0
Asset quality Nonperforming loans to total gross loans 1.8 2.2 2.0 3 1.0
Earnings and profitability Return on assets 1.3 1.7 3.0 3.0 Return on equity 16.9 15.7 20.0 27.0 Non interest expenses to gross income 66.5 61.8 68.0 4 80.0 4
Liquidity Liquid assets to total assets 4.7 10.4 13.0 82.0
Source: National authorities and IMF staff estimates.1 Data are as of March 2005 for South Africa, September 2005 for Swaziland, and December 2004 for Lesotho. 2 Regulatory tier 1 capital to risk-weighted assets.3 Exclude the Swaziland Development and Savings Bank, which is owned by the government and provides commercial and development loans. 4 Total expenses to total income.
Table 3.4. CMA Countries: Selected Banking Sector Indicators, 2004-2005 1
(Percent, unless otherwise indicated)
Wages and the Labor Market
32. Historically, cross-border mobility of labor in the region was extensive (Fig. 3.9). There were no border controls between the small countries (Lesotho and Swaziland) and South Africa before 1963. During the boom of the mining industry in the 1980s, a large number of unskilled and semi-skilled foreign laborers sought employment in South Africa. At the height of foreign worker employment in South Africa’s mining sector, about 150,000 from Lesotho and 20,000 from Swaziland, or about 25 percent and 9 percent of the labor force of the respective country, were employed in South African mines.18 Over the past two decades, mining production processes have become more capital intensive. The restructuring of the mining sector caused the number of employees in the industry to fall by over 50 percent. As demand for unskilled and semi-skilled workers in South Africa fell, the recorded number of Lesotho and Swaziland migrant workers also declined (Fig. 3.10).19 There was no similar trend in Namibia because significant repatriations of migrant workers took place around 1990 when the country gained independence (Crush, 2002).
18 Labor movement from Namibia to South Africa’s mines was not of the same magnitude as Lesotho and Swaziland because Namibia has a large mining sector of its own.
19 The extent to which cross-border labor movement has changed is difficult to quantify precisely because of the lack of reliable data on migrant workers outside the traditional mining sector or employed without a work permit.

26
Source: United Nations (Population Division).1 A negative value represents a net inflow of migrants.2 Data available only from 1965-70 onwards.
Figure 3.9. Small CMA Countries: Number of Migrants (Net), 1950-2005 (Thousands) 1
Lesotho
-20
-10
0
10
20
30
40
50
60
70
80
90
1950-55 55-60 60-65 65-70 70-75 75-80 80-85 85-90 90-95 95-00 00-05
Namibia 2
-80-70-60-50-40-30-20-10
0102030405060708090
1950-55 55-60 60-65 65-70 70-75 75-80 80-85 85-90 90-95 95-00 00-05
Swaziland
-20
-10
0
10
20
30
40
50
60
70
80
90
1950-55 55-60 60-65 65-70 70-75 75-80 80-85 85-90 90-95 95-00 00-05
33. Parallel to the reduction in migrant miners was a steady decline in remittances relative to GDP in both Lesotho and Swaziland.20 At their peak, remittances amounted to approximately 75 percent and 15 percent of GDP in Lesotho and Swaziland respectively. Over the years, these ratios have dropped to the current levels of about 25 percent of GDP in Lesotho and 4 percent of GDP in Swaziland (Fig. 3.11). These data suggest that although remittances as recorded by Lesotho and Swaziland have been on the decline, these receipts remain an important source of income for these countries, especially Lesotho.
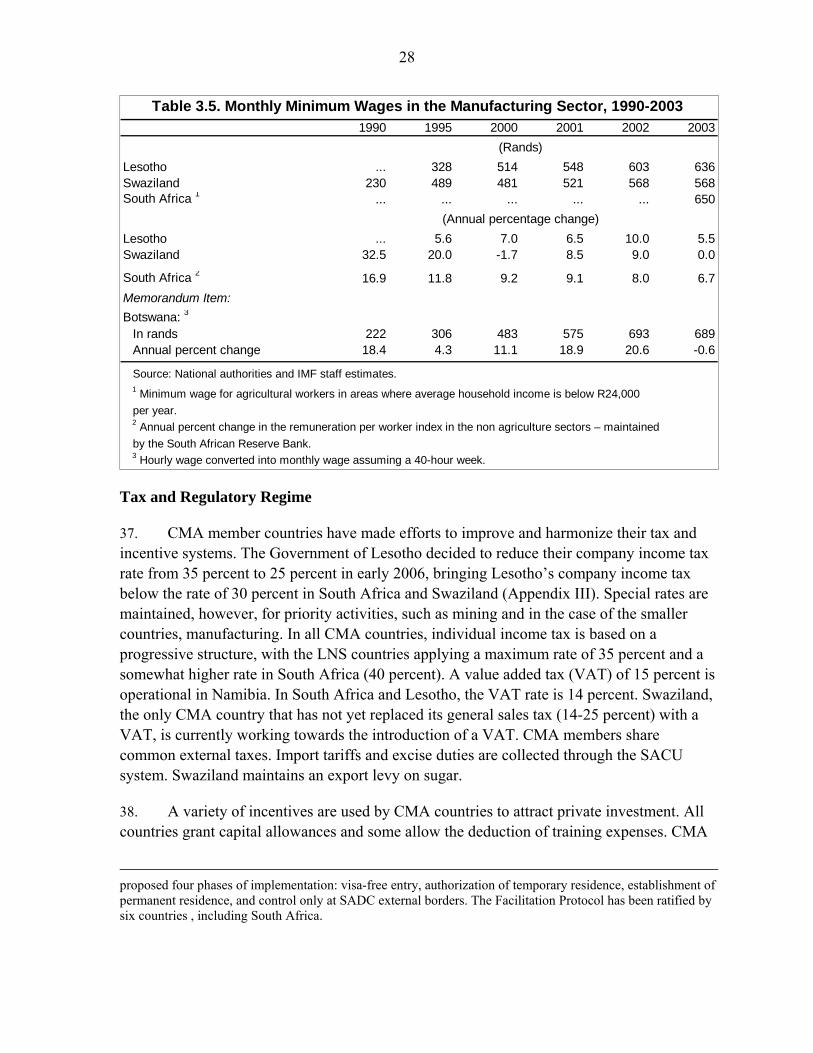
34. Wage data that are available for the region offer indirect evidence on cross-border mobility of unskilled labor (Table 3.5). The analysis of labor mobility is hampered by the scarcity of reliable and comparable wage data. In Lesotho and Swaziland, unskilled workers in the textile sector are typically paid minimum wages. These wages are often the outcome of tripartite-negotiations between labor unions, employers and the government involved. To the extent that these minimum wages are correlated with industry-wide average wages, changes in the minimum wages in Lesotho and Swaziland can be compared to changes in the index of manufacturing sector wage in South Africa. Such a comparison suggests that despite the decline in migrant workers in South Africa’s mining sector, markets
20 Based on statistics compiled by central banks, which may not fully capture remittances from workers outside the mining sector.

27
Source: National authorities.
Source: IMF staff estimates.
Figure 3.11. Lesotho and Swaziland: Remittances, 1990-2004(Percent of GDP)
Figure 3.10. Lesotho: Migrant Workers in South African Mines, 1990-2004 (Thousands of workers)
0
20
40
60
80
100
120
1990 1993 1996 1999 2002 2005
0
10
20
30
40
50
60
70
80
1990 1992 1994 1996 1998 2000 2002 20040
2
4
6
8
10
12
14
16
18Lesotho
Swaziland (right scale)
for unskilled labor are still closely linked in the CMA—wages for unskilled workers tended to move together and their absolute levels are broadly similar in CMA countries.
35. A work permit is required for a LNS worker to be legally employed in South Africa. While the application process for a work permit has stayed much the same, one particular requirement has become significantly harder to fulfill. In order to obtain a work permit in South Africa, a foreign worker has to prove that the job being sought cannot be completed by a South African—a requirement more easily met in the past. Historically, mining companies preferred employing foreign miners because of the skills they possessed.21 But the recent developments in the mining sector have diminished the opportunity to fill a once unique void and it has become more challenging for foreign workers to meet the requirements for a work permit in South Africa, adversely affecting labor mobility.
36. There is anecdotal evidence on the movement of skilled workers from the small countries, particularly Lesotho and Swaziland, to South Africa. The flows may have increased in recent years as growth accelerated in South Africa, in part reflecting changes in South Africa’s immigration policy. The 2002 Immigration Act (as amended in 2004) aims to ease the import of skills from outside the country. South Africa has also ratified a SADC Draft Protocol on the Facilitation of Movement of Persons. The Protocol, once in force, should make it easier for skilled people from the rest of SADC to work in South Africa and vice-versa.22
21 According to Crush et. al (1999), Lesotho workers were known to be skilled shaft sinkers whilst Swazi mine workers were excellent machinists.
22 A draft protocol was proposed to the SADC Council of Ministers 1995 (Free Movement Protocol), which was replaced later by a draft on the facilitation of movements of persons in the SADC (Facilitation Protocol). Both
(continued…)
28
Table 3.5. Monthly Minimum Wages in the Manufacturing Sector, 1990-2003 1990 1995 2000 2001 2002 2003
Lesotho ... 328 514 548 603 636Swaziland 230 489 481 521 568 568South Africa 1 ... ... ... ... ... 650
Lesotho ... 5.6 7.0 6.5 10.0 5.5Swaziland 32.5 20.0 -1.7 8.5 9.0 0.0
South Africa 2 16.9 11.8 9.2 9.1 8.0 6.7Memorandum Item:Botswana: 3
In rands 222 306 483 575 693 689Annual percent change 18.4 4.3 11.1 18.9 20.6 -0.6
Source: National authorities and IMF staff estimates.1 Minimum wage for agricultural workers in areas where average household income is below R24,000 per year.2 Annual percent change in the remuneration per worker index in the non agriculture sectors – maintained by the South African Reserve Bank. 3 Hourly wage converted into monthly wage assuming a 40-hour week.
(Annual percentage change)
(Rands)
Tax and Regulatory Regime
37. CMA member countries have made efforts to improve and harmonize their tax and incentive systems. The Government of Lesotho decided to reduce their company income tax rate from 35 percent to 25 percent in early 2006, bringing Lesotho’s company income tax below the rate of 30 percent in South Africa and Swaziland (Appendix III). Special rates are maintained, however, for priority activities, such as mining and in the case of the smaller countries, manufacturing. In all CMA countries, individual income tax is based on a progressive structure, with the LNS countries applying a maximum rate of 35 percent and a somewhat higher rate in South Africa (40 percent). A value added tax (VAT) of 15 percent is operational in Namibia. In South Africa and Lesotho, the VAT rate is 14 percent. Swaziland, the only CMA country that has not yet replaced its general sales tax (14-25 percent) with a VAT, is currently working towards the introduction of a VAT. CMA members share common external taxes. Import tariffs and excise duties are collected through the SACU system. Swaziland maintains an export levy on sugar.
38. A variety of incentives are used by CMA countries to attract private investment. All countries grant capital allowances and some allow the deduction of training expenses. CMA
proposed four phases of implementation: visa-free entry, authorization of temporary residence, establishment of permanent residence, and control only at SADC external borders. The Facilitation Protocol has been ratified by six countries , including South Africa.

29
Source: National authorities, and IMF staff estimates.
Source: Garment import price index: U.S. Department of Commerce (annual). Sugar index: International Financial Statistics. U.S. dollar based index: Datastream and International Financial Statistics.1 The commodity price index is a weighted index where gold composes 48 percent of the index, platinum 30 percent, and coal 22 percent.
Figure 4.1. CMA: Terms of Trade, 1995-2005(1995=100)
Figure 4.2. Commodity Prices, 1995-2005(1995=100) 1
50
60
70
80
90
100
110
120
130
140
150
1995 1996 1997 1998 1999 2000 2001 2002 2003 2004 2005
Lesotho Namibia
South Africa Swaziland
60
80
100
120
140
160
180
1995 1996 1997 1998 1999 2000 2001 2002 2003 2004 2005
US$ based commodity price index, comprising gold, platinum, and coal
Sugar (European market, c.i.f)
US Garment Import Price Index
countries also provided tax holidays, publicly funded factory shells, and in some cases, “export processing zones” (e.g. in Namibia) for prospective foreign investors. However, in the areas of trade and industrial licensing, customs clearance procedures, and visa requirements and procedures for foreigners, there are various practices, which could be streamlined to further improve the investment climate, especially in the LNS countries.23
IV. SHOCKS AND ADJUSTMENT
39. The net gains of a monetary union to its membership depend importantly on how well the member countries adjust to external shocks. Key factors affecting the adjustment process include whether the shocks have a symmetric or asymmetric impact on the member countries and whether the policy and institutional framework of the monetary union helps cushion the impact of asymmetric shocks and facilitates adjustment. This chapter examines these issues in light of the CMA’s experience. Particular attention is paid to the period since the end of apartheid in South Africa, which led to significant changes in CMA member countries’ external trade and capital flows.
Are Shocks Asymmetric?
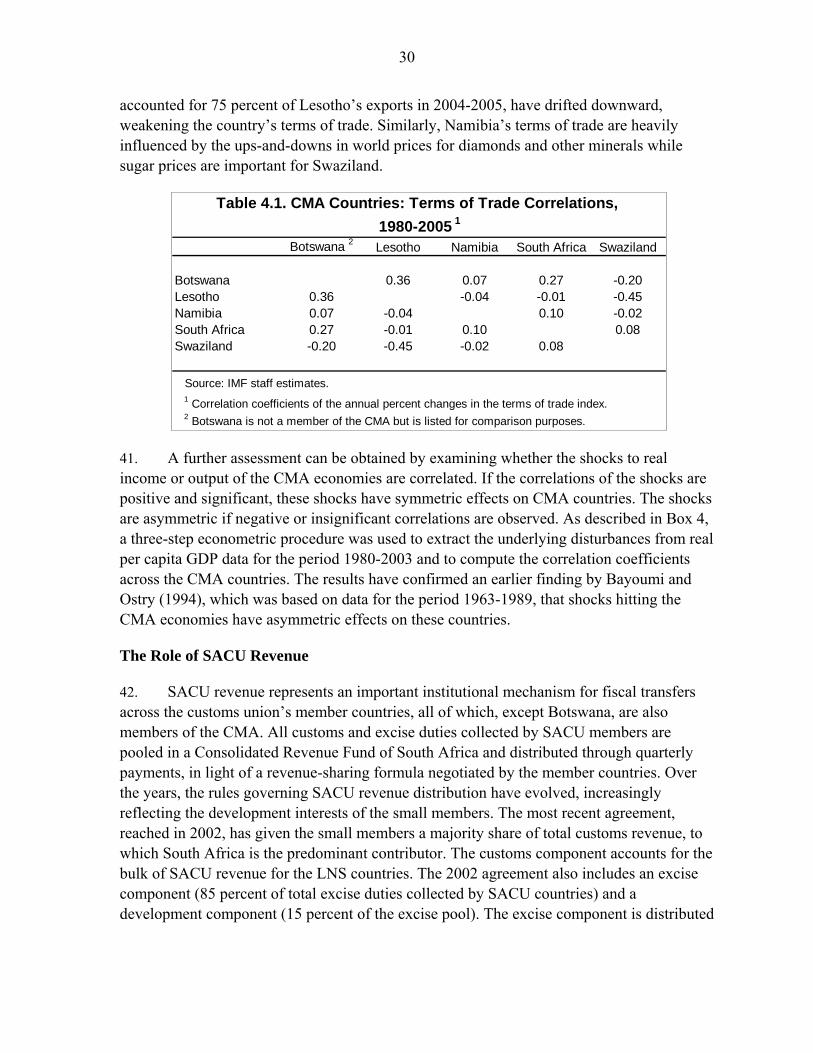
40. Available data suggest that shocks to the terms of trade of the CMA countries are not well correlated (Table 4.1 and Fig. 4.1). This asymmetry reflects in large part differences in the composition of CMA countries’ exports and the fact that the world prices of various commodities do not move together. Most notably, world market prices for gold, platinum, iron ore and related products, which accounted for some 60 percent of South Africa’s exports in 2004, have surged since the late 1990s (Fig. 4.2). During the same period, prices of textile products, which 23 See World Bank (2005) and USAID (2005).
30
accounted for 75 percent of Lesotho’s exports in 2004-2005, have drifted downward, weakening the country’s terms of trade. Similarly, Namibia’s terms of trade are heavily influenced by the ups-and-downs in world prices for diamonds and other minerals while sugar prices are important for Swaziland.
Table 4.1. CMA Countries: Terms of Trade Correlations, 1980-2005 1
Botswana 2 Lesotho Namibia South Africa Swaziland
Botswana 0.36 0.07 0.27 -0.20Lesotho 0.36 -0.04 -0.01 -0.45Namibia 0.07 -0.04 0.10 -0.02South Africa 0.27 -0.01 0.10 0.08Swaziland -0.20 -0.45 -0.02 0.08
Source: IMF staff estimates.1 Correlation coefficients of the annual percent changes in the terms of trade index.2 Botswana is not a member of the CMA but is listed for comparison purposes.
41. A further assessment can be obtained by examining whether the shocks to real income or output of the CMA economies are correlated. If the correlations of the shocks are positive and significant, these shocks have symmetric effects on CMA countries. The shocks are asymmetric if negative or insignificant correlations are observed. As described in Box 4, a three-step econometric procedure was used to extract the underlying disturbances from real per capita GDP data for the period 1980-2003 and to compute the correlation coefficients across the CMA countries. The results have confirmed an earlier finding by Bayoumi and Ostry (1994), which was based on data for the period 1963-1989, that shocks hitting the CMA economies have asymmetric effects on these countries.
The Role of SACU Revenue
42. SACU revenue represents an important institutional mechanism for fiscal transfers across the customs union’s member countries, all of which, except Botswana, are also members of the CMA. All customs and excise duties collected by SACU members are pooled in a Consolidated Revenue Fund of South Africa and distributed through quarterly payments, in light of a revenue-sharing formula negotiated by the member countries. Over the years, the rules governing SACU revenue distribution have evolved, increasingly reflecting the development interests of the small members. The most recent agreement, reached in 2002, has given the small members a majority share of total customs revenue, to which South Africa is the predominant contributor. The customs component accounts for the bulk of SACU revenue for the LNS countries. The 2002 agreement also includes an excise component (85 percent of total excise duties collected by SACU countries) and a development component (15 percent of the excise pool). The excise component is distributed

31
Box 4. Are Shocks to Real Output in CMA Symmetric?
Studies of shocks to African economies have examined a number of variables including GDP growth, inflation, exchange rates, interest rates, and structural factors (e.g., Elbadawi and Majd, 1992, and Fielding, Lee, and Shields, 2004). The approach employed below, following Bayoumi and Ostry (1994), focuses on the extent to which shocks to real output per capita are correlated among countries of the CMA.
A three-step procedure is followed: First, a unit root (Augmented Dickey Fuller) test is carried out on the time series data of the natural log of per capita real GDP of the four CMA countries covering the period 1980-2003. It is found that the data are integrated of order 1 (I(1)). This step helps inform that the next step should use data of first differences, selected based on standard lag tests. Second, a regression on the first differences of the per capita GDP data is undertaken to extract the underlying disturbances or shocks from the data using the following equation:
∑=
− +Δ+=Δn
ititit L
YLY
10 )()( μββ (1)
where Y/L is real income per capita at period t, and tμ is an error term that captures the deviations of real GDP per capita from its long-run trend. Using the estimated coefficients, a time series of tμ is derived by subtracting the observations of per capita GDP from the estimated long-run trend:
ttt LY
LY )()( * Δ−Δ=μ (2)
The last step is to compute the correlation coefficients of the time series of the residuals obtained from each regression. If the correlation is positive and significant (with computed asymptotic standard error at 0.23), the shocks are symmetric, and if it is negative and/or statistically insignificant, they are asymmetric. The results, shown in the table below, confirm that shocks to the CMA countries are asymmetric.
Lesotho Namibia South Africa Swaziland
Lesotho 1.00Namibia -0.08 1.00South Africa 0.09 0.08 1.00Swaziland -0.05 -0.18 -0.46 1.00
CMA Countries: Correlation of Underlying Disturbances, 1980-2003
32
Source: National authorities, and IMF staff estimates.1 SACU revenues are reported on a fiscal year basis; real GDP growth is calendar year.
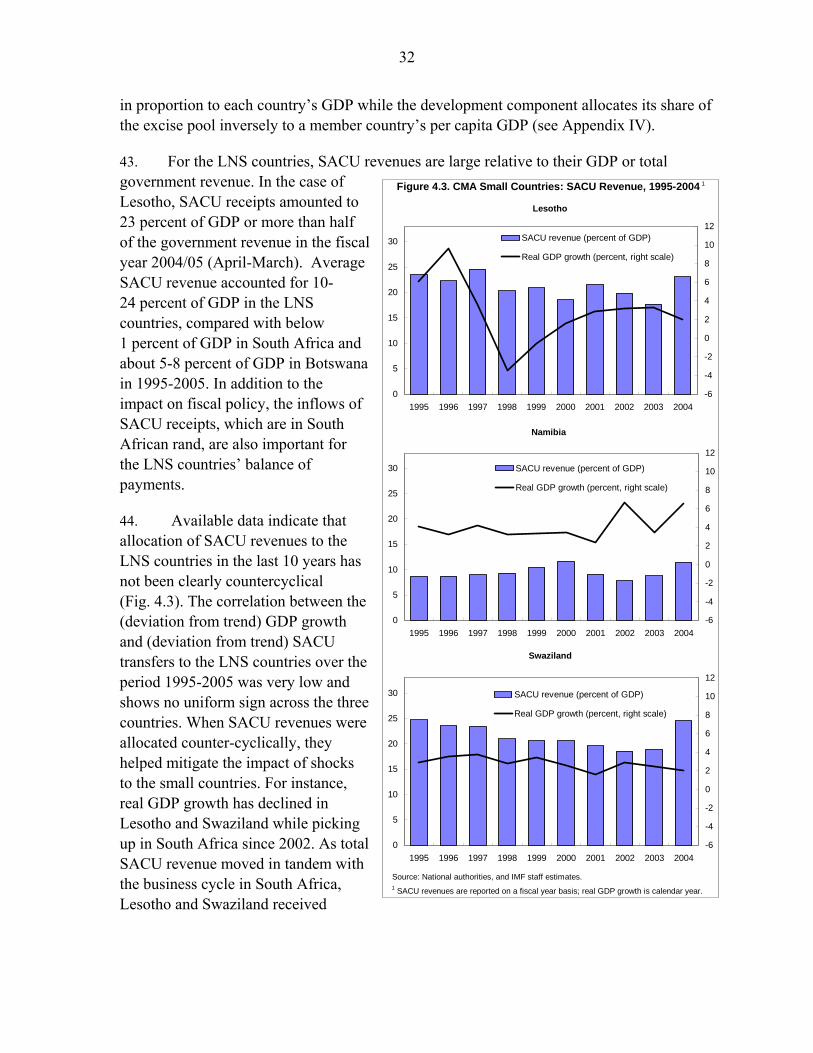
Figure 4.3. CMA Small Countries: SACU Revenue, 1995-2004 1
0
5
10
15
20
25
30
1995 1996 1997 1998 1999 2000 2001 2002 2003 2004-6
-4
-2
0
2
4
6
8
10
12SACU revenue (percent of GDP)
Real GDP growth (percent, right scale)
Lesotho
0
5
10
15
20
25
30
1995 1996 1997 1998 1999 2000 2001 2002 2003 2004-6
-4
-2
0
2
4
6
8
10
12
SACU revenue (percent of GDP)
Real GDP growth (percent, right scale)
Namibia
0
5
10
15
20
25
30
1995 1996 1997 1998 1999 2000 2001 2002 2003 2004-6
-4
-2
0
2
4
6
8
10
12
SACU revenue (percent of GDP)
Real GDP growth (percent, right scale)
Swaziland
in proportion to each country’s GDP while the development component allocates its share of the excise pool inversely to a member country’s per capita GDP (see Appendix IV).
43. For the LNS countries, SACU revenues are large relative to their GDP or total government revenue. In the case of Lesotho, SACU receipts amounted to 23 percent of GDP or more than half of the government revenue in the fiscal year 2004/05 (April-March). Average SACU revenue accounted for 10-24 percent of GDP in the LNS countries, compared with below 1 percent of GDP in South Africa and about 5-8 percent of GDP in Botswana in 1995-2005. In addition to the impact on fiscal policy, the inflows of SACU receipts, which are in South African rand, are also important for the LNS countries’ balance of payments.
44. Available data indicate that allocation of SACU revenues to the LNS countries in the last 10 years has not been clearly countercyclical (Fig. 4.3). The correlation between the (deviation from trend) GDP growth and (deviation from trend) SACU transfers to the LNS countries over the period 1995-2005 was very low and shows no uniform sign across the three countries. When SACU revenues were allocated counter-cyclically, they helped mitigate the impact of shocks to the small countries. For instance, real GDP growth has declined in Lesotho and Swaziland while picking up in South Africa since 2002. As total SACU revenue moved in tandem with the business cycle in South Africa, Lesotho and Swaziland received
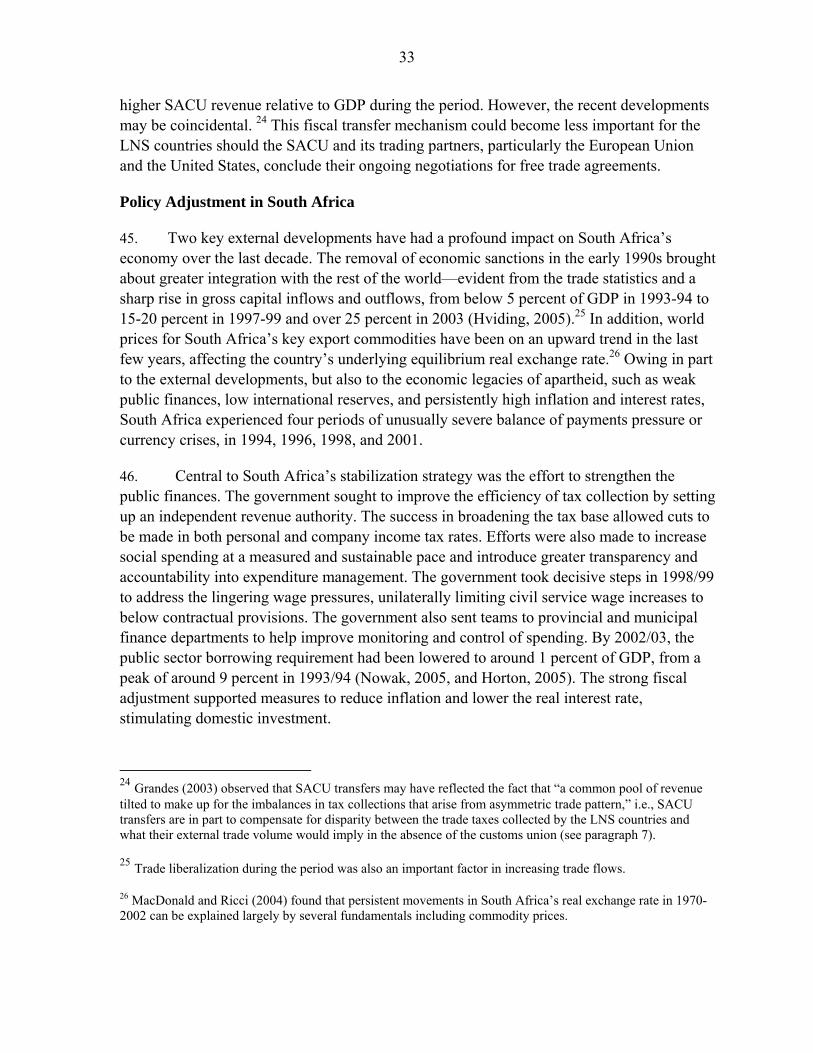
33
higher SACU revenue relative to GDP during the period. However, the recent developments may be coincidental. 24 This fiscal transfer mechanism could become less important for the LNS countries should the SACU and its trading partners, particularly the European Union and the United States, conclude their ongoing negotiations for free trade agreements.
Policy Adjustment in South Africa
45. Two key external developments have had a profound impact on South Africa’s economy over the last decade. The removal of economic sanctions in the early 1990s brought about greater integration with the rest of the world—evident from the trade statistics and a sharp rise in gross capital inflows and outflows, from below 5 percent of GDP in 1993-94 to 15-20 percent in 1997-99 and over 25 percent in 2003 (Hviding, 2005).25 In addition, world prices for South Africa’s key export commodities have been on an upward trend in the last few years, affecting the country’s underlying equilibrium real exchange rate.26 Owing in part to the external developments, but also to the economic legacies of apartheid, such as weak public finances, low international reserves, and persistently high inflation and interest rates, South Africa experienced four periods of unusually severe balance of payments pressure or currency crises, in 1994, 1996, 1998, and 2001.
46. Central to South Africa’s stabilization strategy was the effort to strengthen the public finances. The government sought to improve the efficiency of tax collection by setting up an independent revenue authority. The success in broadening the tax base allowed cuts to be made in both personal and company income tax rates. Efforts were also made to increase social spending at a measured and sustainable pace and introduce greater transparency and accountability into expenditure management. The government took decisive steps in 1998/99 to address the lingering wage pressures, unilaterally limiting civil service wage increases to below contractual provisions. The government also sent teams to provincial and municipal finance departments to help improve monitoring and control of spending. By 2002/03, the public sector borrowing requirement had been lowered to around 1 percent of GDP, from a peak of around 9 percent in 1993/94 (Nowak, 2005, and Horton, 2005). The strong fiscal adjustment supported measures to reduce inflation and lower the real interest rate, stimulating domestic investment.
24 Grandes (2003) observed that SACU transfers may have reflected the fact that “a common pool of revenue tilted to make up for the imbalances in tax collections that arise from asymmetric trade pattern,” i.e., SACU transfers are in part to compensate for disparity between the trade taxes collected by the LNS countries and what their external trade volume would imply in the absence of the customs union (see paragraph 7).
25 Trade liberalization during the period was also an important factor in increasing trade flows. 26 MacDonald and Ricci (2004) found that persistent movements in South Africa’s real exchange rate in 1970-2002 can be explained largely by several fundamentals including commodity prices.
34
47. The South African Reserve Bank over the past decade has moved from a pegged exchange rate to a monetary policy based on inflation targeting and a free float of the rand. To bolster the credibility of monetary policy and anchor inflation expectations, an inflation target of 3 to 6 percent was announced in 2000, which was to be achieved in 2002. Contrary to the repeated interventions in the foreign exchange market financed by short-term borrowing in earlier currency crises, in dealing with the heavy exchange rate pressures in 2001, the SARB let the exchange rate adjust. It did not sell foreign currency, confining itself to foreign exchange purchases to wind down the SARB’s open forward position (in effect, exposure to exchange rate risks), and once this was achieved, started to rebuild international reserves (Aron and Muellbauer, 2004, Bhundia and Ricci, 2005).27
48. Exchange rate flexibility has served South Africa well. A more flexible exchange rate helped South Africa to cope with terms of trade changes and strong capital inflows in recent years and allowed monetary policy successfully to focus on inflation under an inflation targeting framework. The rand appreciated vis-à-vis the US dollar in 2002-2004, inflation was well within the 3-6 percent target band, the Johannesburg stock exchange soared, and notwithstanding higher exchange rate volatility than in the early 1990s, South Africa’s exports and real GDP grew strongly.28 Official reserves, as a ratio to short-term debt, rose from 25 percent at end-1998 to around 180 percent by mid-2005. The strengthened reserve position boosted confidence in the government’s economic policies, lowered the spread on long-term debt, and helped reduce the country’s vulnerability to external shocks.
Policy Adjustment in Small CMA Countries
49. The small CMA countries have faced various shocks over the past decade. As all three small member countries peg their currency to the rand at par and a significant part of their exports are to markets outside the CMA, movements of the rand exchange rate have had a major impact on these countries’ external competitiveness. During 2002-2004, the nominal appreciation of the rand against the US dollar was about 40 percent, resulting in a 13-25 percent real effective appreciation in the LNS countries. However, reflecting the different production and trade structures, terms of trade movements varied. Moreover, these countries have had to cope with other shocks, such as the persistent drought that has affected both Lesotho and Swaziland in recent years. With the CMA providing a common framework for monetary and exchange rate policies, fiscal policy is the main tool for macroeconomic stabilization in the small CMA countries. These countries also have to rely heavily on structural reforms to improve external competitiveness and achieve sustainable growth. 27 The open forward position of the SARB is the bank’s short-term forward foreign exchange liabilities that exceed its gross foreign reserves.
28 A more recent empirical study (Harjes and Shirono, 2006) found no statistically significant adverse effect of exchange rate volatility, measured as the standard deviation of monthly changes in the real effective exchange rate, on trade in South African data.

35
Source: National authorities, and Fund staff estimates and projections.1 For 2003/04–2005/06 Swaziland government debt includes domestic payment arrears.
Fiscal Balance(Percent of GDP)
-10
-5
0
5
10
2001/02 2002/03 2003/04 2004/05 2005/06
Official Reserves(Months of imports)
012345678
2001/02 2002/03 2003/04 2004/05 2005/06
Government Debt(Percent of GDP) 1
020406080
100120140
2001/02 2002/03 2003/04 2004/05 2005/06
Figure 4.4. Small CMA Countries: Selected Economic Indicators, 2001/02-2005/06
-2
0
2
4
6
8
Lesotho Namibia Swaziland South Africa
2001 2002 2003 2004 2005
Real GDP Growth(Percent)
50. In the case of Lesotho, multiple shocks, including a sharp drop in workers’ remittances relative to GDP due to the decline in mining jobs in South Africa, weakened economic performance in 1996-2000. Without a large investment from South Africa in the Lesotho Highlands Water Project, which partially offset the adverse impact of the shocks, output decline would have been steeper. Since 2000, garment exports, mostly to the United States under the US African Growth and Opportunity Act, had become the main engine of growth and accounted for about 70 percent of total exports in 2002-2004. However, the real exchange rate appreciation in 2002-2004 and the elimination of textile quotas by industrial countries in January 2005 battered manufacturing (including garments) and related activities. The effects of these shocks were particularly pronounced in the garment sector in the second half of 2004/05, resulting in factory closures and the loss of about 20 percent of jobs in the sector. At the same time, agricultural output had declined, as a result of a three-year drought and such long-standing structural weaknesses as soil erosion, water shortages in the lowlands, and a lack of agro-financing.
51. In response to the severe shocks to its textile sector, Lesotho implemented a prudent fiscal policy. Domestic (non-SACU) revenue collection improved with the launch of the Lesotho Revenue Authority, despite the slowdown in economic activity.29 Current expenditures,
29 Domestic tax revenue relative to GDP rose from 14.6 percent in 2002/03 to 17.8 percent in 2003/04. The decline in 2004/05 as shown in Fig. 4.5 was due mainly to the external shocks.
36
particularly salaries and wages, were contained. Upon receiving additional SACU revenues in 2004/05-2005/06, the government saved part of the receipts and prepaid high interest external debt. The overall fiscal balance (including grants) has been in surplus in the last three years since 2003/04 (Fig. 4.4, and 4.5). With the strengthening of the country’s fiscal position, the government reduced the public debt-to-GDP ratio, and the country has maintained a relatively high level of international reserves, equivalent to over four months of imports as of end-2005/06.
Source: National authorities and IMF staff estimates.
(Percent of GDP)Figure 4.5. CMA Countries: Selected Fiscal Indicators, 2003/04-2004/05
Domestic Revenue
0
5
10
15
20
25
30
35
40
Lesotho Namibia South Africa Swaziland
2003/04 2004/05
Wage Bill
0
2
4
6
8
10
12
14
16
18
20
Lesotho Namibia South Africa Swaziland
Current Expenditure
0
5
10
15
20
25
30
35
40
Lesotho Namibia South Africa Swaziland
Capital Expenditure
0
2
4
6
8
10
12
14
16
18
20
Lesotho Namibia South Africa Swaziland
52. Swaziland has encountered particular challenges since the mid-1990s. During the 1980s, Swaziland’s location, infrastructure, and agro-processing businesses made it an attractive place for foreign investors who wanted to produce for the South Africa market but did not want to invest in South Africa itself. When South Africa democratized in 1994, Swaziland lost part of its attractiveness. As foreign direct investment inflows declined, real GDP growth fell from 3.6 percent in the 1990s to just over 2 percent since 2000. In the last several years, a prolonged drought affected agricultural output. The real appreciation of the lilangeni since 2002 hurt Swaziland’s main exports (sugar, wood pulp, and garments) and manufacturing activities. In addition, the removal of the textile quotas by industrial countries since January 2005 has led to significant job losses in the garment sector.
53. Compared to the other small CMA countries that have faced similar or more severe exogenous shocks, Swaziland is lagging behind in adjustment and output recovery. Despite large additional SACU revenues, the overall fiscal deficit widened in 2004/05-2005/06,

37
driven by sharp increases in the wage bill and other spending. The government wage bill increased by almost 4 percentage points of GDP between 2003/04 and 2005/06. The deficits were financed by running down external reserves and accumulating domestic arrears. In the face of shocks to exports and strong pressure to finance the fiscal deficit, gross international reserves declined from 2.7 months of imports at end-2002 to 1.1 months at end-2005, the lowest level among CMA members. Other reserve adequacy indicators such as the ratio to short-term debt or to broad money have also deteriorated. Real GDP growth has continued to weaken, further diverging from that in South Africa, the engine of growth in the region.
54. As for Namibia, the appreciation of the Namibia dollar, in tandem with the rand, hit the fishing and commercial agriculture sectors. But the negative effect on the economy appeared to have been offset by strong growth in the production and exports of diamonds and other minerals, which accounted for about 60 percent of total exports in 2004-05. Nevertheless the deterioration of the terms of trade in 2003 lowered GDP growth and government revenue, contributing to a widening of the fiscal deficit. The resulting worsening of the government’s net position at the central bank led to a decline in official reserves (Fig. 4.6).
Source: National authorities, and IMF staff estimates.
Figure 4.6. Swaziland and Namibia: Central Bank Net Domestic Assets and Foreign Reserves, 2001-2005(Billions of rand)
Swaziland
0.0
0.5
1.0
1.5
2.0
2.5
3.0
3.5
4.0
2001 2002 2003 2004 2005-2.5
-2.0
-1.5
-1.0
-0.5
0.0
0.5
1.0
1.5Net foreign assets
Net government position at the CBS (right
Namibia
0.0
0.5
1.0
1.5
2.0
2.5
3.0
3.5
4.0
2001 2002 2003 2004 2005-2.5
-2.0
-1.5
-1.0
-0.5
0.0
0.5
1.0
1.5Net foreign assetsNet government position at the BON (right scale) BON net credit to banks (right scale)
55. In the following years, with a large windfall in SACU receipts and increased diamonds royalties, the Namibian government sharply reduced its fiscal deficit. The deficit fell by close to 7 percentage points of GDP in two years to about 0.8 percent of GDP in 2005/06. Between end-2002 and end-2005, the central bank acquired domestic assets by extending credits to commercial banks at a pace faster than the increase in the monetary base. Namibia has enjoyed record exports, strong external current account surpluses, and moderate inflation. However, continued outflows of capital to South African financial markets have kept international reserves low. While reserves were larger than the monetary base, they were
38
low relative to imports and short-term debt. The import cover of official reserves declined between 2002-2004 and remained below two months of imports by end-2005.30
V. KEY POLICY CHALLENGES AND ISSUES
Do the LNS Countries Benefit from the CMA?
56. The analysis and evidence presented in the preceding chapter suggest that external shocks often have asymmetric effects on CMA member countries. This raises the question whether the LNS countries have benefited from the CMA. Available data over the last two decades indicate strong benefits of the CMA. The CMA facilitates cross-border trade and capital flows, provides a framework for monetary policy, and helps maintain price stability. The policy credibility of the SARB has a positive spillover effect, lowering inflation expectations in the LNS countries. A credible link of the LNS countries’ currencies to the South African rand thus serves as a bedrock for financial stability in these countries.
Other Lessons of the CMA Experience
57. The CMA experience also suggests a number of policy lessons:
• The existing CMA arrangements provide incentives, but no assurances, for fiscal discipline. The CMA has sustained so far without any limits on fiscal deficits in part because the LNS governments have no access to SARB monetary financing. Budgetary recourse to the central bank in the LNS countries is also restrained by the requirement that all national currency issued by the central bank be fully backed by foreign exchange reserves. Despite these arrangements, however, unsustainable fiscal trends could develop and member countries could embark on a very different adjustment path in response to shocks.
• Under the current exchange rate arrangement, fiscal deficits financed primarily by domestic borrowing carry the risk of worsening the international reserve position in small member countries. This is because a significant part of official reserves in small CMA countries has a counterpart in government deposits, and domestic financing of the fiscal deficit could lead to a rise in the net domestic assets of the central bank that cannot be accommodated by domestic money demand. Moreover, the import propensity of spending in small CMA countries is high.
30 The 2005 and 2006 IMF staff reports on the Namibian economy encouraged the Namibian authorities to strengthen their international reserve positions through appropriate macroeconomic policies and market-based strategies. The latter include promotion of asset securitization, open-market purchases of foreign exchange, and if need be, creating a positive interest rate differential vis-à-vis South Africa.

39
• Under the CMA, member countries other than South Africa do not have an independent monetary policy. Demand for their national currencies depends importantly on the public’s confidence in the exchange rate parity arrangement. Domestic money demand in nominal terms in the LNS countries may grow at a pace reflecting the fact that price levels and interest rates are influenced mainly by monetary developments in South Africa, rather than by local currency money supply. Containing their central banks’ net domestic assets, including credits to the private sector, is essential to ensure that domestic money supply is in line with money demand, not putting pressures on official reserves. Low reserves could undermine the exchange rate peg and hence the benefits arising from the fixed exchange rate system.
• The monetary arrangement of the CMA by itself does not lead to higher growth performance. Growth performance could diverge as a result of asymmetric shocks and country specific structural weaknesses. Economic growth in the small member countries requires reforms to remove structural impediments.
Key Policy Challenges
58. The main lessons summarized above suggest that maintaining adequate reserves is a challenge to policy makers in the small member countries under the current CMA arrangements. Relying solely on reserve coverage of base money is not adequate for judging reserve adequacy in the CMA context. In recent years, Lesotho has been generally prudent in managing its domestic assets and has maintained a relatively high level of international reserves. But in Swaziland, large fiscal deficits, financed mostly by domestic borrowing, had led to a decline in international reserves (Fig. 4.6. and Box 5). In the case of Namibia, despite large external current account surpluses, continued outflows of capital to South African financial markets have kept official reserves low relative to imports and short-term debt. Recent studies on financial crises, including the breakdown of currency board systems, have emphasized the use of reserve coverage of short-term debt and monetary aggregates, such as broad money, in conjunction with the import coverage of reserves, as the key indicators for assessing reserve adequacy. In addition to the comparison with certain benchmarks, such as 100 percent of reserve coverage of short-term debt and three months of import cover, this assessment will have to be made taking into account a country’s fiscal and debt sustainability. Maintaining adequate reserves requires a prudent fiscal policy (Box 5).
59. Against the backdrop of a likely persistent and volatile increase in world demand for commodities and continued downward pressures on the prices of labor-intensive manufacturing products, external shocks to CMA member countries would remain asymmetric in the period ahead. While a more flexible exchange rate has served South Africa well, the small CMA countries have not benefited equally from the flexibility of the rand. Thus the challenge to policy makers in the CMA is to take the necessary steps, under the new circumstances, to help member countries minimize their adjustment costs, ensuring
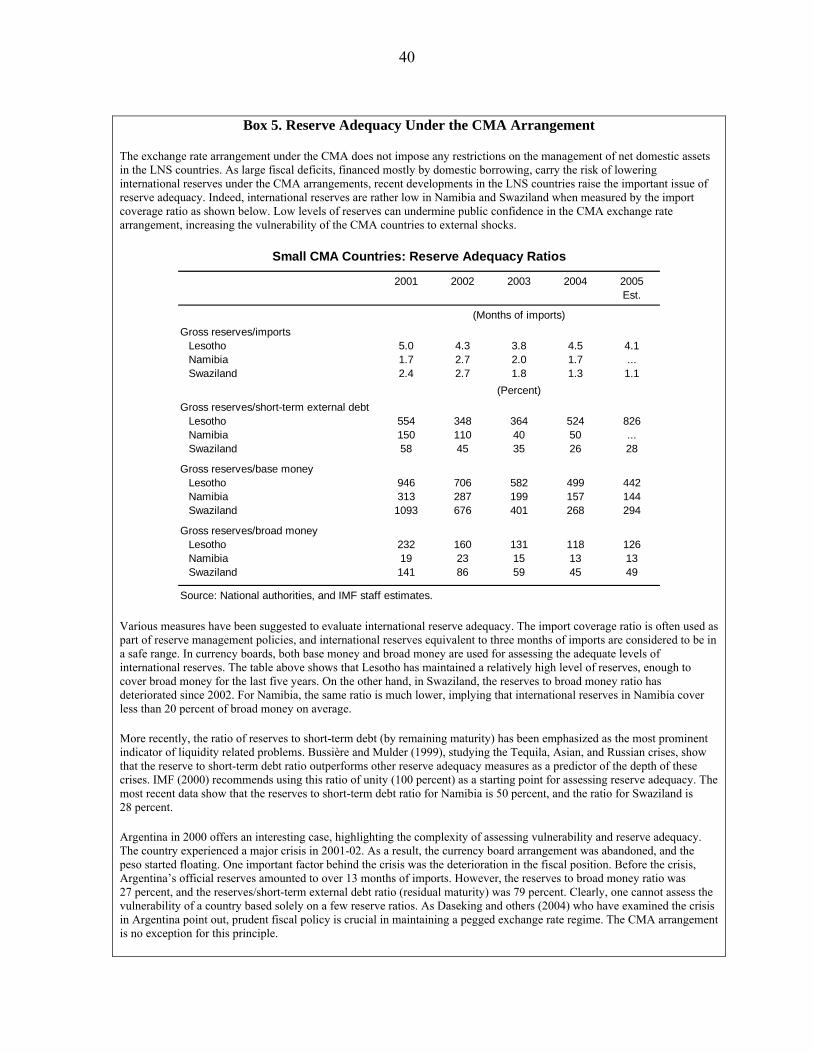
40
Box 5. Reserve Adequacy Under the CMA Arrangement
The exchange rate arrangement under the CMA does not impose any restrictions on the management of net domestic assets in the LNS countries. As large fiscal deficits, financed mostly by domestic borrowing, carry the risk of lowering international reserves under the CMA arrangements, recent developments in the LNS countries raise the important issue of reserve adequacy. Indeed, international reserves are rather low in Namibia and Swaziland when measured by the import coverage ratio as shown below. Low levels of reserves can undermine public confidence in the CMA exchange rate arrangement, increasing the vulnerability of the CMA countries to external shocks.
2001 2002 2003 2004 2005Est.
Gross reserves/importsLesotho 5.0 4.3 3.8 4.5 4.1Namibia 1.7 2.7 2.0 1.7 ...Swaziland 2.4 2.7 1.8 1.3 1.1
Gross reserves/short-term external debtLesotho 554 348 364 524 826Namibia 150 110 40 50 ...Swaziland 58 45 35 26 28
Gross reserves/base moneyLesotho 946 706 582 499 442Namibia 313 287 199 157 144Swaziland 1093 676 401 268 294
Gross reserves/broad moneyLesotho 232 160 131 118 126Namibia 19 23 15 13 13Swaziland 141 86 59 45 49
Source: National authorities, and IMF staff estimates.
Small CMA Countries: Reserve Adequacy Ratios
(Percent)
(Months of imports)
Various measures have been suggested to evaluate international reserve adequacy. The import coverage ratio is often used as part of reserve management policies, and international reserves equivalent to three months of imports are considered to be in a safe range. In currency boards, both base money and broad money are used for assessing the adequate levels of international reserves. The table above shows that Lesotho has maintained a relatively high level of reserves, enough to cover broad money for the last five years. On the other hand, in Swaziland, the reserves to broad money ratio has deteriorated since 2002. For Namibia, the same ratio is much lower, implying that international reserves in Namibia cover less than 20 percent of broad money on average.
More recently, the ratio of reserves to short-term debt (by remaining maturity) has been emphasized as the most prominent indicator of liquidity related problems. Bussière and Mulder (1999), studying the Tequila, Asian, and Russian crises, show that the reserve to short-term debt ratio outperforms other reserve adequacy measures as a predictor of the depth of these crises. IMF (2000) recommends using this ratio of unity (100 percent) as a starting point for assessing reserve adequacy. The most recent data show that the reserves to short-term debt ratio for Namibia is 50 percent, and the ratio for Swaziland is 28 percent.
Argentina in 2000 offers an interesting case, highlighting the complexity of assessing vulnerability and reserve adequacy. The country experienced a major crisis in 2001-02. As a result, the currency board arrangement was abandoned, and the peso started floating. One important factor behind the crisis was the deterioration in the fiscal position. Before the crisis, Argentina’s official reserves amounted to over 13 months of imports. However, the reserves to broad money ratio was 27 percent, and the reserves/short-term external debt ratio (residual maturity) was 79 percent. Clearly, one cannot assess the vulnerability of a country based solely on a few reserve ratios. As Daseking and others (2004) who have examined the crisis in Argentina point out, prudent fiscal policy is crucial in maintaining a pegged exchange rate regime. The CMA arrangement is no exception for this principle.

41
“sustained economic development of the CMA as a whole” and “equitable benefits” to all CMA members.
60. Further developments in regional trade and financial integration, including in the context of the SADC, would change the environment in which the CMA operates, entailing possible modifications of the institutional and policy arrangements of the CMA.
Issues Facing the CMA Countries
61. CMA countries are facing a number of issues and policy options as they strive to achieve higher economic growth. The discussion below, in part reflecting the ongoing developments and debate in the region, highlights the key economic and non-economic considerations in assessing these issues.
(i) Consultations on monetary and exchange rate policies under the existing arrangements. At present, the LNS countries essentially import monetary and exchange rate policies from South Africa. Although the governors of CMA central banks meet three or four time per year, right before the SARB’s Monetary Policy Committee meetings, the LNS countries have no formal role in the formulation of the monetary and exchange rate policies that affect their countries. However, it is not clear that there would be a net benefit, and it may not be easy to give the small countries greater voice or attach heavier weight to their adjustment and growth interests in the decision making process—such as granting the LNS countries a formal role in the SARB monetary policy deliberation—given the existing institutional arrangements. Moreover, enhancing the level of consultation under the existing arrangements has limitations in dealing with severe asymmetric shocks. When the economic interests of the predominant country and smaller countries diverge, the former, by virtue of its size under a weighted voting structure, would ultimately prevail in monetary and exchange rate policy setting.
(ii) Regional mechanisms to facilitate fiscal adjustment and structural reforms. Close macroeconomic policy coordination is at the core of most existing monetary unions. Indeed, because maintaining a sustainable fiscal position is so crucial for the success of a monetary union, explicit ceilings on fiscal deficits and total government debt are often set as convergence criteria for new entrants or as part of a fiscal code of conduct for the membership.31 In the CMA, explicit limits on fiscal deficit and public debt have not been used so far. However, as asymmetric shocks are getting more severe, the disadvantages of the lack of regional surveillance on fiscal, as well as structural policies, become more apparent.
31 For instance, budgetary convergence criteria in the European Union (EU) specify an overall fiscal deficit and total public debt of no more than 3 percent of GDP and 60 percent of GDP respectively. The WAEMU requires the basic fiscal balances, defined as fiscal revenue minus expenditure and excluding both grants and foreign financed investment to be positive or nil, and the ratio of overall public debt to GDP to be no more than 70 percent.

42
Under the current arrangements, unsustainable fiscal policy could lead to large loss of reserves, a break of the exchange rate peg, and possibly financial turmoil in the small member countries. While the negative spillover effect of a crisis in a small country could be limited, the lack of fiscal adjustment and reforms could prolong economic stagnation and enlarge the income gaps between the member countries, ultimately affecting the viability and effectiveness of the CMA. The experience of other monetary unions (e.g., the Euro area) shows that a rule-based fiscal framework could be an effective discipline device, especially in small member countries that are subject to greater macroeconomic volatility.32 Such a framework could include a preventive arm focusing on the avoidance of excessive deficits and a dissuasive arm working to ensure that the countries respect the agreed limits (e.g., on budget deficit relative to GDP, expenditure growth, or public debt to GDP ratio). If a country’s deficit is deemed to be excessive, the framework could call for the country to undertake corrective policies within a defined time frame. It should be noted that fiscal deficit and public debt targets have already been explicitly proposed and discussed by SADC members, including the CMA countries, for achieving macroeconomic convergence in the SADC.33
(iii) Fiscal transfers. There are already significant fiscal transfers across the CMA countries under the SACU arrangements. The ongoing efforts by SADC members to achieve a custom union by 2010 have raised the issues of SADC revenue distribution arrangements and institutions, which would supersede the SACU revenue sharing mechanism. In general, more effective use of pooled resources, particularly by providing countercyclical transfers to member states could lend strong support to economic adjustment and stabilization in a monetary union.34 CMA countries, as a core part of other regional organizations, have a legitimate interest in ensuring that regional fiscal transfer arrangements are conducive to the stability of the CMA. There are already suggestions in the region to link the allocation of pooled resources to economic development, for instance, to enhance the productive and trade capacity of the poorest member states. Admittedly, the issue of regional fiscal transfers is rather complex, given the differences in membership in the CMA, SACU and SADC. Informed discussions would help develop an arrangement that would best serve the region.
32 See “Enforcement and the stability and growth pact: How fiscal policy did and did not change under Europe’s fiscal framework,” IMF Working Paper 06/116.
33 The SADC Macroeconomic Sub-Committee (comprising senior officials from central banks and finance ministries) discussed the first set of macroeconomic convergence country reports and the convergence criteria in their meeting in Mauritius in November 2006.
34 Sala-i-Martin and Sachs (1992) estimate that fiscal transfers in the United States eliminate about 40 percent of the decline in regional income in response to negative economic shocks.

43
(iv) Labor mobility and wage flexibility. A flexible labor market will facilitate regional integration and effective adjustment to asymmetric shocks. Although the region has a long history of labor mobility, efforts to further liberalize cross-border labor movement may have to face the reality of high unemployment in the region. There are steps, however, that could be taken to improve the status quo. Measures to harmonize immigration practices—such as standardizing immigration forms, streamlining visa requirements, and improving immigration facilities both where travel documents are issued and at border crossings—have already been discussed by countries in the region and could be implemented relatively quickly once consensus is reached.35 Streamlining and simplifying the regulations on labor entry and work permit and other requirements would facilitate orderly movement of labor, including skilled labor, and lower the costs for private sector-led growth in South Africa and the LNS countries. To overcome labor market and wage rigidities, the parties involved in wage negotiations need to be encouraged to take into account productivity and terms of trade developments. To the extent that labor skills are an important attribute to a more flexible labor market in the region, a concerted effort to support human capital investment, labor training and other skill enhancing programs could help create the conditions for expanded employment opportunities, including for skilled labor in the LNS countries. (v) Moving toward a full monetary union. This option aims to complete monetary integration in the CMA. It could entail the adoption of a single currency, foreign exchange reserves pooling, and the creation of a common monetary authority with clear responsibility for formulating and conducting monetary policy for the entire CMA. Compared with the current arrangements, the main benefit of this option is greater credibility of monetary policy in the small countries. A full-fledged monetary union eliminates the possibility of devaluation by small member countries. It also closes any remaining room for the LNS central banks to extend credits to domestic entities. The enhanced credibility might also come from stronger institutional capacity of a common central bank and a centralized lender of last resort.36 However, moving to a single currency and a common central bank represents a major institutional change, with related political and legal ramifications.37 In addition, depending on how the common central bank allocates seigniorage under the full monetary
35 SADC secretariat has proposed a single visa for the region, known as a “univisa”, which officials expected to be adopted by 2010.
36 A common lender of last resort within the CMA could significantly increase liquid funds available to support financial institutions in the monetary union in response to emergency situations. Moreover, a single lender of last resort could assess risks in a more comprehensive manner and therefore would be able to provide a more integrated regulatory and supervisory framework (see Dwight (2006)).
37 For example, a national currency may be regarded as a national symbol or embody national pride.

44
union, the LNS countries might gain or lose as compared with the current arrangements.38 For South Africa, this change might imply more responsibilities, given the country’s and the SARB’s central role in the system. (vi) Withdrawal from the CMA. This option was exercised by Botswana in 1975. However, this is unlikely to be an attractive option for the LNS countries now. Botswana has recorded robust economic growth over the last two decades, driven in large part by strong diamonds exports. Mason and Pattillo (2005) argue that Botswana has used the peg of the pula to a currency basket to maintain external competitiveness while keeping monetary growth moderate. There has been no need for the Bank of Botswana to resort to monetary financing because the public sector has been able to run persistent budget surpluses. Moreover, the country has accumulated very large foreign exchange reserves (equivalent to a multiple of broad money or more than a year of imports), thereby strengthening the credibility of the peg. In comparison, the LNS countries are in much weaker fiscal and reserves position. Opting out of the CMA would also imply the loss of the CMA-related benefits such as zero transaction costs for currency exchange with the rand and compensation payments for forgone seigniorage, although the latter could be offset by seignorage from having an exclusive national currency. In addition, opting out of the CMA would expose the LNS countries to a more volatile world environment. Given the extensive trade and financial ties between the LNS countries and South Africa, there may be no credible alternative monetary anchor (other than the rand) for the LNS countries at present.
62. The issues discussed above are not necessarily mutually exclusive. A full monetary union would further regional economic integration and yield additional benefits in terms of monetary policy credibility. But a single currency by itself will not significantly increase the effectiveness of the CMA in response to asymmetric shocks unless it is accompanied by efforts to increase market flexibility and macroeconomic policy coordination and cooperation. Should a decision be made to move to a full monetary union, enhancing the level of consultations on monetary and exchange rate policies under the existing arrangements could be a transitional step.
VI. CONCLUSION
63. This study provides an assessment of the CMA experience, against its two stated goals—to promote sustained growth in the CMA as a whole and to facilitate economic development in less developed member countries. Aside from reviewing trend developments over the last two decades, this study focuses on CMA members’ adjustment to economic shocks in recent years, aiming to identify policy lessons and the key challenges to policy
38 Cohen (2000) argues that compensation payments by South Africa and its willingness to stand as the lender of last resort to the banking systems in the LNS countries under the current CMA arrangements are “side payments” for the rand to be legal tender in the small CMA countries.
45
makers in the region. The paper provides a summary of the issues facing the CMA countries in their efforts to achieve higher growth under the CMA.
64. The current CMA arrangements, although not a full monetary union, have delivered many benefits of a full monetary union. Available data through end-2005 show that real GDP growth in the CMA as a whole has accelerated over the last two decades, and real income per capita, in purchasing power parity terms, has converged—the gap between the richest country, South Africa, and other member countries having narrowed. However, this convergence of per capita income has evidently slowed down over the last 10 years. Thus, the CMA experience so far has provided affirmative answers to the two main objectives, set out in the CMA originating documents, but further progress is facing challenges.
65. The CMA arrangements have facilitated regional integration, particularly in the goods and financial markets, evident from data on both the structures and pricing. Inflation in the CMA has been falling, and has been lower than its neighbors in the SADC. Similarly, interest rates in the CMA are lower than in neighboring countries in Southern Africa. There is strong evidence of a de facto single monetary policy throughout the CMA, set by the South Africa Reserve Bank. Compared to the goods and financial markets, the labor market is less integrated but the region has a history of extensive cross-border labor mobility. CMA countries also made progress towards harmonizing their tax and incentive systems.
66. Empirical analysis confirms that external shocks impact asymmetrically on CMA countries. In response to asymmetric shocks, each CMA country has reacted differently. South Africa moved from a pegged exchange rate regime to a flexible exchange rate regime, adopting inflation targeting as its monetary framework. However, the small member countries have not benefited equally from a more flexible exchange rate. In the small countries, some have responded to shocks with fiscal deficits that are largely financed through domestic borrowing, with the consequence of lowering international reserves. Unsustainable fiscal trends could develop and lead to depletion of foreign reserves under the current system.
67. In addition to maintaining adequate reserves under the current system, the key challenge to CMA policy makers in the period ahead is to take the necessary steps to ensure timely and effective adjustment by member countries in response to asymmetric shocks, in order to achieve the growth and development objectives of the CMA. Depending on policy response, divergent growth performance among CMA countries could be persistent, and credibly boosting growth in the small member countries affected by exogenous shocks is a serious challenge. In this regard, CMA countries face a number of issues, some of which concern the institutions of the monetary union (the level of consultations on monetary and exchange rate policies under the existing arrangements, moving toward to a full monetary union, and the option to withdraw from the CMA) while others are related to macroeconomic policy coordination and market flexibility that could reinforce the monetary arrangements of the CMA (regional surveillance over fiscal and structural policies, fiscal transfers across

46
member states, and labor mobility and wage flexibility). Many of these issues are rather complicated, influenced by economic and non-economic considerations. The summary provided in this paper, by clarifying the pros and cons, could contribute to consensus building.
68. Recent tides of globalization have added impetus to economic development and integration in Southern Africa. The issues and policy choices discussed in this paper thus need to be seen in this broader context. Indeed, many of these issues may inevitably confront CMA member countries in the period ahead. With further development, the CMA could play a central role in the process of economic and monetary integration in the region. Progress in this regard depends, to a large extent, on South Africa, which will continue to be the engine of growth in the region. Under these circumstances, the small member countries will need to focus on strengthening competitiveness, through the conduct of prudent fiscal policy and accelerated structural reforms.
47
References
Annett, Anthony, 2006, “Enforcement and the Stability and Growth Pact: How Fiscal Policy Did and Did Not Change Under Europe’s Fiscal Framework,” IMF Working Paper No. 06/116 (Washington: International Monetary Fund).
Aron, Janine, and John Muelbauer, 2004, “Review of Monetary Policy in South Africa
during 1994–2004,” Center for the Study of African Economies, Department of Economics, (Oxford: University of Oxford), available via the Internet at http://www.csae.ox.ac.uk/
Bayoumi, Tamim, and Jonathan D. Ostry ,1994, “Macroeconomic Shocks and Trade Flows
within sub-Saharan Africa: Implications for Optimum Currency Arrangements,” Journal of African Economies, Vol. 6, No 3, pp 412–44
Bhundia, Ashok, 2002, “An Empirical Investigation of Exchange Rate Pass-Through in
South Africa,” IMF Working Paper No. 02/165 (Washington: International Monetary Fund).
Bhundia, Ashok and Luca A. Ricci, 2005, “The Rand Crises of 1998 and 2001: What Have
We Learned,” in: Post-Apartheid South Africa: The First Ten years, ed. by Michael Nowak and Luca Antonio Ricci (Washington: International Monetary Fund).
Bussière, Matthieu, and Christian Mulder, 1999, “External Vulnerability in Emerging Market
Economies: How High Liquidity Can Offset Weak Fundamentals and the Effects of Contagion,” IMF Working Paper, No. 99/88 (Washington: International Monetary Fund).
Cobham, David, and Peter Robson, 1994, “Monetary Integration in Africa: A Deliberately
European Perspective,” World Development, Vol. 22 (March), pp. 285–99. Cohen, Benjamin J, 2000, Life at the Top : International Currencies in the Twenty-First
Century, International Economics Section, Department of Economics (Princeton: Princeton University).
Collings, Francis d’A., George Donely, Arne Petersen, Chanpen Puckahtikom, and Peter
Wickham, 1978, “The Rand and the Monetary Systems of Botswana, Lesotho, and Swaziland,” The Journal of Modern African Studies, Vol.16 (March), pp. 97–121.
Crush, Jonathan, Theresa Ulicki, Tke Tseane, and Elizabeth Jansen van Vuuren, 1999, “Undermining
Labor: Migrancy and Sub-Contracting in the South African Gold Mining Industry,” Migration Policy Series No. 15.
Crush, Jonathan, 2002, “Mobile Namibia: Migration Trends and Attitudes,” Migration Policy Series
No. 27.
Daseking, Christina, Atish Ghosh, Timothy Lane, and Alun Thomas, 2004, Lessons from the Crisis in Argentina, IMF Occasional Paper No. 236 (Washington: International Monetary Fund).

48
Devarajan, Shantayanan, and Jaime de Melo, 1987, "Evaluating Participation in African Monetary Unions: A Statistical Analysis of the CFA Zones," World Development, Vol. 15, No. 4, pp. 483–96.
Dwight, Lawrence, 2006, “Prospects for a Monetary Union,” in Namibia: Selected Issues and
Statistical Appendix, (Washington: International Monetary Fund), http://www.imf.org/ Elbadawi, Ibrahim, and Nader Majd, 1992, “Fixed Parity of the Exchange Rate and
Economic Performance in the CFA Zone A Comparative Study,” African Region Working Paper Series No. 830 (Washington: World Bank).
Engle, R.F., and C.W.J. Granger, 1987, "Co-Integration and Error Correction:
Representation, Estimation and Testing," Econometrica, Vol. 55, No.2, pp.251–76. Engstrom, Lars, 2004, “The New SACU Agreement and Its Effect on Revenues,” in Lesotho:
Selected Issues and Statistical Appendix, {Washington: International Monetary Fund}, http://www.imf.org/
Fasano, Ugo, 2003, Monetary Union Among Member Countries of the Gulf Cooperation
Council, IMF Occasional Paper No. 223 (Washington: International Monetary Fund). Fielding D, Kevin Lee, and Kalvinder Shields, 2004, “The Characteristics of Macroeconomic Shocks
in the CFA and Franc Zone,” Journal of African Economies, Volume 13, No. 4, pp.488–517
Flint, Henry, Jan Duvenage, and Isaac Matshego, 2004, “Market Insight: Monetary Policy in the CMA,” Standard Bank African Research, http://www.ed.standardbank.co.za/research/
Foulo, Tabo, 2003, “Regional Currency Area and the Use of Foreign Currencies: Lesotho’s
Experience,” Bank for International Settlements Papers, No. 17, pp. 128–33, (Basel: BIS); http://www.bis.org/publ/
Gelbard, E. A. and S. P. Leite, 1999, “Measuring Financial Development in sub-Saharan
Africa,” IMF Working Paper, No. 99/105 (Washington: International Monetary Fund). Gons, Jacob, 2006, “Swaziland’s External Competitiveness in the Context of the Common
Monetary Area,” in Swaziland: Statistical Appendix (Washington: International Monetary Fund).
Grandes, Martin, 2003, “Macroeconomic Convergence in Southern Africa: The Rand Zone
Experience,” OECD Working Paper No. 231. Guillaumont, Patrick, Sylviane Guillaumont, and Patrick Plane, 1988, “Participating in
African Monetary Unions:An Alternative Evaluation,” World Development. Vol. 16. No. 5, pp. 569–76.
49
Guma, X.P., 1985, “The Rand Monetary Area Agreement,” The South African Journal of Economics, Vol. 53 (June), pp. 166–83.
Harjes, Thomas, and Kazuko Shirono, 2006, “Exchange Rate Volatility in South Africa,” in
South Africa: Selected Issues (forthcoming). Honohan, Patrick, 1992, “Price and Monetary Convergence In Currency Unions: The Franc
and Rand Zones,” Journal of International Money and Finance, Vol. 11, pp.397–410. Horton, Mark, 2005, “Role of Fiscal Policy in Stabilization and Poverty Alleviation,” in:
Post-Apartheid South Africa: The First Ten years, ed. by Michael Nowak and Luca Antonio Ricci (Washington: International Monetary Fund).
Humpage, Owen F, and Jean M. McIntire, 1995, “An Introduction to Currency Board,”
Federal Reserve Bank of Cleveland Economic Review (31), pp. 2–11. Hviding, Ketil, 2005, “Liberalizing Trade and Capital Transactions: An Overview,” in: Post-
Apartheid South Africa: The First Ten years, ed. by Michael Nowak and Luca Antonio Ricci (Washington: International Monetary Fund).
IMF, 2000, “Debt-and Reserve-Related Indicators of External Vulnerability,” (Washington: International Monetary Fund), http://www.imf.org/external/np/pdr/debtres/index.htm Jenkins, Carolyn, and Lynne Thomas, 1997, “Is Southern Africa Ready for Regional
Monetary Integration? Convergence, Divergency, and Macroeconomic Policy in SADC,” Center for Research for Southern Africa Research Paper No. 10, (London:London School of Economics) Available via the Internet: http://www.lse.ac.uk/Depts/CREFS/publications.htm
Kirk, Robert and Mathew Stern, 2003, “The New Southern African Customs Union
Agreement,” Africa Region Working Paper Series No. 57 (June) (Washington: World Bank).
Lledo, Victor, Jan Kees Martijn, and Jacob Gons, 2005, “Competitiveness and Export
Performance in Lesotho,” in Lesotho: Selected Issues and Statistical Appendix (Washington: International Monetary Fund).
MacDonald, Ronald and Luca A. Ricci, 2004, “Estimation of the Equilibrium Real Exchange
Rate for South Africa,” South Africa Journal of Economics, Vol. 72, No.2 (June), pp. 282–304.
Masson, Paul R. and Catherine Pattillo, 2001, Monetary Union in West Africa (ECOWAS): Is
It Desirable and How Could It be Achieved? IMF Occasional Paper No. 204 (Washington: International Monetary Fund).

50
Masson, Paul R., and Catherine Pattillo, 2005, The Monetary Geography of Africa, (Washington: Brookings Institutions Press).
McKinnon, Ronald, 1963, “Optimal Currency Area,” American Economic Review, Vol. 53
(September), pp.717–25. Metzger, Martina, 2004, “The Common Monetary Area in Southern Africa: A Typical South-
South Coordination Effort?”, The Berlin Institute for Financial Market Research. http://www.duei.de/iik/de/content/forschung/
Mundell, Robert, 1961, “A Theory of Optimum Currency Areas,” American Economic
Review, Vol. 51 (September), pp. 657–65. Nielsen, Hannah, Ebson Uanguta, and Sylvanus Ikhide, 2005, “Financial Integration in the
Common Monetary Area,” South African Journal of Economics, vol.73:4 (December), pp.710-21.
Nowak, Michael, 2005, “The First Ten Years after Apartheid: An Overview of South African
Economy,” in: Post-Apartheid South Africa: The First Ten years, ed. by Michael Nowak and Luca Antonio Ricci (Washington: International Monetary Fund).
Sala-i-Martin, Xavier, and Jeffrey Sachs, 1992, “Fiscal Federalism and Optimum Currency
Areas: Evidence for Europe from the United States,” in Establishing a Central Bank: Issues in Europe and Lessons from the U.S., ed. By M.B. Canzoneri, V. Grilli, and P.R. Masson (Cambridge, England: Cambridge University Press).
Tjirongo, Meshack T., 1995, “Short-Term Stabilizaton Versus Long-Term Price Stability:
Evaluating Namibia’s Membership of the Common Monetary Area,” Center for the Study of African Economies, Institute of Economics and Statistics, WPS/95-18 (Oxford: University of Oxford).
USAID, 2005, The Swaziland Investor Roadmap, Gaborone, Botswana, Regional Center for
Southern Africa, U.S. Agency for International Development. Van der Merwe, E. J., 1996, “Exchange Rate Policies in South Africa: Recent Experience
and Prospects,” Occassional Paper of the South African Reserve Bank No. 9 (Pretoria: South: African Reseve Bank).
World Bank, 2004, “Lesotho—Financial Sector Review,” Financial Sector Division, Africa
Region (Washington: World Bank). ———, 2005, “Lesotho—An Assessment of the Investment Climate,” Africa Private Sector
Group (Washington: World Bank) WTO, 2003, “Trade Policy Review, Southern African Customs Union, Report by the
Secretariat,” WT/TPR/S/114 (Geneva: World Trade Organization).
51
Zaidi, Iqbal, 2004, “External Competitiveness, Exchange Rate Flexibility, and the Monetary Policy Framework,” in Botswana: Selected Issues and Statistical Appendix (Washington: International Monetary Fund).

52
APPENDIX I. Regional Comparison of Economic Performance
1. While the CMA has consistently had a lower growth rate than other parts of sub-Saharan Africa, its average real growth rate has accelerated faster than that of comparator regions (see Table A1.1.). The growth rate of the CMA has more than tripled over the last twenty-five years, narrowing the gap in average growth rate between the CMA and other sub-Saharan African regions.39
1. Average inflation has declined substantially, from 14.5 percent in 1980-1992 to 7.7 percent in 1993-2000 and 3.7 percent in 2001-2005. As a result, the inflation differential between the CMA and the CFA zone declined significantly. This declining trend in CMA inflation reflects the successful implementation of inflation targeting in South Africa.
2. Though the fiscal deficit in the CMA has declined in recent years, it is still higher than in comparator regions. On the other hand, external debt is substantially lower than that of other sub-Saharan African regions.
3. As for the business environment and the regulatory regime, the CMA countries fare relatively well compared with other sub-Saharan African counties. According to the economic freedom index published by the Heritage Foundation,40 South Africa ranks higher than the OECD average on trade policy, wages and prices, and government intervention in the economy. Lesotho’s trade policy also scores better than both the sub-Saharan African and OECD averages. Namibia ranks higher than the regional average on several indicators, including regulation, banking and finance, and capital flows and foreign investment, but falls below the regional average with respect to fiscal burden of government and government intervention in the economy. The Heritage Foundation also ranked Swaziland as having greater economic freedom than its sub-Saharan African counterparts.
4. One of the greatest structural challenges facing CMA countries is the HIV/AIDS epidemic. They are among the countries with the highest prevalence rate of HIV/AIDS in the world. The epidemic can have serious macroeconomic implications through its effect on, among other things, labor force participation, skills accumulation, and domestic savings.
39 For more on the economic performance of the CFA zone, see Devarajan and de Melo (1987) and Guillaumont, Guillaumont, and Plane (1988).
40 Heritage Foundation, Index of Economic Freedom 2005.
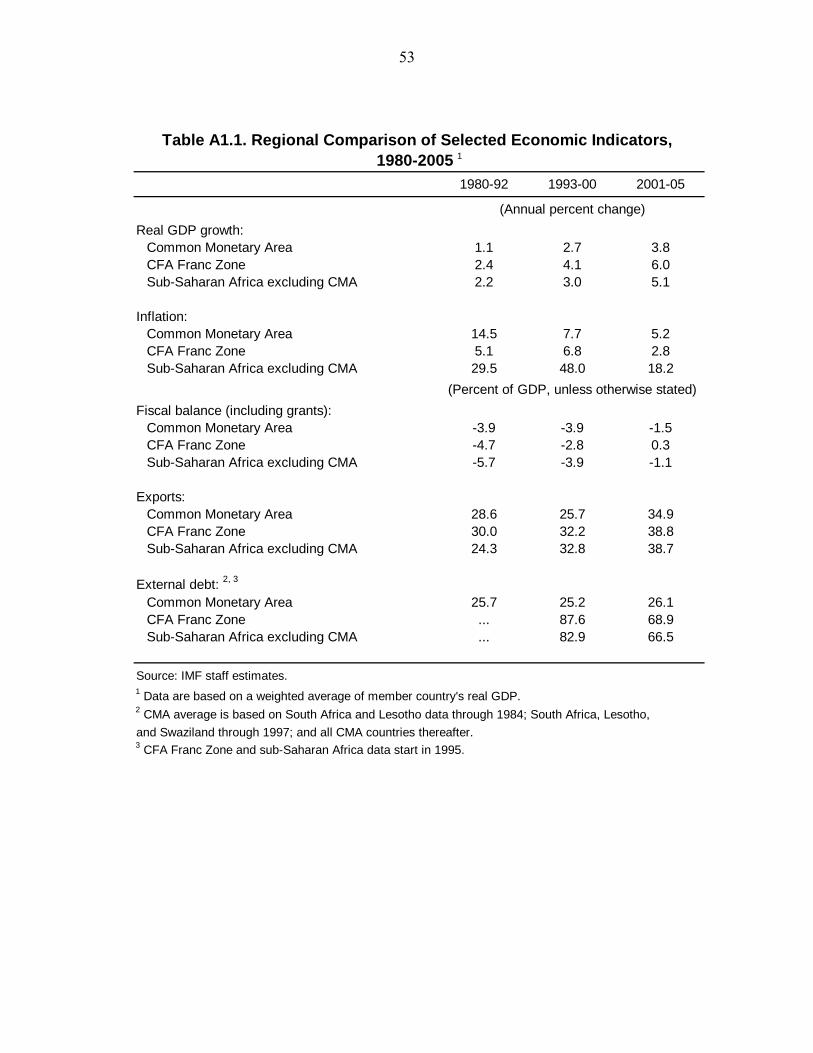
53
Table A1.1. Regional Comparison of Selected Economic Indicators, 1980-2005 1
1980-92 1993-00 2001-05
Real GDP growth:Common Monetary Area 1.1 2.7 3.8CFA Franc Zone 2.4 4.1 6.0Sub-Saharan Africa excluding CMA 2.2 3.0 5.1
Inflation:Common Monetary Area 14.5 7.7 5.2CFA Franc Zone 5.1 6.8 2.8Sub-Saharan Africa excluding CMA 29.5 48.0 18.2
(Percent of GDP, unless otherwise stated)Fiscal balance (including grants):
Common Monetary Area -3.9 -3.9 -1.5CFA Franc Zone -4.7 -2.8 0.3Sub-Saharan Africa excluding CMA -5.7 -3.9 -1.1
Exports:Common Monetary Area 28.6 25.7 34.9CFA Franc Zone 30.0 32.2 38.8Sub-Saharan Africa excluding CMA 24.3 32.8 38.7
External debt: 2, 3
Common Monetary Area 25.7 25.2 26.1CFA Franc Zone ... 87.6 68.9Sub-Saharan Africa excluding CMA ... 82.9 66.5
Source: IMF staff estimates.1 Data are based on a weighted average of member country's real GDP.2 CMA average is based on South Africa and Lesotho data through 1984; South Africa, Lesotho, and Swaziland through 1997; and all CMA countries thereafter.3 CFA Franc Zone and sub-Saharan Africa data start in 1995.
(Annual percent change)
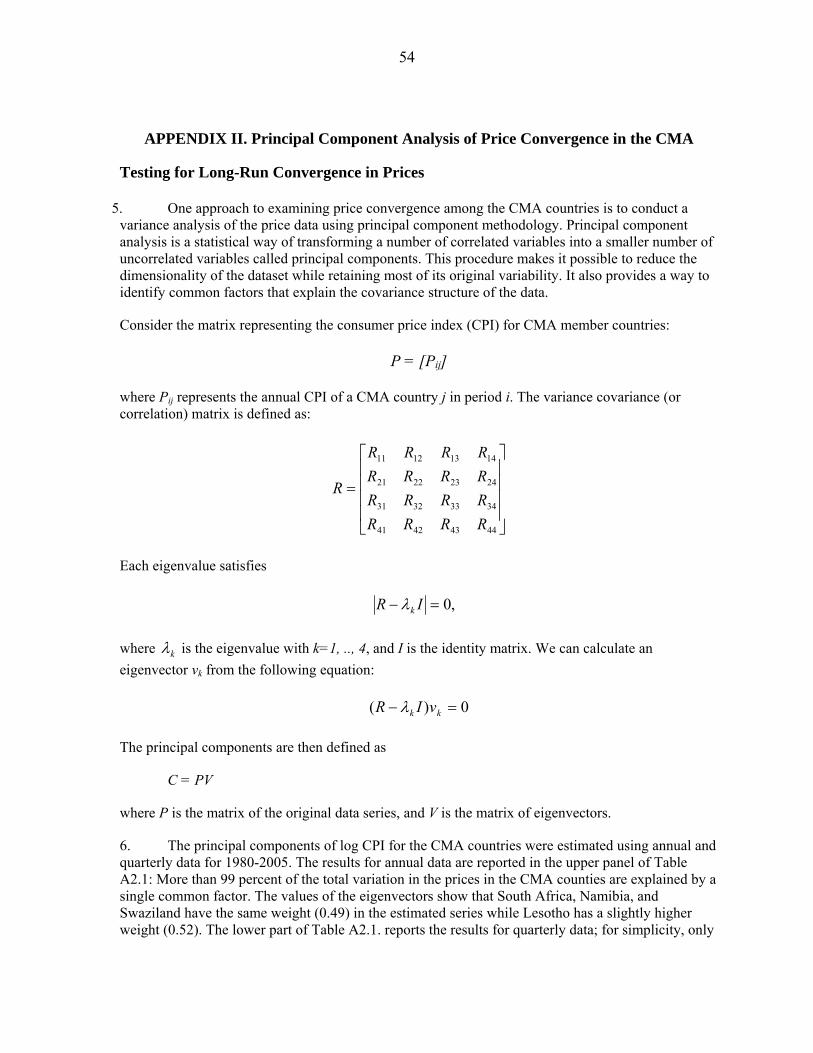
54
APPENDIX II. Principal Component Analysis of Price Convergence in the CMA Testing for Long-Run Convergence in Prices
5. One approach to examining price convergence among the CMA countries is to conduct a variance analysis of the price data using principal component methodology. Principal component analysis is a statistical way of transforming a number of correlated variables into a smaller number of uncorrelated variables called principal components. This procedure makes it possible to reduce the dimensionality of the dataset while retaining most of its original variability. It also provides a way to identify common factors that explain the covariance structure of the data.
Consider the matrix representing the consumer price index (CPI) for CMA member countries:
P = [Pij] where Pij represents the annual CPI of a CMA country j in period i. The variance covariance (or correlation) matrix is defined as:
⎥⎥⎥⎥
⎦
⎤
⎢⎢⎢⎢
⎣
⎡
=
44434241
34333231
24232221
14131211
RRRRRRRRRRRRRRRR
R
Each eigenvalue satisfies
,0=− IR kλ where kλ is the eigenvalue with k=1, .., 4, and I is the identity matrix. We can calculate an eigenvector vk from the following equation:
0)( =− kk vIR λ
The principal components are then defined as
C = PV
where P is the matrix of the original data series, and V is the matrix of eigenvectors.
6. The principal components of log CPI for the CMA countries were estimated using annual and quarterly data for 1980-2005. The results for annual data are reported in the upper panel of Table A2.1: More than 99 percent of the total variation in the prices in the CMA counties are explained by a single common factor. The values of the eigenvectors show that South Africa, Namibia, and Swaziland have the same weight (0.49) in the estimated series while Lesotho has a slightly higher weight (0.52). The lower part of Table A2.1. reports the results for quarterly data; for simplicity, only

55
the eigenvector matrix is shown. South Africa has the highest weight (0.72) in the first principal component series.
7. Figure A2.1. plots the first principal component series and the actual CPI for each country. The figure shows a long-run convergence in prices for the CMA countries, especially after 1993. In all cases, the actual series closely follows the derived series with the gap between the two narrowing over time. Note, however, that the differential between the two series seems to have widened slightly in recent years. Nevertheless, our results strongly suggest a long-run convergence in prices among the CMA members.
Sample: 1980–2005Observations: 26Covariance of LNLESOTHO LNNAMIBIA LNSOUTHAF LNSWAZILAND
PC 1 PC 2 PC 3 PC 4Eigenvalue 0.466 0.000 0.000 0.000Variance prop. 0.999 0.001 0.000 0.000Cumulative prop. 0.999 0.999 1.000 1.000
Eigenvectors:Variable Vector 1 Vector 2 Vector 3 Vector 4LNLESOTHO 0.52 0.22 0.53 0.63LNNAMIBIA 0.49 0.48 0.16 -0.71LNSOUTHAF 0.49 -0.84 0.11 -0.20LNSWAZILAND 0.49 0.13 -0.82 0.24
Principal component analysis of the log of the CPI (Quarterly data) Sample (adjusted): 1981Q1–2005Q3Observations: 89 after adjustments
Eigenvectors:Variable Vector 1 Vector 2 Vector 3 Vector 4LESOTHO 0.32 -0.03 -0.12 0.94NAMIBIA 0.51 -0.40 0.75 -0.09SOUTH AFRICA 0.72 -0.13 -0.60 -0.33SWAZILAND 0.35 0.90 0.24 -0.05
Table A2.1. CMA Countries: Principal Component Analysis of the Log of the CPI, 1990-2005 (Annual and quarterly data)

56
Figure A2.1. CMA: Principal Component Analysis, 1980-2005
Lesotho
-1.5
-1.0
-0.5
0.0
0.5
1.0
1.5
2.0 1.0
1.2
1.4
1.6
1.8
2.0
2.2
2.4Principal Component ofCMA CPIActual CPI
1980 1985 1990 1995 2000 2005
Namibia
-1.5
-1.0
-0.5
0.0
0.5
1.0
1.5
2.0 1.0
1.2
1.4
1.6
1.8
2.0
2.2
2.4Principal Component ofCMA CPIActual CPI
1980 1985 1990 1995 2000 2005
Swaziland
-1.5
-1.0
-0.5
0.0
0.5
1.0
1.5
2.0 1.0
1.2
1.4
1.6
1.8
2.0
2.2
2.4Principal Component ofCMA CPIActual CPI
1980 1985 1990 1995 2000 2005
South Africa
-1.5
-1.0
-0.5
0.0
0.5
1.0
1.5
2.0 1.0
1.2
1.4
1.6
1.8
2.0
2.2
2.4
Principal Component ofCMA CPI
Actual CPI
1980 1985 1990 1995 2000 2005
8. While principal component analysis provides information about commonality in the variation of CPI among the CMA countries, it does not imply any causality. On the other hand, given the economic dominance of South Africa in the CMA, it is natural to assume that the causality runs from South Africa to smaller CMA countries. To confirm this intuition, Granger causality tests were conducted on the inflation of the CMA counties. Table A2.2. reports the results. For Lesotho and Namibia, the hypothesis that South African inflation Granger-causes inflation in other countries cannot be rejected while the hypothesis of reverse causality is rejected. For Swaziland, the Granger causality runs from South Africa to Swaziland, but the hypothesis of reverse causality cannot be rejected.

57
Sample: 1980Q1–2005Q3Lags: 4
Null hypothesis: Obs F-Statistic ProbabilitySouth Africa and Lesotho:
D(LOGZAF) does not Granger-cause D(LOGLES) 98 4.8 0.0 D(LOGLES) does not Granger-cause D(LOGZAF) 0.7 0.6
South Africa and Namibia: D(LOGZAF) does not Granger-cause D(LOGNAM) 98 3.2 0.0 D(LOGNAM) does not Granger-cause D(LOGZAF) 0.4 0.8
South Africa and Swaziland: D(LOGZAF) does not Granger-cause D(LOGSWZ) 98 2.2 0.1 D(LOGSWZ) does not Granger-cause D(LOGZAF) 2.5 0.1
Table A2.2. CMA Countries: Pairwise Granger Causality Tests
9. In summary, the results from the principal component analysis strongly support a long-run price convergence among the CMA countries. Granger causality tests further confirm that inflation in the smaller CMA countries is Granger-caused by inflation in South Africa.

58
A
ppen
dix
III.
CM
A C
ount
ries
: Com
para
tive
Tax
Rat
es a
nd In
cent
ives
41
T
ax
Les
otho
N
amib
ia
Sout
h A
fric
a Sw
azila
nd
Com
pany
inco
me
tax
25
per
cent
; sp
ecia
l rat
es fo
r man
ufac
-tu
ring,
min
ing,
and
no
nres
iden
t com
pani
es.
35 p
erce
nt;
spec
ial r
ates
for d
iam
ond,
no
ndia
mon
d, a
nd m
anuf
actu
rers
.
30 p
erce
nt;
Seco
ndar
y ta
x on
com
pani
es: 1
2.5
perc
ent
Spec
ial r
ates
for g
old
min
ing,
oil
extra
ctio
n, lo
ng-te
rm in
sura
nce
tax,
and
sm
all e
nter
pris
es.
30 p
erce
nt.
Com
pani
es g
rant
ed d
evel
opm
ent
appr
oval
ord
er: 1
0 pe
rcen
t
In
divi
dual
inco
me
tax
Prog
ress
ive
tax
stru
ctur
e:
Min
imum
: 0 p
erce
nt
Max
imum
: 35
perc
ent
Prog
ress
ive
tax
stru
ctur
e:
Min
imum
: 0 p
erce
nt
Max
imum
: 35
perc
ent
Prog
ress
ive
tax
stru
ctur
e:
Min
imum
: 0 p
erce
nt
Max
imum
: 40
perc
ent
Prog
ress
ive
tax
stru
ctur
e:
Min
imum
: 0 p
erce
nt
Max
imum
: 33
perc
ent
Ta
x on
non
resi
dent
ial
shar
ehol
ders
10 p
erce
nt o
f am
ount
of d
ivid
end.
12.5
per
cent
for c
ompa
nies
in
corp
orat
ed in
SA
CU
cou
ntrie
s.
Prop
erty
tax
0.25
per
cent
on
resi
dent
ial
prop
erty
. 2
perc
ent o
n co
mm
erci
al
prop
erty
. 2.
75 p
erce
nt o
n in
dust
rial
prop
erty
.
Min
imum
: 0 p
erce
nt, f
or v
alue
un
der 1
00,0
00
Max
imum
: 11,
000,
plu
s 8 p
erce
nt
for v
alue
s exc
eedi
ng 4
00,0
00
Prop
erty
tax
rate
diff
ers w
ith lo
cal
gove
rnm
ents
. Fo
r ind
ivid
ual n
atio
nals
: M
inim
um 5
per
cent
M
axim
um: 8
per
cent
Fo
r leg
al e
ntiti
es: 1
0 pe
rcen
t
Min
imum
: 2 p
erce
nt
Max
imum
: 6 p
erce
nt
Min
eral
righ
ts ta
x: v
ario
us ra
tes
Val
ue-a
dded
tax
14
per
cent
.
15 p
erce
nt.
14
per
cent
. G
ener
al sa
les t
ax: 1
4 –
25 p
erce
nt
Exci
se ta
x
Spec
ific
or a
d va
lore
m ra
tes
or b
oth.
Spec
ific
or a
d va
lore
m ra
tes o
r bo
th.
Spec
ific
or a
d va
lore
m ra
tes.
Mos
tly sp
ecifi
c ra
tes.
41
Mai
n ta
xes a
nd in
cent
ives
onl
y.
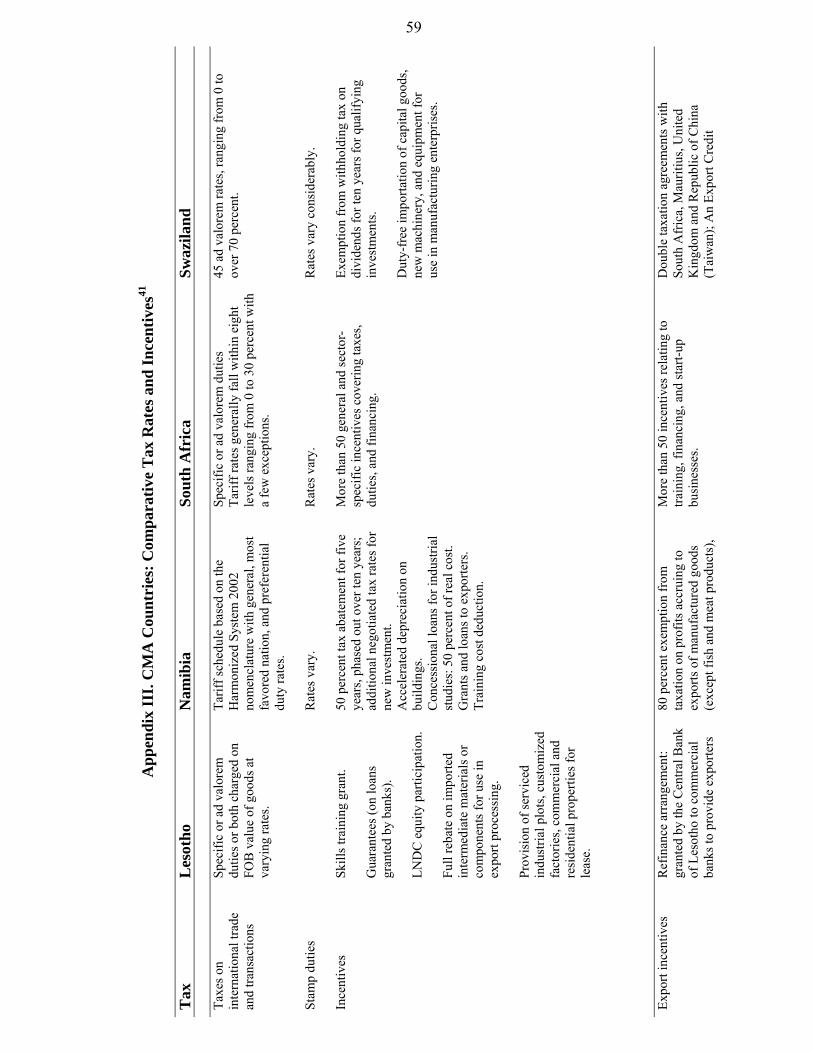
59
A
ppen
dix
III.
CM
A C
ount
ries
: Com
para
tive
Tax
Rat
es a
nd In
cent
ives
41
T
ax
Les
otho
N
amib
ia
Sout
h A
fric
a Sw
azila
nd
Taxe
s on
inte
rnat
iona
l tra
de
and
trans
actio
ns
Spec
ific
or a
d va
lore
m
dutie
s or b
oth
char
ged
on
FOB
val
ue o
f goo
ds a
t va
ryin
g ra
tes.
Tarif
f sch
edul
e ba
sed
on th
e H
arm
oniz
ed S
yste
m 2
002
nom
encl
atur
e w
ith g
ener
al, m
ost
favo
red
natio
n, a
nd p
refe
rent
ial
duty
rate
s.
Spec
ific
or a
d va
lore
m d
utie
s Ta
riff r
ates
gen
eral
ly fa
ll w
ithin
eig
ht
leve
ls ra
ngin
g fr
om 0
to 3
0 pe
rcen
t with
a
few
exc
eptio
ns.
45 a
d va
lore
m ra
tes,
rang
ing
from
0 to
ov
er 7
0 pe
rcen
t.
St
amp
dutie
s
Rat
es v
ary.
R
ates
var
y.
Rat
es v
ary
cons
ider
ably
.
Ince
ntiv
es
Skill
s tra
inin
g gr
ant.
G
uara
ntee
s (on
loan
s gr
ante
d by
ban
ks).
LND
C e
quity
par
ticip
atio
n.
Full
reba
te o
n im
porte
d in
term
edia
te m
ater
ials
or
com
pone
nts f
or u
se in
ex
port
proc
essi
ng.
Prov
isio
n of
serv
iced
in
dust
rial p
lots
, cus
tom
ized
fa
ctor
ies,
com
mer
cial
and
re
side
ntia
l pro
perti
es fo
r le
ase.
50 p
erce
nt ta
x ab
atem
ent f
or fi
ve
year
s, ph
ased
out
ove
r ten
yea
rs;
addi
tiona
l neg
otia
ted
tax
rate
s for
ne
w in
vest
men
t. A
ccel
erat
ed d
epre
ciat
ion
on
build
ings
. C
once
ssio
nal l
oans
for i
ndus
trial
st
udie
s: 5
0 pe
rcen
t of r
eal c
ost.
G
rant
s and
loan
s to
expo
rters
. Tr
aini
ng c
ost d
educ
tion.
Mor
e th
an 5
0 ge
nera
l and
sect
or-
spec
ific
ince
ntiv
es c
over
ing
taxe
s, du
ties,
and
finan
cing
.
Exem
ptio
n fr
om w
ithho
ldin
g ta
x on
di
vide
nds f
or te
n ye
ars f
or q
ualif
ying
in
vest
men
ts.
Dut
y-fr
ee im
porta
tion
of c
apita
l goo
ds,
new
mac
hine
ry, a
nd e
quip
men
t for
us
e in
man
ufac
turin
g en
terp
rises
.
Expo
rt in
cent
ives
R
efin
ance
arr
ange
men
t: gr
ante
d by
the
Cen
tral B
ank
of L
esot
ho to
com
mer
cial
ba
nks t
o pr
ovid
e ex
porte
rs
80 p
erce
nt e
xem
ptio
n fr
om
taxa
tion
on p
rofit
s acc
ruin
g to
ex
ports
of m
anuf
actu
red
good
s (e
xcep
t fis
h an
d m
eat p
rodu
cts)
,
Mor
e th
an 5
0 in
cent
ives
rela
ting
to
train
ing,
fina
ncin
g, a
nd st
art-u
p bu
sine
sses
.
Dou
ble
taxa
tion
agre
emen
ts w
ith
Sout
h A
fric
a, M
aurit
ius,
Uni
ted
Kin
gdom
and
Rep
ublic
of C
hina
(T
aiw
an);
An
Expo
rt C
redi
t

60
A
ppen
dix
III.
CM
A C
ount
ries
: Com
para
tive
Tax
Rat
es a
nd In
cent
ives
41
T
ax
Les
otho
N
amib
ia
Sout
h A
fric
a Sw
azila
nd
with
con
cess
iona
ry e
xpor
t fin
ance
. C
ount
er-g
uara
ntee
ar
rang
emen
t: C
entra
l Ban
k as
sum
es 9
5 pe
rcen
t of t
he
risk
asso
ciat
ed w
ith
guar
ante
es is
sued
by
the
LND
C; f
inan
cial
bac
king
fr
om th
e C
entra
l Exp
ort
Dev
elop
men
t Fun
d or
gani
zed
on a
revo
lvin
g ba
sis;
fund
is m
anag
ed b
y th
e C
entra
l Ban
k of
Le
soth
o.
whe
ther
pro
duce
d in
Nam
ibia
or
not.
Expo
rt pr
oces
sing
and
spec
ial
ince
ntiv
e zo
nes.
El
igib
le a
ctiv
ities
incl
ude
taxe
s and
du
ties.
Gua
rant
ee S
chem
e gr
ante
d th
roug
h co
mm
erci
al b
anks
and
supp
orte
d
by th
e C
entra
l Ban
k fo
r ex
port-
orie
nted
ent
erpr
ises
.
Inve
stm
ent
guar
ante
es
Leso
tho
is a
sign
ator
y to
the
Inte
rnat
iona
l Cen
tre fo
r Se
ttlem
ent o
f Inv
estm
ent
Dis
pute
s (IC
SID
) and
a
mem
ber o
f the
Wor
ld
Ban
k’s M
ultil
ater
al
Inve
stm
ent G
uara
ntee
A
genc
y (M
IGA
).
Nam
ibia
is a
sign
ator
y to
the
MIG
A,.
U.S
. Ove
rsea
s Priv
ate
Inve
stm
ent C
orpo
ratio
n (O
PIC
), an
d si
mila
r acc
ords
with
Ger
man
y,
Switz
erla
nd, F
ranc
e, M
alay
sia,
C
uba,
the
Uni
ted
Kin
gdom
, and
N
orth
ern
Irel
and.
Com
preh
ensi
ve d
oubl
e ta
xatio
n ag
reem
ents
with
num
erou
s cou
ntrie
s w
orld
wid
e. S
igna
tory
to in
tern
atio
nal
inve
stm
ent p
rote
ctio
n ag
reem
ents
in
clud
ing
the
MIG
A.
Swaz
iland
is a
mem
ber o
f MIG
A.
Sour
ce: I
MF
and
natio
nal a
utho
ritie
s.
61
APPENDIX IV. The Southern African Customs Union: Revenue Distribution
A Brief History
1. Three agreements have been crucial for the development of the Southern African Customs Union (SACU): (i) the initial 1910 Customs Union Arrangement, (ii) the 1969 agreement, and (iii) the 2002 agreement, which was signed on October 21 after eight years of negotiation. Current members are Botswana, Lesotho, Namibia, and Swaziland (the BLNS countries) and South Africa.
2. Under the 1910 arrangement, all member states applied the same rate of import duty, set by South Africa, which administered the common customs revenue pool and distributed it among members on the basis of fixed (i.e., not trade-related) percentage shares, which gave South Africa 98.7 percent of the revenue.
3. The 1969 agreement distributed customs union revenue using a formula that calculates revenue shares for each BLNS country with South Africa’s share as a residual. The formula is designed to allocate customs and excise duties to each BLNS country according to its share of total extra- and intra-SACU imports and excisable goods consumed within the customs union. The formula also contains a provision that enhances each BLNS country’s revenue receipts by 42 percent. Revenues are distributed with a lag of two years.
4. An important addition was made in 1977, when a “stabilized revenue rate” was introduced that promised minimum receipts equal to 17 percent of the total value of SACU imports and excisable value to the BLNS countries as a group. Because the guarantee is binding, SACU receipts are higher than they would have been otherwise.
The 2002 Agreement
5. The objectives of the 2002 agreement as defined in Article 2 are to (i) facilitate the cross-border movement of goods between the territories of the member states; (ii) create effective, transparent, and democratic institutions that will ensure equitable benefits to member states; (iii) promote conditions of fair competition in the common customs area; (iv) substantially increase investment opportunities in the common customs area; (v) enhance the economic development, diversification, industrialization, and competitiveness of member states; (vi) promote the integration of member states into the global economy through enhanced trade and investment; (vii) facilitate the equitable sharing of revenue arising from customs and excise duties levied by member states; and (viii) facilitate the development of common policies and strategies.
6. The agreement introduces, inter alia, a new institutional structure, a new system of managing and sharing the common revenue pool, and a dispute settlement mechanism; it notes the need for common policies for industrial development, agriculture, competition policy, and unfair practice.
7. The revenue-sharing formula of the 2002 agreement, for a given financial year, is:
⎥⎦⎤
⎢⎣⎡ −−∗∗∗+∗∗+∗=
101)/(
1)15.0()20()85.0(YY
EGDPGDP
EAA
CR iiii

62
Where:
Ri = revenue share of SACU country i
i = Botswana, Lesotho, Namibia, South Africa, or Swaziland
C = all customs duties actually collected on goods imported into SACU, less the cost of financing the Secretariat, the Tariff Board, and the Tribunal, less customs duties rebated or refunded
Ai = c.i.f. value (at the border) of imports of SACU country i from all other SACU members, less re-exports
A = total c.i.f. value (at the border) of intra-SACU imports, less re-exports
E = all excise duties actually collected on goods produced in the SACU area, less the cost of financing the Secretariat, the Tariff Board, and the Tribunal, less excise duties rebated or refunded
GDPi = gross domestic product of SACU country i
GDP = total gross domestic product of SACU members
Yi = gross domestic product per capita of SACU country i
Y = average gross domestic product per capita of all SACU members.
The new formula thus has three parts:
8. The customs component (C∗(Ai/A)). Total customs duties collected in all member countries will be distributed to each country in proportion to its share of intra-SACU imports, that is, the share of imports by SACU countries from other SACU members. On the basis of 1998/99 trade, South Africa would have contributed about 80 percent to the customs component and its share of the customs pool would have been 20 percent.
9. The excise component (E∗(GDPi/GDP)). The size of this component has been set initially at 85 percent of total excise duties collected in all member countries, and will be distributed to each country in proportion to its share of SACU GDP. In 1998, South African GDP represented about 93 percent of SACU total GDP, and its share of this component would have been about 79 percent.
10. The development component (20∗(0.15)∗E∗(1-((Yi/Y)-1)/10)). The size of this component has been set initially at 15 percent of total excise duties collected in all member countries and will be distributed inversely to GDP per capita: The smaller a country’s GDP per capita, the greater its share of the development pool.
11. Thus, the BLNS countries would largely derive their total SACU revenues from the customs component, and South Africa would get most of its SACU revenue from the excise component. The development component is more important the less developed the member is (WTO, 2003).

63
12. The new 2002 agreement is more democratic than the 1969 agreement. All member countries now take part in managing the customs union and have a voice in new customs tariffs, which were previously set by South Africa’s Board on Tariffs and Trade. The decisions of all SACU institutions except the Tribunal are to be made by consensus.