quarterly report to the pennsylvania public utility commission...quarterly report to the...
TRANSCRIPT

Quarterly Report to the
Pennsylvania Public Utility Commission
For the Period
March 1, 2013 through May 31, 2013
Program Year 4, Quarter 4
For Pennsylvania Act 129 of 2008
Energy Efficiency and Conservation Plan
Prepared by West Penn Power Company and ADM Associates, Inc.
For
West Penn Power Company
Docket No. M-2009-2093218
July 15, 2013

7/15/13 | Quarterly Report to the PA PUC – Program Year 4 Quarter 4
West Penn Power Company | Page i
Table of Contents
TABLE OF CONTENTS............................................................................................................................................... I
ACRONYMS............................................................................................................................................................ II
1 OVERVIEW OF PORTFOLIO............................................................................................................................. 3
1.1 SUMMARY OF ACHIEVEMENTS .............................................................................................................................3
1.2 PROGRAM UPDATES AND FINDINGS......................................................................................................................6
1.3 EVALUATION UPDATES AND FINDINGS...................................................................................................................8
2 SUMMARY OF ENERGY IMPACTS BY PROGRAM .......................................................................................... 16
3 SUMMARY OF DEMAND IMPACTS BY PROGRAM ........................................................................................ 19
4 SUMMARY OF FINANCES ............................................................................................................................. 22
4.1 PORTFOLIO LEVEL EXPENDITURES .......................................................................................................................22
4.2 PROGRAM LEVEL EXPENDITURES ........................................................................................................................23

7/15/13 | Quarterly Report to the PA PUC – Program Year 4 Quarter 4
West Penn Power Company | Page ii
Acronyms
C & I Commercial and Industrial
CATI Computer-Aided Telephone Interview
CFL Compact Fluorescent Lamp
CPITD Cumulative Program/Portfolio Inception to Date
CPITD-Q Cumulative Program/Portfolio Inception through Current Quarter
CVR Conservation Voltage Reduction
CVRf Conservation Voltage Reduction factor
DLC Direct Load Control
EDC Electric Distribution Company
EE&C Energy Efficiency and Conservation
EM&V Evaluation, Measurement, and Verification
HVAC Heating, Ventilating, and Air Conditioning
IQ Incremental Quarter
kW Kilowatt
kWh Kilowatt-hour
LED Light Emitting Diode
LEEP Low-Income Energy Efficiency Program
LIURP Low-Income Usage Reduction Program
M&V Measurement and Verification
MW Megawatt
MWh Megawatt-hour
NTG Net-to-Gross
PUC Public Utility Commission
PY1 Program Year 2009
PY2 Program Year 2010
PY3 Program Year 2011
PY4 Program Year 2012
PY4TD Program/Portfolio Year Four to Date
SEER Seasonal Energy Efficiency Rating
SWE Statewide Evaluator
TRC Total Resource Cost
TRM Technical Reference Manual

7/15/13 | Quarterly Report to the PA PUC – Program Year 4 Quarter 4
West Penn Power Company | Page 3
1 Overview of Portfolio
Pennsylvania Act 129 of 2008 signed on October 15, 2008, mandated energy savings and demand
reduction goals for the largest electric distribution companies (EDCs) in Pennsylvania. Each EDC
submitted energy efficiency and conservation (EE&C) plans—which were approved by the Pennsylvania
Public Utility Commission (PUC)—pursuant to these goals. This report documents the progress and
effectiveness of the EE&C accomplishments for West Penn Power Company (“West Penn Power” or
“Company”) in the fourth quarter of Program Year Four (PY4) defined as March 1, 2013 through May 31,
2013, as well as the cumulative accomplishments of the programs since inception.
Based on preliminary results, West Penn Power successfully achieved the May 31, 2013 targets for
Energy Efficiency and Peak Demand Reductions.
The results depicted in this fourth quarter report (Preliminary Annual Report) of Program Year Four
(PY4) include all MWh/MW savings and associated dollars through May 31, 2013. However, additional
program savings are still being processed for projects that were installed by May 31, 2013 and are not
yet reflected in these preliminary results. These additional savings will be included in the final Annual
Report to be filed November 15, 2013.
1.1 Summary of Achievements
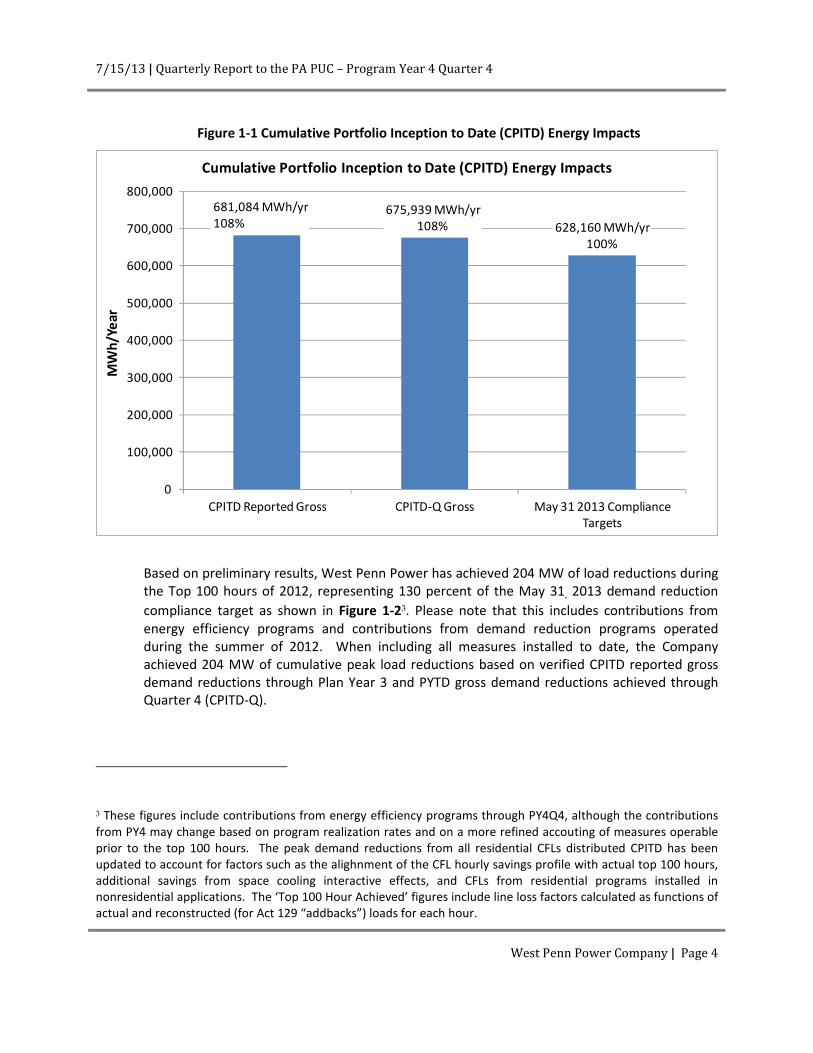
West Penn Power has achieved 108 percent of the May 31, 2013 energy savings compliance target,
based on cumulative program inception to date (CPITD) reported gross energy savings1, and 108 percent
of the energy savings compliance target, based on verified CPITD gross energy savings through Plan Year
3 and PYTD gross energy savings achieved through Quarter 4 (CPITD-Q)2, as shown in Figure 1-1.
1 CPITD Reported Gross Savings = CPITD Reported Gross Savings through PY3 + PYTD Reported Gross Savings. All
savings reported as CPITD reported gross savings are computed this way.
2 CPITD-Q Gross Savings = CPITD Verified Gross Savings through PY3 + PYTD Reported Gross Savings. All savings
reported as CPITD-Q gross savings are computed this way. CPITD-Q savings provide the best available estimate of
savings achieved through the current quarter. CPITD Verified Gross Savings will be reported in the annual report.
7/15/13 | Quarterly Report to the PA PUC – Program Year 4 Quarter 4
West Penn Power Company | Page 4
Figure 1-1 Cumulative Portfolio Inception to Date (CPITD) Energy Impacts
681,084 MWh/yr
108%675,939 MWh/yr
108% 628,160 MWh/yr
100%
0
100,000
200,000
300,000
400,000
500,000
600,000
700,000
800,000
CPITD Reported Gross CPITD-Q Gross May 31 2013 Compliance
Targets
MW
h/Y
ea
r
Cumulative Portfolio Inception to Date (CPITD) Energy Impacts
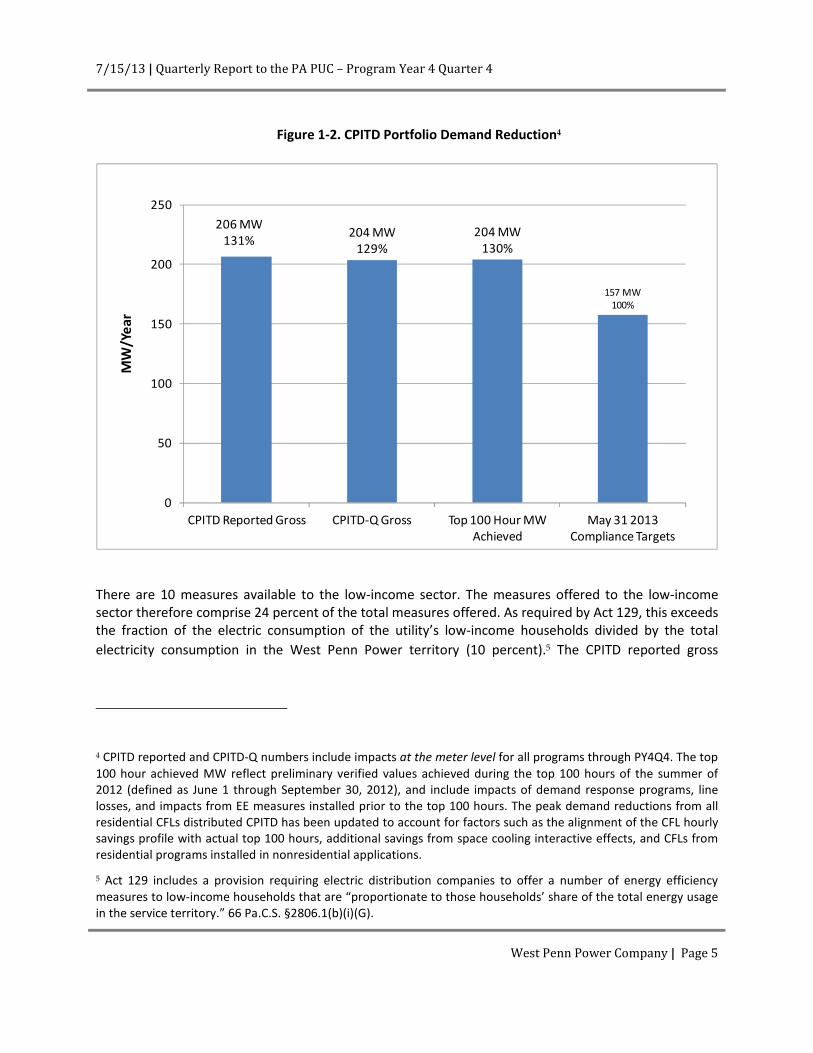
Based on preliminary results, West Penn Power has achieved 204 MW of load reductions during
the Top 100 hours of 2012, representing 130 percent of the May 31, 2013 demand reduction
compliance target as shown in Figure 1-23. Please note that this includes contributions from
energy efficiency programs and contributions from demand reduction programs operated
during the summer of 2012. When including all measures installed to date, the Company
achieved 204 MW of cumulative peak load reductions based on verified CPITD reported gross
demand reductions through Plan Year 3 and PYTD gross demand reductions achieved through
Quarter 4 (CPITD-Q).
3 These figures include contributions from energy efficiency programs through PY4Q4, although the contributions
from PY4 may change based on program realization rates and on a more refined accouting of measures operable
prior to the top 100 hours. The peak demand reductions from all residential CFLs distributed CPITD has been
updated to account for factors such as the alighnment of the CFL hourly savings profile with actual top 100 hours,
additional savings from space cooling interactive effects, and CFLs from residential programs installed in
nonresidential applications. The ‘Top 100 Hour Achieved’ figures include line loss factors calculated as functions of
actual and reconstructed (for Act 129 “addbacks”) loads for each hour.
7/15/13 | Quarterly Report to the PA PUC – Program Year 4 Quarter 4
West Penn Power Company | Page 5
Figure 1-2. CPITD Portfolio Demand Reduction4
206 MW
131%204 MW
129%
204 MW
130%
157 MW
100%
0
50
100
150
200
250
CPITD Reported Gross CPITD-Q Gross Top 100 Hour MW
Achieved
May 31 2013
Compliance Targets
MW
/Ye
ar
There are 10 measures available to the low-income sector. The measures offered to the low-income
sector therefore comprise 24 percent of the total measures offered. As required by Act 129, this exceeds
the fraction of the electric consumption of the utility’s low-income households divided by the total
electricity consumption in the West Penn Power territory (10 percent).5 The CPITD reported gross
4 CPITD reported and CPITD-Q numbers include impacts at the meter level for all programs through PY4Q4. The top
100 hour achieved MW reflect preliminary verified values achieved during the top 100 hours of the summer of
2012 (defined as June 1 through September 30, 2012), and include impacts of demand response programs, line
losses, and impacts from EE measures installed prior to the top 100 hours. The peak demand reductions from all
residential CFLs distributed CPITD has been updated to account for factors such as the alignment of the CFL hourly
savings profile with actual top 100 hours, additional savings from space cooling interactive effects, and CFLs from
residential programs installed in nonresidential applications.
5 Act 129 includes a provision requiring electric distribution companies to offer a number of energy efficiency
measures to low-income households that are “proportionate to those households’ share of the total energy usage
in the service territory.” 66 Pa.C.S. §2806.1(b)(i)(G).

7/15/13 | Quarterly Report to the PA PUC – Program Year 4 Quarter 4
West Penn Power Company | Page 6
energy savings achieved in the low-income sector is 69,139 MWh/yr; this is 10 percent of the CPITD total
portfolio reported gross energy savings6.
West Penn Power achieved 171 percent of the May 31, 2013, energy reduction compliance target for
government, nonprofit and institutional sector, based on CPITD reported gross energy savings, and 166
percent of the target based on verified CPITD gross energy savings through Plan Year 3 and PYTD gross
energy savings achieved through Quarter 4 (CPITD-Q)7, as shown in Figure 1-3.
Figure 1-3 Government, Nonprofit, and Institutional Sectors
107,122 MWh/yr
171%104,396 MWh/yr
166%
62,816 MWh/yr
100%
0
20,000
40,000
60,000
80,000
100,000
120,000
CPITD Reported Gross CPITD-Q Gross May 31 2013 Compliance
Targets
MW
h/Y
ea
r
Government, Nonprofit, and Institutional Sectors
1.2 Program Updates and Findings
• Critical Peak Rebate (CPR) Rate: No changes to this program during PY4Q4.
6 The Energy Savings achieved in the low-income sector in reports including and after the PY4Q2 report are
calculated according to the procedure in the PY3 Annual report (page 14). This is a shift from the previous
calculation procedure that was used for the PY4Q1 report, and the new methodology results in smaller claimed
impacts, thus the adjustment from the PY4Q1 report.
7 Reference footnote 2 on page 4.

7/15/13 | Quarterly Report to the PA PUC – Program Year 4 Quarter 4
West Penn Power Company | Page 7
• Residential Home Performance Program: There are four components to this program: 1) online
analyzer; 2) walk thru audits; 3) whole house audits; and, 4) behavior modification. As of this
writing, the Behavior Modification Program CSP is compiling preliminary savings calculations. There was one slight change to the Walk Thru audit program; the $50 participation fee was waived
beginning in October 2012 in an effort to boost participation and will continue through May 31, 2013.
• Residential Appliance Turn-In Program: No changes to this program during PY4Q4.
• Residential Energy Efficiency HVAC Program: No changes to this program during PY4Q4.
• Residential Energy Efficient Products Program: No changes to this program during PY4Q4.
• Residential New Construction Program: No changes to this program during PY4Q4.
• Low Income Energy Efficient Program (LIEEP): No changes to this program during PY4Q4.
• Joint Utility Usage Management Program: WPP and the natural gas distribution company’s
within the Company’s service territory regularly exchange scheduled work lists to provide
comprehensive whole house measures for customers that qualify for both companies’
programs. When a customer for both utilities cannot be scheduled at the same time, each
utility will schedule a work time that is convenient for the customer. In addition, WPP began to
realize savings results from the Low-Income, Low-Usage (LILU) mailing of energy efficiency kits
that were completed in November 2012.
• Commercial / Industrial Small Sector Equipment Program: No changes to this program during
PY4Q4. No changes during PY4Q4.
• Commercial / Industrial Large Sector Performance Contracting / Equipment Program: No
changes to this program during PY4Q4. No changes during PY4Q4.
• Commercial / Industrial Large Sector Demand Response Program – CSP Mandatory and
Voluntary Curtailment Program (“PJM Demand Response”): This program was operated
between June 1 and September 30, 2012. As of this writing, the gross / net impact evaluation
effort is completed.
• Distributed Generation: This program was removed from West Penn’s Plan under docket M-
2009-2093218 approved by the Commission on June 14, 2012.
• Time of Use (TOU) with Critical Peak Pricing (CPP) Rate: No changes to this program during
PY4Q4.
• Governmental and Institutional Program: No changes to this program during PY4Q4.
• Conservation Voltage Reduction Program: No changes to this program during the PY4Q4

7/15/13 | Quarterly Report to the PA PUC – Program Year 4 Quarter 4
West Penn Power Company | Page 8
1.3 Evaluation Updates and Findings
• Portfolio Level CPITD CFL Top 100 hour Impacts Assessment
ADM has updated the portfolio-level top 100 hour impacts with a preliminary assessment of the top-100
hour impacts from CFLs. The coincidence factor of 5% stipulated in the TRM is significantly lower than
coincidence factors from recent and relevant CFL metering studies, as can be inferred from Figure 1-4.
The 5% coincidence factor does not reflect the full peak demand reduction benefits of CFLs.
Figure 1-4 CFL hourly Savings profiles from recent studies.
0%
5%
10%
15%
20%
25%
30%
35%
1 2 3 4 5 6 7 8 9 10 11 12 13 14 15 16 17 18 19 20 21 22 23 24
Eff
ect
ive
Co
inci
de
nce
Fac
tor
Hour of Day, Averged over July
NE 2009 MD 2011
DEER 2008 CPUC 2005/2010
Fraction of Top 100 Hours for 4 EDCs
ADM has developed an hourly energy savings profile that accounts for the following factors:
o An updated load shape for CFLs. The load shape in the solid black profile is chosen for
this analysis because it results from the largest study (in terms of number of homes
metered and number of lighting loggers deployed) in a geographically comparable
region. ADM has also constructed a separate load shape for CFLs that are installed
outdoors. The fraction of CFLs installed outdoors is taken from the PA Residential
baseline study conducted by the SWE team.
o Cooling interactive effects are carefully developed based on data regarding CFL
installation areas and heating/cooling system types and prevalence. All data are taken
from the PA Residential baseline study conducted by the SWE team.
o The coincidence factors also account for “cross-sector” sales. ADM is using a
preliminary estimate of 4% cross over from the residential to the nonresidential sector.
The 4% value will be updated with in-store intercept interview results.

7/15/13 | Quarterly Report to the PA PUC – Program Year 4 Quarter 4
West Penn Power Company | Page 9
• Residential Appliance Turn-In Program
The evaluation methodology for this program is unchanged from PY3. Preliminary realization rates
have been constructed from information gained from the evaluation effort conducted for PY3.
These will be updated as PY4 evaluation survey results become available.
Table 1.3.1 Residential Appliance Turn-In Program Evaluation Summary
Program Component Evaluation Activities Planned Evaluation Activities Status
Refrigerator
Freezer
Room air conditioner
Tracking System/TRM Review
Verification Surveys
ADM has conducted preliminary
desk reviews.
• Residential Energy Efficient Products Program
The sampling scheme for this program includes several qualitative strata for lighting and appliances.
Evaluation activities for the strata are listed below.
Table 1.3.2 Residential Energy Efficient Products Program Evaluation Summary
Program Component Evaluation Activities Planned Evaluation Activities Status
CFL Buydowns Invoice + calculation review
CFL Giveaways Invoice + calculation review
Appliances
Invoice + calculation review
On-Site inspection
PY4 evaluation activities to date
include calculation and ex-ante
reviews and assignment of preliminary
realization rate based on desk review
and application of updated TRM
protocols. A careful treatment of CFL
impacts in the top 100 hours is
underway, with preliminary results
included in this report.

7/15/13 | Quarterly Report to the PA PUC – Program Year 4 Quarter 4
West Penn Power Company | Page 10
• Residential Energy Efficient HVAC Equipment Program
The sampling scheme for this program includes four qualitative strata. Evaluation activities for the
strata are listed below. Preliminary realization rates are based on information gained from the PY3
evaluation. These will be updated as PY4 evaluation results become available.
Table 1.3.3 Residential Energy Efficient HVAC Equipment Program Evaluation Summary
Program Component Evaluation Activities Planned Evaluation Activities Status
Air Source Heat Pump
Invoice + calculation review
On-Site inspection
Ground Source Heat
Pump
Invoice + calculation review
On-Site inspection
Central Air Conditioning
Invoice + calculation review
On-Site inspection
HVAC tune-ups Invoice + calculation review, and
telephone verification surveys
PY4 evaluation activities to date
include calculation and ex-ante
reviews and assignment of preliminary
realization rate based on desk review
and application of updated TRM
protocols. The average efficiencies
and capacities from the PY3 evaluation
are used to generate preliminary
realization rates for this program.
• Residential Home Performance Program
The Residential Home Performance Program assists households in identifying energy savings
opportunities through self-administered and professional walk-through home audits and providing
customers with CFLs and other low cost energy savings measures. The program promotes CFL
giveaways through several CFL promotional channels, including Opt-in, Smart Meter and School Kits.
The program also includes a behavioral modification and education component designed to provide
customers with information about their energy usage and low cost ways they can reduce usage.

7/15/13 | Quarterly Report to the PA PUC – Program Year 4 Quarter 4
West Penn Power Company | Page 11
Table 1.3.4 Residential Home Performance Program Evaluation Summary
Program Component Evaluation Activities Planned Evaluation Activities Status
Conservation Kits Survey representative sample of
participants
ADM has conducted desk reviews of
the tracking data and has constructed
preliminary realization rates that
consider historical “in service rates”
and successful delivery rates, as well
as changes in the TRM protocols.
Direct Install of Low-Cost
Measures
Sample once for entire PY4,
conduct engineering review and
verification surveys.
ADM has conducted preliminary desk
reviews.
Behavior Modification Billing Analysis
M&V plans are completed and initial
data requests have been made by the
M&V team.
Critical Peak Rebate (CPR) Rate
Impact evaluation for this program is complete on a preliminary basis. The program achieved 13.0
MW demand reduction averaged over the top 100 hours, compared to a goal of 8.5 MW.
• Limited Income Energy Efficient Program (LIEEP)
This program is separated into two strata for evaluation purposes. Evaluation activities are similar
for the two strata and are described in the table below.
Table 1.3.5 Joint Utility Usage Management Program Evaluation Summary
Program Component Evaluation Activities Planned Evaluation Activities Status
In-home services
Invoice + calculation review and
telephone verification surveys
ADM has conducted preliminary desk
reviews. Sample will be drawn
shortly after PY2Q2 report is filed.
Conservation Kits Invoice + calculation review and
telephone verification surveys
ADM has conducted preliminary desk
reviews. Sample will be drawn
shortly after PY2Q2 report is filed.
7/15/13 | Quarterly Report to the PA PUC – Program Year 4 Quarter 4
West Penn Power Company | Page 12
• Joint Utility Usage Management Program
This program is separated into two strata for evaluation purposes. Evaluation activities are similar
for the two strata and are described in the table below.
Table 1.3.6 Joint Utility Usage Management Program Evaluation Summary
Program Component Evaluation Activities Planned Evaluation Activities Status
JUUMP Comprehensive
Audits
Study feasibility of billing analysis and
conduct billing analysis for PY4 if
practicable.
ADM has conducted preliminary
tracking data reviews.
Conservation Kits Invoice + calculation review and
telephone verification surveys
ADM has conducted preliminary
tracking data reviews.
• Commercial & Industrial Equipment Program – Small
This program offers energy efficiency measures to small commercial/industrial customers. The
impact evaluation utilizes stratified sampling. First, the population is stratified into qualitative strata
that consist of standardized measure groups as listed below. Each qualitative stratum may contain
several quantitative strata based on the expected magnitude of the impacts. The sample sizes are
based on past program experience regarding the variability of the realization rates for sampled
projects.
Table 1.3.6 Commercial & Industrial Equipment Program Evaluation Summary
Program Component Evaluation Activities Planned Evaluation Activities Status
“Lighting for Business”
Applications Stratified sampling and on-site visits
Samples through PY4Q4 are drawn
and on-site work is expected to
continue through September 2013.
HVAC and Prescriptive
Motors
Sample for first 2 quarters, then for
each subsequent quarter. Conduct
on-sites and analyses as required.
Samples through PY4Q4 are drawn
and on-site work is expected to
continue through September 2013.
Custom
Sample for first 2 quarters, then for
each subsequent quarter. Conduct
on-sites and analyses as required.
All large (above 1 GWh) custom
projects have been sampled with
certainty and evaluated 2013.

7/15/13 | Quarterly Report to the PA PUC – Program Year 4 Quarter 4
West Penn Power Company | Page 13
• Time of Use (TOU) with Critical Peak Pricing (CPP) Rate
This program had no participation; no impact evaluation will be performed.
• Commercial & Industrial Equipment Program – Large
This program offers similar measures as the Small C/I and Government Equipment programs. The
evaluation approach for this program is similar to the one employed for the Small C/I program.
Table 1.3.7 Commercial & Industrial Equipment Program Evaluation Summary
Program Component Evaluation Activities Planned Evaluation Activities Status
“Lighting for Business”
Applications Stratified sampling and on-site visits
Samples through PY4Q4 are drawn
and on-site work is expected to
continue through September.
Prescriptive HVAC,
Motor, and
Refrigeration
Applications
Stratified sampling and on-site visits
Samples through PY4Q4 are drawn
and on-site work is expected to
continue through September.
Custom Applications Stratified sampling and on-site visits
All large (above 1 GWh) custom
projects have been sampled with
certainty and evaluated.
• Customer Load Response
Impact evaluation for this program is complete on a preliminary basis8. The evaluation effort
involved stratified sampling and inspection of the hourly demand reduction calculations for selected
projects. Projects that have base load estimation protocols accepted by and registered by PJM are
evaluated on the basis of those protocols. Projects that do not have PJM registrations are evaluated
independently, though with protocols that are similar to or derivative of the PJM base load
estimation protocols.
8 Site-level hourly impacts verified on a preliminary basis are undergoing final quality assurance checks for a
stratified sample of projects to meet ±15% relative precision at the 85% confidence level. However the top 100
hour definitions and the hourly line loss factors may change based on the additional contributions from energy
efficiency projects that are not yet evaluated.

7/15/13 | Quarterly Report to the PA PUC – Program Year 4 Quarter 4
West Penn Power Company | Page 14
• Customer Resources Demand Response Program
Impact evaluation for this program is complete on a preliminary basis9. The evaluation effort
involved stratified sampling and inspection of the hourly demand reduction calculations for selected
projects. Projects that have base load estimation protocols accepted by and registered by PJM are
evaluated on the basis of those protocols. Projects that do not have PJM registrations are evaluated
with protocols that are identical to or similar to the PJM base load estimation protocols.
• Distributed Generation
This program had no participation; no impact evaluation will be performed.
• Conservation Voltage Reduction Program
The CVR program incorporates voltage regulation techniques on select distribution circuits that
result in lower service voltage levels and, thus, lower the energy consumption and demand of
customers. Three sets of retrofit isolation tests are planned: One in Winter 2013, one in Spring
2013, and one in Summer 2013.
• Governmental & Institutional Program
This program provides prescriptive and performance based incentives for the installation of cost
effective energy efficient non-standard equipment through an authorized contractor network and
traditional channels. The evaluation approach for this program is similar to the one employed for
the other nonresidential energy efficiency programs.
9 Site-level hourly impacts verified on a preliminary basis are undergoing final quality assurance checks for a
stratified sample of projects to meet ±15% relative precision at the 85% confidence level. However the top 100
hour definitions and the hourly line loss factors may change based on the additional contributions from energy
efficiency projects that are not yet evaluated.

7/15/13 | Quarterly Report to the PA PUC – Program Year 4 Quarter 4
West Penn Power Company | Page 15
Table 1.3.8 Governmental & Institutional Program Evaluation Summary
Program Component Evaluation Activities Planned Evaluation Activities Status
Lighting Stratified sampling and on-site visits On site verifications are expected to
continue through September 2013.
Street Lighting Stratified sampling and on-site visits On site verifications are expected to
continue through September 2013.
Traffic Signals Stratified sampling and on-site visits On site verifications are expected to
continue through September 2013.

7/15/13 | Quarterly Report to the PA PUC – Program Year 4 Quarter 4
West Penn Power Company | Page 16
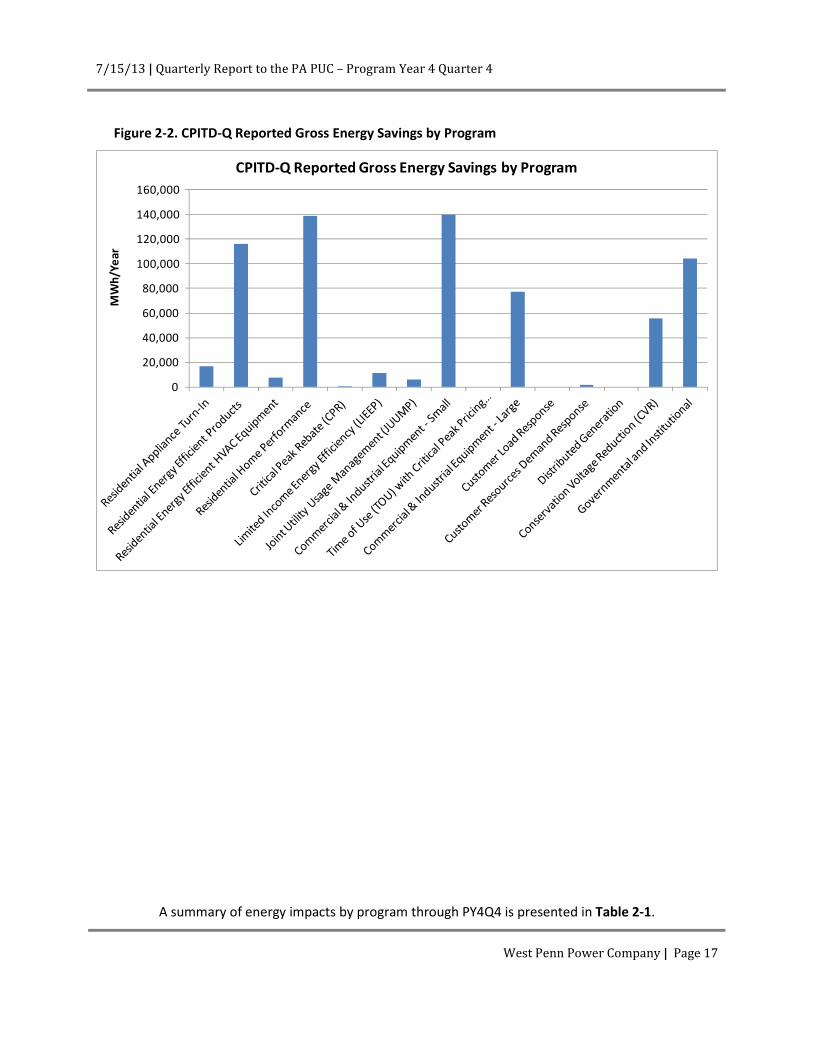
2 Summary of Energy Impacts by Program
A summary of the reported energy savings by program is presented in Figure 2-1.
Figure 2-1. CPITD Reported Gross Energy Savings by Program
0
20,000
40,000
60,000
80,000
100,000
120,000
140,000
160,000
MW
h/Y
ea
r
CPITD Reported Gross Energy Savings by Program
7/15/13 | Quarterly Report to the PA PUC – Program Year 4 Quarter 4
West Penn Power Company | Page 17
Figure 2-2. CPITD-Q Reported Gross Energy Savings by Program
0
20,000
40,000
60,000
80,000
100,000
120,000
140,000
160,000
MW
h/Y
ea
r
CPITD-Q Reported Gross Energy Savings by Program
A summary of energy impacts by program through PY4Q4 is presented in Table 2-1.

7/15/13 | Quarterly Report to the PA PUC – Program Year 4 Quarter 4
West Penn Power Company | Page 18
Table 2-1. EDC Reported Participation and Gross Energy Savings by Program
Reported Gross Impact
Participants (MWh/Year)
Preliminary
Realization
Rate1
Program IQ PYTD CPITD IQ PYTD CPITD CPITD-Q PYTD
Residential Appliance Turn-In 915 5,217 11,233 1,612 9,251 18,646 17,036 77.9%
Residential Energy Efficient Products 98,234 271,895 597,851 17,770 48,243 117,243 115,946 86.5%
Residential Energy Efficient HVAC
Equipment 1,177 10,440 13,913 662 4,193 7,428 7,672 96.6%
Residential Home Performance² 2,731 189,170 561,647 10,578 23,500 141,029 138,651 92.1%
Critical Peak Rebate (CPR) 0 23,974 23,974 0 620 620 620 n/a
Limited Income Energy Efficiency
(LIEEP) 0 424 10,702 0 522 13,149 11,490 100.0%
Joint Utility Usage Management
(JUUMP) 0 4,396 8,708 0 2,362 6,045 5,977 98.9%
Commercial & Industrial Equipment –
Small 326 11,527 37,677 27,730 61,973 136,376 139,655 95.0%
Time of Use (TOU) with Critical Peak
Pricing (CPP) 0 0 0 0 0 0 0 n/a
Commercial & Industrial Equipment -
Large 48 135 184 17,254 51,390 75,951 77,022 95.0%
Customer Load Response 0 0 0 0 0 0 0 n/a
Customer Resources Demand
Response 0 155 155 0 1,567 1,567 1,567 n/a
Distributed Generation 0 0 0 0 0 0 0 n/a
Conservation Voltage Reduction
(CVR)³ 0 0 0 0 55,907 55,907 55,907 95.0%
Governmental and Institutional 97 215 1,279 13,836 22,173 107,122 104,396 1
TOTAL PORTFOLIO 103,528 517,548 1,267,323 89,440 281,701 681,084 675,939 n/a
NOTES:
1. Preliminary Realization Rates are based on evaluation activities and findings conducted on a partial sample set. These
realization rates are not based on a statistically significant sample and are subject to change until the full evaluation is
complete at the end of the program year. In this report, the realization rates for residential programs are based on
tracking system review, incorporation of TRM updates, and historical verification/in-service rates. For nonresidential
programs, a preliminary placeholder of 95% is used based on historical program performance.
2. Residential Home Performance participation includes 175,000 participants for Behavior Modification measure. No
savings results were reported to date.
3. Conservation Voltage Reduction reported energy savings is based on preliminary engineering assessment.

7/15/13 | Quarterly Report to the PA PUC – Program Year 4 Quarter 4
West Penn Power Company | Page 19
3 Summary of Demand Impacts by Program
A summary of the reported demand reduction by program is presented in Figure 3-1.
Figure 3-1. CPITD Reported Demand Reduction by Program.
0.00
10.00
20.00
30.00
40.00
50.00
60.00
70.00
80.00
90.00
MW
/Ye
ar
CPITD-Q Reported Demand Reduction by Program
7/15/13 | Quarterly Report to the PA PUC – Program Year 4 Quarter 4
West Penn Power Company | Page 20
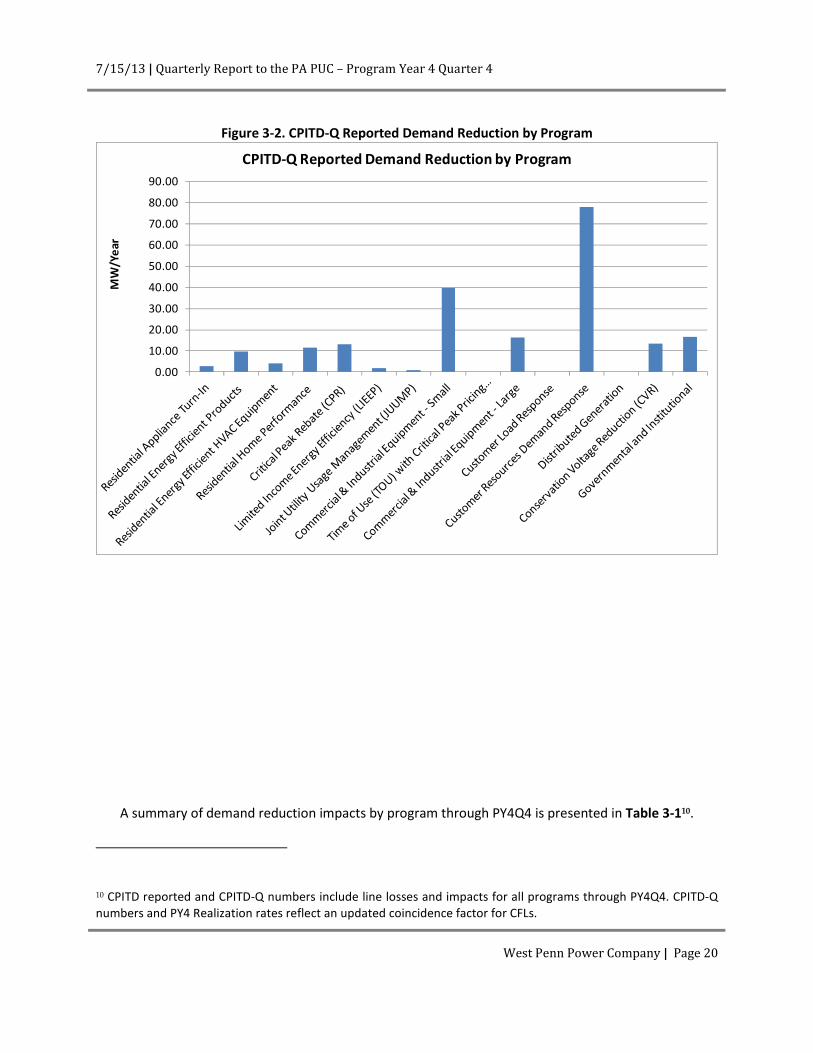
Figure 3-2. CPITD-Q Reported Demand Reduction by Program
0.00
10.00
20.00
30.00
40.00
50.00
60.00
70.00
80.00
90.00
MW
/Ye
ar
CPITD-Q Reported Demand Reduction by Program
A summary of demand reduction impacts by program through PY4Q4 is presented in Table 3-110.
10 CPITD reported and CPITD-Q numbers include line losses and impacts for all programs through PY4Q4. CPITD-Q
numbers and PY4 Realization rates reflect an updated coincidence factor for CFLs.

7/15/13 | Quarterly Report to the PA PUC – Program Year 4 Quarter 4
West Penn Power Company | Page 21
Table 3-1. Participation and Reported Gross Demand Reduction by Program
Reported Gross Impact
Participants (MW/Year)
Preliminary
Realization
Rate1
Program IQ PYTD CPITD IQ PYTD CPITD CPITD-Q PYTD
Residential Appliance Turn-In 915 5,217 11,233 0.23 1.29 2.99 2.79 80.3%
Residential Energy Efficient Products 98,234 271,895 597,851 0.87 2.41 8.24 9.81 150.3%
Residential Energy Efficient HVAC
Equipment 1,177 10,440 13,913 0.33 2.93 4.12 4.03 76.5%
Residential Home Performance² 2,731 189,170 561,647 1.12 2.28 7.74 11.65 206.3%
Critical Peak Rebate (CPR) 0 23,974 23,974 0.00 12.99 12.99 12.99 n/a
Limited Income Energy Efficiency
(LIEEP) 0 424 10,702 0.00 0.06 2.25 1.69 100.0%
Joint Utility Usage Management
(JUUMP) 0 4,396 8,708 0.00 0.39 0.92 0.93 98.5%
Commercial & Industrial Equipment -
Small 326 11,527 37,677 17.57 25.36 45.92 39.66 95.0%
Time of Use (TOU) with Critical Peak
Pricing (CPP) 0 0 0 0.00 0.00 0.00 0.00 n/a
Commercial & Industrial Equipment -
Large 48 135 184 7.48 11.73 15.98 16.13 95.0%
Customer Load Response 0 0 0 0.00 0.00 0.00 0.00 n/a
Customer Resources Demand
Response 0 155 155 0.00 77.84 77.84 77.84 100.0%
Distributed Generation 0 0 0 0.00 0.00 0.00 0.00 n/a
Conservation Voltage Reduction
(CVR)³ 0 0 0 0.00 13.30 13.30 13.30 95.0%
Governmental and Institutional 97 215 1,279 2.60 3.56 18.11 16.66 95.0%
TOTAL PORTFOLIO 103,528 517,548 1,267,323 30.20 154.14 210.40 207.48 n/a
NOTES:
1. Preliminary Realization Rates are based on evaluation activities and findings conducted on a partial sample set.
These realization rates are not based on a statistically significant sample and are subject to change until the full
evaluation is complete at the end of the program year. In this report, the realization rates for residential programs
are based on tracking system review, incorporation of TRM updates, and historical verification/in-service rates.
For nonresidential programs, a preliminary placeholder of 95% is used based on historical program performance.
2. Residential Home Performance participation includes 175,000 participants for Behavior Modification measure.
No savings results were reported to date.
3. Conservation Voltage Reduction reported demand savings is based on preliminary engineering assessment.

7/15/13 | Quarterly Report to the PA PUC – Program Year 4 Quarter 4
West Penn Power Company | Page 22
4 Summary of Finances
4.1 Portfolio Level Expenditures
A breakdown of the portfolio finances is presented in Error! Reference source not found..
Table 4-1. Summary of Portfolio Finances
IQ
($000)
PYTD
($000)
CPITD
($000)
EDC Incentives to Participants $ 5,088 $ 19,870 $ 44,142
EDC Incentives to Trade Allies
Subtotal EDC Incentive Costs $ 5,088 $ 19,870 $ 43,991
Design & Development $ 5 $ 1,792
Administration $ 141 $ 1,298 $ 4,849
Management1
Marketing $ 755 $ 1,744 $ 6,828
Technical Assistance2
$ 2,420 $ 6,624 $ 16,869
Subtotal EDC Implementation Costs $ 3,316 $ 9,671 $ 30,338
EDC Evaluation Costs $ 157 $ 532 $ 2,048
SWE Audit Costs $ 310
3 $ 2,304
Total EDC Costs $ 8,561 $ 30,384 $ 78,682
Participant Costs
Total TRC Costs
Notes: 1EDC costs other than those identified explicitly.
2Implementation Contractor Costs.
3SWE Audit Costs from PY4 Q1 included in PYTD.

7/15/13 | Quarterly Report to the PA PUC – Program Year 4 Quarter 4
West Penn Power Company | Page 23
4.2 Program Level Expenditures
Program-specific finances are shown in the following tables.
Table 4-2. Summary of Program Finances – Residential Appliance Turn-In Program
IQ
($000)
PYTD
($000)
CPITD
($000)
EDC Incentives to Participants $ 51 $ 247 $ 663
EDC Incentives to Trade Allies
Subtotal EDC Incentive Costs $ 51 $ 247 $ 663
Design & Development $ 0 $ 0 $ 1
Administration $ 1 $ 10 $ 138
Management1
Marketing $ 25 $ 105 $ 935
Technical Assistance2 $ 87 $ 411 $ 1,354
Subtotal EDC Implementation Costs $ 114 $ 526 $ 2,428
EDC Evaluation Costs $ 9 $ 21 $ 105
SWE Audit Costs
Total EDC Costs $ 174 $ 793 $ 3,196
Participant Costs
Total TRC Costs
Notes: 1EDC costs other than those identified explicitly.
2Implementation Contractor Costs.

7/15/13 | Quarterly Report to the PA PUC – Program Year 4 Quarter 4
West Penn Power Company | Page 24
Table 4-3. Summary of Program Finances – Residential Energy Efficient Products Program
IQ
($000)
PYTD
($000)
CPITD
($000)
EDC Incentives to Participants $ 433 $ 1,050 $ 4,419
EDC Incentives to Trade Allies
Subtotal EDC Incentive Costs $ 433 $ 1,050 $ 4,419
Design & Development $ 1 $ 1 $ 266
Administration $ 16 $ 187 $ 560
Management1
Marketing $ 125 $ 231 $ 2,375
Technical Assistance2 $ 348 $ 1,800 $ 2,656
Subtotal EDC Implementation Costs $ 490 $ 2,219 $ 5,857
EDC Evaluation Costs $ 20 $ 54 $ 346
SWE Audit Costs
Total EDC Costs $ 943 $ 3,324 $ 10,622
Participant Costs
Total TRC Costs
Notes: 1EDC costs other than those identified explicitly.
2Implementation Contractor Costs.

7/15/13 | Quarterly Report to the PA PUC – Program Year 4 Quarter 4
West Penn Power Company | Page 25
Table 4-4. Summary of Program Finances – Residential Energy Efficient HVAC Equipment Program
IQ
($000)
PYTD
($000)
CPITD
($000)
EDC Incentives to Participants $ 152 $ 919 $ 1,550
EDC Incentives to Trade Allies
Subtotal EDC Incentive Costs $ 152 $ 919 $ 1,550
Design & Development $ 0 $ 0 $ 123
Administration $ 5 $ 50 $ 183
Management1
Marketing $ 44 $ 242 $ 442
Technical Assistance2 $ 46 $ 29 $ 287
Subtotal EDC Implementation Costs $ 95 $ 321 $ 1,035
EDC Evaluation Costs $ 2 $ 22 $ 121
SWE Audit Costs
Total EDC Costs $ 249 $ 1,263 $ 2,707
Participant Costs
Total TRC Costs
Notes: 1EDC costs other than those identified explicitly.
2Implementation Contractor Costs.

7/15/13 | Quarterly Report to the PA PUC – Program Year 4 Quarter 4
West Penn Power Company | Page 26
Table 4-5. Summary of Program Finances – Residential Home Performance Program
IQ
($000)
PYTD
($000)
CPITD
($000)
EDC Incentives to Participants $ 467 $ 863 $ 6,608
EDC Incentives to Trade Allies
Subtotal EDC Incentive Costs $ 467 $ 863 $ 6,608
Design & Development $ 1 $ 1 $ 136
Administration $ 21 $ 185 $ 414
Management1
Marketing $ 60 $ 301 $ 1,148
Technical Assistance2 $ 297 $ (642) $ 3,337
Subtotal EDC Implementation Costs $ 379 $ (155) $ 5,036
EDC Evaluation Costs $ 25 $ 40 $ 194
SWE Audit Costs
Total EDC Costs $ 871 $ 748 $ 11,838
Participant Costs
Total TRC Costs
Notes: 1EDC costs other than those identified explicitly.
2Implementation Contractor Costs.

7/15/13 | Quarterly Report to the PA PUC – Program Year 4 Quarter 4
West Penn Power Company | Page 27
Table 4-6. Summary of Program Finances – Critical Peak Rebate (CPR) Rate
IQ
($000)
PYTD
($000)
CPITD
($000)
EDC Incentives to Participants $ 513 $ 513
EDC Incentives to Trade Allies
Subtotal EDC Incentive Costs $ 513 $ 513
Design & Development $ 0 $ 0 $ 6
Administration $ 2 $ 23 $ 94
Management1
Marketing $ 0 $ 1 $ 180
Technical Assistance2 $ 12 $ 100 $ 132
Subtotal EDC Implementation Costs $ 15 $ 123 $ 412
EDC Evaluation Costs $ 24 $ 51 $ 68
SWE Audit Costs
Total EDC Costs $ 39 $ 687 $ 994
Participant Costs
Total TRC Costs
Notes: 1EDC costs other than those identified explicitly.
2Implementation Contractor Costs.

7/15/13 | Quarterly Report to the PA PUC – Program Year 4 Quarter 4
West Penn Power Company | Page 28
Table 4-7. Summary of Program Finances – Limited Income Energy Efficiency Program (LIEEP)
IQ
($000)
PYTD
($000)
CPITD
($000)
EDC Incentives to Participants $ 7,021
EDC Incentives to Trade Allies
Subtotal EDC Incentive Costs $ 7,021
Design & Development $ 0 $ 0 $ 41
Administration $ 7 $ 39 $ 345
Management1
Marketing $ 1 $ 2 $ 19
Technical Assistance2 $ 2 $ (717) $ (25)
Subtotal EDC Implementation Costs $ 11 $ (675) $ 380
EDC Evaluation Costs $ 3 $ 5 $ 57
SWE Audit Costs
Total EDC Costs $ 14 $ (670) $ 7,459
Participant Costs
Total TRC Costs
Notes: 1EDC costs other than those identified explicitly.
2Implementation Contractor Costs.
3 Negative values listed in IQ and PYTD columns reflect accounting adjustments during the quarter.

7/15/13 | Quarterly Report to the PA PUC – Program Year 4 Quarter 4
West Penn Power Company | Page 29
Table 4-8. Summary of Program Finances – Joint Utility Usage Management Program
IQ
($000)
PYTD
($000)
CPITD
($000)
EDC Incentives to Participants $ 762 $ 1,437
EDC Incentives to Trade Allies
Subtotal EDC Incentive Costs $ 762 $ 1,286
Design & Development $ 0 $ 0 $ 25
Administration $ 5 $ 151 $ 324
Management1
Marketing $ 1 $ 8 $ 22
Technical Assistance2 $ 58 $ 2,729 $ 3,012
Subtotal EDC Implementation Costs $ 63 $ 2,888 $ 3,383
EDC Evaluation Costs $ 2 $ 35 $ 85
SWE Audit Costs
Total EDC Costs $ 65 $ 3,684 $ 4,753
Participant Costs
Total TRC Costs
Notes: 1EDC costs other than those identified explicitly.
2Implementation Contractor Costs.

7/15/13 | Quarterly Report to the PA PUC – Program Year 4 Quarter 4
West Penn Power Company | Page 30
Table 4-9. Summary of Program Finances – Commercial & Industrial Equipment Program - Small
IQ
($000)
PYTD
($000)
CPITD
($000)
EDC Incentives to Participants $ 1,551 $ 3,336 $ 6,621
EDC Incentives to Trade Allies
Subtotal EDC Incentive Costs $ 1,551 $ 3,336 $ 6,621
Design & Development $ 1 $ 1 $ 310
Administration $ 33 $ 215 $ 1,076
Management1
Marketing $ 460 $ 696 $ 1,140
Technical Assistance2 $ 1,268 $ 2,156 $ 3,297
Subtotal EDC Implementation Costs $ 1,763 $ 3,069 $ 5,823
EDC Evaluation Costs $ 33 $ 169 $ 556
SWE Audit Costs
Total EDC Costs $ 3,346 $ 6,573 $ 13,000
Participant Costs
Total TRC Costs
Notes: 1EDC costs other than those identified explicitly.
2Implementation Contractor Costs.

7/15/13 | Quarterly Report to the PA PUC – Program Year 4 Quarter 4
West Penn Power Company | Page 31
Table 4-10. Summary of Program Finances – Time of Use (TOU) with Critical Peak Pricing (CPP) Rate
IQ
($000)
PYTD
($000)
CPITD
($000)
EDC Incentives to Participants
EDC Incentives to Trade Allies
Subtotal EDC Incentive Costs
Design & Development $ 0 $ 0 $ 6
Administration $ 1 $ 27 $ 72
Management1
Marketing $ 0 $ 0 $ 17
Technical Assistance2 $ 0 $ (5) $ 23
Subtotal EDC Implementation Costs $ 2 $ 22 $ 118
EDC Evaluation Costs $ 4 $ 20 $ 32
SWE Audit Costs
Total EDC Costs $ 6 $ 42 $ 150
Participant Costs
Total TRC Costs
Notes: 1EDC costs other than those identified explicitly.
2Implementation Contractor Costs.

7/15/13 | Quarterly Report to the PA PUC – Program Year 4 Quarter 4
West Penn Power Company | Page 32
Table 4-11. Summary of Program Finances – Commercial & Industrial Equipment Program – Large
IQ
($000)
PYTD
($000)
CPITD
($000)
EDC Incentives to Participants $ 1,111 $ 3,019 $ 4,917
EDC Incentives to Trade Allies
Subtotal EDC Incentive Costs $ 1,111 $ 3,019 $ 4,917
Design & Development $ 0 $ 0 $ 668
Administration $ 14 $ 101 $ 668
Management1
Marketing $ 12 $ 111 $ 295
Technical Assistance2 $ 162 $ 249 $ 1,507
Subtotal EDC Implementation Costs $ 188 $ 462 $ 3,138
EDC Evaluation Costs $ 4 $ 22 $ 110
SWE Audit Costs
Total EDC Costs $ 1,303 $ 3,503 $ 8,165
Participant Costs
Total TRC Costs
Notes: 1EDC costs other than those identified explicitly.
2Implementation Contractor Costs.

7/15/13 | Quarterly Report to the PA PUC – Program Year 4 Quarter 4
West Penn Power Company | Page 33
Table 4-12. Summary of Program Finances – Customer Load Response Program
IQ
($000)
PYTD
($000)
CPITD
($000)
EDC Incentives to Participants $ 15
EDC Incentives to Trade Allies
Subtotal EDC Incentive Costs $ 15
Design & Development $ 0 $ 0 $ 88
Administration $ 3 $ 21 $ 99
Management1
Marketing $ 0 $ 0 $ 3
Technical Assistance2 $ 1 $ 4 $ 46
Subtotal EDC Implementation Costs $ 4 $ 26 $ 235
EDC Evaluation Costs $ 1 $ 4 $ 18
SWE Audit Costs
Total EDC Costs $ 4 $ 30 $ 268
Participant Costs
Total TRC Costs
Notes: 1EDC costs other than those identified explicitly.
2Implementation Contractor Costs.
7/15/13 | Quarterly Report to the PA PUC – Program Year 4 Quarter 4
West Penn Power Company | Page 34
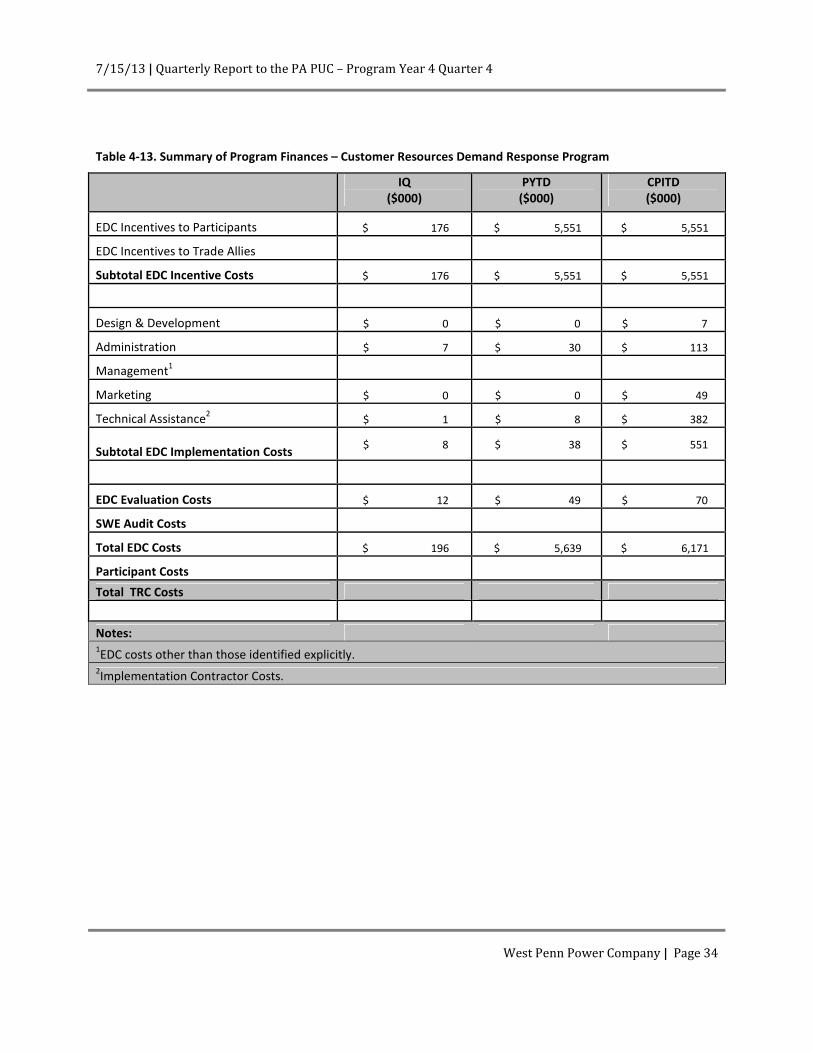
Table 4-13. Summary of Program Finances – Customer Resources Demand Response Program
IQ
($000)
PYTD
($000)
CPITD
($000)
EDC Incentives to Participants $ 176 $ 5,551 $ 5,551
EDC Incentives to Trade Allies
Subtotal EDC Incentive Costs $ 176 $ 5,551 $ 5,551
Design & Development $ 0 $ 0 $ 7
Administration $ 7 $ 30 $ 113
Management1
Marketing $ 0 $ 0 $ 49
Technical Assistance2 $ 1 $ 8 $ 382
Subtotal EDC Implementation Costs $ 8 $ 38 $ 551
EDC Evaluation Costs $ 12 $ 49 $ 70
SWE Audit Costs
Total EDC Costs $ 196 $ 5,639 $ 6,171
Participant Costs
Total TRC Costs
Notes: 1EDC costs other than those identified explicitly.
2Implementation Contractor Costs.
7/15/13 | Quarterly Report to the PA PUC – Program Year 4 Quarter 4
West Penn Power Company | Page 35
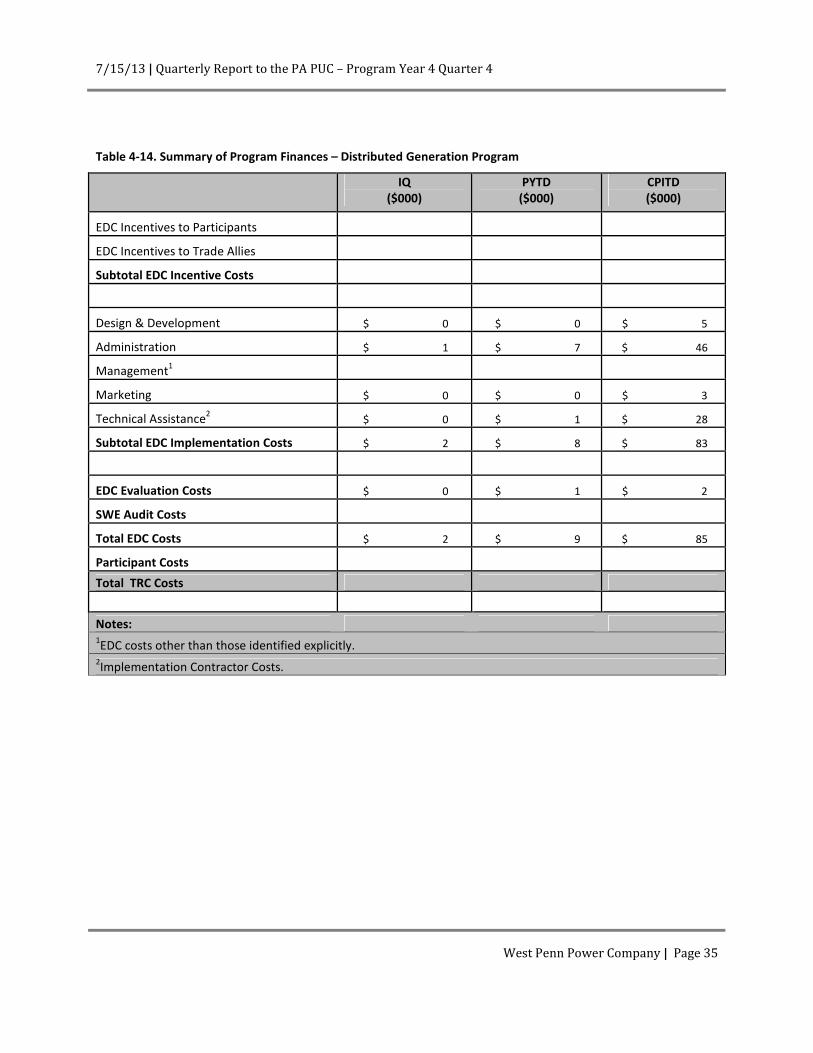
Table 4-14. Summary of Program Finances – Distributed Generation Program
IQ
($000)
PYTD
($000)
CPITD
($000)
EDC Incentives to Participants
EDC Incentives to Trade Allies
Subtotal EDC Incentive Costs
Design & Development $ 0 $ 0 $ 5
Administration $ 1 $ 7 $ 46
Management1
Marketing $ 0 $ 0 $ 3
Technical Assistance2 $ 0 $ 1 $ 28
Subtotal EDC Implementation Costs $ 2 $ 8 $ 83
EDC Evaluation Costs $ 0 $ 1 $ 2
SWE Audit Costs
Total EDC Costs $ 2 $ 9 $ 85
Participant Costs
Total TRC Costs
Notes: 1EDC costs other than those identified explicitly.
2Implementation Contractor Costs.

7/15/13 | Quarterly Report to the PA PUC – Program Year 4 Quarter 4
West Penn Power Company | Page 36
Table 4-15. Summary of Program Finances – Conservation Voltage Reduction (CVR) Program
IQ
($000)
PYTD
($000)
CPITD
($000)
EDC Incentives to Participants $ 3 $ 3
EDC Incentives to Trade Allies
Subtotal EDC Incentive Costs $ 3 $ 3
Design & Development $ 0 $ 0 $ 0
Administration $ 8 $ 192 $ 283
Management1
Marketing $ 0 $ 0 $ 0
Technical Assistance2 $ 1 $ 54 $ 58
Subtotal EDC Implementation Costs $ 9 $ 246 $ 342
EDC Evaluation Costs $ 16 $ 19 $ 21
SWE Audit Costs
Total EDC Costs $ 25 $ 267 $ 366
Participant Costs
Total TRC Costs
Notes: 1EDC costs other than those identified explicitly.
2Implementation Contractor Costs.

7/15/13 | Quarterly Report to the PA PUC – Program Year 4 Quarter 4
West Penn Power Company | Page 37
Table 4-16. Summary of Program Finances – Governmental and Institutional Program
IQ
($000)
PYTD
($000)
CPITD
($000)
EDC Incentives to Participants $ 1,149 $ 3,607 $ 4,825
EDC Incentives to Trade Allies
Subtotal EDC Incentive Costs $ 1,149 $ 3,607 $ 4,825
Design & Development $ 0 $ 0 $ 111
Administration $ 15 $ 59 $ 431
Management1
Marketing $ 27 $ 46 $ 198
Technical Assistance2 $ 136 $ 448 $ 776
Subtotal EDC Implementation Costs $ 179 $ 553 $ 1,516
EDC Evaluation Costs $ 3 $ 19 $ 262
SWE Audit Costs
Total EDC Costs $ 1,330 $ 4,179 $ 6,604
Participant Costs
Total TRC Costs
Notes: 1EDC costs other than those identified explicitly.
2Implementation Contractor Costs.