quarterly report 3rd quarter 2021
TRANSCRIPT

3. kvartal 2021 KONGSBERG 1
QUARTERLYREPORT
3rd QUARTER 2021

2 3rd quarter 2021 KONGSBERG
GEIR HÅØYPresident & CEO
“KONGSBERG has delivered profitable growth and a record high order intake of over NOK 15 billion. The increase in turnover was mainly driven by Kongsberg Defence & Aerospace (KDA), which can point to good growth over a number of quarters with deliveries for several large defence programmes. Kongsberg Maritime (KM) has continued to improve profitability in a market where we now start to see increased activity in some segments.
For Kongsberg Digital (KDI), the main priorities are to expand the customer portfolio and to further develop the digital ecosystem for Vessel Insight and Kognitwin. Within the business area, three important fleet roll-out contracts for Vessel Insight were signed during the quarter. The roll-out of Kognitwin, the business area’s dynamic digital twin solution, is continuing, and we have now installed twins for upstream, mid-stream and downstream operations.
KONGSBERG has significant ambitions to reduce the climate footprint, both in terms of direct reduction of our own impact but also indirectly through the value chain. How we can really make a difference is by looking at our entire value chain, from sub-supplier to the finished system and through the life cycle of the system. During Q3, we joined the Science Based Targets Initiative, and our ambition is that minimum two-thirds of our suppliers by spend will do the same within five years. This will help the value chain to work in a more targeted manner to reduce emissions and set specific ambitions for the reduction of its total environmental footprint. Through our technology expertise, we will help solve the environmental challenges facing our customers and industries, and we see significant business opportunities in the need for sustainable solutions.
Overall, the group has a solid foundation with sustainable technology- and market positions in both established and newer markets. This makes us confident that KONGSBERG will continue the positive development.”

3rd quarter 2021 KONGSBERG 3
Highlights
Growth, solid project execution and cost discipline resulted in increased EBITDA in Q3 2021 compared with Q3 2020. A good order intake resulted in a Group-wide book-to-bill ratio of 2.46.
Q3 YTD 2021Revenues: MNOK 6,216 MNOK 19,342EBITDA: MNOK 1,054 MNOK 2,930EBITDA margin: 17.0 per cent 15.1 per cent
KONGSBERG
A book-to-bill ratio of 1.30 was realised with the order intake including, among other things, a significant contract for the delivery of equipment to two new offshore wind installation vessels. Good cost discipline and a favourable project mix have improved profitability. The business area is experiencing somewhat improved market prospects in general.
Q3 YTD 2021Revenues: MNOK 3,734 MNOK 11,632EBITDA: MNOK 560 MNOK 1,439EBITDA margin: 15.0 per cent 12.4 per cent
KONGSBERG MARITIME
Growth in operating revenues of 17 per cent and 20.4 per cent EBITDA-margin, mainly due to a favourable project mix and continued solid project execution during the quarter. Contracts with Norway and Germany totalling NOK 8.2 billion for the delivery of combat systems to submarines and NSM. Record order backlog of over NOK 31 billion.
Q3 YTD 2021Revenues: MNOK 2,261 MNOK 7,067EBITDA: MNOK 461 MNOK 1,443EBITDA margin: 20.4 per cent 20.4 per cent
KONGSBERG DEFENCE & AEROSPACE
A high level of market activity and scale up of the business related to the delivery and roll-out of dynamic digital twins and Vessel Insight for both new and existing customers.
Q3 YTD 2021Revenues: MNOK 221 MNOK 616EBITDA: MNOK 22 MNOK 23Share of “recurring revenues”: 41 per cent 41 per cent
KONGSBERG DIGITAL

4 3rd quarter 2021 KONGSBERG
Key figures
1.7 - 30.9 1.1 - 30.9 1.1-31.12
MNOK 2021 2020 2021 2020 2020
Operating revenue 6 216 5 802 19 342 18 464 25 612
EBITDA 1 054 919 2 930 2 302 3 250
EBITDA (%) 17,0 15,8 15,1 12,5 12,7
EBIT 748 595 2 019 1 326 1 905
EBIT (%) 12,0 10,3 10,4 7,2 7,4
Share of net income from associated companies 79 35 148 67 186
Earnings before tax from continuing operations 786 566 2 021 1 203 1 855
Earnings after tax from continuing operations 619 444 1 572 916 1 481
Earnings after tax including discontinued operations 619 455 1 572 2 367 2 932
EPS continued operations (NOK) 3,04 2,36 8,23 4,86 8,01
EPS included discontinued operations (NOK) 3,04 2,41 8,23 12,92 16,08
Order Intake 15 315 4 558 28 503 17 437 28 818
30.9. 30.6. 31.12.
MNOK 2021 2021 2020
Equity ratio (%) 33,7 33,6 33,9
Net interest-bearing debt 1) (3 593) (2 835) (3 949)
Working Capital 2) (244) (28) (458)
ROACE (%) 3) 28,7 26,8 20,8
Order backlog 44 918 35 781 35 947
Net interest-bearing debt/EBITDA before IFRS 16 4) (1,1) (0,9) (1,4)
No. of employees 11 045 10 896 10 689
1) Net interest-bearing debt is the net amount of the accounting lines “Cash and cash equivalents” and “Short- and long-term interest-bearing liabilities, excluding leasing commitments”.2) Current assets (except cash and cash equivalents) minus non-interest-bearing liabilities (except taxes payable). Financial instruments classified as cashflow hedges are not included in working
capital.3) 12-month rolling EBIT including share of net income from joint arrangements and associated companies, excluding IFRS 16 divided by the 12-month mean of recognised equity and net interest-
bearing debt. 4) 12-month rolling EBITA excluding IFRS 16
OPERATING REVENUE AND ORDER INTAKE
5 833 5 802 6 216
11 810
4 558
15 315
Q12019
Q2 Q3 Q4 Q12020
Q2 Q3 Q4 Q12021
Q2 Q3
KMKDAOtherOrder intake

3rd quarter 2021 KONGSBERG 5
ORDER BACKLOG
13 %
38 %
49 %
33 306 31 748
44 918
Q12019
Q2 Q3 Q4 Q12020
Q2 Q3 Q4 Q12021
Q2 Q3
2021
2022
2023+
Order backlog
EBITDA 496
919
1 054
Q12019
Q2 Q3 Q4 Q12020
Q2 Q3 Q4 Q12021
Q2 Q3
EPSContinued operations
0,38
2,36
3,04
Q12019
Q2 Q3 Q4 Q12020
Q2 Q3 Q4 Q12021
Q2 Q3
EPS continued operations
6 3rd quarter 2021 KONGSBERG
Performance, market and ordersOperating revenues in Q3 were MNOK 6,216 against MNOK 5,802 in the same quarter the previous year, representing an increase of 7 per cent. All business areas saw increased operating revenues compared to the corresponding quarter last year, but the majority of the increase was within Kongsberg Defence & Aerospace (KDA). Operating revenues for the year so far have been MNOK 19,342 (MNOK 18,464). Accumulated growth in 2021 was also driven by KDA.
EBITDA was MNOK 1,054 in Q3, an EBITDA margin of 17.0 per cent compared to MNOK 919 (15.8 per cent) in the same quarter the previous year. Accumulated EBITDA at the end of Q3 was MNOK 2,930, an increase of MNOK 628 compared to the same period in 2020.
During Q3, order intake amounted to MNOK 15,315, compared to MNOK 4,558 in the same quarter last year. This gives a book-to-bill ratio for the quarter of 2.46. KM had a book-to-bill ratio of 1.30, KDA had a book-to-bill ratio of 4.56 and KDI had a book-to-bill ratio of 0.75 during the quarter. Variations in order intake are normal, and order intake can vary considerably between quarters. This should be viewed in the context of the signing date of large contracts. At the beginning of July, KDA signed two significant contracts with Norway and Germany for the delivery of combat systems to submarines and Naval Strike Missiles. The total value of the contracts was NOK 8.2 billion. The Group’s accumulated order intake has been MNOK 28,503 (MNOK 17,437) so far this year, equivalent to a book-to-bill ratio of 1.47.
The order backlog at the end of Q3 was MNOK 44,918, an increase of MNOK 9,137 during the quarter.
Cash flowKONGSBERG recorded a net increase in cash and cash equivalents of MNOK 755 in Q3 2021. Net cash flow from operating activities amounted to MNOK 1,094. Out of this, EBITDA amounted to MNOK 1,054, while the change in net current assets and other operating items amounted to MNOK 40. Group cash flow from investment activities amounted to MNOK -149. This consists of investments in property, plant and equipment, as well as capitalised research and development. Cash flow from financing activities was MNOK -188, of which MNOK 53 was share buy back.
So far in 2021, net cash and cash equivalents have decreased by MNOK 875. The largest negative cash flows were related to the payment of dividends, an increase in working capital at KDA and the settlement of bond loan KOG08. The largest positive cash flow elements were cash flow from operations and the issue of a new bond.
OPERATING REVENUES
6 216MNOK
EBITDA-MARGIN
17,0%
ORDER INTAKE
15 315MNOK

3rd quarter 2021 KONGSBERG 7
Balance sheetAt the end of the quarter, the group had net interest-bearing debt totalling MNOK 2,953. Long-term interest-bearing debt consisted of four bond totalling MNOK 2,450. The KOG12 bond, of MNOK 500 that is due to mature in December 2021, is classified as short-term interest-bearing debt, see Note 8. The group had MNOK 6,545 in cash and cash equivalents at the end of Q3, against MNOK 5,790 at the end of Q2 and MNOK 7,420 at the end of 2020.
At the end of Q3, net interest-bearing debt was MNOK -3,593, compared to MNOK -2,835 at the end of Q2 and MNOK -3,949 at the end of 2020. The change in the quarter was mainly due to strong cash flow from operations. In addition, the group had a syndicated and committed credit facility of MNOK 2,300 and an overdraft credit facility of MNOK 500. These were unused at the end of Q3 2021.
Kongsberg Gruppen ASA has a long-term issuer rating of A- with “stable outlook” awarded by the Nordic Credit Rating agency. The standalone credit assessment is BBB+.
30.9. 30.6. 31.12.
MNOK 2021 2021 2020
Equity 13 052 12 415 13 301
Equity ratio (%) 33,7 33,6 33,9
Total assets 38 718 36 967 39 230
Working capital 1) (244) (28) (458)
Gross interest-bearing debt 2 953 2 956 3 471
Cash and cash equivalents 6 545 5 790 7 420
Net interest bearing debt 1) (3 593) (2 835) (3 949)
Net interest bearing debt/EBITDA before IFRS 16 1) (1,1) (0,9) (1,4)
1) See definition note 13
NET INTEREST-BEARING DEBT
-3 593MNOK
EQUITY RATIO
33,7%
8 3rd quarter 2021 KONGSBERG
Foreign currencyKONGSBERG’s financial policy states that contracts over a certain amount shall be hedged against foreign exchange risk. These are typically hedged through forward exchange contracts (fair value hedges). The net fair value of these hedges was MNOK 148 as of Q3 2021. In special cases, forward contracts and other types of financial derivatives are used as cash flow hedges, for example in the case of large tenders where the probability of winning the contracts is considered high. The company’s portfolio of cash flow hedges had a net fair value of MNOK -69 at the end of the quarter, which has been recognised in equity. The fair value (market value) here represents unrealised profits/losses in relation to agreed rates.
Changes to the maturity structure in underlying contracts may result in cash effects when rolling over related forward contracts. The effect size will be dependent on the prevailing market rate of the Norwegian krone relative to the initial agreed exchange rate. In addition, other financial derivatives are used, such as interest rate swaps, cross currency swaps and currency options, where fair value is also recognised against equity. See Note 8 for further information.
KONGSBERG’s finance policy entails that revenue recognition will largely be based on exchange rates hedged at historical levels. This limits short-term effects on profits in the event of a strengthening or weakening of the company’s functional currency (NOK).
Product developmentKONGSBERG is continually investing in product development, both through in-house-funded and customer-funded programmes. Total in-house-financed product development and maintenance amounted to MNOK 384 in the quarter and MNOK 1,219 accumulated over the year so far, of which MNOK 59 and MNOK 150 are capitalised, respectively. Capitalised development during the quarter was mainly related to KDI projects, although KDA and KM also were represented with a part of development capitalised during the quarter. See the table in Note 9.
As of Q3, the largest capitalised projects in the balance sheet were related to the development of the Kognifai digital platform, Joint Strike Missile and other missile technology, weapons stations, communications solutions and remote towers for airports.
Customer-funded development comes in addition, either as part of delivery projects or as specific development assignments. The total costs of product development and maintenance account for about 10 per cent of operating revenues.
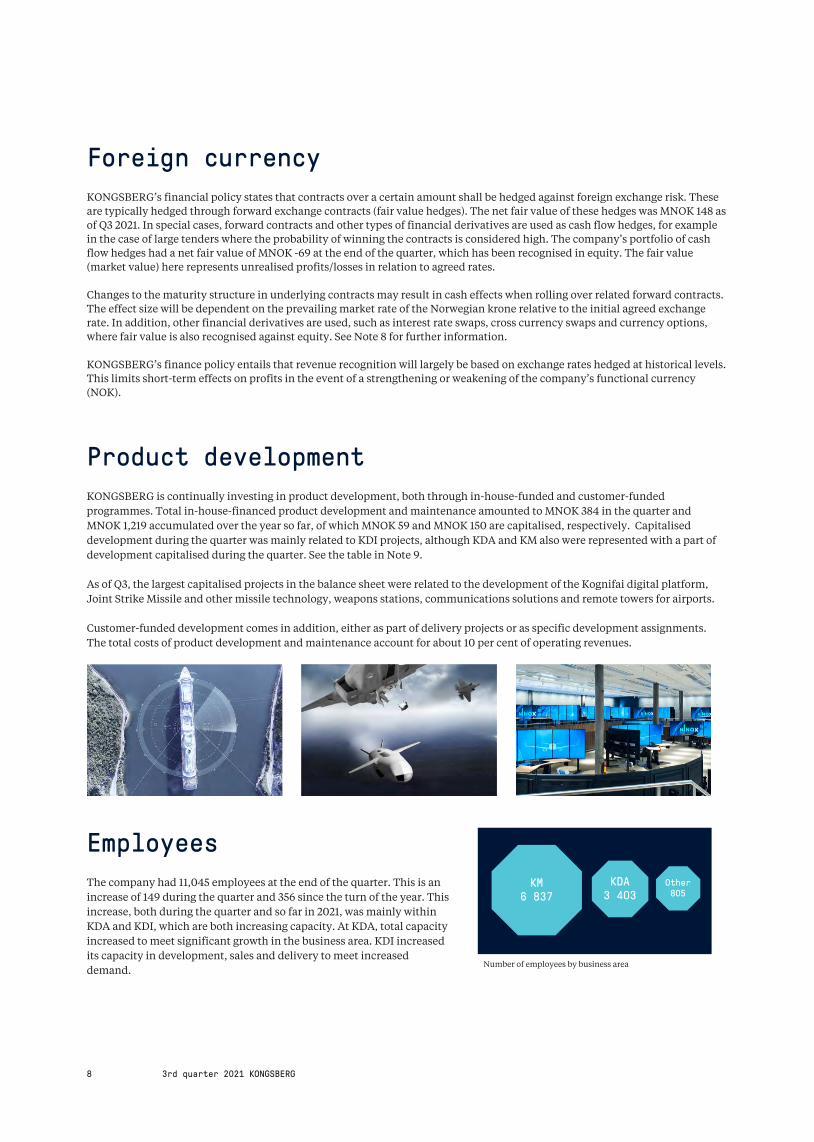
EmployeesThe company had 11,045 employees at the end of the quarter. This is an increase of 149 during the quarter and 356 since the turn of the year. This increase, both during the quarter and so far in 2021, was mainly within KDA and KDI, which are both increasing capacity. At KDA, total capacity increased to meet significant growth in the business area. KDI increased its capacity in development, sales and delivery to meet increased demand.
KM6 837
KDA 3 403
Other 805
Number of employees by business area

3rd quarter 2021 KONGSBERG 9

10 3rd quarter 2021 KONGSBERG
ResultsOperating revenues amounted to MNOK 3,734 in Q3, compared to MNOK 3,695 during the same quarter last year, an increase of 1 per cent. There was increased after-market activity while activity related to deliveries to new vessels was lower. This is mainly due to the low level of contracting of new vessels during 2020. The Sensors & Robotics area, where activity is less reliant on new vessels, saw an increase in operating revenues. Operating revenues for the first three quarters of the year totalled MNOK 11,632 (MNOK 12,000).
EBITDA was MNOK 560 in Q3, an EBITDA margin of 15.0 per cent, compared to MNOK 411 (11.1 per cent) in the same quarter the previous year. Accumulated EBITDA at the end of Q3 was MNOK 1,439, an increase of MNOK 371 compared to the same period last year. This improvement was mainly a result of the successful integration programme implemented in 2019 and 2020 related to the acquisition of Commercial Marine (CM), continuous efficiency improvements and a good project mix.
Compared to Q3 2020, there was also a clear improvement in the after-market. The after-market generally sees relatively short lead time between orders and deliveries. This meant that the market was quickly hit by a reduction in demand caused by the pandemic in 2020. Since Q3 2020, we have seen a gradual increase in demand, confirmed by revenue and profit developments in Q3 2021.
Market and ordersOrder intake in Q3 was MNOK 4,864, equivalent to a book-to-bill ratio of 1.30, compared to MNOK 3,439 in Q3 2020. The after-market is an important driver for the total order intake, turnover and profitability of the business area. In Q3, order intake from the after-market amounted to more than 40 per cent of KM order intake.
The largest single contract during the quarter was a contract worth MEUR 49 with the Chinese shipyard COSCO Shipping Offshore, for the delivery of a significant technology package for two new wind turbine installation vessels (WTIV) that COSCO is building for the Danish company Cadeler. These vessels will be among the largest of their kind and will be able to ship and install multiple sets of wind turbines and their foundations. The delivery combines thrusters, electrical systems and dynamic positioning to enable the ship to maintain operations in challenging conditions, as well as a range of digital tools for sustainable performance and reliability. Offshore wind is a growth market, and so far in 2021 KM
has secured contracts with a value of more than MNOK 1,300 from this market.
KEY FIGURES
1.7 - 30.9 1.1 - 30.9 1.1-31.12
MNOK 2021 2020 2021 2020 2020
Operating revenues 3 734 3 695 11 632 12 000 16 319
EBITDA 560 411 1 439 1 068 1 532
EBITDA (%) 15,0 11,1 12,4 8,9 9,4
Order Intake 4 864 3 439 13 158 12 103 15 925
30.9. 30.6. 31.12.
MNOK 2021 2021 2020
Order backlog 12 870 11 731 11 386
No. of employees 6 837 6 817 6 815
Operating revenue
4 0413 695 3 734
Q12019
Q2 Q3 Q4 Q12020
Q2 Q3 Q4 Q12021
Q2 Q3
EBITDA
223
411
560
Q12019
Q2 Q3 Q4 Q12020
Q2 Q3 Q4 Q12021
Q2 Q3

3rd quarter 2021 KONGSBERG 11
KM has relatively low emissions from its own operations, while at the same time supplying industries that have historically to a certain extent been responsible for high emissions and are now facing a significant transition. KM aims to ensure its deliveries improve efficiency and ensure safety of customer operations. In addition to our ambition of reducing the impact of our own operations on the climate, it is also important that we work with our customers to develop new and more environmentally friendly products and solutions. This is where the technologies within the business area can make a real difference. As part of the long-term strategy of KM, advanced digital infrastructures are also developed and used for data capture and monitoring, and the management of marine environments and resources. KM has been involved in a significant number of conversion projects in recent years. These projects typically convert vessels from pure diesel-electric propulsion systems to hybrid solutions which supplement propulsion with more environmentally friendly alternatives, like battery power. KM is also involved in a number of projects in which vessels are purely battery operated or are to run on more environmentally friendly fuel. In the future, a significant proportion of KM’s projects are expected to focus on reducing emissions within maritime markets. An important driver of growth at KM is sales synergies between KM and the acquired business CM. A large part of the rationale behind the acquisition of CM in 2019 was the complementary product and market portfolio between the two companies. So far in 2021, there have been cross-sales of over NOK 1 billion, of which around MNOK 300 were in Q3. A total of MNOK 700 in cross-sales were achieved in total in 2020. Cross-sales only include additional sales as a result of the integration of CM and KM. Around half of the additional sales are linked to offshore wind projects. The remainder is divided between offshore, traditional merchant marine, LNG and fishing. At the end of Q3 2021, KM had an order backlog of MNOK 12,870.
COVID-19 and other factorsAt the outbreak of the ongoing pandemic in the winter/spring of 2020, a number of measures were quickly implemented to limit infection, maintain as normal a level of operations as possible and to ensure that cost levels were adapted to the level of activity. The results achieved by KM during the pandemic would not have been possible without the measures that were implemented. The degree of measures and restrictions has varied throughout the pandemic, but digital solutions for customer support are still in use, with significant infection-control measures in place as well, including the use of homeworking. KM has employees in 34 countries and operations practically all over the world, which means that the measures vary considerably according to the current restrictions in individual territories. During the pandemic, our worldwide presence has been shown to be important both when delivering projects and performing service assignments, as travel and other restrictions have proved to be a significant challenge.
There is still some uncertainty about the impact on order intake, operating income and results arising from the pandemic, but a number of areas around the world have now started the transition to a more normal day-to-day life.
Worldwide, we are seeing both an increase in the price of raw materials, and a shortage of components. The majority of KM’s product portfolio is made up to a limited extent of raw materials. At the same time, for example, the price of steel is affecting the cost of propeller production. The price of raw materials also affects total project costs for end customers. This may affect the demand for vessels. In terms of the situation with components, we are experiencing increased lead times and difficulty in sourcing certain components. This can lead to delays in deliveries and increased costs, but the situation is being closely monitored and continuous actions are taken to ensure continued progress of projects.
Operating revenueYTD by division
Integrated Soutions
22%
Sensors & Robotics
16%
Global Customer Support & Services
44%
Propulsion & Engines
13%
Deck Machinery
5%
Order backlogBreakdown by delivery date
2021 21%
2022 56%
2023+ 23%
Orders
4 864
12 446 11 826 12 870
3 345 3 439
Q12019
Q2 Q3 Q4 Q12020
Q2 Q3 Q4 Q12021
Q2 Q3
Order intake
Order backlog

12 3rd quarter 2021 KONGSBERG
ResultsOperating revenues amounted to MNOK 2,261 in Q3, compared to MNOK 1,933 during the same quarter the previous year, an increase of 17 per cent. There has been a high level of activity in several projects, especially weapons stations for the US CROWS programme, several NASAMS air-defence programmes and deliveries for the F-35 fighter aircraft. As of Q3, accumulated operating revenues were MNOK 7,067, up from MNOK 5,883 in the same period in 2020. All KDA divisions have seen increased operating revenues in the first three quarters of the year compared with last year.
EBITDA was MNOK 461 in Q3, an EBITDA margin of 20.4 per cent, compared to MNOK 473 (24.5 per cent) in the same quarter the previous year. KDA’s EBITDA in Q3 2020 included approximately MNOK 150 in positive effects related to reduced costs in individual projects. This solid margin is a result of good project execution, a favourable project mix and high efficiency throughout the organisation. Cumulative EBITDA as of Q3 2021 was MNOK 1,443 (MNOK 1,142), corresponding to an EBITDA margin of 20.4 per cent (19.4 per cent)
The share of profits from associated companies amounted to MNOK 82 (MNOK 38) in the quarter. See also Note 6.
Market and ordersOrder intake reached MNOK 10,303 in Q3, compared to MNOK 987 for the same quarter last year. Total order intake for the first three quarters of the year was MNOK 14,769 (MNOK 4,543). The defence market is characterised by relatively few, but large, contracts. Deliveries are normally made over a number of years. Significant fluctuations in order intake between quarters and years are, therefore, considered normal.
In July 2021, KONGSBERG signed agreements with Norway and Germany for the delivery of elements from the ORCCA™ combat system for their six new 212CD submarines, and Naval Strike Missile (NSM) for the naval defences of both countries. Deliveries will extend well into the next decade, and represent an important strategic milestone for the Group. The NSM contract is a joint Norwegian–German acquisition, valued at MNOK 4,404. Germany is the sixth country to opt for KONGSBERG’s NSM. For Norway, the contract will serve to replenish and update the current inventory . The contract for the ORCCA™ combat system has a value of MNOK 3,800 for KONGSBERG. The business area’s remaining order
KEY FIGURES
1.7 - 30.9 1.1 - 30.9 1.1-31.12
MNOK 2021 2020 2021 2020 2020
Operating revenues 2 261 1 933 7 067 5 883 8 503
EBITDA 461 473 1 443 1 142 1 656
EBITDA (%) 20,4 24,5 20,4 19,4 19,5
Share of netincome associated companies
82 38 155 85 206
Order Intake 10 303 987 14 769 4 543 11 891
30.9. 30.6. 31.12.
MNOK 2021 2021 2020
Order backlog 31 189 23 145 23 477
No. of employees 3 403 3 318 3 189
Operating revenues
1 578
1 933
2 261
Q12019
Q2 Q3 Q4 Q12020
Q2 Q3 Q4 Q12021
Q2 Q3
EBITDA
252
473 461-
Q12019
Q2 Q3 Q4 Q12020
Q2 Q3 Q4 Q12021
Q2 Q3

3rd quarter 2021 KONGSBERG 13
intake during the quarter consisted of several smaller contracts, including a contract of MNOK 122 for the delivery of horizontal and vertical tails for the F-35.
KDA sells systems that will be operational for decades. When a system is to remain operational and modern over a long period of time, it requires continuous product development, upgrading and maintenance along the way. Maintenance, repair and overhaul (MRO) is an important focus area for KDA, both in keeping systems modern and operational but also in relation to life extension of systems. KDA after-market volumes, including MRO, are increasing along with new sales growth and now account for just over MNOK 1,500 annually.
At the end of Q3 2021, KDA had an order backlog of MNOK 31,189.
COVID-19 and other factorsThe defence business has not experienced major financial consequences as a result of COVID-19. Progress within projects has been affected by the situation to a minor extent despite certain challenges relating to the movement of staff across borders. Furthermore, certain contract negotiations have proved more time-consuming due to travel restrictions.
In 2021, a lack of individual components has affected many companies. KDA is dependent on the supply capacity of several hundred subcontractors, both in Norway and elsewhere. Additional resources were introduced at an early stage of the pandemic, to ensure the flow of goods, shipments and, where necessary, alternative subcontractors to avoid delays in production. The component situation has been an area of great focus for KDA. So far, the business area has not experienced significant delays related to component deficiency, but now face increased cost and prolonged lead times for certain components. The situation and developments are under close monitoring and measures have been, and continue to be, taken on a going basis.
Operating revenuesYTD by division
Missile Systems 15%
Aerostructures 22%
Integrated Defence Systems
28%
Space & Surveillance 7%
Land Systems 28%
Ordre backlogBreakdown by delivery date
2021 10%
2022 30%2023+
60%
Orders
20 027 18 757
31 189
8 254
987
10 303
Q12019
Q2 Q3 Q4 Q12020
Q2 Q3 Q4 Q12021
Q2 Q3
Order intake
Order backlog

14 3rd quarter 2021 KONGSBERG
ResultsOperating revenues totalled NOK 221 million in Q3, compared to MNOK 185 in the corresponding quarter in 2020. Recurring revenues (RR) increased to MNOK 91 during the quarter (41 per cent), up from MNOK 83 (41 per cent) in Q2. As of Q3, the accumulated operating revenues of KDI amounted to MNOK 616 (MNOK 601) with an RR share of 41 per cent.
Demand for KONGSBERG’s digital twin solution, Kognitwin, and its “ship to cloud” solution, Vessel Insight, is increasing. In Q3, KDI signed an agreement with ExxonMobil, which will install and evaluate Kognitwin at one of its facilities in Guyana. Shell has also initiated a digital twin solution on the Ormen Lange field, which will be integrated with the existing Nyhamna digital twin. This will be the first fully integrated twin to cover the entire process, upstream to downstream. In addition, KDI has several ongoing proof of concept (POC) agreements, where the customer will test and evaluate Kognitwin on selected installations.
The roll-out of Vessel Insight continues, and a number of new agreements were entered into with both vessel owners and application partners during the quarter. Agreements have been entered into with Olympic Subsea, Island Offshore and Güngen for the roll-out of Vessel Insight on the entire fleets of respective ship owners.
The demand for traditional maritime simulators has been negatively affected by the COVID-19 pandemic. This has led to a reduction in operating revenues from the sector, which so far this year has amounted to about 35 per cent of KDI operating revenues. Despite the fact that the market for traditional maritime simulators is still challenging, we see an improved order intake, both compared to the first two quarters of the year and Q3 2020.
KONGSBERG has great ambitions in terms of the growth of KDI and significant investments are being made in the scaling and roll-out of new solutions and applications. This will affect the EBITDA development in the business area.
KDI in the future Since KONGSBERG established KDI in 2016, the business area has established itself as a leading supplier of digital solutions to the energy sector and maritime industry. Digitilisation is an important contributor to increased efficiency and reduction of climate emissions.
The Software as a Service (SaaS) solutions Kognitwin® Energy and Vessel Insight are the most important growth drivers for KDI. In 2020 and 2021, there has been a focus on market positioning and KDI has thus increased capacity related to development, sales and delivery.
KEY FIGURES
1.7 - 30.9 1.1 - 30.9 1.1-31.12
MNOK 2021 2020 2021 2020 2020
Operating revenues 221 185 616 601 821
of this Recurring revenues*
91 74 250 128 278
EBITDA 22 26 23 57 34
EBITDA (%) 10,1 14,1 3,8 9,4 4,1
Order Intake 165 151 556 794 997
30.9. 30.6. 31.12.
MNOK 2021 2021 2020
Order backlog 924 964 977
No. of employees 686 641 565
Operating revenues
176 185 221
Q12019
Q2 Q3 Q4 Q12020
Q2 Q3 Q4 Q12021
Q2 Q3
Recurring Revenues*
74
91
Q12020
Q2 Q3 Q4 Q12021
Q2 Q3
*Recurring revenues (RR) consist of revenues from Software as a Service revenues, Software Leases and Software Maintenance & User Support.

3rd quarter 2021 KONGSBERG 15
In 2020, KDI signed a global framework agreement with Shell for the digitisation of current and future production facilities. Kognitwin® Energy has already been delivered and is operational at upstream, mid-stream and downstream facilities. Work on the delivery of multiple digital twins is being done in parallel. In the future, both the number of twins installed and their users will increase significantly.
The digitisation of the vessels market is an important driver for Vessel Insight. One prerequisite for digitisation is to connect the vessel to the cloud and make contextualised data available. Vessel Insight makes this possible quickly and efficiently and provides significant benefits, from cost, efficiency, environmental and operational perspectives. Many vessel markets have experienced challenges as a result of the COVID-19 pandemic. A decrease in
willingness to invest has led to delays in relation to the original Vessel Insight market and roll-out plans. KDI is now experiencing a significant improvement in the situation and several new customers are signed during the last quarter. The ambition is to increase the number of Vessel Insight customers significantly in the coming years.
The phase that KDI now finds itself in means that it is natural to assess both future partner models and other models in order to fully realise the potential KONGSBERG sees in the sector, including a stock exchange listing in the long term.
Orders
809
1 034 924
174 151 165
Q12019
Q2 Q3 Q4 Q12020
Q2 Q3 Q4 Q12021
Q2 Q3
Ordre intake
Order backlog

16 3rd quarter 2021 KONGSBERG
KONGSBERG has a solid balance sheet and an order backlog of NOK 44.9 billion at the end of Q3 2021. Of the order backlog, NOK 6.0 billion is expected to be delivered during Q4 2021. Order intake from the after-market is only included in the order backlog to a limited extent. The order backlog of associated companies, in addition to framework agreements, are in addition to the order backlog reported.
A number of countries have now reopened or started reopening post-pandemic, but restrictions and uncertainty may continue to affect the world and the markets in which the Group operates. Throughout the pandemic, KDA has maintained operations at an almost normal level, and this is expected to continue in the future. For KM and KDI, a number of markets have been challenging, but the group has a more optimistic view of market developments in the future. KONGSBERG has initiated new working methods and solutions as a consequence of the pandemic. The experience gained through this, together with continuous efficiency improvements and discipline in terms of costs, is a good basis for the group to achieve its stated objectives.
Going forward, KDA and KDI will continue to increase capacity, both to deliver the existing order backlog and to build a base for further growth. KDA has a record order backlog and is also well positioned in a number of significant international defence programmes. The maritime market has been characterised by a generally low level of vessel contracting for a number of years. In recent quarters, the contracting of new vessels has picked up across several segments. Despite the fact that increased cost for raw materials may affect overall demand, and challenges with component shortages persist in many of the world’s industries, the company believes that the positive trend will continue. KONGSBERG has a technology portfolio contributing to a significant reduction in the climate footprint. The order intake so far this year shows that customers have an increased willingness to invest in more sustainable vessel and energy solutions.
Service and maintenance are a significant part of the business activities of KONGSBERG, and important to the company’s customers. KM has equipment installed on over 30,000 vessels and, in recent years, KDA has built up a significant MRO (Maintenance, Repair & Overhaul) business. The after-market has shown positive development in recent quarters, and this trend is expected to continue.
The group expects growth within KDA to contribute to growth for the group overall in 2021. For KDI, the proportion of “recurring revenues” is expected to continue increasing, while KM expects activity approximately on a par with 2020 levels.
Kongsberg, 28 October 2021
The Board of Kongsberg Gruppen ASA

3rd quarter 2021 KONGSBERG 17

18 3rd quarter 2021 KONGSBERG
Key figures by quarter
KONGSBERG 2021 2020 2019
MNOK 2021 Q3 Q2 Q1 2020 Q4 Q3 Q2 Q1 2019 Q4 Q3 Q2 Q1
Operating revenues 19 342 6 216 6 762 6 364 25 612 7 148 5 802 5 983 6 678 23 245 7 938 5 833 6 012 3 462
EBITDA 2 930 1 054 993 883 3 250 948 919 740 643 2 113 825 496 414 378
EBITDA (%) 15,1 17,0 14,7 13,9 12,7 13,3 15,8 12,4 9,6 9,1 10,4 8,5 6,9 10,9
EBIT 2 019 748 697 575 1 905 579 595 429 302 1 029 532 193 98 206
EBIT (%) 10,4 12,0 10,3 9,0 7,4 8,1 10,3 7,2 4,5 4,4 6,7 3,3 1,6 6,0
Share of net income associated companies 148 79 58 11 186 118 35 33 - 21 (2) (9) 29 3
Order intake 28 503 15 315 5 544 7 643 28 818 11 381 4 558 6 067 6 812 31 413 6 645 11 810 9 297 3 661
Order backlog 44 918 44 918 35 781 36 867 35 947 35 947 31 748 32 935 33 342 32 347 32 347 33 306 27 177 16 786
KONGSBERG MARITIME 2021 2020 2019
MNOK 2021 Q3 Q2 Q1 2020 Q4 Q3 Q2 Q1 2019 Q4 Q3 Q2 Q1
Operating revenues 11 632 3 734 4 092 3 807 16 319 4 319 3 695 3 762 4 543 15 198 5 263 4 041 3 989 1 905
EBITDA 1 439 560 452 427 1 532 464 411 267 390 1 005 408 223 168 206
EBITDA (%) 12,4 15,0 11,1 11,2 9,4 10,7 11,1 7,1 8,6 6,6 7,8 5,5 4,2 10,8
EBIT 951 403 295 254 718 236 227 86 169 356 234 33 (46) 136
EBIT (%) 8,2 10,8 7,2 6,7 4,4 5,5 6,2 2,3 3,7 2,3 4,5 0,8 (1,2) 7,1
Share of net income associated companies - - - - - - - (1) 1 - - - - -
Order intake 13 158 4 864 4 220 4 074 15 925 3 822 3 439 3 850 4 813 14 427 3 858 3 345 4 917 2 306
Order backlog 12 870 12 870 11 731 11 483 11 386 11 386 11 826 12 111 12 404 11 311 11 311 12 446 12 920 5 465
KONGSBERG DEFENCE AEROSPACE 2021 2020 2019
MNOK 2021 Q3 Q2 Q1 2020 Q4 Q3 Q2 Q1 2019 Q4 Q3 Q2 Q1
Operating revenues 7 067 2 261 2 456 2 350 8 503 2 619 1 933 2 008 1 942 7 245 2 468 1 578 1 829 1 369
EBITDA 1 443 461 513 469 1 656 514 473 437 231 1 123 446 252 260 165
EBITDA (%) 20,4 20,4 20,9 20,0 19,5 19,6 24,5 21,8 11,9 15,5 18,1 16,0 14,2 12,1
EBIT 1 061 330 386 344 1 157 389 338 314 116 725 336 150 164 75
EBIT (%) 15,0 14,6 15,7 14,7 13,6 14,8 17,5 15,6 6,0 10,0 13,6 9,5 9,0 5,5
Share of net income associated companies 155 82 59 14 206 120 38 37 10 34 2 (5) 31 6
Order intake 14 769 10 303 1 120 3 346 11 891 7 348 987 1 788 1 769 16 060 2 509 8 254 4 160 1 137
Order backlog 31 189 31 189 23 145 24 470 23 477 23 477 18 757 19 658 19 977 20 146 20 146 20 027 13 433 10 519
KONGSBERG DIGITAL 2021 2020 2019
MNOK 2021 Q3 Q2 Q1 2020 Q4 Q3 Q2 Q1 2019 Q4 Q3 Q2 Q1
Operating revenues 616 221 204 192 821 220 185 209 207 799 214 176 209 200
EBITDA 23 22 10 (9) 34 (23) 26 33 (2) 15 - 7 (2) 9
EBITDA (%) 3,8 10,1 4,9 (4,8) 4,1 (10,4) 14,1 15,6 (1,0) 1,8 (0,1) 4,0 (0,8) 4,7
EBIT (32) 3 (8) (28) (22) (44) 14 21 (14) (28) (10) (5) (12) (1)
EBIT (%) (5,2) 1,5 (4,0) (14,4) (2,7) (19,8) 7,7 10,1 (6,6) (3,5) (4,8) (2,8) (5,8) (0,5)
Order intake 556 165 199 192 997 203 151 428 216 884 260 174 233 218
Order backlog 924 924 964 972 977 977 1 034 1 083 876 842 842 809 804 783
Due to eliminations and that Property and Corporate functions are not included, the sum of Business Areas does not add up to Group.

3rd quarter 2021 KONGSBERG 19
Condensed income statement
1.7 - 30.9 1.1 - 30.9 1.1-31.12
MNOK Note 2021 2020 2021 2020 2020
Operating revenues 5 6 216 5 802 19 342 18 464 25 612
Operating expenses 9 (5 161) (4 883) (16 412) (16 162) (22 362)
EBITDA 5, 13 1 054 919 2 930 2 302 3 250
Depreciation (124) (122) (354) (358) (481)
Depreciation, leasing assets 7 (99) (104) (296) (307) (411)
Impairment of property, plant and equipment - (4) (3) (4) (52)
Amortisation (82) (84) (257) (251) (339)
Impairment of intangible assets - (10) - (55) (60)
EBIT 5, 13 748 595 2 019 1 326 1 905
Share of net income from joint arrangements and associated companies 6 79 35 148 67 186
Interest on leasing liabilities 7 (33) (35) (101) (107) (142)
Net financial items 8 (8) (29) (45) (83) (93)
Earnings before tax from continuing operations (EBT) 786 566 2 021 1 203 1 855
Income tax expense 12 (167) (122) (449) (288) (374)
Earnings after tax from continuing operations 619 444 1 572 916 1 481
Earnings after tax from discontinued operations - 11 - 1 451 1 451
Earnings after tax (EAT) 619 455 1 572 2 367 2 932
Attributable to:
Equity holders of the parent 543 434 1 470 2 326 2 891
Non-controlling interests 76 20 102 41 41
Earnings per share (EPS) / EPS diluted in NOK
-Earnings per share from continuing operations 3,04 2,36 8,23 4,86 8,01
-Earnings per share from continuing operations, diluted 3,04 2,36 8,23 4,86 8,01
-Earnings per share 3,04 2,41 8,23 12,92 16,08
-Earnings per share, diluted 3,04 2,41 8,23 12,92 16,08

20 3rd quarter 2021 KONGSBERG
Condensed statement of comprehensive income
1.7 - 30.9 1.1 - 30.9 1.1-31.12
MNOK Note 2021 2020 2021 2020 2020
Earnings after tax 619 455 1 572 2 367 2 932
Specification of other comprehensive income for the period:
Items to be reclassified to profit or loss in subsequent periods:
Change in fair value, financial instruments
- Cash flow hedges 8 45 (59) 94 (202) (118)
Tax effect cash flow hedges (10) 13 (21) 44 26
Translation differences currency 34 118 (154) 437 76
Total items to be reclassified to profit or loss in subsequent periods 69 72 (81) 279 (16)
Items not to be reclassified to profit or loss:
Actuarial gains/losses pensions - - - - (167)
Tax effect on actuarial gain/loss on pension - - - - 36
Total items not to be reclassified to profit or loss - - - - (131)
Comprehensive income 688 527 1 491 2 646 2 785

3rd quarter 2021 KONGSBERG 21
Condensed statement of financial position
30.9. 30.6. 31.12.
MNOK Note 2021 2021 2020
Property, plant and equipment 3 793 3 641 3 665
Leasing assets 7 1 735 1 805 1 965
Intangible assets 9 5 093 5 116 5 196
Shares in joint arrangements and associated companies 6 3 427 3 320 3 465
Other non-current assets 437 541 516
Total non-current assets 14 484 14 423 14 808
Inventories 4 157 4 097 4 132
Trade receivables 6 192 5 318 5 542
Customer contracts, asset 8 6 295 5 918 5 783
Derivatives 8 493 641 964
Other short-term receivables 551 781 580
Cash and cash equivalents 6 545 5 790 7 420
Total current assets 24 234 22 544 24 422
Total assets 38 718 36 967 39 230
Issued capital 4 5 932 5 932 5 933
Retained earnings 6 489 5 999 6 754
Other reserves 480 410 559
Non-controlling interests 150 74 55
Total equity 13 052 12 415 13 301
Long-term interest-bearing loans 8 2 453 2 453 1 971
Long-term leasing liabilities 7 1 531 1 599 1 753
Other non-current liabilities and provisions 3 2 688 2 619 2 509
Total non-current liabilities and provisions 6 672 6 671 6 233
Customer contracts, liabilities 8 11 846 10 387 11 103
Derivatives 8 412 345 546
Short-term interest-bearing loans 8 500 502 1 500
Short-term leasing liabilities 7 361 353 339
Other current liabilities and provisions 3 5 876 6 294 6 208
Total current liabilities and provisions 18 994 17 882 19 696
Total equity, liabilities and provisions 38 718 36 967 39 230
Equity ratio (%) 33,7 33,6 33,9
Net interest-bearing debt (3 593) (2 835) (3 949)

22 3rd quarter 2021 KONGSBERG
Condensed statement of changes in equity
30.9. 30.6. 31.12
MNOK Note 2021 2021 2020
Equity opening balance 13 301 13 301 12 810
Other comprehensive income 1 491 804 2 785
Dividends paid (1 425) (1 425) (450)
Additional dividend paid - - (1 800)
Share buy-back related to share buy-back programme - - (29)
Transactions with treasury shares related to employee share programme (112) (62) (15)
Capital reduction (196) (196) -
Dividends, non-controlling interests (5) (5) -
Purchase/sale, in non-controlling interests (1) (1) -
Equity closing balance 13 052 12 415 13 301

3rd quarter 2021 KONGSBERG 23
Condensed cash flow statement
1.7 - 30.9 1.1 - 30.9 1.1-31.12
MNOK Note 2021 2020 2021 2020 2020
EBITDA 1 054 919 2 930 2 302 3 250
EBITDA from discontinued operations - - - 40 40
Change in net current assets and other operatings-related items 40 (577) (649) (1 220) (539)
Net cash flow from operating activities 1 094 343 2 281 1 122 2 751
Dividend from joint arrangements and associated companies - - 147 130 130
Purchase/disposal of property, plant and equipment (89) (119) (328) (362) (506)
Proceeds from acquiring subsidiaries and associated companies - (16) (8) (59) (59)
Proceeds from sale of business - (455) - 3 177 3 051
Capitalised internal developed/ purchase of intangible assets (R&D) 9 (59) (40) (150) (187) (224)
Net cash flow from investing activities (149) (630) (339) 2 699 2 392
Net change interest-bearing loans (2) (63) (518) (603) (617)
Payment of principal portion of lease liabilities 7 (90) (86) (266) (257) (342)
Interest paid (18) (22) (58) (81) (102)
Interest paid on leasing liabilities 7 (33) (34) (101) (107) (142)
Interest income 7 9 - 33 (51) 57
Net payment related to employee share programme - - (91) - (51)
Share buy-back related to share buy-back programme (53) - (217) - (29)
Dividends paid to equity holders of the parent - - (1 440) (450) (450)
- of which dividends from treasury shares - - 15 2 2
Additional dividend - - - - (1 800)
Settlement of cross-currency swaps 8 (2) - (114) - -
Net cash flow from financing activities (188) (205) (2 755) (1 547) (3 474)
Effect of changes in exchange rates on cash and cash equivalents (2) (20) (62) 170 97
Net change in cash and cash equivalents 755 (512) (875) 2 444 1 766
Cash and cash equivalents at the beginning of the period 5 790 8 610 7 420 5 654 5 654
Cash and cash equivalents at the end of the period 6 545 8 098 6 545 8 098 7 420

24 3rd quarter 2021 KONGSBERG
Note 1 | General information and principles
General informationThe consolidated financial statement for Q3 (interim financial statement) covers Kongsberg Gruppen ASA, its subsidiaries and shares in joint arrangements and associated companies that are included according to the equity method.
PrinciplesInterim financial statements are compiled in accordance with IAS 34 (interim reporting), stock exchange regulations and the additional requirements of the Securities Trading Act. Interim financial statements do not include the same amount of information as the full financial statements and should be read in the context of the consolidated financial statements for 2020. The consolidated financial statements for 2020 were prepared in compliance with the Norwegian Accounting Act and international standards for financial reporting (IFRS) established by the EU.
The consolidated financial statements for 2020 are available on www.kongsberg.com.
The interim financial statement has not been audited.
Note 2 | New standards as from 1.1.2021
The accounting principles used in the quarterly report are the same principles as those applied to the consolidated financial statements for 2020 , with the exception of changes to IFRS 9, IFRS 7 and IFRS 16 regarding amendments to new interest-rate benchmarks, which was implemented 1 January 2021 . The implementation of the changes has not had any significant effect on the consolidated financial statements.
Note 3 | Estimates
Preparing the interim financial statement involves assessments, estimates and assumptions that affect the use of accounting principles and posted amounts for assets and obligations, revenues and expenses. Actual results may deviate from these estimates. The key considerations in connection with the application of the Group’s accounting principles and the major sources of uncertainty remain the same as when the 2020 consolidated financial statements was compiled.
Note 4 | Capital reduction in Q2 2021 and share buy-back in Q3 2021
KONGSBERG’s Annual General Meeting resolved on 6 May 2021 to reduce the company’s share capital by NOK 1, 445, 773.75 from NOK 224,987,581.25, through cancellation and redemption of 1, 156, 619 shares.Following the capital reduction, the share capital of KONGSBERG is NOK 223, 541, 807.50 divided into 178, 833, 446 shares of NOK 1,25 each.
As earlier communicated in the stock exchange notification on 19 May 2021 Kongsberg Gruppen ASA (“KONGSBERG”) has put in place a non-discretionary agreement with Danske Bank for the repurchase of KONGSBERG shares for up to NOK 200 million in the market. The share repurchases started 16th of August 2021. KONGSBERG has in Q3 repurchased 218 878 shares equivalent to a value of MNOK 53. At the end of the Q3 KONGSBERG owned 240 839 shares.

3rd quarter 2021 KONGSBERG 25
Note 5 | Segment information
OPERATING REVENUES EBITDA EBIT
1.7 - 30.9 1.1 - 30.9 1.1-31.12 1.7 - 30.9 1.1 - 30.9 1.1-31.12 1.7 - 30.9 1.1 - 30.9 1.1-31.12
MNOK 2021 2020 2021 2020 2020 2021 2020 2021 2020 2020 2021 2020 2021 2020 2020
KM 3 734 3 695 11 632 12 000 16 319 560 411 1 439 1 068 1 532 403 227 951 482 718
KDA 2 261 1 933 7 067 5 883 8 503 461 473 1 443 1 142 1 656 330 338 1 061 769 1 157
Other1) 220 174 643 580 790 33 35 48 93 62 16 30 7 75 30
Group 6 216 5 802 19 342 18 464 25 612 1 054 919 2 930 2 302 3 250 748 595 2 019 1 326 1 905
1) Other activities consist of Kongsberg Digital (KDI), property, corporate functions and eliminations. For information about KDI see separate section.
Operating revenues YTD by division:
MNOK 2021 2020
Divisions
Global customer suppport & Services 5 603 5 349
Integrated Solutions 2 753 3 292
Sensor & Robotics 2 027 2 041
Propulsion & Engines 1 689 1 715
Deck Machinery 612 534
Other/elimination (1 051) (930)
Kongsberg Maritime 11 632 12 000
Land Systems 2 116 1 595
Integrated Defence Systems 2 191 1 746
Aerostructures 1 716 1 519
Missile Systems 1 167 955
Space & Surveillance 505 421
Other/elimination (628) (353)
Kongsberg Defence & Aerospace 7 067 5 883
The table shows the anticipated date on which remaining performance obligations as of 30 September 2021 are recognised as income:
2021 2020
Date of revenue recognition Date of revenue recognition
MNOK
Order backlog 30.9.21 2021 2022
2023 and later
Order backlog 30.9.20 2020 2021
2022 and later
Kongsberg Martime 12 870 2 746 7 215 2 909 11 826 3 453 6 324 2 049
Kongsberg Defence & Aerospace 31 189 3 118 9 265 18 806 18 757 2 573 8 030 8 154
Other/elimination 860 179 446 234 1 165 234 473 457
Total 44 918 6 043 16 927 21 948 31 748 6 261 14 828 10 659

26 3rd quarter 2021 KONGSBERG
Note 6 | Shares in joint arrangements and associated companies
Specification of movement in the balance sheet line “Shares in joint arrangements and associated companies”1 January to 30 September
MNOKOwner
ship
Carrying amount 1.1.2021
Additions/ disposals
Dividends received
Share of net income 1)
Other items and
comprehensive income
Carrying amount 30.9.21
Share of net income
1.7 - 30.9
Patria Oyj 49,9 % 2 841 - (84) 58 (41) 2 773 38
Kongsberg Satellite Services AS 50,0 % 557 - (63) 105 - 599 43
Other shares 68 2 - (14) - 55 (2)
Total 3 465 2 (147) 148 (41) 3 427 79
1) The share of net result is included after tax and amortisation of excess value.
Share of net result from Patria:
1.7 - 30.9 1.1 - 30.9 1.1-31.12
Millions 2021 2020 2021 2020 2020
KONGSBERG's share (49,9%) 1) 42 8 68 20 132
Amortisation of excess values after tax
(4) (4) (11) (16) (25)
Share of net income recognised in KDA for the period
38 4 58 4 108
1) Share of Patria's net income after tax adjusted for non-controlling interests and net income from KAMS.
Share of net income and dividend from associated companies per business area:
Share of net income Dividend
1.7 - 30.9 1.1 - 30.9 1.1-31.12 1.7 - 30.9 1.1 - 30.9 1.1-31.12
MNOK 2021 2020 2021 2020 2020 2021 2020 2021 2020 2020
KDA 82 38 155 85 206 - - 147 130 130
Other (3) (3) (7) (18) (20) - - - - -
Group 79 35 148 67 186 - - 147 130 130

3rd quarter 2021 KONGSBERG 27
Note 7 | Leasing
KONGSBERG has leases that are primarily related to land and buildings, as well as leases for machinery, vehicles and equipment.
IFRS 16 effects on condensed statement of financial position:
Opening balance 1 January 2021 1 965
Addition 47
Depreciation Q1 (98)
Translation differences (16)
Opening balance 1 April 2021 1 899
Addition 5
Disposal (4)
Depreciation Q2 (99)
Translation differences 4
Opening balance 1 July 2021 1 805
Addition 27
Depreciation Q3 (99)
Translation differences 3
Closing balance 30 September 2021 1 735
30.9.2021 30.6.2021 31.12.2020
Leasing assets 1 735 1 805 1 965
Long-term leasing liabilities 1 531 1 599 1 753
Short-term leasing liabilities 361 353 339
IFRS 16 effects on condensed income statement in the period:
1.7 - 30.9 1.1 - 30.9 1.1-31.12
2021 2020 2021 2020 2020
Returned rental cost earlier included in EBITDA 123 119 366 364 484
Profit/Loss on disposed leases - - 1 - -
Increased EBITDA in the period 123 119 367 364 484
Depreciation on leases (99) (104) (296) (307) (411)
Increased EBIT in the period 23 15 71 56 73
Interest cost on leasing liabilities for the period (33) (35) (101) (107) (142)
Reduced EBT in the period (9) (20) (30) (51) (69)

28 3rd quarter 2021 KONGSBERG
Note 8 | Financial instruments
Loans and credit facilities The group has five bond loans amounting to a total of MNOK 2,950. The loans are classified as long-term loans, except KOG12 (nominal value of MNOK 500), which is due within a year and are reclassified to short-term loans. The maturity dates of the long-term bond loans range from 5 December 2023 to 2 June 2026. In addition, the group has a syndicated credit facility of MNOK 2,300 and an overdraft credit facility of MNOK 500. Neither were utilised.
Interest-bearing loans:
30.9.2021 31.12.2020
MNOK Due dateNominal
interest rate Value1 Value1
Long-term loans:
Bond issue KOG09 - fixed interest rate 02.06.2026 3,20% 1 000 1 000
Bond issue KOG11 - fixed interest rate 05.12.2023 2,90% 450 450
Bond issue KOG13 - floating interest rate 06.06.2024 1,62% 500 500
Bond issue KOG14 - floating interest rate2 26.02.2026 1,28% 500 -
Other long-term loans3 3 21
Total long-term loans 2 453 1 971
Short-term loans:
Bond issue KOG08 - floating interest rate - 1 000
Bond issue KOG12 - floating interest rate4 06.12.2021 1,30% 500 500
Other short-term loans - -
Total short-term loans 500 1 500
Total interest-bearing loans 2 953 3 471
Syndicated credit facility (unutilised borrowing limit) 15.03.2023 2 300 2 300
Overdraft facility (unutilised) 500 500
1) Value is equal to nominal amount. For long-term bond loans, the carrying amount is equal to the nominal amount.2) KONGSBERG issued MNOK 500 on 22 February 2021 in a new bond with a 5-year tenor and a floating rate coupon of 3M NIBOR + 0.86% p.a. The bonds have been listed at Oslo Stock Exchange during the third quarter.
3) Other long-term loans consist of minor loans in some of the Group’s subsidiaries.
4) The bond issue KOG12 was reclassified to short-term loans at 31 December 2020.

3rd quarter 2021 KONGSBERG 29
Forward exchange contracts Fair value of balances classified as cash flow hedges, as shown in the condensed statement of comprehensive income, increased by MNOK 94 before tax during the period 1 January – 30 September 2021. The change in fair value of forward exchange contracts accounted for an increase of MNOK 9. The total change in net fair value of fair value hedges represented a decrease of MNOK 481 from the end of last year. The end-of-quarter spot prices were USD/NOK 8.75, EUR/NOK 10.13 and GBP/NOK 11.78.
Forward exchange contracts classified as cash flow hedges:
Due in 2021 Due in 2022 or later Total
MNOK Value in NOK on
agreed ratesFair value at
30.9.21Value in NOK on
agreed ratesFair value at
30.9.21Value in NOK on
agreed rates
Change in fair value from
31.12.20Fair value at
30.9.21
USD 58 (29) (255) (43) (197) (3) (72)
EUR 224 8 (123) (4) 100 13 4
Other (9) - (44) (1) (54) (1) (2)
Sum 272 (21) (423) (49) (151) 9 (69)
Roll-over of currency futures
(9) (49) 62 (58)
Total 272 (30) (423) (98) (151) 71 (128)
Forward exchange contracts cash flow hedges, assets 22
Forward exchange contracts cash flow hedges, liabilities 91
Net forward exchange contracts cash flow hedges (69)
Fair value is referring to the net present value of the variance between the revaluated forward rate at 30 September 2021 and the forward rate at the time of entering the forward exchange contract.
The change in the fair value of cash flow hedges recognized in the statement of comprehensive income is MNOK 94, while the table above show a change in fair value of MNOK 71 since year end 2020. The difference between these two amounts of MNOK 22 was ascribable to a change in fair value of cross-currency swaps of MNOK 34 and revers of fair value of terminated currency options with net MNOK -11.
Forward exchange contracts classified as fair value hedges:
Due in 2021 Due in 2022 or later Total
MNOKValue in NOK on
agreed ratesFair value at
30.9.21Value in NOK on
agreed ratesFair value at
30.9.21Value in NOK on
agreed rates
Change in fair value from
31.12.20Fair value at
30.9.21
USD 2 850 (11) 4 914 (3) 7 764 (419) (14)
EUR 1 677 9 4 050 127 5 728 42 137
GBP (5) (2) 1 083 1 1 078 (16) (1)
Other 209 4 517 22 726 (88) 26
Total 4 731 1 10 565 147 15 296 (481) 148
Forward exchange contracts fair value hedges, assets 468
Forward exchange contracts fair value hedges, liabilities 320
Net forward exchange contracts fair value hedges 148

30 3rd quarter 2021 KONGSBERG
The net value of fair value hedges is recognized as derivates in the statement of financial position, offset against customer contracts, assets by MNOK 182 (decrease) and customer contracts, liabilities by MNOK -28 (decrease).
Specification of derivatives:
30.9. 30.6. 31.12.
MNOK 2021 2021 2020
Forward exchange contracts, cash flow hedges 22 12 23
Forward exchange contracts, fair value hedges 468 629 924
Cross-currency swaps 3 - -
Currency options - - 17
Total derivatives, current assets 493 641 964
Forward exchange contracts, cash flow hedges 91 90 101
Forward exchange contracts, fair value hedges 320 251 295
Cross-currency swaps - 5 144
Currency options - - 6
Total derivatives, current liabilities 412 345 546
Note 9 | Product development
Product maintenance cost and development recognised in the income statement during the period:
1.7 - 30.9 1.1 - 30.9 1.1-31.12
MNOK 2021 2020 2021 2020 2020
Product maintenance 102 92 314 292 414
Development cost 223 165 755 637 939
Total 325 258 1 069 929 1 353
Capitalised development recognised during the period:
1.7 - 30.9 1.1 - 30.9 1.1-31.12
MNOK 2021 2020 2021 2020 2020
Capitalised development 59 39 150 186 223
In the consolidated statement of financial position as of Q3 he largest capitalised projects were related to the development of the digital platform Kognifai, Joint Strike Missile (JSM) and other missiletechnology, medium-calibre weapon station (MCT and RWS), communication solutions and remote towers for airports.

3rd quarter 2021 KONGSBERG 31
Note 10 | Related parties
The Board is not aware of any changes or transactions in Q3 associated with related parties that in any significant way have an impact on the Group’s financial position and profit for the period.
Note 11 | Important risk and uncertainty factors
The Group’s risk management is described in the 2020 annual report. No new risk and uncertainty factors emerged during this quarter.
Note 12 | Tax
The income tax expense per Q3 was calculated to be 22.2 per cent of earnings before tax. The income tax expense was affected by non-deductible costs, withholding tax on dividends and the fact that shares of net income from associated companies were recognised after tax.
Note 13 | Definitions
Definitions
KONGSBERG uses terms in the consolidated financial statements that are not anchored in the IFRS accounting standards. Our definitions and explanations of these terms follow below.
Kongsberg considers EBITDA and EBIT to be normal accounting terms, but they are not included in the IFRS accounting standards. EBITDA is the abbreviation of “Earnings Before Interest, Taxes, Depreciation and Amortisation”. KONGSBERG uses EBITDA in the income statement as a summation line for other accounting lines. These accounting lines are defined in our accounting principles, which are part of the 2020 financial statements. The same applies to EBIT.
Restructuring costs consist of salaries and social security tax upon termination of employment (such as severance and gratuity) in connection with workforce reductions. In addition to this are rent and other related costs and any one-off payments in the event of the premature termination of tenancy agreements for premises that are not in use.
Integration costs are those associated with integrating Commercial Marine into Kongsberg Maritime.
Net interest-bearing debt is the net amount of the accounting lines “Cash and cash equivalents” and “Short- and long-term interest-bearing liabilities, excluding leasing commitments”.
Return on Average Capital Employed (ROACE) is defined as the 12-month rolling EBIT including share of net income from joint arrangements and associated companies, excluding IFRS 16 divided by the 12-month mean of recognised equity and net interest-bearing debt.
Net interest-bearing debt/EBITDA before IFRS 16 is defined as net interest-bearing debt divided by 12-month rolling EBITA excluding IFRS 16.
Working capital is defined as current assets (except cash and cash equivalents) minus non-interest-bearing liabilities (except taxes payable). Financial instruments classified as cash flow hedges are not included in working capital.

32 3rd quarter 2021 KONGSBERG
Working capital is calculated as follow:
30.9. 30.6. 31.12.
MNOK 2021 2021 2020
Current assets 24 234 22 544 24 422
Current liabilities and provisions (18 994) (17 882) (19 696)
Adjusted for:
Cash and cash equivalents (6 545) (5 790) (7 420)
Short-term interest-bearing loans 500 502 1 500
Short-term leasing liabilities 361 353 339
Net tax payable 77 75 66
Financial instruments classified as cash flow hedges 124 170 332
Working capital (244) (28) (458)
Book-to-bill ratio is order intake divided by operating revenues.
Recurring revenues consist of revenues from Software as a Service revenues, Software Leases and Software Maintenance & User Support.
Organic growth is change in operating revenues exclusive acquired companies.

3rd quarter 2021 KONGSBERG 35