quarterly labour force survey - statistics south … quarterly labour force survey (qlfs) is a...
TRANSCRIPT

Statistical release P0211
Quarterly Labour Force Survey Quarter 2, 2009
Embargoed until:
28 July 2009 11:30
Enquiries: Forthcoming issue: Expected release date
User Information Services Quarter 3, 2009 October 2009 Tel: (012) 310 8600 / 4892 / 8390

Statistics South Africa P0211
Quarterly Labour Force Survey, Quarter 2, 2009
i
Published by Statistics South Africa, Private Bag X44, Pretoria 0001 © Statistics South Africa, 2009 Users may apply or process this data, provided Statistics South Africa (Stats SA) is acknowledged as the original source of the data; that it is specified that the application and/or analysis is the result of the user’s independent processing of the data; and that neither the basic data nor any reprocessed version or application thereof may be sold or offered for sale in any form whatsoever without prior permission from Stats SA. Stats SA Library Cataloguing-in-Publication (CIP) Data Quarterly Labour Force Survey Quarter 2, 2009/ Statistics South Africa. Pretoria: Statistics South Africa, 2009
Quarterly 1. Labour supply – Statistics 2. Labour supply (South Africa) 3. Unemployment (South Africa) 4. Informal sector (Economics) – South Africa 5. Formal sector (Economics) – South Africa I. Statistics South Africa II. Series (LCSH 16) A complete set of Stats SA publications is available at Stats SA Library and the following libraries: National Library of South Africa, Pretoria Division National Library of South Africa, Cape Town Division Library of Parliament, Cape Town Bloemfontein Public Library Natal Society Library, Pietermaritzburg Johannesburg Public Library Eastern Cape Library Services, King William's Town Central Regional Library, Polokwane Central Reference Library, Nelspruit Central Reference Collection, Kimberley Central Reference Library, Mmabatho This publication is available both in hard copy and on the Stats SA website www.statssa.gov.za. The data and metadata set from the Quarterly Labour Force Survey will be available on CD-ROM. A charge may be made according to the pricing policy, which can be accessed on the website. Stats SA also provides a subscription service. Enquiries: Printing and distribution User information services Tel: (012) 310 8251 (012) 310 8600 Fax: (012) 321 7381 (012) 310 8500/ 8495 Email: [email protected] [email protected]

Statistics South Africa P0211
Quarterly Labour Force Survey, Quarter 2, 2009
ii
Table of contents Page
List of tables in highlights of the results ..........................................................................................................iii
List of figures in highlights of the results.........................................................................................................iii
List of tables....................................................................................................................................................iv
1. Introduction ......................................................................................................................................... v
2. Highlights of the results....................................................................................................................... v
3. Employment ........................................................................................................................................vi
4. The unemployed population................................................................................................................ix
5. Characteristics of the not economically active population...................................................................xi
6. Technical notes..................................................................................................................................xii
6.1. Response details ...............................................................................................................................xii
6.2. Survey requirements and design ...................................................................................................... xiii
6.3. Sample rotation................................................................................................................................. xiii
6.4. Weighting .......................................................................................................................................... xiii
6.5. Non-response adjustment................................................................................................................. xiii
6.6. Final survey weights .........................................................................................................................xiv
6.7. Estimation .........................................................................................................................................xiv
6.8. Reliability of the survey estimates.....................................................................................................xiv
7. Definitions ..........................................................................................................................................xv
Statistics South Africa P0211
Quarterly Labour Force Survey, Quarter 2, 2009
iii
List of tables in highlights of the results Page
Table A: Key labour market indicators.........................................................................................................v
Table B: Employment by industry ............................................................................................................... vi
Table C: Employment by province.............................................................................................................. vi
Table D: Employment by occupation .........................................................................................................viii
Table E: Unemployed by sex...................................................................................................................... ix
Table F: Characteristics of the unemployed ................................................................................................x
Table G: The not economically active......................................................................................................... xi
Table H: Response rates by province........................................................................................................ xii
List of figures in highlights of the results Figure 1: Formal sector employment by industry....................................................................................... vii
Figure 2: Informal sector employment by industry.....................................................................................viii
Figure 3: Unemployment rate by province.................................................................................................. ix
Figure 4: Unemployment rate by population group......................................................................................x

Statistics South Africa P0211
Quarterly Labour Force Survey, Quarter 2, 2009
iv
List of tables Page Table 1: Population of working age (15-64 years) .......................................................................................... 1
Table 2: Labour force characteristics by sex - All population groups.............................................................. 2
Table 2.1: Labour force characteristics by population group .......................................................................... 3
Table 2.2: Labour force characteristics by province ....................................................................................... 4
Table 2.2: Labour force characteristics by province (concluded).................................................................... 5
Table 3.1: Employed by industry and sex - South Africa ................................................................................ 6
Table 3.2: Employed by industry and province............................................................................................... 7
Table 3.2: Employed by industry and province (concluded) ........................................................................... 8
Table 3.3: Employed by sector and industry - South Africa............................................................................ 9
Table 3.4: Employed by province and sector................................................................................................ 10
Table 3.5: Employed by sex and occupation - South Africa ......................................................................... 11
Table 3.6: Formal and informal employment ................................................................................................ 12
Table 3.6: Formal and informal employment (concluded) ............................................................................ 13
Table 3.7: Employed by sex and status in employment - South Africa......................................................... 14
Table 3.8: Employed by sex and usual hours of work - South Africa ........................................................... 15
Table 3.9: Time-related underemployment - South Africa ............................................................................ 16
Table 4: Characteristics of the unemployed - South Africa........................................................................... 17
Table 5: Characteristics of the not economically active - South Africa ......................................................... 18
Table 7: Involvement in non-market activities and labour market status by province................................... 20
Table 7: Involvement in non-market activities and labour market status by province (concluded) ............... 21
Appendix 2A: Sampling variability for labour force characteristics by sex.................................................... 22
Appendix 2.1A: Sampling variability for labour force characteristics by population group............................ 23
Appendix 2.2A: Sampling variability for labour force characteristics by province ......................................... 24
Appendix 2.2A: Sampling variability for labour force characteristics by province (Concluded) .................... 25
Appendix 3.1A: Sampling variability for the employed by industry and sex.................................................. 26
Appendix 3.4A: Sampling variability for the employed by province and sector............................................. 27
Appendix 3.5A: Sampling variability for the employed by sex and occupation............................................. 28
Appendix 2B: Sampling variability for labour force characteristics by sex.................................................... 29
Appendix 2.1B: Sampling variability for labour force characteristics by population group............................ 30
Appendix 2.2B: Sampling variability for labour force characteristics by province ......................................... 31
Appendix 2.2B: Sampling variability for labour force characteristics by province (Concluded) .................... 32
Appendix 3.1B: Sampling variability for the employed by industry and sex.................................................. 33
Appendix 3.4B: Sampling variability for the employed by province and sector............................................. 34
Appendix 3.5B: Sampling variability for the employed by sex and occupation............................................. 35

Statistics South Africa P0211
Quarterly Labour Force Survey, Quarter 2, 2009
v 1. Introduction The Quarterly Labour Force Survey (QLFS) is a household-based sample survey conducted by Statistics South Africa (Stats SA). It collects data on the labour market activities of individuals aged 15 years and above who live in South Africa. However, this report will only cover labour market activities of persons aged between 15 and 64 years. This report presents the key findings of the QLFS conducted in April–June, 2009 (Q2:2009).
2. Highlights of the results Table A: Key labour market indicators
Apr–Jun 2008
Jan–Mar 2009
Apr–Jun 2009
Qrt to Qrt change
Year-on-year
change
P-value (Qrt to
Qrt) Thousand Population 15–64 yrs 30 705 30 987 31 080 93 375 Labour force 17 844 17 820 17 495 -325 -349 0,00 Employed 13 729 13 636 13 369 -267 -360 0,00 Formal sector (Non-agricultural) 9 415 9 449 9 356 -93 -59 0,16 Informal sector (Non-agricultural) 2 340 2 150 2 109 -41 -231 0,34 Agriculture 790 738 710 -28 -80 0,41 Private households 1 185 1 299 1 194 -105 9 0,00 Unemployed 4 114 4 184 4 125 -59 11 0,45 Not economically active 12 861 13 166 13 585 419 724 0,00 Discouraged work-seekers 1 079 1 215 1 517 302 438 0,00 Other (not economically active) 11 783 11 951 12 068 117 285 0,15 Rates (%) Unemployment rate 23,1 23,5 23,6 0,1 0,5 0,79 Employed / population ratio (Absorption) 44,7 44,0 43,0 -1,0 -1,7 0,00 Labour force participation rate 58,1 57,5 56,3 -1,2 -1,8 0,00
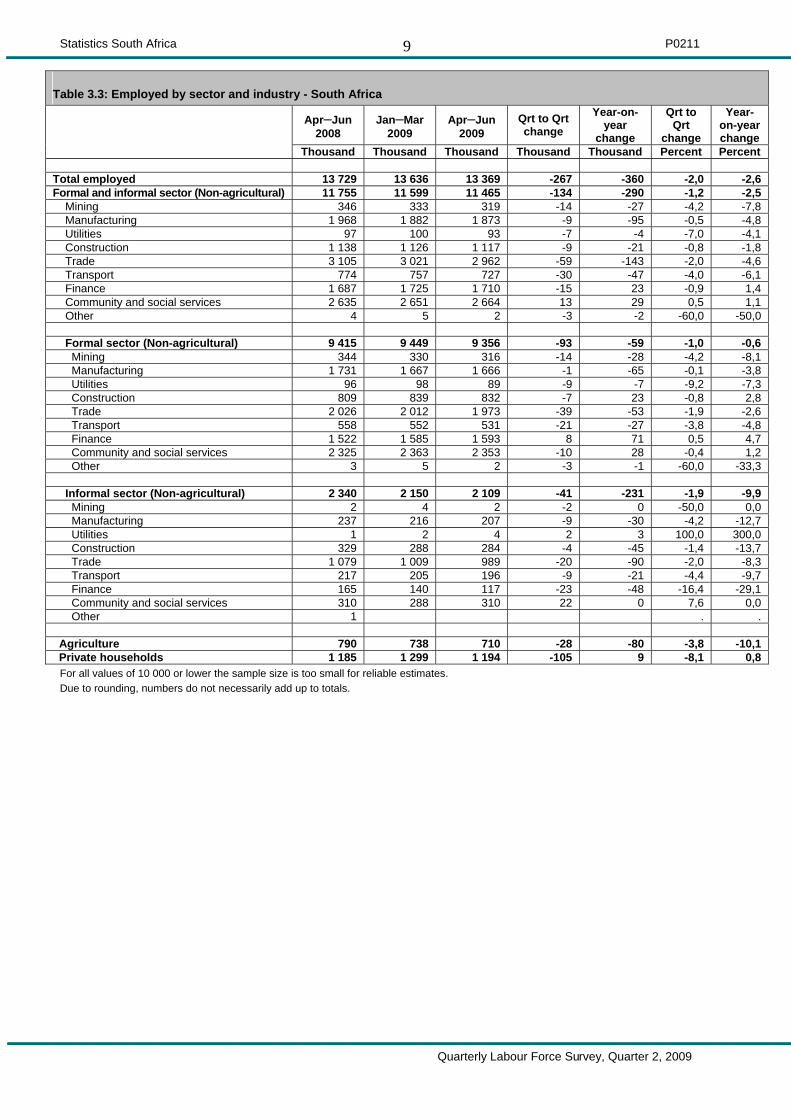
Due to rounding, numbers do not necessarily add up to totals. The number of persons in the labour force decreased by 325 000 from 17,8 million Q1:2009 to 17,5 million in Q2:2009. Table A shows that employment decreased by 2,0 percent between Q1:2009 and Q2:2009. A total of 267 thousand jobs were lost between the two quarters, with most job losses recorded in private households (105 000), followed by the formal sector (93 000). While employment fell by a substantial 267 thousand from Q1:2009, this decline did not translate to an increase in the number of unemployed persons but rather to the increase in the number of persons who are not economically active (419 000) with the majority of them being discouraged work-seekers (302 000); the number of unemployed persons decreased by 59 thousand. As a result, there was virtually no change in the unemployment rate between the two quarters. Compared to Q2:2008, there was an annual decrease of 2,6 percent (360 000) in employment; an increase of 11 thousand in the number of unemployed persons and a massive increase of 724 thousand in the number of persons who are not economically active – 438 thousand being discouraged work-seekers.

Statistics South Africa P0211
Quarterly Labour Force Survey, Quarter 2, 2009
vi 3. Employment Table B: Employment by industry
Apr–Jun 2008
Jan–Mar 2009
Apr–Jun 2009
Qrt to Qrt change
Year-on-year
change
Qrt to Qrt
change
Year-on-year
change Thousand Percent
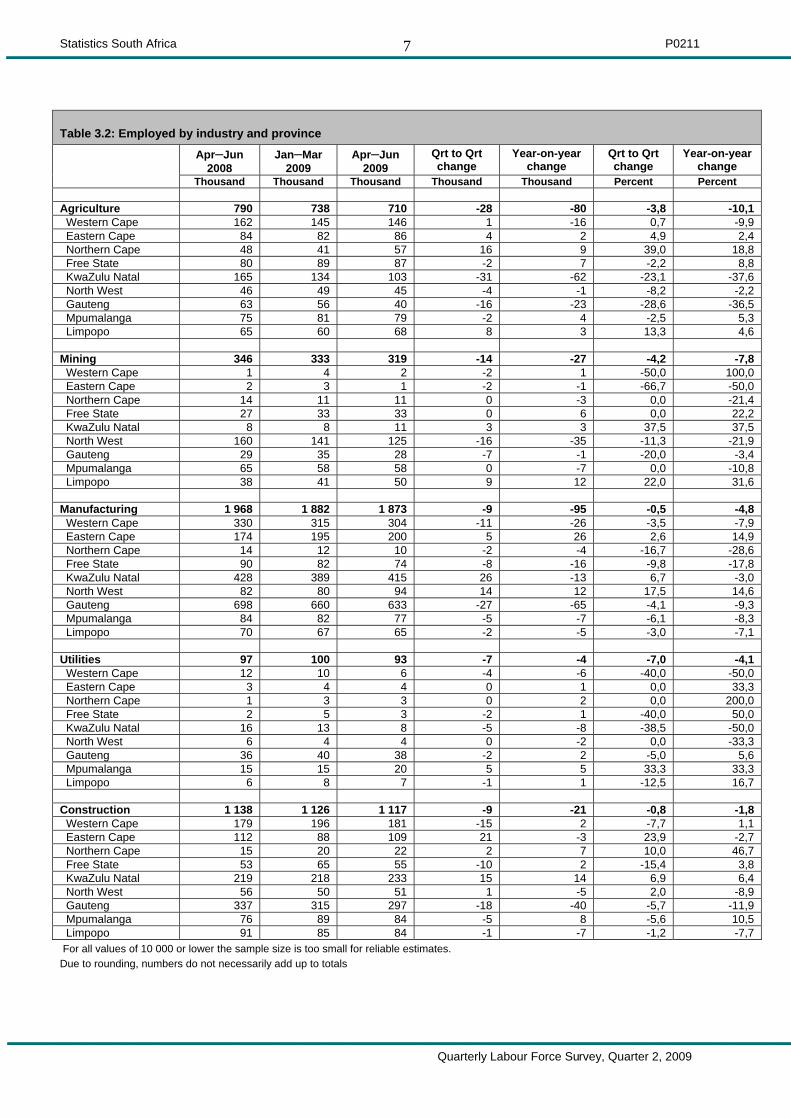
Total 13 729 13 636 13 369 -267 -360 -2,0 -2,6 Agriculture 790 738 710 -28 -80 -3,8 -10,1 Mining 346 333 319 -14 -27 -4,2 -7,8 Manufacturing 1 968 1 882 1 873 -9 -95 -0,5 -4,8 Utilities 97 100 93 -7 -4 -7,0 -4,1 Construction 1 138 1 126 1 117 -9 -21 -0,8 -1,8 Trade 3 105 3 021 2 962 -59 -143 -2,0 -4,6 Transport 774 757 727 -30 -47 -4,0 -6,1 Finance 1 687 1 725 1 710 -15 23 -0,9 1,4 Community and social services 2 635 2 651 2 664 13 29 0,5 1,1 Private households 1 185 1 299 1 194 -105 9 -8,1 0,8 Other 4 5 2 -3 -2 -60,0 -50,0
*Due to rounding, numbers do not necessarily add up to totals. Table B indicates that between Q1:2009 and Q2:2009, job losses were recorded in all industries but Community and social services. Most of the jobs losses were in Private households which accounted for 105 thousand of the job losses, followed by Trade (59 000), Transport (30 000) and Agriculture (28 000). The year-on-year comparisons also show that job losses were experienced in most of the industries with Trade accounting for 143 thousand of the job losses, followed by Manufacturing (95 000) and Agriculture (80 000). There were some job gains in Community and social services (29 000), Finance (23 000) and Private households (9 000) although there was an overall decline of 360 thousand in employment between Q2:2008 and Q2:2009.
Table C: Employment by province Apr–Jun
2008 Jan–Mar
2009 Apr–Jun
2009 Qrt to Qrt change
Year-on-year change
Jan–Mar 2009
Thousand % share Total 13 729 13 636 13 369 -267 -360 100,0 Western Cape 1 891 1 965 1 898 -67 7 14,2 Eastern Cape 1 363 1 311 1 353 42 -10 10,1 Northern Cape 297 278 283 5 -14 2,1 Free State 831 812 773 -39 -58 5,8 KwaZulu Natal 2 614 2 514 2 457 -57 -157 18,4 North West 900 885 849 -36 -51 6,4 Gauteng 4 061 4 030 3 953 -77 -108 29,6 Mpumalanga 900 936 897 -39 -3 6,7 Limpopo 874 905 906 1 32 6,8 *Due to rounding, numbers do not necessarily add up to totals. Table C shows that between Q1:2009 and Q2:2009, employment decreased in most provinces except Eastern Cape, Northern Cape and Limpopo. The highest number of job losses was observed in Gauteng (77 000) followed by Western Cape (67 000) and KwaZulu-Natal (57 000).

Statistics South Africa P0211
Quarterly Labour Force Survey, Quarter 2, 2009
vii The year-on-year comparisons (Q2:2008 and Q2:2009) show that KwaZulu-Natal and Gauteng were the hardest hit provinces in terms of job losses, recording 157 thousand and 108 thousand job losses respectively. Figure 1: Formal sector employment by industry
500
1 000
1 500
2 000
2 500Thousand
Q2:2008 344 1 731 96 809 2 026 558 1 522 2 325
Q1:2009 330 1 667 98 839 2 012 552 1 585 2 363
Q2:2009 316 1 666 89 832 1 973 531 1 593 2 353
Mining Manufacturing Utilities Construction Trade Transport Finance
Community and social services
Figure 1 shows that there was a decrease of 93 thousand formal sector jobs between Q1:2009 and Q2:2009 with the most affected industries being Trade (39 000), Transport (21 000) and Mining (14 000). The year-on-year comparisons show a net loss of 59 thousand jobs in the formal sector, with Manufacturing and Trade being the hardest hit with the loss of 65 thousand and 53 thousand jobs respectively, although some industries such as Finance, Community and social services and Construction experienced job gains.

Statistics South Africa P0211
Quarterly Labour Force Survey, Quarter 2, 2009
viii Figure 2: Informal sector employment by industry
200
400
600
800
1 000
1 200Thousand
Q2:2008 2 237 1 329 1 079 217 165 310
Q1:2009 4 216 2 288 1 009 205 140 288
Q2:2009 2 207 4 284 989 196 117 310
Mining Manufacturing Utilities
Construction Trade Transport Finance Community
and social services
Figure 2 indicates that, similar to the formal sector, the informal sector also shed 41 thousand jobs between Q1:2009 and Q2:2009, especially in the Finance (23 000) and Trade (20 000) industries. Compared to Q2:2008, the informal sector lost 231 thousand jobs with most of them being in Trade (90 000), Finance (48 000), Construction (45 000) and Manufacturing (30 000). Table D: Employment by occupation
Apr–Jun 2008
Jan–Mar 2009
Apr–Jun 2009
Qrt to Qrt
change
Year-on-year
change
Qrt to Qrt
change
Year-on-year
change Thousand Percent
Total 13 729 13 636 13 369 - 267 - 360 -2,0 -2,6 Manager 993 1 053 1 022 - 31 29 -2,9 2,9 Professional 789 795 654 - 141 - 135 -17,7 -17,1 Technician 1 454 1 496 1 550 54 96 3,6 6,6 Clerk 1 450 1 403 1 440 37 - 10 2,6 -0,7 Sales and services 1 749 1 780 1 804 24 55 1,3 3,1 Skilled agriculture 95 118 83 - 35 - 12 -29,7 -12,6 Craft and related trade 1 946 1 809 1 779 - 30 - 167 -1,7 -8,6 Plant and machine operator 1 161 1 217 1 186 - 31 25 -2,5 2,2 Elementary 3 137 2 934 2 889 - 45 - 248 -1,5 -7,9 Domestic worker 953 1 031 963 - 68 10 -6,6 1,0 Other 2 . . . . . .
*Due to rounding, numbers do not necessarily add up to totals.
Table D shows a decrease in the number of individuals employed in various occupations, with the biggest quarterly decrease recorded in Professional occupations where 141 thousand jobs were lost. This was followed by Domestic workers (68 000), Elementary occupations (45 000) and Skilled agriculture (35 000) occupations.
The year-on-year comparisons show that the shed jobs were mostly in Elementary, Craft and related trade and Professional occupations (248 000, 167 000 and 135 000 respectively).
Statistics South Africa P0211
Quarterly Labour Force Survey, Quarter 2, 2009
ix
4. The unemployed population Table E: Unemployed by sex
Apr–Jun 2008
Jan–Mar 2009
Apr–Jun 2009
Qrt to Qrt change
Year-on-year change
Qrt to Qrt change
Year-on-year change
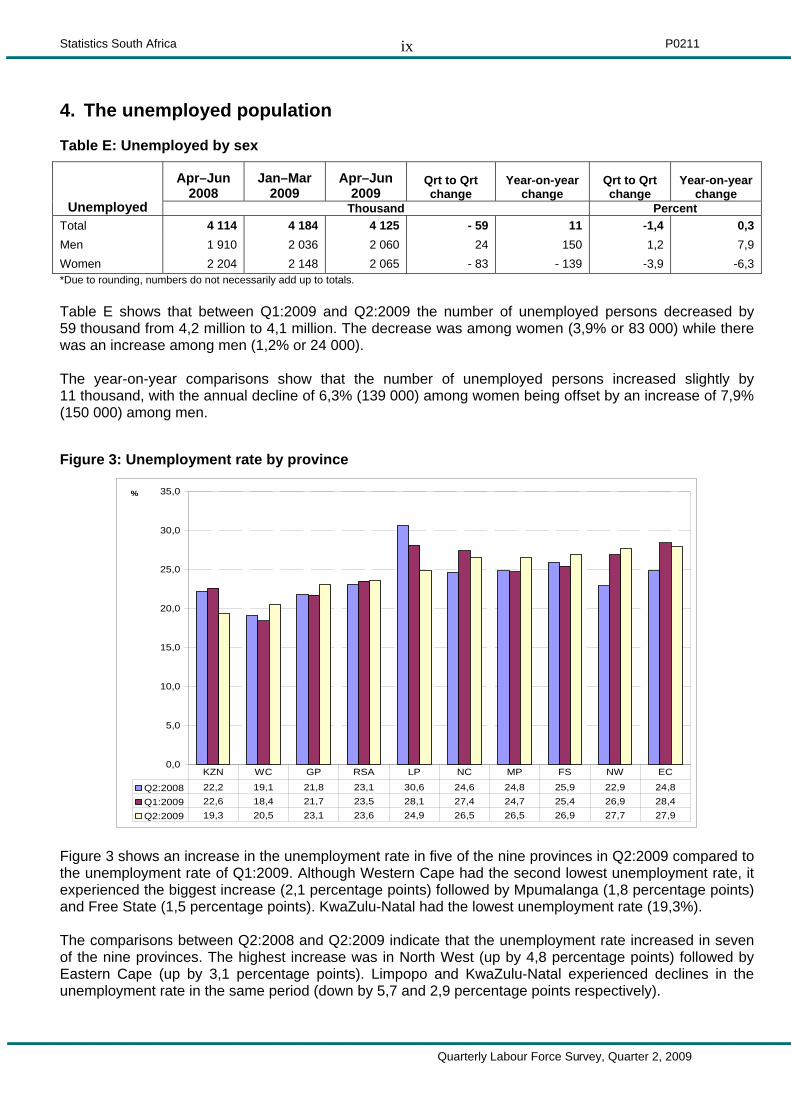
Unemployed Thousand Percent Total 4 114 4 184 4 125 - 59 11 -1,4 0,3 Men 1 910 2 036 2 060 24 150 1,2 7,9 Women 2 204 2 148 2 065 - 83 - 139 -3,9 -6,3 *Due to rounding, numbers do not necessarily add up to totals. Table E shows that between Q1:2009 and Q2:2009 the number of unemployed persons decreased by 59 thousand from 4,2 million to 4,1 million. The decrease was among women (3,9% or 83 000) while there was an increase among men (1,2% or 24 000). The year-on-year comparisons show that the number of unemployed persons increased slightly by 11 thousand, with the annual decline of 6,3% (139 000) among women being offset by an increase of 7,9% (150 000) among men.
Figure 3: Unemployment rate by province
0,0
5,0
10,0
15,0
20,0
25,0
30,0
35,0%
Q2:2008 22,2 19,1 21,8 23,1 30,6 24,6 24,8 25,9 22,9 24,8Q1:2009 22,6 18,4 21,7 23,5 28,1 27,4 24,7 25,4 26,9 28,4Q2:2009 19,3 20,5 23,1 23,6 24,9 26,5 26,5 26,9 27,7 27,9
KZN WC GP RSA LP NC MP FS NW EC
Figure 3 shows an increase in the unemployment rate in five of the nine provinces in Q2:2009 compared to the unemployment rate of Q1:2009. Although Western Cape had the second lowest unemployment rate, it experienced the biggest increase (2,1 percentage points) followed by Mpumalanga (1,8 percentage points) and Free State (1,5 percentage points). KwaZulu-Natal had the lowest unemployment rate (19,3%). The comparisons between Q2:2008 and Q2:2009 indicate that the unemployment rate increased in seven of the nine provinces. The highest increase was in North West (up by 4,8 percentage points) followed by Eastern Cape (up by 3,1 percentage points). Limpopo and KwaZulu-Natal experienced declines in the unemployment rate in the same period (down by 5,7 and 2,9 percentage points respectively).

Statistics South Africa P0211
Quarterly Labour Force Survey, Quarter 2, 2009
x
Figure 4: Unemployment rate by population group
0,0
5,0
10,0
15,0
20,0
25,0
30,0%
Q2:2008 27,0 19,5 12,7 4,6 23,1Q1:2009 27,7 19,5 12,7 4,6 23,5Q2:2009 27,9 19,5 11,3 4,6 23,6
Black/African Coloured Indian/Asian White South Africa
Figure 4 shows that between Q1:2009 and Q2:2009, the unemployment rate remained unchanged across all population groups except among Indians where it declined by 1,4 percentage points. The year-on-year comparisons show that the unemployment rate remained unchanged among coloured and white population groups; increased among Black Africans, and decreased among Indians.
Table F: Characteristics of the unemployed
Apr–Jun
2008 Jan–Mar
2009 Apr–Jun
2009 Qrt to Qrt change
Year-on-year
change Qrt to Qrt change
Year-on-year
change Unemployed Thousand Percent Total 4 114 4 184 4 125 - 59 11 -1,4 0,3
Job losers 1 172 1 360 1 427 67 255 4,9 21,8
Job leavers 402 357 345 - 12 - 57 -3,4 -14,2
New entrants 1 746 1 785 1 670 - 115 - 76 -6,4 -4,4
Re-entrants 253 188 173 - 15 - 80 -8,0 -31,6
Other 541 494 510 16 - 31 3,2 -5,7
Table F shows that between Q1:2009 and Q2:2009 new entrants accounted for most (115 000) of the observed decrease in the levels of unemployment, while the number of job losers increased by 67 thousand in the same period. While there was an increase in the number of job losers (255 000) in Q2:2009 compared to Q2:2008, this was offset by a decline among re-entrants (80 000), new entrants (76 000) and job leavers (57 000), resulting in a net gain of 11 thousand in the number of unemployed persons over this period.

Statistics South Africa P0211
Quarterly Labour Force Survey, Quarter 2, 2009
xi
5. Characteristics of the not economically active population Table G: The not economically active
Apr–Jun 2008
Jan–Mar 2009
Apr–Jun 2009
Qrt to Qrt change
Year-on-year
change Qrt to Qrt change
Year-on-year change Not economically
active Thousand Percent Total 12 861 13 166 13 585 419 724 3,2 5,6
Student 5 670 5 634 5 693 59 23 1,0 0,4
Home-maker 2 496 2 693 2 652 - 41 156 -1,5 6,3
Illness/disability 1 794 1 767 1 799 32 5 1,8 0,3
Too old/young to work 978 1 042 1 062 20 84 1,9 8,6
Discouraged 1 079 1 215 1 517 302 438 24,9 40,6
Other 845 816 862 46 17 5,6 2,0 Due to rounding, numbers do not necessarily add up to totals. Table G shows that the not economically active population increased by 419 thousand persons between Q1:2009 and Q2:2009, with the discouraged work-seekers accounting for 302 thousand of such persons. The only observed decline was among the Home-makers (41 000). The year-on-year changes indicate that overall there was an increase in the number of not economically active persons (724 000 or 5,6%) between Q2:2008 and Q2:2009. Discouraged work-seekers (438 000) and Home-makers (156 000) made the largest contribution to the increase of 724 thousand among the not economically active persons, while students accounted for 23 thousand of the increase.
______________________
PJ Lehohla Statistician-General: Statistics South Africa
Statistics South Africa P0211
Quarterly Labour Force Survey, Quarter 2, 2009
xii
6. Technical notes
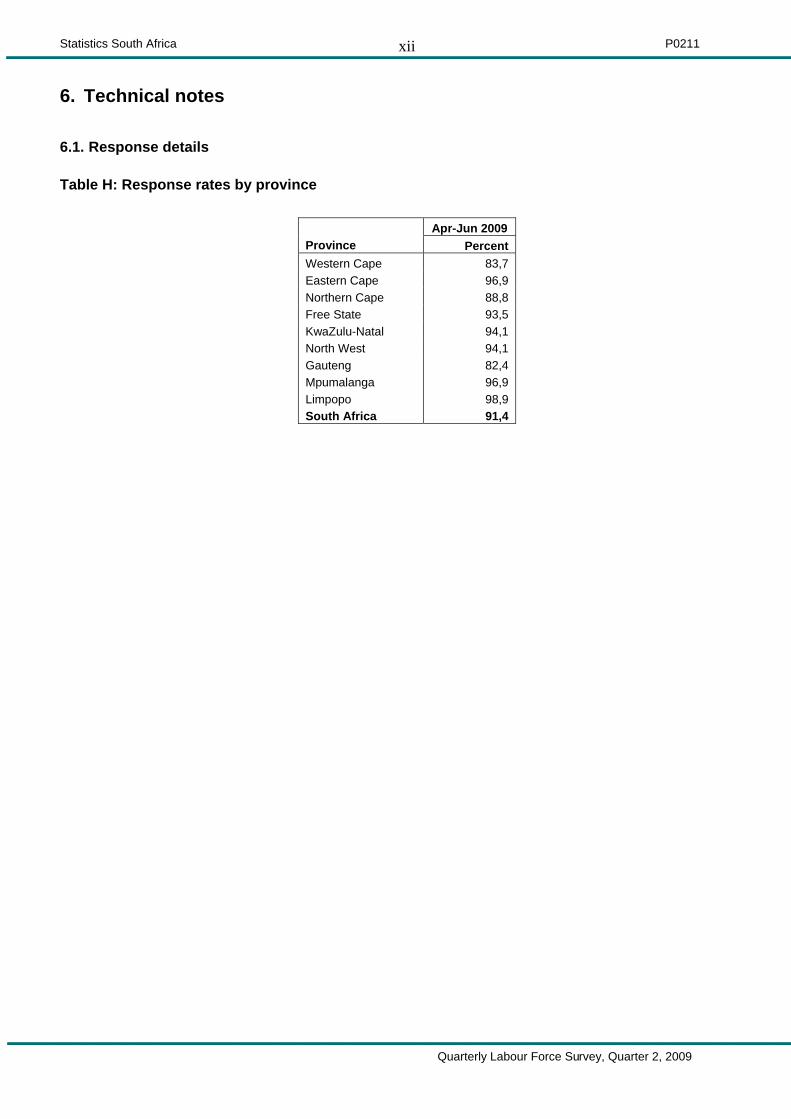
6.1. Response details Table H: Response rates by province
Apr-Jun 2009
Province Percent Western Cape 83,7 Eastern Cape 96,9 Northern Cape 88,8 Free State 93,5 KwaZulu-Natal 94,1 North West 94,1 Gauteng 82,4 Mpumalanga 96,9 Limpopo 98,9 South Africa 91,4

Statistics South Africa P0211
Quarterly Labour Force Survey, Quarter 2, 2009
xiii
6.2. Survey requirements and design The Quarterly Labour Force Survey (QLFS) frame has been developed as a general-purpose household survey frame that can be used by all other household surveys irrespective of the sample size requirement of the survey. The sample size for the QLFS is roughly 30 000 dwellings per quarter.
The sample is based on information collected during the 2001 Population Census conducted by Stats SA. In preparation for the 2001 Census, the country was divided into 80 787 enumeration areas (EAs). Stats SA’s household-based surveys use a master sample of primary sampling units (PSUs) which comprises of EAs that are drawn from across the country. The sample is designed to be representative at provincial level and within provinces at metro/non-metro level. Within the metros, the sample is further distributed by geography type. The four geography types are: urban formal, urban informal, farms and tribal. This implies, for example, that within a metropolitan area the sample is representative at the different geography types that may exist within that metro. The current sample size is 3 080 PSUs. It is divided equally into four sub-groups or panels called rotation groups. The rotation groups are designed in such a way that each of these groups has the same distribution pattern as that which is observed in the whole sample. They are numbered from one to four and these numbers also correspond to the quarters of the year in which the sample will be rotated for the particular group. The sample for the redesigned Labour Force Survey (i.e. the QLFS) is based on a stratified two-stage design with probability proportional to size (PPS) sampling of primary sampling units (PSUs) in the first stage, and sampling of dwelling units (DUs) with systematic sampling in the second stage.
6.3. Sample rotation Each quarter, a ¼ of the sampled dwellings rotate out of the sample and are replaced by new dwellings from the same PSU or the next PSU on the list. Thus, sampled dwellings will remain in the sample for four consecutive quarters. It should be noted that the sampling unit is the dwelling, and the unit of observation is the household. Therefore, if a household moves out of a dwelling after being in the sample for, say two quarters and a new household moves in then the new household will be enumerated for the next two quarters. If no household moves into the sampled dwelling, the dwelling will be classified as vacant (unoccupied).
6.4. Weighting The sampling weights for the data collected from the sampled households are constructed in such a manner that the responses could be properly expanded to represent the entire civilian population of South Africa. The weights are the result of calculations involving several factors, including original selection probabilities, adjustment for non-response, and benchmarking to known population estimates from the Demographic division of Stats SA.
6.5. Non-response adjustment In general, imputation is used for item non-response (i.e. blanks within the questionnaire) and edit failure (i.e. invalid or inconsistent responses). The eligible households in the sampled dwellings can be divided into two response categories: respondents and non-respondents; and weight adjustment is applied to account for the non-respondent households (e.g. refusal, no contact, etc.).
Statistics South Africa P0211
Quarterly Labour Force Survey, Quarter 2, 2009
xiv
6.6. Final survey weights The final survey weights are constructed using regression estimation to calibrate to the known population counts at the national level population estimates (which are supplied by the Demography division) cross-classified by 5-year age groups, gender and race, and provincial population estimates by broad age groups. The 5-year age groups are: 0–4, 5–9, 10–14, etc, and 65 and over. The provincial level age groups are: 0–14, 15–34, 35–64, and 65 years and over. The calibrated weights are constructed such that all persons in a household would have the same final weight.
6.7. Estimation The final survey weights are used to obtain the estimates for various domains of interest, e.g. number of persons employed in agriculture in the province of Western Cape, number of females employed in manufacturing, etc.
6.8. Reliability of the survey estimates
Because estimates are based on sample data, they differ from figures that would have been obtained from complete enumeration of the population using the same instrument. Results are subject to both sampling and non-sampling errors. Non-sampling errors include biases from inaccurate reporting, processing, and tabulation etc., as well as errors from non-response and incomplete reporting. These types of errors cannot be measured readily. However, to the extent possible, non-sampling errors can be minimised through the procedures used for data collection, editing, quality control, and non-response adjustment. The variances of the survey estimates are used to measure sampling errors. The variance estimation methodology is discussed below.
(i) Variance estimation The most commonly used methods for estimating variances of survey estimates from complex surveys, such as the QLFS, are the Taylor-series Linearization, Jackknife Replication, Balanced Repeated Replication (BRR), and Bootstrap methods (Wolter, 2007)1. The Fay’s BRR method has been used for variance estimation in the QLFS because of its simplicity.
(ii) Coefficient of variation It is more useful in many situations to assess the size of the standard error relative to the magnitude of the characteristic being measured (the standard error is defined as the square root of the variance). The coefficient of variation ( )cv provides such a measure. It is the ratio of the standard error of the survey estimate to the value of the estimate itself expressed as a percentage. It is very useful in comparing the precision of several different survey estimates, where their sizes or scale differ from one another. (iii) P-value of an estimate of change The p-value corresponding to an estimate of change is the probability of observing a value larger than the particular observed value under the hypothesis that there is no real change. If p-value <0,01 then the difference is highly significant; if p-value is between 0,01 and 0,05 then the difference is significant; and if p-value >0,05 then the difference is not significant
1 Wolter, K. M. (2007), Introduction to Variance Estimation, 2nd Edition, Springer-Verlag: New York.

Statistics South Africa P0211
Quarterly Labour Force Survey, Quarter 2, 2009
xv
7. Definitions
Discouraged work-seeker is a person who was not employed during the reference period, wanted to work, was available to work/start a business but did not take active steps to find work during the last four weeks, provided that the main reason given for not seeking work was any of the following: no jobs available in the area; unable to find work requiring his/her skills; lost hope of finding any kind of work.
Economic activities are those that contribute to the production of goods and services in the country. There are two types of economic activities, and they are: (1) Market production activities (work done for others and usually associated with pay or profit); and (2) Non-market production activities (work done for the benefit of the household e.g. subsistence farming) Employed persons are those aged 15–64 years who, during the reference week: did any work for at least one hour; or had a job or business but were not at work (temporarily absent). Employment-to-population ratio (labour absorption rate) is the proportion of the working age population that is employed.
Informal employment identifies persons who are in precarious employment situations irrespective of whether or not the entity for which they work is in the formal or informal sector. Persons in informal employment therefore consist of all persons in the informal sector; employees in the formal sector; and persons working in private households who are not entitled to basic benefits such as pension or medical aid contributions from their employer, and who do not have a written contract of employment.
Informal sector: The informal sector has the following two components: i) Employees working in establishments that employ less than five employees, who do not deduct
income tax from their salaries/wages; and ii) Employers, own account workers and persons helping unpaid in their household business who
are not registered for either income tax or value-added tax.
The labour force comprises all persons who are employed plus all persons who are unemployed.
Labour force participation rate is the proportion of the working age population that is either employed or unemployed. Long-term unemployment: Persons in long-term unemployment are those individuals among the unemployed who were without work and trying to find a job or start a business for one year or more.
Not economically active: Persons aged 15–64 years who are neither employed nor unemployed in the reference week.
Persons in underemployment (time-related) are employed persons who were willing and available to work additional hours, whose total number of hours actually worked during the reference period was below 35 hours per week.
Underutilised labour comprises three groups as follows: persons who are underemployed, persons who are unemployed, and persons who are discouraged. Unemployed persons are those (aged 15–64 years) who:
a) Were not employed in the reference week and; b) Actively looked for work or tried to start a business in the four weeks preceding the survey interview
and; c) Were available for work i.e. would have been able to start work or a business in the reference week
or;
Statistics South Africa P0211
Quarterly Labour Force Survey, Quarter 2, 2009
xvi
d) Had not actively looked for work in the past four weeks but had a job or business to start at a
definite date in the future and were available.
Unemployment rate is the proportion of the labour force that is unemployed.
The working-age population comprises all persons aged 15–64 years.
Statistics South Africa P0211
Quarterly Labour Force Survey, Quarter 2, 2009
1
Appendix 1
Table 1: Population of working age (15-64 years)
Apr–Jun 2008
Jan–Mar 2009
Apr–Jun 2009
Qrt to Qrt change
Year-on-year change
Qrt to Qrt change
Year-on-year change
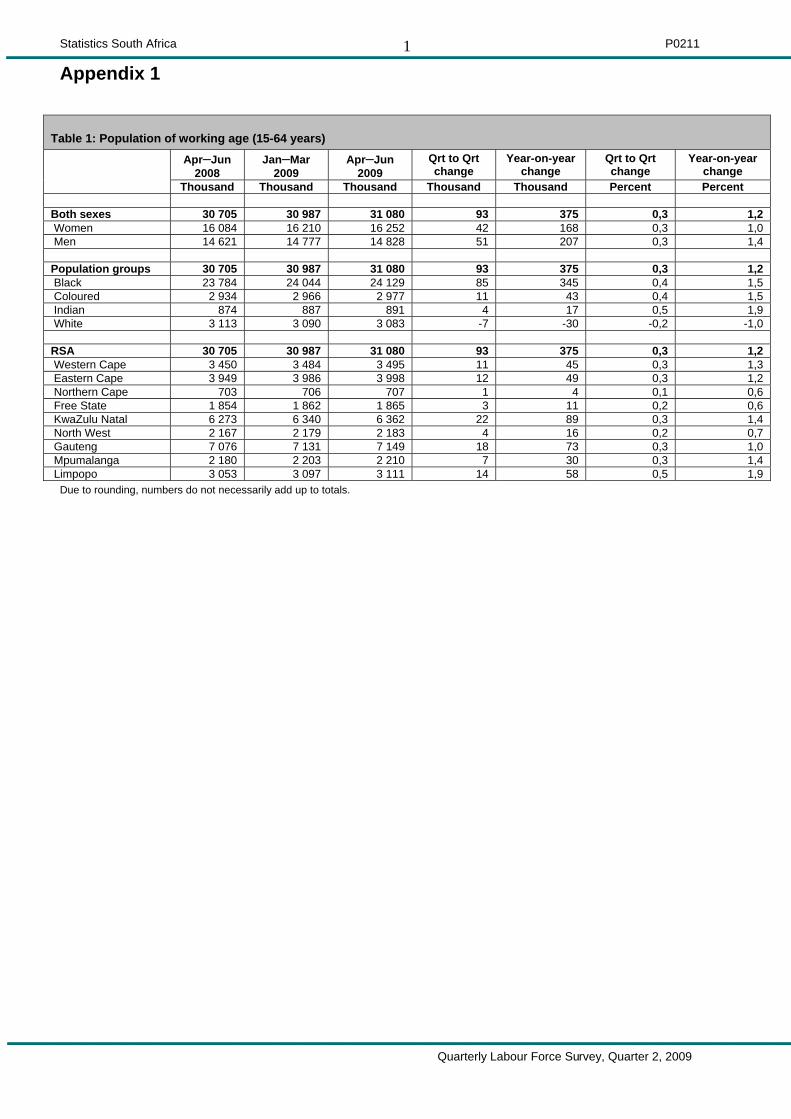
Thousand Thousand Thousand Thousand Thousand Percent Percent Both sexes 30 705 30 987 31 080 93 375 0,3 1,2 Women 16 084 16 210 16 252 42 168 0,3 1,0 Men 14 621 14 777 14 828 51 207 0,3 1,4 Population groups 30 705 30 987 31 080 93 375 0,3 1,2 Black 23 784 24 044 24 129 85 345 0,4 1,5 Coloured 2 934 2 966 2 977 11 43 0,4 1,5 Indian 874 887 891 4 17 0,5 1,9 White 3 113 3 090 3 083 -7 -30 -0,2 -1,0 RSA 30 705 30 987 31 080 93 375 0,3 1,2 Western Cape 3 450 3 484 3 495 11 45 0,3 1,3 Eastern Cape 3 949 3 986 3 998 12 49 0,3 1,2 Northern Cape 703 706 707 1 4 0,1 0,6 Free State 1 854 1 862 1 865 3 11 0,2 0,6 KwaZulu Natal 6 273 6 340 6 362 22 89 0,3 1,4 North West 2 167 2 179 2 183 4 16 0,2 0,7 Gauteng 7 076 7 131 7 149 18 73 0,3 1,0 Mpumalanga 2 180 2 203 2 210 7 30 0,3 1,4 Limpopo 3 053 3 097 3 111 14 58 0,5 1,9
Due to rounding, numbers do not necessarily add up to totals.

Statistics South Africa P0211
Quarterly Labour Force Survey, Quarter 2, 2009
2
Table 2: Labour force characteristics by sex - All population groups
Apr–Jun 2008
Jan–Mar 2009
Apr–Jun 2009
Qrt to Qrt change
Year-on-year
change
Qrt to Qrt
change
Year-on-year
change
Thousand Thousand Thousand Thousand Thousand Percent Percent Both sexes . . Population 15-64 yrs 30 705 30 987 31 080 93 375 0,3 1,2 Labour Force 17 844 17 820 17 495 -325 -349 -1,8 -2,0 Employed 13 729 13 636 13 369 -267 -360 -2,0 -2,6 Formal sector (Non-agricultural) 9 415 9 449 9 356 -93 -59 -1,0 -0,6 Informal sector (Non-agricultural) 2 340 2 150 2 109 -41 -231 -1,9 -9,9 Agriculture 790 738 710 -28 -80 -3,8 -10,1 Private households 1 185 1 299 1 194 -105 9 -8,1 0,8 Unemployed 4 114 4 184 4 125 -59 11 -1,4 0,3 Not economically active 12 861 13 166 13 585 419 724 3,2 5,6 Discouraged work-seekers 1 079 1 215 1 517 302 438 24,9 40,6 Other(not economically active) 11 783 11 951 12 068 117 285 1,0 2,4 Rates (%) Unemployment rate 23,1 23,5 23,6 0,1 0,5 Employed / population ratio (Absorption) 44,7 44,0 43,0 -1,0 -1,7 Labour force participation rate 58,1 57,5 56,3 -1,2 -1,8 Women Population 15-64 yrs 16 084 16 210 16 252 42 168 0,3 1,0 Labour Force 8 237 8 212 8 037 -175 -200 -2,1 -2,4 Employed 6 033 6 064 5 973 -91 -60 -1,5 -1,0 Formal sector (Non-agricultural) 3 767 3 817 3 840 23 73 0,6 1,9 Informal sector (Non-agricultural) 1 084 983 965 -18 -119 -1,8 -11,0 Agriculture 253 237 217 -20 -36 -8,4 -14,2 Private households 928 1 026 951 -75 23 -7,3 2,5 Unemployed 2 204 2 148 2 065 -83 -139 -3,9 -6,3 Not economically active 7 846 7 998 8 215 217 369 2,7 4,7 Discouraged work-seekers 663 721 880 159 217 22,1 32,7 Other(not economically active) 7 183 7 278 7 334 56 151 0,8 2,1 Rates (%) Unemployment rate 26,8 26,2 25,7 -0,5 -1,1 Employed / population ratio (Absorption) 37,5 37,4 36,8 -0,6 -0,7 Labour force participation rate 51,2 50,7 49,5 -1,2 -1,7 Men Population 15-64 yrs 14 621 14 777 14 828 51 207 0,3 1,4 Labour Force 9 606 9 608 9 457 -151 -149 -1,6 -1,6 Employed 7 696 7 572 7 397 -175 -299 -2,3 -3,9 Formal sector (Non-agricultural) 5 648 5 632 5 517 -115 -131 -2,0 -2,3 Informal sector (Non-agricultural) 1 256 1 167 1 144 -23 -112 -2,0 -8,9 Agriculture 537 500 494 -6 -43 -1,2 -8,0 Private households 256 273 243 -30 -13 -11,0 -5,1 Unemployed 1 910 2 036 2 060 24 150 1,2 7,9 Not economically active 5 015 5 168 5 371 203 356 3,9 7,1 Discouraged work-seekers 416 494 637 143 221 28,9 53,1 Other(not economically active) 4 599 4 674 4 734 60 135 1,3 2,9 Rates (%) Unemployment rate 19,9 21,2 21,8 0,6 1,9 Employed / population ratio (Absorption) 52,6 51,2 49,9 -1,3 -2,7 Labour force participation rate 65,7 65,0 63,8 -1,2 -1,9
Due to rounding, numbers do not necessarily add up to totals. Note: Employment refers to market production activities.

Statistics South Africa P0211
Quarterly Labour Force Survey, Quarter 2, 2009
3
Table 2.1: Labour force characteristics by population group
Apr–Jun 2008
Jan–Mar 2009
Apr–Jun 2009
Qrt to Qrt change
Year-on-year
change
Qrt to Qrt
change
Year-on-year
change
Thousand Thousand Thousand Thousand Thousand Percent Percent South Africa Population 15-64 yrs 30 705 30 987 31 080 93 375 0,3 1,2 Labour Force 17 844 17 820 17 495 -325 -349 -1,8 -2,0 Employed 13 729 13 636 13 369 -267 -360 -2,0 -2,6 Unemployed 4 114 4 184 4 125 -59 11 -1,4 0,3 Not economically active 12 861 13 166 13 585 419 724 3,2 5,6 Rates (%) Unemployment rate 23,1 23,5 23,6 0,1 0,5 Employed / population ratio (Absorption) 44,7 44,0 43,0 -1,0 -1,7 Labour force participation rate 58,1 57,5 56,3 -1,2 -1,8 Black/African Population 15-64 yrs 23 784 24 044 24 129 85 345 0,4 1,5 Labour Force 13 238 13 135 12 877 -258 -361 -2,0 -2,7 Employed 9 662 9 503 9 290 -213 -372 -2,2 -3,9 Unemployed 3 576 3 632 3 587 -45 11 -1,2 0,3 Not economically active 10 546 10 908 11 252 344 706 3,2 6,7 Rates (%) Unemployment rate 27,0 27,7 27,9 0,2 0,9 Employed / population ratio (Absorption) 40,6 39,5 38,5 -1,0 -2,1 Labour force participation rate 55,7 54,6 53,4 -1,2 -2,3 Coloured Population 15-64 yrs 2 934 2 966 2 977 11 43 0,4 1,5 Labour Force 1 909 1 972 1 942 -30 33 -1,5 1,7 Employed 1 538 1 588 1 563 -25 25 -1,6 1,6 Unemployed 372 384 379 -5 7 -1,3 1,9 Not economically active 1 025 994 1 035 41 10 4,1 1,0 Rates (%) Unemployment rate 19,5 19,5 19,5 0,0 0,0 Employed / population ratio (Absorption) 52,4 53,5 52,5 -1,0 0,1 Labour force participation rate 65,1 66,5 65,2 -1,3 0,1 Indian/Asian Population 15-64 yrs 874 887 891 4 17 0,5 1,9 Labour Force 534 536 521 -15 -13 -2,8 -2,4 Employed 466 468 461 -7 -5 -1,5 -1,1 Unemployed 68 68 59 -9 -9 -13,2 -13,2 Not economically active 340 350 370 20 30 5,7 8,8 Rates (%) Unemployment rate 12,7 12,7 11,3 -1,4 -1,4 Employed / population ratio (Absorption) 53,3 52,8 51,7 -1,1 -1,6 Labour force participation rate 61,1 60,4 58,4 -2,0 -2,7 White Population 15-64 yrs 3 113 3 090 3 083 -7 -30 -0,2 -1,0 Labour Force 2 163 2 177 2 155 -22 -8 -1,0 -0,4 Employed 2 064 2 077 2 056 -21 -8 -1,0 -0,4 Unemployed 99 100 100 0 1 0,0 1,0 Not economically active 951 914 928 14 -23 1,5 -2,4 Rates (%) Unemployment rate 4,6 4,6 4,6 0,0 0,0 Employed / population ratio (Absorption) 66,3 67,2 66,7 -0,5 0,4 Labour force participation rate 69,5 70,5 69,9 -0,6 0,4 Due to rounding, numbers do not necessarily add up to totals. Note: Employment refers to market production activities.
Statistics South Africa P0211
Quarterly Labour Force Survey, Quarter 2, 2009
4
Table 2.2: Labour force characteristics by province
Apr–Jun 2008
Jan–Mar 2009
Apr–Jun 2009
Qrt to Qrt change
Year-on-year
change Qrt to Qrt change
Year-on-year
change
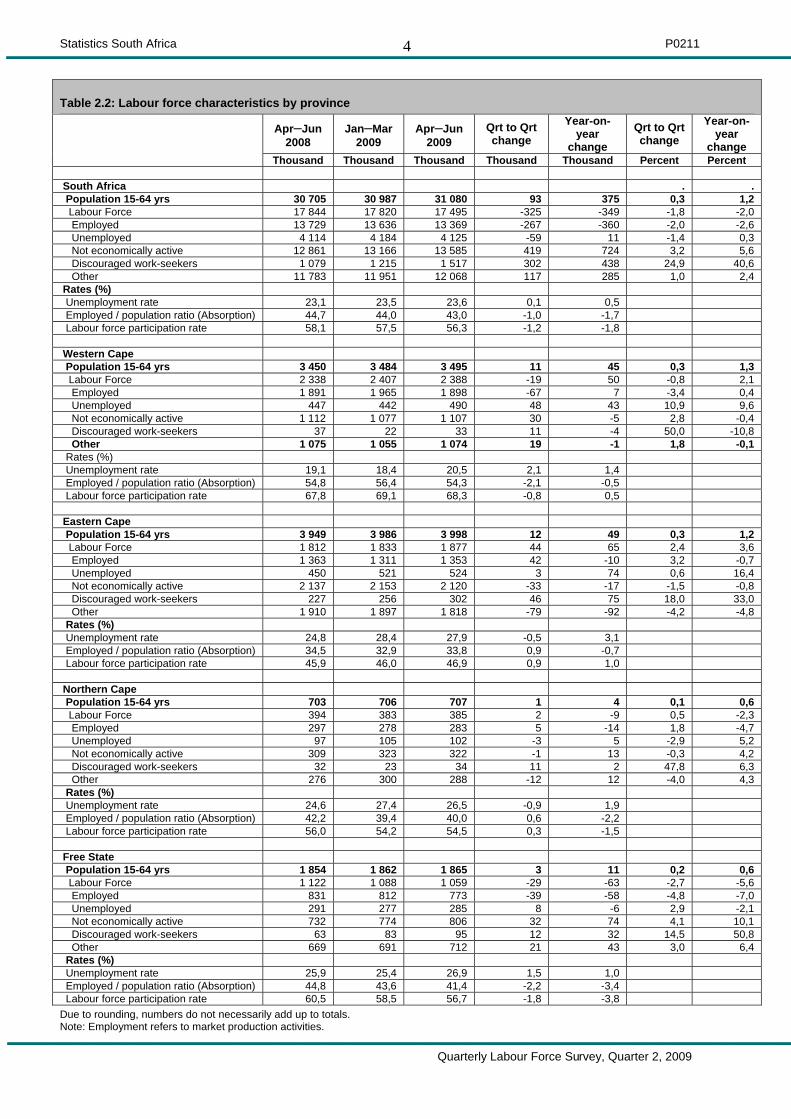
Thousand Thousand Thousand Thousand Thousand Percent Percent South Africa . . Population 15-64 yrs 30 705 30 987 31 080 93 375 0,3 1,2 Labour Force 17 844 17 820 17 495 -325 -349 -1,8 -2,0 Employed 13 729 13 636 13 369 -267 -360 -2,0 -2,6 Unemployed 4 114 4 184 4 125 -59 11 -1,4 0,3 Not economically active 12 861 13 166 13 585 419 724 3,2 5,6 Discouraged work-seekers 1 079 1 215 1 517 302 438 24,9 40,6 Other 11 783 11 951 12 068 117 285 1,0 2,4 Rates (%) Unemployment rate 23,1 23,5 23,6 0,1 0,5 Employed / population ratio (Absorption) 44,7 44,0 43,0 -1,0 -1,7 Labour force participation rate 58,1 57,5 56,3 -1,2 -1,8 Western Cape Population 15-64 yrs 3 450 3 484 3 495 11 45 0,3 1,3 Labour Force 2 338 2 407 2 388 -19 50 -0,8 2,1 Employed 1 891 1 965 1 898 -67 7 -3,4 0,4 Unemployed 447 442 490 48 43 10,9 9,6 Not economically active 1 112 1 077 1 107 30 -5 2,8 -0,4 Discouraged work-seekers 37 22 33 11 -4 50,0 -10,8 Other 1 075 1 055 1 074 19 -1 1,8 -0,1 Rates (%) Unemployment rate 19,1 18,4 20,5 2,1 1,4 Employed / population ratio (Absorption) 54,8 56,4 54,3 -2,1 -0,5 Labour force participation rate 67,8 69,1 68,3 -0,8 0,5 Eastern Cape Population 15-64 yrs 3 949 3 986 3 998 12 49 0,3 1,2 Labour Force 1 812 1 833 1 877 44 65 2,4 3,6 Employed 1 363 1 311 1 353 42 -10 3,2 -0,7 Unemployed 450 521 524 3 74 0,6 16,4 Not economically active 2 137 2 153 2 120 -33 -17 -1,5 -0,8 Discouraged work-seekers 227 256 302 46 75 18,0 33,0 Other 1 910 1 897 1 818 -79 -92 -4,2 -4,8 Rates (%) Unemployment rate 24,8 28,4 27,9 -0,5 3,1 Employed / population ratio (Absorption) 34,5 32,9 33,8 0,9 -0,7 Labour force participation rate 45,9 46,0 46,9 0,9 1,0 Northern Cape Population 15-64 yrs 703 706 707 1 4 0,1 0,6 Labour Force 394 383 385 2 -9 0,5 -2,3 Employed 297 278 283 5 -14 1,8 -4,7 Unemployed 97 105 102 -3 5 -2,9 5,2 Not economically active 309 323 322 -1 13 -0,3 4,2 Discouraged work-seekers 32 23 34 11 2 47,8 6,3 Other 276 300 288 -12 12 -4,0 4,3 Rates (%) Unemployment rate 24,6 27,4 26,5 -0,9 1,9 Employed / population ratio (Absorption) 42,2 39,4 40,0 0,6 -2,2 Labour force participation rate 56,0 54,2 54,5 0,3 -1,5 Free State Population 15-64 yrs 1 854 1 862 1 865 3 11 0,2 0,6 Labour Force 1 122 1 088 1 059 -29 -63 -2,7 -5,6 Employed 831 812 773 -39 -58 -4,8 -7,0 Unemployed 291 277 285 8 -6 2,9 -2,1 Not economically active 732 774 806 32 74 4,1 10,1 Discouraged work-seekers 63 83 95 12 32 14,5 50,8 Other 669 691 712 21 43 3,0 6,4 Rates (%) Unemployment rate 25,9 25,4 26,9 1,5 1,0 Employed / population ratio (Absorption) 44,8 43,6 41,4 -2,2 -3,4 Labour force participation rate 60,5 58,5 56,7 -1,8 -3,8 Due to rounding, numbers do not necessarily add up to totals. Note: Employment refers to market production activities.

Statistics South Africa P0211
Quarterly Labour Force Survey, Quarter 2, 2009
5
Table 2.2: Labour force characteristics by province (concluded)
Apr–Jun 2008
Jan–Mar 2009
Apr–Jun 2009
Qrt to Qrt change
Year-on-year
change
Qrt to Qrt
change
Year-on-year
change
Thousand Thousand Thousand Thousand Thousand Percent Percent KwaZulu Natal Population 15-64 yrs 6 273 6 340 6 362 22 89 0,3 1,4 Labour Force 3 359 3 248 3 043 -205 -316 -6,3 -9,4 Employed 2 614 2 514 2 457 -57 -157 -2,3 -6,0 Unemployed 745 733 586 -147 -159 -20,1 -21,3 Not economically active 2 914 3 092 3 319 227 405 7,3 13,9 Discouraged work-seekers 167 271 448 177 281 65,3 168,3 Other 2 747 2 821 2 871 50 124 1,8 4,5 Rates (%) Unemployment rate 22,2 22,6 19,3 -3,3 -2,9 Employed / population ratio (Absorption) 41,7 39,7 38,6 -1,1 -3,1 Labour force participation rate 53,5 51,2 47,8 -3,4 -5,7 North West Population 15-64 yrs 2 167 2 179 2 183 4 16 0,2 0,7 Labour Force 1 168 1 211 1 174 -37 6 -3,1 0,5 Employed 900 885 849 -36 -51 -4,1 -5,7 Unemployed 268 326 325 -1 57 -0,3 21,3 Not economically active 999 969 1 009 40 10 4,1 1,0 Discouraged work-seekers 128 107 117 10 -11 9,3 -8,6 Other 871 862 892 30 21 3,5 2,4 Rates (%) Unemployment rate 22,9 26,9 27,7 0,8 4,8 Employed / population ratio (Absorption) 41,5 40,6 38,9 -1,7 -2,6 Labour force participation rate 53,9 55,6 53,8 -1,8 -0,1 Gauteng Population 15-64 yrs 7 076 7 131 7 149 18 73 0,3 1,0 Labour Force 5 195 5 149 5 141 -8 -54 -0,2 -1,0 Employed 4 061 4 030 3 953 -77 -108 -1,9 -2,7 Unemployed 1 134 1 119 1 188 69 54 6,2 4,8 Not economically active 1 881 1 982 2 008 26 127 1,3 6,8 Discouraged work-seekers 169 135 160 25 -9 18,5 -5,3 Other 1 712 1 846 1 848 2 136 0,1 7,9 Rates (%) Unemployment rate 21,8 21,7 23,1 1,4 1,3 Employed / population ratio (Absorption) 57,4 56,5 55,3 -1,2 -2,1 Labour force participation rate 73,4 72,2 71,9 -0,3 -1,5 Mpumalanga Population 15-64 yrs 2 180 2 203 2 210 7 30 0,3 1,4 Labour Force 1 197 1 244 1 221 -23 24 -1,8 2,0 Employed 900 936 897 -39 -3 -4,2 -0,3 Unemployed 297 307 324 17 27 5,5 9,1 Not economically active 983 959 989 30 6 3,1 0,6 Discouraged work-seekers 94 108 110 2 16 1,9 17,0 Other 890 852 879 27 -11 3,2 -1,2 Rates (%) Unemployment rate 24,8 24,7 26,5 1,8 1,7 Employed / population ratio (Absorption) 41,3 42,5 40,6 -1,9 -0,7 Labour force participation rate 54,9 56,4 55,2 -1,2 0,3 Limpopo Population 15-64 yrs 3 053 3 097 3 111 14 58 0,5 1,9 Labour Force 1 259 1 259 1 206 -53 -53 -4,2 -4,2 Employed 874 905 906 1 32 0,1 3,7 Unemployed 385 354 300 -54 -85 -15,3 -22,1 Not economically active 1 794 1 838 1 905 67 111 3,6 6,2 Discouraged work-seekers 160 211 219 8 59 3,8 36,9 Other 1 634 1 627 1 685 58 51 3,6 3,1 Rates (%) Unemployment rate 30,6 28,1 24,9 -3,2 -5,7 Employed / population ratio (Absorption) 28,6 29,2 29,1 -0,1 0,5 Labour force participation rate 41,2 40,7 38,8 -1,9 -2,4 Due to rounding, numbers do not necessarily add up to totals. Note: Employment refers to market production activities.
Statistics South Africa P0211
Quarterly Labour Force Survey, Quarter 2, 2009
6
Table 3.1: Employed by industry and sex - South Africa
Apr–Jun 2008
Jan–Mar 2009
Apr–Jun 2009
Qrt to Qrt change
Year-on-year change
Qrt to Qrt change
Year-on-year
change
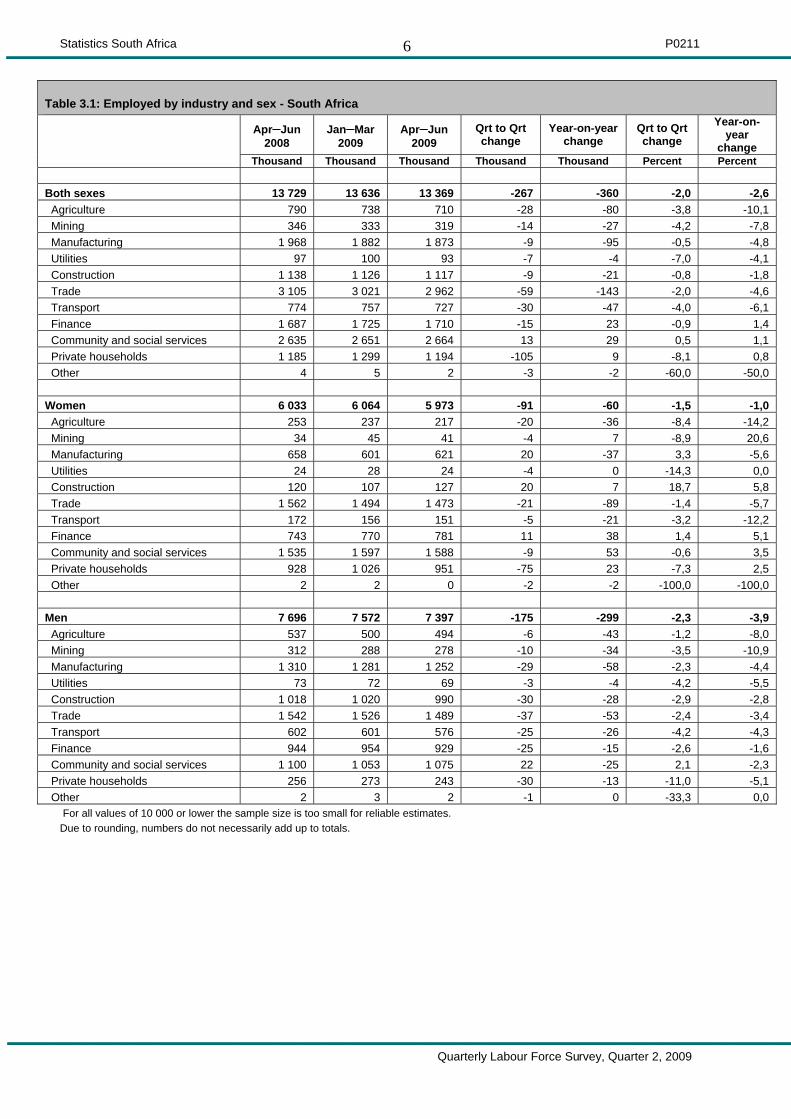
Thousand Thousand Thousand Thousand Thousand Percent Percent Both sexes 13 729 13 636 13 369 -267 -360 -2,0 -2,6 Agriculture 790 738 710 -28 -80 -3,8 -10,1 Mining 346 333 319 -14 -27 -4,2 -7,8 Manufacturing 1 968 1 882 1 873 -9 -95 -0,5 -4,8 Utilities 97 100 93 -7 -4 -7,0 -4,1 Construction 1 138 1 126 1 117 -9 -21 -0,8 -1,8 Trade 3 105 3 021 2 962 -59 -143 -2,0 -4,6 Transport 774 757 727 -30 -47 -4,0 -6,1 Finance 1 687 1 725 1 710 -15 23 -0,9 1,4 Community and social services 2 635 2 651 2 664 13 29 0,5 1,1 Private households 1 185 1 299 1 194 -105 9 -8,1 0,8 Other 4 5 2 -3 -2 -60,0 -50,0 Women 6 033 6 064 5 973 -91 -60 -1,5 -1,0 Agriculture 253 237 217 -20 -36 -8,4 -14,2 Mining 34 45 41 -4 7 -8,9 20,6 Manufacturing 658 601 621 20 -37 3,3 -5,6 Utilities 24 28 24 -4 0 -14,3 0,0 Construction 120 107 127 20 7 18,7 5,8 Trade 1 562 1 494 1 473 -21 -89 -1,4 -5,7 Transport 172 156 151 -5 -21 -3,2 -12,2 Finance 743 770 781 11 38 1,4 5,1 Community and social services 1 535 1 597 1 588 -9 53 -0,6 3,5 Private households 928 1 026 951 -75 23 -7,3 2,5 Other 2 2 0 -2 -2 -100,0 -100,0 Men 7 696 7 572 7 397 -175 -299 -2,3 -3,9 Agriculture 537 500 494 -6 -43 -1,2 -8,0 Mining 312 288 278 -10 -34 -3,5 -10,9 Manufacturing 1 310 1 281 1 252 -29 -58 -2,3 -4,4 Utilities 73 72 69 -3 -4 -4,2 -5,5 Construction 1 018 1 020 990 -30 -28 -2,9 -2,8 Trade 1 542 1 526 1 489 -37 -53 -2,4 -3,4 Transport 602 601 576 -25 -26 -4,2 -4,3 Finance 944 954 929 -25 -15 -2,6 -1,6 Community and social services 1 100 1 053 1 075 22 -25 2,1 -2,3 Private households 256 273 243 -30 -13 -11,0 -5,1 Other 2 3 2 -1 0 -33,3 0,0
For all values of 10 000 or lower the sample size is too small for reliable estimates. Due to rounding, numbers do not necessarily add up to totals.
Statistics South Africa P0211
Quarterly Labour Force Survey, Quarter 2, 2009
7
Table 3.2: Employed by industry and province
Apr–Jun 2008
Jan–Mar 2009
Apr–Jun 2009
Qrt to Qrt change
Year-on-year change
Qrt to Qrt change
Year-on-year change
Thousand Thousand Thousand Thousand Thousand Percent Percent Agriculture 790 738 710 -28 -80 -3,8 -10,1 Western Cape 162 145 146 1 -16 0,7 -9,9 Eastern Cape 84 82 86 4 2 4,9 2,4 Northern Cape 48 41 57 16 9 39,0 18,8 Free State 80 89 87 -2 7 -2,2 8,8 KwaZulu Natal 165 134 103 -31 -62 -23,1 -37,6 North West 46 49 45 -4 -1 -8,2 -2,2 Gauteng 63 56 40 -16 -23 -28,6 -36,5 Mpumalanga 75 81 79 -2 4 -2,5 5,3 Limpopo 65 60 68 8 3 13,3 4,6 Mining 346 333 319 -14 -27 -4,2 -7,8 Western Cape 1 4 2 -2 1 -50,0 100,0 Eastern Cape 2 3 1 -2 -1 -66,7 -50,0 Northern Cape 14 11 11 0 -3 0,0 -21,4 Free State 27 33 33 0 6 0,0 22,2 KwaZulu Natal 8 8 11 3 3 37,5 37,5 North West 160 141 125 -16 -35 -11,3 -21,9 Gauteng 29 35 28 -7 -1 -20,0 -3,4 Mpumalanga 65 58 58 0 -7 0,0 -10,8 Limpopo 38 41 50 9 12 22,0 31,6 Manufacturing 1 968 1 882 1 873 -9 -95 -0,5 -4,8 Western Cape 330 315 304 -11 -26 -3,5 -7,9 Eastern Cape 174 195 200 5 26 2,6 14,9 Northern Cape 14 12 10 -2 -4 -16,7 -28,6 Free State 90 82 74 -8 -16 -9,8 -17,8 KwaZulu Natal 428 389 415 26 -13 6,7 -3,0 North West 82 80 94 14 12 17,5 14,6 Gauteng 698 660 633 -27 -65 -4,1 -9,3 Mpumalanga 84 82 77 -5 -7 -6,1 -8,3 Limpopo 70 67 65 -2 -5 -3,0 -7,1 Utilities 97 100 93 -7 -4 -7,0 -4,1 Western Cape 12 10 6 -4 -6 -40,0 -50,0 Eastern Cape 3 4 4 0 1 0,0 33,3 Northern Cape 1 3 3 0 2 0,0 200,0 Free State 2 5 3 -2 1 -40,0 50,0 KwaZulu Natal 16 13 8 -5 -8 -38,5 -50,0 North West 6 4 4 0 -2 0,0 -33,3 Gauteng 36 40 38 -2 2 -5,0 5,6 Mpumalanga 15 15 20 5 5 33,3 33,3 Limpopo 6 8 7 -1 1 -12,5 16,7 Construction 1 138 1 126 1 117 -9 -21 -0,8 -1,8 Western Cape 179 196 181 -15 2 -7,7 1,1 Eastern Cape 112 88 109 21 -3 23,9 -2,7 Northern Cape 15 20 22 2 7 10,0 46,7 Free State 53 65 55 -10 2 -15,4 3,8 KwaZulu Natal 219 218 233 15 14 6,9 6,4 North West 56 50 51 1 -5 2,0 -8,9 Gauteng 337 315 297 -18 -40 -5,7 -11,9 Mpumalanga 76 89 84 -5 8 -5,6 10,5 Limpopo 91 85 84 -1 -7 -1,2 -7,7 For all values of 10 000 or lower the sample size is too small for reliable estimates. Due to rounding, numbers do not necessarily add up to totals

Statistics South Africa P0211
Quarterly Labour Force Survey, Quarter 2, 2009
8
Table 3.2: Employed by industry and province (concluded)
Apr–Jun 2008
Jan–Mar 2009
Apr–Jun 2009
Qrt to Qrt change
Year-on-year change
Qrt to Qrt change
Year-on-year
change
Thousand Thousand Thousand Thousand Thousand Thousand Thousand Trade 3 105 3 021 2 962 -59 -143 -2 -4 Western Cape 391 444 416 -28 25 -6 6 Eastern Cape 318 315 320 5 2 1 0 Northern Cape 55 48 42 -6 -13 -12 -23 Free State 208 167 162 -5 -46 -3 -22 KwaZulu Natal 583 516 521 5 -62 1 -10 North West 189 206 194 -12 5 -5 2 Gauteng 921 873 860 -13 -61 -1 -6 Mpumalanga 232 226 210 -16 -22 -7 -9 Limpopo 207 226 236 10 29 4 14 Transport 774 757 727 -30 -47 -4 -6 Western Cape 95 91 79 -12 -16 -13 -16 Eastern Cape 84 67 77 10 -7 14 -8 Northern Cape 10 10 12 2 2 20 20 Free State 41 38 39 1 -2 2 -4 KwaZulu Natal 171 184 173 -11 2 -6 1 North West 35 25 21 -4 -14 -16 -40 Gauteng 254 251 249 -2 -5 -0 -2 Mpumalanga 39 45 40 -5 1 -11 2 Limpopo 46 46 37 -9 -9 -19 -19 Finance 1 687 1 725 1 710 -15 23 -0 1 Western Cape 259 285 259 -26 0 -9 0 Eastern Cape 139 107 128 21 -11 19 -7 Northern Cape 23 21 19 -2 -4 -9 -17 Free State 64 66 67 1 3 1 4 KwaZulu Natal 296 279 280 1 -16 0 -5 North West 72 72 74 2 2 2 2 Gauteng 695 745 743 -2 48 -0 6 Mpumalanga 84 92 88 -4 4 -4 4 Limpopo 55 58 51 -7 -4 -12 -7 Community and social services 2 635 2 651 2 664 13 29 0 1 Western Cape 341 352 372 20 31 5 9 Eastern Cape 341 304 307 3 -34 1 -10 Northern Cape 81 79 78 -1 -3 -1 -3 Free State 174 172 169 -3 -5 -1 -2 KwaZulu Natal 497 490 465 -25 -32 -5 -6 North West 160 166 164 -2 4 -1 2 Gauteng 679 712 729 17 50 2 7 Mpumalanga 144 154 154 0 10 0 6 Limpopo 219 222 226 4 7 1 3 Private households 1 185 1 299 1 194 -105 9 -8 0 Western Cape 119 125 132 7 13 5 10 Eastern Cape 106 147 122 -25 16 -17 15 Northern Cape 35 31 28 -3 -7 -9 -20 Free State 93 94 85 -9 -8 -9 -8 KwaZulu Natal 230 283 245 -38 15 -13 6 North West 93 93 79 -14 -14 -15 -15 Gauteng 346 339 334 -5 -12 -1 -3 Mpumalanga 85 95 88 -7 3 -7 3 Limpopo 78 93 81 -12 3 -12 3 Due to rounding, numbers do not necessarily add up to totals
Statistics South Africa P0211
Quarterly Labour Force Survey, Quarter 2, 2009
9
Table 3.3: Employed by sector and industry - South Africa
Apr–Jun 2008
Jan–Mar 2009
Apr–Jun 2009
Qrt to Qrt change
Year-on-year
change
Qrt to Qrt
change
Year-on-year change
Thousand Thousand Thousand Thousand Thousand Percent Percent Total employed 13 729 13 636 13 369 -267 -360 -2,0 -2,6 Formal and informal sector (Non-agricultural) 11 755 11 599 11 465 -134 -290 -1,2 -2,5 Mining 346 333 319 -14 -27 -4,2 -7,8 Manufacturing 1 968 1 882 1 873 -9 -95 -0,5 -4,8 Utilities 97 100 93 -7 -4 -7,0 -4,1 Construction 1 138 1 126 1 117 -9 -21 -0,8 -1,8 Trade 3 105 3 021 2 962 -59 -143 -2,0 -4,6 Transport 774 757 727 -30 -47 -4,0 -6,1 Finance 1 687 1 725 1 710 -15 23 -0,9 1,4 Community and social services 2 635 2 651 2 664 13 29 0,5 1,1 Other 4 5 2 -3 -2 -60,0 -50,0 Formal sector (Non-agricultural) 9 415 9 449 9 356 -93 -59 -1,0 -0,6 Mining 344 330 316 -14 -28 -4,2 -8,1 Manufacturing 1 731 1 667 1 666 -1 -65 -0,1 -3,8 Utilities 96 98 89 -9 -7 -9,2 -7,3 Construction 809 839 832 -7 23 -0,8 2,8 Trade 2 026 2 012 1 973 -39 -53 -1,9 -2,6 Transport 558 552 531 -21 -27 -3,8 -4,8 Finance 1 522 1 585 1 593 8 71 0,5 4,7 Community and social services 2 325 2 363 2 353 -10 28 -0,4 1,2 Other 3 5 2 -3 -1 -60,0 -33,3 Informal sector (Non-agricultural) 2 340 2 150 2 109 -41 -231 -1,9 -9,9 Mining 2 4 2 -2 0 -50,0 0,0 Manufacturing 237 216 207 -9 -30 -4,2 -12,7 Utilities 1 2 4 2 3 100,0 300,0 Construction 329 288 284 -4 -45 -1,4 -13,7 Trade 1 079 1 009 989 -20 -90 -2,0 -8,3 Transport 217 205 196 -9 -21 -4,4 -9,7 Finance 165 140 117 -23 -48 -16,4 -29,1 Community and social services 310 288 310 22 0 7,6 0,0 Other 1 . . Agriculture 790 738 710 -28 -80 -3,8 -10,1 Private households 1 185 1 299 1 194 -105 9 -8,1 0,8
For all values of 10 000 or lower the sample size is too small for reliable estimates. Due to rounding, numbers do not necessarily add up to totals.

Statistics South Africa P0211
Quarterly Labour Force Survey, Quarter 2, 2009
10
Table 3.4: Employed by province and sector
Apr–Jun 2008
Jan–Mar 2009
Apr–Jun 2009
Qrt to Qrt change
Year-on-year
change Qrt to Qrt change
Year-on-year
change
Thousand Thousand Thousand Thousand Thousand Percent Percent South Africa 13 729 13 636 13 369 -267 -360 -2,0 -2,6 Formal sector (Non-agricultural) 9 415 9 449 9 356 -93 -59 -1,0 -0,6 Informal sector (Non-agricultural) 2 340 2 150 2 109 -41 -231 -1,9 -9,9 Agriculture 790 738 710 -28 -80 -3,8 -10,1 Private households 1 185 1 299 1 194 -105 9 -8,1 0,8 Western Cape 1 891 1 965 1 898 -67 7 -3,4 0,4 Formal sector (Non-agricultural) 1 434 1 496 1 423 -73 -11 -4,9 -0,8 Informal sector (Non-agricultural) 175 199 198 -1 23 -0,5 13,1 Agriculture 162 145 146 1 -16 0,7 -9,9 Private households 119 125 132 7 13 5,6 10,9 Eastern Cape 1 363 1 311 1 353 42 -10 3,2 -0,7 Formal sector (Non-agricultural) 840 803 857 54 17 6,7 2,0 Informal sector (Non-agricultural) 333 280 287 7 -46 2,5 -13,8 Agriculture 84 82 86 4 2 4,9 2,4 Private households 106 147 122 -25 16 -17,0 15,1 Northern Cape 297 278 283 5 -14 1,8 -4,7 Formal sector (Non-agricultural) 179 181 172 -9 -7 -5,0 -3,9 Informal sector (Non-agricultural) 34 25 26 1 -8 4,0 -23,5 Agriculture 48 41 57 16 9 39,0 18,8 Private households 35 31 28 -3 -7 -9,7 -20,0 Free State 831 812 773 -39 -58 -4,8 -7,0 Formal sector (Non-agricultural) 506 501 470 -31 -36 -6,2 -7,1 Informal sector (Non-agricultural) 152 127 131 4 -21 3,1 -13,8 Agriculture 80 89 87 -2 7 -2,2 8,8 Private households 93 94 85 -9 -8 -9,6 -8,6 KwaZulu Natal 2 614 2 514 2 457 -57 -157 -2,3 -6,0 Formal sector (Non-agricultural) 1 688 1 627 1 662 35 -26 2,2 -1,5 Informal sector (Non-agricultural) 531 471 447 -24 -84 -5,1 -15,8 Agriculture 165 134 103 -31 -62 -23,1 -37,6 Private households 230 283 245 -38 15 -13,4 6,5 North West 900 885 849 -36 -51 -4,1 -5,7 Formal sector (Non-agricultural) 633 624 617 -7 -16 -1,1 -2,5 Informal sector (Non-agricultural) 128 119 108 -11 -20 -9,2 -15,6 Agriculture 46 49 45 -4 -1 -8,2 -2,2 Private households 93 93 79 -14 -14 -15,1 -15,1 Gauteng 4 061 4 030 3 953 -77 -108 -1,9 -2,7 Formal sector (Non-agricultural) 3 111 3 159 3 110 -49 -1 -1,6 0,0 Informal sector (Non-agricultural) 541 477 468 -9 -73 -1,9 -13,5 Agriculture 63 56 40 -16 -23 -28,6 -36,5 Private households 346 339 334 -5 -12 -1,5 -3,5 Mpumalanga 900 936 897 -39 -3 -4,2 -0,3 Formal sector (Non-agricultural) 533 561 533 -28 0 -5,0 0,0 Informal sector (Non-agricultural) 207 200 198 -2 -9 -1,0 -4,3 Agriculture 75 81 79 -2 4 -2,5 5,3 Private households 85 95 88 -7 3 -7,4 3,5 Limpopo 874 905 906 1 32 0,1 3,7 Formal sector (Non-agricultural) 492 498 511 13 19 2,6 3,9 Informal sector (Non agricultural) 240 253 246 -7 6 -2,8 2,5 Agriculture 65 60 68 8 3 13,3 4,6 Private households 78 93 81 -12 3 -12,9 3,8 Due to rounding, numbers do not necessarily add up to totals.

Statistics South Africa P0211
Quarterly Labour Force Survey, Quarter 2, 2009
11
Table 3.5: Employed by sex and occupation - South Africa
Apr–Jun 2008
Jan–Mar 2009
Apr–Jun 2009
Qrt to Qrt change
Year-on-year change
Qrt to Qrt change
Year-on-year
change
Thousand Thousand Thousand Thousand Thousand Percent Percent Both sexes 13 729 13 636 13 369 -267 -360 -2,0 -2,6 Manager 993 1 053 1 022 -31 29 -2,9 2,9 Professional 789 795 654 -141 -135 -17,7 -17,1 Technician 1 454 1 496 1 550 54 96 3,6 6,6 Clerk 1 450 1 403 1 440 37 -10 2,6 -0,7 Sales and services 1 749 1 780 1 804 24 55 1,3 3,1 Skilled agriculture 95 118 83 -35 -12 -29,7 -12,6 Craft and related trade 1 946 1 809 1 779 -30 -167 -1,7 -8,6 Plant and machine operator 1 161 1 217 1 186 -31 25 -2,5 2,2 Elementary 3 137 2 934 2 889 -45 -248 -1,5 -7,9 Domestic worker 953 1 031 963 -68 10 -6,6 1,0 Other 2 . . Women 6 033 6 064 5 973 -91 -60 -1,5 -1,0 Manager 308 315 325 10 17 3,2 5,5 Professional 352 386 296 -90 -56 -23,3 -15,9 Technician 806 827 824 -3 18 -0,4 2,2 Clerk 984 983 1 019 36 35 3,7 3,6 Sales and services 849 889 895 6 46 0,7 5,4 Skilled agriculture 20 26 17 -9 -3 -34,6 -15,0 Craft and related trade 315 246 239 -7 -76 -2,8 -24,1 Plant and machine operator 174 159 180 21 6 13,2 3,4 Elementary 1 308 1 235 1 247 12 -61 1,0 -4,7 Domestic worker 917 999 931 -68 14 -6,8 1,5 Men 7 696 7 572 7 397 -175 -299 -2,3 -3,9 Manager 685 738 697 -41 12 -5,6 1,8 Professional 437 409 358 -51 -79 -12,5 -18,1 Technician 648 669 727 58 79 8,7 12,2 Clerk 465 420 421 1 -44 0,2 -9,5 Sales and services 900 891 909 18 9 2,0 1,0 Skilled agriculture 75 92 67 -25 -8 -27,2 -10,7 Craft and related trade 1 631 1 564 1 540 -24 -91 -1,5 -5,6 Plant and machine operator 987 1 058 1 006 -52 19 -4,9 1,9 Elementary 1 829 1 699 1 642 -57 -187 -3,4 -10,2 Domestic worker 36 31 32 1 -4 3,2 -11,1 Other 2 . . For all values of 10 000 or lower the sample size is too small for reliable estimates. Due to rounding, numbers do not necessarily add up to totals.

Statistics South Africa P0211
Quarterly Labour Force Survey, Quarter 2, 2009
12
Table 3.6: Formal and informal employment
Apr–Jun 2008
Jan–Mar 2009
Apr–Jun 2009
Qrt to Qrt change
Year-on-year change
Qrt to Qrt change
Year-on-year
change
Thousand Thousand Thousand Thousand Thousand Percent Percent Employed (Both sexes) 13 729 13 636 13 369 -267 -360 -2,0 -2,6 Formal employment 8 157 8 351 8 334 -17 177 -0,2 2,2 Informal employment 4 915 4 585 4 365 -220 -550 -4,8 -11,2 Other employment 657 700 671 -29 14 -4,1 2,1 Employed (Women) 6 033 6 064 5 973 -91 -60 -1,5 -1,0 Formal employment 3 352 3 510 3 538 28 186 0,8 5,5 Informal employment 2 484 2 370 2 258 -112 -226 -4,7 -9,1 Other employment 197 183 176 -7 -21 -3,8 -10,7 Employed (Men) 7 696 7 572 7 397 -175 -299 -2,3 -3,9 Formal employment 4 805 4 841 4 795 -46 -10 -1,0 -0,2 Informal employment 2 432 2 215 2 107 -108 -325 -4,9 -13,4 Other employment 459 517 495 -22 36 -4,3 7,8 Formal employment 8 157 8 351 8 334 -17 177 -0,2 2,2 15-24 yrs 967 904 905 1 -62 0,1 -6,4 25-34 yrs 2 894 2 962 2 916 -46 22 -1,6 0,8 35-44 yrs 2 207 2 266 2 293 27 86 1,2 3,9 45-54 yrs 1 487 1 585 1 580 -5 93 -0,3 6,3 55-64 yrs 602 634 640 6 38 0,9 6,3 Informal employment 4 915 4 585 4 365 -220 -550 -4,8 -11,2 15-24 yrs 712 630 569 -61 -143 -9,7 -20,1 25-34 yrs 1 643 1 461 1 433 -28 -210 -1,9 -12,8 35-44 yrs 1 212 1 243 1 183 -60 -29 -4,8 -2,4 45-54 yrs 919 857 813 -44 -106 -5,1 -11,5 55-64 yrs 429 395 367 -28 -62 -7,1 -14,5 Formal employment 8 157 8 351 8 334 -17 177 -0,2 2,2 No schooling 163 155 160 5 -3 3,2 -1,8 Less than primary completed 498 508 473 -35 -25 -6,9 -5,0 Primary completed 297 314 300 -14 3 -4,5 1,0 Secondary not completed 2 309 2 387 2 398 11 89 0,5 3,9 Secondary completed 2 890 2 845 2 852 7 -38 0,2 -1,3 Tertiary 1 904 2 074 2 079 5 175 0,2 9,2 Other 97 68 71 3 -26 4,4 -26,8 Informal employment 4 915 4 585 4 365 -220 -550 -4,8 -11,2 No schooling 413 363 320 -43 -93 -11,8 -22,5 Less than primary completed 949 866 764 -102 -185 -11,8 -19,5 Primary completed 438 411 390 -21 -48 -5,1 -11,0 Secondary not completed 2 099 1 962 1 925 -37 -174 -1,9 -8,3 Secondary completed 803 800 795 -5 -8 -0,6 -1,0 Tertiary 143 127 126 -1 -17 -0,8 -11,9 Other 71 56 46 -10 -25 -17,9 -35,2 Due to rounding, numbers do not necessarily add up to totals.

Statistics South Africa P0211
Quarterly Labour Force Survey, Quarter 2, 2009
13
Table 3.6: Formal and informal employment (concluded)
Apr–Jun 2008
Jan–Mar 2009
Apr–Jun 2009
Qrt to Qrt change
Year-on-year change
Qrt to Qrt change
Year-on-year
change
Thousand Thousand Thousand Thousand Thousand Percent Percent Formal employment 8 157 8 351 8 334 -17 177 -0,2 2,2 Agriculture 346 365 362 -3 16 -0,8 4,6 Mining 335 319 310 -9 -25 -2,8 -7,5 Manufacturing 1 515 1 472 1 470 -2 -45 -0,1 -3,0 Utilities 93 94 85 -9 -8 -9,6 -8,6 Construction 446 529 527 -2 81 -0,4 18,2 Trade 1 552 1 583 1 566 -17 14 -1,1 0,9 Transport 433 430 425 -5 -8 -1,2 -1,8 Finance 1 284 1 373 1 375 2 91 0,1 7,1 Community and social services 2 148 2 181 2 211 30 63 1,4 2,9 Other 5 5 2 -3 -1 -60,0 -33,3 Informal employment 4 915 4 585 4 365 -220 -550 -4,8 -11,2 Agriculture 396 330 299 -31 -97 -9,4 -24,5 Mining 8 12 8 -4 0 -33,3 0,0 Manufacturing 386 347 344 -3 -42 -0,9 -10,9 Utilities 3 4 8 4 5 100,0 166,7 Construction 624 510 500 -10 -124 -2,0 -19,9 Trade 1 380 1 247 1 217 -30 -163 -2,4 -11,8 Transport 282 277 249 -28 -33 -10,1 -11,7 Finance 261 207 194 -13 -67 -6,3 -25,7 Community and social services 399 367 366 -1 -33 -0,3 -8,3 Private households 1 176 1 285 1 180 -105 4 -8,2 0,3 Other 1 . . Formal employment 8 157 8 351 8 334 -17 177 -0,2 2,2 Manager 588 620 568 -52 -20 -8,4 -3,4 Professional 638 660 547 -113 -91 -17,1 -14,3 Technician 1 205 1 283 1 344 61 139 4,8 11,5 Clerk 1 275 1 244 1 311 67 36 5,4 2,8 Sales and services 1 074 1 098 1 131 33 57 3,0 5,3 Skilled agriculture 32 45 22 -23 -10 -51,1 -31,3 Craft and related trade 1 083 1 033 1 030 -3 -53 -0,3 -4,9 Plant and machine operator 842 895 900 5 58 0,6 6,9 Elementary 1 419 1 472 1 479 7 60 0,5 4,2 Domestic worker 1 1 0 0,0 . Informal employment 4 915 4 585 4 365 -220 -550 -4,8 -11,2 Manager 100 96 90 -6 -10 -6,3 -10,0 Professional 55 55 47 -8 -8 -14,5 -14,5 Technician 183 135 137 2 -46 1,5 -25,1 Clerk 164 146 121 -25 -43 -17,1 -26,2 Sales and services 624 626 618 -8 -6 -1,3 -1,0 Skilled agriculture 33 43 30 -13 -3 -30,2 -9,1 Craft and related trade 811 719 700 -19 -111 -2,6 -13,7 Plant and machine operator 306 310 281 -29 -25 -9,4 -8,2 Elementary 1 686 1 428 1 381 -47 -305 -3,3 -18,1 Domestic worker 952 1 027 961 -66 9 -6,4 0,9 For all values of 10 000 or lower the sample size is too small for reliable estimates. Due to rounding, numbers do not necessarily add up to totals.
Statistics South Africa P0211
Quarterly Labour Force Survey, Quarter 2, 2009
14
Table 3.7: Employed by sex and status in employment - South Africa
Apr–Jun 2008
Jan–Mar 2009
Apr–Jun 2009
Qrt to Qrt change
Year-on-year change
Qrt to Qrt change
Year-on-year
change
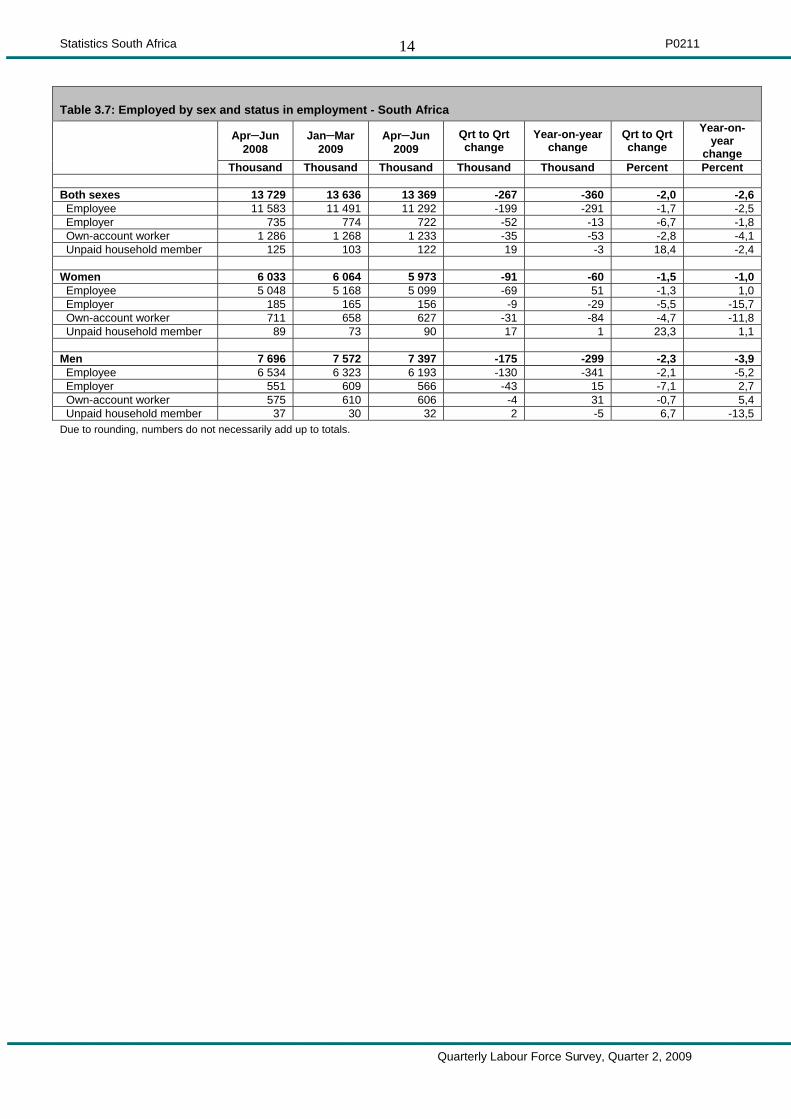
Thousand Thousand Thousand Thousand Thousand Percent Percent Both sexes 13 729 13 636 13 369 -267 -360 -2,0 -2,6 Employee 11 583 11 491 11 292 -199 -291 -1,7 -2,5 Employer 735 774 722 -52 -13 -6,7 -1,8 Own-account worker 1 286 1 268 1 233 -35 -53 -2,8 -4,1 Unpaid household member 125 103 122 19 -3 18,4 -2,4 Women 6 033 6 064 5 973 -91 -60 -1,5 -1,0 Employee 5 048 5 168 5 099 -69 51 -1,3 1,0 Employer 185 165 156 -9 -29 -5,5 -15,7 Own-account worker 711 658 627 -31 -84 -4,7 -11,8 Unpaid household member 89 73 90 17 1 23,3 1,1 Men 7 696 7 572 7 397 -175 -299 -2,3 -3,9 Employee 6 534 6 323 6 193 -130 -341 -2,1 -5,2 Employer 551 609 566 -43 15 -7,1 2,7 Own-account worker 575 610 606 -4 31 -0,7 5,4 Unpaid household member 37 30 32 2 -5 6,7 -13,5 Due to rounding, numbers do not necessarily add up to totals.

Statistics South Africa P0211
Quarterly Labour Force Survey, Quarter 2, 2009
15
Table 3.8: Employed by sex and usual hours of work - South Africa
Apr–Jun 2008
Jan–Mar 2009
Apr–Jun 2009
Qrt to Qrt change
Year-on-year
change
Qrt to Qrt
change
Year-on-year
change
Thousand Thousand Thousand Thousand Thousand Percent Percent Both sexes 13 729 13 636 13 369 -267 -360 -2,0 -2,6 Working less than 15 hours per week 314 273 284 11 -30 4,0 -9,6 Working 15-29 hours per week 820 809 843 34 23 4,2 2,8 Working 30-39 hours per week 1 024 1 038 972 -66 -52 -6,4 -5,1 Working 40-45 hours per week 6 880 7 235 7 187 -48 307 -0,7 4,5 Working more than 45 hours per week 4 691 4 281 4 083 -198 -608 -4,6 -13,0 Women 6 033 6 064 5 973 -91 -60 -1,5 -1,0 Working less than 15 hours per week 196 176 182 6 -14 3,4 -7,1 Working 15-29 hours per week 539 550 566 16 27 2,9 5,0 Working 30-39 hours per week 633 670 629 -41 -4 -6,1 -0,6 Working 40-45 hours per week 2 947 3 127 3 110 -17 163 -0,5 5,5 Working more than 45 hours per week 1 717 1 541 1 485 -56 -232 -3,6 -13,5 Men 7 696 7 572 7 397 -175 -299 -2,3 -3,9 Working less than 15 hours per week 118 97 102 5 -16 5,2 -13,6 Working 15-29 hours per week 280 260 277 17 -3 6,5 -1,1 Working 30-39 hours per week 391 368 343 -25 -48 -6,8 -12,3 Working 40-45 hours per week 3 933 4 107 4 077 -30 144 -0,7 3,7 Working more than 45 hours per week 2 974 2 740 2 598 -142 -376 -5,2 -12,6 Due to rounding, numbers do not necessarily add up to totals.

Statistics South Africa P0211
Quarterly Labour Force Survey, Quarter 2, 2009
16
Table 3.9: Time-related underemployment - South Africa
Apr–Jun 2008
Jan–Mar 2009
Apr–Jun 2009
Qrt to Qrt change
Year-on-year
change Qrt to Qrt change
Year-on-year
change
Thousand Thousand Thousand Thousand Thousand Percent Percent Both sexes 608 613 651 38 43 6,2 7,1 Women 360 390 420 30 60 7,7 16,7 Men 248 222 230 8 -18 3,6 -7,3 As percentage of the labour force (Both sexes) 3,4 3,4 3,7 0,3 0,3 Women 4,4 4,7 5,2 0,5 0,8 Men 2,6 2,3 2,4 0,1 -0,2 As percentage of total employment (Both sexes) 4,4 4,5 4,9 0,4 0,5 Women 6,0 6,4 7,0 0,6 1,0 Men 3,2 2,9 3,1 0,2 -0,1 Industry 608 613 651 38 43 6,2 7,1 Agriculture 24 14 16 2 -8 14,3 -33,3 Mining 0 Manufacturing 37 44 41 -3 4 -6,8 10,8 Utilities 1 Construction 56 52 56 4 0 7,7 0,0 Trade 132 105 131 26 -1 24,8 -0,8 Transport 22 21 20 -1 -2 -4,8 -9,1 Finance 36 29 34 5 -2 17,2 -5,6 Community and social services 92 88 98 10 6 11,4 6,5 Private households 210 260 253 -7 43 -2,7 20,5 Occupation 608 613 651 38 43 6,2 7,1 Manager 10 8 10 2 0 25,0 0,0 Professional 18 23 16 -7 -2 -30,4 -11,1 Technician 41 35 50 15 9 42,9 22,0 Clerk 19 14 28 14 9 100,0 47,4 Sales and services 62 56 59 3 -3 5,4 -4,8 Skilled agriculture 3 6 4 -2 1 -33,3 33,3 Craft and related trade 72 70 58 -12 -14 -17,1 -19,4 Plant and machine operator 22 19 15 -4 -7 -21,1 -31,8 Elementary 207 180 207 27 0 15,0 0,0 Domestic worker 153 201 203 2 50 1,0 32,7 For all values of 10 000 or lower the sample size is too small for reliable estimates. Due to rounding, numbers do not necessarily add up to totals.

Statistics South Africa P0211
Quarterly Labour Force Survey, Quarter 2, 2009
17
Table 4: Characteristics of the unemployed - South Africa
Apr–Jun 2008
Jan–Mar 2009
Apr–Jun 2009
Qrt to Qrt change
Year-on-year change
Qrt to Qrt change
Year-on-year change
Thousand Thousand Thousand Thousand Thousand Percent Percent
Unemployed 4 114 4 184 4 125 -59 11 -1,4 0,3 Job losers 1 172 1 360 1 427 67 255 4,9 21,8 Job leavers 402 357 345 -12 -57 -3,4 -14,2 New entrants 1 746 1 785 1 670 -115 -76 -6,4 -4,4 Re-entrants 253 188 173 -15 -80 -8,0 -31,6 Other 541 494 510 16 -31 3,2 -5,7 Unemployed 4 114 4 184 4 125 -59 11 -1,4 0,3 Long-term unemployment (1 year and more) 2 405 2 486 2 484 -2 79 -0,1 3,3 Short-term unemployment (less than 1 year) 1 710 1 698 1 641 -57 -69 -3,4 -4,0 Long-term unemployment (%) Proportion of the labour force 13,5 14,0 14,2 0,2 0,7 Proportion of the unemployed 58,5 59,4 60,2 0,8 1,7 Those who have worked in the past 5 years Previous occupation 1 827 1 905 1 946 41 119 2,2 6,5 Manager 28 33 30 -3 2 -9,1 7,1 Professional 27 28 25 -3 -2 -10,7 -7,4 Technician 89 87 81 -6 -8 -6,9 -9,0 Clerk 183 187 193 6 10 3,2 5,5 Sales and services 278 251 306 55 28 21,9 10,1 Skilled agriculture 5 7 7 0 2 0,0 40,0 Craft and related trade 297 372 356 -16 59 -4,3 19,9 Plant and machine operator 130 146 174 28 44 19,2 33,8 Elementary 593 633 595 -38 2 -6,0 0,3 Domestic worker 197 162 180 18 -17 11,1 -8,6 Other 0 . . Previous industry 1 827 1 905 1 946 41 119 2,2 6,5 Agriculture 117 121 124 3 7 2,5 6,0 Mining 27 32 27 -5 0 -15,6 0,0 Manufacturing 230 285 316 31 86 10,9 37,4 Utilities 9 9 12 3 3 33,3 33,3 Construction 289 344 329 -15 40 -4,4 13,8 Trade 448 446 459 13 11 2,9 2,5 Transport 86 82 95 13 9 15,9 10,5 Finance 203 208 207 -1 4 -0,5 2,0 Community and social services 171 145 146 1 -25 0,7 -14,6 Private households 247 231 230 -1 -17 -0,4 -6,9 Other 1 1 0 -1 -1 -100,0 -100,0 For all values of 10 000 or lower the sample size is too small for reliable estimates. Due to rounding, numbers do not necessarily add up to totals.

Statistics South Africa P0211
Quarterly Labour Force Survey, Quarter 2, 2009
18
Table 5: Characteristics of the not economically active - South Africa
Apr–Jun 2008
Jan–Mar 2009
Apr–Jun 2009
Qrt to Qrt change
Year-on-year change
Qrt to Qrt change
Year-on-year
change
Thousand Thousand Thousand Thousand Thousand Percent Percent Not economically active 12 861 13 166 13 585 419 724 3,2 5,6 Student 5 670 5 634 5 693 59 23 1,0 0,4 Home-maker 2 496 2 693 2 652 -41 156 -1,5 6,3 Illness/disability 1 794 1 767 1 799 32 5 1,8 0,3 Too old/young to work 978 1 042 1 062 20 84 1,9 8,6 Discouraged work seekers 1 079 1 215 1 517 302 438 24,9 40,6 Other 845 816 862 46 17 5,6 2,0 Inactivity rate by age (Both sexes) 41,9 42,5 43,7 1,2 1,8 15-24 yrs 69,2 70,3 71,4 1,1 2,2 25-54 yrs 24,6 24,9 26,1 1,2 1,5 55-64 yrs 56,0 56,5 58,1 1,6 2,1 Inactivity rate by age (Women) 48,8 49,3 50,5 1,2 1,7 15-24 yrs 72,0 73,5 74,1 0,6 2,1 25-54 yrs 33,8 33,8 35,4 1,6 1,6 55-64 yrs 66,4 67,6 68,5 0,9 2,1 Inactivity rate by age (Men) 34,3 35,0 36,2 1,2 1,9 15-24 yrs 66,3 67,2 68,8 1,6 2,5 25-54 yrs 14,2 14,8 15,6 0,8 1,4 55-64 yrs 43,0 42,6 45,0 2,4 2,0 Due to rounding, numbers do not necessarily add up to totals.

Statistics South Africa P0211
Quarterly Labour Force Survey, Quarter 2, 2009
19
Table 6: Socio-demographic characteristics - South Africa
Apr–Jun 2008
Jan–Mar 2009
Apr–Jun 2009
Qrt to Qrt change
Year-on-year
change
Qrt to Qrt
change
Year-on-year change
Thousand Thousand Thousand Thousand Thousand Percent Percent Age group of the employed 13 729 13 636 13 369 -267 -360 -2,0 -2,6 15-24 yrs 1 698 1 551 1 489 -62 -209 -4,0 -12,3 25-34 yrs 4 655 4 558 4 480 -78 -175 -1,7 -3,8 35-44 yrs 3 620 3 696 3 674 -22 54 -0,6 1,5 45-54 yrs 2 614 2 663 2 586 -77 -28 -2,9 -1,1 55-64 yrs 1 142 1 168 1 140 -28 -2 -2,4 -0,2 Age group of the unemployed 4 114 4 184 4 125 -59 11 -1,4 0,3 15-24 yrs 1 362 1 421 1 382 -39 20 -2,7 1,5 25-34 yrs 1 686 1 733 1 678 -55 -8 -3,2 -0,5 35-44 yrs 682 668 685 17 3 2,5 0,4 45-54 yrs 290 287 317 30 27 10,5 9,3 55-64 yrs 94 74 64 -10 -30 -13,5 -31,9 Age group of the not economically active 12 861 13 166 13 585 419 724 3,2 5,6 15-24 yrs 6 861 7 042 7 175 133 314 1,9 4,6 25-34 yrs 1 935 2 006 2 146 140 211 7,0 10,9 35-44 yrs 1 219 1 249 1 286 37 67 3,0 5,5 45-54 yrs 1 273 1 252 1 307 55 34 4,4 2,7 55-64 yrs 1 573 1 616 1 671 55 98 3,4 6,2 Highest level of education of the employed 13 729 13 636 13 369 -267 -360 -2,0 -2,6 No schooling 582 532 490 -42 -92 -7,9 -15,8 Less than primary completed 1 465 1 398 1 256 -142 -209 -10,2 -14,3 Primary completed 743 736 704 -32 -39 -4,3 -5,2 Secondary not completed 4 521 4 465 4 455 -10 -66 -0,2 -1,5 Secondary completed 3 928 3 880 3 871 -9 -57 -0,2 -1,5 Tertiary 2 313 2 490 2 466 -24 153 -1,0 6,6 Other 177 136 128 -8 -49 -5,9 -27,7 Highest level of education of the unemployed 4 114 4 184 4 125 -59 11 -1,4 0,3 No schooling 112 94 94 0 -18 0,0 -16,1 Less than primary completed 399 336 383 47 -16 14,0 -4,0 Primary completed 235 209 203 -6 -32 -2,9 -13,6 Secondary not completed 1 879 1 973 1 863 -110 -16 -5,6 -0,9 Secondary completed 1 261 1 327 1 342 15 81 1,1 6,4 Tertiary 192 218 213 -5 21 -2,3 10,9 Other 37 27 27 0 -10 0,0 -27,0 Highest level of education of the not economically active 12 861 13 166 13 585 419 724 3,2 5,6 No schooling 871 878 916 38 45 4,3 5,2 Less than primary completed 1 871 1 846 1 911 65 40 3,5 2,1 Primary completed 1 043 959 1 080 121 37 12,6 3,5 Secondary not completed 6 837 6 950 7 143 193 306 2,8 4,5 Secondary completed 1 866 2 138 2 104 -34 238 -1,6 12,8 Tertiary 273 309 334 25 61 8,1 22,3 Other 101 86 97 11 -4 12,8 -4,0 Current marital status of the employed 13 729 13 636 13 369 -267 -360 -2,0 -2,6 Married 5 566 5 614 5 464 -150 -102 -2,7 -1,8 Living together like husband and wife 1 588 1 583 1 562 -21 -26 -1,3 -1,6 Widow/widower 467 454 446 -8 -21 -1,8 -4,5 Divorced or separated 488 517 501 -16 13 -3,1 2,7 Never married 5 621 5 468 5 396 -72 -225 -1,3 -4,0 Current marital status of the unemployed 4 114 4 184 4 125 -59 11 -1,4 0,3 Married 669 608 662 54 -7 8,9 -1,0 Living together like husband and wife 443 456 458 2 15 0,4 3,4 Widow/widower 63 62 56 -6 -7 -9,7 -11,1 Divorced or separated 88 65 67 2 -21 3,1 -23,9 Never married 2 852 2 993 2 882 -111 30 -3,7 1,1 Current marital status of the not economically active 12 861 13 166 13 585 419 724 3,2 5,6 Married 2 656 2 689 2 766 77 110 2,9 4,1 Living together like husband and wife 706 681 671 -10 -35 -1,5 -5,0 Widow/widower 603 631 642 11 39 1,7 6,5 Divorced or separated 232 229 230 1 -2 0,4 -0,9 Never married 8 664 8 936 9 276 340 612 3,8 7,1 Due to rounding, numbers do not necessarily add up to totals.
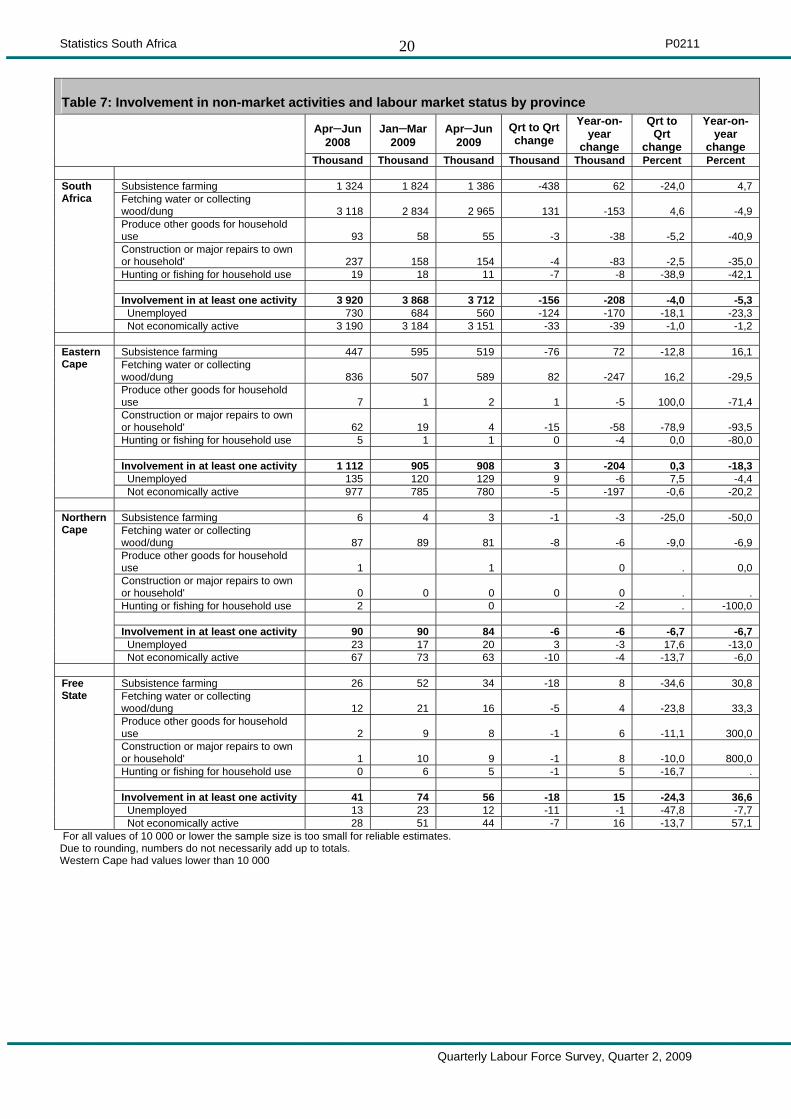
Statistics South Africa P0211
Quarterly Labour Force Survey, Quarter 2, 2009
20
Table 7: Involvement in non-market activities and labour market status by province
Apr–Jun 2008
Jan–Mar 2009
Apr–Jun 2009
Qrt to Qrt change
Year-on-year
change
Qrt to Qrt
change
Year-on-year
change
Thousand Thousand Thousand Thousand Thousand Percent Percent
Subsistence farming 1 324 1 824 1 386 -438 62 -24,0 4,7 Fetching water or collecting wood/dung 3 118 2 834 2 965 131 -153 4,6 -4,9 Produce other goods for household use 93 58 55 -3 -38 -5,2 -40,9 Construction or major repairs to own or household' 237 158 154 -4 -83 -2,5 -35,0 Hunting or fishing for household use 19 18 11 -7 -8 -38,9 -42,1 Involvement in at least one activity 3 920 3 868 3 712 -156 -208 -4,0 -5,3 Unemployed 730 684 560 -124 -170 -18,1 -23,3
South Africa
Not economically active 3 190 3 184 3 151 -33 -39 -1,0 -1,2
Subsistence farming 447 595 519 -76 72 -12,8 16,1 Fetching water or collecting wood/dung 836 507 589 82 -247 16,2 -29,5 Produce other goods for household use 7 1 2 1 -5 100,0 -71,4 Construction or major repairs to own or household' 62 19 4 -15 -58 -78,9 -93,5 Hunting or fishing for household use 5 1 1 0 -4 0,0 -80,0 Involvement in at least one activity 1 112 905 908 3 -204 0,3 -18,3 Unemployed 135 120 129 9 -6 7,5 -4,4
Eastern Cape
Not economically active 977 785 780 -5 -197 -0,6 -20,2
Subsistence farming 6 4 3 -1 -3 -25,0 -50,0 Fetching water or collecting wood/dung 87 89 81 -8 -6 -9,0 -6,9 Produce other goods for household use 1 1 0 . 0,0 Construction or major repairs to own or household' 0 0 0 0 0 . . Hunting or fishing for household use 2 0 -2 . -100,0 Involvement in at least one activity 90 90 84 -6 -6 -6,7 -6,7 Unemployed 23 17 20 3 -3 17,6 -13,0
Northern Cape
Not economically active 67 73 63 -10 -4 -13,7 -6,0
Subsistence farming 26 52 34 -18 8 -34,6 30,8 Fetching water or collecting wood/dung 12 21 16 -5 4 -23,8 33,3 Produce other goods for household use 2 9 8 -1 6 -11,1 300,0 Construction or major repairs to own or household' 1 10 9 -1 8 -10,0 800,0 Hunting or fishing for household use 0 6 5 -1 5 -16,7 . Involvement in at least one activity 41 74 56 -18 15 -24,3 36,6 Unemployed 13 23 12 -11 -1 -47,8 -7,7
Free State
Not economically active 28 51 44 -7 16 -13,7 57,1 For all values of 10 000 or lower the sample size is too small for reliable estimates. Due to rounding, numbers do not necessarily add up to totals. Western Cape had values lower than 10 000
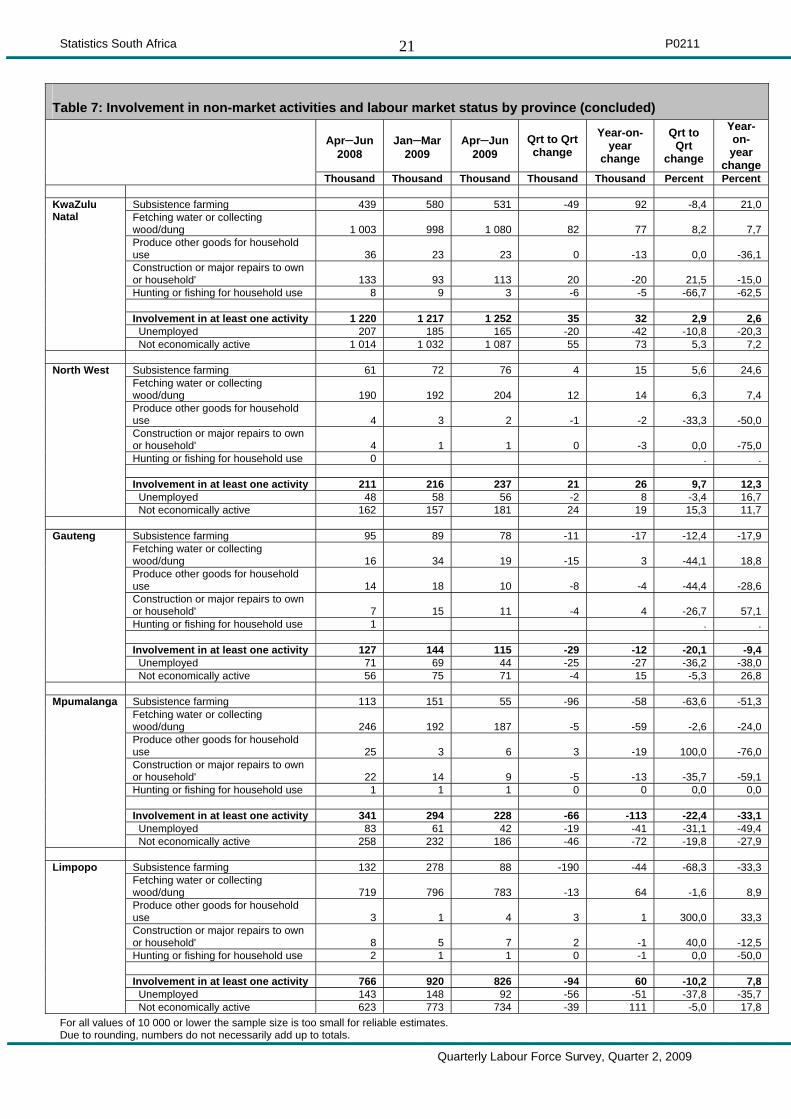
Statistics South Africa P0211
Quarterly Labour Force Survey, Quarter 2, 2009
21
Table 7: Involvement in non-market activities and labour market status by province (concluded)
Apr–Jun 2008
Jan–Mar 2009
Apr–Jun 2009
Qrt to Qrt change
Year-on-year
change
Qrt to Qrt
change
Year-on-year
change
Thousand Thousand Thousand Thousand Thousand Percent Percent
Subsistence farming 439 580 531 -49 92 -8,4 21,0 Fetching water or collecting wood/dung 1 003 998 1 080 82 77 8,2 7,7 Produce other goods for household use 36 23 23 0 -13 0,0 -36,1 Construction or major repairs to own or household' 133 93 113 20 -20 21,5 -15,0 Hunting or fishing for household use 8 9 3 -6 -5 -66,7 -62,5 Involvement in at least one activity 1 220 1 217 1 252 35 32 2,9 2,6 Unemployed 207 185 165 -20 -42 -10,8 -20,3
KwaZulu Natal
Not economically active 1 014 1 032 1 087 55 73 5,3 7,2
Subsistence farming 61 72 76 4 15 5,6 24,6 Fetching water or collecting wood/dung 190 192 204 12 14 6,3 7,4 Produce other goods for household use 4 3 2 -1 -2 -33,3 -50,0 Construction or major repairs to own or household' 4 1 1 0 -3 0,0 -75,0 Hunting or fishing for household use 0 . . Involvement in at least one activity 211 216 237 21 26 9,7 12,3 Unemployed 48 58 56 -2 8 -3,4 16,7
North West
Not economically active 162 157 181 24 19 15,3 11,7
Subsistence farming 95 89 78 -11 -17 -12,4 -17,9 Fetching water or collecting wood/dung 16 34 19 -15 3 -44,1 18,8 Produce other goods for household use 14 18 10 -8 -4 -44,4 -28,6 Construction or major repairs to own or household' 7 15 11 -4 4 -26,7 57,1 Hunting or fishing for household use 1 . . Involvement in at least one activity 127 144 115 -29 -12 -20,1 -9,4 Unemployed 71 69 44 -25 -27 -36,2 -38,0
Gauteng
Not economically active 56 75 71 -4 15 -5,3 26,8
Subsistence farming 113 151 55 -96 -58 -63,6 -51,3 Fetching water or collecting wood/dung 246 192 187 -5 -59 -2,6 -24,0 Produce other goods for household use 25 3 6 3 -19 100,0 -76,0 Construction or major repairs to own or household' 22 14 9 -5 -13 -35,7 -59,1 Hunting or fishing for household use 1 1 1 0 0 0,0 0,0 Involvement in at least one activity 341 294 228 -66 -113 -22,4 -33,1 Unemployed 83 61 42 -19 -41 -31,1 -49,4
Mpumalanga
Not economically active 258 232 186 -46 -72 -19,8 -27,9
Subsistence farming 132 278 88 -190 -44 -68,3 -33,3 Fetching water or collecting wood/dung 719 796 783 -13 64 -1,6 8,9 Produce other goods for household use 3 1 4 3 1 300,0 33,3 Construction or major repairs to own or household' 8 5 7 2 -1 40,0 -12,5 Hunting or fishing for household use 2 1 1 0 -1 0,0 -50,0 Involvement in at least one activity 766 920 826 -94 60 -10,2 7,8 Unemployed 143 148 92 -56 -51 -37,8 -35,7
Limpopo
Not economically active 623 773 734 -39 111 -5,0 17,8 For all values of 10 000 or lower the sample size is too small for reliable estimates. Due to rounding, numbers do not necessarily add up to totals.

Statistics South Africa P0211
Quarterly Labour Force Survey, Quarter 2, 2009
22
Appendix 2A: Sampling variability for labour force characteristics by sex Jan–Mar
2009 CV
Apr–Jun 2009 CV
Estimate Lower 95%
Upper 95% P-Value
Both sexes Population 15-64 yrs Labour Force 0,5 0,5 -326 -483 -168 0,00 Employed 0,6 0,6 -267 -400 -134 0,00 Formal sector (Non-agricultural) 0,8 0,8 -93 -221 35 0,16 Informal sector (Non-agricultural) 2,1 2,1 -41 -127 44 0,34 Agriculture 4,9 5,1 -27 -92 38 0,41 Private households 2,7 3,1 -105 -164 -47 0,00 Unemployed 1,8 2,0 -59 -211 93 0,45 Not economically active 0,7 0,7 419 262 575 0,00 Discouraged work-seekers 4,0 3,3 302 199 406 0,00 Other(not economically active) 0,7 0,7 116 -43 276 0,15 Rates (%) Unemployment rate 1,6 1,7 0,1 -0,7 0,9 0,79 Employed / population ratio (Absorption) 0,6 0,6 -1,0 -1,4 -0,6 0,00 Labour force participation rate 0,5 0,5 -1,2 -1,7 -0,7 0,00 Women Population 15-64 yrs Labour Force 0,7 0,8 -175 -284 -66 0,00 Employed 0,9 0,8 -92 -182 -1 0,05 Formal sector (Non-agricultural) 1,2 1,3 22 -61 106 0,60 Informal sector (Non-agricultural) 2,7 2,9 -18 -71 35 0,51 Agriculture 6,3 6,7 -21 -48 6 0,13 Private households 2,8 3,2 -75 -123 -28 0,00 Unemployed 2,3 2,7 -83 -187 21 0,12 Not economically active 0,8 0,7 216 108 325 0,00 Discouraged work-seekers 4,3 3,5 160 91 229 0,00 Other(not economically active) 0,8 0,8 57 -55 168 0,32 Rates (%) Unemployment rate 2,0 2,3 -0,5 -1,6 0,6 0,40 Employed / population ratio (Absorption) 0,9 0,8 -0,7 -1,2 -0,1 0,02 Labour force participation rate 0,7 0,7 -1,2 -1,9 -0,5 0,00 Men Population 15-64 yrs Labour Force 0,5 0,6 -151 -252 -51 0,00 Employed 0,6 0,7 -175 -271 -80 0,00 Formal sector (Non-agricultural) 1,0 1,0 -115 -209 -22 0,02 Informal sector (Non-agricultural) 2,9 2,7 -24 -87 39 0,46 Agriculture 5,4 5,5 -7 -56 43 0,80 Private households 6,0 6,1 -30 -63 3 0,08 Unemployed 2,1 2,2 24 -70 119 0,61 Not economically active 0,9 1,0 202 106 299 0,00 Discouraged work-seekers 5,3 4,4 143 84 201 0,00 Other(not economically active) 1,0 1,0 60 -33 153 0,21 Rates (%) Unemployment rate 1,9 2,0 0,6 -0,3 1,5 0,19 Employed / population ratio (Absorption) 0,6 0,7 -1,4 -2,0 -0,7 0,00 Labour force participation rate 0,5 0,5 -1,2 -1,9 -0,6 0,00

Statistics South Africa P0211
Quarterly Labour Force Survey, Quarter 2, 2009
23
Appendix 2.1A: Sampling variability for labour force characteristics by population group Jan–Mar
2009 CV
Apr–Jun 2009 CV
Estimate Lower 95%
Upper 95% P-Value
South Africa Population 15-64 yrs Labour Force 0,5 0,5 -326 -483 -168 0,00 Employed 0,6 0,6 -267 -400 -134 0,00 Unemployed 1,8 2,0 -59 -211 93 0,45 Not economically active 0,7 0,7 419 262 575 0,00 Rates (%) Unemployment rate 1,6 1,7 0,1 -0,7 0,9 0,79 Employed / population ratio (Absorption) 0,6 0,6 -1,0 -1,4 -0,6 0,00 Labour force participation rate 0,5 0,5 -1,2 -1,7 -0,7 0,00 Black/African Population 15-64 yrs Labour Force 0,6 0,7 -258 -407 -109 0,00 Employed 0,8 0,8 -213 -332 -95 0,00 Unemployed 2,1 2,2 -45 -191 102 0,55 Not economically active 0,8 0,8 343 194 493 0,00 Rates (%) Unemployment rate 1,8 1,8 0,2 -0,7 1,2 0,67 Employed / population ratio (Absorption) 0,8 0,8 -1,0 -1,5 -0,5 0,00 Labour force participation rate 0,6 0,7 -1,3 -1,9 -0,7 0,00 Coloured Population 15-64 yrs Labour Force 1,0 1,2 -30 -74 13 0,17 Employed 1,5 1,7 -25 -71 21 0,28 Unemployed 4,9 4,6 -5 -35 24 0,72 Not economically active 2,1 2,0 41 2 80 0,04 Rates (%) Unemployment rate 4,8 4,6 0,0 -1,4 1,5 0,97 Employed / population ratio (Absorption) 1,5 1,6 -1,0 -2,5 0,4 0,15 Labour force participation rate 1,0 1,0 -1,3 -2,5 0,0 0,05 Indian/Asian Population 15-64 yrs Labour Force 2,2 2,7 -16 -46 14 0,30 Employed 2,6 2,9 -7 -34 20 0,62 Unemployed 8,2 9,6 -9 -21 3 0,15 Not economically active 3,3 3,4 20 -8 48 0,16 Rates (%) Unemployment rate 8,1 9,1 -1,3 -3,4 0,8 0,22 Employed / population ratio (Absorption) 2,6 2,4 -1,0 -3,7 1,6 0,44 Labour force participation rate 2,2 2,2 -2,1 -5,0 0,9 0,17 White Population 15-64 yrs Labour Force 0,9 1,1 -22 -64 21 0,32 Employed 1,0 1,1 -22 -65 22 0,33 Unemployed 10,3 9,8 0 -26 26 0,99 Not economically active 2,2 2,3 14 -24 52 0,47 Rates (%) Unemployment rate 10,1 9,7 0,0 -1,1 1,2 0,95 Employed / population ratio (Absorption) 1,0 1,0 -0,5 -1,8 0,7 0,39 Labour force participation rate 0,9 0,9 -0,5 -1,7 0,7 0,38

Statistics South Africa P0211
Quarterly Labour Force Survey, Quarter 2, 2009
24
Appendix 2.2A: Sampling variability for labour force characteristics by province Jan–Mar
2009 CV
Apr–Jun 2009 CV
Estimate Lower 95%
Upper 95% P-Value
South Africa Population 15-64 yrs Labour Force 0,5 0,5 -326 -483 -168 0,00 Employed 0,6 0,6 -267 -400 -134 0,00 Unemployed 1,8 2,0 -59 -211 93 0,45 Not economically active 0,7 0,7 419 262 575 0,00 Discouraged work-seekers 4,0 3,3 302 199 406 0,00 Other(not economically active) 0,7 0,7 116 -43 276 0,15 Rates (%) Unemployment rate 1,6 1,7 0,1 -0,7 0,9 0,79 Employed / population ratio (Absorption) 0,6 0,6 -1,0 -1,4 -0,6 0,00 Labour force participation rate 0,5 0,5 -1,2 -1,7 -0,7 0,00 Western Cape Population 15-64 yrs Labour Force 1,0 1,1 -19 -63 25 0,40 Employed 1,7 1,4 -67 -127 -7 0,03 Unemployed 5,7 3,9 49 -6 103 0,08 Not economically active 2,2 2,4 30 -14 74 0,19 Discouraged work-seekers 27,5 29,0 11 -2 24 0,10 Other(not economically active) 2,1 2,3 19 -23 61 0,38 Rates (%) Unemployment rate 5,7 3,7 2,2 0,0 4,4 0,05 Employed / population ratio (Absorption) 1,7 1,4 -2,1 -3,8 -0,4 0,02 Labour force participation rate 1,0 1,1 -0,8 -2,0 0,5 0,24 Eastern Cape Population 15-64 yrs Labour Force 3,0 3,4 45 -21 111 0,18 Employed 2,1 2,7 42 -15 98 0,15 Unemployed 9,0 8,9 3 -42 48 0,89 Not economically active 2,5 2,9 -33 -101 36 0,35 Discouraged work-seekers 7,5 8,7 47 -1 95 0,06 Other(not economically active) 2,5 2,9 -79 -149 -9 0,03 Rates (%) Unemployment rate 6,6 6,3 -0,5 -2,6 1,6 0,63 Employed / population ratio (Absorption) 2,1 2,6 0,9 -0,4 2,3 0,18 Labour force participation rate 3,0 3,3 1,0 -0,6 2,6 0,23 Northern Cape Population 15-64 yrs Labour Force 2,0 4,5 2 -26 30 0,89 Employed 3,2 5,5 5 -22 33 0,71 Unemployed 7,1 10,3 -3 -19 13 0,69 Not economically active 2,4 5,3 -1 -28 26 0,95 Discouraged work-seekers 18,3 26,4 11 -1 22 0,08 Other(not economically active) 2,2 4,5 -12 -34 11 0,32 Rates (%) Unemployment rate 6,7 9,2 -1,0 -4,9 3,0 0,63 Employed / population ratio (Absorption) 3,2 5,5 0,7 -3,2 4,5 0,73 Labour force participation rate 2,0 4,5 0,2 -3,7 4,1 0,92 Free State Population 15-64 yrs Labour Force 1,8 1,9 -30 -58 -2 0,04 Employed 2,4 2,3 -38 -70 -7 0,02 Unemployed 5,2 4,4 9 -26 43 0,62 Not economically active 2,6 2,5 32 5 60 0,02 Discouraged work-seekers 13,8 11,2 12 -9 33 0,27 Other(not economically active) 2,5 2,2 21 -8 50 0,16 Rates (%) Unemployment rate 4,8 3,9 1,5 -1,4 4,4 0,30 Employed / population ratio (Absorption) 2,4 2,3 -2,1 -3,8 -0,5 0,01 Labour force participation rate 1,8 1,8 -1,7 -3,1 -0,3 0,02
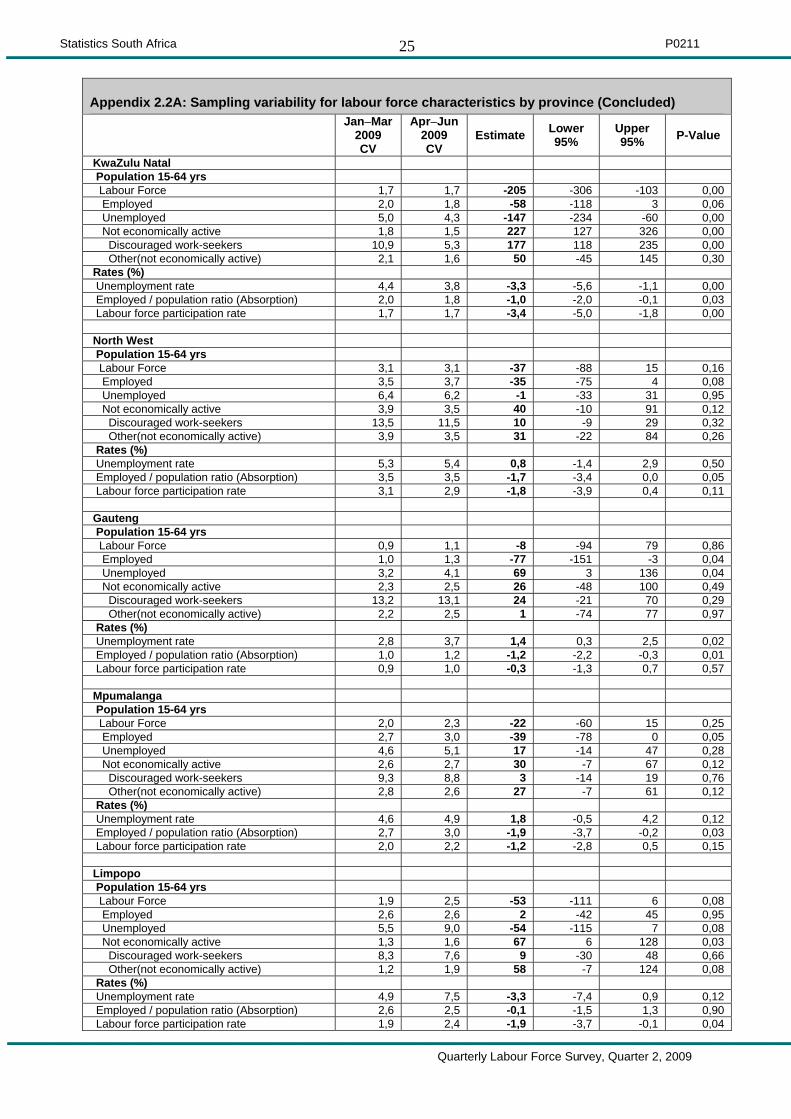
Statistics South Africa P0211
Quarterly Labour Force Survey, Quarter 2, 2009
25
Appendix 2.2A: Sampling variability for labour force characteristics by province (Concluded) Jan–Mar
2009 CV
Apr–Jun 2009 CV
Estimate Lower 95%
Upper 95% P-Value
KwaZulu Natal Population 15-64 yrs Labour Force 1,7 1,7 -205 -306 -103 0,00 Employed 2,0 1,8 -58 -118 3 0,06 Unemployed 5,0 4,3 -147 -234 -60 0,00 Not economically active 1,8 1,5 227 127 326 0,00 Discouraged work-seekers 10,9 5,3 177 118 235 0,00 Other(not economically active) 2,1 1,6 50 -45 145 0,30 Rates (%) Unemployment rate 4,4 3,8 -3,3 -5,6 -1,1 0,00 Employed / population ratio (Absorption) 2,0 1,8 -1,0 -2,0 -0,1 0,03 Labour force participation rate 1,7 1,7 -3,4 -5,0 -1,8 0,00 North West Population 15-64 yrs Labour Force 3,1 3,1 -37 -88 15 0,16 Employed 3,5 3,7 -35 -75 4 0,08 Unemployed 6,4 6,2 -1 -33 31 0,95 Not economically active 3,9 3,5 40 -10 91 0,12 Discouraged work-seekers 13,5 11,5 10 -9 29 0,32 Other(not economically active) 3,9 3,5 31 -22 84 0,26 Rates (%) Unemployment rate 5,3 5,4 0,8 -1,4 2,9 0,50 Employed / population ratio (Absorption) 3,5 3,5 -1,7 -3,4 0,0 0,05 Labour force participation rate 3,1 2,9 -1,8 -3,9 0,4 0,11 Gauteng Population 15-64 yrs Labour Force 0,9 1,1 -8 -94 79 0,86 Employed 1,0 1,3 -77 -151 -3 0,04 Unemployed 3,2 4,1 69 3 136 0,04 Not economically active 2,3 2,5 26 -48 100 0,49 Discouraged work-seekers 13,2 13,1 24 -21 70 0,29 Other(not economically active) 2,2 2,5 1 -74 77 0,97 Rates (%) Unemployment rate 2,8 3,7 1,4 0,3 2,5 0,02 Employed / population ratio (Absorption) 1,0 1,2 -1,2 -2,2 -0,3 0,01 Labour force participation rate 0,9 1,0 -0,3 -1,3 0,7 0,57 Mpumalanga Population 15-64 yrs Labour Force 2,0 2,3 -22 -60 15 0,25 Employed 2,7 3,0 -39 -78 0 0,05 Unemployed 4,6 5,1 17 -14 47 0,28 Not economically active 2,6 2,7 30 -7 67 0,12 Discouraged work-seekers 9,3 8,8 3 -14 19 0,76 Other(not economically active) 2,8 2,6 27 -7 61 0,12 Rates (%) Unemployment rate 4,6 4,9 1,8 -0,5 4,2 0,12 Employed / population ratio (Absorption) 2,7 3,0 -1,9 -3,7 -0,2 0,03 Labour force participation rate 2,0 2,2 -1,2 -2,8 0,5 0,15 Limpopo Population 15-64 yrs Labour Force 1,9 2,5 -53 -111 6 0,08 Employed 2,6 2,6 2 -42 45 0,95 Unemployed 5,5 9,0 -54 -115 7 0,08 Not economically active 1,3 1,6 67 6 128 0,03 Discouraged work-seekers 8,3 7,6 9 -30 48 0,66 Other(not economically active) 1,2 1,9 58 -7 124 0,08 Rates (%) Unemployment rate 4,9 7,5 -3,3 -7,4 0,9 0,12 Employed / population ratio (Absorption) 2,6 2,5 -0,1 -1,5 1,3 0,90 Labour force participation rate 1,9 2,4 -1,9 -3,7 -0,1 0,04

Statistics South Africa P0211
Quarterly Labour Force Survey, Quarter 2, 2009
26
Appendix 3.1A: Sampling variability for the employed by industry and sex Jan–Mar
2009 CV
Apr–Jun 2009 CV
Estimate Lower 95%
Upper 95% P-Value
Both sexes 0,6 0,6 -267 -400 -134 0,00 Agriculture 4,9 5,1 -27 -92 38 0,41 Mining 6,5 7,5 -14 -42 13 0,31 Manufacturing 2,6 2,7 -9 -82 64 0,81 Utilities 15,5 18,7 -7 -24 10 0,42 Construction 3,0 3,0 -10 -76 56 0,77 Trade 1,8 1,8 -59 -153 35 0,22 Transport 3,6 3,8 -30 -78 17 0,21 Finance 2,4 2,4 -15 -81 51 0,66 Community and social services 1,7 1,7 13 -72 97 0,77 Private households 2,7 3,1 -105 -164 -47 0,00 Other Women 0,9 0,8 -92 -182 -1 0,05 Agriculture 6,3 6,7 -21 -48 6 0,13 Mining 12,6 14,4 -5 -15 6 0,37 Manufacturing 3,5 4,1 21 -22 63 0,34 Utilities 18,3 21,4 -4 -13 5 0,34 Construction 8,1 7,6 20 -3 43 0,08 Trade 2,2 2,2 -22 -80 37 0,47 Transport 6,9 7,4 -5 -25 15 0,64 Finance 3,4 3,4 10 -31 52 0,63 Community and social services 2,1 2,1 -9 -70 52 0,77 Private households 2,8 3,2 -75 -123 -28 0,00 Other Men 0,6 0,7 -175 -271 -80 0,00 Agriculture 5,4 5,5 -7 -56 43 0,80 Mining 7,3 8,0 -10 -36 17 0,47 Manufacturing 3,1 3,2 -30 -85 26 0,30 Utilities 17,9 21,1 -3 -16 10 0,68 Construction 3,1 3,2 -30 -92 33 0,35 Trade 2,4 2,4 -38 -102 27 0,25 Transport 3,7 4,1 -25 -68 17 0,24 Finance 3,0 3,6 -25 -78 28 0,35 Community and social services 2,6 2,7 22 -27 71 0,38 Private households 6,0 6,1 -30 -63 3 0,08 Other
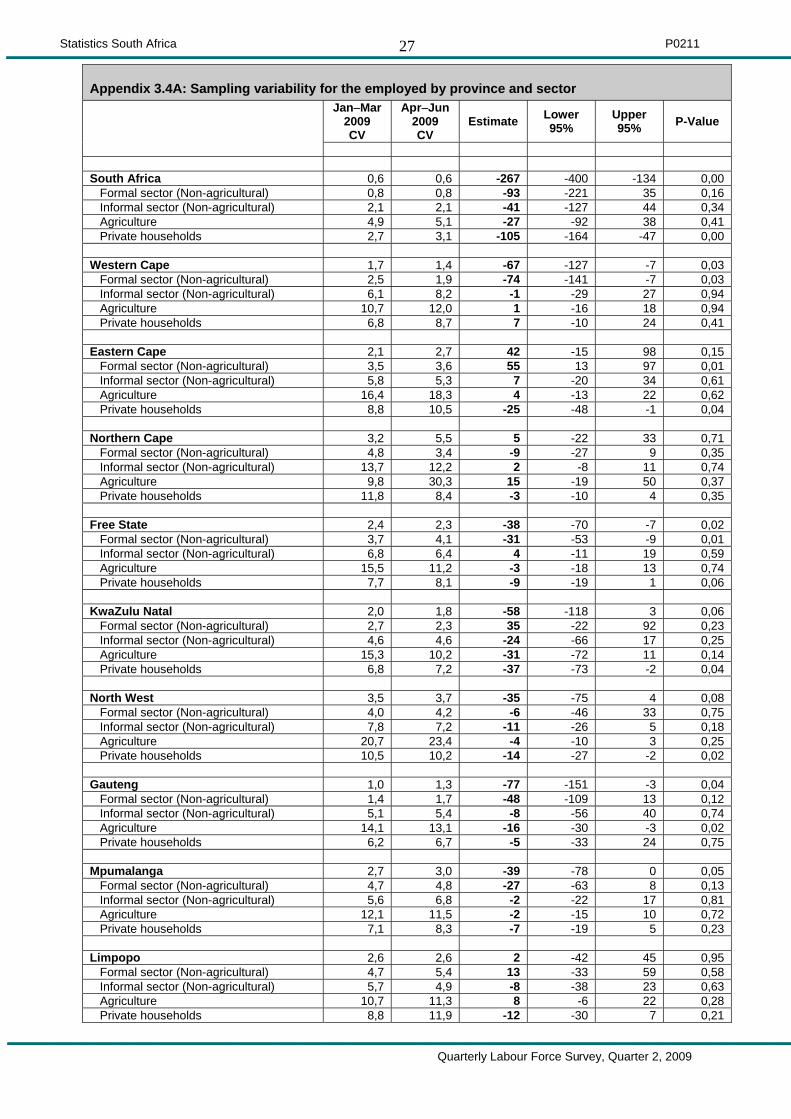
Statistics South Africa P0211
Quarterly Labour Force Survey, Quarter 2, 2009
27
Appendix 3.4A: Sampling variability for the employed by province and sector Jan–Mar
2009 CV
Apr–Jun 2009 CV
Estimate Lower 95%
Upper 95% P-Value
South Africa 0,6 0,6 -267 -400 -134 0,00 Formal sector (Non-agricultural) 0,8 0,8 -93 -221 35 0,16 Informal sector (Non-agricultural) 2,1 2,1 -41 -127 44 0,34 Agriculture 4,9 5,1 -27 -92 38 0,41 Private households 2,7 3,1 -105 -164 -47 0,00 Western Cape 1,7 1,4 -67 -127 -7 0,03 Formal sector (Non-agricultural) 2,5 1,9 -74 -141 -7 0,03 Informal sector (Non-agricultural) 6,1 8,2 -1 -29 27 0,94 Agriculture 10,7 12,0 1 -16 18 0,94 Private households 6,8 8,7 7 -10 24 0,41 Eastern Cape 2,1 2,7 42 -15 98 0,15 Formal sector (Non-agricultural) 3,5 3,6 55 13 97 0,01 Informal sector (Non-agricultural) 5,8 5,3 7 -20 34 0,61 Agriculture 16,4 18,3 4 -13 22 0,62 Private households 8,8 10,5 -25 -48 -1 0,04 Northern Cape 3,2 5,5 5 -22 33 0,71 Formal sector (Non-agricultural) 4,8 3,4 -9 -27 9 0,35 Informal sector (Non-agricultural) 13,7 12,2 2 -8 11 0,74 Agriculture 9,8 30,3 15 -19 50 0,37 Private households 11,8 8,4 -3 -10 4 0,35 Free State 2,4 2,3 -38 -70 -7 0,02 Formal sector (Non-agricultural) 3,7 4,1 -31 -53 -9 0,01 Informal sector (Non-agricultural) 6,8 6,4 4 -11 19 0,59 Agriculture 15,5 11,2 -3 -18 13 0,74 Private households 7,7 8,1 -9 -19 1 0,06 KwaZulu Natal 2,0 1,8 -58 -118 3 0,06 Formal sector (Non-agricultural) 2,7 2,3 35 -22 92 0,23 Informal sector (Non-agricultural) 4,6 4,6 -24 -66 17 0,25 Agriculture 15,3 10,2 -31 -72 11 0,14 Private households 6,8 7,2 -37 -73 -2 0,04 North West 3,5 3,7 -35 -75 4 0,08 Formal sector (Non-agricultural) 4,0 4,2 -6 -46 33 0,75 Informal sector (Non-agricultural) 7,8 7,2 -11 -26 5 0,18 Agriculture 20,7 23,4 -4 -10 3 0,25 Private households 10,5 10,2 -14 -27 -2 0,02 Gauteng 1,0 1,3 -77 -151 -3 0,04 Formal sector (Non-agricultural) 1,4 1,7 -48 -109 13 0,12 Informal sector (Non-agricultural) 5,1 5,4 -8 -56 40 0,74 Agriculture 14,1 13,1 -16 -30 -3 0,02 Private households 6,2 6,7 -5 -33 24 0,75 Mpumalanga 2,7 3,0 -39 -78 0 0,05 Formal sector (Non-agricultural) 4,7 4,8 -27 -63 8 0,13 Informal sector (Non-agricultural) 5,6 6,8 -2 -22 17 0,81 Agriculture 12,1 11,5 -2 -15 10 0,72 Private households 7,1 8,3 -7 -19 5 0,23 Limpopo 2,6 2,6 2 -42 45 0,95 Formal sector (Non-agricultural) 4,7 5,4 13 -33 59 0,58 Informal sector (Non-agricultural) 5,7 4,9 -8 -38 23 0,63 Agriculture 10,7 11,3 8 -6 22 0,28 Private households 8,8 11,9 -12 -30 7 0,21

Statistics South Africa P0211
Quarterly Labour Force Survey, Quarter 2, 2009
28
Appendix 3.5A: Sampling variability for the employed by sex and occupation Jan–Mar
2009 CV
Apr–Jun 2009 CV
Estimate Lower 95%
Upper 95% P-Value
Both sexes 0,6 0,6 -267 -400 -134 0,00 Manager 2,6 2,9 -31 -84 22 0,25 Professional 2,9 3,4 -140 -194 -87 0,00 Technician 2,3 2,6 54 -24 133 0,18 Clerk 2,5 2,6 36 -35 108 0,32 Sales and services 2,3 2,3 24 -51 98 0,53 Skilled agriculture 9,3 9,8 -35 -57 -13 0,00 Craft and related trade 2,2 2,3 -30 -112 51 0,47 Plant and machine operator 3,0 2,9 -31 -95 32 0,33 Elementary 1,8 1,9 -46 -140 49 0,34 Domestic worker 2,9 3,3 -67 -116 -19 0,01 Other Women 0,9 0,8 -92 -182 -1 0,05 Manager 5,6 5,1 10 -24 44 0,55 Professional 4,7 4,8 -90 -138 -43 0,00 Technician 2,7 2,7 -3 -50 44 0,90 Clerk 3,0 3,0 36 -24 97 0,24 Sales and services 3,0 2,9 6 -45 58 0,81 Skilled agriculture 16,5 19,8 -10 -20 0 0,06 Craft and related trade 4,8 5,7 -7 -38 24 0,67 Plant and machine operator 6,6 7,0 21 -5 47 0,12 Elementary 2,4 2,4 12 -46 70 0,68 Domestic worker 2,9 3,4 -68 -116 -20 0,01 Other Men 0,6 0,7 -175 -271 -80 0,00 Manager 2,7 3,4 -41 -79 -4 0,03 Professional 4,3 4,9 -50 -88 -12 0,01 Technician 3,7 3,9 57 0 114 0,05 Clerk 4,2 4,6 0 -40 40 0,99 Sales and services 3,1 3,1 17 -37 72 0,53 Skilled agriculture 10,4 10,8 -25 -43 -7 0,01 Craft and related trade 2,5 2,5 -24 -100 53 0,54 Plant and machine operator 3,2 3,2 -53 -111 6 0,08 Elementary 2,2 2,5 -58 -137 22 0,16 Domestic worker 15,1 14,8 1 -11 12 0,89 Other 0,6 0,6 -267 -400 -134 0,00
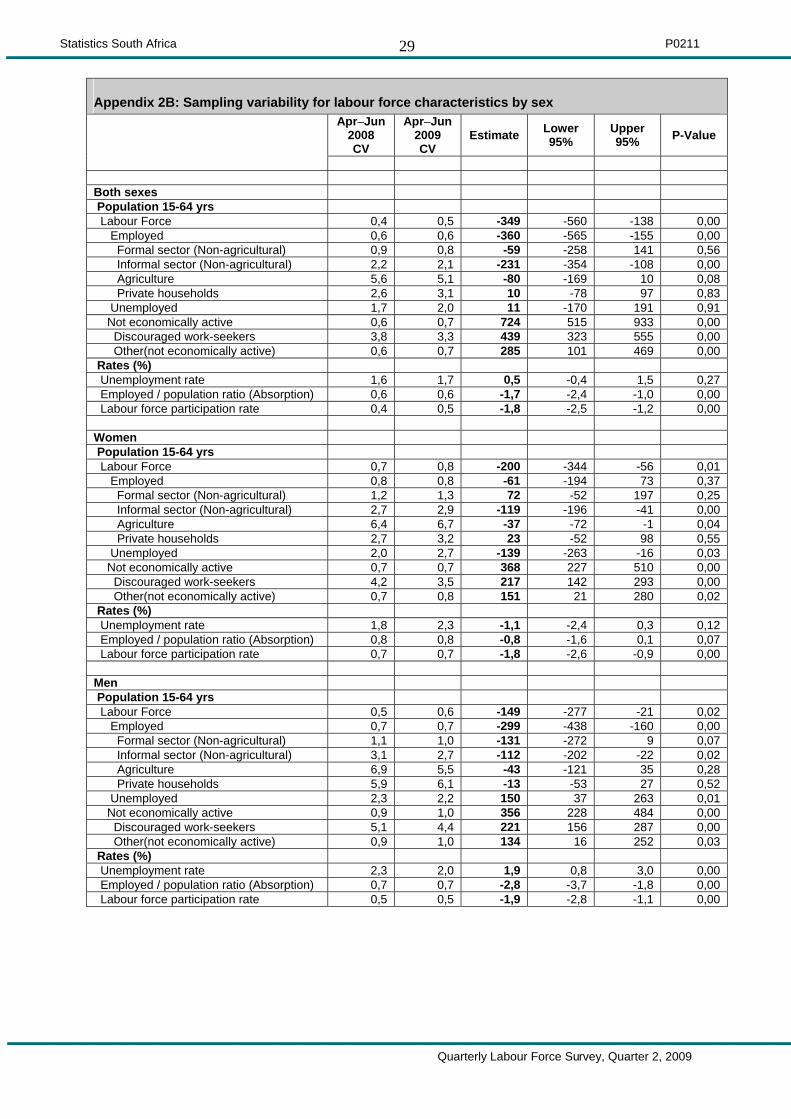
Statistics South Africa P0211
Quarterly Labour Force Survey, Quarter 2, 2009
29
Appendix 2B: Sampling variability for labour force characteristics by sex Apr–Jun
2008 CV
Apr–Jun 2009 CV
Estimate Lower 95%
Upper 95% P-Value
Both sexes Population 15-64 yrs Labour Force 0,4 0,5 -349 -560 -138 0,00 Employed 0,6 0,6 -360 -565 -155 0,00 Formal sector (Non-agricultural) 0,9 0,8 -59 -258 141 0,56 Informal sector (Non-agricultural) 2,2 2,1 -231 -354 -108 0,00 Agriculture 5,6 5,1 -80 -169 10 0,08 Private households 2,6 3,1 10 -78 97 0,83 Unemployed 1,7 2,0 11 -170 191 0,91 Not economically active 0,6 0,7 724 515 933 0,00 Discouraged work-seekers 3,8 3,3 439 323 555 0,00 Other(not economically active) 0,6 0,7 285 101 469 0,00 Rates (%) Unemployment rate 1,6 1,7 0,5 -0,4 1,5 0,27 Employed / population ratio (Absorption) 0,6 0,6 -1,7 -2,4 -1,0 0,00 Labour force participation rate 0,4 0,5 -1,8 -2,5 -1,2 0,00 Women Population 15-64 yrs Labour Force 0,7 0,8 -200 -344 -56 0,01 Employed 0,8 0,8 -61 -194 73 0,37 Formal sector (Non-agricultural) 1,2 1,3 72 -52 197 0,25 Informal sector (Non-agricultural) 2,7 2,9 -119 -196 -41 0,00 Agriculture 6,4 6,7 -37 -72 -1 0,04 Private households 2,7 3,2 23 -52 98 0,55 Unemployed 2,0 2,7 -139 -263 -16 0,03 Not economically active 0,7 0,7 368 227 510 0,00 Discouraged work-seekers 4,2 3,5 217 142 293 0,00 Other(not economically active) 0,7 0,8 151 21 280 0,02 Rates (%) Unemployment rate 1,8 2,3 -1,1 -2,4 0,3 0,12 Employed / population ratio (Absorption) 0,8 0,8 -0,8 -1,6 0,1 0,07 Labour force participation rate 0,7 0,7 -1,8 -2,6 -0,9 0,00 Men Population 15-64 yrs Labour Force 0,5 0,6 -149 -277 -21 0,02 Employed 0,7 0,7 -299 -438 -160 0,00 Formal sector (Non-agricultural) 1,1 1,0 -131 -272 9 0,07 Informal sector (Non-agricultural) 3,1 2,7 -112 -202 -22 0,02 Agriculture 6,9 5,5 -43 -121 35 0,28 Private households 5,9 6,1 -13 -53 27 0,52 Unemployed 2,3 2,2 150 37 263 0,01 Not economically active 0,9 1,0 356 228 484 0,00 Discouraged work-seekers 5,1 4,4 221 156 287 0,00 Other(not economically active) 0,9 1,0 134 16 252 0,03 Rates (%) Unemployment rate 2,3 2,0 1,9 0,8 3,0 0,00 Employed / population ratio (Absorption) 0,7 0,7 -2,8 -3,7 -1,8 0,00 Labour force participation rate 0,5 0,5 -1,9 -2,8 -1,1 0,00

Statistics South Africa P0211
Quarterly Labour Force Survey, Quarter 2, 2009
30
Appendix 2.1B: Sampling variability for labour force characteristics by population group Apr–Jun
2008 CV
Apr–Jun 2009 CV
Estimate Lower 95%
Upper 95% P-Value
South Africa Population 15-64 yrs Labour Force 0,4 0,5 -349 -560 -138 0,00 Employed 0,6 0,6 -360 -565 -155 0,00 Unemployed 1,7 2,0 11 -170 191 0,91 Not economically active 0,6 0,7 724 515 933 0,00 Rates (%) Unemployment rate 1,6 1,7 0,5 -0,4 1,5 0,27 Employed / population ratio (Absorption) 0,6 0,6 -1,7 -2,4 -1,0 0,00 Labour force participation rate 0,4 0,5 -1,8 -2,5 -1,2 0,00 Black/African Population 15-64 yrs Labour Force 0,5 0,7 -361 -554 -168 0,00 Employed 0,8 0,8 -372 -557 -188 0,00 Unemployed 1,9 2,2 12 -168 191 0,90 Not economically active 0,7 0,8 706 512 901 0,00 Rates (%) Unemployment rate 1,7 1,8 0,9 -0,4 2,1 0,17 Employed / population ratio (Absorption) 0,8 0,8 -2,1 -2,9 -1,4 0,00 Labour force participation rate 0,5 0,7 -2,3 -3,1 -1,5 0,00 Coloured Population 15-64 yrs Labour Force 0,9 1,2 32 -21 85 0,23 Employed 1,9 1,7 25 -45 95 0,48 Unemployed 5,7 4,6 7 -42 56 0,78 Not economically active 1,7 2,0 10 -41 62 0,70 Rates (%) Unemployment rate 5,9 4,6 0,0 -2,5 2,6 0,98 Employed / population ratio (Absorption) 1,9 1,6 0,1 -2,2 2,4 0,93 Labour force participation rate 0,9 1,0 0,2 -1,5 1,8 0,85 Indian/Asian Population 15-64 yrs Labour Force 1,5 2,7 -13 -43 17 0,40 Employed 2,4 2,9 -5 -37 27 0,78 Unemployed 13,5 9,6 -9 -28 11 0,39 Not economically active 2,3 3,4 30 4 57 0,03 Rates (%) Unemployment rate 13,4 9,1 -1,3 -4,9 2,2 0,46 Employed / population ratio (Absorption) 2,4 2,4 -1,5 -4,6 1,6 0,33 Labour force participation rate 1,5 2,2 -2,6 -5,5 0,2 0,07 White Population 15-64 yrs Labour Force Employed 1,1 1,1 -8 -78 63 0,83 Unemployed 1,3 1,1 -8 -81 64 0,82 Not economically active 11,0 9,8 1 -27 29 0,96 Rates (%) 2,6 2,3 -23 -92 46 0,52 Unemployment rate Employed / population ratio (Absorption) 11,0 9,7 0,1 -1,2 1,3 0,94 Labour force participation rate 1,3 1,0 0,4 -1,9 2,6 0,74

Statistics South Africa P0211
Quarterly Labour Force Survey, Quarter 2, 2009
31
Appendix 2.2B: Sampling variability for labour force characteristics by province Apr–Jun
2008 CV
Apr–Jun 2009 CV
Estimate Lower 95%
Upper 95% P-Value
Population 15-64 yrs Labour Force 0,4 0,5 -349 -560 -138 0,00 Employed 0,6 0,6 -360 -565 -155 0,00 Unemployed 1,7 2,0 11 -170 191 0,91 Not economically active 0,6 0,7 724 515 933 0,00 Discouraged work-seekers 3,8 3,3 439 323 555 0,00 Other(not economically active) 0,6 0,7 285 101 469 0,00 Rates (%) Unemployment rate Employed / population ratio (Absorption) 1,6 1,7 0,5 -0,4 1,5 0,27 Labour force participation rate 0,6 0,6 -1,7 -2,4 -1,0 0,00 0,4 0,5 -1,8 -2,5 -1,2 0,00 Western Cape Population 15-64 yrs Labour Force Employed 0,9 1,1 50 -3 104 0,07 Unemployed 1,4 1,4 7 -59 73 0,84 Not economically active 4,5 3,9 43 -10 97 0,11 Discouraged work-seekers 1,9 2,4 -6 -60 48 0,84 Other(not economically active) 20,0 29,0 -4 -17 8 0,50 Rates (%) 1,8 2,3 -1 -54 52 0,96 Unemployment rate Employed / population ratio (Absorption) Labour force participation rate 4,5 3,7 1,4 -0,8 3,6 0,21 1,4 1,4 -0,5 -2,4 1,4 0,60 Eastern Cape 0,9 1,1 0,6 -1,0 2,1 0,46 Population 15-64 yrs Labour Force Employed Unemployed 2,6 3,4 65 -35 165 0,20 Not economically active 2,8 2,7 -10 -105 85 0,84 Discouraged work-seekers 5,4 8,9 75 -2 151 0,06 Other(not economically active) 2,2 2,9 -16 -117 84 0,75 Rates (%) 7,3 8,7 75 8 143 0,03 Unemployment rate 2,3 2,9 -92 -172 -12 0,03 Employed / population ratio (Absorption) Labour force participation rate 4,5 6,3 3,1 -0,5 6,7 0,09 Northern Cape 2,8 2,6 -0,7 -3,1 1,7 0,59 Population 15-64 yrs 2,6 3,3 1,1 -1,4 3,5 0,39 Labour Force Employed Unemployed Not economically active Discouraged work-seekers 1,9 4,5 -9 -38 21 0,56 Other(not economically active) 3,0 5,5 -13 -44 18 0,40 Rates (%) 7,8 10,3 4 -10 19 0,56 Unemployment rate 2,4 5,3 13 -16 43 0,37 Employed / population ratio (Absorption) 15,7 26,4 1 -13 15 0,85 Labour force participation rate 2,5 4,5 12 -13 37 0,36 Free State Population 15-64 yrs 7,5 9,2 1,7 -2,3 5,6 0,40 Labour Force 3,0 5,5 -2,1 -6,5 2,2 0,34 Employed 1,9 4,5 -1,6 -5,7 2,5 0,45 Unemployed Not economically active Discouraged work-seekers Other(not economically active) Rates (%) 1,4 1,9 -63 -102 -24 0,00 Unemployment rate 2,0 2,3 -57 -100 -15 0,01 Employed / population ratio (Absorption) 4,2 4,4 -6 -35 24 0,71 Labour force participation rate 2,1 2,5 74 35 113 0,00

Statistics South Africa P0211
Quarterly Labour Force Survey, Quarter 2, 2009
32
Appendix 2.2B: Sampling variability for labour force characteristics by province (Concluded) Apr–Jun
2008 CV
Apr–Jun 2009 CV
Estimate Lower 95%
Upper 95% P-Value
KwaZulu Natal Population 15-64 yrs Labour Force 1,2 1,7 -316 -443 -189 0,00 Employed 1,8 1,8 -157 -275 -39 0,01 Unemployed 4,2 4,3 -159 -233 -85 0,00 Not economically active 1,4 1,5 405 280 531 0,00 Discouraged work-seekers 10,9 5,3 281 229 333 0,00 Other(not economically active) 1,5 1,6 124 11 238 0,03 Rates (%) Unemployment rate Employed / population ratio (Absorption) 4,2 3,8 -2,9 -5,0 -0,8 0,01 Labour force participation rate 1,8 1,8 -3,1 -4,9 -1,2 0,00 1,2 1,7 -5,7 -7,7 -3,7 0,00 North West Population 15-64 yrs Labour Force Employed 2,4 3,1 6 -45 57 0,81 Unemployed 3,9 3,7 -50 -101 0 0,05 Not economically active 5,8 6,2 57 8 106 0,02 Discouraged work-seekers 2,9 3,5 10 -43 62 0,72 Other(not economically active) 10,6 11,5 -12 -38 14 0,37 Rates (%) 3,1 3,5 21 -35 78 0,45 Unemployment rate Employed / population ratio (Absorption) Labour force participation rate 6,8 5,4 4,7 1,0 8,4 0,01 3,9 3,5 -2,6 -4,9 -0,4 0,02 Gauteng 2,4 2,9 -0,1 -2,3 2,1 0,93 Population 15-64 yrs Labour Force Employed Unemployed 0,9 1,1 -54 -178 70 0,39 Not economically active 1,1 1,3 -108 -220 5 0,06 Discouraged work-seekers 3,9 4,1 54 -55 163 0,33 Other(not economically active) 2,5 2,5 127 12 241 0,03 Rates (%) 13,8 13,1 -9 -61 42 0,72 Unemployment rate 2,4 2,5 136 35 238 0,01 Employed / population ratio (Absorption) Labour force participation rate 3,5 3,7 1,3 -0,6 3,2 0,18 Mpumalanga 1,1 1,2 -2,1 -3,6 -0,6 0,01 Population 15-64 yrs 0,9 1,0 -1,5 -3,1 0,1 0,06 Labour Force Employed Unemployed Not economically active 2,1 2,3 25 -34 84 0,41 Discouraged work-seekers 3,1 3,0 -3 -70 64 0,93 Other(not economically active) 5,0 5,1 28 -11 66 0,16 Rates (%) 2,5 2,7 6 -53 64 0,85 Unemployment rate 9,7 8,8 16 -2 35 0,08 Employed / population ratio (Absorption) 2,7 2,6 -11 -68 46 0,71 Labour force participation rate Limpopo 5,3 4,9 1,8 -1,5 5,0 0,29 Population 15-64 yrs 3,1 3,0 -0,7 -3,7 2,3 0,65 Labour Force 2,1 2,2 0,4 -2,3 3,0 0,79 Employed Unemployed Not economically active Discouraged work-seekers 2,2 2,5 -53 -128 21 0,16 Other(not economically active) 2,7 2,6 32 -37 100 0,37 Rates (%) 5,0 9,0 -85 -144 -26 0,01 Unemployment rate 1,6 1,6 111 36 186 0,00 Employed / population ratio (Absorption) 8,6 7,6 59 18 101 0,01 Labour force participation rate 1,7 1,9 52 -24 128 0,18

Statistics South Africa P0211
Quarterly Labour Force Survey, Quarter 2, 2009
33
Appendix 3.1B: Sampling variability for the employed by industry and sex Apr–Jun
2008 CV
Apr–Jun 2009 CV
Estimate Lower 95%
Upper 95% P-Value
Both sexes 0,6 0,6 -360 -565 -155 0,00 Agriculture 5,6 5,1 -80 -169 10 0,08 Mining 9,1 7,5 -27 -69 14 0,20 Manufacturing 2,2 2,7 -95 -209 18 0,10 Utilities 10,9 18,7 -4 -43 34 0,84 Construction 3,4 3,0 -22 -114 71 0,65 Trade 1,7 1,8 -143 -286 0 0,05 Transport 3,6 3,8 -47 -118 24 0,19 Finance 2,9 2,4 22 -85 130 0,68 Community and social services 1,8 1,7 28 -87 144 0,63 Private households 2,6 3,1 10 -78 97 0,83 Other Women 0,8 0,8 -61 -194 73 0,37 Agriculture 6,4 6,7 -37 -72 -1 0,04 Mining 13,4 14,4 7 -7 20 0,33 Manufacturing 3,6 4,1 -37 -101 27 0,26 Utilities 18,8 21,4 0 -14 14 0,99 Construction 8,1 7,6 6 -20 33 0,64 Trade 2,2 2,2 -90 -179 0 0,05 Transport 6,5 7,4 -21 -51 8 0,15 Finance 3,4 3,4 37 -34 109 0,30 Community and social services 2,0 2,1 53 -31 138 0,22 Private households 2,7 3,2 23 -52 98 0,55 Other Men 0,7 0,7 -299 -438 -160 0,00 Agriculture 6,9 5,5 -43 -121 35 0,28 Mining 9,7 8,0 -34 -73 5 0,09 Manufacturing 2,5 3,2 -58 -146 29 0,19 Utilities 12,3 21,1 -4 -35 27 0,80 Construction 3,4 3,2 -28 -114 58 0,52 Trade 2,5 2,4 -53 -158 51 0,32 Transport 4,1 4,1 -26 -86 34 0,40 Finance 3,6 3,6 -15 -103 72 0,73 Community and social services 2,8 2,7 -25 -97 48 0,50 Private households 5,9 6,1 -13 -53 27 0,52 Other
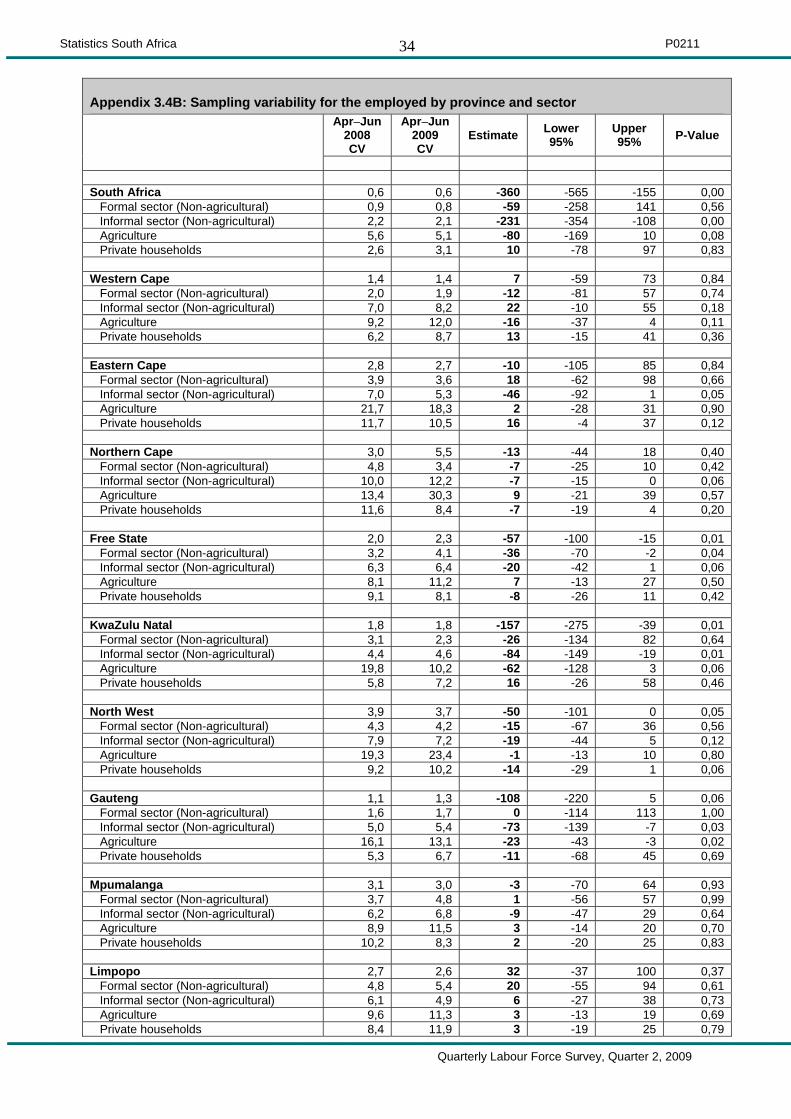
Statistics South Africa P0211
Quarterly Labour Force Survey, Quarter 2, 2009
34
Appendix 3.4B: Sampling variability for the employed by province and sector Apr–Jun
2008 CV
Apr–Jun 2009 CV
Estimate Lower 95%
Upper 95% P-Value
South Africa 0,6 0,6 -360 -565 -155 0,00 Formal sector (Non-agricultural) 0,9 0,8 -59 -258 141 0,56 Informal sector (Non-agricultural) 2,2 2,1 -231 -354 -108 0,00 Agriculture 5,6 5,1 -80 -169 10 0,08 Private households 2,6 3,1 10 -78 97 0,83 Western Cape 1,4 1,4 7 -59 73 0,84 Formal sector (Non-agricultural) 2,0 1,9 -12 -81 57 0,74 Informal sector (Non-agricultural) 7,0 8,2 22 -10 55 0,18 Agriculture 9,2 12,0 -16 -37 4 0,11 Private households 6,2 8,7 13 -15 41 0,36 Eastern Cape 2,8 2,7 -10 -105 85 0,84 Formal sector (Non-agricultural) 3,9 3,6 18 -62 98 0,66 Informal sector (Non-agricultural) 7,0 5,3 -46 -92 1 0,05 Agriculture 21,7 18,3 2 -28 31 0,90 Private households 11,7 10,5 16 -4 37 0,12 Northern Cape 3,0 5,5 -13 -44 18 0,40 Formal sector (Non-agricultural) 4,8 3,4 -7 -25 10 0,42 Informal sector (Non-agricultural) 10,0 12,2 -7 -15 0 0,06 Agriculture 13,4 30,3 9 -21 39 0,57 Private households 11,6 8,4 -7 -19 4 0,20 Free State 2,0 2,3 -57 -100 -15 0,01 Formal sector (Non-agricultural) 3,2 4,1 -36 -70 -2 0,04 Informal sector (Non-agricultural) 6,3 6,4 -20 -42 1 0,06 Agriculture 8,1 11,2 7 -13 27 0,50 Private households 9,1 8,1 -8 -26 11 0,42 KwaZulu Natal 1,8 1,8 -157 -275 -39 0,01 Formal sector (Non-agricultural) 3,1 2,3 -26 -134 82 0,64 Informal sector (Non-agricultural) 4,4 4,6 -84 -149 -19 0,01 Agriculture 19,8 10,2 -62 -128 3 0,06 Private households 5,8 7,2 16 -26 58 0,46 North West 3,9 3,7 -50 -101 0 0,05 Formal sector (Non-agricultural) 4,3 4,2 -15 -67 36 0,56 Informal sector (Non-agricultural) 7,9 7,2 -19 -44 5 0,12 Agriculture 19,3 23,4 -1 -13 10 0,80 Private households 9,2 10,2 -14 -29 1 0,06 Gauteng 1,1 1,3 -108 -220 5 0,06 Formal sector (Non-agricultural) 1,6 1,7 0 -114 113 1,00 Informal sector (Non-agricultural) 5,0 5,4 -73 -139 -7 0,03 Agriculture 16,1 13,1 -23 -43 -3 0,02 Private households 5,3 6,7 -11 -68 45 0,69 Mpumalanga 3,1 3,0 -3 -70 64 0,93 Formal sector (Non-agricultural) 3,7 4,8 1 -56 57 0,99 Informal sector (Non-agricultural) 6,2 6,8 -9 -47 29 0,64 Agriculture 8,9 11,5 3 -14 20 0,70 Private households 10,2 8,3 2 -20 25 0,83 Limpopo 2,7 2,6 32 -37 100 0,37 Formal sector (Non-agricultural) 4,8 5,4 20 -55 94 0,61 Informal sector (Non-agricultural) 6,1 4,9 6 -27 38 0,73 Agriculture 9,6 11,3 3 -13 19 0,69 Private households 8,4 11,9 3 -19 25 0,79
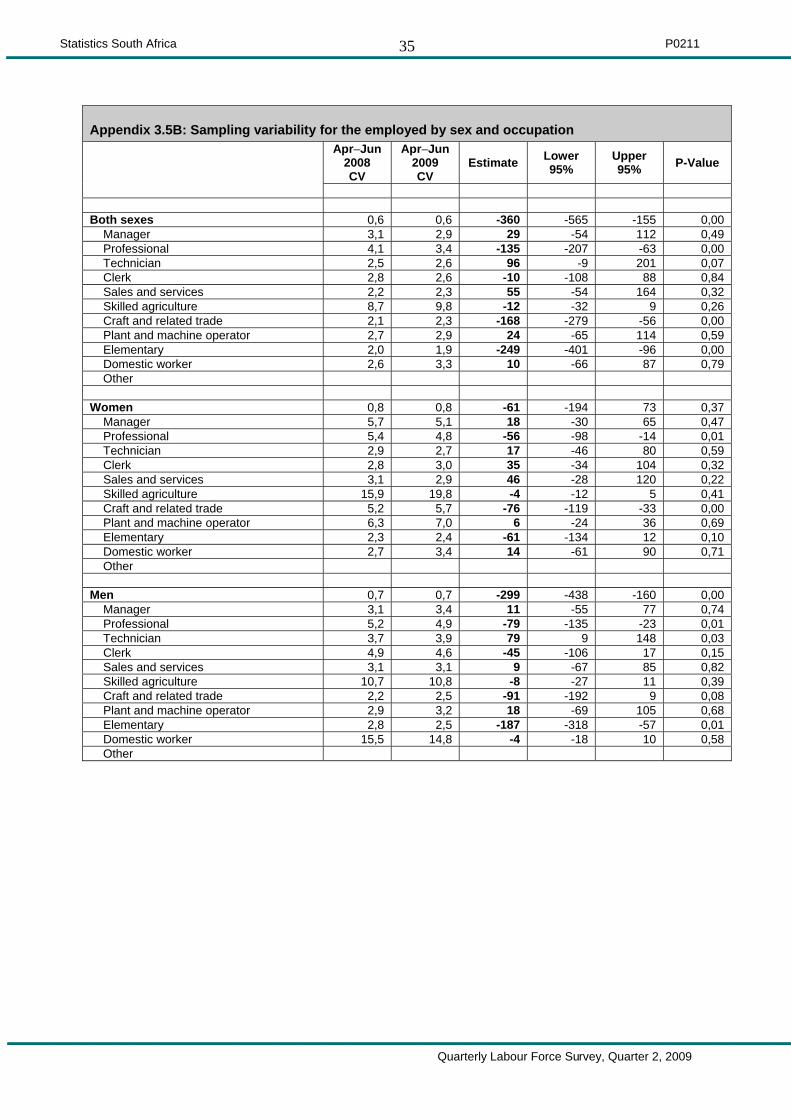
Statistics South Africa P0211
Quarterly Labour Force Survey, Quarter 2, 2009
35
Appendix 3.5B: Sampling variability for the employed by sex and occupation Apr–Jun
2008 CV
Apr–Jun 2009 CV
Estimate Lower 95%
Upper 95% P-Value
Both sexes 0,6 0,6 -360 -565 -155 0,00 Manager 3,1 2,9 29 -54 112 0,49 Professional 4,1 3,4 -135 -207 -63 0,00 Technician 2,5 2,6 96 -9 201 0,07 Clerk 2,8 2,6 -10 -108 88 0,84 Sales and services 2,2 2,3 55 -54 164 0,32 Skilled agriculture 8,7 9,8 -12 -32 9 0,26 Craft and related trade 2,1 2,3 -168 -279 -56 0,00 Plant and machine operator 2,7 2,9 24 -65 114 0,59 Elementary 2,0 1,9 -249 -401 -96 0,00 Domestic worker 2,6 3,3 10 -66 87 0,79 Other Women 0,8 0,8 -61 -194 73 0,37 Manager 5,7 5,1 18 -30 65 0,47 Professional 5,4 4,8 -56 -98 -14 0,01 Technician 2,9 2,7 17 -46 80 0,59 Clerk 2,8 3,0 35 -34 104 0,32 Sales and services 3,1 2,9 46 -28 120 0,22 Skilled agriculture 15,9 19,8 -4 -12 5 0,41 Craft and related trade 5,2 5,7 -76 -119 -33 0,00 Plant and machine operator 6,3 7,0 6 -24 36 0,69 Elementary 2,3 2,4 -61 -134 12 0,10 Domestic worker 2,7 3,4 14 -61 90 0,71 Other Men 0,7 0,7 -299 -438 -160 0,00 Manager 3,1 3,4 11 -55 77 0,74 Professional 5,2 4,9 -79 -135 -23 0,01 Technician 3,7 3,9 79 9 148 0,03 Clerk 4,9 4,6 -45 -106 17 0,15 Sales and services 3,1 3,1 9 -67 85 0,82 Skilled agriculture 10,7 10,8 -8 -27 11 0,39 Craft and related trade 2,2 2,5 -91 -192 9 0,08 Plant and machine operator 2,9 3,2 18 -69 105 0,68 Elementary 2,8 2,5 -187 -318 -57 0,01 Domestic worker 15,5 14,8 -4 -18 10 0,58 Other