quantitative composition, distribution, community
TRANSCRIPT
VOL. 33, NO. 4 (DECEMBER lSaO), P. 768-793 ARCTIC
Quantitative Composition, Distribution, Community Structure and Standing Stock of Sea Ice Microalgae in the Canadian Arctic
STEPHEN I. C. HSIAO’
ABSTRACT. One hundred and ninety-six (196) species of microalgae were identified from the annual shore-fast sea ice samples collected from the Canadian Arctic between November and June in the years 1971 to 1978. The diatoms were represented by 189 species (21 centric and 168 pennate), the flagellates by three species, the dinoflagellates and chrysophytes by two species each. There were no blue-green algae. Species composi- tion and distribution are tabulated. The dominant species of the microalgal communities in the bottom of the ice different from those found elsewhere in the ice.
The sea ice microalgal communities and standing stock started to develop in late fall at the time of ice formation. They grew very slowly through the winter months, exponentially increased in early spring, reached a peak just prior to the thaw period in late spring or early summer, and declined rapidly in summer as ice melting occurred. Standing stock was greatest at the bottom of the sea ice, where it was one to two orders of magnitude larger than in other parts of the ice column, and 50 to 500 times greater than in the phytoplankton in the underlying waters. The ice communities consisted mainly of diatoms with a great majority of pennate forms. Large numbers of species and cells of diatoms were found at the bottom of the sea ice. Dinoflagellates, flagellates and chrysophytes occurred in relatively low numbers except in a few cases when ice blooms were observed. During May most of the sea ice microalgal blooms occurred in the bottom of the ice except for Phueocystis pouchetii, which occurred elsewhere in the ice.
Environmental factors controlling standing stock, growth and distribution of sea ice microalgae are discussed.
I
R6SUM6. Cent quatre-vingt seize (1%) espbces d’algues microscopiques ont et6 identi- fiees B partir d’bchantillons prkleves dans 1’Arctique canadien sur la banquise c6tibre annuelle entre novembre etjuin, de 1971 B 1978. Les diatomkes y ttaient representtes par 189 espbces (21 de forme centrique et 168 de forme pennee), les flagelles partrois espbces, les dinoflagelks et les chrysophytes par deux especes chacune. Les algues bleues ne comptaient aucun representant. La composition et la distribution de espbces ont et6 mises en tableaux. Les:esp*ces dominantes des communautes d’algues microscopiques que l’on retrouue &an’s la couche inftrieure de la glace differaient de celles recontrees ailleurs dans la glace.
Les communautts d’algues microscopiques de glace de mer et le stock in situ ont commencC B se constituer la fin de l’automne, lors de la formation des glaces. 11s se sont dtveloppds trbs lentement durant les mois d’hiver, augmentant de faGon exponentielle t8t le printemps pour atteindre un sommet tout juste avant la p6riode de degel, a la fin du printemps ou au dtbut de Yet6 et puis decroitre rapidement en et6 avec lafonte des glaces. Le stock in situ atteignait un maximum dans la couche infkrieure de la glace de mer et depassait par un ou deux ordres de grandeur les valeurs trouvees dans les autres parties de la colonne de glace; il etait de 50 B 500 fois suptrieur B celui du phytoplancton present dans les sous-jacentes. Les communautes de glace se composent surtout de diatomkes, la grande majorite &ant de forme pennee. Un grand nombre d’espbces et de cellules de diatomees dans la couche inferieure de la glace. Les dinoflagellbs, flagelles et chryso- phytes se retrouvent en nombre relativement restreint B part quelques rares occasions lorsque des blooms d’algues microscopiques ont kt6 observes dans laglace. Durant le mois
I ’
‘Arctic Biological Station, Department of Fisheries and Oceans, 555 St. Pierre Boulevard, ste. Anne de Bellevue, Quebec, Canada H9X 3R4
SEA ICE MICROALGAE IN THE CANADIAN ARCTIC 769
de mai, c’est dans la couche infkrieure de la glacezmarine que se produisent la plupart des blooms d’algues microscopiques A I’exception de Phaeocystis pouchetii dont le bloom se prouit ailleurs dans la glace.
Des facteurs de I’environnement pouvant contdler les stocks in situ, la croissance et la distribution des algues microscopiques de la glace marine sont discutks.
Traduit par I’auteur.
INTRODUCTION I Sea ice covers 26 million km2 of the earth’s surface. Of this, about 10 million km2
lie in the Arctic (Coachman and Aagaard, 1974). Two distinct communities of microalgae exist in the polar sea ice. The first is the snow community in the Antarctic studied by Meguro (1962), which is derived from seawater penetrating into the interstices of the snow which piles on the surface of the ice; the microalgae are entrapped and frozen compacted on the top of the ice. The second is the epontic community described by Bunt and Wood (1963) in the Antarctic and by Meguro et al. (1%7) in the Arctic, in which the microalgae are attached to ice crystals and in the interstitial water of the ice matrix formed at the bottom surface of the sea ice. During late winter through spring and early summer, colored bands ranging from brownish-green, greenigh-brown, yellow- brown, brown, dark brown, to red are commonly seen in the arctic sea ice, especially in the bottom layers (Gran, 1904; Apollonio, 1961; Bursa, 1961; Meguro et al., 1966; 1967; Alexander et al., 1974; McRoy and Goering, 1976; Grant and Homer, 1976). These bands are caused by the pigments of microalgae with different proportions of diatoms, green flagellates, dinoflagellates and chrysophytes growing on, or trapped within, the ice. It has been recognized that the sea ice microalgae play an important role as primary producers in the arctic marine ecosystem (Meguro et al., 1966; 1967; Horner and Alexander, 1972; Alexander, 1974; McRoy and Goering, 1974; Clasby et al., 1976). They may directly provide a potential food source for grazing zooplankton (English, 1961 ; Apollonio, 1965; Alexander et al., 1974), euphausiid shrimp, fish fry, glacial and polar cod (Andriashev, 1968’; Ackley etal., 1979), and they may indirectly supply food through zooplankton consumers (fishes) to fish-eating species of mahmals and birds (Homer, 1976; McConnaughey and McRoy, 1979).
The composition of the arctic ice flora was reported by Ehrenberg (1853) from Assistance Bay, Hingston Bay and Melville Bay; Dickie (1878) from the region between Smith Sound and Robeson Channel; Cleve and Grunow (1880) from the Kara Sea; Cleve (1883; 1884; 18%; 1898; 1899; 1900) from Cape Wankarema, Discovery Bay, Baffh Bay and Davis Strait, Franz Joseph Land, between Greenland and Spitsbergen, and north of Jan Mayen Island; Gran (1897; 1904) from Karajak Fjord and the Arctic Ocean; Jbstrup (1895) from the east coast of Greenland; and Usachev (1938; 1949) from the Kara and Laptev seas. All of this information was obtained from drifting, broken ice-floes or samples taken from ice upturned in the path of ice-breakers. None of it was quantitatively evaluated samples for species composition. Recently, Alexander etal. (1974) used a SIPRE ice corer to take samples from solid, unbroken sea ice at Barrow, Alaska and quantitatively analyzed the samples from the bottom of ice cores for species
I

770 S. I . C. HSIAO
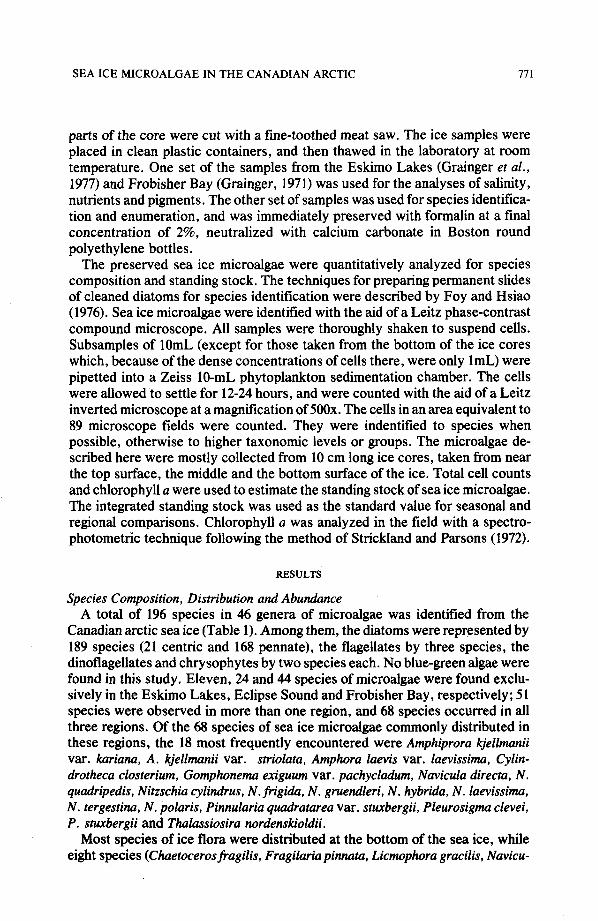
FIG. 1 . Station locations in the Canadian Arctic. The collecting sites, A, B, and C indicated in the map at upper left are illustrated in greater detail in the other three maps.
composition and standing stock. The development and composition of the epontic community in the vicinity of Barrow have been studied by Meguro et al. (1966; 1967), Homer and Alexander (1972) and Horner (1976; 1977). However, very little is known concerning qualitative and quantitative species composition and spatial distribution of sea ice microalgae in the Canadian Arctic. The objective of this paper is to investigate the quantitative composition, vertical distribution and standing stock of microalgae in the Canadian arctic sea ice, and to explore some environmental factors controlling their distribution.
MATERIALS AND METHODS
The sea ice microalgal samples were collected with a 7.5-cm SIPRE ice corer from the top to the bottom of the ice at stations 508 and 515 in the Eskimo Lakes during late fall and spring of the years 1972 to 1974; at stations 1, 2,3, and 4 in Eclipse Sound during March and May of the years 1976 and 1977; and at stations 1,5 and 5B in Frobisher Bay during late fall and spring of the years 1971 to 1973, 1977 and 1978 (Fig. 1). The length of the ice core was measured, and various
SEA ICE MICROALGAE IN THE CANADIAN ARCTIC 77 1
parts of the core were cut with a fine-toothed meat saw. The ice samples were placed in clean plastic containers, and then thawed in the laboratory at room temperature. One set of the samples from the Eskimo Lakes (Grainger et al., 1977) and Frobisher Bay (Grainger, 1971) was used for the analyses of salinity, nutrients and pigments. The other set of samples was used for species identifica- tion and enumeration, and was immediately preserved with formalin at a final concentration of 2%, neutralized with calcium carbonate in Boston round polyethylene bottles.
The preserved sea ice microalgae were quantitatively analyzed for species composition and standing stock. The techniques for preparing permanent slides of cleaned diatoms for species identification were described by Foy and Hsiao (1976). Sea ice microalgae were identified with the aid of a Leitz phase-contrast compound microscope. All samples were thoroughly shaken to suspend cells. Subsamples of lOmL (except for those taken from the bottom of the ice cores which, because of the dense concentrations of cells there, were only 1mL) were pipetted into a Zeiss 10-mL phytoplankton sedimentation chamber. The cells were allowed to settle for 12-24 hours, and were counted with the aid of a Leitz inverted microscope at a magnification of 500x. The cells in an area equivalent to 89 microscope fields were counted. They were indentified to species when possible, otherwise to higher taxonomic levels or groups. The microalgae de- scribed here were mostly collected from 10 cm long ice cores, taken from near the top surface, the middle and the bottom surface of the ice. Total cell counts and chlorophyll a were used to estimate the standing stock of sea ice microalgae. The integrated standing stock was used as the standard value for seasonal and regional comparisons. Chlorophyll a was analyzed in the field with a spectro- photometric technique following the method of Strickland and Parsons (1972).
RESULTS
Species Composition, Distribution and Abundance A total of 196 species in 46 genera of microalgae was identified from the
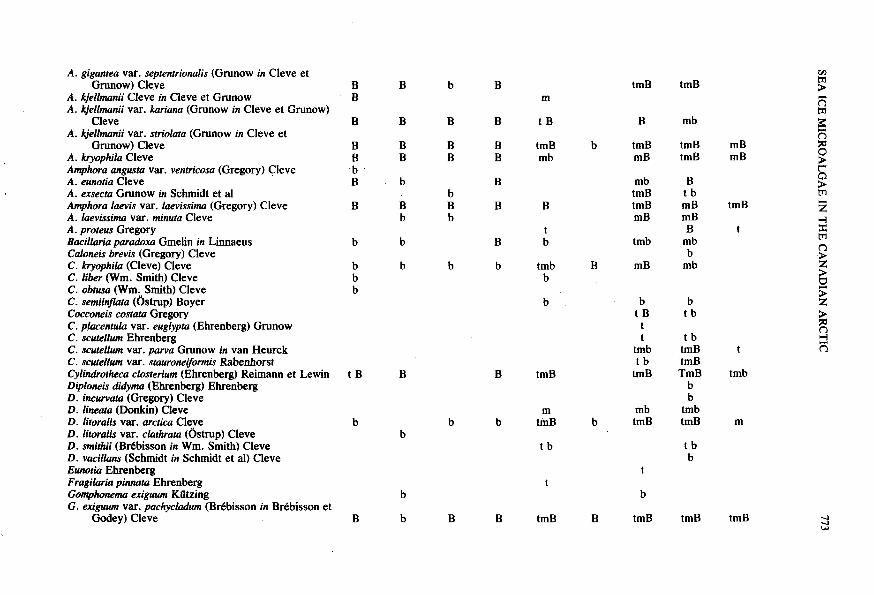
Canadian arctic sea ice (Table 1). Among them, the diatoms were represented by 189 species (21 centric and 168 pennate), the flagellates by three species, the dinoflagellates and chrysophytes by two species each. No blue-green algae were found in this study. Eleven, 24 and 44 species of microalgae were found exclu- sively in the Eskimo Lakes, Eclipse Sound and Frobisher Bay, respectively; 51 species were observed in more than one region, and 68 species occurred in all three regions. Of the 68 species of sea ice microalgae commonly distributed in these regions, the 18 most frequently encountered were Amphiprora kjellmanii var. karianu, A. kjellmanii var. striolata, Amphora laevis var. laevissima, Cylin- drotheca closterium, Gomphonema exiguum var. pachycladum, Navicula directa, N . quadripedis, Nitzschia cylindrus, N . frigida, N . gruendleri, N . hybrida, N . laevissima, N . tergestinu, N . Polaris, Pinnularia quadratarea var. stuxbergii, Pleurosigma clevei, P . stuxbergii and Thalassiosira nordenskioldii.
Most species of ice flora were distributed at the bottom of the sea ice, while eight species (Chuetocerosfragilis, Fragilaria pinnata, Licmophora gracilis, Navicu-

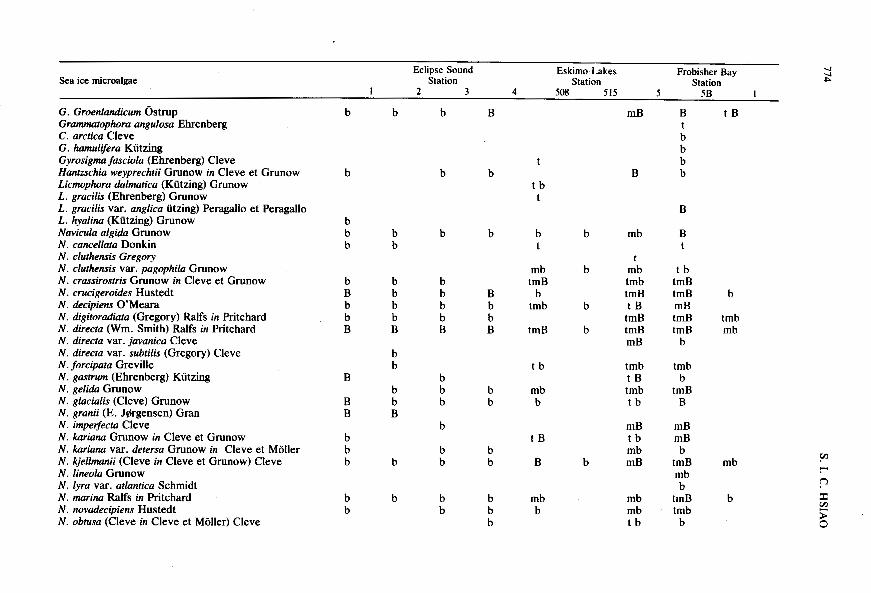
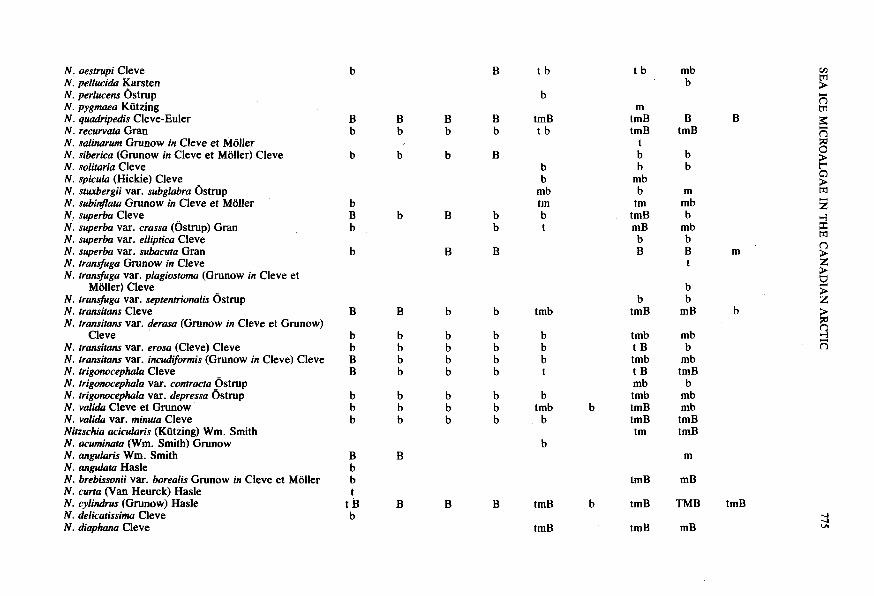
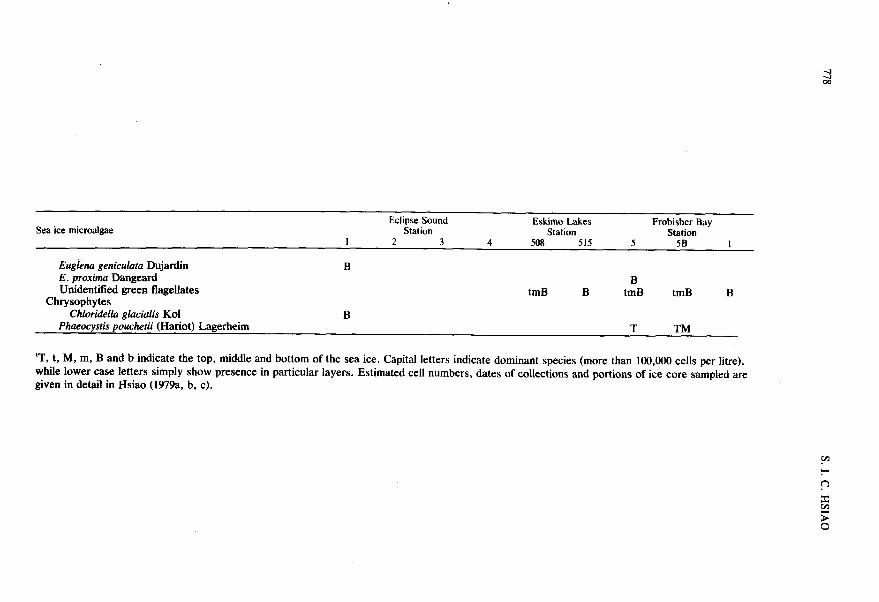
Table 1. Species composition and vertical distribution' of sea ice microalgae in the Canadian Arctic
Sea ice microalgae Eclipse Sound
Station Eskimo Lakes Frobisher Bay
Station Station 1 2 3 4 508 515 5 5B 1
Diato.ms Centric
Biddulphia aurita (Lyngbye) Brebisson et Godey Chaetoceros borealis Bailey C. decipiens Cleve C. fragilis Meunier C. furcellatus Bailey C. septentrionalis Ostrop Coscinodiscus kuetzingii var. glacialis Grunow C. lacustris var. septentrionalis (Grunow) Rattray C. polyacanthus Grunow in Cleve et Grunow Coscinosira oesrncpii Ostenfeld Eucampia Ehrenberg Melosira arctica (Ehrenberg) Dickie in Pritchard Porisira glacialis (Grunow) E. J@rgensen Rhizosolenia alata Brightwell R. hebetata var. subacuta Grunow Thalassiosira bioculatus (Grunow) Ostenfeld T. bioculatus var. exigua (Grunow) Hustedt T. decipiens (Grunow) E. J@rgensen T. gravida Cleve T. nordenskioldii Cleve Triceratiwn arcticwn Brightwell T. nobile Witt
Achnanrhes delicatula (Kiitzing) Grunow in Cleve et
A. minutissiinaKiitzing A. taeniata Grunow in Cleve et Grunow Amphipleura rutilans (Trentepohl) Cleve Amphiprora concilians Cleve
Pennate
Grunow
t
b b B
B
b B b
b
B b
B b b b
b b
b b b t b
t t mb t B tmB tmB
t b b m
tmB b
tmb tmb
mB tmb
b
b t b tm tm
b B tm
tmb b
tm B B B
b tm b tm tmb t
b m B t b
t B
t B mB
tmB mB b
t t
m
A. gigantea vaf. septentrionalis (Grunow in Cleve et
A. kjellmanii Cleve in Cleve et Grunow A. kjellmanii var. kariana (Grunow in Cleve et Grunow)
A. kjellmanii var. striolata (Grunow in Cleve et
A. kryophila Cleve Amphora angusta var. ventricosu (Gregory) Cleve A. eunoria Cleve A. exsecta Grunow in Schmidt et al Amphora laevis var. laevissima (Gregory) Cleve A. laevissima var. minuta Cleve A. proteus Gregory Bacillaria paradoxa Gmelin in Linnaeus Caloneis brevis (Gregory) Cleve C. kryophila (Cleve) Cleve C. liber (Wm. Smith) Cleve C. obtusa (Wm, Smith) Cleve C. sem'inflara (Ostrup) Boyer Cocconeis costata Gregory C. pkentula var. euglypta (Ehrenberg) Grunow C. scurellum Ehrenberg C. scutellum var. parva Grunow in van Heurck C. scutellum var. stauroneifonnis Rabenhorst Cylindrotheca closterium (Ehrenberg) Reimann et Lewin Diploneis didyma (Ehrenberg) Ehrenberg D. incurvata (Gregory) Cleve D. lineata (Donkin) Cleve D. litoralis var. arcrica Cleve D. litoralis var. clarhrata (Ostrup) Cleve D. smithii (Bdbisson in Wm. Smith) Cleve D. vacillans (Schmidt in Schmidt et al) Cleve Eunotia Ehrenberg Fragilaria pinnata Ehrenberg Gomphomma exiguum Kiitzing G . exiguum var. pachycludum (Brebisson in Brebisson et
Grunow) Cleve
Cleve
Grunow) Cleve
Godey) Cleve
B B
B
t B
b
B
B
B
B B
b
B
b
b
b
b
B
B B
b B b
b
b
B
B m
B t B
B tmB B mb
B
B B
t B b
b tmb b
b
B tmB
b m
tmB
t b
t
B tmB
tmB tmB rA
ij n B mb
b tmB tmB mB mB tmB mB
mb B tmB t b tmB mB tmB mB mB
tmb mb
B mB mb
B t
b
b b t B t b t t t b
tmb tmB t t b tmB
tmB TmB tmb b b
mb tmb b tmB tmB m
t b b
t
b
B tmB tmB tmB
h i%
n 9 z 9
Z 9 s
21 4 W
Sea ice microalgae Eclipse Sound Eskimo Lakes
Station Frobisher Bay
Station I 2 3 4 508 515 5 5B
Station I
G. Groenlandicum Ostrup Grammatophra angulosa Ehrenberg C. arctica Cleve G. hamulifera Kiitzing Gyrosigma fasciola (Ehrenberg) Cleve Hanfzschia weyprechrii Grunow in Cleve et Grunow Licmophora dalmarica (Kiitzing) Grunow L. gracilis (Ehrenberg) Grunow L. gracilis var. anglica iitzing) Peragallo et Peragallo L. hyalina (Kiitzing) Grunow Navicula algida Grunow N. cancellara Donkin N. cluthensis Gregory N. cluthensis var. pagophila Grunow N. crassirosrris Grunow in Cleve et Grunow N . crucigeroides Hustedt N. decipiens O’Meara N. digiroradiara (Gregory) Ralfs in Pritchard N. directa (Wm. Smith) Ralfs in F’ritchard N. directa var. javanica Cleve N. directa var. subrilis (Gregory) Cleve N. forcipara Greville N. gasmtm (Ehrenberg) Kiitzing N . gel& Grunow N . glacialis (Cleve) Grunow N. granii (E. Jergensen) Gran N. imperfecra Cleve N. kariana Grunow in Cleve et Grunow N. kariana var. detersa Grunow in Cleve et Moller N. kjellmanii (Cleve in Cleve et Grunow) Cleve N. lineola Grunow N. lyra var. arlantica Schmidt N . marina Ralfs in Pritchard N. novadecipiens Hustedt N. obtusa (Cleve in Cleve et Moller) Cleve
b
b
b b b
b B b b B
B
B B
b b b
b b
b
b b
b b b b B
b b
b b B
b
b
b
b
b
b b b b B
b b b
b
b b
b b
B
b
b
B b b B
b b
b b
b b b
t
t b t
b t
mb tmB
b tmb
tmB
t b
mb b
t B
B
mb b
mB
B
b mb
b r
mb tmb
b tmB t B tmB
b tmB mB
tmb t B tmb t b
mB t b
b mb mB
mb mb t b
B t B
b t
b b b
B
B t
t b tmB tmB b mB tmB tmb tmB mb
b
tmb b
tmB B
mB mB b
tmB mb mb b
tmB b tmb
b
N. oestrupi Cleve N. pellucida Uarsten N. perlucens Ostrup N. pygmaea Kiitzing N. quadripedis Cleve-Euler N. recurvata Gran N. salinarum Grunow in Cleve et Moller N. siberica (Grunow in Cleve et Moller) Cleve N. solitaria Cleve N. spicula (Hickie) Cleve N. stuxbergii var. subglabra Ostrup N. subintta Grunow in Cleve et Moller ’
N. superba Cleve N. superba var. crassa (Ostrup) Gran N. superba var. elliptica Cleve N. superba var. subacuta Gran N. tramjiuga Grunow in Cleve N. transfuga var. plagiostoma (Grunow in Cleve et
Moller) Cleve N. transfuga var. septentrionalis Ostrup N. transitans Cleve N. transitans VU. {erasa (Grunow in Cleve et Grunow)
N. transitans var. erosa (Cleve) Cleve N. transitans var. incudiformis (Grunow in Cleve) Cleve N. trigonocephala Cleve N. trigomephala var. contracta Ostrup N. trigomephala var. depressa Ostrup N. valida Cleve et Grunow N. valida var. minuta Cleve Nirzschia acicularis (Kutzing) Wm. Smith N. acuminata (Wm. Smith) Grunow N. angularis Wm. Smith N. angulata Hade N. brebissonii var. borealis Grunow in Cleve et Moller N. cwta (Van Heurck) Hasle N. cylindrus (Grunow) Hade N. delicatissima Cleve N. diaphana Cleve
Cleve
b B t b
b
tmB t b
t b mb b
ij m tmB m
tmB
b t
b mb b
tm tmB mB b B
B B tmB
B b
B b
B b
B b
b b b B b b b
b mb tm b t
m mb b
mb b B t
m
b b
mB b
b B b
b B
B
b b
B b
b tmB tmb
b b b t
tmb mb t B b tmb mb t B tmB mb b tmb mb
b tmB mb tmB tmB tm tmB
b b b
b b b
b b b
b b b
b tmb
b
b B b b t
t B b
B m
tmB mB
B B B tmB
tmB
b tmB TMB tmB 4 4 VI tmB mB

Sea ice microalgae Eclipse Sound Eskimo Lakes Frobisher Bay
I Station Station
2 3 4 508 515 5 5B I
N. disruns var. erruticu Cleve B B B b b mB mB B
B N. frigidu Grunow in Cleve et Grunow B mB mB mB B N. gelidu Cleve et Grunow in Cleve et Moller t mB mB mB
B b B
N. gruendleri Grunow in Cleve B B mB tmB mB N. grunowii Hasle b b b b B B
B N. hybrida Grunow in Cleve et Grunow B B B tmB b tMB tmB N. luevissima Grunow in Cleve et Moller B b B B tmB
m tmB tmB mB
N. lunceolutu var. pygmaeu Cleve B N. lecointei Van Heurck b b b b b b N. lineuris (Agardh) Wm. Smith b
mb mb tm B
N. lineutu Hasle B b B
b B
b N. longissima (Brkbisson in Kiitzing) Grunow b tmB N. marginulutu Grunow in Cleve et Moller b N. obliquecosturu (Van Heurck) Hade b N. Polaris Grunow in Cleve et Moller B B B B tmB B tmB tmB tmB N. seriatu Cleve tmB B B tb N. tergestinu (Kiitzing) Ralfs in Pritchard Pinnuluriu umbigua Cleve b b b b b b b P. quadruturea (Schmidt) Cleve _, b tm mb P. quadruturea var. bicontructu (Ostrup) Heiden in
P . quadrurureu var. bicuneuta Heiden et Kolbe P. quadrutureu var. constrictu (Ostrup) Heiden in
P . quadrutureu var. cuneutu (Ostrup) in Schmidt et a1 P. quadruturea var. densestriutu Cleve b b b
m
P. quadruturea var. leptostuuron Cleve b b P . quadrutureu var. maxima (Ostrup) Boyer b b b
tmb mb b
b P . quadratureu var. minima (Ostrup) Boyer b b b b b b mb P. quadrutureu var. stwrbergii (Cleve in Cleve et
Grunow) Cleve b B b B t B b tmB tmb mb P. quadruturea var. subconstrictu (Ostrup) Heiden in
Schmidt et al b m m P. quadrutureu var. subcontinua (Cleve) Cleve b b b mb Plugiogrummu stuurophorum (Gregory) Heiberg t b b
Station
B
tmB mB b B B mB
Schmidt et al b b b b tmB B tmB mB b b m tmB mb
Schmidt et al b b b b tmB B tmB tmB

Pleurosigma angulutum (Quekett) Wm. Smith P. antarcticum Heiden et Kolbe P. clevei Grunow in Cleve et Grunow P. cuspidarum (Cleve) H. Peragallo P. elonguturn var. karianum (Grunow in Cleve et
P. longum Cleve P. murinum Donkin P. stuxbergii Cleve et Grunow P. shubergii var. minor Grunow P. shubergii var. rhomboides (Cleve in Cleve et
Grunow) H. Peragallo Rhabdonema arcuatum (Lyngbye) Kiitzing R. minurum Kiitzing Stenoneis inconspicua var. baculus (Cleve in Cleve et
MOller) Cleve Surirellu japonica A. Schmidt in Schmidt et al S. oestrupi Gran Synedra camtschatica var. finmmarchica Cleve et
S. hyperborea Grunow S. hyperboreu var. rostelluru Grunow S. pulchellu (Ralfs) Kutzing S. tubdata (Agardh) Kiitzing S. tubulutu var. fasciculuru (Kutzing) Hustedt S. rabulata var. obrusa (Pantocsek) Hustedt Tabellaria fenestrara (Lyngbye) Kiitzing T. flocctdosa (Roth) Kiitzling Trachyneis aspera (Ehrenberg) Cleve Tropidoneis maxima (Gregory) Cleve T. muxima var. dubia (Cleve et Grunow) Cleve
Goniaular catenata Kofoid Cymrsodiniiwn Stein Peridiniwn Ehrenberg Prormentrum ovalis Rampi
Chlamydomonas ballenyanu Kol et Flint
Grunow) Cleve
Grunow
Dinoflagellates
Flagellates
b b b
b
b
B
b
b
b
B
b b
b b b B
b
b
b
b
b b
b b
b
b
b
b
B
B
b
b
b
b
b
b tmB mB B b mB tmB m E
mb B m
B t b F; w 0 s r Q mB tmB t B mB
nib tmB tmB k z b t b 4
t b B E n
mb b t
tmb
tmB mb ( B
b t
t b
t b t B
5 5 0 j: z
t tmb t
b t b
mb tmB tmB b
tmB b b b B b
b t b
Sea ice microalgae Eclipse Sound Eskimo Lakes
Station Frobisher Bay
Station Station I 2 3 4 508 515 5 5B I
Euglena geniculata Dujardin B E . proxima Dangeard Unidentified green flagellates
B tmB B tmB tmB B
Chrysophytes Chloridella glacialis Kol B
Phueocysfis pouchefii (Hariot) Lagerheim T TM
SEA ICE MICROALGAE IN THE CANADIAN ARCTIC 779
la cluthensis, N . salinarum, N . transfiga, Synedra hyperborea and S. hyperborea var. rostella) occurred only at the top of the sea ice. Notably there were 17 species (Chuetoceros septentrionalis, Amphiprora kjellmanii var. striolata, Cylindrotheca closterium, Diploneis litoralis var. arctica, Gomphonema exiguum var. pachycladum, Navicula crassirostris, N . directa, N . quadripedis, N . transitans, N . valida, Nitzschia cylindrus, N . diaphana, N . hybrida, N . laevissima, N . polaris, Pinnularia quadratarea var. bicontracta and P. quadratarea var. constricta) scattered throughout the entire thickness of the sea ice both in the Eskimo Lakes and in Frobisher Bay, while only four species (Achnanthes minutissima, Navicula pygmaea, Pinnularia quadra- tarea var. cuneata and Coscinodiscus polyacanthus) inhabited exclusively the middle of the sea ice. The species composition and distribution of microalgae in the Canadian arctic sea ice are presented in detail in Hsaio (1979a, b, c).
The vertical distribution of dominant species of microalgae in the Eskimo Lakes, Eclipse Sound and Frobisher Bay is listed in Table 1 . Highest counts of diatoms were found at the top of the ice at station 5B in Frobisher Bay in late May, with the greatest number of Nitzschia cylindrus the dominant species, occurring as 1.45 X los cells/L. In the middle of the ice at station 5 in Frobisher Bay in late May Nitzschia hybrida was dominant, as 1.45 X 10s cells&. In the bottom of the ice at station 4 in Eclipse Sound in late May, Nitzschiafrigida was dominant, comprising 193.07 X los cells/L. The most abundant flagellate found was an unidentified green flagellate with 1.45 x lo4 celldL in the top of the ice in early February and 6.16 x lo4 c e l l a in the middle of the ice at station 5B in Frobisher Bay in late May, and with 5.44 X 10s cells/L from the bottom of the ice at station 5 in Frobisher Bay in mid-May. Among euglenoid flagellates, the most abundant was Euglena proxima, with 2.18 X los cells/L, encountered only in the bottom of the ice at station 5 in Frobisher Bay in mid-and late-May. Phaeocysris pouchetii, with 2.03 x 10s cells/L in the top of the ice and with 3.52 X lo5 cells/L in the middle of the ice occurred at station 5B in Frobisher Bay in late May, but not in the bottom of the ice. Chloridella glacialis, with 29.73 X los cells&, was obtained only from the bottom of the ice at station 1 in Eclipse Sound in mid-May , and showed there the highest counts of chrysophytes found. Goniaulax catenata, in quantities of 3.3 x lo3, 7.3 x lo3 and 112Ox lo3 cells/L was found, respectively, in the top, middle and bottom of the ice at station 508 in the Eskimo Lakes in late May. It was the most abundant dinoflagellate.
Community Structure The ice flora of the Eskimo Lakes was dominated by the diatom community in
all but three samples out of 34, followed by dinoflagellates and flagellates. No chrysophytes were found in this region (Table 2). The largest numbers of species and cells of diatoms were found in the bottom of the sea ice,while the dino- flagellates and flagellates were rare and scattered through the entire thickness of the ice. Diatoms comprised more than 95.1% of the microalgae in the sea ice of Eclipse Sound (Table 3). A small number of species and cells of dinoflagellates and chrysophytes occasionally formed communities at the bottom of the sea ice. Ice diatoms appeared to be the largest community in the ice flora of Frobisher

Table 2. Standing stock and community structure of sea ice microalgae in the ,Eskimo Lakes
Station Sea ice Ice section Chl. a Total sea ice Diatoms Flagellates Dinoflagellates No. Date thickness from top to microalgae
(cm) bottom (cm) (mgm? (cellditre) %* No.** %* No." %* No.** ~
508 17 Mar72 I57
18 May 72 191
24 Nov 72
23 Feb 73
508 19 May 73
2 Mar 74
50
141
169
143
24 May 74 203
508
515 1 Mar 74 144
147-157 0-10
0-10 35-45 70-80
140-150 105-115
181-191 0-10
40-50
35-45 0-10
105-115 70-80
131-141 0-10
70-80 35-45
105-115 159-369
0-10 35-45 70-80
133-143 105-115
0-35 35-70 70-105
105-140 140-175 175-193 193-203 139-144
trace 3.14
trace 2.49
2.27 3.30
1.71 5.95
trace 1.18 0.23 0.60 0.36 0.65 0.84 0.50 0.32 1.24
57.02 I .28
0.11 0.47 0.23
0.45 0.44
0.38 0.10
trace trace 0.05
22.28 0.24
0.23
373,492 3,952,558
119,662 58,017
250,200 340,856 319,101
41,157,370 39,887
485,906
108,784 58,015
108,784 170,427 333,604 616.442 268,333 504,035
35,174,140 504,031
130,539 130,540 116,035
217,566 181,306
112.408 145,044 232,073 203,064
591,060 250,203
29,491,884
35.01tC11.7 OP23.3)
43.8( C12.5 P31.3) 74.3( C11.0 P63.3)
57.6( C 6.1 P51.5) 82.q C 4.4 P78.2) 93.q C 0 P93.6) 95.4( c 3.4 P92.0) 94.9( C 4.8 P90.1) 72.7( C 9.1 P63.6) 97.M C 1.5 P95.5) 75.01 C12.5 P62.5)
6O.M C 6.7 P53.3) 36.7( C 3.3 P33.4)
89.4( C 6.4 P83.0) 79.3( C25.0 P54.3)
94.M C 5.4 P89.2) %.5( C24.7 P71.8)
95.7( C 0.7 P95.0) 90.M C 4.3 P86.3) 99.2( c 4.3 P94.9) 91.7( C19.4 P72.3) 7 7 4 C 0 P77.8) 8 7 3 C 0 P87.5) 90.01 C 2.0 P88.0) 90.0( C 6.7 P83.3) 64.3 (212.9 P51.6) 7 2 3 C 5.0 P67.5)
67.9( C 3.6 P64.3) 6 2 3 C 4.7 P57.8)
93.3( C 8.0 P85.3) 8 5 3 C15.9 tP69.6)
95.7( C 6.2 P89.5)
41( C2 P39) 1qtc1 OP15)
2( co P2 ) 9( c1 P8 )
11( co PII) %CO P9)
45( C3 P42) 16( C1 PIS)
16( CI P15) 2( co I2 )
8(C1 P 7 ) 5( co P5 )
11( c1 P10) 15( CI P14) 17( C3 P14) 32( C4 P28)
26( c 1 P25) 18( C2 P16)
28( C2 P26) 61( C2 P59) 1q co P10) %CO P9) 9(co P9) 8( CO P8 )
16( C3 P13) 8 (C1 P 7 ) 9(C1 P 8 ) 7( c 2 P5 )
39( c2 P37) 7( c1 P 6 )
29( c 2 P27) 33( c 3 P30)
0
0 0
0 0 0 0 0.6 0 0 6.3 0 6.7 2.1 2.2
0 0
0.7 0 0 0 0 0 0 0
12.9
17.2 7.5
0 1.5 0.6 1.8 n
0 0 0 0 0 0 0
SPP. 0 0
SPP. 0
SPP. SPP. SPP.
0 0
SPP'
0 0
0 0 0
0 0
SPP. SPP. SPP.
0 SPP. SPP. SPP.
0
65.0 25.7 56.2 42.4 17.4 6.4 4.6 4.5
27.3
18.7 3.0
63.3 33.3 8.5
18.5
3.5 5.4 3.60 9.4 0.8
22.2 8.3
12.5
10.0 10.0
22.6 20.0
32.1 20.3
13.0 6.1 2.5
12.9
+ SPP. SPP .
SPP. SPP. SPP.
SPP. SPP.
+ SPP. SPP.
SPP. SPP.
SPP. SPP. SPP.
1 +spp.
SPP. SPP.
SPP. SPP. SPP. SPP. WP.
SPP. SPP.
SPP. I + spp. I + spp. I + spp.
SPP. SPP.
I + spp. I + spp.
I + spp. 25 May 74 186 181-186 29,154,648 97.6( C 2.7 P94.9) IS( C1 P14) 1.0 spp. 1.4 l+spp.
~~ ~ 112,408 87.1( C22.6 P64.5) 14( C2 P12) -
* Percentage of total sea ice microalgae ** Number of species t C = Centric diatoms 5 P = Pennate diatoms

Table 3. Standing stock and community structure of sea ice microalgae in Eclipse Sound
Station Sea ice Ice section Total sea ice Diatoms No. Date thickness from top to microalgae
Flagellates Chrysophytes Dinoflagellates
(cm) bottom (cm) (cells/litre) %* NO.'* %* NO.** %* NO.** %* NO.**
1 15 May 76 20 May 76 27 May 76 21 Mar 77
2 17 May 76 18 May 76 24 May 76
3 18 May 76 4 18 May 76
25 May 76
I82 1% 193 1 24
193 193 192
216 217
181-182 195-196 192- 193
0-1 61-62 123-124 192- 193 192-193 191-192
bottom 1 cm
215-216 216-217
62,736,113 95.l(tC11.6 BP 83.5) 91,664,798 100.W C 4.0 P 96.0) 110,700,616 99.91 C 1.9 P 98.0)
28,000 100.0( (37.1 P 42.9)
29,000 100.W C 0 P100.0) 4,000 100.w c 0 P100.0)
25,808,366 994 (213.5 P86.3) 2,349,764 100.W C 3.3 P96.7) 11,631,363 100.w C 3.4 m.6)
62,491,490 100.q C 1.8 P98.2) 127,319,753 100.0( C 1.8 P98.2) 160,229,950. 99.9f.C 1.3 iP98.6)
72(tC7 W65) 0.2 1 4.7 1 0 0
52( C4 P48) 0 0 0 0 <0.1 spp. 57( c4 P53) 0 0 0 0 0 0
6( Cl P5 ) 0 0 0 0 0 0 I ( co PI ) 0 0 0 0 0 0 10( c1 P9 ) 0 0 0 0 0 0
56( c3 P53) 0 0 0 0 0 0 56( c2 P54) 0 0 0 0 0 0
56( C3 P53) 0 0 0 0 0.2 spp.
69( C3 P66) 0 0 0 0 0 0 64( c2 P62) 0 0 0 0 0 0 65( C3 P62) 0 0 0 0 <0.1 spp.
el X m
* Percentage of total sea ice microalgae ** Number of species t C = Centric diatoms 0 P = Pennate diatoms

782 S. I . C. HSIAO
FIG. 2. Standing stock of sea ice microalgae in the Canadian Arctic.
Bay except for one sample (out of 54) dominated by chrysophytes (Table 4). Dinoflagellates frequently occurred with small numbers of species and cells. Flagellates formed the smallest community.
Generally, the ice flora of the Canadian Arctic consisted mainly of diatoms which were largely composed of pennate forms. Dinoflagellates, flagellates and chrysophytes were fewer in numbers of species and cells.
Standing Stock The standing stock results, as measured by both chlorophyll a and cell counts,
are presented in Tables 2-5 and Figure 2. The cell numbers in Canadian arctic sea ice varied from 3.99 X lo4 cells/L in the top of the ice in late November to 4.12 X lo7 cells/L in the bottom of the ice in mid-May at station 508 in the Eskimo Lakes; from 4.0 X 10’ cells/L in the middle of the ice in late March at station 1 to 1.6 X lo8 cells/L in the bottom of the ice in late May at station 4 in the Eclipse Sound; and from 5.8 X lo4 cells/L in the top of the ice at station 5B in late April to 7.2 X lo7 cells/L in the bottom of the ice in early May at station 1 in Frobisher Bay. Chlorophyll a ranged from a trace amount (undetected by spectrophoto- meter) in the top of the ice in late November to.57.02 mg/m’ in the bottom of the ice in mid-May at station 508 in the Eskimo Lakes, and from 0.19 mg/m3 in the top of the ice at station 1 in early May to 300.55 mg/m’ in the bottom of the ice in late May at station 5 in Frobisher Bay. The greatest numbers of cells and concentra- tions of chlorophyll a were found near the bottom of the sea ice.
Integrated standing stock, in terms of cell numbers and chlorophyll a per m2 over the whole ice column, showed that the standing stock started to build up from the time the ice formed in late fall. From initial values of 1 .OS x lo8 cells/m2 with chlorophyll a 0.023 mg/m2, there was a slow but steady increase through the winter months, followed by a dramatic increase in early spring. Maximum levels of 3.42 x 1Olo cells/m2, with a chlorophyll a value 7.58 mg/m2 were reached in late spring, and thereafter declined rapidly as ice melting occurred in early summer (Fig. 2).

Table 4. Standing stock and community structure of sea ice microalgae in Frobisher Bay
Station Scaice Icesection Chl. a Total seaice Diatoms Flagellates Chrysophytes Dinoflagellates No. Dste thickness fmmtopto microalgae
(cm) bottom (cm) (mghn') (cellditre) %* No." %* No.- %* NO.** %* No." 5 27 Apr71
27 May 71
3 June 71 9 June 71 17 May 72
22 Mar 73
29 May 73
5B 27 Apr 71
27 May 71
3 June 71 9 June 71
158
160
159
191 I58
168
195
163
166
160 158
35-45 0-10
70-80 105-1 15 148-158
0-8 37-45 72-80
107-115 152-160 151-159 150-158
0-10 181-191
0-10 35-45 70-80
105-1 15 140-150 158-168
0-8 36-44
106-114 141-149 187-195
0-10 35-35 70-80
105-115 153-163
37-45 0-8
72-80 107-115 158-166
150-158 152-160
1.11 2.51 0.85 1.93
252.76 1.09
0.66 0.31
300.55 0.19
189.72 68.31 - -
0.33 0.21 0.33 0.34
52.15 I .98
1.23 0.71 0.62 1.10
95.63 9.29 3.95 0.61
94.32 2.35
2.53 0.82 0.68 O.%
133.77 54.3 14.73
203,064 141,418
369,862 525,790
65,452,910 638,205 431,510 848,521
68,172,560 1,127,732
51,238,206 41,810,086
35,137,878 275,588
431,507 587,434
551,168
1,486,720 645,447
14,113,127 844,888
1,047,957 1,664,399
43,079,256 1,653,528
221,194
348,111 58,016
38,205,643 525,791
957,309 627,326 902,913
1,493,978 54,429,262 16,027,804 12,075,246
74.qtC33.4 OP41.0) 16(tC4 OP12) 80.4( C 5.4 F75.0) 21( C4 P17) 97.1( C 2.0 P95.1) 33( C2 P31)
98.7( C 6.3 P92.4) 76( C5 P71) 95.2( C 8.3 P86.9) 45( C4 P41)
97.7( C13.6 P84.1) 17( C2 PIS) 90.8( C 8.4 P82.4) 20( C1 P19) 973 C 9.8 P88.I) 32( C3 €29) 98.q C 9.3 P89.1) 61( C4 P57) 98.8( C 8.2 P90.6) 62( C3 P59) 9 7 3 C 7.2 p90.7) 64( C4 P60) 99.q c 4.9 P94.7) 5% c 4 PSI) 22.4( C 1.3 P 2 1 . 1 ) 24( C3 € 2 1 ) 9 7 4 C 6.1 P90.9) 65( C2 P63) 92.q C28.4 92.5( C 5.1 89.5( C 8.6 89.3( C 7.3 97.3( C 3.2 97.9( C 2.6 84.q c 9.9 87.9( C10.4 89.1( C 3.7 82.2( C 4.4 98.4( C 7.7 98.4( C13.1 62.5( C31.2 94.8( c 2.1 89.q C 7.6 99.6( C10.3 99.2( C 8.3 94.2( (212.1 98.8( C12.5 99.3( C13.8 98.q c 3.3 97.3( C 5.0 %.7( C 4.8
P64.2) 37( c 7 P87.4) 36( c 2 Pso.9) 4% c 4 P82.0) 47( c 4 P94.1) 57( c 2
€74.7) 3% c 4 P95.3) 68( c 3
F77.5) 43( c 4 P85.4) 5% C4 €57.8) 53( c 3 p90.7) so( c4 P85.3) 18( c 3 P31.3) 13( C2 P92.7) 3% C4 P82.0) 46( c 3 P89.3) 7% c 4 p90.9) 27C C2 P82.1) 22( c 3 ps6.3) 36( c2 P94.7) 61( C1 P85.5) 54( c 5
P92.3) 49( C2 P91.9) 51( C2
p34) "30)
P45) P43) P55) p65)
E P55) P50) €76) P15) PI 1) P3 1 ) P43) F75)
P19) €25)
P34) P49) p60) P47) P49)
0 0 0 0 0.5 0.6 2.5 0 0 0.5
0 1.1
0 2.2 0 0.8 0 0 0.5 0 0 2.8
0.5 0.9
0.5
0 12.5
0 0
0.2 0 0.6 0 0
2.7 1.2
0.9
0 0
0 0
I + spp. SPP. SPP.
0 SPP. SPP.
0 0 1
0 SPP. 0 0
SPP. 0 0
SPP. SPP. SPP. SPP. 0
SPP. 0 0
SPP. 0
SPP. 0 0
SPP. SPP. SPP.
0 .
0 0 0
0 0
0 0 0 0 0 0 0
50.0 0
0 0 0
0 0
0 3.9 2.4
15.8 6. I
0
0 0
0 3.5 0 0 0 0
0 0
0 0
0 0 0 0 0 0 0 0 0 0 0 0
0 1
0 0 0 0 0 0 I 1 1 I 0
0 0
0
0 1
0 0 0 0 0 0 0
25.6 19.6 2.9 4.8 0.8 1.7 6.7 2.1 1.6 0.7 1 .o
27.6 0.4
0.8
7.4 6.7
10.5 10.7 2.2 2.1
11.5 6.9 3.9 1.5 1.1 1.6
25.0 5.2 6.9 0.2 0.8 5.2
0.7 1.2
0.8 0 2.4
F n ti z 4
m EC
4 m W

,
station NO. Date thickness from top to
Sea ice k c section Chl. a Total sea ice Diatoms Flagellates Chrysophytes Dinoflagellates microalgae
(cm) bottom (Em) (~ng~m') (cells/litre) %* NO.** %'a. NO.*' %' NO." ?b* NO.*'
9 Feb 72 145 0-8
22 Mar 73 137-145
181 0-10 35-45 70-80
105415 "150 171-181
29 May 73 200 36-44 0-8
106-114 141-149 192-200
23 Mar 77 180 175-180 1 3 Mav 78 185 0-5
- 68,895 42.1( C31.6 P10.5) 2( C1 PI ) - 1,174,876 %.2( C12.0 P82.2) 2% C3 P26) 0.48 496,784 73.N C16.8 P56.2) 16( C3 P13) 0.19 663,586 82.N C16.9 P65.1) IS( C1 P14) 0.53 757,862 87.H C18.7 P68.9) 40( C5 P3S) 0.70 797,750 902% C25.0 P65.9) 51( C6 P45) 0.48
12.19 12,249,270 9 7 4 C 7.2 P89.8) 67( C2 P65) 924,662 95.7( C12.9 P82.8) 51( C7 P44)
1.62 576,558 50.3( C12.0 P38.3) 23( C6 P17) 1.25 823,137 91.2( C34.8 P56.4) 35( C7 P28) 1.79 1,519,359 67.3( C10.0 P57.3) 60( C7 P53)
56.15 37,531,170 99.q C 7.7 P91.3) 74( C3 P71) 1.63 1,171,247 %.O( C12.1 P83.9) 47( C5 P42)
7,397,448 %.O( C 6.4 P89.6) 57( CS P52) 0.19 576.556 95.01 c39.0 ~ 5 6 . m IO( CI p9
21.1 spp. 0 0 36.8 1.5 spp. 0 0 0 0
4.3 0
0 0 27.0
0 0 0
0.5 1 17.5 0
0 0 0 0 12.4 0
0 9.1
0 0 0
0 0
0 0
4.3 3.0
0.6 spp. 35.3 1 0
13.8 0 1.3 1 7.5
4.1 spp. 23.1 1 5.5 0 0 0
0 0
0 0 0
4.0 1 .o
2.0 spp. 0 0 2.0
SPP. SPP. SPP. SPP. SPP. SPP.
1 + spp. SPP.
1 i spp. 1 + spp.
1 + spp. SPP.
SPP.
SPP.
SPP ' SPP. SPP.
90-95 1.06 765;119 97.2( C 4.8 P92:;i) 1% Cl P18j 180-185 108.40 72,270,116 98.W C 2.1 P96.8) 24( CO P24) .. .~
0 0
0 0
0 0
0 5.0 0 2.8
0.8 spp. 0 0 0.3
** Number of species * Percentage of total sea ice microalgae
t C = Centric diatoms B P = Pennate diatoms
SEA ICE MICROALGAE IN THE CANADIAN ARCTIC 135
The standing stock of sea ice microalgae in the Eskimo Lakes, Eclipse Sound and Frobisher Bay was almost always dominated by species of pennate diatoms and had cell numbers greater than 1 million per litre (Hsiao 1979a, b, c). Navicula quadripedis, Nitzschia cylindrus, N. polaris and N . frigida were commonly found in these 3 regions. Other dominant species in both Eclipse Sound and Frobisher Bay were Amphiprora kjellmanii var. striolata, Amphora laevis var. laevissima, Gomphonema exiguum var. pachycladum, Nitzschia hybrida and N . seriata. Other abundant species occurring only in Eclips'e Sound included Amphiprora kryo- phila, Bacilluria paradoxa, Navicula granii, Nitzschia angularis, N . laevissima, N . tergestinu and N. lineata. Species occurring only in Frobisher Bay were Achnan- thes taeniata, Navicula transitans, Cylindrotheca closterium, Nitzschia distans var. erratica, N . grunowii and Rhabdonema minutum.
DISCUSSION
There were 196 species of microalgae found in the Canadian arctic sea ice with I89 species of diatoms making up the greatest cell abundance, and fewer species and a lesser abundance of flagellates, dinoflagellates and chrysophytes. Usachev (1949) listed 142 species of diatoms but few dinoflagellates, flagellates or green algae from the ice in the Kara and Laptev seas. He.designated 24 (three centric and 21 pennate) diatom species as typical cryophiles. All these typical cryophiles except Fragilaria islandica were also found in the Canadian arctic sea ice. Meguro et al. (1966; 1967) found 24 species of pennate diatoms, but no other algae, in the bottom of arctic sea ice off the Point Barrow area, Alaska. Nineteen of them, except Gomphonema exiguum var. arctica, Navicula gracilis var. inae- qualis, Nitzschia lavuensis, Pinnularia quadratarea var. capitata and Stenoneis incon- spicua, also commonly occurred in the sea ice of the Canadian Arctic. The pennate diatoms Nitzschiafrigida and Navicula marina were the most abundant species in the ice microalgal community in the Chukchi Sea at Barrow (Horner and Alexander, 1972; Clasby et al., 1976), but were not found in areas farther from shore (Meguro et al., 1966; 1967). These species were commonly dominant in this study. Other dominant species of diatoms are listed in Table 1 which includes all the species found by Horner and Alexander (1972).
In most samples (101 out of 105), the diatom community overwhelmingly exceeded the dinoflagellates, flagellates and chrysophytes. On only three occa- sions did the dinoflagellates exceed more than 50% of the total microalgal population in the top of the ice at station 508 in the Eskimo Lakes. In only one case did the chrysophytes exceed 50% of the populations in the top of the ice at station 5 in Frobisher Bay. Diatoms consisted largely of pennate forms in all three areas studied in the Canadian arctic sea ice, while centric forms formed only a small percentage of the total population except for two (out of 105) samples. In these, centric forms were 14.2% and 21.1% more numerous than pennates in the top of the ice at stations 5B and 1 in Frobisher Bay and in Eclipse Sound, respectively. Allen (1971) stated that small pennate diatoms principally represented the ice community at high latitudes. Horner and Alexander (1972) found only pennate diatoms occurring in Chukchi sea ice. Later, Horner (1976) observed several species of Chaetoceros and Thalassiosira, centric diatoms,

786 S. I . C. HSIAO
occurring in an ice microalgal community dominated by pennate diatoms and small flagellates, in the sea ice at Barrow. Grant and Horner (1976) collected Coscinodiscus lacustris from ice in the nearshore Beaufort Sea. Of the diatoms identified in the sea ice samples from the Eskimo Lakes, Eclipse Sound and Frobisher Bay, the order of importance of the genera of pennate diatoms, in terms of standing stock, were Navicula, Nitzschia and Pinnularia. Centric diatom genera of lesser importance included Chaetoceros and Thalassiosiru. Next to the diatoms in abundance and importance were the dinoflagellates represented by Goniaulax catenata, the flagellates by Euglena proxima and unidentified green flagellates, and the chrysophytes by Chloridella glacialis and Phaeocystis pouch- etii. Species other than diatoms were not found commonly at Barrow (Horner and Alexander, 1972). In the Antarctic, most of the sea ice microalage were diatoms (Bunt and Wood, 1963; Buinitsky, 1968).
The sea ice microalgal communities developed from late fall at the time of the ice formation, through the winter, and increased rapidly in spring until the ice disappeared. The melting fast ice promoted the growth of microalgae by increas- ing available light, nutrients and low-salinity water (McRoy and Goering, 1974; Grainger, 1977; Tsurikov and Vedernikov, 1979), with maximum standing stock being reached just prior to the thaw period. The dominant species of microalgae in the bottom of the ice differed from those found in the top and middle. The shade-adapted microalgae grew well in a very small amount of light energy reaching to the bottom of the sea ice after being almost completely absorbed by snow cover, sea ice and flora lying above (Tsurikov and Vedernikov, 1979). The growth was inhibited by the higher light intensities in the upper layer as a result of photo-oxidation of photosynthetic algal pigments, particularly as the over- lying snow melted (Apollonio, 1961; Bunt, 1964; Burkholder and Mandelli, 1965; Tsurikov and Vedernikov, 1979).
The standing stock of microalgae in the top of the ice increased from 4.0 X lo4 cells/L with a trace amount of chlorophyll a in late November to 9.6 X 10⁵ cells/L with chlorophyll a 2.53 mg/m3 in late May; in the middle of the ice it increased from 1.09 x lO'celldL with chlorophyll a 0.36 mg/m3 in late February to 3.41 X 1(Y celldL with chlorophyll a 2.27 mum3 in mid-May; in the bottom ice it increased from 2.17 x 1(Y cells/L with chlorophyll a 0.45 mg/m3 in early March to 6.82 X lo7 cells/L with chlorophyll a 300.55 mg/m3. Concentrations varied greatly depend- ing upon the time of year, station locations and portions of the ice core sampled. The integrated standing stock found in the sea ice increased in quantity from 1.05 x 10" cells/m2 with chlorophyll a 0.023 mg/mz in November to 3.42 X 10'' celldm' with chlorophyll a 7.58 mg/m2 in late May. Such standing stock was comparable to the amount found in the arctic sea ice of Jones Sound, N.W.T. (Apollonio, 1961; 1965), at Point Barrow, Alaska (Meguro et al., 1966; 1967; Alexander etal., 1974), and in the Bering Sea (McRoy and Goering, 1974), and in the Antarctic fast ice (Buinitsky, 1977), but it was at least one to two orders of magnitude greater than that of phytoplankton in the underlying waters (Hsiao, 1979c), and also higher than that of phytoplankton blooms in some productive seas of the northern hemisphere (Bursa, 1961; Thordardottir, 1973; Throndsen and Heimdal, 1976; Hsiao et al., 1977; Hsiao and Trucco, 1980). Standing stock,

SEA ICE MICROALGAE IN THE CANADIAN ARCTIC 787
consisting mostly of species of Navicula and Nitzsrhic, with Navicula quadripedis and Nitzschia frigida being the most abundant, was low in late fall through winter, increased in early spring to blooms in late spring or early summer, and then declined as the sea ice melted.
Live microalgae within seasonal shore-fast ice in the study areas lasted eight to nine months a year, starting from newly formed sea ice in late October that thickened through the winter months to about 2 m by early June. Microalgal cells were present in the ice from the time it formed, but they were few in number and scattered through the entire thickness of the ice so that no visible layer of organisms was present. By late March a relatively large population existed in the ice and by late April or May a thin layer was visible on the bottom of the ice. The number of cells increased and the layer developed colored bands ranging from greenish-brown to dark brown, concentrated in approximately the bottom 2 cm.
The bottom ice layer of 1-2 cm was relatively soft, and consisted of a relatively loosely aggregated matrix of large, platelet ice crystals oriented verti- cally in which many micro- and mega-fissures were encased; within these fissures were brine solutions and air pockets (Pounder, 1965; Meguro et al., 1967). The sea ice in nature is virtually never in an equilibrium state and most of its physical properties depend on the brine content (Pounder, 1965). The brine content varies with time because of both temperature and salinity changes. The ice-air interface (top of the ice) is colder than the bottom of the ice sheet, which is fixed at the freezing point of the seawater. Because of diffusion, the concentra- tion of brine within the cell is uniform and of a salinity to match the mean temperature of the ice surrounding the cell. Hence at the warmer end the brine is too concentrated and will dissolve ice to reduce its concentration. At the colder end more ice freezes to increase the brine concentration, and the net effect is to move the entire cell of brine along the gradient in the direction of higher temperature. In a sea ice cover the brine migration acts in the same direction as brine drainage so that the two effects are additive. Both processes take place slowly during the winter months. Brine drainage is quite rapid when the ice approaches its melting point during the warmer months of spring and summer (Pounder, 1965).
A high nutrient content occurs in the brine pockets and fissures in which the microalgae live and form colonies. The brine is in a quasi-crystalline (ice-like) state and acts as a strong biological stimulant to algal growth (Buinitsky, 1977). Thus the bottom layer was the main area of distribution and had the largest quantity of microalgae. The numbers of microalgae varied from 2.18 x 10s to 1.6 X 10⁸ cells/L. In contrast, the top ice layer was relatively thick, dense, compact and hard because its temperature was colder than the bottom ice resulting in brine cells, cut off from each other and from the sea, that decreased in size to smaller diameters or even migrated downward to the bottom. Salinity and nutrients subsequently declined. The cell numbers ranged between 2.8 x lo4 and 9.57 X lo’ cells/L, and were ten to a hundred times fewer than the bottom ones.

4 m m
Table 5 . Standing stock and community structure of sea ice microalgae and phytoplankton in the underlying water in Frobisher Bay
Station Sea ice Sample type Chl. a Total cell No. Date thickness
(cm) (ms/m’) NosJlitre %* No.** %* No.** %’ No.** 5B 23 Mar77 180 Ice core bottom 5cm -
Surface water 7,397,448 %.O(tC 6.4 4P89.6) 57(tC5 5P52) 2.0 spp. 2.0 spp.
1 3 May 78 185 Ice core top 5cm 37,109 95.4( C 8.6 P86.8) 7( C2 P5 ) 0.6 spp. 4.0 spp.
0.19 1.06
576,556 95.0( C 3.9 P56 ) IO( C1 P9 ) 0 765,119 97.2( C 4.7 P92.5) 19( C1 P18) 0
0 Ice core middle 5cm
5.0 spp. 0
Ice core bottom 5cm 108.40 72,270,116 98.9( C 2.1 P96.8) 14( CO P14) 1.4 spp. 0.3 spp. 2.8 spp.
Diatoms Flagellates Dinoflagellates
-
Surface water 2.12 1,958,141 100.0( C 0.9 P99.1) 8( CO P8) 0 0 0 0 0.32 5m 184,932 98.0( C31.4 P66.6) 4( CO P4) 2.0 spp. 0
10m 0.29 170,426 9 3 4 C14.9 P78.7) 4( CO P4 ) 0 0
15m 0.42 105,156 100.0( C10.3 P89.7) 3( CO P3 ) 0 0 6.4 spp.
20m 0.22 0 0 0
105,156 l00.0( C34.5 P65.5) 4( C1 P3 ) 0 25-11 76,147 100.0( C19.1 P80.9) 5( CO P5 ) 0
0 0 0 0.31 0 0 0
* Percentage of total sea ice microalgae
t C = Centric diatoms 0 P = Pennate diatoms
** Number of species

SEA ICE MICROALGAE IN THE CANADIAN ARCTIC 789
Nutrients were always sufficient to support the growth of microalgae in the ice of the Eskimo Lakes and Frobisher Bay (Grainger, 1975; 1977; 1979). They were also plentiful in ice in other areas of the Arctic (Meguro et al., 1967; Oradovskiy, 1972; Alexander, 1974) and in the Antarctic (Oradovskiy, 1974; Buinitsky, 1977). These nutrients were possibly supplied from desaltation of sea ice, exchange with seawater under the ice, and in situ regeneration due to the active microbial populations (Meguro et al . , 1967; Alexander et al., 1974). Microalgae entrapped over winter in persistent ice due to freezing of seawater could remain viable for long periods in the dark without an external additional carbon source (Bunt and Lee, 1972). Rodhe (1955) demonstrated that microalgae had the dual ability of auto-and hetero-trophic growth to enable them to survive the extended darkness of winter by assimilating dissolved organic substances or extracellular products synthesized during growth in the previous light period. Recently, Mel'nikov and Pavlov (1978) found that organic carbon concentrations were higher in ice than in water in the Arctic Basin. They supported Rodhe's observation that dissolved and suspended organic carbons in ice seem to play an important role in the survival of microalgae during the polar winter.
The sea ice microalgae grew and spread in the continuously low temperature, variable salinities and a quite remarkable set of light fields, together with spa- tially and temporally variable and discontinuous physical-chemical conditions. Unfortunately, the temperature of sea ice was not measured in this study. Minimal surface seawater temperatures under the ice in the Eskimo Lakes, Eclipse Sound and Frobisher Bay during winter months were -1.2"C, -1.6"C and -1.7"C, respectively, whereas the air temperatures were between -20°C and -30°C. Most arctic environments have a comparable temperature regime in the winter months. Meguro et al. (1967) found that the temperature of the microhabi- tat in the brine cells within 5 cm of the bottom sea ice was stable at about -1.75"C in ice 2 m thick at Point Barrow, Alaska. They concluded that this microhabitat was neither a closed frozen system to supply nutrients nor a completely inactive biochemical environment owing to the extremely low temperature.
Ice formation and melting affect the salinity and available nutrients (Grainger, 1977). The salinity at the bottom of the ice ranged from 2"/- to lo"/- in Frobisher Bay and Eskimo Lakes. Microalgae were potentially exposed to high ranges of salinities up to 45"/- in the brine cells near the bottom of the sea ice in winter in the Barrow area (Meguro et al., 1967), and to very low salinities as early summer melt water mixed with the surface water producing a range of OS"/=- to 7"/-, averaging about 4"/- in Frobisher Bay (Grainger, 1977). Grant and Homer (1976) reported that arctic ice diatoms were able to grow in a wide range of salinities between 5"/- and 60°/-, and tolerate well the brine-cell salinities. Meguro et al. (1967) suggested that salinity was probably the most important factor limiting the upper extent of the microalgae in the sea ice. However, with low summer salinities below 5"/- resulting from prolonged periods of melting ice, the pig- mentation of Antarctic ice diatoms changed from the normal yellow-brown to pale bluish-green (Whitaker, 1977), and was probably not the major cause of the disappearance of the ice microalgal bloom (Grant and Homer, 1976). Apollonio (1965) found that the loss of the epontic community was more closely related to a
r

790 S . I . C. HSlAO
marked increase in light intensity within the ice as the overlying snow melted and shade-adapted ice microalgae could not tolerate the higher light intensities.
During the ice period, in late autumn and early spring the sun is low on the horizon and the days are short, while winter months are essentially sunless. From late spring onwards, day length increases and in summer the sun remains overhead 24 hours daily while the sea is still covered with about 2 m of ice and often snow as well. The effect of light on life processes is indeed significant. Sea ice is itself a strongly scattering medium and is definitely not a homogeneous material. It is commonly illuminated by natural sunlight at a very low angle. Moreover, the cloudy conditions which often prevail in the polar regions result in further diffusion and scattering of the available light. Light transmission through in situ sea ice is determined not only by its intensity, angle of incidence, surface reflection, snow cover and ice conditions but also by the biological activities of epontic communities. It is a widely held veiw that the photic zone extends to the depth at which illumination has fallen to 1% of its value at the surface. Many of the sea ice microalgae are able to make slow but effective growth at intensities several orders of magnitude lower than this. Their ranges may be extended further still if provided with appropriate organic substrates.
Light intensity under the ice in Frobisher Bay measured by Grainger (1979) was less than 5 ft-c in January and March with the snow cover between 3 and 45 cm, while surface light was about 770 ft-c. In late April and May, with the snow cover about the same as earlier, surface light reached as high as 1300 ft-c and the light under the ice increased to between 5 and 10 ft-c. At this period a colored layer of microalgae appeared at the bottom of the ice. Grainger (1977) also indicated that the maximum ice flora activity probably occurred at between about 10 and 50 ft-c, before loss by melting began. In June the snow cover on the ice disappeared, whereas light beneath the ice rose to between 50 and 75 ft-c. Apollonio (1965) reported that light intensity reaching the bottom of the ice in Jones Sound near Devon Island was less than 20 ft-c at the time of the maximum chlorophyll development, while English (1961) considered the compensation intensity for microalgae recovered from beneath arctic pack ice to lie between 20 and 200 ft-c. Clasby et al. (1973) indicated that the minimum light requirement for primary productivity of arctic sea ice microalgae was about 6 ft-c. In the Antarctic, the sea ice microalgae were light saturated at 100 ft-c, photosynthesis inhibited at 1100 ft-c and compensation intensity was about 2.5 to 7 ft-c (Bunt, 1964; 1%8). Apparently light is the primary limitation to the development of the epontic community in polar waters. Buinitsky (1968) found that sea ice microal- gae absorb radiation passing through the ice and thereby promote the more rapid melting and breakup of the ice. A sudden marked increase in under-ice illumina- tion would damage the epontic community coincident with deterioration in the lower layers of the sea ice.
Sea ice is a very favorable medium for the existence and development of microalgae (Buinitsky, 1977). Under favorable conditions, the microalgae start to grow from where they are trapped. They are distributed in different ways in the ice. Most frequently they form horizontal layers at the bottom of the arctic sea ice. This is possibly due to the fact that the largest brine drainage channels

SEA ICE MICROALGAE IN THE CANADIAN ARCTIC 79 1
are located near the bottom of the ice and extend downward to the ice-water interface. They also show horizontal migration in these layers (Lake and Lewis, 1970; Eide and Martin, 1975). In the Antarctic sea ice, some microalgal popula- tions form as individual patches which are irregularly distributed throughout the entire ice thickness, and as clearly outlined horizontally elongated “strings”, “veins” or “trunks” (Buinitsky, 1968). Sometimes these typesof strings, veins and trunks run vertically and/or obliquely riddling the ice from its lower to its upper surface. It is clear that the microalgal distribution and growth in the seaice are probably determined by the orientation and length of fissures and capillary drainage channels that riddle the ice as well as by available nutrients and light. The movement of microalgae in the ice is closely associated with the mechanism of brine migration.
The peak of the sea ice microalgal bloom takes place about late May or early June just before the sea ice melts and erodes away. In mid-June ice melting then begins and continues until the sea is free of fast ice soon after mid-July . The rapid disappearance of the Microalgal layer is probably caused by a combination of melting ice, which results.in low salinity and increased light intensity, and brine drainage along with tidal currents that wash away the soft bottom ice.
ACKNOWLEDGEMENTS
I amgrateful to J. Lovrity, R. Harland, J . Walbridge, B. Petolas and H. Steltnerfor their efforts to collect the phytoplankton and sea ice microalgal samples, to D. Lussier-Brown for her very able technical assistance. and to Dr. E. H. Graingerfor his helpful criticism of the manuscript.
REFERENCES
ACKLEY, S.F., BUCK, K.R. and TAGUCHI, S. 1979. Standing crop of algae in the sea ice of the Weddell sea region. Deep-sea Research 6A:269-281.
ALEXANDER, V. 1974. Primary productivity regimes of the nearshore Beaufort Sea, with refer- ence to potential roles of ice biota. In: Reed, J . C. and Sater, J. E. (eds.). The Coast and Shelf of the Beaufort Sea. Arlington, Virginia: Arctic Institute of North America. 609-635.
-, HORNER, R. and CLASBY, R.C. 1974. Metabolism of arctic sea ice organisms. IMS Report R74-4, Institute of Marine Science, University of Alaska, Fairbanks. 120 p.
ALLEN, M.B. 1971. High latitude phytoplankton. Annual Review of Ecology and Systematics
ANDRIASHEV, A.P. 1%8. The Problem of the life community associated with Antarctic fast ice. In: Cume, R. I. (ed.). Symposium on Antarctic Oceanography. Cambridge: Scott Polar Research Institute. 147-155.
2~261-276.
APOLLONIO, S. 1961. The chlorophyll content of arctic sea-ice. Arctic 14:197-200. -. 1%5. Chlorophyll in arctic sea ice. Arctic 18:118-122. BUINITSKY, V.Kh. 1968. The influence of microalgae on the structure and strength of Antarctic
sea ice. Oceanology 8:771-776. -. 1977. Organic life in sea ice. In: Dunbar, M. J . (ed.). Polar Oceans. Proceedings
SCOWSCAR Polar Oceans Conference, Montreal, May 1974. Calgary, Alberta: Arctic Institute of North America. 301-306.
BUNT J.S. 1964. Primary productivity under sea ice in Antarctic waters. 2. Influence of light and other factors on photosynthetic activities of Antarctic marine microalgae. Antarctic Research Series 1:27-31.
-. 1%8. Some characteristics ofmicroalgae isolated from Antarctic seaice. Antarctic Research Series 11:l-14.

792 S. I . C. HSIAO
- and WOOD, E.J.F. 1963. Microalgae and Antarctic sea-ice. Nature 19:1254-1255. BUNT, J.S. and LEE, C.C. 1972. Data on the composition and dark survival of four sea-ice
microalgae. Limnology and Oceanograph 17:458-461. BURKHOLDER, P.R. and MANDELLI, E.F. 1965. Productivity of microalgae in Antarctic seaice.
Science 149:872-874. BURSA, A S . 1961. The annual oceanographic cycle at Igloolik in the Canadian Arctic. 11. The
phytoplankton. Journal of the Fisheries Research Board of Canada 18563-615. CLASBY, R.C., HORNER, R. and ALEXANDER, V. 1973. An in siru method for measuring
primary productivity of arctic sea ice algae. Journal of the Fisheries Research Board of Canada
CLASBY, R.C., ALEXANDER, V. and HORNER, R. 1976. Primary productivity of sea-ice algae. In: Hood, D.W. and Burrell, D.C. (eds.). Assessment of the Arctic Marine Environment: Selected Topics. Fairbanks: Institute of Marine Science, University of Alaska. 289-327.
CLEVE, P.T. 1883. Diatoms collected during the Expedition of the Vega. Vega-Expedition Veten- skapliga Iakttagelser 3:455-517.
-, 1884. On the diatoms collected during the Arctic Expedition of Sir George Nares. Journal of the Linnean Society (Botany) 20:313-317.
__. 1896. Diatoms from B a f h s Bay and Davis Strait collected by M. E. Nilsson. Bihang till
-. 1898. Diatoms from Franz Josef Land collected by the Harmsworth-Jackson Expedition. Bihang Till K. Svenska Vetenskaps-Akademiens Handlingar Band 24, Afd,,3, No. 2 .26 p.
-. 1899. Mikroskopisk undersokning af stoft, funnet pH drifis i Ishafvet. Ofversigt af Kongl. Vetenskaps-Akademiens Forhandlingar 56: 123-130.
-. 1900. Microscopical examination of dust from drift-ice north of Jan Mayen. Ofversigt af Kongl. Vetenskaps-Akademiens Forhandlingar 57:393-397.
-and GRUNOW, A. 1880. Beitr’dge zur Kenntniss der arctischen Diatomeen. Kongl. Svenska Vetenskaps-Akademiens Handlingar Band 17, No. 2. 121 p.
COACHMAN, L.K. and AAGAARD, K. 1974. Physical oceanography of arctic and subarctic seas. In: Herman, Y. (ed.). Marine Geology and Oceanography of the Arctic Seas. New York: Springer-Verlag. p. 1-72.
DICKIE, G. 1878. On the algae found during the Arctic Expedition. Journal of the Linnean Society
EHRENBERG, C.G. 1853. Uber neue Anschauungen des Kleinsten nordlichen Polarlebens. Akademie der Wissenschaften, Berlin. Bericht iiber die zur bekannt-machung geeigneten Verhandlungen 1853522329.
EIDE, L.I. and MARTIN, S. 1975. The formation of brine drainage features in young sea-ice. Journal of Glaciology 14:137-154.
ENGLISH, T.S. 1%1. Some biological oceanographic observations in the central north Polar Sea, Drift Station Alpha, 1957-1958. Arctic Institute of North America Research Paper No. 13.80 p.
FOY, M.G. and HSIAO, S.I.C. 1976. Phytoplankton data from the Beaufort Sea, 1973 to 1975. Fisheries and Marine Service Technical Report No. 617. Environment Canada. 44 p.
GRAINGER, E.H. 1971. Biological oceanographic observations in Frobisher Bay I . Physical, nutrient and primary production data, 1967-1971. Fisheries Research Board of Canada Technical Report No. 265. 75 p. -. 1975. A marine ecology study in Frobisher Bay, Arctic Canada. In: Cameron, T. W. M. and Billingsley, L. W. (eds). Energy flow - its biological dimensions. Ottawa: The Royal Society of Canada. 261-266.
-. 1977. The annual nutrient cycle in sea-ice. In: Dunbar, M.J. (ed). Polar Oceans. Proceedings SCOWSCAR Polar Oceans Conference, Montreal, May 1974. Calgary, Alberta: Arctic Institute of North America. 285-299.
-1979. Primary production in Frobisher Bay, Arctic Canada. In: Dunbar, M. J. (ed). Primary Production Mechanisms. International Biological Programme 20. Cambridge University Press.
-, LOVRITY, J.E. and EVANS, M.S. 1977. Biological oceanographic observations in the Eskimo Lakes, Arctic Canada: physical, nutrient and primary production data, 1961-1975. Fisheries and Marine Service Technical Report No. 685. Environment Canada. 108 p.
GRAN, H.H. 1897. Bacillariaceen vom Kleinen Karajakfjord. Bibliotheca Botanica 42:13-24. -. 1904. Diatomaceae from the ice-floes and plankton of the Arctic Ocean. In: Nansen, F. (ed).
GRANT, W.S. and HORNER, R.A. 1976. Growth responses to salinity variation in four arctic ice
30:835-838.
K. Svenska Vetenskaps-Akademiens Handlingar Band 22, Afd. 3, No. 4. 22 p.
(Botany) 17:6-12.
9-30.
The Norwegian North Polar Expedition, 1893-18%. Scientific Results 4(11):1-74.
diatoms. Journal of Phycology 12:180-185.
SEA ICE MICROALGAE IN THE CANADIAN ARCTIC 793
HORNER, R.A. 1976. Sea ice organisms. Oceanography and Marine Biology A n n d Review
-. 1977. History and recent advances in the study of ice biota. In: Dunbar, M. J. (4). Polar Oceans. Proceedings SCOWSCAR. Pdar Oceans Conference, Montreal, hkay t974. Calgary, Alberta: Arctic Institute of North America. 269-283.
-and ALEXANDER, V. 1972. Algal populations in arctic sea-ice: an investigation of hetero- trophy, Limnology and Oceanography 17:454-458.
HSIAO, S.I.C., FOY, M.G. and KITTLE, D.W. 1977. Standing stock, community structure, species composition, distribution and primary production of natural populations ofphytoplank- ton in the southern Beaufort Sea. Canadian Journal of Botany 55:685-694.
HSIAO, S.I.C. 1979a. Sea ice microalgd data from Eclipse Sound, 1976 and 1977. Fisheries and Marine Service Data Report No. 131. Fisheries and Environment Canada. 34 p.
-. 1979b. Sea ice micrdgal data from the Eskimo Lakes, 1972 to 1974. Fisheries and Marine Service Data Report No. 146. Fisheries and Environmental Canada. 43 p.
-. 1979c. Phytoplankton and sea ice micrdgal data from Frobisher Bay, 1971 to 1978. Fisheries and Marine Service Data Report No. 155. Fisheries and Environment Canada. 82 p.
-andTRUCCO, R.G. 1980. Phytoplankton. In: A marine biological studyofBrevoort Harbour and nearby waters of Eastern B a t h Island. Canadian Manuscript report of Fisheries and Aquatic Sciences No. 1557. Arctic Biological Station, Ste. Anne de Betlevue, Quebec. 17-49 Appendix
LAKE, R.A. and LEWIS, E.L. 1970. Salt rejection by sea ice duringgrowth. JoumalofGeophysical
MEGURO, H. 1%2. Plankton ice in the Antarctic Ocean. Antarctic Record 1 4 1192-1 199. -, ITO, K. and FUKUSHIMA, H. 1%. Diatomsand the ecdogicai conditions of theirgrowth
in sea ice in the Arctic Ocean. Science 152:1089-1090. -. 1%7. Ice flora (bottom type): A mechanism of primary production in polar stxu and the
growth of diatoms in sea ice. Arctic 20:114-133. MEL’NIKOV, LA. and PAVLOV, G.L. 1978. Characteristics of organic carbon distribution in the
waters and ice of the Arctic Basin. Oceanology 18:163-167. McCONNAUGHEY, T. and McROY, C.P. 1979. Food-web structure and the fractionation of
carbon isotopes in the Bering S e i . Marine Biology 53257-262. McROY, C.P. and GOERING, J.J. 1974. The infivence of i c e on the primary productivity of the
Bering Sea. In: H W , D. W. and Kelley, E. 3. (eds). Oceanography of the Bering Sea. Fairbanks: ,. Institute of Marine Science, University of Aiaska. 403-421. -. 1976. Annual budget of primary production in the Bering sea. Marine Science Communica-
ORADVOSKIY, S.G. 1972. Studies on the composition of nutrients in the ice of the Barents Sea. (In
-. 1974. Investigation ofthe chemical composition of Antarctic sea ice. Oceanology 14:5054. @STRUP, E. 1895. Marine Diatom& fra p)Stgr@nland. Meddeklser om Gr@niand 18397-476. POUNDER, E.R. 1965. The physics of ice. Oxford: Pergamon Press. RODHE, W. 1955. Can plankton production proceed during winter darkness in subarctic lakes?
International Association of the Theoretical and Applied Lilogy Proceedings 12:117-122. STRICKLAND, J.D.H. and PARSONS, T.R. 1972. A practid handbook of seawater analysis.
Fisheries Research Board of Canada Bulletin 167: 1-310. TH6RDARD6TTIR, T. 1973. Successive measurements of primary production and composition of
THRONDSEN, J. and HEIMDAL, B.R. 1974. Primary production, phytoplankton and l i t in phytoplankton at two stations west of Iceland. Norwegian Journal of Botany 20257-270.
Straumsbukb near TromN. Astarte 951-60. TSURIKOV, V.L. and VEDERNIKOV, V.I. 1979. Photosynthesis of algae in ice. Soviet Journal of
Marine Biology 4(3):637-643. USACHEV, P.I. 1938. Biological analysis of ice-floes. Comptes Rendus (hklady) de L’Acadkmie
des Sciences de L’URSS 19645-648, -. 1949. The microflora of arctic ice. (In Russian). Trudy Instituta Okeambgii 3:216-259. WHITAKER, T.M. 1977. Sea ice habitats of Signy Island (South Orkneys) and their primary
productivity. In: Llano, G.A. (ed.). Adaptations within Antarctic ecosytems. Proceedings ofthe Third SCAR Symposium on Antarctic Biology, Smithsonian Institution, Washington. 75-82,
14:167-182.
11: 139-157.
Research 75583-597.
tions 2~255-267.
Russian). VNIRO Trudy 75:65-73.