quantitative interpretation of mineralogical composition ... · quantitative interpretation of...
TRANSCRIPT

Quantitative Interpretation
of Mineralogical Composition
from X-ray and Chemical
Data for the Pierre Shale
G E 0 L 0 G I C A L SJJ R V E Y P R 0 FE S S I 0 N A L PAPER 3 9 1-C


Quantitative Interpretation
of Mineralogical Composition
from X-ray and Chemical
Data for the Pierre Shale By LEONARD G. SCHULTZ
ANALYTICAL METHODS IN GEOCHEMICAL INVESTIGATIONS OF THE PIERRE SHALE
GEOLOGICAL SURVEY PROFESSIONAL PAPER 391-C
Derivation, reproducibility, and accuracy of modal analyses and calculation of composition
of montmorillonitic components
UNITED STATES GOVERNMENT PRINTING OFFICE, WASHINGTON : 1964

UNITED STATES DEPARTMENT OF THE INTERIOR
STEWART L. UDALL, Secretary
GEOLOGICAL SURVEY
Thomas B. Nolan, Director
For sale by the Superintendent of Documents, U.S. Government Printing Office Washington, D.C. 20402
CONTENTS
Abstract-------------------------------------------Introduction.--------------------------------------X-ray analysis ________ --_--_--_----- _________ -------
Sample preparation and treatment _______________ _
Interpretation----------------------------------Whole rock data ___________________________ _
Carbonate minerals.--------- _____ -----_ Disordered cristobalite _________________ _ Total clay minerals __ -------- __________ _
Clay fraction data_------------- __ ------- __ _ Clay minerals present __ -----------------Comparison of X-ray peak sizes _________ _ Estimation of kaolinite and chlorite ______ _
Examples of interpretation __________________ _
ReproducibilitY-------------------------------------Long-term reproducibility----- __________________ _
Accuracy-comparison with chemical analyses _________ _ Sulfide, sulfate, and carbonate minerals ___________ _
Page
C1 1 2 2 2 2 2 4 5 5 5 6 8 9
12 16 17 17
Accuracy-comparison with chemical analyses-Con. Alumina---------------------------------------
Lower limits of detection---------------------------Mineralogical occurrence of principal chemical elements.
Calculations described in the literature.-----------Pierre Shale ____ --------------------------------
Basis of calculations------------------------Chemical composition of minerals------------
Minerals calculated primarily from chemical analyses-----------------------------
Minerals calculated primarily from X-ray data--------------------------------
Minerals calculated from chemical constit-uents not otherwise assigned __________ _
Example of chemical-mineralogical calculations. Discussion __________ - __ --------------------
Conclusions----------------------------------------Literature cited _____ - ___ ----------------------------
ILLUSTRATIONS
Page
C18 20 20 20 22 22 22
22
24
25 26 27 30 30
PLATE 1. Worksheet for chemical-mineralogical calculations ___ ------------------------------ _____ ------------- In pocket Page
FIGURE 1. Relation between principal carbonate X-ray peak heights and acid-soluble carbonate for 63 samples from the Pierre Shale-------------------------------------------------------------------------------------- C3
2. X-ray diffractometer traces of clay minerals representative of those in the Pierre Shale (CuK a radiation)_____ 7 3. Examples of quantitative evaluation of X-ray diffractometer traces of three samples of Pierre Shale (CuK a
radiation)---------------------------------------------------------------------------------------- 10 4. The effect of baseline position on quantitative interpretation of X-ray diffractometer traces__________________ 14 5. Relation between coefficient of variation (C) and the average amount of each mineral determined from X-ray
patterns·----------------------------------------------------------------------------------------- 15 6. Comparison of quantitative determinations derived by X-ray methods and by chemical analysis______________ 18 7. Comparison of chemical determinations for alumina and determinations for total clay derived from X-ray
diffractometer data for the Pierre Shale ___ ------- ___________________ ----- ____ ------------------------ 19 8. Comparison of chemical determinations for alumina and calculations for alumina from X-ray data____________ 21 9. Total charge on interlayer cations of montmorillonite and mixed-layer clay in the Pierre Shale_______________ 28
10. Effect of brucite- or gibbsite-like interlayers on the X-ray diffractometer traces of montmorillonitic clay_______ 29
TABLES
Page
TABLlll 1. Factors for X-ray quantitative interpretation of minerals in the Pierre Shale______________________________ C2 2. Procedure for calculation of relative amounts of clay minerals in the Pierre Shale. __________________ -- ___ ---_ 11 3. Repeated X-ray analyses, in percent, of three samples of Pierre Shale_____________________________________ 13 4. Repeated X-ray analyses, in percent, for calcite and quartz in samples of Pierre Shale _______________ - __ --___ 16 5. X-ray mineralogical analyses, in percent, of unknown duplicate samples _________________________ -- __ --_-- 16 6. Repeated X-ray analyses, in percent, of three different splits each of three samples of Pierre Shale over a period
of 2years---------------------------------------------------------------------------------------- 17 7. Different standard deviations derived from repeated analyses of three samples of Pierre Shale ____________ -___ 17 8. Amorphous silica and alumina, in percent, in Pierre Shale_---------- ______________________________ ---- 27
m


ANALYTICAL METHODS IN GEOCHEMICAL INVESTIGATIONS OF THE PIERRE SHALE
QUANTITATIVE INTERPRETATION OF MINERALOGICAL COMPOSITION FROM X-RAY AND CHEMICAL DATA FOR THE PIERRE SHALE
By LEONARD G. ScHULTZ
ABSTRACT
Quantitative X-ray determinations for total amounts of clay, quartz, feldspar, carbonate, and other minerals common in the Pierre Shale are based on heights of peaks on diffractometer traces of unoriented powder samples. Conversion factors are derived from X-ray analyses of prepared mixtures, from weight loss due to solution by dilute acid of carbonate minerals in Pierre samples, and from comparison of X-ray and chemical data for Pierre samples. Proportions of kaolinite, chlorite, illite, montmorillonite, and mixed-layer clay are interpreted from the relative sizes of basal reflections from oriented clay aggregates.
Repeated analyses indicate that variations in (1) sampling, (2) sample preparation, (3) machine response, and ( 4) interpretation by the operator all affect the precision of the X-ray determinations. Inconsistency of interpretation has the greatest effect on the determination of the clay minerals. If a mineral is present in an amount greater than 15 percent of the sample, the precision of its determination generally is ±10 percent. Minerals present in amounts of a few percent or less are not consistently detected. Comparison of chemical analyses for carbon dioxide and alumina and quantitative interpretations for carbonate minerals and total clay, respectively, indicates accuracy of the X-ray interpretations to be generally about the same as the precision.
Calculations of mineral compositions from chemical analyses are based, in part, on the X-ray data. The amounts of apatite, barite, pyrite, and of sulfate and carbonate minerals are calculated from their essential constituents; X-ray data for these minerals serve only to indicate the variety of sulfate or carbonate minerals to be calculated. X-ray quantitative data and mineral compositions for quartz, cristobalite, feldspars, zeolite, kaolinite, chlorite, and illite determine the amounts of chemical constituents assigned to each of these minerals; X-ray and chemical data, and, to some extent, necessary assumptions determine the composition for minerals that are extremely variable, such as chlorite, illite, and feldspar. The remaining chemical constitutents, amounting to about half of most samples, are assigned to montmorillonite and mixed-layer clay. The composition assigned to these two minerals is expressed as a combined structural formula. The structural formula partly determines which montmorillonitic clays contain interlayer gibbsite- or brucitelike structures. The rationality of the structural formula and the extent of agreement between the X-ray-mineralogical and chemical-mineralogical calculations check the gross accuracy of the calculations for individual samples of Pierre Shale.
INTRODUCTION
The geochemical investigation of the Pierre Shale is a continuing study (Tourtelot, Schultz, and Gill, 1960; Rader and Grimaldi, 1961; Tourtelot, 1962) which will attempt to relate data on mineralogical and chemical composition of a large body of fine-grained sedimentary rocks to their physical and lithologic characteristics and to their stratigraphic and geographic positions. Because 1nuch of the Pierre Shale is fairly homogeneous, such an investigation requires reasonably precise quantitative data and knowledge of the accuracy and reproducibility of the data.
Quantitative analyses based on X-ray diffraction data have been described for clay minerals by numerous investigators (Tal venheimo and "White, 1952; Johns, Grim, and Bradley, 1954; Degens, Williams, and Keith, 1957; Weaver, 1958; Jarvis, 1958; Sudo, Oinuma, and l(obayashi, 1961; and others). The author (1960) described general methods used by him for analyses of some aluminous clay minerals. X-ray methods also have been used for quantitative analyses of other minerals in samples, as for example, the quartz determinations reported by Rex and Goldberg (1958), the determinations of minerals in bauxite by Black (1953), and the determinations of feldspar, quartz, and calcite in prepared mixtures by Mitchell (1960). Schmalz and Zen (1959) used X-ray diffraction techniques for quantitative evaluation of both clay and other minerals in modern sediments from the Peru-Chile Trench. Descriptions of methods for complete X-ray quantitative mineralogical analyses of sedimentary rocks that have a clay mineral suite as complex as that of the Pierre Shale, however, have not previously been published.
This report describes techniques of X-ray analyses used in the investigations of the Pierre shale, presents data on the reproducibility and accuracy of the results, and describes the calculations used to assign chemical constituents to the minerals identified in each sample.
The chemical analyses used in parts of this report will be presented in a subsequent report.
Cl

C2 ANALYTICAL METHODS IN GEOCHEMICAL INVESTIGATIONS OF THE PIERRE SHALE
X-RAY ANALYSIS
SAMPLE PREPARATION AND TREATMENT
Two types of mounts were made from each sample for X-ray analysis. An unoriented mount was prepared by packing a finely ground powder into a holder, and a oriented aggregate was prepared by using the porous tile technique of Kinter and Diamond ( 1956). An X-ray diffraction trace was run of the powder, and four traces were run of the oriented aggregate in the following order: (1) dried at room temperature, (2) glycol treated, (3) heated at 300°0 for half an hour, and (4) heated at 550°0 for half an hour. Traces were run by using nickel-filtered copper radiation generated at 40 kilovolts and 20 milliamperes, 1° beam slit and a 0.006-inch detector slit, and scanning at 2° per minute. Uniform response of the X-ray machine was maintained by periodic alinement checks and calibration with a standard sample. Before preparation of the oriented aggregate, the calcareous samples were first treated with cold 1N (normal) hydrochloric acid and washed with distilled water; they were then treated like the noncalcareous samples. Samples containing abundant organic material were treated either with warm 10 percent hydrogen peroxide or 5 percent chlorox and then washed in distilled water.
INTERPRETATION
WHOLE ROCK DATA
The abundance of nonclay minerals is interpreted from the size of the strongest diffraction peak for each mineral on the X-ray trace of the unoriented powder. Diffraction peaks and intensity factors used in interpreting mineral percent from peak size are shown in table 1. Most of the intensity factors shown in table 1 are derived from several diffractometer traces of prepared mixtures in which the concentration range of each mineral is similar to its concentration range in the Pierre Shale. Minerals in prepared mixtures used to develop the intensity factors came from Pierre material, insofar as possible. For example, the diluting agent in the mixtures was a Pierre bentonite composed entirely of montmorillonite which had a chemical composition reasonably close to that of the clays in the Pierre Shale; it therefore had an absorption factor similar to the clays in the Pierre Shale. If sufficiently pure Pierre materials were not available, as for quartz and feldspar, the materials used in the prepared mixtures were as similar as possible to the Pierre minerals in composition and particle size. Because an internal standard was not used, some control was lost over absorption effects. However, as will be discussed later, absorption apparently does not cause much variation in diffracted X-ray intensities within the concentration range of minerals
common in the Pierre Shale; by not using an internal standard, a diluting effect on diffracted intensities is avoided as is interference between reflections from the internal standard and the dozen or so minerals in the Pierre Shale.
Clinoptilolite is used as defined by Mumpton (1960) because in the Pierre Shale this mineral is stable when heated at 550°0 for half an hour.
Peak intensities for the different varieties of feldspar vary with the chemical composition of the feldspar. The intensity factors in table 1 correspond to oligoclase, because this variety apparently is the most common in the Pierre Shale. Further refinement of the factor for feldspar seemed unwarranted, because in the small amounts commonly present in the Pierre Shale, the variety of feldspar could not be determined consistently.
Although the intensity factors recorded in table .1 would probably be different if other X-ray equipment were used, they are included here for comparative purposes.
TABLE 1.-Factors for X-ray quantitative interpretation of minerals in the Pierre Shale
Minerals
Quartz (Si02) ___ --------------------------------------Disordered cristobalite (Si02) __ ----------------------Plagioclase (oligoclase) __ -----------------------------K-feldspar (KAlSiaOs>--------------------------------Calcite, pure (CaCOa) --------------------------------Calcite, mixed I (CaC03)-----------------------------Dolomite, pure (CaMg(C03h)-----------------------Siderite, mixed 2 (FeC03>----------------------------Rhodochrosite, mixed' (MnCOa) __ ----------~-------Gypsum (CaS04·2H20)- ------------------------------Jarosite 6 (KFea(OH)s(S04)2) _________________________ _ Alunite (KAla(OH)6(S04h)--------------------------Pyrite (FeS2) -----------------------------------------Clinoptilolite 7 (NatAbSiloOu·7H20) ------------------Clay minerals 8 _ ----- ____ ----------- ___ ------------ ___ _
1 Mg+t, Fe+2, or Mn+2 substitution. 2 Ca+2, Mg+2, or Mn+2 substitution. a In amounts less than 10 percent~ ' Ca+2, Mg+2, or Fe+Z substitution. 6 Commonly a very broad peak. 6 Probably extensive substitution of H+I for K+I. 7 Some K+I and Ca+2 substitution.
Peak position In degrees 29
(CuKa: radiation)
26.6 21.8 28.0 27.5 29.4
29.6-30.0 31.0
31.7-31.9 & 30.8-31.5
11.6 29.1 30.0 33.1 10.0 19.9 34.6 61.9
Intensity factor in
counts per second per 100 percent
2,000 570
1,000 1,000 1,000
500 1,000 3 600
300 1,500 3 550
750 3 250
800 100(150)
60(60) 30(40)
8 Values in parentheses are for bentonite. See text for explanation of these thr.ee values.
CARBONATE MINERALS
Intensity factors for calcite and dolomite (table 1) are based on detenninations of acid-soluble carbonate and X-ray measurements for 58 samples of calcareous shale and marlstone, and 5 carbonate nodules from the Pierre Shale (fig. 1). The amount of acid-soluble carbonate was determined by weight loss resulting from re· peated treatment with 1N hydrochloric acid until effervescence stopped. X-ray patterns that were run before and after the acid treatment indicated that all the car· bonate minerals had been removed and that no minerals other than carbonates were discernibly affected by the

QUANTITATIVE INTERPRETATION OF MINERALOGICAL COMPOSITION C3
900r-
0
5 800r(.) LJ.J (/)
a:: LJ.J Cl.
(/) I-s 700 r-0 (.)
~
en ~ <(
M: 600 '-LJ.J I-
~ 0 ...J 0 0
~ 500-<(
LJ.J 1-u ...J <( (.)
-:i. 400-Cl. C3 z 0: Cl.
u.. 0 (/) 300-1-:r: (!) ijj :r: u.. 0
~ 200-(/)
100-
X
I I I I 20 3.0 40 50
-
-
-
-0
0
0 -
oo
-
-
-
f I I f
60 70 80 90 100 FRACTION SOLUBLE IN lN HCI, IN PERCENT
FIGUBlll !.-Relation between principal carbonate X-ray peak heights and acid-soluble carbonate for 63 samples from the Pierre Shale. D, dolomite only; d, mostly dolomite; x, dolomite and calcite in about equal amounts; c, mostly calcite; C, calcite only; 0. calcite from a concretion with extensive substitution of magnesium, iron, and manganese ions.
acid treatment used. The proportion of calcite and dolomite in each sample estimated from the relative intensities of their principal peaks is indicated by the symbols on figure 1. Regardless of the proportions of calcite and. dolomite, the intensity sum of their principal peaks is almost linearly related to the total amount of acid-soluble carbonates. Thus, the finegrained hut pure calcite a.nd dolomite common in many samples of Pierre Shale give principal diffraction peaks
of about the same intensity for a given amount of material; with the X-ray equipment used, the intensity of the principal peak can be divided by 1,000 cps (counts per second) to give a carbonate value that generally will be accurate within 10 percent of the amount stated (fig. 1). The fact that the strongest diffraction peaks of calcite and dolomite are of nearly equal intensity agrees generally with the results of Tennant and Berger (1957) and Gulbrandsen (1960).

C4 ANALYTICAL METHODS IN GEOCHEMICAL INVESTIGATIONS OF THE PIERRE SHALE
An intensity factor of 1,000 cps is not applicable to the carbonate minerals composing concretions (fig. 1). The carbonates in concretions gives relatively broad X-ray peaks that are shifted from their normal positions; for a given amount of this mixed carbonate, the height of the principal peak is about half of that expected for a pure calcite (fig. 1). Although this intensity relation for X-ray diffraction peaks of calcite from concretions is shown by only five samples on figure 1, its general applicability is confirmed by observations of many traces of nodules that are composed predominantly ( 80-90 percent) of carbonate minerals, but for which solubility data are not available. Chemical data indicate extensive substitution of iron, magnesium, and, in some samples, manganese for the calcium in such carbonate. In table 1 and throughout this report, the modifier "mixed" is used to distinguish carbonates having extensive substitution from "pure" carbonates having an ideal chemical cmnposition.
DIS'ORDERED CRISTOBALITE
Cristobalite in the Pierre Shale gives a few broad X-ray peaks close to the strongest peaks of wellcrystallized cristobalite. It apparently is similar to the opal of Franks and Swineford ( 1959, fig. 4) and to the beta cristobalite of Levin and Ott (1933). Yet, the term "opal" seen1s inappropriate because "opal" generally connotes a hydrous amorphous silica mineral, whereas the material in the Pierre is crystalline and produces a distinct X-ray pattern. Beta cristobalite seems inappropriate because the term "beta," though variously used, generally implies a high temperature form, whereas material like that in the Pierre apparently has not resulted from high temperatures. In this paper, the term "disordered cristobalite" indicates the presence of distortions in the crystal lattice that produce the characteristic broad .X-ray peaks. According to Franks and Swineford ( 1959) , the distortions in such 1naterial are caused by a small mnount of alumina, water, and alkalies stuffed into the cristobalite crystal lattice.
The intensity factor in table 1 for disordered cristohalite in the Pierre Shale was determined empirically, because no pure samples of cristobalite known to be identical with that in the Pierre Shale were available for prepared mixtures. Two considerations were involved in the determination of the intensity factor for cristo halite: ( 1) the amount of material unaccounted for after percentages of other mineral components had been calculated, and (2) for chemically analyzed samples, the amount of silica left over after an appropriate amount had been assigned to clay and quartz. For example, partial X-ray and chemical analyses of a sample are as follows :
X-ray analysis: Percent Clay minerals-------------------------------- 55
Quartz -------------------------------------- 7 Plagioclase ---------------------------------- 1
68 Chemical analysis : Percent
SiOa ---------------------------------------- 70.2 Al2~ ---------------------------------------- 10.8
81
The only 1nineral detected on the X-ray trace other than the three listed is disordered cristobalite, whose principal peak at 21.8° 20 is 200 cps high. Clay minerals, quartz, and plagioclase constitute 63 percent of the sample; therefore the remaining 37 percent must be mostly disordered cristobalite. The general formula for converting X-ray peak intensity into percent of cristo halite is
peak height (cps) intensity factor (cps) per 100 percent
=percent cristobalite;
for the sample above, the intensity factor (cps) per 100
percent 200 cps = 540 37 percent ·
The silica and alumina values also can be used to derive an X-ray intensity factor for cristobalite in the following way: The average ratio of weight percent silica to alumina of clays in the Pierre Shale is about 2.6; therefore, in the sample containing 70.2 percent silica, 10.8 percent alumina, and 7 percent quartz, about 28 percent of the silica (10.8X2.-6) should be in the clay minerals, 7 percent in quartz, and the remaining 35 percent silica can be assigned to cristobalite. Fron1 the inferred amount of 35 percent cristo-
halite, an X-ray intensity factor of 570 cps (20~;ps) is
calculated. Both the difference method and the chemical method
general1y indicate the 570-cps value given in table 1 as an appropriate intensity factor for disordered cristohalite in the Pierre Shale. The amount of cristohalite in one sample, as calculated from X-ray analysis, was subsequently checked by the solubility test of Hashimoto and Jackson (1960). As shown in table 8, the X-ray determination of 35 percent obtained by using the in.;. tensity factor of 570 cps is in good agreement with the solubility test in which 34.8 percent dissolved silica and 0.85 percent dissolved alumina are reported. Some solution of components other than cristobalite may have occurred, but the X-ray determination gives a figure that must be nearly correct and that cannot be obtained as conveniently in any other way.

QUANTITATIVE INTERPRETATION OF MINERALOGICAL COMPOSITION C5
TOTAL CLAY MINERALS
A direct determination of intensity factors for clay minerals in the Pierre Shale was not possible, because all the shale samples contain other components. The only reasonably pure clays are in the bentonites, and diffraction characteristics of these are not typical of the shales in general. There was no assurance that clays used in mixtures intended to approximate the Pierre would be similar to the clays actually in the Pierre. Therefore, the intensity factor for total clay minerals was obtained by difference; samples of Pierre Shale containing in most part only clay and quartz were used. For example, if X-ray data indicated that a sample contained 20 percent quartz and 2 percent feldspar and if no other reflections were perceived except for the clays, then the clay reflections were assumed to represent 78 percent of the sample. A large number of such analyses gave fairly consistent relations between the sizes of the peaks shown on table 1 and the apparent total amount of clays in each sample. Basal reflections were not used because of the considerable effect of any slight preferred orientation on these reflections, a factor which has much less effect on the intensity of the nonbasal reflections. Three nonbasal reflections common to most clay minerals in shale samples from the Pierre were used (see table 1); most significance was given to the amount calculated from the peak at about 19.9° beca:use this peak is the largest of the three and most easily measured. This amount was modified if the 34.6° and 61.9° peaks gave appreciably different but apparently valid amounts of clay. For example, if the 19.9° peak indicated 70 percent clay, but both of the other two peaks indicated 60 percent, then 65 percent clay minerals was reported. Consideration of three peaks also made possible the elimination of any one peak with which reflections fron1 other minerals interfered.
Intensity factors used for total-clay in shales cannot be used for bentonites because the montmorillonite in bentonites generally gives bigger peaks than do the clay minerals in the shales. Therefore, the numbers in parentheses in table 1 were used to evaluate the total amount of clay minerals in bentonites.
The system for determining total clay in samples of Pierre Shale will not be applicable to all possible mixtures of clay. For example, highly kaolinitic samples will give peaks higher than the clay minerals in the Pierre; if factors listed in table 1 were used for such kaolinitic clays, an unrealistic total amount, perhaps 150 percent clay, might be calculated. The particular dual system for shales and bentonites listed in table 1 is appropriate only for material very similar to the Pierre Shale.
~24-487--64----2
Beca:use of the many considerations involved in the determination of the intensity factors for total clay minerals and cristobalite, their quantitative determinations are probably the least accurate. Accordingly, amounts of total clay and cristobalite have been rounded to the nearest 5 percent.
A figure for the total amount of clay minerals in each sample might have been obtained by assuming that clay composed that portion of each sample not assigned to nonclay minerals. This method probably would give a figure for total clay in most samples as accurate or more accurate than could be derived by using the intensity factors listed in table 1. Derivation of total amount of clay by using the X-ray intensity factors in table l for all samples has the advantage of indicating which of the hundreds of samples of Pierre Shale analyzed give sums for total minerals present that are so low as to indicate something unusual, such as the presence of amorphous material. Almost all samples give totals between 90 and 105 percent. Sums within this range are interpreted as normal variations caused by the inaccuracies of the methods used and as being free of appreciable amounts of components amorphous to X-rays.
Absorption of X-rays can influence intensity relations greatly in some samples. However, most Pierre samples are composed of reasonably uniform proportions of silicate minerals; the X-ray peak intensity relations observed from most prepared mixtures indicate that absorption has little effect upon the nearly linear relation between mineral percent and diffraction intensities within the concentration ranges in which the different minerals commonly occur in the Pierre Shale. The most extensive variation common in the mineralogy, chemistry, and, thus, in the absorption of Pierre samples probably· involves the amount of carbonate minerals, but even in this variation no drastic deviation from linearity is observed (figs. 1 and 6). Exceptions to linearity are provided by samples having high iron contents, in which high absorption of copper radiation by the iron reduces expected intensity for all peaks and adjustments in intensity factors are necessary. Such samples, however, are not common from the Pierre Shale.
CLAY FRACTION DATA
CLAY MINERALS PRESENT
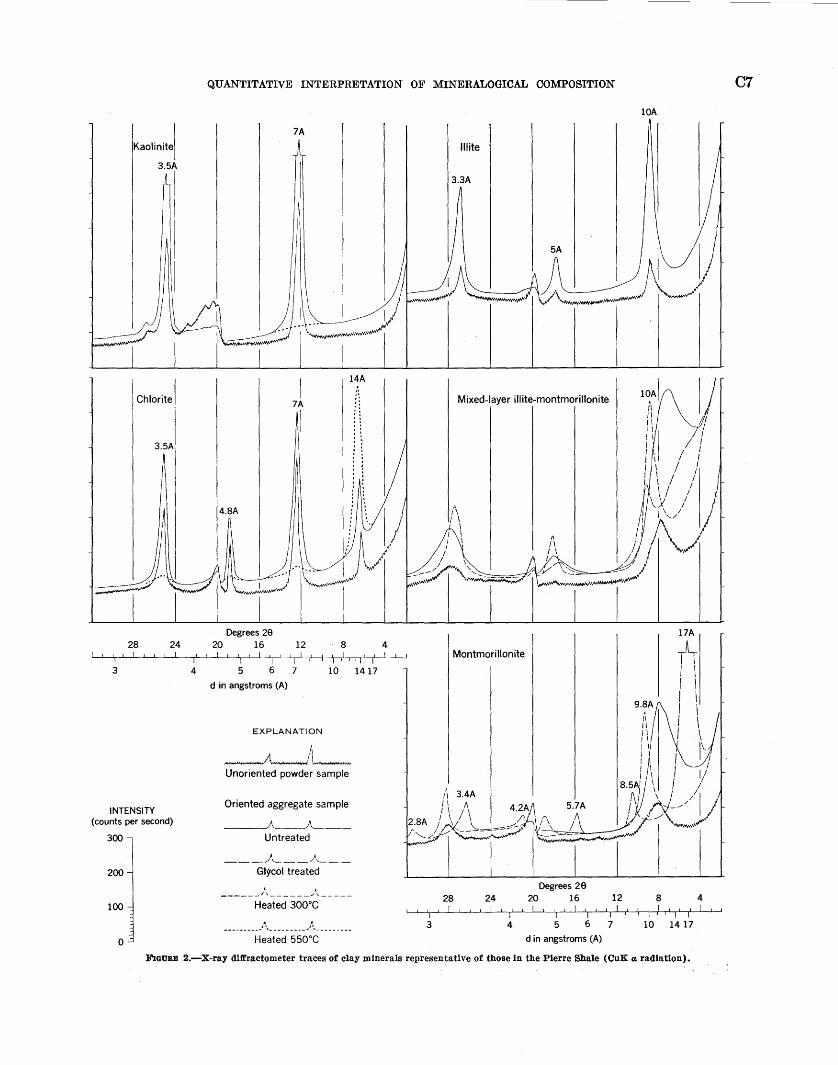
Clay minerals in samples of Pierre Shale analyzed from South Dakota and adjacent areas are classified as kaolinite, chlorite, illite, montmorillonite, and mixedlayer clay. X-ray diffractometer traces of pure clay minerals from or similar to those in the Pierre Shale are shown in figure 2. The following criteria are used to identify the clay minerals:
C6 ANALYTICAL METHODS IN GEOCHEMICAL INVESTIGATIONS OF THE PIERRE SHALE
1. Kaolinite is characterized by a series of basal X-ray diffraction peaks at about 7 A, 3.5A, and so forth. Judged from the shape of the 7A peak (Schultz, 1960, fig. 2), kaolinite in the Pierre Shale appears to be of a moderately w~ll crystallized variety.
2. Chlorite is characterized by a series of basal X-ray diffraction peaks at about 14A, 7 A, 4.8A, 3.5A, and so forth. Heating at 550°0 for half an hour causes a change in the chlorite structure, hence the 14A reflection increases greatly in size and the other basal orders almost disappear.
3. Illite is characterized by a series of X-ray diffraction peaks at lOA, 5A, 3.3A, and so forth that are not appreciably affected by either glycol or heat treatment. Illite is used as a general or group term for the micalike clay of partly uncertain species and undeterminable polymorph that generally gives fewer and broader X-ray reflections than ideal mica, but that shows no significant change in the lOA spacing after mild heat or glycol treatment. The illite in the Pierre Shale is predominantly a dioctahedral aluminous variety. However, materials fitting the above description of illite may include some micalike clays other than the usually dominant disordered muscovitelike clay, and may include a small amount of undetected mixed layers. For example, analyses by optical methods revealed small amounts of glauconite and biotite that were included with illite in the X-ray analyses of some samples.
4. Montmorillonite is characterized by its expanding lattice. When dried under ordinary room conditions, montmorillonite having sodium as the exchange ion frequently has one molecular layer of water and a basal spacing of about 12.5A; when calcium or magnesium is the exchange ion, it frequently has two molecular water layers and a c-axis spacing of about 15.5A (Grim, 1953, p. 57). After glycol treatment, montmorillonite exhibits a series of basal X-ray peaks at 17A, 8.5A, 5.7A, 4.2A, 3.4A, 2.8A, and so forth. When heated at 300°0 for half an hour, volatilization of all adsorbed water or ethylene glycol causes a decrease in the basal spacing to about lOA. The montmorillonite in the Pierre Shale gives the X-ray pattern of a dioctahedral aluminous variety.
5. Mixed -layer clay in the Pierre Shale is characterized by a broad basal X-ray diffraction peak near 17A on the trace of the glycolated sample (fig. 2), indicating that montmorillonite layers are · most rubundant. Complete collapse of the c-axis spacing to about lOA after heat treatment of most samples indicates that the only other common layers are
illite, because only illite and montmorillonite give c-axis spacings of about lOA after being heated at 300°0. In only a few samples does a c-axis spacing of greater than lOA after heating indicate presence of a brucitelike interlayered component of moderate thermal stability that prevents collapse to lOA at 300°0 but that will collapse at 550°0. The mixed-layer clays of the Pierre Shale are dioctahedral aluminous varieties.
COMPARISON OF X-RAY PEAK SIZES
The relative sizes of the X-ray diffraction peaks from the basal planes of the clay minerals in the 7 to 17 A range provide the basis for calculating the relative amounts of the different clay minerals. For some calculations, peak area is used and for others, peak height. Methods for measuring peak size and comparing intensities, which were previously derived (Schultz, 1960), are:
1. The peak area is considered to be the sum of five measurements of the height above the baseline. One measurement is at the peak position (called peak height) and the other four are at %0 intervals on either side of the peak position. For example, in the symmetrical peak illustrated in the lower left corner of figure 3, the height above baseline at the peak position is 10 divisions, the height above baseline at 1;2 o and 1° 20 on the left side of the peak position is 11;2 divisions and % division, and the height above baseline at 1;2 6 and 1° on the right side of the peak position is 2 divisions and 1;2 division; the total of these 5 measurements, 141;2 divisions, is considered a measure of the peak area. · The size of the divisions is immaterial, because all measurements of the basal clay peaks are used on a relative basis only. In practice, the one-tenth-inch grid on the recorder paper is used as convenient division. For notably asymmetrical peaks (fig. 3, lower left corner), one peak flank measurement is made on the steep side of the peak and three are made on the less steep side. The determination of peak area thus requires consideration of peak shape.
2. The baseline indicates where the trace would be if the mineral producing the diffraction peak were absent. The position of the baseline depends upon the intensity of background radiation and upon radiation reflected from other minerals having closely similar lattice spacings. The exact position of a baseline below critical clay mineral peaks is, to some extent, subject to the personal judgment of the interpreter.
3. After heating at 300°0, all the clay minerals common in the Pierre Shale give X-ray reflections
I
I 3
IKaolinitel
3.5A
Chlorite
3.5A
28 24
INTENSITY (counts per second)
300
200
100
0
I I I
I 4
QUANTITATIVE INTERPRETATION OF MINERALOGICAL COMPOSITION
7A
I 7A
I
Degrees 29 20 16 12 8 I I I
I I I I
I I I
I I I I
I I I 1\ I I I
I
5 6 7 10
d in angstroms (A)
EXPLANATION
Unoriented powder sample
Oriented aggregate sample
__A______)\__
Untreated
___ _)'-- _)''-.__ __ Gl9col treated
)\_--- __ .,.,.\-----Heated 300°C . .
--------- .. I\,_--- ... -- __ ... , .... _--------
Heated 550°C
1417
Illite
Mixed-layer illite-montmorillonite
4 Montmorillonite
Degrees 29
28 24 20 16 12 I I I I I I I I I I I I I I
I I I
I I I I
3 4 5 6 7
d in angstroms (A)
lOA
8
't I I I
I I
I
I I
I I
10 14 17
FIGURE 2.-X-ray diffractometer traces of clay minerals representative of those in the Pierre Shale (CuK a radiation).
C7
4

C8 ANALYTICAL METHODS IN GEOCHEMICAL INVESTIGATIONS OF THE PIERRE SHALE
from their basal planes at about either 7 A (kaolinite and chlorite) or lOA (illite, mixedlayer clay, and montmorillonite) (fig. 2). Therefore, with suitable correction, an initial division into these two groups of clay minerals can be made by comparing the relative areas of the 7A and the lOA peaks after the sample has been heated at 300°C.
4. In their collapsed state after 300°C heating, aluminous illite, montmorillonite, and mixed-layer illitemontmorillonite give lOA X-ray peaks of about the same area for equal weights of material.
5. The ratio of peak areas of the 7A and lOA reflections for equal amounts of kaolinite and collapsed illite, montmorillonite, or mixed-layer illitemontmorillonite ranges from 1 : 1 for poorly crystallized kaolinite to 2 : 1 for well-crystallized kaolinite; the ratio for kaolinite of an intermediate degree of crystallinity is intermediate between 1: 1 and 2: 1. The sharpness of the 7 A kaolinite peak as expressed by its area : height ratio can be used to evaluate the crystallinity of kaolinite.
6. The ratio of heights of the 17 A peak of glycolated montmorillonite to the 9.8-lOA peak of collapsed montmorillonite generally is between 4 and 5 for the sample mounts used; an average value of 4.5 is used.
A relation of peak intensity to crystallinity similar to that for kaolinite may exist also between illite and well-crystallized mica. Well-crystallized mica, however, is not a significant component in the Pierre Shale; thus, only the poorly crystallized iiHtic type of clay mineral need be considered.
Application of these factors to the quantitative interpretation of X-ray data are discussed on pages C9-Cl2 and are shown in table 2. The basis and methods of quantitative interpretation of the amounts of kaolinite and chlorite are discussed in the following section.
ESTIMATION OF KAOLINITE AND CHLORITE
Differentiating between kaolinite and chlorite is one of the most common difficulties in X-ray identification of clay minerals. The difficulty arises from coincidence of the basal reflections of kaolinite with those of chlorite at about 7A and 3.5A (fig. 2). The problem is important in this study because the Pierre Shale commonly contains small amounts of both kaolinite and chlorite. The ( 002) reflection of kaolinite and the ( 004) reflection of chlorite at about 3.5A are never resolved on diffraction traces of samples from the Pierre Shale; hence, the solution of Grim, Bradley, and White (1957, fig. 2) is not applicable. The thermal stability of the two minerals in the Pierre Shale is such that the intensity changes of the X-ray peaks occur at about the
same temperature, and the solution of Jolms, Grim, and Bradley (1954) is not applicable. J{aolinite and chlorite in the Pierre Shale commonly occur in such small amounts that the ( 003) reflections of kaolinite at 2.38A and of chlorite at about 4.8A are not both seen, thus, the solution of Weaver (1958, p. 271) also is not helpful.
The factor for determining the total kaolinite and chlorite was derived in the following manner. In samples containing no chlorite, the shape of the 7 A peak indicates that kaolinite in the Pierre Shale has a fairly uniform intermediate degree of crystallinity which should give a 7A peak having an area a;bout 1.4 times that of the lOA peak of the illite and collapsed montmorillonite or mixed-layer illite-montmorillonite (Schultz, 1960, fig. 2; see also item 5, p. C8 of this report). The shape of the 7 A peak for samples containing both kaolinite and chlorite is about the same as for samples containing only kaolinite; thus the crystallinity of the kaolinite is apparently similar to that of the chlorite. According to Weaver (1958, p. 271), the 7 A peaks of kaolinite and chlorite, which presumably possess similar crystallinity, are of about equal intensity. Therefore,. for all Pierre Shale samples the size of the 7A peak was divided by 1.4 and the quotient was then compared with the size of the lOA peak in order to estimate the relative quantities of the minerals producing these two X-ray reflections.
The method formulated for evaluating the relative amounts o£ kaolinite and chlorite in samples of Pierre Shale is based on a comparison of X-ray traces of oriented aggregates before and after they were treated with warm 6N hydrochloric acid for 16 hours and after they were heated at 300° C and 550° C for half an hour. Twenty-eight samples in which chlorite composed more than 5 percent of each were studied. In no sample was a 14A chlorite peak observed after the acid treatment, but in all the sa1nples, a 7A kaolinite peak remained. Because orientation in the aggregates differed in the slides prepared before and after the acid treatment, peak-size comparisons were all relative to the lOA peak after heating at 300°C; minerals causing the lOA peak apparently were not appreciably affected by the acid treatment. For the 28 samples so studied, the amount of the decrease in height of the 7 A peak clue to removal of chlorite by acid treatment averaged two-thirds (ranged between one-half and one) of the height of the chlorite peak at 14A after heating at 550° C and before treating with hydrochloric acid. Therefore, for a sampie o£ the Pierre Shale, the part of the 7 A peak that is attributed to reflections from chlorite is calculated by multiplying the height of the 14A peak obtained after heating the sample at 5150° C by the factor two-thirds (or dividing by 1.5). The remainder of the 7 A peak

QUANTITATIVE INTERPRETATION OF MINERALOGICAL COMPOSITION C9
height is attributed to kaolinite. For example, if a sample gives a 7A peak that is 12 units high and a 14A peak (after heating at 550°0) 9 units high, then 6 units (9-7-1.5) of the 7A peak height would be attributed to chlorite and the other 6 units to kaolinite; the two minerals would be calculated as being equally abundant.
In most samples of the Pierre, kaolinite and chlorite are generally present in small amounts, and one of these minerals is calculated to be no more than twice as abundant as the other. Within this range, differences in the relative abundance of kaolinite and chlorite may be due only to inaccuracy in measuring the usually small 7 A and 14A peaks. The differences are considered to be significant only where the total amount of kaolinite and chlorite is more than a few percent and where one mineral is more than twice as abundant as the other.
As the Pierre investigation continues, samples may be found which contain large amounts of either kaolinite or chlorite that is of considerably different crystallinity than that in the fine-grained offshore facies investigated so far. If this happens, appropriate changes can be made in the factors used for the quantitative interpretation of kaolinite or chlorite. In the samples which have been investigated to date (1960), however, kaolinite and chlorite occur in such small amounts and appear to be sufficiently uniform in grain size and crystallinity that a variable comparison factor is not justified.
EXAMPLES OF INTERPRETATION
Figure 3 shows quantitative interpretations of the X-ray diffractometer traces of three samples that illustrate the known range of mineral com position in the Pierre Shale. Sample 259543 (fig. 3B) will be discussed in greatest detail because it is most typical of much of the Pierre Shale.
The minerals in sample 259543 for which diffractometer peaks are noted other than the clay minerals are quartz, feldspar, clinoptilolite, and possibly pyrite. By dividing the measured height of the 26.6° quartz
peak in counts per second by 2,000 100
cps t (from percen
table 1) , the amount of quartz is determined to be 16 percent. The 2-percent value for feldspar is similarly derived by dividing the measured height of the
28.0° feldspar peak by 1,000 100
cps t. On the perc en
basis of the 28.0° peak position rather than the 27.5° one (table 1), the feldspar is determined to be mainly a plagioclase rather than a potassium feldspar. The 1-percent clinoptilolite is interpreted from the small peak at 10.0°; although such a small peak might be considered to be of questionable significance, it is here interpreted as clinoptilolite because the same peak is
seen on the X-ray traces of the oriented aggregate and because no other mineral now known to occur in the Pierre Shale gives an X-ray peak in this position. Pyrite is listed as questionably present in this sample because of the very small size of the 33.1° peak and because no other pyrite peak can be distinguished. The value of 75 percent for total amount of clay is derived from the 19.9° clay peak; the values for total clay from the 34.6° peak and the 61.9° peak are in fairly close agreement. The 94-percent total of minerals determined is within the range normally expected. Of the undetermined 6 percent, 1.5 percent is known to be organic matter and the remaining 4.5 percent probably is caused mostly by using a value for total clay that is slightly too low.
Relative amounts of the different clay minerals in sample 259543 are determined by using the procedure listed in table 2. The clay mineral fraction is calculated to be comprised of 4 percent kaolinite, 3 percent chlorite, 17 percent illite, 33 percent montmorillonite, and 43 percent mixed-layer illite-montmorillonite. Each of these relative amounts may be multiplied by 75 percent (the proportion of total clay minerals) to determine their proportion in the total sample.
Amounts and proportions of minerals for samples 259574 (fig. 3A) and 259550 (fig. 30) are calculated in a similar fashion. Inasmuch as no 17 A peak is shown on the glycol trace for sample 25957 4 (fig. 3A), no montmorillonite is recorded. The very large 17 A peak for glycolated sa1nple 259550 (fig. 30) corresponds to an unusually large amount of montmorillonite; although the height of the 17 A peak for sample 259550 is twice that for sample 259543,. the amount of calculated montmorillonite is not twice as much. The large peaks obtained from the oriented aggregate of sample 259550 are, in part, due to a very high degree of preferred orientation of the clay flakes. The large peaks near 12.5A on the untreated traces for samples 259543 and 259550 indicate that much of the montmorillonite in these samples contains one layer of hy"' dration water, this single layer in turn suggests that sodium probably is the most abundant exchangeable cation.
The method of differentiating montmorillonite and -mixed-layer clay may be unrealistic, because all the material producing the broad 17 A peak in samples like no. 259543 (fig. 3) might be interpreted as entirely mixedlayer clay rather than as a combination of montmorillonite and mixed-layer clay. Pure, unmixed montmorillonite having a 17A reflection as strong as that shown for sample 259543 should produce a series of reasonably sharp basal reflections at submultiples of the 17A(001) spacing-8.5A(002), 5.7A(003), 4.2A(004)

ClO ANALYTICAL METHODS IN GEOCHEMICAL INVESTIGATIONS OF THE PIERRE SHALE
A Sample 259574 O'l
7 A= _a_== 20 percent< 11 percent kaolinite ~ 40 9 percent chlonte
Clay minerals== 65 percent Quartz == 29 percent
~ 6~~~~~~ ~ i percent
Q; Gypsum == 2 percent a. Pyrite = 2~rcent
-99 percent
B Sample 259543
lllite==-{~-==30 percent 5; ~
Montmorillonite==O c :g_ Mixed-layer==50 percent ~
Q) c a. Q)
U'l ~ <D Q) II a.
~0 ~ OI<D ~0 ~-
~ ~~ ~~~ ::l ~ ·cv 0' u ~
a..
59.3 3 percent chlonte
II
$ 0 N
1/)
~g o.o ()()IN U'l'
1:: ~ Q) a.
Illite= ~Q_ = 17 percent
{
7A==-4d.= 7 percent<4 percent kaolimte
!:I<D
c ~ a. 0 00 II
~0 U'l(Y) N
~~~ CY~ uo 00 N (Y)
Clay mmerals = 75 percent 59 3 Quartz = 16 percent Montrnonllon1te=25~1>4 V: X93=33 percent Feldspar = 2 percent X 2
Cl1noptllohte = 1 percent Mlxed-layer=43 percent 94 percent
~ CY
C Sample 259550 I { 7A=li=3 ercent<1 percent kaolinite I 72.1 P 2 percent chlonte
Clay minerals=75 percent Illite= 78i\ =12 percent I
Quartz =19 percent Montmorillonite=~!: x97 =55 percent Feldspar = 5_pe!~ent . c- 31 x4 2
99 percent Mlxed-layer=30 percent ..., ..., c ~ Q; a. 0 00 II
1.5
60 56 52 I
Peak size measurements
48 44 40 I r
I I I
2
DIVISIONS
[
c c Q) Q)
~ ~ Q) .... Q) a. "' a.
5l-U'l
~~~~ uO OU'l oo-
Degrees 29 36 32 28
r I I I
3 din angstroms
EXPLANATION
Unoriented powder sample
Oriented aggregate samples
~
Untreated
___ _.b,_ ___ , ..... __
Glycol treated
_____ ,.,./'\ _____ /\ ____ _ Heated 300"C
............... ,' ...................... -''.:'.. ............ _ Heated 550"C
I. 1:: ~ Q) a.
U'l <D II
1:: ~ Q) a.
U'l
"
24 20 I I
l r
4 5
~ 00 II N
:gl ~:::\C)('t)
U'l N
8
16 12 8 l
r r
l I I '! l i\jl (
6 7 10 1417
INTENSITY (counts per second)
300 l 200
100
0
4 f
FIGURE 3.-Examples of quantitative evaluation of X-ray diffractometer traces of three samples of Pierre Shale (CuK « radiation). Illite peak at lOA is shaded.

QUANTITATIVE INTERPRETATION OF MINERALOGICAL COMPOSITION Cll
TABLE 2.-Procedure for calculation of relative amounts of clay mineral8 in the Pierre Shale
General procedure Calculation& for sample 169648 (fio. SB)
1. Measure the areas of the 7 A, the lOA glycol, and the lOA 300°0 peaks; measure the heights of the 7 A, the lOA 300°0, the 14A 550°0, and the 17A glycol peaks--------------------------- 7A peak height=5; peak area=6.
lOA glycol peak area= 10. lOA 300°C peak height=25; peak area= 55. 14A 550°0 peak height=3~. 17 A glycol peak height= 40.
7 A peak area 6 3 2. Corrected 7 A peak area 1.4
-------------------- Corrected 7 A peak area=1.4 =4. ·
3. Kaolinite+ chlorite (percent)=
corrected 7 A peak area X 100 ______ Kaolinite+ chlorite=___!:!_ X 100=7 percent. corrected 7 A peak area+ lOA 300°C peak area 4.3+55
4. Chlorite (percent)= · . . . 14A 550°C peak height (kaolimte+chlonte) X . -----------1.5 X 7 A peak height
Chlorite=7 percentX 1~~x 5=3 percent.
5. Kaolinite (percent) = (kaolinite+ chlorite) -chlorite_ _ _ _ _ _ _ _ _ _ Kaolinite= 7 percent-3 percent= 4 percent.
6. lllite (percent)= lOA glycol peak area x 100 lllite=4.
31+0
55X100=17 percent.
corrected 7 A peak area+ lOA 300°C peak area ----
7. Montmorillonite (percent)= 17 A glycol peak height . . • 40
4%XlOA 300oc peak height X (100-kaolimte-chlonte)- Montmorillonite=4~X 25X93=33 percent.
8. Mixed-layer clay (percent) =100-(kaolinite+chlorite+illite Mixed-layerclay=100-(4+3+17+33)=43 per· +montmorillonite) ___________________ - __ - ___ ---------- cent.
and so forth. Such higher order basal reflections, though commonly noted for bentonite samples, are generally not observed for the shale samples, or, if present, they are very broad, small, and shifted slightly from their theoretical positions. According to Weaver (1956, fig. 1), interlayering of 10-20 percent of nonexpanding layers with montmorillonite produces very little shift in the first basal reflection at 17A. Such scant mixedlayering apparently shifts the higher order basal reflections more than the 17 A ( 001) reflection. Probably the most notable effect, however, is the broadening and decrease in intensity of all the basal reflections. If mixed-layering is accompanied by dilution with several other minerals as it is in the Pierre Shale, the higher order basal reflections commonly are not clearly seen. Thus, the first basal reflection at 17A is the only consistently usable criterion for evaluating the expandable clay. However, if only the position of the 17A reflection is considered and is interpreted as evidence that all the expanding clay is unmixed montmorillonite, then the quantitative values give no indication of any difference between the expanding clay in shale samples like 259543 or 259550 (fig. 3) and the montmorillonite in the bentonite samples (fig. 2). In contrast to the shales, the bentonites generally produce a series of sharp basal re-
flections at 17A, 8.5A, 5.7A, and so forth. On the other hand, if broadness of the 17 A reflection peak and weakness or slight shifting of higher order basal reflection peaks are interpreted as indicating that all the expandable clay is mixed layered, then the interpretation provides no basis for differentiating the expanding clay in a sample like 259543 from that in sample 259574 (fig. 3), even though the diffractometer patterns for the two samples are quite different. Both samples would be reported as containing abundant mixed-layer clay but no montmorillonite.
The sharpness and relative height of the 17 A reflection are the most notable differences observed between most X-ray patterns from samples of Pierre Shale; in some manner the quantitative X-ray interpretation should express these differences. The means by which they have been expressed is by reporting both mixedlayer montmorillonite-illite and theoretically pure montmorillonite in relative amounts that depend on the sharpness or relative size of the 17 A reflection. If no distinct 17A reflection is perceived, as in sample 259574 (fig. 3) , then no montmorillonite is reported, and all the increase in size of the lOA reflection after heating at 300°C is attributed to mixed-layer clay. Relatively large 17 A reflections, as in samples 259543 and 259550

C12 ANALYTICAL METHODS IN GEOCHEMICAL INVESTIGATIONS OF THE PIERRE SHALE
(fig. 3), result in proportionately large amounts of reported n10ntmorillonite; nevertheless, in both these samples some reported mixed-layer clay serves to differentiate the partially expanding clay in these samples from the completely expanding montmorillonite common in the bentonite beds.
Some discretion must be used in calculating the ratio of montmorillonite to mixed-layer clay, because several factors may affect the 17 A: lOA ratio of 4.5: 1 normally expected for montmorillonite in the Pierre Shale. First, the 4.5: 1 ratio is an average; thus, for example, if a 4.0:1 ratio is measured but the X-ray pattern shows a good, sharp sequence of basal orders all in the proper positions for montmorillonite, then the expanding clay is interpreted as being entirely montmorillonite, regardless of the deviation of peak heights from the ideal 4.5: 1 average. Second, a very thin oriented aggregate of pure montmorillonite produces a 17 A: lOA ratio considerably in excess of the expected 4.5 : 1 ratio, because, as the diffraction angle increases from the 17 A to the lOA positions, increasingly more of the X-ray beam penetrates through the sample instead of being diffracted by it. In such an example, however, the thinness of the sample is readily observed and a fairly good sequence of basal orders is still produced. by the glycol-treated slide; the clay can therefore be reasonably interpreted as montmorillonite, regardless of the abnormally high 17A: lOA ratio. Third, a thick oriented aggregate of exceptionally well oriented montmorillonitic clay will produce extremely strong X-ray reflections which saturate the geiger counter for the 17A peak and cause an abnormally low 17: lOA peakheight ratio. In such instances, the sharpness and relative intensities of the higher order basal reflections can be used to estimate the extent of mixed-layering in the montmorillonite; moreover, the intensity of the X-ray beam reaching the sample can be reduced in order to reduce the intensity of the diffracted beam until it is within the linear range of the detector.
REPRODUCIBILITY
Four variables affect the reproducibility of quantitative values as determined from the X-ray diffractometer studies. They are :
1. Interpretation : inconsistencies in measurement of peak size.
2. Machine: variations in response of the X-ray diffractometer equipment.
3. Sample preparation : variations in packing of the unoriented powder and in the degree of preferred orientation of the oriented aggregates.
4. Sampling: differences in pieces of sample selected for analysis.
Repeated analyses that are intended to indicate the importance of each of these four variables are given in table3.
Quantitative values determined from X-ray traces of powders of five different pieces of the same sample are recorded in column 1 of table 3, and the clay-mineral analyses from the oriented aggregates prepared from the same five pieces are recorded in column 2; all four variables enter into the values in columns 1 and 2. The oriented aggregates used for columns 3, 4, and 5 of the table are made from the same minus-2 micron fraction from each of the three different samples in order to eliminate any sampling error. Data in column 3 are from five oriented aggregates prepared from the same clay-water slurry; the first three variables enter into the tabulated quantitative values. Data in column 4 are from five different groups of X-ray traces made from a single oriented aggregate; the first two variables enter into these values. Data in column 5 are from five different interpretations of the same dif~ fractometer traces made over a period of several days; only the first variable (interpretation) enters into these values.
The means, standard deviations (ynl:w2 - ( I:w)2 ; n(n-1)
n =number of determinations; w =calculated value) , and coefficients of variation (standard deviation X 100)
mean from each group of five determinations are also given in table 3. In the lower part of the table, the standard deviations and coefficients of variation are totaled for each of the clay minerals and for all five clay minerals combined.
The standard deviations for the five determinations of each of the individual clay minerals in each of the three samples vary considerably (table 3). The total of the three standard deviations for each clay mineral, however, generally decreases from column 2 to column 5 of the table, and the total of the standard deviations for all five clay minerals decreases consistently. The magnitude of this decrease is an approximate measure of the influence of each of the four previously mentioned variables on the reproducibility of the quantitative values. Each of the four variables introduces some uncertainty, but inconsistent interpretation of peak size seems to cause the largest variation in the calculated values.
Part of the inconsistency of interpretation is caused by slight differences in placement of the baseline below

QUANTITATIVE INTERPRETATION OF MINERALOGICAL COMPOSITION C13
TABLE 3.-Repeated X-ray anaZyBeB, in percent, of three 8ampZe8 of Pierre Shale [?, presence doubtful, calculated as zero. Variables: a, interpretation; b, X-ray machine; c, sample preparation; d, sampling]
Whole sample
1 (variables a-d) 2 (variables a-d)
Sample ;§ <P ~
= ~ ~ s ~ ;§ <P ~
-~
::s 0. .e :!:: s f!i. 0
~ .9 ~
~ ~ ~ :;... .e .c ~ 0
t:!l 5 ~ 0 ~ 8 ---------------------1---1------------------------------------259547------------------------------------------------ -- ---- 65 30 1 ? ? 1 9 7 29 55 -------- --------
Mean_------------- __ ------. ___ - _____ ·---------------Standard deviation ________________________ .------- __ _ Coefficient of variation ___ ----------------------------
65 30 70 31 65 31 70 30
67 2. 7 4
30.4 .6
2
1 2 1 2
1.4 .6
43
0 ? 3 4
1.4 2. 0
140
? ? 2 ?
.4
.9 225
0 0 0 ?
250
.2 -------
.5 --------
10 11 8 8
9.2 1.3
14
7 7 8 7
7.2 .4
6
30 30 27 27
28.6 1.5 5
53 -------- --------52 -------- --------57 -------- --------58 -------- --------55.0 -------- --------2.6 -------- --------5 -------- --------
259543______________________________________________________ 80 14 2 ? -------- -------- 1 6 5 19 43 27 = 75 14 2 1 -------- -------- ? 3 6 19 46 26 70 17 1 0 -------- -------- 0 5 4 18 47 26 75 15 2 ? -------- -------- 0 5 3 18 45 29 75 16 2 0 -------- -------- 2 6 3 17 45 29 ------------------------------------·---
Mean_---_----------- ___________ -------------- ______ _ 75 3.5 5
15.2 1.3 9
1.8 .5
28
. 2 -------- -------
.4 -------- --------.6 .9
150
5.0 1.2
24
4.2 1.3
31
18.2 .8
4
45.2 1.5 3
27.4 --------Standard deviation _____ -------- __________ -------- ___ _ Coefficient of variation __ -----------------------------
1.5 --------5 200 -------- --------
259550 ___ -- ·- ·- ·- ------------------------------------------- 75 20 5 -------- -------- -------- -------- 3 2 14 31 50 = 80 16 3 -------- -------- -------- -------- 2 2 15 33 48 80 16 3 -------- -------- -------- -------- 2 1 11 32 54 75 17 9 -------- -------- -------- -------- 2 2 12 32 52 80 18 10 -------- -------- -------- -------- 2 2 12 29 55
Mean _________________ ----- _______ ------------________ 78 17.4 1.7
10
6.0 ------------------------------- 2.2 1.8 . 5
28
12.8 1.6
13
31.4 1.5 5
51.8 --------Standard deviation___________________________________ 2. 7 Coefficient of variation ___ ---------------------------- . 3
3. 3 -------- -------- -------- -------- . 5 55 ·------- ·------- -------- 23
2.9 --------6
Total of standard deviations for three samples_-------------------------------------------------------------------- 3. 0 2. 2 3. 9 5. 6 4. 4 19. 1 Total of coefficients of variation for three samples .. ---------------------------------------------------------------- 61 65 22 13 11 172
Minus-2 micron .fraction
3 (variables a-c) 4 (variables a-b) 5 (variable a)
<P ~ :§ :a ~ ~
~ s ~ s ... ~ ::::: ::::: <P :;... ~ <P
:;... ~ .l!S
:;... ~ $
~ :!:: <P ~ <P ~
~ s § :!:: ~ s :§ :!:: ~ s ~
~ <P ~ ~ .9 <P <P ~ <a 0 ~ <P .§ ~ 3 .:::1 0 :!:: I>< 0 ~ s .c 0 0 ~ .c ~
~ 0
~ ~ s ~ ~ ~ 0
0 E-< ~ 0 E-< ~ 0 E-<
Sample
--------------1--------------------------------------259574.---------------------------------------- 7
8 8 7 6
5 5 6 6 7
24 64 25 62 23 63 25 62 21 66
------ -------- 8 5 21 ------ -------- 8 6 24 -- ·- - ·- ·- ·- ·- 7 7 22 ------ -------- 7 6 25 ------ -------- 7 6 25
66 ------ -------- 7 6 25 62 ------ ------62 ------ -------- 8 5 24 63 ------ ------64 ... ·- ·- ... ·- ·- ·- 7 6 24 63 ------ ------62 ------ -------- 7 7 25 61 ------ ------62 ------ -------- 7 6 24 63 ------ ------Mean_----~----------------------------- 7.2 5.8 23.6 63.4 -=-= === 1.'4 ---;l,{) 23.4 63.2 ::-::-== == 7.2 6.0 24.4 62.4 ~ -:-::-= Standarddeviation_____________________ .8 .8 1.7 1.7 ______ -------- .5 .7 1.8 1.8 -------------- .5 .7 .5 .9 ------------Coefficient of variation __________________ 11 14 7 3 ______ -------- 7 12 8 3 ------ -------- 7 12 2 1 ___________ _
---------------------------------------259543 __ ------------------------------------ -- 3 2 11 49 35 2 3 14 47 33 3 2 13 46 36
4 2 11 49 34 -------- 3 2 13 47 35 -------- 2 3 14 45 36 3 2 10 49 36 -------- 3 2 13 47 35 -------- 3 3 15 44 35 3 2 11 49 35 -------- 3 3 13 45 36 -------- 2 3 15 47 33 2 3 14 47 33 3 2 13 46 36 -------- 2 3 14 45 36
Mean ___________________________________ 3:'0 ~ 11.4 48.6 34.6 === 2.8 ~ 13.2 46.4 35. 0 ===:- 2.4 2.8 14.2 45.4 35.2 -=-= Standarddeviation_____________________ .7 .4 1.5 .9 1.1 -------- .4 .5 .4 .9 1.2 -------- .5 .4 .8 1.1 1.3 ------Coefficient of variation __________________ 23 18 13 2 3 -------- 14 21 3 2 3 -------- 21 14 6 2 4 ------
259550.- --- ------------------------ ------------
Total of standard deviations for three
==================== 1 10 30 58 1 1 11 30 57 2 1 8 36 54 1 0 9 33 57 1 1 12 27 59 1
0. 8 10. 0 31.2 57.0 -------- 1. 2 .4 1.6 3.4 1.9 -------- .4
50 16 11 3 -------- 33
1 12 27 59 ? 10 29 58 0 10 30 59 1 9 30 58 1 11 30 57
0.6 10.4 29.2 58.2 --------.5 1.1 1.3 .8 ------
83 11 4 1
1 2 1 1 2
1.0 1.4 .o .5
0 36
11 10 9 8
10
30 31 31 32 32
57 56 58 58 55
9.6 31.2 56.8 ------1.1 0. 8 1. 3 ------
11 3 2 ======================
samples _______________________________ 1.5 1.6 4.8 6.0 3.0 16.9 1.3 1.7 3.3 4.0 2.0 12.3 1.0 1.6 2.4 2.8 2.6 10.4 Total of coefficients of variation for three
samples------------------------------- 34 82 36 16 6 174 54 116 22 9 4 205 28 62 19 6 6 121
1. Five difierent splits, unoriented powder. 2. Five difierent splits, oriented aggregate. 3. Five different oriented aggregates from one split.
4. Same oriented aggregate, rerun five times. 5. Same X-ray diffractometer traces, interpreted five times.
724-487--64----3

C14 ANALYTICAL METHODS IN GEOCHEMICAL INVESTIGATIONS OF THE PIERRE SHALE
the X-ray peaks being 1neasured. Figure 4 illustrates the importance of baseline placement in repeated analyses of the same set of X-ray traces; the two interpretations are the first and second listed for sample 259543 in column 5 of table.
The long baseline below the 7A, the 10A-300°C, and the 17 A -glycol peaks is constructed by use of a french curve. Even if the low-angle portions of the glycol and the 300°0 traces do not exactly coincide as shown on figure 4, the 300°0 trace is still a useful parallel guideline for construction of a baseline for the glycol trace. Nevertheless, the baseline was placed slightly lower in the first than in the second interpretation and resulted in differences in measured sizes of the 7A, lOA-30000, and 17A-glycol peak sizes. The baselines below the lOA-glycol peak and the 14A-550°0 peak are sketched in freehand. Differences in the measured peak sizes of the two interpretations are small, but nevertheless they are large enough to explain much of the variability reported in column 5 of table 3.
Coefficients of variation in table 3 fluctuate much more than the standard deviations. The very small amounts of kaolinite and chlorite in some of the samples cause most of this variation. For example, the coefficient of variation of 50 percent for chlorite in sample 259550, column 3, is caused by a difference of only 1 percent in one of the determinations. In such a case, the coefficient of variation has little meaning.
High variation in determinations for pyrite, dolomite, gypsum, and clinoptilolite in column 1 of table 3 indicates that in small amounts these minerals are not consistently detected.
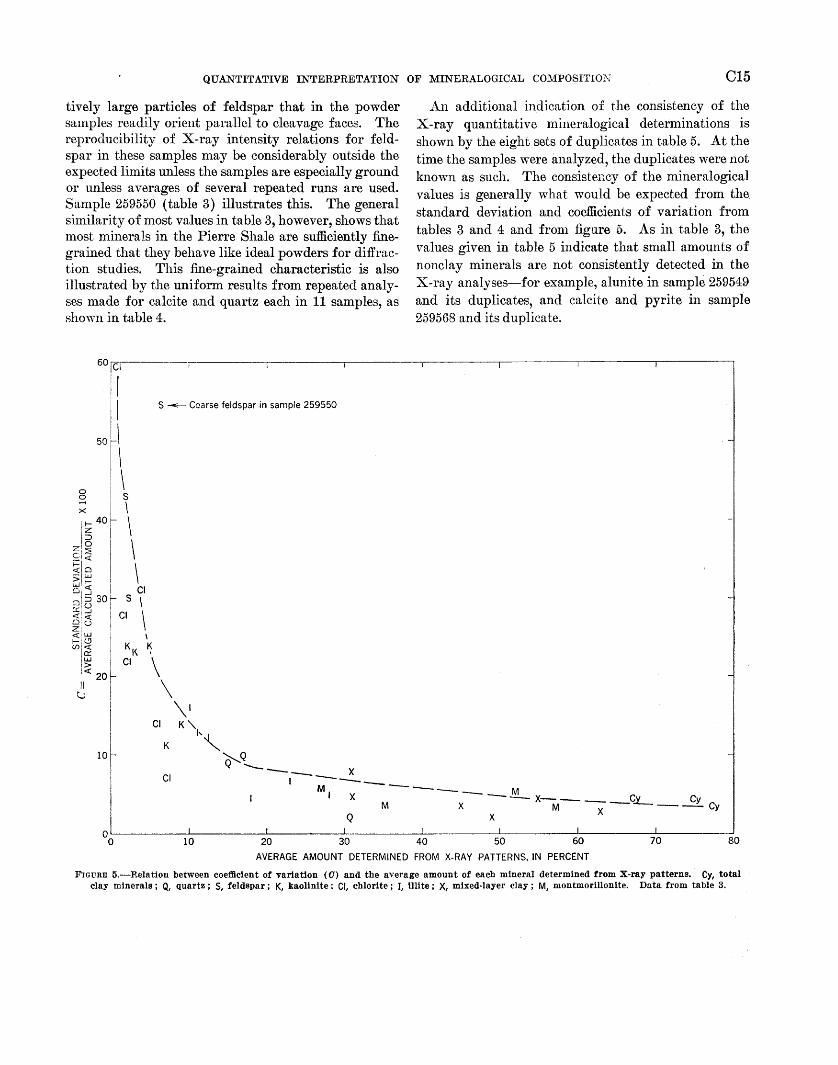
The importance of the amount of material sampled to the consistency of the X-ray quantitative determinations is illustrated in figure 5 by plotting the coefficients of variation for total clay, quartz, feldspar, and the clay minerals in columns 1, 2, and 3 of table 3 as functions of the average amount of each component calculated to be present. For minerals composing more than 15 percent of the sample, any one single determination likely will be within 10 percent of the average of five repeated determinations. The reproducibility is less for amounts smaller than 15 percent.
This generalization will apply to most, but not all, samples of Pierre Shale. For example, some bentonite and some highly bentonitic shale samples contain rela-
First interpretation:
]A=~ =S (3 percent kaoli~ite 78.9 2 percent chlonte
Illite= 10112
= 13 percent 78.9
Montmorillonite= - 50- x95:36 percent 29x41f2
Mixed-layer=46 percent
Second interpretation:
7 A= ~ = 5 ( 2 percent kaoli~ite 73.5 3 percent chlonte
Illite= _!Q_ =14 percent 73.5
Montmorillonite=~ x95:36 percent 28x41f2
Mixed.layer=45 percent
Degrees 2e 12 8 4 I I 'I' 1·11 I II I I'll '111'111111 I I I I I I
Angstroms 7 10 14 17
EXPLANATION
Base lines, first interpretation
Base lines, second interpretation
Glycol treated
Heated 300°C
Heated 550oc
FIGURE 4.-The efrect of bueline position on quantitative interpretation of X-ray diffractometer traces. The two interpretations illustrate derivations of the percentages in first two horizontal rows for sample 259543, column 5, table 3.
QUANTITATIVE INTERPRETATION OF MINERALOGICAL COMPOSITIO?'·J C15
tively large particles of feldspar that in the powder sa1nples readily orient parallel to cleavage faces. The reproducibility of X-ray intensity relations for feldspar in these samples may be considerably outside the expected limits unless the samples are especially ground or unless averages of several repeated runs are used. Sample 259550 (table 3) illustrates this. The general si1nilarity of n1ost values in table 3, however, shows that most minerals in the Pierre Shale are sufficiently finegrained that they behave like ideal powders for diffraction studies. This fine-grained characteristic is also illustrated by the uniform results from repeated analyses made for calcite and quartz each in 11 samples, as shown in table 4.
8 ......
60fCI
i I 11
50 I \ II i \ I s
\
\ \ \ Cl
s \ Cl \
\
KK K
S --- Coarse feldspar in sample 259550
Cl \
\ \I
Cl K ".
K
,,, 10 ~Q
---- X
.... t\.n additional indication of the consistency of the X-ray quantitative mineralogical determinations is shown by the eight sets of duplicates in table 5. A.t the time the samples were analyzed, the duplicates were not known as such. The consistellcy of the mineralogical values is generally what would be expected from the standard deviation and coefficients of variation from tables 3 and 4 and fron1 figure 5. A.s in table 3, the values given in table 5 indicate that small amounts of nonclay minerals are not consistently detected in the X-ray analyses-for example, alunite in sample 259549 and its duplicates, and calcite and pyrite in sample 259568 and its duplicate.
I--M ---1 X ---M C
Cl
X
M X - X----iY___ Cy M X -- Cy
Q
QL---------~--------~----------~---------L----------L----------L--------~~------~ 50 70 80 60 0 10 20 30 40
AVERAGE AMOUNT DETERMINED FROM X-RAY PATTERNS, IN PERCENT
FIGURE 5.-Relatiou between coefficient of variation (0) and the average amount of each mineral determined from X-ray patterns. Cy, total clay minerals; Q, quartz; S, feldspar; K, kaollnite; Cl, chlorite; I, tllite; X, mixed-layer clay; M, montmorillonite. Data from table 3.

C16 ANALYTICAL METHODS IN GEOCHEMICAL INVESTIGATIONS OF THE PIERRE SHALE
TABLE 4.-Repeatetl X-ray analyses, in percent, for calcite and quartz in samples of Pierre Shale
Sample
S57-32-6 __ -- ------------------------S57-35A-2 __ -----------------------S57-35A-3_ ------------------------S57-35C-1 __ ------------------------S57-34-1 ___________________________ _
S57-34-2_ --------------------------S57-34-3_----- ----------------------S57-35D-5N -----------------------S57-35E-2 __ ------------------------S57-30-7 ____ ----- _ -------------- _- __ To57-1-3 _____________ ---- __________ _
Calculated values Determi- ±standard deviation Coefficient nations (range of determina- of variation
tions in parentheses)
Calcite
5 11 11 11 11 6 6 6 6 6 5
55±3. 0 (53-60) 43±1. 5 (41-45) 42±1. 0 (41-44) 44±1. 0 (41-44) 28±2. 2 (2&-32) 41±1. 9 (39-43) 21±1. 3 (2Q-23) 47±1. b (44-48) 47±5.0 (4Q-50) 88±3. 5 (84-93) 65±2. 0 (62-66)
5.5 3.5 2.4 2.3 7.8 4.6 6.2 3.2
10.5 4.0 3.1
Average __ ------------------ ___ ----------- ---------------------- 4. 8
S57-35B-L _ -----------------------S57-35A-2 __ ------------------------857-35A-6 __ ------------------------857-34-3_-- -------------------------857-'35D-3_----- --------------------857-35D-5 ______ ---- _______________ _ 857-'35D-6 ___ -----------------------857-35E-2 __ ------------------------857-35E-3 __ ------------------------G57-4-26L _________________________ _
S57-35A-3 ______ --------------------
Quartz
5 12±1. 8 (ll. Q-12. 5) 6 6±0. 4 (5. 5- 6. 5) 6 18±1.0 (17.Q-19.5) 6 13±0. 8 (12. Q-14. 0) 5 19±1. 5 (17. 5-21. 0) 6 16±0. 8 (15. Q-16. 5) 6 21±1. 0 (19. 5-22. 5) 6 12±0. 3 (11. 5-12. 0) 6 12±0. 5 (11. 5-12. 5) 5 37 ±1. 0 (35. Q-37 0 5) 6 1±0.2 (l.Q- 1.5)
15.0 6. 7 5.6 6.2 7.9 5.0 4.8 2.5 4.2 2. 7
120.0
Average_--------------------- ------------ __ -------------------- 6.1
1 Not included in average.
LONG-TERM REPRODUCIBILITY
Results illustrated in table 3 were obtained from carefully prepared samples having good orientation of the oriented aggregates; all samples were treated in exactly the same manner and run on the same Norelco X-ray machine during a 3-month period in late 1958 and early 1959. In contrast, X-ray data for the Pierre study, as a whole, have been obtained over a period of several years by using two different machines and three goniometers. To determine if the reproducibility indicated in table 3 could be maintained under these conditions, three additional sets of analyses of the same group of three samples were obtained under less ideal conditions (table 6). The first set of analyses were run in November 1957 on one X-ray machine, and the two additional sets were run in 1960 on each of two goniometers mounted on another machine. Even when pyrite, dolomite, gypsum, and clinoptilolite are excluded from consideration because they occur as such small amounts and when an average of the standard deviations for each mineral in the three samples is used (table 7) , less than half of the determinations are within one standard de viation of the mean for each mineral reported in table 3. Because maintenance of the same degree of reproduci-
TABLE 5.-X-ray mineralogical analyses in percent, of unknown duplicate samples [Figures in parentheses are calculated from chemical analyses and are not included in total. ? , presence of the mineral doubtfull
Set 1 Set 2 Set 3 Set 4 Set 5 Set 6 Set 7 Set 8
Constituent ----- -·--.,----:-----:---1------:---1--·---:---1
259597 259596 259599 259603 1259604 259598 259601 259600 259602 259605 259533 (dupli- 259549 (dupli- (dupli- (dupli- 259553 (dupli- 259565 (dupli- 259568 (dupli- 259580 (dupli- 259582 (duoli- 259586 (dupli-
cate) cate) cate) cate) c'lte) cate) cate) cate) cate) cate)
--'-----------·1------------------------------------------Clay minerals:
Montmorillonite __ ------------ 43 Mixed-layer___________________ 37
g~i~rite~:::::::::::::::::::::: 1~ Kaolinite______________________ 3
Whole rock: Total clay minerals___________ 45
8~~~balite::::::::::::::::::: a~ Feldspar:
Predominantly potassium
41 37 16 4 2
45 5
45 12
40 14
40 13
35 9
34 29 21 6
10
40 9
35 34 17 6 8
35 6
35 28 25 6 6
70 22
30 34 26
7 3
70 21
22 38 21 9
10
70 25
19 39 23
7 12
65 21
24 39 25
7 5
70 19
25 42 22 5 6
70 22
25 40 22
5 8
65 19
28 35 30 37 48 53 22 12 11 ~ -----5- -----6-
60 21
80 19
80 19
30 ------- ------- ------- ------- ------- ------- ------- ------- ------- ------- ------- ------- ------- ------- ------- -------
feldspar _________________ ------- ------- ------- _______ ------- ____________________________ ------- ------- ------- ------- ------- ------- ------- ------- -------
~~g~r~~~a~~~~~~~~ -----i- ----T ::::::: ----T ----T ::::::: ----T ----T -----~- -----~- -----2- -----~- -----~- -----~- _____ :_ -----=- -----=- -----~-
~~f~~~l~~~l~~~~=~~~~~ ~~~~~i~ ~~il~~~ ===jl~i ==;~l~ =====1= =====~= ~~(~) ~;'(40) ~~·1m ~~~~111 =·(;I ~~~·<·; ~~~111) =--11l~ ~~11~) ~~~:(:) ~~:mi :~~;m Pyrite_________________________ 1(1) 2(1) 15(18) 20(7) 20(4) 20(4) 4(4) 2 ------- ------- 0(1) 1 ------- ------- 10(8) 15(3) ------- -------
Cllno:::~~-::::::::::::::::: ~ :~ ~:~~ ~~~----*~:~ ~~~ ~ ~=;;~:~ . t Also contains 12 percent organic matter.
bility requires that two-thirds of the values be within one standard deviation, the short-term reproduci:bility was not maintained under the conditions in which data for the Pierre study have been accumulated.
The probable increase in variability due to lapse of time and use of different apparatus was estimated by trial and error adjustment of the standard deviations to
the point that the required two-thirds of the determinations for each mineral in table 6 came within one empirical standard deviation on each side of the meanvalues given in table 3. Significant differences between the empirical and average standard deviations (table 7) are the larger empirical standard deviations for montmorillonite, mixed-layer clay, and, to a lesser extent,
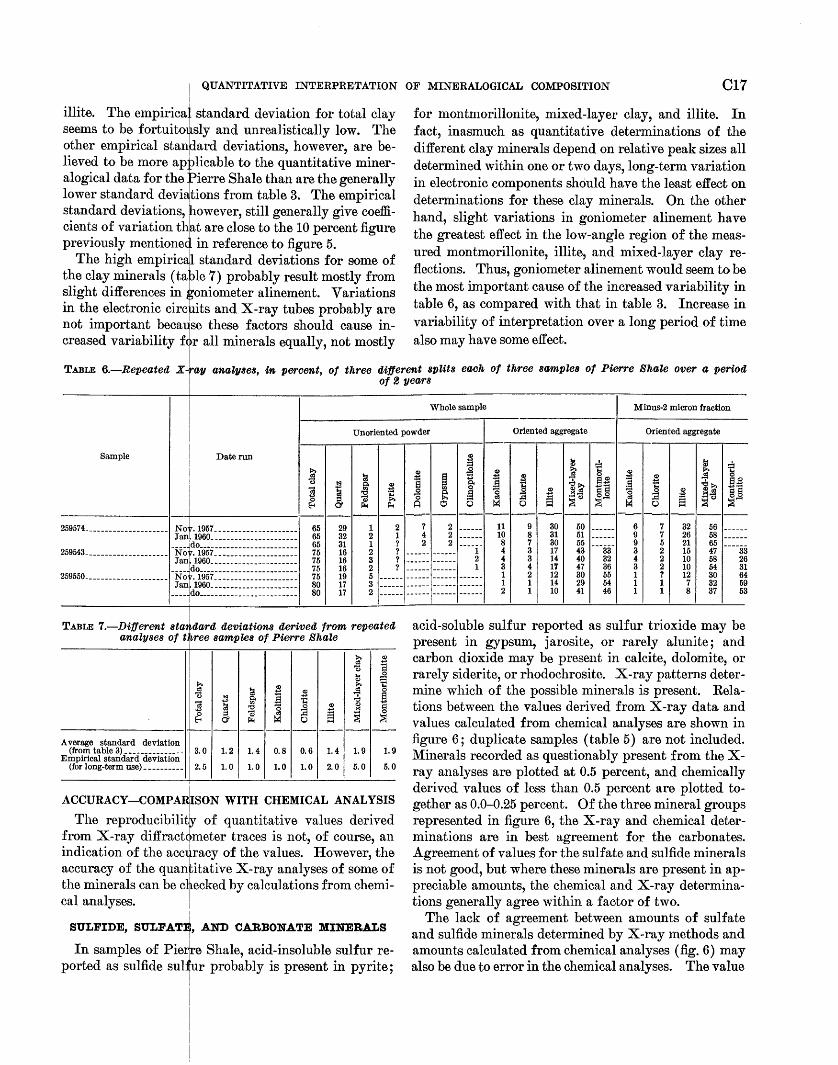
1 QUANTITATIVE INTERPRETATION OF MINERALOGICAL COMPOSITION C17 I
illite. The e1npiricaf standard deviation for total clay for montmorillonite, mixed-layer clay, and illite. In seems to be fortuitolil.sly and unrealistically low. The fact, inasmuch as quantitative determinations of the other empirical stan~ard deviations, however, are be- different clay minerals depend on relative peak sizes all lieved to be more aptlicable to the quantitative miner- determined within one or two days, long-term variation alogical data for the rierre Shale than are the generally in electronic components should have the least effect on lower standard deviajtions from table 3. The empirical determinations for these clay minerals. On the other standard deviations, ~owever, still generally give coeffi- hand, slight variations in goniometer alinement have cients of variation thdbrt are close to the 10 percent figure the greatest effect in the low-angle region of the measpreviously mentione , in reference to figure 5.
ured montmorillonite, illite, and mixed-layer clay re-The high empiric~! standard deviations for some of
the clay minerals (table 7) probably result mostly from flections. Thus, goniometer alinement would seem to be slight differences in goniometer alinement. Variations the most important cause of the increased variability in in the electronic circhits and .X-ray tubes probably are table 6, as compared with that in table 3. Increase in not important beca~se these factors should cause in- variability of interpretation over a long period of time creased variability f~r all minerals equally, not mostly also may have some effect.
TABLE 6.-Repeated x+ay analyses, in percent, of three different splits each of three samples of Pierre Shale over a period i of 2 years I
Whole sample Minus-2 micron fraction
Unoriented powder Oriented aggregate Oriented aggregate
Sample Date run
~ N Po Q)
1 ~ ~ ~
f'o4 ~ I ------
29 1 2 32 2 1 31 1 ? 16 2 ? 16 3 ? 16 2 ?
259574_____________________ Nov. 1957
259543 _____________________ -:t~~;;~i~~~~~~~~~~~~~~~~~~~~~ -: ~~ld~~~= = = = = = = = = = = === =: == = = = = 259550____________ _________ Nov. 1957 __ ------------------ _
65 65 65 75 75 75 75 80 80
19 5 ------17 3 ------17 2 -------=~}d~~~= ======= === === ==== === =
I
TABLE 1.-Different stafr,dard deviations derived from repeated analyses of three samples of Pierre ShaZe
i
~ ~ '0
~ '"' ~ CD
~ ~ ~ ~ ! 0
3 ~ ~ :§ ;::: § ~ '0 ! .Sl ~
Cl)
§ M 0 ::l "W .d ~ ~ E-t Ci f'o4 0
------------I Average standard deviation I
(from table 3) --------------- ! 3.0 1. 2 1.4 0.8 0.6 1.4 1.9 1.9 Empirical standard deviation
I (for long-term use) __________ 12.5 1.0 1.0 1.0 1.0 2.0 5.0 5.0
ACCURACY-COMPA~ISON WITH CHEMICAL ANALYSIS
The reproducibilit~ of quantitative values derived from X-ray diffractq·1neter traces is not, of course, an indication of the acciracy of the values. However, the accuracy of the quantitative X-ray analyses of some of the minerals can be clb.ecked by calculations from chemi-cal analyses. I
I
I
SULFIDE, SULFAT~, AND CARBONATE MINERALS
In samples of Pierke Shale, acid-insoluble sulfur reported as sulfide sulfur probably is present in pyrite;
Q)
~ J ~ ~ ~ CD
I :§! Q)
Q) ~ Q) Q) ~ ~ ~ ~ ~
! ~ .0~ a~
~ 1:: :6>. a~ a s 0 ~ Cl) §.:!! "'=§ s Cl) .§~ @] 0 ~ :§ .d s ~Q ~- .d ~ A 0 0 0 1-1 ~ 0 ~ ~ ---------------------------? 2 ------ 11 9 30 50 6 7 32 56 4 2 ------ 10 8 31 51 9 7 26 58 2 2 8 7 30 55 ---33- 9 5 21 65 ----33 ------ ------ ----r 4 3 17 43 3 2 15 47
------ ------ 2 4 3 14 40 32 4 2 10 58 26 ------ ------ 1 3 4 17 47 36 3 2 10 54 31 ------ ------ ------ 1 2 12 30 55 1 ? 12 30 64 ------ ------ ------ 1 1 14 29 54 1 1 7 32 59 ------ ------ ------ 2 1 10 41 46 1 1 8 37 53
acid-soluble sulfur reported as sulfur trioxide may be present in gypsum, jarosite, or rarely alunite; and carbon dioxide may be present in calcite, dolomite, or rarely siderite, or rhodochrosite. X-ray patterns determine which of the possible minerals is present. Relations between the values derived from X-ray data and values calculated from chemical analyses are shown in figure 6; duplicate samples (table 5) are not included. Minerals recorded as questionably present from the Xray analyses are plotted at 0.5 percent, and chemically derived values of less than 0.5 percent are plotted together as 0.0-0.25 percent. Of the three mineral groups represented in figure 6, the X-ray and chemical determinations are in best agreement for the carbonates. Agreement of values for the sulfate and sulfide minerals is not good, but where these minerals are present in appreciable amounts, the chemical and X-ray determinations generally agree within a factor of two.
The lack of agreement between amounts of sulfate and sulfide minerals determined by X-ray methods and amounts calculated from chemical analyses (fig. 6) may also be due to error in the chemical analyses. The value

Cl8 ANALYTICAL METHODS IN GEOCHEMICAL INVESTIGATIONS OF THE PIERRE SHALE
Carbonate minerals
2
w )()(
Expanded 42 scale for. samples
X small values 0
0 0 20 40 60 80
Sulfate minerals
5 10 15 20
Sulfide minerals
o~~~----~------o 2 0 5 10 15 20
X-RAY ANALYSIS, IN PERCENT
FIGURE 6.-Comparison of quantitative determinations of carbonate, sulfate, and sulfide minerals derived by X-ray methods and by chemical analysis. Points that fall within shaded areas on graphs represent d1ilerences of less than 10 percent between amounts determined by X-ray and chemical methods.
determined for ferrous oxide in the presence of organic matter such as occurs in most samples of Pierre Shale is uncertain, and the amount of ferric iron is assumed to be the difference between total iron and ferrous iron. These less dependable chemical determinations may limit the amount of pyrite and jarosite that can be calculated from the chemical analyses (such as sample 259549 and its duplicates, table 5). Therefore, only the
graph of the carbonate minerals (fig. 6) may reflect the accuracy of the X-ray determinations.
ALUMDTA
Nearly all of the alumina in samples of Pierre Shale occurs in the clay minerals. Feldspar is the only other alumina-cQntaining mineral found in most samples, and it rarely exceeds a few percent of any sample; in such amounts of feldspar, the alumina content is less than 1 percent. The chemical composition of the different clay minerals is not the same. However, the proportions in which the clay minerals occur are fairly constant for most samples of Pierre Shale. Kaolinite and chlorite compose only a few percent of the claymineral fraction of most samples although kaolinite may constitute as much as 10 to 15 percent of this fraction in a few samples. Illite commonly composes 15 to 25 percent of the clay-mineral fraction. Montmorillonite and mixed-layer clay are the dominant clay minerals. The montmorillonite, illite, and mixed-layer clays are the common aluminous varieties. Therefore, theoretically, the amount of alumina should bear a fairly consistent relation to the total clay content in each sample and should provide a rough check on the reliability of the X-ray-determined values for total clay.
Values for total clay and alumina are compared in figure 7. If the middle dashed line in figure 7 represents the average alumina content for a given percentage of total clay in the Pierre Shale, most of the points plot outside the limits expected from either the 3.0-percent average or the 2.5-percent empirical standard deviation for total clay shown in table 7. However, about two-thirds of the samples plot within the 10 percent coefficient of variation indicated by figure 5. Furthermore, some of the scatter of points on figure 7 may be caused by different clay-mineral composition of the samples. Of the clay minerals. in the Pierre Shale, the relative amounts of kaolinite and montmorillonite should have the most pronounced effect on the alumina content (fig. 7). Samples having unusually high montmorillonite: kaolinite ratios should have relatively low alumina content, because kaolinite contains 40 percent alumina, whereas montmorillonite like that in the Pierre probably contains only about 16 to 20 percent. A.s expected (fig. 7), the more kaolinitic samples (low montmorillonite: kaolinite ratio) are generally plotted above the average alumina content, and the more montmorillonitic samples are plotted below the average.
Figure 8 shows an evaluation of the relative importance of errors in total clay values and of the effect of different proportions of the clay minerals as causes for

QUANTITATIVE INTERPRETATION OF MINERALOGICAL COMPOSITION 019
1-z UJ () a: UJ a. z
0 N
<
20
0::: 15 0 L&..
en z 0 t= <( z ~ a: UJ
tw 0
-' <(
S:2 ::! UJ J: () 10
I , I I ,
I , , , I
I I
.~,' ·~I '(§,'
~,' ·~,'
ctt:J,' ..... ~, ~,'
I I ,
I
, , I ,
; , , I ,
I ,
, , ,
, I ,
I ,
EXPLANATION X-6
Sample of Pierre Shale Numbers are ratio, montmorillonite
kaolinite
50 60 70 80 90 100
X-RAY DETERMINATION FOR TOTAL CLAY, IN PERCENT
FmuRm 7.-Comparlson of chemical determinations for alumina and determinations for total clay derived from X-ray diffractometer data for the Pierre Shale.
scatter of points on figure 7. A theoretical amount of alumina for each sample is calculated by multiplying the determined amount of each significant aluminabearing mineral by an alumina content assumed to be reasonable for that mineral. The amount of each clay
mineral in the sample is the product of its proportion in the clay fraction and the amount of total clay in the sample. For example, the alumina content shown in figure 8 for sample 259543 (fig. 3) is calculated as follows:

C20 ANALYTICAL METHODS IN GEOCHEMICAL INVESTIGATIONS OF THE PIERRE SHALE
OaZculation of alumina from X-rau data
[Total clay is 75 percent (rounded) of whole sample]
Alumina
Mineral
Clay minerals:
Percent of total
clay (1)
Percent of whole sample (2; 1X75 percent)
Percent of mineral
(3)
Percent of whole sample (2X3)
Montmorillonite_______________ 33 24 18 4. 46 Mixed-layer clay--------------- 43 32 20 6. 45 Illite___________________________ 17 13 27 3.44 Chlorite_---------------------- 3 2 17 . 38 Kaolinite._-------------------- 4 3 40 1. 20
Feldspar--------------------------- ---------- 2 22 . 44
TotaL----------------------- 100 ------------ ------------ 16.37
Total alumina determined from chemical analyses _____ ---------- ------------ ------------ 15.92
The points on figure 8 are scattered much less than they are on figure 7, and they more realistically portray the probable accuracy of determinations for total clay. Even if all the scatter of points on figure 8 is attributed to error in the total clay determinations, the indicated accuracy clearly is within the coefficient of variation of 10 percent previously mentioned in reference to figure 5.
An additional conclusion may be derived from figure 8, namely, that errors in total clay values probably cause the greatest observed deviations from the ideal 1: 1 ratio of chemically determined alumina and alu~ mina calculated from X-ray data. Two of the three samples that give alumina values of more than 10 percent in excess of the chemically determined alumina (plot below shaded area, fig. 8) have a total of minerals calculated from X-ray that is in excess of 100 percent; obviously, for some mineral in these samples the determination is too large. In these samples, inasmuch as determined feldspar is only 1 to 2 percent, determined amounts cannot possibly exceed the true amounts sufficiently to explain the abnormally high alumina calculated from X-ray data. The determinations that must be high are those for the only other common aluminabearing minerals in these samples, the clays.
On the other end of the scale, the total amount of minerals determined for the four samples that are plotted farthest above the ideal 1 : 1 ratio (fig. 8) is 88 to 90 percent. The 10 to 12 percent of these samples not determined probably is not amorphous silica, for silica alone would not affect the alumina calculations. It probably is not feldspar either, because, if it were, the 2 to 4 percent feldspar determinations for these samples would correspond to true values of 12 to 16 percent; an error of this magnitude for all four samples is extremely unlikely. The only remaining common alumina-bearing minerals that can be responsible for the 10 to 12 percent deficiency in the total sample and the deficiency of about 2 percent in alumina calculated from X-ray data are the clays.
LOWER LIMITS OF DETECTION
Data in table 3 and figure 5 suggest that generally a mineral must be uniformly distributed in a sample in amounts of 2 percent or more before it is consistently detected in the X-ray analyses. In no sample is the mineral detected if present in amounts of less than 0.5 percent. These lower limits of detection depend to some extent upon the inherent diffracting ability of the different minerals (see table 1). To be consistently detected, a mineral must give a peak height of about 5 to 10 cps above background. Quartz, for example, tends to give large peaks and may be consistently detected in amounts of only 1 percent, whereas the lower limit of detection for pyrite generally is 2 percent or greater. Interference of X-ray reflections from other n1inerals also may raise the lower limit of detection. For example, either plagioclase or clinoptilolite could mask the main X-ray peak for a small amount of cristobalite, and a combination of X-ray diffraction peaks from illite and gypsum can hide the two main peaks of jarosite.
MINERALOGICAL OCCURRENCE OF PRINCIPAL CHEMICAL ELEMENTS
CALCULATIONS DESCRIBED IN THE LITERATURE
Calculation of the mineralogical composition of a rock from its chemical composition was first proposed by Cross, Iddings, Pirsson, and vVashington ( 1903). By their system, generally known as the CIPW System, a chemical analysis is used to calculate a theoretical mineral composition called the norm of the rock. The norm includes minerals of simple chemical composition that may have crystallized from a magma having the chemical composition of the rock. Minerals having complex and variable chemical compositions like the micas, garnets, and aluminous amphiboles and pyroxenes are not included as norm minerals. The calculated norm may or may not agree closely with the actual (modal) mineralogical composition of the rock. CIPW normative calculations have been widely applied to igneous rocks.
Krumbein and Pettijohn (1938, p. 490-492) indicated the possible value of chemical analyses in identifying minerals in fine-grained sedimentary rocks and gave an example of the calculation of the norm of a graywacke. They assumed that the constituents occurred in minerals like kaolinite or amesite to which they ascribed simple, fixed chemical compositions. They also pointed out that the calculations were only asappropriate as were the assumptions underlying them.
Such an approach has been more fully explained by both Miesch and Nicholls. Miesch (1962) calculated the possible range of the gross mineral composition of

QUANTITATIVE INTERPRETATION OF MINERALOGICAL COMPOSITION C21
18 •
1-z w (.)
16 0::: w a..
~ en 0 0 :c 1-w :2: 14 ...J <( (.)
~ w :c (.)
>-co 0
12 w z ~ 0::: w 1-w 0
EXPLANATION
~ 10 <
• Samp-le of Pierre Shale
•
8
8 10 12 14 16 18 20
Al 20-3 CALCULATED FROM X-RAY DATA, IN PERCENT
FIGURE 8.-Comparison of chemical determinations for alumina and calculations for alumina from X-ray data. Points that fall within shaded area represent differences of less than 10 percent between amounts determined by X-ray and chemical methods.
rocks from chemical composition and known mineral occurrence of some of the chemical constituents. Nicholls ( 1962) proposed a scheme for recalculating chemical analyses first into normative formulae representing ideal muscovite, paragonite, kaolinite, magnesian antigorite, and iron antigorite, which in turn may be regrouped into normative minerals of more probable chemical composition such as illite, chlorite, and kaolinite.
724-487---64-4
Imbrie and Poldervaart ( 1959) described a method for the calculation of mineral composition from chemical analyses of sedimentary rocks which contain minerals of complex and variable composition, including montmorillonite, illite, and chlorite. In the shale studied by them, these minerals were carefully determined, using several analytical techniques. Once the norm minerals were determined and the chemical compositions of these minerals were assumed, the amounts

C22 ANALYTICAL METHODS IN GEOCHEMICAL INVESTIGATIONS OF THE PIERRE SHALE
of each norm mineral in the individual samples were determined by rigidly following a sequence of steps and allotting the chemical elements to the different norm minerals. This method obtained a good agreement between norm values, amounts of insoluble residues, and X-ray quantitative values for percent of carbonates, quartz, and total clay minerals (Imbrie and Poldervaart, 1959, tables 5 and 6). However, there was little agreement between the norm calculations and X-ray values for the various clay minerals.
A good agreement between X-ray mode and chemical norm for a sample containing mainly muscovite, chlorite, and plagioclase was obtained by Zen ( 1960, p. 135). The investigated rocks were sufficiently coarse grained that optical properties and chemical composition of individual minerals could be determined. Such is not true for samples of Pierre Shale.
PIEBBE SHALE
The objective of the chemical-mineralogical calculations for the Pierre Shale is to allot the chemical constituents as realistically and accurately as possible to mi;nerals known to occur in each sample. This objective allows a comparison of X-ray and chemical data to make sure they are not conflicting, and facilitates a study of compositional similarities and differences between groups of samples.
Most of the chemical constituents in the Pierre Shale can occur in several minerals, and many of these minerals in the Pierre may vary in composition. For example, alumina occurs in feldspar, in all five of the clay minerals, and also in clinoptilolite or alunite in a few samples. In fact, all the chemical components that commonly amount to more than 1 percent in the analyses· of Pierre Shale have multiple mineralogical occurrences. Therefore, X-ray data are used to help assign t~e proper amount of the more common elements to minerals; the X-ray data are used not only to help identify minerals present in individual samples, but also to determine the amounts of several of the minerals calculated from the chemical analysis.
The moderate variation in the mineralogical composition of the Pierre Shale permits some procedures and assumptions about chemical composition of minerals that would not be justified for all sedimentary rocks. The composition of minerals which make up only a minor part of the Pierre Shale does not need to be known as accurately as does the composition of the major mineral constituents.
BASIS OF CALCULATIONS
Minerals in the Pierre Shale are divided into three groups on the basis of the method used for calculating their amounts and compositions.
In the first group, a unique constituent in the chemical analysis is the primary basis for calculating the abundance of the mineral. This group contains minerals such as pyrite, apatite, and the carbonate minerals. Xray data aid in determining exactly the composition of the minerals in this group that are somewhat variable, such as apatite and the carbonates, but the X-ray determinations have little or no relation to the amount of the minerals calculated.
The second group includes minerals, such as kaolinite, the feldspars, illite, and chlorite, that have no unique chemical constituent to determine their abundance. Compositions of some of the minerals are almost unvariable, but the compositions of others may be highly variable, and assumptions have to be made. Because most of the minerals in this group that vary considerably in composition are present in Pierre samples only in small amounts, the effect of assumed chemical formulae in the overall calculations is small. The X-ray data provide the only basis for distributing the chemical elements in such minerals.
The third group of minerals contains montmorillonite and mixed-layer illite-montmorillonite, both of which may vary considerably in chemical composition. These minerals commonly make up half or more of most samples of Pierre Shale, and any errors in assumed chemical composition would have considerable effect on the overall chemical calculations. Therefore these two minerals are grouped together, and all chemical elements not assigned to other minerals are assigned to them.
Frequent reference to plate 1 may help the reader to understand the following discussion of the individual minerals.
CHEMICAL COMPOSITION OF MINERALS
MINERALS CALCULATED PRIMARILY FROM CHEMICAL ANALYSES
APATITE
Apatite is the principal mineral in some concretions in the Pierre Shale, but in the shale itself, apatite is detected only rarely by X-ray techniques. Petrographic examination of thin sections and heavy mineral separates reveals apatite in some shale samples in amounts too small to be detected by X-ray analysis. Small amounts of phosphate also may be adsorbed on the clay minerals.
In the Pierre Shale, the common range for chemically determined phosphorous pentoxide is about 0.05 to 0.30 percent, and most determinations are in the smaHer end of this range. For the chemical-mineralogical calculations, phosphorous pentoxide in amounts .less than 0.5 percent is disregarded because it is of uncertain mineralogical occurrence, and because if phosphorus having

QUANTITATIVE INTERPRETATION OF MINERALOGICAL COMPOSITION C23
appropriate amounts of other constituents is calculated as apatite, the remaining amount of calcium in many samples is insufficient for other determined calciumbearing minerals. In amounts of 0.5 percent or greater, phosphorous pentoxide is calculated as apatite. X-ray and chemical data indicate that apatite in the Pierre Shale is a carbonate-fluorapatite similar to that described by Altschuler, Clarke, and Young ( 1958, p. 49) . In chemical calculations for the Pierre Shale, apatite is assumed to contain 55 percent calcium oxide, 38 percent phosphorous pentoxide, 4 percent fluorine, and 3 percent carbon dioxide. Errors introduced by this procedure will not significantly affect most calculations, as apatite generally is at most a very minor component in the Pierre Shale.
PYRITE (FeS2)
Pyrite has a relatively simple and unvarying chemical formula. It is the only sulfide mineral known to occur in the Pierre Shale; thus, the amount of pyrite can be calculated from the amount of acid-insoluble sulfur reported as sulfide sulfur, in the chemical analysis, unless there is reason to consider the effects of barite on the determination of insoluble sulfur.
BARITE (BaSQ,)
Most sulfate minerals are soluble under the conditions by which acid-soluble sulfur is determined. The amount of acid-soluble sulfur is subtracted from the amount of total sulfur to give a value for acid-insoluble sulfur. Barite, however, is insoluble under conditions by which acid-soluble sulfur is determined and, therefore, if barite is present, its sulfur is reported with acid-insoluble sulfur as sulfide sulfur. Unless suitable corrections are made, the amount of sulfur in barite will be used in calculating the amount of pyrite.
Although in a few places barite occurs as nodules in the Pierre Shale, in the shale itself it has not been recognized either petrographically or on X-ray traces. The commonly reported range for barium oxide in the Pierre Shale is 0.02 to 0.2 percent; most determinations are in the smaller end of this range. In such small amounts, barium oxide is disregarded in the chemicalmineralogical calculations. If reported in amounts of 0.5 percent or greater, barium oxide is calculated as barite and an appropriate correction is made in the amount of acid-insoluble sulfur. In the great majority of samples, the amount of barium is so small that errors in this procedure will not appreciably influence the calculations.
GYPSUM (CaS0,·2H20)
Unless X-ray or other data indicate presence of other sulfate minerals, all acid-soluble sulfur reported as sui-
fur trioxide in the chemical analyses and the necessary amounts of calcium oxide and water are assigned to gypsum. Where calculated to be present in amounts of 2 percent or more, gypsum is invariably indicated by the X-ray patterns.
JAROSITE
Jarosite is not present in most samples of Pierre Shale, but where present, it may compose several percent of the sample. In small amounts, it is best detected by the presence of a yellow powder on the hand specimen.
The theoretical chemical formula of jarosite is KFe3 (0H) 6 (S04 ) 2• Within it, extensive substitutions are possible (Hendricks, 1937) ; sodium and hydrogen most commonly substitute for potassium, and aluminum may substitute for the iron.
X-ray patterns of the jarosite in the Pierre Shale show c-axis measurements slightly smaller than those reported by Warshaw (1956) for jarosite, indicating that the jarosite in the Pierre contains some sodium or hydrogen substituting for potassium. Furthermore, several samples of Pierre having abundant jarosite contained only one-third to two-thirds of the potassium oxide needed to explain the sulfate reported in the chemical analysis as ideal jarosite. In a semiquantitative spectrographic analysis of a nearly pure jarosite separated from the Pierre Shale, 1 to 2 percent sodium oxide was reported; this is not enough sodium to make up for the deficiency in potassium in most jarositebearing samples. The fact that only samples containing jarosite have determinations ·for water-soluble sulfate in excess of 1 percent indicates that jarosite in the Pierre is slightly soluble in water. Yet, these same samples yield not enough water-soluble potassium and sodium to explain the water-soluble sulfate as a sodium jarosite. All the dissolved solutions, however, give a pH of 2 to 4, which is lower than any of the pH values determined for samples without jarosite. Apparently, appreciable numbers of hydrogen or hydronium (H30+) as well as sodium ions substitute for potassium ions in jarosite in the Pierre Shale.
For chemical calculations of the PieiTe Shale, jarosite is assumed to have the composition (K~Na~H~)Fe3(0H6)(S04)2 • Inaccuracies in this assumed composition may cause considerable error in the chemical calculations for a few samples, but inasmuch as most samples contain no jarosite, the assumption only rarely enters into the calculations.
ALUNITE [KAk(OHe) (SQ,)2]
Alunite, the aluminous analogue of jarosite, is found in a few samples of Pierre Shale. Its X-ray pattern closely matches that of a pure alunite. Where alunite

C24 ANALYTICAL METHODS IN GEOCHEMICAL INVESTIGATIONS OF THE PIERRE SHALE
is indicated by X-ray or other data, it is calculated as having the ideal chemical composition.
WATER-SOLUBLE SALTS
Amounts of water-soluble calcium, magnesium, sodium, potassium, sulfate, and iron were determined for 65 samples. The most abundant soluble ions comn1only are sodium and sulfate. A good correlation between reported water-soluble calcium and the presence of gypsum reflections on X-ray traces indicates that watersoluble calcium comes from gypsum; it is so assigned in the calculations. If water-soluble sulfate, potassium, and sodium apparently come from jarosite, they are so assigned. Water-soluble salts in amounts over 0.5 percent that have no obvious mineral affinity are listed simply as water-soluble ions. In amounts below 0.5 percent, which are most conunon, the water-soluble components are disregarded. For most samples, errors caused by using such a procedure wili be small.
CARBONATE MINERALS
Calcite (CaCOa) and dolomite [CaMg(C03 ) 2] in samples of shale from the Pierre have compositions near those of the ideal end members. Unless a carbonate other than calcite is indicated by the X-ray data, all carbon dioxide reported in the chemical analysis is calculated as calcite. If both calcite and dolomite are indicated, carbon dioxide is calculated as calcite and dolomite in proportions indicated by the X-ray analysis.
All siderite and rhodochrosite in the Pierre as well ' as calcite in nodules or concretions from the Pierre, are
mixed carbonates having extensive substitutions of calcium, magnesium, ferrous, and manganese ions. Chemical analyses indicate that ratios of weight percents of CaO: MgO : FeO are generally about 35 : 2: 3 for the mixed calcite and about 3 : 2 : 15 for siderite.
All fresh shale samples from the Pierre having manganese oxide values of over 0.1 percent contain appreciable carbon dioxide, and X-ray data usually indicate either siderite, calcite, or rhodochrosite. Therefore, although small amounts of manganese may occur in the clay mineral structures, amounts in excess of 0.1 percent probably occur as carbonate and they are so assigned. Rhodochrosite in the Pierre is of a highly mixed variety. Most of the rhodochrosite is composed of slightly more than half maganese carbonate; the remaining part is composed of calcium and iron carbonate in about equal amounts and magnesium carbonate in smaller amounts. In siderite, amounts of manganese oxide range from 0.5 percent to nearly 10 percent, and, in mixed calcite, amounts of manganese oxide are as high as 5 percent. Therefore, no common or general ratio for manganese oxide in these minerals can be given.
The procedure adopted for mixed carbonates in the chemical-mineralogical calculations for the Pierre Shale is to assign manganese oxide below 0.1 percent to the clay minerals, and to assign manganese oxide in excess of 0.1 percent to the carbonate mineral indicated to be present by .X-ray data. The carbon dioxide not combined with manganese is combined with calcium, magnesium, and ferrous iron oxide in the ratios of 2: 1: 2 for rhodochrosite, 3: 2: 15 for siderite, and 35:2:3 for mixed calcite. Where necessary, these ratios are adjusted to accommodate the chemical analyses of the individual samples.
The aforesaid procedures for pure calcite and dolomite should cause little error in the chemical-mineralogical calculations. The procedures for the mixed carbonates can cause greater error. Fortunately, pure calcite and dolomite are the common carbonates in most shale samples from the Pierre; mixed carbonates are rare.
MINERALS CALCULATED PRllMARILY FROM X-RAY DATA
FELDSPAR
Assignment of chemical elements to feldspar is dependent on the .X-ray data. Where the composition of plagioclase in the Pierre can be determined, it is commonly 20-40 percent anorthite. Therefore, if plagioclase is determined to be the dominant feldspar, the elements are assigned in ratios corresponding to a composition of 30 percent anorthite which is comprised of 61 weight-percent silica, 25 weight-percent alumina, 6 weight-percent calcium oxide, and 8 weightpercent sodium oxide. If potassium feldspar is dominant, the elements are assigned in the ratios of 65 percent silica, 18 percent alumina, and 17 percent potassium oxide, a composition corresponding to the ideal formula of KAlSiaOs. If the dominant type of feldspar is not determined, as commonly happens where only 1 to 2 percent feldspar is indicated, then half is assumed to be plagioclase and half is assumed to be potassium feldspar, and the elements are assigned in ratios of 63 percent silica, 22 percent alumina, 3 percent calcium oxide, 4 percent sodium oxide, and 8 percent potassium oxide.
Because most feldspar values are small, errors due to inappropriate assumptions for chemical composition will also be small.
CLINOPTILOLITE ( N a4KA15.5Siso.5072 ·19H20)
The assumed formula for clinoptilolite is simplified from a formula-(Mg.12Ca.19N aa.7sl{1.os) 5.1sA15.49Siao.5 0 72 • 19H20-given by Mason and Sand (1960, p. 346). Inasmuch as this mineral is generally present only in small amounts in the Pierre Shale, slight deviations
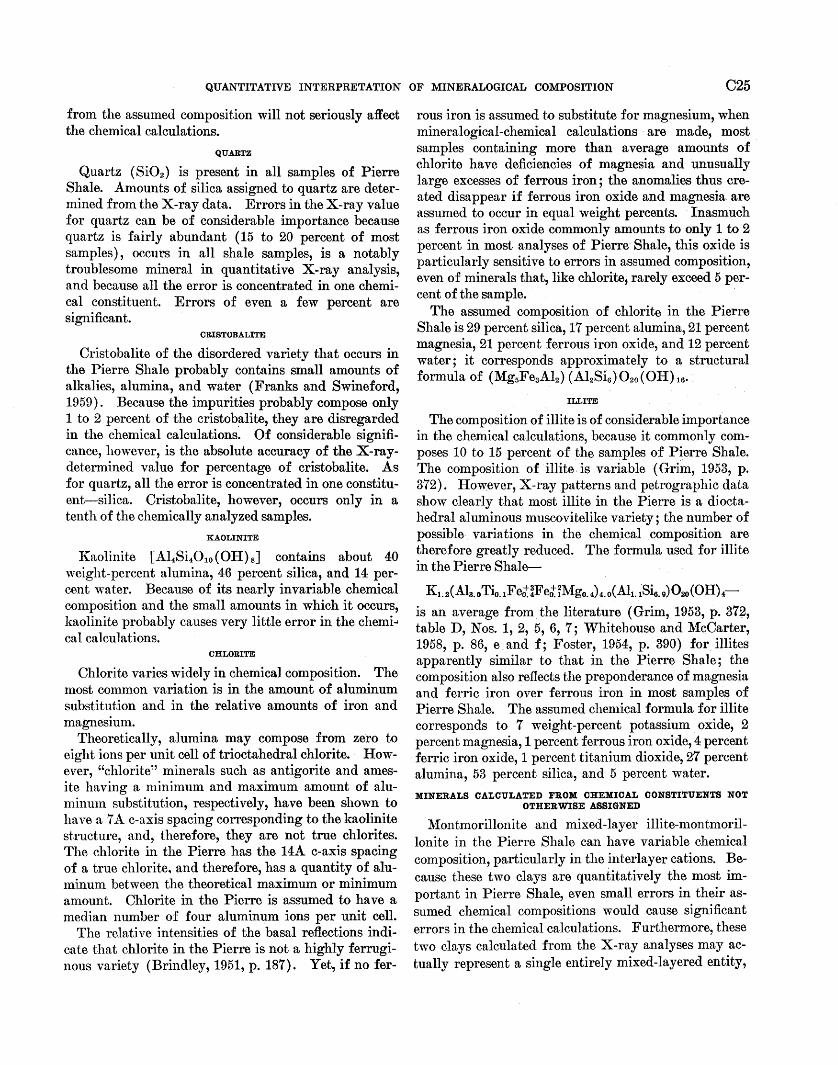
QUANTITATIVE INTERPRETATION OF MINERALOGICAL COMPOSITION C25
from the assumed composition will not seriously affect the chemical calculations.
QUARTZ
Quartz (Si02) is present in all samples of Pierre Shale. Amounts of silica assigned to quartz are determined from the X-ray data. Errors in the X-ray value for quartz can be of considerable importance because quartz is fairly abundant (15 to 20 percent of most samples), occurs in all shale samples, is a notably troublesome mineral in quantitative X-ray analysis, and because all the error is concentrated in one chemical constituent. Errors of even a few percent are significant.
CRISTOBALITE
Cristobalite of the disordered variety that occurs in the Pierre Shale probably contains small amounts of alkalies, alumina, and water (Franks and Swineford, 1959). Because the impurities probably compose only 1 to 2 percent of the cristobalite, they are disregarded in the chemical calculations~ Of considerable significance, however, is the absolute accuracy of the .X-raydetermined value for percentage of cristobalite. As for quartz, all the error is concentrated in one constituent-silica. Cristobalite, however, occurs only in a tenth of the chemically analyzed samples.
KAOLINITE
Kaolinite [Al4Si4010(0H)s] contains about 40 weight-percent alumina, 46 percent silica, and 14 percent water. Because of its nearly invariable chemical composition and the small amounts in which it occurs, kaolinite probably causes very little error in the chemi-< cal calculations.
CHLORITE
Chlorite varies widely in chemical composition. The most common variation is in the amount of aluminum substitution and in the relative amounts of iron and magnesium.
Theoretically, alumina may compose from zero to eight ions per unit cell of trioctahedral chlorite. However, "chlorite" minerals such as antigorite and amesite having a 1ninimum and maximum amount of aluminum substitution, respectively, have been shown to have a 7 A c-axis spacing corresponding to the kaolinite structure, and, therefore, they are not true chlorites. The chlorite in the Pierre has the 14A. c-axis spacing of a true chlorite. and therefore, has a quantity of aluminum between the theoretical maximum or minimum amount. Chlorite in the Pierre is assumed to have a median number of four aluminum ions per unit cell.
The relative intensities of the basal reflections indicate that chlorite in the Pierre is not a highly ferruginous variety (Brindley, 1951, p. 187). Yet, if no fer-
rous iron is assumed to substitute for magnesium, when mineralogical-chemical calculations are made, most samples containing more than average amounts of chlorite have deficiencies of magnesia and unusually large excesses of ferrous iron; the anomalies thus created disappear if ferrous iron oxide and magnesia are assumed to occur in equal weight percents. Inasmuch as ferrous iron oxide commonly amounts to only 1 to 2 percent in most analyses of Pierre Shale, this oxide is particularly sensitive to errors in assumed composition, even of minerals that, like chlorite, rarely exceed 5 percent of the sample.
The assumed composition of chlorite in the Pierre Shale is 29 percent silica, 17 percent alumina, 21 percent magnesia, 21 percent ferrous iron oxide, and 12 percent water; it corresponds approximately to a structural formula of ( Mg5FeaA.l2) ( Al2Si6) 02o ( 0 H) 16•
ILLITE
The composition of illite is of considerable importance in the chemical calculations, because it commonly composes 10 to 15 percent of the samples of Pierre Shale. The composition of 'illite. is variable (Grim, 1953, p. 372). However, X-ray patterns and petrographic data show clearly that most illite in the Pierre is a dioctahedral aluminous muscovitelike variety; the number of possible variations in the chemical composition are therefore greatly reduced. The formula used for illite in the Pierre Shale---
Kt.2(Ala.oTio.1Fet.!Fet,~Mgo.4)4.o(AlL1Si6.9)02o(OH)4-
is an average fromthe literature (Grim, 1953, p. 372, tableD, Nos. 1, 2, 5, 6, 1; Whitehouse and McCarter, 1958, p. 86, e. and f; Foster, 1954, p. 390) for illites apparently similar to that in the Pierre Shale; the composition also reflects the preponderance of magnesia and ferric iron over ferrous iron in most samples of Pierre Shale. The assumed chemical formula for illite corresponds to 1 weight-percent potassium oxide, 2 percent magnesia, 1 percent ferrous iron oxide, 4 percent ferric iron oxide, 1 percent titanium dioxide, 27 percent alumina, 53 percent silica, and 5 percent water.
MINERALS CALCULATED FROM CHEMICAL CONSTITUENTS NOT OTHERWISE ASSIGNED
Montmorillonite and mixed -layer illite-nlonbnorillonite in the Pierre Shale can have variable chemical composition, particularly in the interlayer cations. Because these two clays are quantitatively the most important in Pierre Shale, even small errors in their assumed chemical compositions would cause significant errors in the chemical calculations. Furthermore, these two clays calculated from the X-ray analyses may actually represent a single entirely mixed-layered entity,

C26 ANALYTICAL METHODS IN GEOCHEMICAL INVESTIGATIONS OF THE PIERRE SHALE
the proportions of the different types of layers varying from one sample to the next. (See discussion on p. 09-011.) Therefore, instead of using a fixed chemical formula for either mineral, all chemical elements not assigned to other minerals are assumed to occur in one of these two clay minerals. The chemical elements so assigned to montmorillonite and mixed-layer illitemontmorillonite are then calculated into a combined structural formula according to the method of Ross and Hendricks ( 1945). This method has been explained clearly by Kelley ( 1955) and is briefly illustrated under "Example of chemical-mineralogical calculations."
The calculated structural formulas for montmorillonite and mixed-layer illite-montmorillonite in the Pierre Shale are useful not only as a check on the overall accuracy of the X-ray data and the approximate validity of assumptions in the chemical calculations, but also as a basis for evaluating the variations in composition of these minerals through the Pierre Shale. The second use, of course, presupposes satisfactory results from the first.
EXAMPLE OF CHEMICAL-MINERALOGICAL CALCULATIONS
The chemical-mineralogical calculations used for the Pierre Shale are illustrated by the worksheet reproduced as plate 1. Data for sample 259543 were used for plate 1 and were used also for figure 3B and table 2. The worksheet includes space for tabulating chemical analysis, water soluble ions, pH, and X-ray quantitative data; chemical compositions assumed for minerals in the Pierre Shale are listed, and spaces are provided for assignment of chemical constituents to the different minerals. Not all the spaces are needed for recording data obtained from sample 259543, but all may be necessary for recording data from other samples of Pierre Shale. Most of the calculations are performed on the basis of weight percentages instead of the usual molar proportions because X-ray quantitative values used in parts of the calculations were made in terms of weight percents. The structural formula for montmorillonite and mixed-layer illite-montmorillonite is calculated using the last five columns and is entered in the skeletal formula at the top of the worksheet.
On plate 1, the numbers in parentheses represent the amount of each constituent remaining after calculation of each successive mineral; for example, in the third column, 1.43 percent ferrous iron oxide remains after 0.94 percent is assigned to pyrite. No apatite, barite, or water-soluble ions were calculated because amounts of phosphorous pentoxide, barium oxide, and determinations of water-soluble cations were all below the 0.5 percent limit previously mentioned. No jarosite, alunite, or dolomite were calculated, because these minerals were
not detected in the X-ray analysis. Amounts of pyrite, gyrsum, and calcite were calculated by multiplying the chemical determinations for sulfide sulfur, sulfur trioxide, and carbon dioxide, respectively, by the factors listed at the top of the columns for each of these minerals (for example, FeO in pyrite= 1.12 X 0.84=0.94 percent). For pyrite, the sum of the constituents do not equal the total amount of the mineral calculated, because the oxygen of the ferrous oxide does not occur in the pyrite. Amounts of oxides assigned to the feldspars, clinoptilolite, quartz, cristobalite, kaolinite, chlorite, and illite are the products of the X-ray modes for these minerals (listed in the row below the mineral names) and their assumed chemical compositions (listed at the top of each column). The amounts of the clay minerals are the products of the relative amounts of each clay and the total clay (for example, kaolinite= 0.04 X 75 = 3 percent).
Chemical constituents not assigned after calculation of illite are assumed to occur in the only two minerals in the Pierre Shale not yet calculated-montmorillonite and mixed-layer illite-montmorillonite. A combined structural formula for these two clay minerals is calculated in the columns to the right as follows:
1. Cation equivalents are calculated by dividing the weight percent of each oxide by the result of the molecular weight of the oxide divided by the cations per molecule (pl. 1, fifth column from the right).
2. Charge equivalents are the product of the cation equivalents multiplied by the valence of each cation. Charge equivalents are totaled at the bottom of the column. A total of 44 positive charges is needed to balance the 44 negative charges [0-2
2o
(OH-1, F-1 ) 4] in each unit cell of montmorillonite or mixed-layer illite-montmorillonite. A factor (/) was derived by dividing 44 by the sum of the charge equivalents (44/3.156=13.94). (Note: If hydrogen ions are subsequently calculated in interlayer positions, the factor (/) must be adjusted to compensate for the charge on the H+1 ions; f'=
44-H+1
sum of charge equivalents.) 3. The number of each of the cations per unit cell is the
product of the factor (/) and the cation equivalents.
4. Cations are assigned to the three different structural positions as indicated at the top of plate 1, with enough Al+3 ions substituting for Si+4 to fill all eight tetrahedral positions. Possible occurrence of aluminum, magnesium, or hydrogen in interlayer positions is discussed later.

QUANTITATIVE INTERPRETATION OF MINERALOGICAL COMPOSITION C27
DISCUSSION
The structural formula calculated in plate 1 is typical of the formulas calculated for montmorillonite and mixed-layer clay in the Pierre Shale. The formula is close to that expected for a dioctahedral, aluminous montmorillonitic clay. For all samples calculated, the most consistent discrepancy is that the determinations for total octahedral cations are commonly slightly below 4 per unit cell; in a very few samples silicon ions exceed the theoretical limit of eight per unit cell. Both discrepancies could result from assigning too much silica to the montmorillonitic clay. Significantly, the calculated total of octahedral cations for bentonites, which contain no quartz, generally is very close to 4. At least part of the deficiency of octahedral cations in montmorillonite and mixed-layer clay of the shale samples may result from assignment of insufficient Si02
to quartz, and a consequent excess of Si02 assigned to the clay. Possibly, the fine-grained quartz in the Pierre Shale is surrounded by poorly crystallized layers of silica. Gordon and Harris ( 1955) suggested that such siliea coatings would cause X-ray modes for quartz that are about 12 percent too low. For the Pierre Shale, such an error would result in quartz determinations that generally are about 2 percent low (that is, a determination of 16 percent quartz would probably represent about 18 percent silica).
Several analyses for amorphous silica in samples of Pierre Shale were made using the method of Hashi~ moto and Jackson ( 1960). The first two samples in table 8 seemed to contain excess amorphous silica, be~ cause the calculated structural formula for their mont~ morillonite and mixed-layer illite-montmorillonite had more than 8 silica molecules per unit cell. The third sample in table 8 was analyzed to determine the ap~ proximate accuraey of the cristobalite determination. The last group of samples in table 8 includes two of shale and one of bentonite (259537). These three samples were assumed to be controls having little or no amorphous silica because they caused no difficulties in the chemical-mineralogical calculations.
The dissolved silica and alumina for the control samples may be in part due to solution of crystalline silicates; for sample 259569 the silica-alumina ratio is about that expected for the clays in the Pierre Shale. The important fact shown by the table is that, although a few percent amorphous silica may be undetected (as possibly in sample 259535), the chemicalmineralogical calculations are sufficiently precise to identify samples like 259561 and 259563 that apparently contain fairly large amounts of material amorphous to X-rays.
TABLE B.-Amorphous silica and r;tlumina, in percent, in Pierre Shale
[Analyses by E. C. Mallory using method of Hashimoto and Jackson (1960; sample boiled 2~ minutes in ~N NaOH, leachate analyzed by light transmission)]
Sample I Dissolved SiOt I Dissolved AhOa
Shale samples apparently eontaining amorphous SiO:a aSISigned to elay minerals
i=A::::::::::::::::::::::::::::::::::::::::: I 17.40 I 9. 76
Shale sample eontaining 35 percent eristobalite determined by X-ray
259529.-----------------------------------~----I 34.80 1
Control samples
259535_----------------------------------------j 259537--- -------------------------- ____ ..; __ -- ---259569. -------------------------- --------------
4.481 2.60 1. 68
0.68 .61
0.85
0.39 .39 .58
The theoretical interlayer charge of. an ideal mica is 2 per unit cell. The interlayer charge of montmorillonite and mixed-layer clays, like those in the Pierre Shale, theoretically should be from a third to about two-thirds or possibly three-fourths of the interlayer charge of mica. The total of the charge on the potassium, sodium, and calcium ions calculated to occur in interlayer positions of mixed-layer clay and montmorillonite from samples of Pierre Shale are plotted as dots and squares on figure 9. Most of the Pierre samples plot within the theoretically reasonable field that is represented by the shaded area on figure 9. Other samples . plot outside the shaded area for several reasons. For example, the bentonite sample having a calculated total of 1.17 interlayer charges per unit cell contains several percent biotite for which no correction was made. The abnormally high calculated interlayer charge results from 0.35 potassium ion per unit cell, most of which actually occurs in biotite. Therefore, the shaded area is not extended to include this sample. Some of the other samples of shale that are plotted above the shaded area contain unusually small amounts of montmorillonite and mixed-layer clay; others plotted above the shaded area contain water-soluble cations. or sulfate in unknown qunntities. Calculated structural formulas for these samples therefore are less reliable than most, and they are not included in the shaded area on figure 9. If the shaded area had been extended to include them, its projected upper limit would exceed the maximum possible inter layer charge of 2 per unit cell.
A considerable group of samples also are plotted below the shaded area on figure 9. For example, three of the bentonite samples, which are composed almost entirely of montmorillonite and therefore afford very little room for errors in chemical constituents assigned

C28 ANALYTICAL METHODS IN GEOCHEMICAL INVESTIGATIONS OF THE PIERRE SHALE
to other minerals, have totals of interlayer charge from 0.17 to 0.42 per unit cell. Such totals are much below the reasonably expectable minimum. The low totals for interlayer charge plotted on figure 9 generally are related to two features: the occurrence of interlayer brucite- or gibbsite-like structures in the clay minerals and the pH of the sample slurry.
Brucite- or gibbsitelike layers in some of the clays represented on figure 9 are indicated in the X-ray traces by incomplete collapse of the first basal reflections after the samples are heated at 300°0 for half an hour (fig. 10). Additional heating at 550°0 for half an hour generally causes these interlayer structures to break down, and the clay layers collapse to a lOA spacing. Thus, the interlayer structures are not as stable as the brucite layer of chlorite which maintains
1.6
1.4
-' 1.2 -' LLJ (.)
!::: z ::::>
~ 1.0 c..
0.2
a basal spacing near 14A after heating at 550°0 for half an hour.
The method used to calculate structural formulas (pl. 1) assigns all magnesium and aluminum to octahedral or tetrahedral positions within the clay lattice. If some magnesium or aluminum actually occurs in interlayer positions, the usual procedure would produce an abnormally high total for cations in octahedral positions and also an abnormally low total for interlayer cations and the charge on those cations. These high and low totals occur for several of the Pierre samples. For example, the bentonite sample having only 0.33 positive interlayer charge per unit cell (fig. 9) has a calculated total of 4.31 octahedral cations as compared with an ideal number of 4.0 octahedral cations. Therefore, in the chemical-mineralogical calculations
EXPLANATION
Expected range for total charge on interlayer cations
• Total charge on interlayer K+I, Na+l and Ca+2 _
ions for samples with pH> 7 (alkaline). Position of Mg indicates charge after correction
for inter/oyer Mg+2 ions
D Total charge on interlayer K+I, Na+1, and Ca+2
ions for samples with pH<7 (acid). Position of H indicates charge after correction
for inter/oyer H+l ions. Position of AI indicates charge after correction
for inter/oyer AI +a ions
1.0
~~~--'M=IXED-LA YER CLAY MONTMORILLONITE+ MIXED-LAYER CLAY
FIGURE 9.-Total charge on interlayer cations of montmorlllonite and mixed-layer clay in the Pierre Shale.

QUANTITATIVE INTERPRETATION OF MINERALOGICAL COMPOSITION C29
. ..
INTENSITY (counts per second)
200
100
0
~
J I I
f:\ Jl\ 1\\
: I \ \ EXPLANATION I
: I \ \ f I ~ \ f I ~ \ i I ~ \ :I : \ =, :
f I :
if il
' l
------ I Heated 300°C I .... ... . . . .. . . . . . . . . .. I Heated 550°C
\ /.· //
\ / / '--.,.....,.. ......
~-···. ~ .... __ .. ,-
I I
I
If j/
;,./ ... -~··
12 I ',• I I I I
I 10
Degrees 26 8
II .. II lj I I Jl
14 17 ANGSTROMS
4 I
FIGURE 10.-Etl'ect of brucite- or gibbsttelike interlayers on the X-ray diffractometer traces of montmor1llonitlc clay.
for the Pierre Shale, if a sample contains detectable brucite- or gibbsitelike interlayers, and if the calculated total of octahedral cations exceeds 4.0, enough magnesium or aluminum is transferred into interlayer positions to reduce the total of octahedral cations to 4.0.
Both interlayer hydrogen (or hydronium) and aluminum ions may occur in clays having a low pH; the hydrogen ions are the cause and the aluminum ions are the effect of the acid condition. However, only the aluminum will form gibbsitelike interlayer structures that prevent complete collapse to a basal spacing of about lOA after heating at 300°0 for half an hour. Therefore, if X-ray data indicate an interlayer structure and if a low pH denotes that the clay is acid, then
aluminum ions are transferred in the structural formula to interlayer positions. If the pH shows that the clay is alkaline, the interlayer structure is assumed to be brucitelike and magnesium is transferred to interlayer positions. Such transfers generally increased the total interlayer charge until they were within the expected range shown on figure 9. For one bentonite sample, the aluminum transfer caused the total interlayer charge to exceed the expected range, probably because the charges on some of the interlayer aluminum ions are balanced by inter layer OH-1 ions for which no attempt was made to compensate.
All but one of the samples that showed no evidence of brucitelike or gibbsitelike interlayers, but which were plotted below the shaded areas of figure 9, have low pH. These samples probably contained interlayer hydrogen (or H 30+) ions that were not included when the structural formula was calculated by the usual method. The amount of the interlayer hydrogen was determined by assuming sufficient interlayer hydrogen to increase the interlayer charge to the minimum expected total indicated by the shaded area on figure 9.
The aforesaid procedures for the calculation of interlayer magnesium, aluminum, and hydrogen ions will not produce corrections in every situation where small · amounts of these ions actually occur in the exchange positions. Scant available data indicate that magnesium ions frequently compose about 10 percent of the total exchangeable cations. Because no magnesium generally is calculated in interlayer positions, exchangeable magnesium in small amounts is assigned to octahedral positions. However, in the one sample having calculated interlayer magnesium for which exchange data are available, magnesium ions composed 41 percent of the exchangeable cations. Thus, the adopted procedure generally will indicate the presence of interlayer magnesium, aluminum, and hydrogen ions where they compose a major proportion of the interlayer cations, and the resulting structural formulas will give a more accurate picture of the occurrence of elements in the minerals of the Pierre Shale.
The calculated structural formulas for montmorillonite and mixed-layer clay are by no means perfect. They contain a residuum of all errors made in the chemical analysis, the interpretation of the X-ray data, and the assigmnent of chemical elements to other minerals, as well as small errors in assignment of the remaining cations to the three structural positions of the montmorillonite and mixed-layer clay. Nevertheless, the formulas are still useful for comparison among samples handled by uniform methods, and they indicate the major features of distribution of elements in the clay lattices.

C30 ANALYTICAL METHODS IN GEOCHEMICAL INVESTIGATIONS OF THE PIERRE SHALE
CONCLUSIONS
The accuracy and the reproducibility that can be expected for the quantitative determinations of mineral abundance derived from X-ray diffraction traces of samples of the.Pierre Shale seem to be of the same order of magnitude. Most determinations, if greater than about 15 percent, are accurate within 10 percent of the stated value. However, unless precautions are taken, a few errors in determinations can be made that are considerably greater than the usual limits of error. Poor reproducibility of the feldspar determination in one sample illustrated the need for careful hand grinding and homogenization or repeated analyses of samples containing relatively coarse particles. Machine grinding produced uniformity, but also produced a considerable change in crystallinity and diffraction properties of some minerals. In making comparisons, consideration must be given to which minerals in· which types of samples are likely to be most in error. Comparisons are best made on the basis of groups of samples rather than between individual samples. If determined values for amounts of minerals in groups of samples are consistently diffe~ent, then differences smaller than 10 percent probably are significant.
Structura1 formulas calculated for the montmorillonite and mix13d-layer clay also should be interpreted with caution, and due regard should be given to the many factors which enter into their calculation. They also are best c01npared as groups rather than as individual samples.
LITERATURE CITED
Altschuler, z. S., Clarke, R. S., Jr., and Young, E. J., 1958, Geochemistry of uranium in apatite and phosphorite: U.S. Geol. Survey Prof. Paper 314-D, p. 45-90.
Black, R. H., 1953, Analysis of bauxite exploration samples-an X-ray diffraction method: Anal. Chern., v. 25, no. 5, p. 743-748.
Brindley, G .. W., ed., 1951, X-ray identification and structures of clay minerals : ed. 1, London, The Mineralogical Society (Clay Minerals Group), 345 p.
Cross, Whitman, Iddings, J.P., Pirsson, L. V., and Washington, H. S., 1903, Quantitative classification of igneous rocks, based on chemical and mineral characters, with a systematic nomenclature: Chicago, University of Chicago Press, 286 p.
Degens, E. T., Williams, E. G., and Keith, M. L., 1957, Geochemical criteria for differentiating marine from freshwater shales, pt. 1 of Environmental studies of Carboniferous sediments [Pa.]: Am. Assoc. Petroleum Geologists Bull., v. 41, no.11, p. 2427-2455.
Foster, M, D., 1954, The relation between "illite," beidellite, and montmorillonite, in Swineford, Ada, and Plummer, N. V., eds., Clays and clay minerals: Natl. Research Council Pub. 327, p. 386-397.
Franks, P. C., and Swineford, Ada., 1959, Character and genesis of massive opal in Kimball member, Ogallala formation, Scott County, Kansas: Jour. Sed. Petrology, v. 29, no. 2, p. 186-196, 5 :figs.
Gordon, R. L., and Harris, G. W., 1955, Effect of particle-size on quantitative determination of quartz by X-ray diffraction: Nature, v.175, no. 4469, p.1135.
Grim, R. E., 1953, Clay mineralogy: New York, McGraw-Hill Book Co., 384 p.
Grim, R. E., Bradley, W. F., and White, W. A., 1957, Petrology of the Paleozoic shales of Illinois : Illinois Geol. Survey Rept. Inv. 203, 35 p., 5 figs.
Gulbrandsen, R. A., 1960, A method of X-ray analysis for determining the ratio of calcite to dolomite in mineral mixtures: U.S. Geol. Survey Bull. 1111-D, p. 147-152.
Hashimoto, I., and Jackson, M. L., 1960, Rapid dissolution of allophane and kaolinite-halloysite after dehydration, in Swineford, Ada., ed., Clays and clay minerals: Internat. Ser. Mons. Earth Sci., v. 5, p.102-113.
Hendricks, S. B., 1937, The crystal structure of alunite and the jarosites: Am. Mineralogist, v. 22, no. 6, p. 773-784.
Imbrie, John, and Poldervaart, Arie, 1959, Mineral compositions calculated from chemical analyses of sedimentary rocks: Jour. Sed. Petrology, v. 29, no. 4, p. 588-595.
Jarvis, N. L., 1958, A method for the quantitative determination of clay mineral mixtures by X-ray diffraction and its application to four soils of southeastern Kansas: Ann Arbor, Mich., Dissertation Abs., v. 18, no. 4, p. 1181-1182, Univ. Microfilms Libr. Cong. Card Mic 58-1262,92 p.
Johns, W. D., Grim, R. E., and Bradley, W. F., 1954, Quantitative estimations of clay minerals by diffraction methods: Jour. Sed. Petrology, v. 24, no. 4, p. 242-251.
Kelley, W. P., 1955, Interpretation of chemical analyses of clays, in Pask, J. A., and Turner, M. D., eds., Clays and clay technology: California Div. Mines Bull. 169, p. 92-94.
Kinter, E. B., and Diamond, Sidney, 1956, A new method for preparation and treatment of oriented-aggregate specimens of soil clays for X-ray ditrraction analysis: Soil Science, v. 81, no. 2, p. 111-120.
Krumbein, W. C., and Pettijohn, F. J., 1938, Manual of sedimentary petrology: New York, Appleton-Century-Crofts Inc., 549 p.
Levin, I., and Ott, Emil, 1933, X-ray study of opals, silica glass, and silica gel: Zeitschrift fiir Kristallographie, v. 85, p. 305-318, 6 figs. [in English].
Mason, Brian, and Sand, L. B .. 1960, Clinoptilolite from Patagonia-the relationship between clinoptilolite and heulandite: Am. Mineralogist, v. 45, nos. 3-4, p. 341-350.
Miesch, A. T., 1962, Oomputing mineral compositions of sedimentary rocks from chemical analyses: Jour. Sed. Petrology,v.32,no.2,p.217-225.
Mitchell, W. A., 1960, A method for quantitative mineralogical analysis by X-ray powder diffraction : Mineralog. Mag., v. 32, no. 249, p. 492-499.
Mumpton, F. A., 1960, Clinoptilolite redefined: Am. Mine·ralogist, v.45,nos.3-4,p.351-369.
Nicholls, G. D., 1962, A scheme for recalculating the chemical analyses of argillaceous rocks for comparative purposes: Am. Mineralogist, v. 47, no.1, p. 34--46.
Rader, L. F., and Grimaldi, F. S., 1961, Chemical analyses for selected minor elements in Pierre shale, in Analytical methods in geochemical investigations of the Pierre shale: U.S. Geol. Survey Prof. Paper 391-A, p. A1-A45.

QUANTITATIVE INTERPRETATION OF MINERALOGICAL COMPOSITION 031
Rex, R. W., and Goldberg, E. D., 1958, Quartz contents of pelagic sediments of the Pacific Ocean: Tellus, v. 10, no. 1, p. 153-159.
Ross, C. S., and Hendricks, S. B., 1945, Minerals of the montmorillonite group, their origin and relation to soils and clays: U.S. Geol. Survey Prof. Paper 205-B, p. 23-79 [1946].
Schmalz, R. F., and Zen, E-An, 1959, Quantitative modal analysis of sediments by X-ray diffraction, in Sears, Mary, ed., Internat. Oceanog. Cong. preprints [Washington, Aug. 13-Sept. 12, 1959] : Washington, D.C., Am. Assoc. Advancement Sci., p. 485-486.
Schultz, I.J. G., 1960, Quantitative X-ray determination of some aluminous clay minerals in rocks, in Swineford, Ada, ed., Clays and clay mineral's: New York, Pergamon Pr~s, p. 216--224.
Sudo, T., Oinuma, K., and Kobayashi, K., 1961, Mineralogical problems concerning rapid clay mineral analysis of sedimentary rocks: Carolinae Univ. Acta, Geologica Sup. 1, p. 18~219, Praque.
Talvenheimo, Gerhardt, •and White, J. L., 1952, Quantitative analysis of clay minerals with the X-rny spectrometer: Anal. Chern., v. 24, no.ll, p.1784-1789.
Tennant, C. B., and Berger, R. W., 1907, X-ray determination of dolomite-calcite ratio of a carbonate rock: Am. Mineralogist, v. 42, nos. 1-2, p. 23-29.
0
Tourtelot, H. A., 1962, Preliminary investigation of the geologic setting and chemical composition of the Pierre Shale, Great Plains region: U.S. Geol. Survey Prof. Paper 390, 74 p.
Tourtelot, H. A., Schultz, L. G., and Gill, J. R., 1960, Stratigraphic variations in mineralogy and chemical composition of the Pierre Shale in South Dakota and ·adjacent parts of North Dakota, Nebraska, Wyoming, and Montana., in Short papers in the geological sciences: U.S. Geol. Survey Prof. Paper 400-B, p. B447-B452.
Warshaw, Charlotte M., 1956, The occurrence of jarosite in underclays: Am. Mineralogist, v. 41, nos. 3-4, p. 288-296.
Weaver, C. E., 1956, The distribution and identification of mixed-layer clays in sedimentary rocks in Swineford, Ada, ed., Clays and clay minerals : Natl. Res. Council Pub. 456, p. 385-386.
--- 1958, Geologic interpretation of argillaceous sediments, Pt. 1, Origin and significance of clay minerals in sedimentary rocks : Am. Assoc. Petroleum Geologists Bull., v. 42, no. 2, p. 254-271.
Whitehouse, U. G., and McCarter, R. S., 1958, Diagenetic modification of clay mineral types in artificial sea water, in Swineford, Ada, ed., Clays and clay minerals: Natl. Research Council Pub. 566, p. 81-119.
Zen, E-An, 1960, Metamorphism of Lower Paleozoic rocks in the vicinity of the Taconic range in west-central Vermont: Am. Mineralogist, v. 45, nos.1-2, p.1~175.
