quantifying the effectiveness of climate change mitigation through forest plantations and carbon...
TRANSCRIPT

BioMed CentralCarbon Balance and Management
ss
Open AcceResearchQuantifying the effectiveness of climate change mitigation through forest plantations and carbon sequestration with an integrated land-use modelJelle G van Minnen1, Bart J Strengers2, Bas Eickhout2, Rob J Swart2 and Rik Leemans*1Address: 1Environmental Systems Analysis Group, Wageningen University, P.O. Box 47, NL-6700 AA Wageningen, The Netherlands and 2Netherlands Environmental Assessment Agency (MNP), P.O. Box 303, NL-3720 AH Bilthoven, The Netherlands
Email: Jelle G van Minnen - [email protected]; Bart J Strengers - [email protected]; Bas Eickhout - [email protected]; Rob J Swart - [email protected]; Rik Leemans* - [email protected]
* Corresponding author
AbstractBackground: Carbon plantations are introduced in climate change policy as an option to slow thebuild-up of atmospheric carbon dioxide (CO2) concentrations. Here we present a methodology toevaluate the potential effectiveness of carbon plantations. The methodology explicitly considersfuture long-term land-use change around the world and all relevant carbon (C) fluxes, including allnatural fluxes. Both issues have generally been ignored in earlier studies.
Results: Two different baseline scenarios up to 2100 indicate that uncertainties in future land-usechange lead to a near 100% difference in estimates of carbon sequestration potentials. Moreover,social, economic and institutional barriers preventing carbon plantations in natural vegetation areasdecrease the physical potential by 75–80% or more.
Nevertheless, carbon plantations can still considerably contribute to slowing the increase in theatmospheric CO2 concentration but only in the long term. The most conservative set ofassumptions lowers the increase of the atmospheric CO2 concentration in 2100 by a 27 ppm andcompensates for 5–7% of the total energy-related CO2 emissions. The net sequestration up to2020 is limited, given the short-term increased need for agricultural land in most regions and thelong period needed to compensate for emissions through the establishment of the plantations. Thepotential is highest in the tropics, despite projections that most of the agricultural expansion willbe in these regions. Plantations in high latitudes as Northern Europe and Northern Russia shouldonly be established if the objective to sequester carbon is combined with other activities.
Conclusion: Carbon sequestration in plantations can play an important role in mitigating the build-up of atmospheric CO2. The actual magnitude depends on natural and management factors, socialbarriers, and the time frame considered. In addition, there are a number of ancillary benefits forlocal communities and the environment. Carbon plantations are, however, particularly effective inthe long term. Furthermore, plantations do not offer the ultimate solution towards stabilizing CO2concentrations but should be part of a broader package of options with clear energy emissionreduction measures.
Published: 15 April 2008
Carbon Balance and Management 2008, 3:3 doi:10.1186/1750-0680-3-3
Received: 20 December 2007Accepted: 15 April 2008
This article is available from: http://www.cbmjournal.com/content/3/1/3
© 2008 van Minnen et al; licensee BioMed Central Ltd. This is an Open Access article distributed under the terms of the Creative Commons Attribution License (http://creativecommons.org/licenses/by/2.0), which permits unrestricted use, distribution, and reproduction in any medium, provided the original work is properly cited.
Page 1 of 20(page number not for citation purposes)
Carbon Balance and Management 2008, 3:3 http://www.cbmjournal.com/content/3/1/3
BackgroundClimate on earth is changing and this has led to a series ofimpacts on the environment and human society [1]. Thisclimate change is most likely caused by the increasedgreenhouse gas concentration with carbon dioxide (CO2)as the most important gas [2]. The United Nations Frame-work Convention on Climate Change (UNFCCC) in itsmandate to limit future climate change and its impacts,aims to 'stabilize greenhouse gas (GHGs) concentrationsin the atmosphere at a level that would prevent dangerousanthropogenic interference with the climate system' (Arti-cle 2 [3]). Many studies have compared emission reduc-tion strategies to achieve different stabilization levels ofCO2 and quantified their consequences (e.g. [4,5]). Mostof these studies concentrate on reducing energy-relatedCO2 emissions and ignore abatement options thatenhance CO2 uptake (or increase C sinks) by the bio-sphere. Such uptake also slows down the concentrationincrease.
The Kyoto Protocol, drafted in 1997 and entered intoforce in 2005, includes quantitative targets for industrialcountries (the so-called "Annex B") to limit the emissionsof six GHGs (CO2, CH4, N2O, and three fluorinated gases)by the 2008–2012 period. In addition to reducing emis-sions from fossil fuel burning, the Kyoto Protocol pro-vides explicit opportunities for Annex B countries to partlyachieve their reduction commitments by planting newforests, or by managing existing forests or agriculturalland differently (so-called Land-Use, Land-Use Changeand Forestry measures: LULUCF). The presumption ofthese LULUCF options is that removing CO2 from theatmosphere can also contribute to the stabilization of theatmospheric CO2 concentration and thus to a limitationof climate change. After the Kyoto Protocol was signed, anumber of technical issues regarding the use of carbonplantations in achieving the country commitmentsremained open. For example, it has been unclear how toquantify the LULUCF potential, both in the short and thelong terms. Furthermore, criticism on establishing newforests (so-called carbon plantations) as a mitigation strat-egy were related to the permanency of sequestration andwhether the sequestration is additional to default devel-opments (e.g. [6]). Permanency is uncertain, since thepressure on land for other purposes than carbon planta-tions may increase considerably in the near future alongwith shifts in disturbance regimes. The Food and Agricul-ture Organization of the United Nations (FAO), for exam-ple, projects considerable increases in arable land neededfor food production [7], whereas land requirements formodern biofuels are increasing considerably as well [8].Furthermore, the Kyoto Protocol clearly states that activi-ties should not be in conflict with existing conventions,such as the Convention on Biological Diversity. Thus
land-use changes that drive losses in biodiversity shouldbe prevented [9].
The Kyoto Protocol has resulted in several studies estimat-ing the sequestration potential in plantations. The IPCC'sspecial report on Land use, land-use change and forestry(LULUCF), for example, suggests that there is a potentialto sequester an additional 87 Pg C by 2050 in global for-ests alone [10]. Other studies even suggest that land-basedmitigation could be cost-effective compared to energy-related mitigation options, and could provide a large pro-portion of the total mitigation [11,12]. However, it isoften difficult to compare the results of these studiesbecause they differ in terms and definitions and methodsused. Furthermore, studies determine the sequestrationpotential in specific regions or specific land-cover types(e.g. [13-15]). Finally, there are studies that incorporatecrude assumptions for future land-use change. For exam-ple, Sathaye et al. [16] based their projections of C sinkson linear extrapolation of continuing deforestation andafforestation rates, whereas Sohngen & Sedjo [17] onlyconsidered an increase in forest product demand, discard-ing future food demand.
The main objective of this paper is to present a methodol-ogy that quantifies the possible role of C plantationsaround the world in mitigating the build-up of CO2 in theatmosphere at different cost levels and assumptions; italso takes into account the aforementioned limitationsand concerns. We specifically address the issue of net car-bon sequestration, including the continued carbonsequestration of the original natural vegetation. Moreo-ver, we only consider the carbon sequestration potentialin regions that are not used for other ecosystem services(like food supply), and include future land-use change. Inthis study we use the methodology as being implementedin the IMAGE-2 model (Integrated Model to Assess theGlobal Environment [18]) to show the long-term poten-tial in eighteen different world regions.
ResultsWe present the global and regional distribution and Cuptake potential of plantations for the different experi-ments and scenarios up to 2100 (see methodology sectionfor detailed definitions of the different potentials). First,the physical potential is given (Experiments 1, 2 and 3),which is the potential based on local physical, ecologicaland environmental conditions. Second, the physicalpotential is translated into a social potential by takinginterference with food and wood availability and natureconservation as main limitations (Experiments 4, 5 and6). This is a general attempt to simulate societal barriers tothe establishment of plantations that can also includeother, such as, for example, institutional factors. Thesefactors differ between regions, and hence the uncertainty
Page 2 of 20(page number not for citation purposes)
Carbon Balance and Management 2008, 3:3 http://www.cbmjournal.com/content/3/1/3
within our projected "social potential" may be larger thanthat within the physical potential. The final step 3 (= eco-nomic potential, including also land and establishmentcosts) is described in detail in Strengers et al [19], includ-ing the sequestration potential. The experiments differwith respect to the used management of the carbon plan-tations and baseline scenarios used. The latter refer to theIPCC SRES A1b and B2 baseline scenarios [20] (see sec-tion on Model application for differences between thesescenarios). Regarding management, the carbon planta-tions are either harvested at regular intervals or not har-vested at all (called permanent carbon plantation). Thesemanagement options can have a considerable effect onthe uptake potential of plantations (see methodology sec-tion).
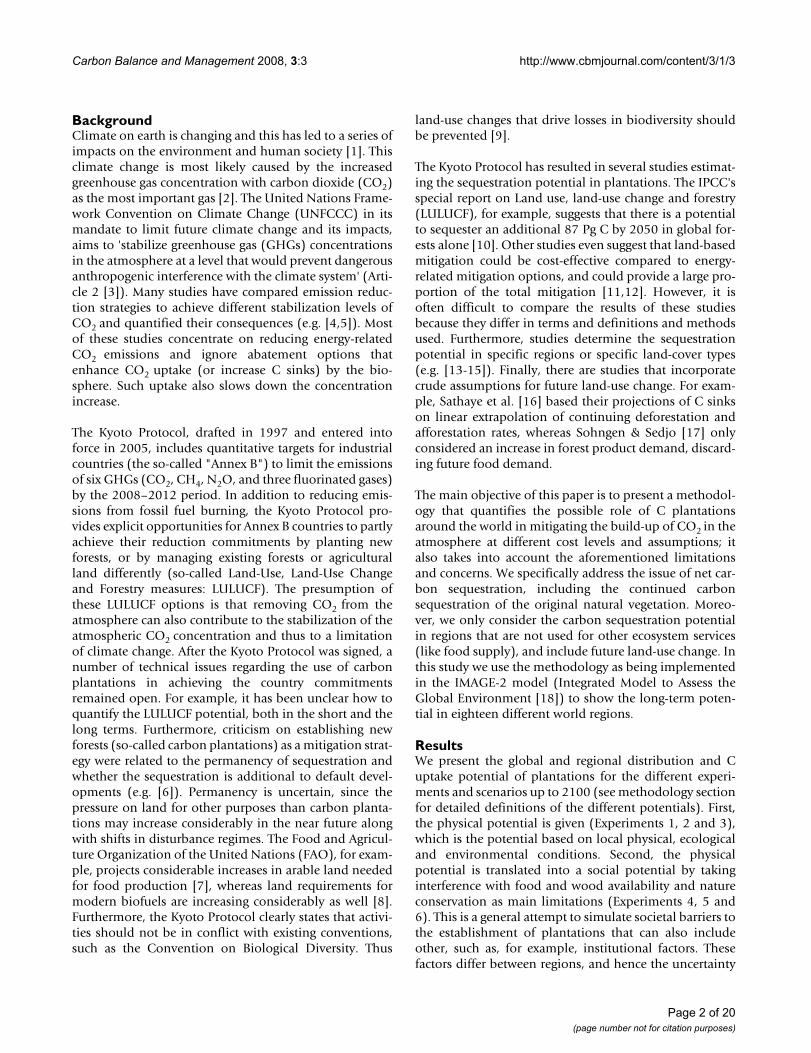
Experiments 1, 2 and 3: Physical potential of carbon plantationsIn these experiments carbon plantations are establishedwherever they can grow and wherever they are carbon-effective compared to the baseline. Under this assump-tion, the six plantation types are found to be effective overlarge areas around the world (Figure 1). Under the A1bbaseline scenario, about 3990 and 3850 Mha (i.e. 1010
m2) plantations can be established under the permanentand frequent-harvest management options, respectivelyup to 2100 (Table 1). Plantations of gum species (Eucalyp-tus spp.), for example, are projected for establishmentmainly in regions that are currently covered by savanna,woodland and even some tropical forest. The potentialover the next few decades is limited because much land isneeded for agricultural production (this land cannot beused because of the assumption that current and futureagricultural land is to be excluded). Under the alternativeB2 baseline scenario less land is projected to becomeavailable for plantations than under the A1b baseline, dueto greater demand for agricultural land. The projected dif-ference between the two management options (i.e. har-vested or permanent plantations) has two reasons. First,the difference results from the assumption for permanentplantations that abandoned agricultural land is not avail-
able if the re-grown natural forest is used at a later stage tofulfill the wood demand. Second, close to 2100 perma-nent plantations are estimated to be more widely distrib-uted because the CO2 emissions related to the harvest ofplantations need to be compensated before harvestedplantations become an effective C sink.
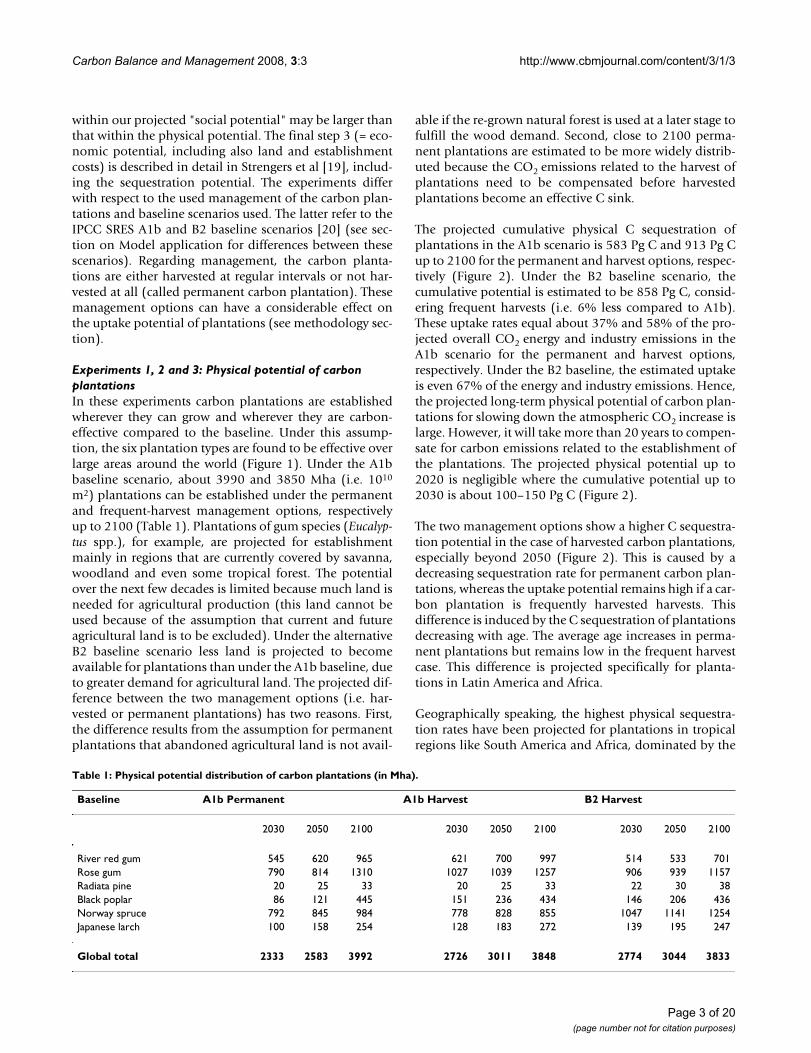
The projected cumulative physical C sequestration ofplantations in the A1b scenario is 583 Pg C and 913 Pg Cup to 2100 for the permanent and harvest options, respec-tively (Figure 2). Under the B2 baseline scenario, thecumulative potential is estimated to be 858 Pg C, consid-ering frequent harvests (i.e. 6% less compared to A1b).These uptake rates equal about 37% and 58% of the pro-jected overall CO2 energy and industry emissions in theA1b scenario for the permanent and harvest options,respectively. Under the B2 baseline, the estimated uptakeis even 67% of the energy and industry emissions. Hence,the projected long-term physical potential of carbon plan-tations for slowing down the atmospheric CO2 increase islarge. However, it will take more than 20 years to compen-sate for carbon emissions related to the establishment ofthe plantations. The projected physical potential up to2020 is negligible where the cumulative potential up to2030 is about 100–150 Pg C (Figure 2).
The two management options show a higher C sequestra-tion potential in the case of harvested carbon plantations,especially beyond 2050 (Figure 2). This is caused by adecreasing sequestration rate for permanent carbon plan-tations, whereas the uptake potential remains high if a car-bon plantation is frequently harvested harvests. Thisdifference is induced by the C sequestration of plantationsdecreasing with age. The average age increases in perma-nent plantations but remains low in the frequent harvestcase. This difference is projected specifically for planta-tions in Latin America and Africa.
Geographically speaking, the highest physical sequestra-tion rates have been projected for plantations in tropicalregions like South America and Africa, dominated by the
Table 1: Physical potential distribution of carbon plantations (in Mha).
Baseline A1b Permanent A1b Harvest B2 Harvest
2030 2050 2100 2030 2050 2100 2030 2050 2100
River red gum 545 620 965 621 700 997 514 533 701Rose gum 790 814 1310 1027 1039 1257 906 939 1157Radiata pine 20 25 33 20 25 33 22 30 38Black poplar 86 121 445 151 236 434 146 206 436Norway spruce 792 845 984 778 828 855 1047 1141 1254Japanese larch 100 158 254 128 183 272 139 195 247
Global total 2333 2583 3992 2726 3011 3848 2774 3044 3833
Page 3 of 20(page number not for citation purposes)
Carbon Balance and Management 2008, 3:3 http://www.cbmjournal.com/content/3/1/3
Page 4 of 20(page number not for citation purposes)
Physical (top) and social (bottom) potential distribution of permanent carbon plantations in 2100 using the A1b scenarioFigure 1Physical (top) and social (bottom) potential distribution of permanent carbon plantations in 2100 using the A1b scenario.

Carbon Balance and Management 2008, 3:3 http://www.cbmjournal.com/content/3/1/3
two Eucalyptus plantation types (Figure 2). The projectedsequestration potential is relatively low in high latitudes,because of low growth rates. In various parts of Canadaand Russia, the net cumulative carbon sequestration evenremains negative for about 50 years.
Experiments 4, 5 and 6: Social potential of carbon plantationsWe assessed the social sequestration potential of C planta-tions up to 2100 using wood availability and nature con-servation as main constraints in addition to the foodsecurity criterion. These constraints have been imple-mented by estimating the potential on abandoned agri-cultural land only. Assuming permanent carbonplantations (Experiment 4), 181 and 831 Ma are projectedin the A1b scenario potentially to be established aroundthe world up to 2050 and 2100, respectively (Table 2). In
the case of harvested carbon plantations, the area availa-ble in 2100 is projected to be 1014 and 695 Mha underthe A1b and B2 baseline scenarios, respectively (Experi-ments 5 & 6). The difference between the baseline scenar-ios is caused by a larger land abandonment under the A1bbaseline scenario than under the B2 baseline. The differ-ence between the two management options is caused bythe assumption for permanent carbon plantations thatabandoned agricultural land is not available if the re-grown natural forest is needed at a later stage to fulfill thewood demand. For frequently harvested carbon planta-tions, the timber from the plantations is used to fulfill thewood demand, reducing the pressure on existing forests.Similar to the physical potential, the difference betweenthe management options is projected to decrease near to2100 because the CO2 emissions related to the harvestneed to be compensated before the plantations become
Cumulative physical global (top) and regional (bottom) C sequestration potential (CSeq)Figure 2Cumulative physical global (top) and regional (bottom) C sequestration potential (CSeq). The regional figure illustrates the trend in the A1b harvest experiment (in Pg C).
-200
0
200
400
600
800
1000
Up
take
(P
g C
)
A1b harvestA1b permanentB2 harvest
2000 2020 2040 2060 2080 2100
Year
Up
take
(P
g C
)
-100
100
200
300
400
South AmericaWestern AfricaSouth East AsiaFormer USSRCanada
0
Page 5 of 20(page number not for citation purposes)

Carbon Balance and Management 2008, 3:3 http://www.cbmjournal.com/content/3/1/3
an effective C sink. As a consequence, fewer harvestedplantations will be established.
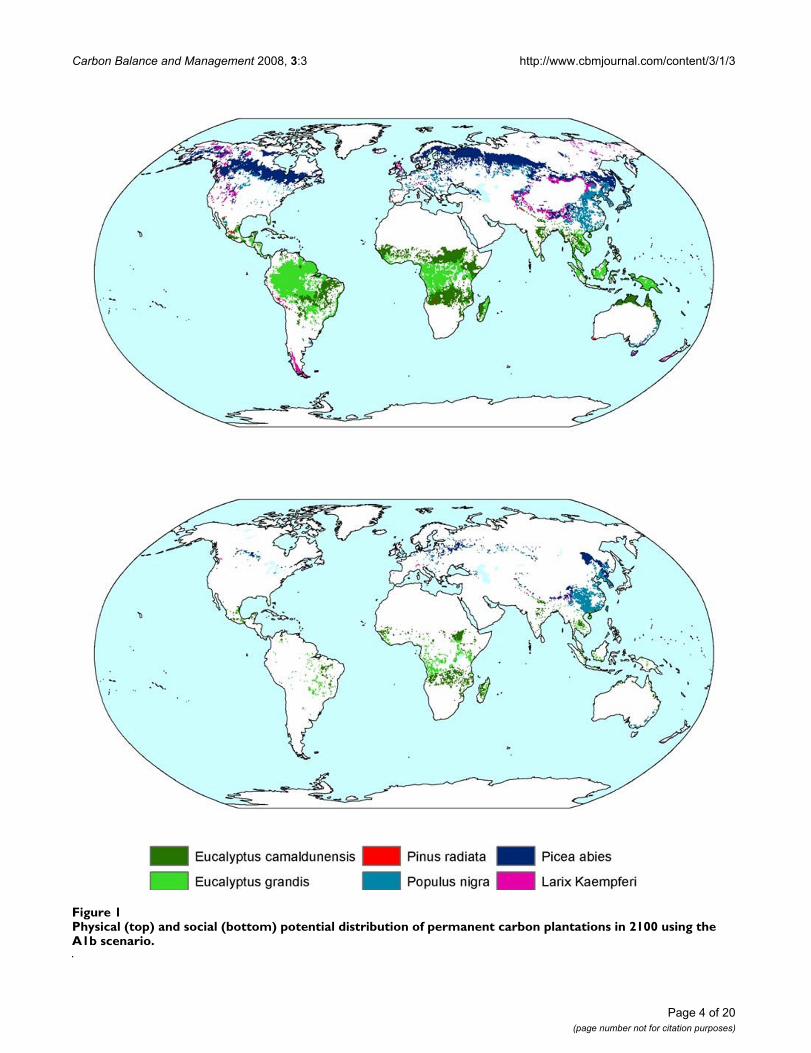
The majority of the carbon plantations is projected in allthe experiments to be established after 2050, because landonly becomes available then, due to decreasing popula-tion and increasing efficiency. The projected cumulativeglobal social C sequestration potential remains low in thecoming decades (Figure 3), and, up to 2050, reaches12–17 Pg C for the different baselines and harvest regimes(Table 3). Under the A1b scenario the potential increases
up to 93 and 133 Pg C in 2100 for permanent and har-vested plantations, respectively (Figure 3 and Table 3).This is 5–7% of the projected cumulative emissions up to2100 coming from the energy and industry sector (i.e.about 1740 Pg C). The potential uptake up to 2100 underthe B2 scenario is 68 Pg C, implying 5% of the energy andindustry emissions (i.e. 1272 Pg C). The net C sequestra-tion potential can be higher under a frequent harvestregime due to a higher area-based uptake and the broaderdistribution. Comparing the 2 baseline scenarios, the pro-jected global sequestration of carbon plantations in 2100
Table 3: Implications of establishing carbon plantations on abandoned agricultural land.
Indicator 2050 2100A1b perm. A1b harvest B2 harvest A1b perm. A1b harvest B2 harvest
Baseline atmos. CO2 concentration (ppm) 561 561 506 753 753 606Change in CO2 concentration, compared to baseline (ppm) -5 -6 -8 -39 -52 -27
Cumulative social C sequestration potential in C plantations on abandoned agricultural land only (Pg C)Global potential 12 17 17 93 133 68
Canada 0.2 0.6 0.8 0.7 1.7 1.9US 0.1 0.3 1.7 0.3 0.6 7.5
Europe 0.1 0.4 1.5 0.7 2.3 3.6FSU 0.6 1.9 3.9 3.4 5.2 7.7
China 0.1 0.8 0.2 10.3 26.3 10.3Latin America 4.2 5.0 3.8 13.6 18.2 13.0
Africa 2.8 3.5 0.1 47.9 57.6 8.1India 0.0 0.0 0.2 6.5 6.8 2.9
SE-Asia 0.0 0.0 0.0 0.2 2.8 0.7Oceania 4.0 4.4 5.1 9.8 11.2 12.3
Table 2: Social potential distribution of carbon plantations with establishment on abandoned agricultural land only (in Mha).
Baseline A1b Permanent A1b Harvest B2 Harvest
2030 2050 2100 2030 2050 2100 2030 2050 2100
River red gum 31 75 317 33 83 332 30 37 158Rose gum 20 26 230 30 41 256 21 34 108Radiata pine 2 2 3 2 2 3 2 2 3Black poplar 16 24 192 23 83 219 31 84 163Norway spruce 31 48 75 128 164 181 119 203 234Japanese larch 4 5 14 11 16 22 15 23 29
Global total 105 181 831 228 390 1014 218 383 695
Canada 2.2 6.7 14.8 16.2 27.2 26.4 15.9 36.2 30.2US 0.9 0.9 2.9 5.0 5.2 5.1 18.4 53.2 69.0
Europe 0.3 0.9 19.5 4.3 12.2 24.7 17.4 36.5 35.4FSU 13.7 20.5 49.9 48.7 67.1 79.9 80.6 107.1 135.8
China 0.3 14.9 187.5 3.0 60.8 254.7 0.0 25.2 125.2Latin America 40.0 47.7 102.9 76.3 85.9 133.3 35.5 56.6 63.8
Africa 6.4 43.5 314.6 10.5 61.1 326.1 0.4 1.6 124.8India 0.4 0.4 54.8 0.6 0.6 56.5 1.2 1.2 27.2
SE-Asia 0.0 0.0 27.6 0.0 0.9 30.4 0.0 0.0 7.2Oceania 41.0 45.7 53.8 63.5 69.0 74.5 47.7 65.5 71.5
Page 6 of 20(page number not for citation purposes)

Carbon Balance and Management 2008, 3:3 http://www.cbmjournal.com/content/3/1/3
is 95% higher under the A1b scenario than in the B2 base-line (Table 3). This is mainly due to the higher establish-ment rates.
Geographically speaking, most plantations are projectedfor establishment in tropical regions (Figure 1 and Table2). The consequences for the C sequestration are thatunder the A1b baseline scenario, 40–50% of the globalpotential can be sequestered in plantations in Africa,10–20%, in China, 10% in Latin America, and 10% inOceania (Table 3). Although a considerable amount ofabandoned agricultural land is projected for Europe, Can-ada and the FSU as well, the effectiveness of establishingC plantations here is projected as being rather limited. Forexample, 6% of the global potential area can be estab-lished in the FSU up to 2100, sequestering only 4% of theglobal potential.
With respect to the social potential, evaluating the effec-tiveness of carbon plantations in slowing down the build-up of CO2 in the atmosphere shows that the concentrationin 2100 under the A1b scenario can be reduced from 752to 713 ppm (i.e. a 39 ppm reduction) when planting per-manent carbon plantations, whereas it reaches 700 ppm(i.e. a 52 ppm reduction) assuming frequently harvestedplantations (Table 3). The two management options differbecause of the broader distribution of carbon plantationswhen planting frequently harvested plantations andbecause of the additional C that will be stored in the soilcompartment. The lower social sequestration potentialprojected under the B2 baseline scenario results, obvi-ously, in a lower effectiveness. Assuming frequently har-vested carbon plantations, we project a CO2 concentrationof 579 ppm in 2100, which is 27 ppm less than in thebaseline.
Social C sequestration potential (CSeq) on abandoned agricultural landFigure 3Social C sequestration potential (CSeq) on abandoned agricultural land; top – annual (Pg C/yr), bottom – cumulative (Pg C).
0
50
100
2000 2020 2040 2060 2080 2100
year
Up
take
(P
g C
)
A1b harvestA1b permanentB2 harvest
0
1
2
3
4
Up
take
(P
g C
yr-
1 ) A1b harvestA1b permanentB2 harvest
150
Page 7 of 20(page number not for citation purposes)
Carbon Balance and Management 2008, 3:3 http://www.cbmjournal.com/content/3/1/3
DiscussionThe carbon sequestration potential in comparison with other studiesHere we have presented a methodology to assess the glo-bal and regional sequestering potential of carbon planta-tions established after 2000. Based on ecological andenvironmental constraints alone, carbon plantations canbe effective in large parts of the world with a projectedcumulative sequestering potential of 913 Pg C up to 2100.In the A1b baseline scenario this equals 52% of the totalcumulative CO2 emissions from energy and industry from2000 to 2100. In the B2 scenarios it is even 67%. Thesocial sequestration potential is much lower but still con-siderable. The annual average global potential is projectedat 0.1 – 0.2 Pg C yr-1 up to 2050, and 0.68–1.3 Pg C yr-1 upto 2100 (Table 3). In 2100 this leads to a 27–52 ppmsmaller increase in the atmospheric CO2 concentrationand compensates for 5–7% of the total energy and indus-try related CO2 emissions. The sequestration potential islikely to considerably increase beyond 2100, becausemany plantations are projected to be established onlyclose to the end of the 21st century. This holds especiallyfor regions where large areas of arable land are expected tobe abandoned towards 2100, such as China.
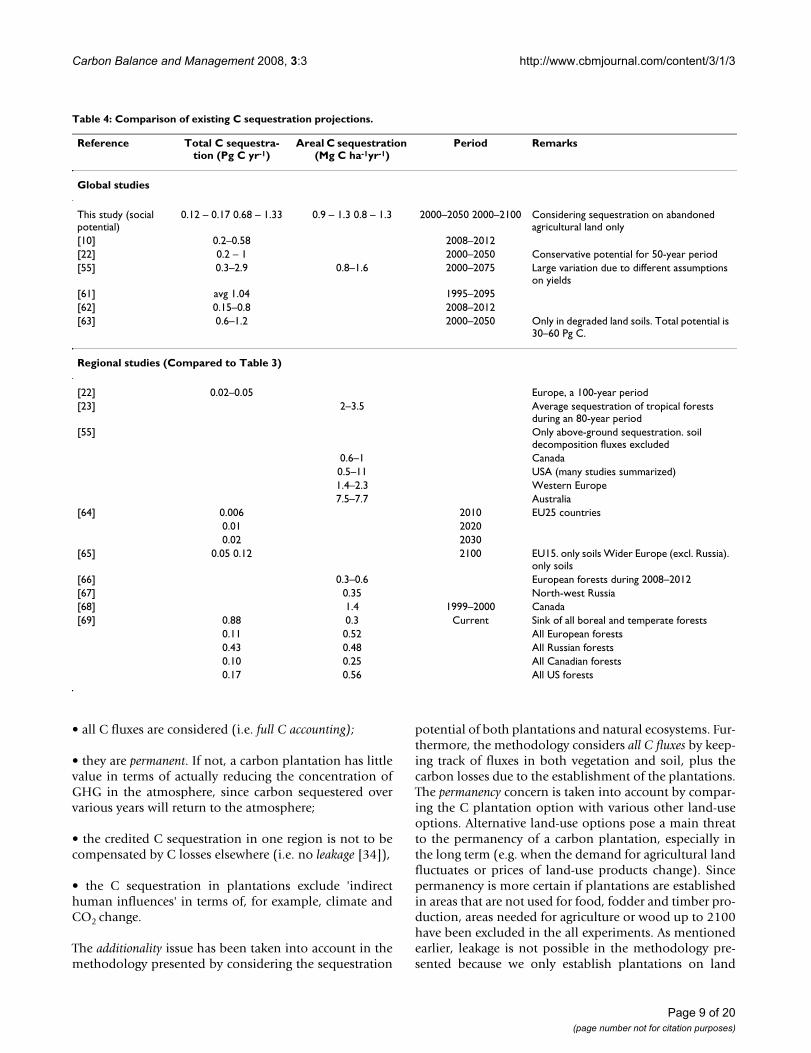
The social sequestration potential of the plantations pro-jected up to 2050 is at the low end of ranges found in theliterature, whereas values for the coming 100 years aremore in line (Table 4). Geographically, the most effectiveplantations are located in tropical regions, whereas due tolow growth rates the C sequestration in high latitudinalplantations is limited (Table 3). This is in line with thefindings of Masera et al. [21] and Cannell [22]. Manyother estimates are especially useful in a comparison withour area-based potentials, because the studies often focuson the C sequestration potential in existing forests (Table4). For example, the projected social C sequestrationpotential of tropical plantations of Latin America andAfrica (1.6–1.9 Mg C ha-1 yr-1 for 2000–2100), is found atthe low end of the range given by Silver et al. [23]. Ourprojections for Europe up to 2100 – between 0.3 and 1.1Mg C ha-1 yr-1 – are well in line with the projected area-based uptake of 0.52 Mg C ha-1 yr-1 given by Liski et al[24]. Note that we have used a particular definition of"social potential", possibly causing differences with otherstudies in either direction. Areas that we excluded, forexample, because of competition with other needs may beconverted in reality, while areas that we included couldnot be appropriate for the establishment of plantationsbecause of other social or institutional factors.
Despite the estimated considerable C sequestrationpotential up to 2100, the uptake potential for the comingdecades is projected to be limited (Figure 3). It can takeabout 20 years to compensate for the emissions related to
the establishment of the plantations. Moreover, not muchagricultural land will likely be abandoned in coming dec-ades due to the current and projected agricultural pres-sure. The limited potential in coming decades is in linewith findings of Marland & Schlamadinger [25], whoshowed that the sequestration potential in forests estab-lished since 1990 is mainly relevant in the long term. Assuch, we do not confirm the suggestion of Kirschbaum[26] that plantations may help to buy some time in initi-ating emission reductions already in the next few decades.
The limited role of plantations in the coming decadesmight be caused by our assumptions that C plantationscan only be established after 2000. Various other studiesreport afforestation activities in different locations aroundthe world, even before 2000. Brown [27] and FAO [28],for example, reported that globally 124 Mha and 187 Mhaforest plantations have been established up to 1995 and2000, respectively. More than 90% of these plantationshave been established in 30 countries only, mainly insuch Asian countries as China (45 Mha), India (32 Mha),and Japan (11 Mha). Furthermore, various studies reportexisting afforestation activities, but seldom account fordeforestation in the same region (the so-called leakageeffect). This has also been shown by others (e.g. [29]) byestimating an annual afforestation rate in the tropics of2.6 Mha yr-1 throughout the 1980s, but at the same time adeforestation rate of 15.4 Ma yr-1. In our methodology,leakage is not possible because we only establish planta-tions on land that is available for the entire simulationperiod (i.e. up to 2100). Finally, our projections are lowerthan in other studies that account for the C sequestrationin forests planted for various other reasons (e.g. recrea-tion, agroforestry and soil restoration). For India, forexample, we have project a negligible afforestation poten-tial up to 2030 because of the large pressure on the landfor food production. Nevertheless, Ravindranath &Somashekhar [30] reported an afforestation rate of Indiaof 1.6 Mha yr-1, mainly for agroforestry purposes. Again,these afforestation rates are partly counterbalanced bydeforestation activities in India [30,31].
The methodology in relation to conventions and protocolsThe methodology presented is aimed at quantifying thesequestration potential of carbon plantations around theworld, in consideration of the requirements mentioned indifferent conventions and protocols. The UN FrameworkConvention on Climate Change [3] and its underlyingKyoto Protocol, which opened the possibility for devel-oped countries to use afforestation programs in achievingtheir reduction commitments, clearly stress that C planta-tions are only effective in the long term if (see also[10,32,33]):
• they are additional to a baseline;
Page 8 of 20(page number not for citation purposes)
Carbon Balance and Management 2008, 3:3 http://www.cbmjournal.com/content/3/1/3
• all C fluxes are considered (i.e. full C accounting);
• they are permanent. If not, a carbon plantation has littlevalue in terms of actually reducing the concentration ofGHG in the atmosphere, since carbon sequestered overvarious years will return to the atmosphere;
• the credited C sequestration in one region is not to becompensated by C losses elsewhere (i.e. no leakage [34]),
• the C sequestration in plantations exclude 'indirecthuman influences' in terms of, for example, climate andCO2 change.
The additionality issue has been taken into account in themethodology presented by considering the sequestration
potential of both plantations and natural ecosystems. Fur-thermore, the methodology considers all C fluxes by keep-ing track of fluxes in both vegetation and soil, plus thecarbon losses due to the establishment of the plantations.The permanency concern is taken into account by compar-ing the C plantation option with various other land-useoptions. Alternative land-use options pose a main threatto the permanency of a carbon plantation, especially inthe long term (e.g. when the demand for agricultural landfluctuates or prices of land-use products change). Sincepermanency is more certain if plantations are establishedin areas that are not used for food, fodder and timber pro-duction, areas needed for agriculture or wood up to 2100have been excluded in the all experiments. As mentionedearlier, leakage is not possible in the methodology pre-sented because we only establish plantations on land
Table 4: Comparison of existing C sequestration projections.
Reference Total C sequestra-tion (Pg C yr-1)
Areal C sequestration (Mg C ha-1yr-1)
Period Remarks
Global studies
This study (social potential)
0.12 – 0.17 0.68 – 1.33 0.9 – 1.3 0.8 – 1.3 2000–2050 2000–2100 Considering sequestration on abandoned agricultural land only
[10] 0.2–0.58 2008–2012[22] 0.2 – 1 2000–2050 Conservative potential for 50-year period[55] 0.3–2.9 0.8–1.6 2000–2075 Large variation due to different assumptions
on yields[61] avg 1.04 1995–2095[62] 0.15–0.8 2008–2012[63] 0.6–1.2 2000–2050 Only in degraded land soils. Total potential is
30–60 Pg C.
Regional studies (Compared to Table 3)
[22] 0.02–0.05 Europe, a 100-year period[23] 2–3.5 Average sequestration of tropical forests
during an 80-year period[55] Only above-ground sequestration. soil
decomposition fluxes excluded0.6–1 Canada0.5–11 USA (many studies summarized)1.4–2.3 Western Europe7.5–7.7 Australia
[64] 0.006 2010 EU25 countries0.01 20200.02 2030
[65] 0.05 0.12 2100 EU15. only soils Wider Europe (excl. Russia). only soils
[66] 0.3–0.6 European forests during 2008–2012[67] 0.35 North-west Russia[68] 1.4 1999–2000 Canada[69] 0.88 0.3 Current Sink of all boreal and temperate forests
0.11 0.52 All European forests0.43 0.48 All Russian forests0.10 0.25 All Canadian forests0.17 0.56 All US forests
Page 9 of 20(page number not for citation purposes)

Carbon Balance and Management 2008, 3:3 http://www.cbmjournal.com/content/3/1/3
available for the entire simulation period (i.e. up to2100). Finally, the methodology accounts only for carbonsequestered directly by the plantations, corrected for cli-mate change and CO2 fertilization (i.e. indirect humaninfluences). This has been done both for the historicaluptake – where we corrected 1995 growth rates forobserved changes in CO2 and climate (see Equation 2) –as well as the projected future (reducing the projectedsocial potential in the supply curves for climate and CO2changes in the baseline).
The effectiveness of carbon plantations in a broader environmental contextThe effectiveness of harvesting plantations and using thebiomass to displace fossil fuels and/or timber, comparedto having carbon stored in a permanent plantation,depends to a great extent on the displacement factor (i.e.the extent to which wood from carbon plantations can beeffectively used to replace fossil fuels) [35]. Here, a dis-placement factor of 'one' is assumed. Theoretically thiscan be achieved if fossil fuels are displaced by harvestedwood [22,36]. However, if the displacement factor is(much) smaller than 'one', the environmental effective-ness of harvested plantations decreases sharply. Likewise,establishing carbon plantations is, in general, less effectivethan avoiding deforestation (especially in tropicalregions, [37,16]). This, however, is associated with vari-ous social difficulties and avoiding deforestation in oneregion may be counterbalanced by additional deforesta-tion elsewhere.
The effectiveness of carbon plantations in especially highlatitudes is questioned because of the effect on differentbiophysical processes (i.e. changed radiation balance)that may counterbalance the additional C sequestration[38-40]. On the basis of the albedo effect and the pro-jected low net sequestration potential for high latitudinalplantations (i.e. in parts of Canada and Russia the net Csequestration even remains negative for about 50 years),the establishment of carbon plantations in high latitudesis only favorable if the objective to sequester carbon iscombined with other environmental considerations. Forexample, plantations may also contribute to water protec-tion and soil erosion control [21,41].
An environmental constraint often mentioned for large-scale C plantations is the availability of water and nitro-gen [41-43]. Also in the methodology presented, the highgrowth rates of the carbon plantations (compared to nat-ural forests) rely on a high level of management, includ-ing nitrogen fertilization for plantations situated on pooror degraded soils. The additional use of water and ferti-lizer should indeed be a concern in the planning andmanagement of the plantation, especially because a(higher) fertilizer use could imply additional emissions of
N2O, which were neither accounted for in our study, norin most other studies. Likewise, afforestation activitieshave recently also been questioned in the context of pos-sible additional methane emissions from trees – the sec-ond-most important greenhouse gas [44]. Although thisissue is currently still under scientific debate, the effective-ness of afforestation programs would be reduced by amaximum of 10%. This has been confirmed by others(see, for example, [45] for a more detailed discussion).
ConclusionWe have presented a rule-based methodology to quantifythe long-term physical and social sequestration potentialof carbon plantations up to the end of the 21st century andtheir effectiveness in slowing down the increase in atmos-pheric CO2. Applying the methodology, we conclude thatprojected potentials differ considerably for differentexperiments, regions and management options. For exam-ple, we projected a nearly 100% difference in the seques-tration potential up to 2100 between two baselinescenarios, showing the effect of uncertainties in futureland use. Nevertheless, in all cases the C sequestrationpotential can be substantial. Even under a conservative setof assumptions, the cumulative sequestration potentialup to 2100 compensates for 5–7% of the total energy andindustry related CO2 emissions. But the sequestrationpotential is substantial only in the long term. The poten-tial for the coming decades is limited due to the limitedamount of available land and the long period needed tocompensate for emissions related to the establishment ofthe plantations. Geographically speaking, plantations intropical regions are most effective. The C sequestrationpotential of plantations in high latitudes is low andbecause of biophysical feedbacks on the climate system itseffectiveness can even be questioned. The establishmentof plantations in these regions is only favorable if theobjective to sequester carbon is combined with otherenvironmental considerations.
Finally, our analysis showed that C sequestration in plan-tations may be substantial and thus can help to slowdown the future increase in atmospheric CO2. But C plan-tations do not represent the ultimate solution to the prob-lem of establishing a stabilization of the atmospheric CO2concentration. They should form part of a broader pack-age of options, with clear measures for also reducingenergy emissions.
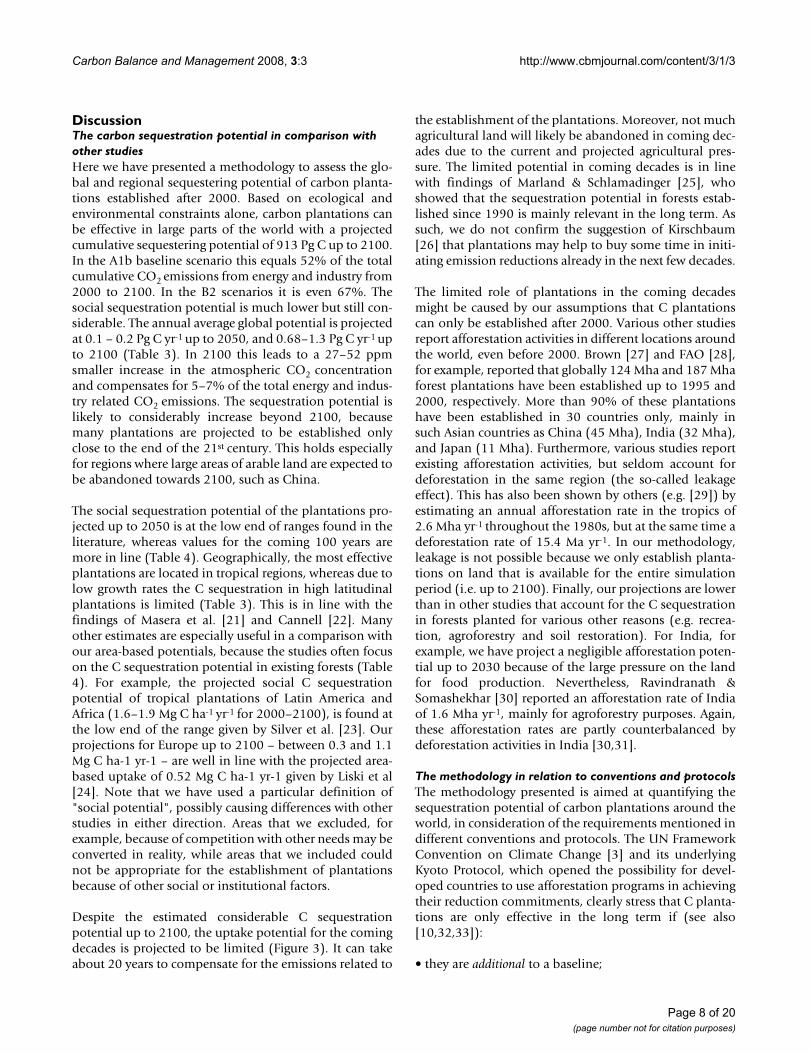
MethodologyThe algorithmThe methodology to assess the C sequestration potentialin carbon plantations, as presented here, is a rule-basedapproach that is implemented on a geographical explicit -0.5° longitude × 0.5° latitude-grid (Figure 4). The timehorizon is 2000 – 2100. This facilitates the quantification
Page 10 of 20(page number not for citation purposes)

Carbon Balance and Management 2008, 3:3 http://www.cbmjournal.com/content/3/1/3
of the long-term potential of carbon plantations in differ-ent parts of the world in mitigating the build-up of CO2 inthe atmosphere. We distinguish different potentials,defined according IPCC definitions [46]. The methodol-ogy consists of three steps (Figure 4). The first step is todetermine the physical sequestration potential of C planta-tions, accomplish by adding carbon plantations as a newland cover class in IMAGE 2 (see below for a generaldescription of the IMAGE 2 model). All carbon pools andfluxes of the potential carbon plantations (e.g. Net Pri-mary Production – NPP and Net Ecosystem Productivity –NEP) are calculated by the IMAGE-2 terrestrial C-cyclemodel, taking environmental (e.g. climate and atmos-pheric CO2) and local conditions (e.g. soil) into consider-ation. In the second step, the social potential of plantationsis determined using the restriction 'no interference withfood supply and nature conservation'. In the third step,the social potential is transferred into the economic
potential by linking the C sequestration potential toestablishment and land costs. The resulting marginalabatement cost curves can be used to compare the poten-tial of carbon plantations with other mitigation strategiesusing cost minimization (e.g. [47]). The focus of thispaper is on describing and analyzing steps 1 and 2 of themethodology. We will also summarize step 3 (i.e. eco-nomic potential), but refer for details on this to the com-panion paper by Strengers et al. [19].
Step 1: The physical sequestration potentialThe starting point for this step is the potential distributionof C plantations around the world. Six plantations typeswere selected on the basis of the 'Top 14 Most PlantedWorld's Trees' [28,48] to represent suitable species in dif-ferent climatic zones around the world (Table 5). Weused, for example, gum species (Eucalyptus spp.) for thetropical regions, and spruce (Picea abies) and larch (Larix
Steps to quantify sequestration potential of carbon plantationsFigure 4Steps to quantify sequestration potential of carbon plantations.
C-sequestrationpotential compared
to baseline
Characteristics for six representative tree species
Harvest regime
Two stages:(1) establishment of plantations on specific locations under certain restriction(2) C-Sequestration supply curves per IMAGE region and every five years
Construction ofcost supply
curves
Land costsEstablishment costsBarriers like implementation factors
,
€ T-1 C Cost supply curves
IMAGE
Comparison ofdifferent mitigation
options
IMAGE
Step 1(physical potential)
Step 2(social potential)
Step 3(economic potential)
Ha
Mt C
Mt C
Page 11 of 20(page number not for citation purposes)
Carbon Balance and Management 2008, 3:3 http://www.cbmjournal.com/content/3/1/3
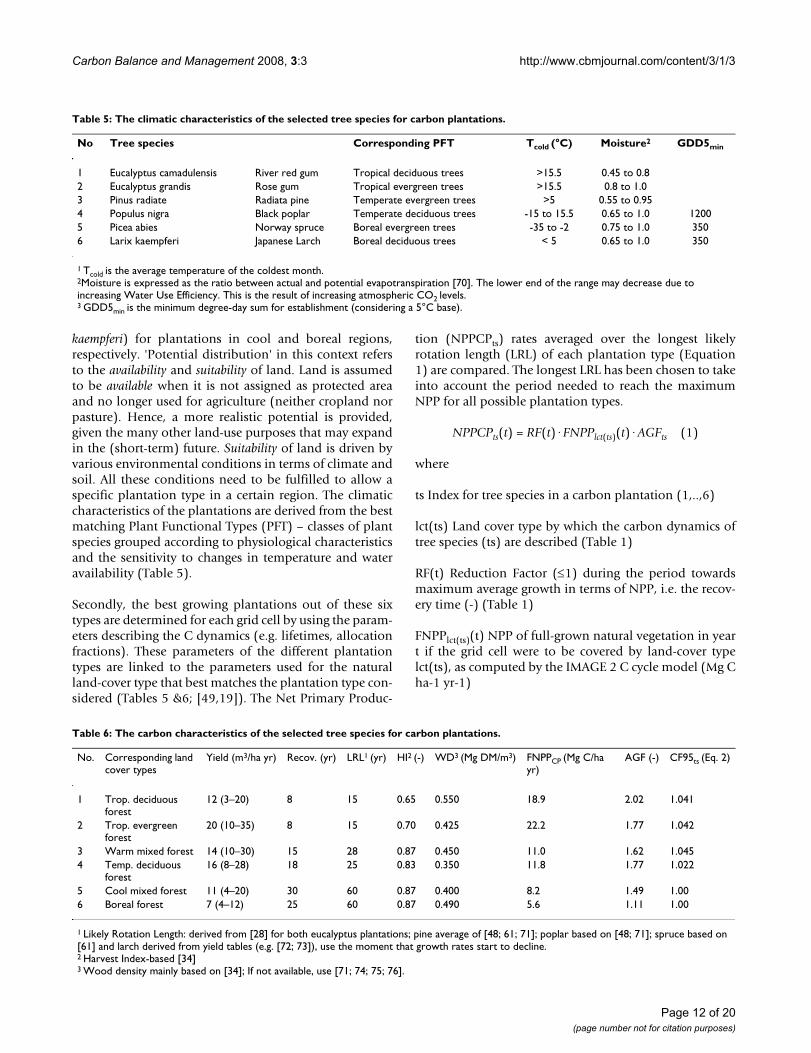
kaempferi) for plantations in cool and boreal regions,respectively. 'Potential distribution' in this context refersto the availability and suitability of land. Land is assumedto be available when it is not assigned as protected areaand no longer used for agriculture (neither cropland norpasture). Hence, a more realistic potential is provided,given the many other land-use purposes that may expandin the (short-term) future. Suitability of land is driven byvarious environmental conditions in terms of climate andsoil. All these conditions need to be fulfilled to allow aspecific plantation type in a certain region. The climaticcharacteristics of the plantations are derived from the bestmatching Plant Functional Types (PFT) – classes of plantspecies grouped according to physiological characteristicsand the sensitivity to changes in temperature and wateravailability (Table 5).
Secondly, the best growing plantations out of these sixtypes are determined for each grid cell by using the param-eters describing the C dynamics (e.g. lifetimes, allocationfractions). These parameters of the different plantationtypes are linked to the parameters used for the naturalland-cover type that best matches the plantation type con-sidered (Tables 5 &6; [49,19]). The Net Primary Produc-
tion (NPPCPts) rates averaged over the longest likelyrotation length (LRL) of each plantation type (Equation1) are compared. The longest LRL has been chosen to takeinto account the period needed to reach the maximumNPP for all possible plantation types.
NPPCPts(t) = RF(t)·FNPPlct(ts)(t)·AGFts (1)
where
ts Index for tree species in a carbon plantation (1,..,6)
lct(ts) Land cover type by which the carbon dynamics oftree species (ts) are described (Table 1)
RF(t) Reduction Factor (≤1) during the period towardsmaximum average growth in terms of NPP, i.e. the recov-ery time (-) (Table 1)
FNPPlct(ts)(t) NPP of full-grown natural vegetation in yeart if the grid cell were to be covered by land-cover typelct(ts), as computed by the IMAGE 2 C cycle model (Mg Cha-1 yr-1)
Table 6: The carbon characteristics of the selected tree species for carbon plantations.
No. Corresponding land cover types
Yield (m3/ha yr) Recov. (yr) LRL1 (yr) HI2 (-) WD3 (Mg DM/m3) FNPPCP (Mg C/ha yr)
AGF (-) CF95ts (Eq. 2)
1 Trop. deciduous forest
12 (3–20) 8 15 0.65 0.550 18.9 2.02 1.041
2 Trop. evergreen forest
20 (10–35) 8 15 0.70 0.425 22.2 1.77 1.042
3 Warm mixed forest 14 (10–30) 15 28 0.87 0.450 11.0 1.62 1.0454 Temp. deciduous
forest16 (8–28) 18 25 0.83 0.350 11.8 1.77 1.022
5 Cool mixed forest 11 (4–20) 30 60 0.87 0.400 8.2 1.49 1.006 Boreal forest 7 (4–12) 25 60 0.87 0.490 5.6 1.11 1.00
1 Likely Rotation Length: derived from [28] for both eucalyptus plantations; pine average of [48; 61; 71]; poplar based on [48; 71]; spruce based on [61] and larch derived from yield tables (e.g. [72; 73]), use the moment that growth rates start to decline.2 Harvest Index-based [34]3 Wood density mainly based on [34]; If not available, use [71; 74; 75; 76].
Table 5: The climatic characteristics of the selected tree species for carbon plantations.
No Tree species Corresponding PFT Tcold (°C) Moisture2 GDD5min
1 Eucalyptus camadulensis River red gum Tropical deciduous trees >15.5 0.45 to 0.82 Eucalyptus grandis Rose gum Tropical evergreen trees >15.5 0.8 to 1.03 Pinus radiate Radiata pine Temperate evergreen trees >5 0.55 to 0.954 Populus nigra Black poplar Temperate deciduous trees -15 to 15.5 0.65 to 1.0 12005 Picea abies Norway spruce Boreal evergreen trees -35 to -2 0.75 to 1.0 3506 Larix kaempferi Japanese Larch Boreal deciduous trees < 5 0.65 to 1.0 350
1 Tcold is the average temperature of the coldest month.2Moisture is expressed as the ratio between actual and potential evapotranspiration [70]. The lower end of the range may decrease due to increasing Water Use Efficiency. This is the result of increasing atmospheric CO2 levels.3 GDD5min is the minimum degree-day sum for establishment (considering a 5°C base).
Page 12 of 20(page number not for citation purposes)

Carbon Balance and Management 2008, 3:3 http://www.cbmjournal.com/content/3/1/3
AGFts Additional Growth Factor of tree species ts (-),(Table 1, Equation 2)
The additional growth factor (AGFts, Equation 2) isdefined as the growth rate of a plantation – based on a lit-erature review (Equation 3) – compared to the averagegrowth of the natural land-cover type, corrected for histor-ical environmental changes – CF95ts. The latter correctionfactor is needed because the information taken from theliterature on the NPP of plantations comprised, in gen-eral, data from around 1995. Following the rules in theKyoto Protocol – stating that sequestration credits shouldonly be based on 'direct human activities' – the NPP dataneeded to be adjusted. This is because these data includea growth stimulus caused by, among other factors,increasing CO2 concentrations (which form 'indirecthuman activities'). The CF95 value for each plantationtype (Table 5) has been derived by applying the IMAGE-2C-cycle model in order to define the growth stimulantsfrom CO2 and climate since 1970. Note that we correct thesequestration potential up to 2100 in a similar way:
where
FNPPCP,ts Average NPP of full grown plantations (Mg Cha-1 yr-1) around 1995 (Eq. 3)
NPPIlct(ts) Average NPP of all grid cells in 1970 covered byland-cover type lct(ts) (Mg C ha-1 yr-1) [19]
CF95ts Correction Factor for climate-induced growth stim-ulants for 1970–1995 (-).
FNPPCP can be derived from especially literature on plan-tations yields ([27,28,34,50,51] and Table 6). This infor-mation is subsequently used in Equation 3 (see also [19])
where
AS Allocation Fraction of Stems (= 0.3)
LS Lifetime of stems, based on the underlying land-covertypes lct(ts) (yr)
AB Allocation Fraction of Branches (= 0.2)
LB Lifetime of branches, based on the underlying land-cover types lct(ts) (yr)
YLD Yield of a plantation averaged over a rotation (m3
Fresh Volume ha-1 yr-1); (Table 7)
WD Wood density (Mg dry matter.m-3 fresh volume; seeTable 1)
HI Average harvest index or the fraction of above-groundbiomass used (Table 1) of which the remainder decom-poses to humus (-)
CF Average carbon factor or carbon content (Mg C m-3 drymatter)
Recov Recovery time or the average time for a carbonplantation to reach maturity in terms of NPP (yr) (Table6).
The last part in determining the physical potential (step 1)is to estimate the net C sequestration (CSeq) potential ofthe best growing species in a grid cell. This calculation isbased on the concept of SPP (Surplus Potential Productiv-ity), as introduced by Onigkeit et al. [52]. The basic phi-losophy is to account only for the net C uptake of aplantation (Equation 4). This is calculated by using emis-sions associated with the conversion from natural landcover into a plantation and comparing the NEP flux of aplantation with the NEP flux of the natural vegetation thatwould otherwise grow in the area. As such, CSeq deter-mines the additionality compared to the situation of hav-ing no plantations. Note that a negative value of CSeqcorresponds to a biospheric uptake of carbon from theatmosphere. In our application, the NEP fluxes are simu-lated by the terrestrial C cycle model of IMAGE 2, takinginto account NPP and soil respiration (see below).
where
CSeq Net carbon sequestration in a grid cell in the periodt0 through 2100 (Mg C ha-1)
t Year (between 2000 and 2100)
t0 Starting year of carbon plantations in a grid cell
NEPCP(t) Net Ecosystem Productivity of best growing treespecies in a grid cell (Mg C ha-1 yr-1)
NEP(t) NEP of the original vegetation according to thebaseline scenario (Mg C ha-1 yr-1)
AGFFNPPCP ts
NPPIlct ts CF tsts =
⋅,
( ) 95(2)
FASLS
ABLB
ASLS
ABLB
FNPP
YLD WD CF LR
CP
= −⎛⎝⎜
⎞⎠⎟
+ − −⎛⎝⎜
⎞⎠⎟
=
⋅ ⋅ ⋅
0 52 2
.
LLHI
F LRL⋅ −⎛⎝⎜
⎞⎠⎟
Re cov2
(3)
CSeq b E NEP t NEP tCPt t
t= ⋅ + −
=
=∑ [ ( ) ( )]0
2100(4)
Page 13 of 20(page number not for citation purposes)

Carbon Balance and Management 2008, 3:3 http://www.cbmjournal.com/content/3/1/3
E C content of natural vegetation before the conversioninto a carbon plantation (Mg C ha-1)
b Burn factor of the initial harvest [either 0 or 1] (-)
The variables E and b account for carbon emissionsrelated to the establishment of a carbon plantation. Forplantations established on abandoned agricultural land,grassland or forest land just being logged, there is no clear-ing needed and 'b' is close to zero. When, however, anexisting natural forest or woodland is converted into a car-bon plantation, the original vegetation is assumed to beburnt entirely (i.e. b = 1), resulting in instantaneous emis-sions of carbon into the atmosphere. These emissionsmust first be compensated before a plantation is effectivein mitigating the CO2 build-up in the atmosphere.
Since management can have a considerable effect on thecarbon uptake potential of plantations [53,54], weincluded two possible harvest regimes. Either plantationsare harvested at regular intervals or no harvest takes placeat all. In the latter case, a plantation will grow to a stablelevel of carbon storage and a low additional C sequestra-tion further in time in the soil. In the former case, a plan-tation is harvested at the moment of maximum Csequestration, (i.e. the NEP of a plantation averaged overthe stand age starts to decrease), followed by re-growth. Inour assessment the harvested wood from stems andbranches is used to fulfill the wood demand. Leaves, rootsand the non-harvested stems and branches enter the litterand humus carbon pools in the soil. The approach of dis-placing wood demand amounts to a displacement factorof 1 (assuming no leakage, i.e. no change in the wood sec-tor).
Figure 5 illustrates step 1, showing the C dynamics of aPinus radiata plantation on either abandoned agricultureor replacing a natural forest. In the case of establishingthis plantation on abandoned agricultural land, the NPPof both the plantation and the natural forest – that wouldotherwise grow in the area – increases from zero up to themaximum value within the predefined recovery period. Ifresponses to changing atmospheric CO2 levels and cli-
mate are excluded, the NPP values will remain constant atthe maximum value. The soil respiration of both the plan-tation and natural forest first decline because the carboninput from young trees is limited, whereas the decompo-sition rate starts at the much higher equilibrium level withrespect to the previous (in this case agricultural) vegeta-tion. After a period of decline, the respiration fluxincreases, since the soil carbon pools are filled up again.The respiration flux increases until it exceeds NPP. If thenet carbon uptake of the carbon plantation [NEPCP(t)] islarger than the net uptake of the natural forest [NEP(t)](i.e. more negative), the plantation is effective in slowingdown the build-up of atmospheric CO2. This is illustratedby negative values of CSeq. Since it is unknown in advancewhen a certain potential is actually used in a mitigationeffort, we averaged the carbon sequestration over a prede-fined period of time expressed as CSeqsup. As such, the CSe-qsup over the time interval [ts, tt] is an approximation of theaverage net carbon sequestration over the time interval[t0,te].
In the case of the establishment of a C plantation on slashand burnt natural ecosystems (Figure 5), large quantitiesof carbon are emitted instantaneously (i.e. E will be large).Afterwards, CSeq(t) in year t equals NEPCP(t), assumingno CO2 fertilization and other climate feedbacks (as such,the NEP of the natural vegetation is about 0). However,the year that a plantation starts to actually sequester car-bon is postponed because the initial emissions have to becompensated (about 23 years for the example in Figure 5).
Step 2: The social sequestration potentialThe social potential of the afforestation activities is esti-mated in two stages. Firstly, we establish plantationsaround the world using certain restrictions based on socialacceptance. This is accomplished by using a particular def-inition of social importance: Considering only those areasthat are neither needed for food and wood supply nor arecovered by natural ecosystems (because of their impor-tance for nature conservation). Establishing plantationson abandoned agricultural land is the only possibility.This leads to uptake potentials per grid cell (geographicalexplicit). Secondly, supply curves have been constructed
Table 7: Comparison of plantation growth rates around the world (m3 ha-1 yr-1).
Species This study [27] [28] [34] [48] [61] [71] [77] [78]
E. camaldulensis 18 6–38 15–30 15–30 4–34E. grandis 28 15–50 15–50 30–35 (tropics)
16–30 (rest of world)25 35–50
P. radiate 16 26 12–35 12–35 20–22 11–25 18–30 8–23Poplar spp. 19 9–30 12–20 9–19 8–40Picea abies 13 5–21 5–8 10–15 4–12Larix kaempferi 8 5–14 4–12
Page 14 of 20(page number not for citation purposes)

Carbon Balance and Management 2008, 3:3 http://www.cbmjournal.com/content/3/1/3
for each IMAGE-2 region, summing-up the griddedsequestration potentials for all grid cells within thatregion where the average carbon sequestration, correctedfor climate change and CO2 fertilization effects, is positivein a year 'z' (Figure 5, [19]). Since it is unknown when acertain potential is actually used in a mitigation effort,and to allow for comparison with other greenhouse gasmitigation options, the carbon sequestration is averagedover a predefined period of time (CSeqsup(t)). Thus eachpoint in a supply curve represents the regional sum of theaverage annual carbon sequestration potential of a gridcell assigned to a time interval [ts, tt], starting with the
most productive grid cells (i.e. cells with highest seques-tration rate per hectare), ending with ineffective grid cells.
Step 3: The economic sequestration potentialThe social C sequestration potential is used to determinethe economic potential by linking it to costs (see [19] fordetails). This results in Marginal Abatement Curves(MACs) or cost-supply curves dependent on geographical-explicit environmental circumstances and possible futurechanges in land use. In general, the most important costfactor in producing or conserving carbon sinks is land[55]. In addition, we also consider establishment costs.
Illustrative growth curves of a Pinus radiata plantationFigure 5Illustrative growth curves of a Pinus radiata plantation: top – permanent plantation on abandoned agricultural land; bot-tom – permanent plantation on former forest area. Note that negative numbers represent a C uptake. Furthermore, the curves assume neither CO2 fertilization nor climate feedbacks.
NPPCP(t) NPP(t) RESPCP(t) RESP(t)NEPCP(t) NEP(t) C-SEQ(t) CSEQsup(t)
-12
-8
-4
0
4
8
12
0 10 20 30 40 50 60 70 80 90 100
-12
-8
-4
0
4
8
12
t C
ha-
1yr
-1
C-Seqsup
t0 ts tt te
C-Seqsup
t C
ha-
1yr
-1
Page 15 of 20(page number not for citation purposes)
Carbon Balance and Management 2008, 3:3 http://www.cbmjournal.com/content/3/1/3
Other types of costs are excluded because they are eitherlow (e.g. maintenance costs), compensated by revenuesfrom timber, or difficult to quantify [56]. Land costs arebased on GTAP data [57] for land values of agriculturalland around the world. Establishment costs, set at 435US$ (1995) per ha, are uniform in time and space. Thisassumption is supported by the survey of Sathaye et al.[15]. The value of 435 US$ (1995) per ha is based on ana-lyzing variations between the regions and the rangeswithin the regions.
The IMAGE 2 modelThe methodology presented has been implemented inIMAGE 2 (Integrated Model to Assess the Global Environ-ment [18,58,59]). This is a multi-disciplinary, integratedassessment model, designed to explore causes and effectsof global environmental change. IMAGE 2 integrates dif-ferent land-use demands like food, fodder, biofuels and Csequestration. IMAGE 2 is global in application and inte-grates regional socio-economic (i.e. eighteen regions) andgeographically explicit grid dimensions (i.e. 0.50 longi-tude by 0.50 latitude). Each grid cell is characterized by itsclimate, soil and land cover (natural ecosystems or agri-culture). Because of the dynamic land use, the geographicexplicit modeling and the global perspective, IMAGE 2 isvery suitable for the presented methodology.
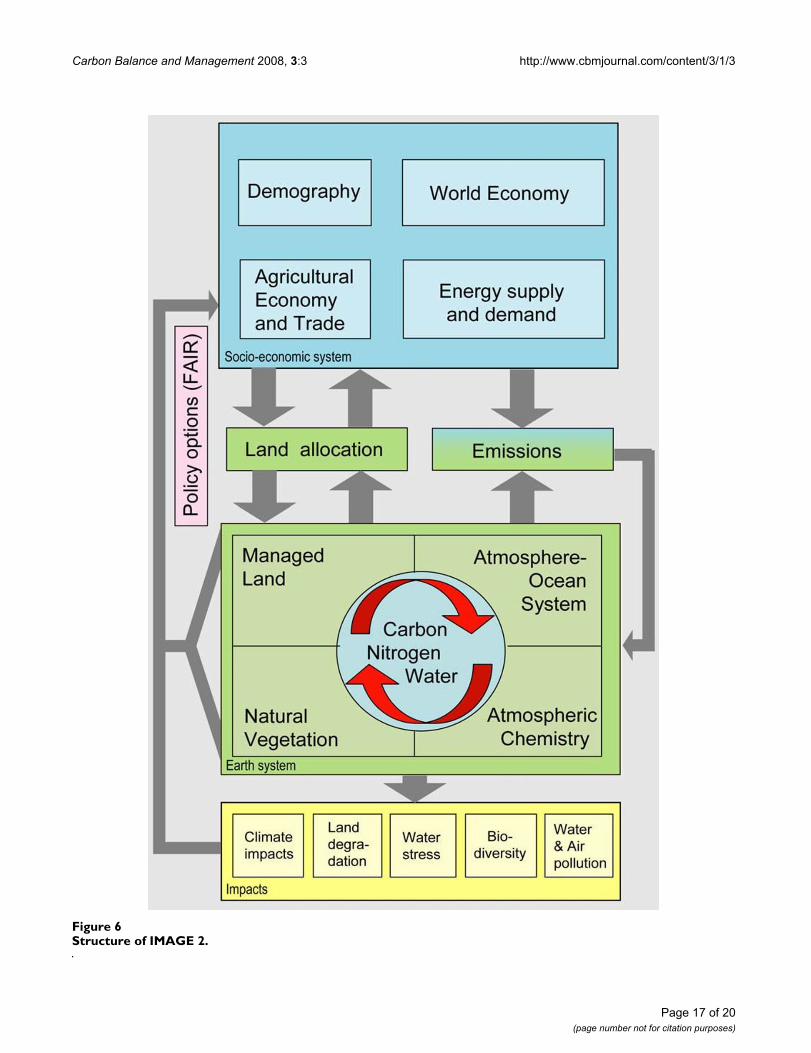
IMAGE 2 consists of various sub-models (Figure 6). Driv-ers of the model are regional trends in wealth, demogra-phy and technology for the period 1970 to 2100. Thesetrends determine, for example, the demand for landresources. Changes in production of or demand for land-related products (i.e. food, fodder, biofuel, timber and Csequestration) drive land-use changes, leading to land-useemissions of various greenhouse gases into the atmos-phere. The IMAGE 2 atmospheric and ocean sub-modelcomputes changes in atmospheric composition (e.g. CO2and CH4) and, subsequently, the climate by using theland-use and energy-related emissions and by taking oce-anic and terrestrial CO2 uptake and atmospheric chemis-try into account. The climatic changes alter thedistribution and productivity of ecosystems and agricul-ture, with both, in turn, affecting the terrestrial C dynam-ics.
Carbon plantations have been added as a separate land-cover class into the land-cover sub-model of IMAGE 2,whereas their carbon pools and fluxes are computed bythe terrestrial C cycle sub-model [19,49,60]. The drivingforce of the C cycle sub-model is Net Primary Productivity(NPP), which is the photosynthetically fixed C in plantsminus C losses due to plant respiration. NPP in IMAGE 2is a function of atmospheric CO2 concentration, climate,soil nutrient and moisture status, biome type and the suc-cessional stage of a biome. NPP determines the Net Eco-
system Productivity (NEP) in an area, together with theheterotrophic soil respiration. NEP represents the net Cflux between the atmosphere and terrestrial ecosystems.Soil respiration depends on the C stocks in the differentsoil compartments (i.e. litter, humus and charcoal), theirturnover rates and environmental conditions (i.e. soilwater availability and temperature). All fluxes are calcu-lated on a monthly basis, while the carbon pools areupdated annually.
Model application and experimental designThe IMAGE 2 model, along with the methodology pre-sented here, has been applied to a number of experimentsto show different sequestration potentials of C planta-tions up to 2100 under different baseline scenarios andmanagement options. The experiments form variants tothe implementation of the IPCC SRES A1b and B2 base-line scenarios [20,59]. The two baseline scenarios differconsiderably in socio-economic and population develop-ments (Table 8). In the B2 scenario, the demands up to2050 for goods (e.g. food, timber and biofuels) are lowerthan in A1b baseline. But between 2050 and 2100, thedemands remain high in B2, and drop in the A1b sce-nario. Combined with lower yield increases in the B2world due to lower economic development and a frag-mented world (e.g. leading to less technology exchange),less agricultural land is projected as being available for Cplantations in the B2 scenario than in the A1b scenario.The consequences for the atmospheric CO2 concentrationand global climate in the two scenarios are given in Table8. Regionally, large temperature changes (up to 6°C) aresimulated for the high latitudes, the Amazonian region,southern Africa and India.
In the first set of experiments, the physical sequestrationpotential is estimated by establishing plantations whereverthe carbon sequestration is higher than in the baseline(Table 9), with the exception of areas used for agriculture.The variants deal with permanent plantations in the A1bscenario (Exp.1) and frequently harvested plantations inthe A1b (Exp. 2) and B2 (Exp.3) baseline scenarios. In thesecond set of experiments we assess the social sequestrationpotential by taking into account such barriers as no inter-ference with the food supply and nature concerns. Weimplemented these criteria by establishing plantations onabandoned agricultural land only. Reforestation of har-vested timberland is, for example, excluded, but couldeasily be incorporated in the methodology presented. Justas for the first set of experiments, we distinguish differenttypes of management (Experiments 4 and 5) and baselinescenarios (Experiments. 4 and 6). In this set of experi-ments we assume that the plantations will actually beestablished, allowing for an evaluation of the possiblerole of carbon plantations in mitigating the build-up ofCO2 in the atmosphere (Table 4).
Page 16 of 20(page number not for citation purposes)
Carbon Balance and Management 2008, 3:3 http://www.cbmjournal.com/content/3/1/3
Structure of IMAGE 2Figure 6Structure of IMAGE 2.
Page 17 of 20(page number not for citation purposes)
Carbon Balance and Management 2008, 3:3 http://www.cbmjournal.com/content/3/1/3
List of abbreviationsCO2: Carbon dioxide; Ha: Hectare; NPP: Net Primary Pro-duction; NEP: Net Ecosystem Productivity.
Competing interestsThe authors declare that they have no competing interests.
Authors' contributionsThe methodology and its applications were designed byJvM, who also prepared this manuscript. B.S. co-designedthe methodology, implemented it in IMAGE 2 and con-tributed to the paper. BE contributed to the differentstages of the methodology and earlier versions of thispaper. RS and RL contributed to all stages of the paper. Allauthors read and approved the final manuscript.
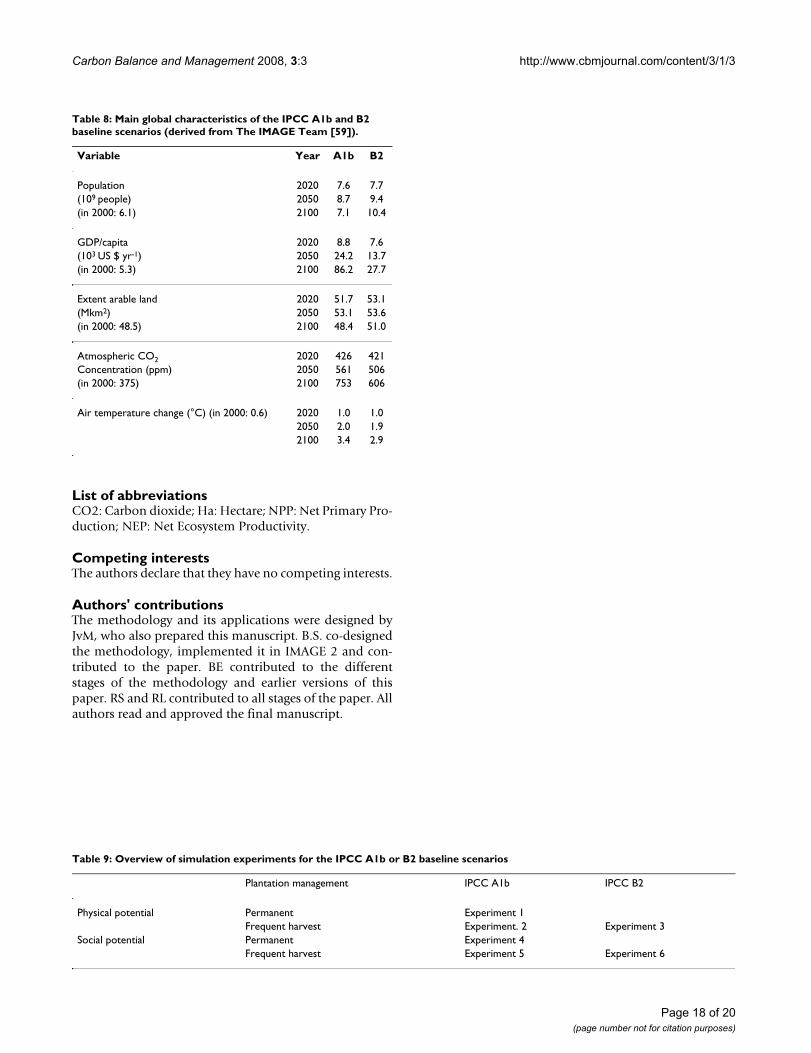
Table 8: Main global characteristics of the IPCC A1b and B2 baseline scenarios (derived from The IMAGE Team [59]).
Variable Year A1b B2
Population 2020 7.6 7.7(109 people) 2050 8.7 9.4(in 2000: 6.1) 2100 7.1 10.4
GDP/capita 2020 8.8 7.6(103 US $ yr-1) 2050 24.2 13.7(in 2000: 5.3) 2100 86.2 27.7
Extent arable land 2020 51.7 53.1(Mkm2) 2050 53.1 53.6(in 2000: 48.5) 2100 48.4 51.0
Atmospheric CO2 2020 426 421Concentration (ppm) 2050 561 506(in 2000: 375) 2100 753 606
Air temperature change (°C) (in 2000: 0.6) 2020 1.0 1.02050 2.0 1.92100 3.4 2.9
Table 9: Overview of simulation experiments for the IPCC A1b or B2 baseline scenarios
Plantation management IPCC A1b IPCC B2
Physical potential Permanent Experiment 1Frequent harvest Experiment. 2 Experiment 3
Social potential Permanent Experiment 4Frequent harvest Experiment 5 Experiment 6
Page 18 of 20(page number not for citation purposes)
Carbon Balance and Management 2008, 3:3 http://www.cbmjournal.com/content/3/1/3
AcknowledgementsThe research was made possible by internal funding from MNP and WUR.
We would like to thank Michiel Schaeffer for his contribution and discus-sion to the development the plantation scenarios based on the SRES sce-narios. We are also indebted to Ruth de Wijs for carefully checking and improving the English.
References1. Schellnhuber HJ, Cramer W, Nakicenovic N, Wigley T, Yohe G, Eds:
Avoiding Dangerous Climate Change. Cambridge, UK: Cam-bridge University Press; 2006:406.
2. Hegerl GC, Zwiers FW, Braconnot P, Gillett NP, Luo Y, Marengo J,Nicholls N, Penner JE, Stott PA: Understanding and AttributingClimate Change. In Climate Change 2007: The Physical Science Basis.Working Group 1 Contribution to the Fourth Assessment Report of theIntergovernmental Panell on Climate Change (IPCC) Volume Chapter 9.Edited by: Solomon S, Qin D, Manning M, Chen Z, Marquis M, AverytK, Tignor MMB, Miller HL. Cambridge University Press, Cambridge,UK; 2007:663-746.
3. UNFCCC: The United Framework Convention on ClimateChange. UN 1993.
4. Morita T, Robinson J, Adegbulugbe A, Alcamo J, Herbert D, LaRovere EL, Nakicenovic N, Pitcher H, Raskin P, Riahi K, et al.: Green-house Gas Emission Mitigation Scenarios and Implications.In Climate change 2001: Mitigation, Contribution of working group III to theThird Assessment Report of the Intergovernmental Panell on ClimateChange (IPCC) Volume Chapter 3. Edited by: Metz B, Davidson O, SwartR, Pan J. Cambridge University Press, London, New York;2001:115-166.
5. Leemans R, Eickhout B: Another reason for concern: regionaland global impacts on ecosystems for different levels of cli-mate change. Global Environmental Change 2004, 14:219-228.
6. Noble IR, Scholes RJ: Sinks and the Kyoto Protocol. Climate Policy2000, 1:5-25.
7. Bruinsma JE, Ed: Agriculture: Towards 2015/2030. A FAO Per-spective. London: Earthscan; 2003:432.
8. Hoogwijk M, Faaij A, Eickhout B, De Vries B, Turkenburg W: Poten-tial of biomass energy out to 2100 for four IPCC SRES land-use scenarios. Biomass & Bioenergy 2005, 29:225-257.
9. Reid WV, Mooney HA, Cropper A, Capistrano D, Carpenter SR,Chopra K, Dasgupta P, Dietz T, Duraiappah AK, Hassan R, KaspersonR, Leemans R, May RM, McMichael AJ, Pingali P, Samper C, Scholes R,Watson RT, Zakri AH, Shidong Z, Ash NJ, Bennett E, Kumar P, LeeMJ, Raudsepp-Hearne C, Simons H, Thonell J, Zurek MB: Millen-nium Ecosystem Assessment Synthesis Report. Island Press,Washington DC; 2005:219.
10. Watson RT, Noble IR, Bolin B, Ravindranth NH, Verado D, DokkenDJ, Eds: IPCC Special report on Land Use, Land-Use Change,and Forestry. Cambridge: Cambridge University Press; 2000:377.
11. Schneider U, McCarl B: Economic Potential of Biomass BasedFuels for Greenhouse Gas Emission Mitigation. Environmental& Resource Economics 2003, 24(4):291-312.
12. Sohngen B, Mendesohn R: An Optimal Control Model of ForestCarbon Sequestration. American Journal of Agricultural Economics2003, 85:448-457.
13. Hamilton C, Vellen L: Land-use changes in Australia and theKyoto protocol. Environmental, Science and Policy 1999, 2:135-144.
14. Nabuurs GJ, Dolman AJ, Verkaik E, Kuikman PJ, van Diepen CA,Whitmore AP, Daamen WP, Oenema O, Kabat P, Mohren GMJ:Article 3.3 and 3.4 of the Kyoto Protocol: consequences forindustrialised countries' commitment, the monitoringneeds, and possible side effects. Environmental Science and Policy2000, 3:123-134.
15. Sathaye JA, Markundi W, Andrasko K, Boer R, Ravindranath NH,Sudha P, Rao S, Lasco R, Pulhin F, Masera O, et al.: Carbon mitiga-tion potential and costs of forestry options in Brazil, China,India, Indonesia, Mexico, the Philippines and Tanzania. Miti-gation and Adaptation Strategies for Global Change 2001, 6:185-211.
16. Sathaye JA, Markundi W, Dale L, Chan P, Andrasko K: GHG Mitiga-tion Potential, Costs and Benefits in Global Forests: ADynamic Partial Equilibrium Approach. Multi-Greenhouse
Gas Mitigation and Climate Policy Special Issue #3. EnergyJournal 2006.
17. Sohngen B, Sedjo RJ: Carbon sequestration costs in global for-ests. Energy Journal 2006.
18. MNP: Integrated modelling of global environmental change.An overview of IMAGE 2.4. Bilthoven, the Netherlands: Nether-lands Environmental Assessment Agency (MNP); 2006:228.
19. Strengers B, van Minnen JG, Eickhout B: The costs and uncertain-ties in establishing C plantations in order to mitigate climatechange. Climatic Change 2008 in press.
20. Nakicenovic N, Alcamo J, Davis G, de Vries B, Fenhann J, Gaffin S,Gregory K, Grübler A, Jung TY, Kram T, Emilio la Rovere E, MichaelisL, Mori S, Morita T, Pepper W, Pitcher H, Price L, Riahi K, Roehrl A,Rogner H-H, Sankovski A, Schlesinger ME, Shukla PR, Smith S, SwartRJ, van Rooyen S, Victor N, Dadi Z, Eds: IPCC Special Report onEmissions Scenarios. Cambridge: Cambridge University PressLondon, New York; 2000:599.
21. Masera OR, Garza-Caligaris JF, Kanninen M, Karjalainen T, Liski J,Nabuurs GJ, Pussinen A, Jong BHJd, Mohren GMJ: Modeling carbonsequestration in afforestation, agroforestry and forest man-agement projects: the CO2FIX V.2 approach. Ecological Mod-elling 2003, 164:177-199.
22. Cannell MGR: Carbon sequestration and biomass energy off-set: Theoretical, potential and achievable capacities globally,in Europe and the UK. Biomass and Bioenergy 2003, 24:97-116.
23. Silver WL, Ostertag R, Lugo AE: The potential for carbonsequestration though reforestation of abandoned tropicalagricultural and pasture lands. Restoration Ecololgy 2000,8:394-407.
24. Liski J, Karjalainen T, Pussinen A, Nabuurs GJ, Kauppi P: Trees ascarbon sinks and sources in the European Union. Environmen-tal Science and Policy 2000, 3:91-97.
25. Marland G, Schlamadinger B: The Kyoto protocol could make adifference for the optimal forest based CO2 mitigation strat-egy: Some results for GORCAM. Environmental Science and Policy1999, 2:111-124.
26. Kirschbaum MF: Can trees buy time? An assessment of the roleof vegetation sinks as part of the global carbon cycle. ClimaticChange 2003, 58:47-71.
27. Brown C: The global outlook for future wood supply from for-est plantations. Food and Agriculture Organization of the UnitedNations (FAO), Report GFPOS/WP/03, Rome; 2000:141.
28. FAO: Global forest resources assessment 2000. Food and Agri-culture Organization of the United Nations (FAO), Main Report 1402001:479.
29. Houghton RA: Revised estimates of the annual flux of carbonto the atmosphere from changes in land use and land man-agement 1950–2000. Tellus B 2003, 55:378-390.
30. Ravindranath N, Somashekhar B: Potential and Economics ofForestry Options for Carbon Sequestration in India. Biomassand Bioenergy 1995, 8:323-336.
31. Sathaye JA, Andrasko K, Markundi W, Lebre La Rovere E, Ravin-dranath NH, Melli A, Rangaschari A, Imaz M, Gay C, Friedmann R, etal.: Concerns about climate change mitigation projects: Sum-mary of findings from case studies in Brazil, India, Mexicoand South Africa. Environmental Science and Policy 1999, 2:187-198.
32. Metz B, Berk M, Kok M, Van Minnen JG, De Moor A, Faber A: Howcan the European Union contribute to a CoP-6 agreement?An overview for policy makers. International Environmental Agree-ment: Politics, Law and Economics 2001, 1:167-185.
33. Schlamadinger B, Marland G: The Kyoto Protocol: Provision andunresolved issues relevant to land-use change and forestry.Environmental Science and Policy 1998, 1:313-327.
34. IPCC: Good Practice Guidance for Land Use, Land-UseChange and Forestry. Special report of the IntergovernmentalPanell on Climate Change (IPCC), Cambridge University Press, Cam-bridge, UK:599.
35. Stinson G, Freenman B: Potential for carbon sequestration inCanadian forests and agroecosystems. Mitigation and AdaptationStrategies for Global Change 2001, 6:1-23.
36. Deckmyn G, Muys B, Garcia Quijano J, Ceulemans R: Carbonsequestration following afforestation of agricultural soils:comparing oak/beech forest to short-rotation poplar cop-pice combining a process and a carbon accounting model.Global Change Biology 2004, 10:1482-1491.
Page 19 of 20(page number not for citation purposes)
Carbon Balance and Management 2008, 3:3 http://www.cbmjournal.com/content/3/1/3
37. Fearnside PM: The potential of Brazil forest sector for mitigat-ing global warming under the Kyoto Protocol. Mitigation andAdaptation Strategies for Global Change 2001, 6:355-372.
38. Betts RA: Offset of the potential carbon sink from boreal for-estation by decreases in surface albedo. Nature 2000,408:187-190.
39. Marland G, Pielke RA, Apps M, Avissar R, Betts RA, Davis KJ, Frum-hoff PC, Jackson ST, Joyce LA, Kauppi P, et al.: The climaticimpacts of land surface change and carbon management,and the implications for climate-change mitigation policy.Climate Policy 2003, 3:149-157.
40. Schaeffer M, Eickhout B, Hoogwijk M, Strengers B, Van Vuuren D,Leemans R, Opsteegh T: CO2 and albedo climate impacts ofextratropical carbon and biomass plantations. Global Biogeo-chemical Cycles 2006, 20:GB2020. doi 2010-1029/2005GB002581
41. Jackson RB, Jobbagy EG, Avissar R, Roy SB, Barrett DJ, Cook CW,Farley KA, Maitre DCl, McCarl BA, Murray BC: Trading Water forCarbon with Biological Carbon Sequestration. Science 2005,310:1944-1947.
42. Schlesinger WH: Carbon sequestration in soils: Some cautionsamidst optimism. Agriculture, Ecosystems and Environment 2000,82:127-127.
43. Hungate BA, Dukes JS, Shaw MR, Luo Y, Field CB: Nitrogen andClimate Change. Science 2003, 302(5650):1512-1513.
44. Keppler F, Hamilton JTG, Braß M, Röckmann T: Methane emis-sions from terrestrial plants under aerobic conditions. Nature2006, 439:187-191.
45. Kirschbaum MUF, Bruhn D, Etheridge DM, Evans JR, Farquhar GD,Gifford RM, Pau KI, Winters AJ: A comment on the quantitativesignificance of aerobic methane release by plants. FunctionalPlant Biology 2006, 33:521-530.
46. Sathaye J, Bouille D, Biswas D, Crabbe P, Geng L, Hall D, Imura H,Jaffe A, Michaelis L, Peszko G, et al.: Barriers, Opportunities, andMarket Potential of Technologies and Practices. In Climatechange 2001: Mitigation, Contribution of working group III to the ThirdAssessment Report of the Intergovernmental Panell on Climate Change(IPCC) Edited by: Metz B, Davidson O, Swart R, Pan J. Cambridge Uni-versity Press, London, New York: IPCC; 2001:351-758.
47. Van Vuuren D, Den Elzen M, Lucas P, Eickhout B, Strengers B, VanRuijven B, Wonink S, Van den Houdt R, Berk M, Oostenrijk R: Sta-bilising greenhouse gas concentrations. Assessment of differ-ent strategies and costs using an integrated assessmentframework. Climatic Change 2007, 81:119-159.
48. Leemans R, Eickhout BJ, Strengers B, Bouwman AF, Schaeffer M: Theconsequences for the terrestrial carbon cycle of uncertain-ties in land use, climate and vegetation responses in theIPCC SRES scenarios. Science in China 2002, 43:1-15.
49. Van Minnen JG, Strengers B, Eickhout B, Klein Goldewijk K: Simulat-ing carbon exchange between the terrestrial biopshere andatmosphere. In Integrated modelling of global environmental change Anoverview of IMAGE 24 Edited by: Bouwman AF, Kram T, Klein Goldew-ijk K. Bilthoven, the Netherlands; 2006:113-130.
50. Del Lungo A: Planted forest database: Analysis of annualplanting trends and silvicultural parameters for commonlyplanted species. Food and Agriculture Organization of the UnitedNations (FAO), Working Paper FP/26, Rome 2003:60.
51. FAO: Assessing carbon stocks and modelling win-win scenar-ios of carbon sequestration through land-use changes. FAO,Rome 2004:68.
52. Onigkeit J, Sonntag M, Alcamo J: Carbon Plantations in theIMAGE model – Model: Description and scenarios. Center forEnvironmental Systems Research, Uni. Kassel, Kassel, Germany 2000:41.
53. Karjalainen T, Pussinen A, Liski J, Nabuurs GJ, Eggers T, LapvetelainenT, Kaipainen T: Scenario analysis of the impacts of forest man-agement and climate change on European forest sector car-bon budget. Forest Policy and Economics 2003, 5:141-155.
54. Phat NK, Knorr W, Kim S: Appropriate measures for conserva-tion of terrestrial carbon stocks – Analysis of trends of forestmanagement in Southeast Asia. Forest Ecology and Management2004, 191:283-299.
55. Richards KR, Stokes C: A review of forest carbon sequestrationcost studies: A dozen years of research. Climatic Change 2004,63:1-48.
56. Benítez PC, McCallum I, Obersteiner M, Yamagata Y: Global poten-tial for carbon sequestration: Geographical distribution,
country risk and policy implications. Ecological Economics 2006,60:572-583.
57. GTAP: The GTAP 6 Data package. Purdue University, USA;2004.
58. Alcamo J, Kreileman GJJ, Krol M, Leemans R, Bollen J, Van Minnen JG,Schaefer F, Toet S, De Vries B: Global modelling of environmen-tal change: An overview of IMAGE 2.1. In Global change scenariosof the 21st century Results from the IMAGE 21 model Edited by: AlcamoJ, Leemans R, Kreileman GJJ. London: Pergamon Press/Elsevier Sci-ence; 1998:3-94.
59. IMAGE team: The IMAGE 2.2 implementation of the SRESscenarios: A comprehensive analysis of emissions, climatechange and impacts in the 21st century. National Institute ofPublic Health and the Environment, RIVM CD-ROM Publication,481508018, Bilthoven; 2001.
60. Klein Goldewijk K, Van Minnen JG, Kreileman GJJ, Vloedbeld M, Lee-mans R: Simulation of the carbon flux between the terrestrialenvironment and the atmosphere. Water, Air and Soil Pollution1994, 76:199-230.
61. Nilsson S, Schopfhauser W: The carbon-sequestration potentialof a global afforestation program. Climatic Change 1995,30:267-293.
62. Vrolijk C, Grubb M, Metz B, Haites E: Quantifying Kyoto Work-shop. A summary. 2000 [http://www.riia.org/research]. RoyalInstitute of International Affairs, London
63. Lal R: Global Potential of soil carbon sequestration to miti-gate the greenhouse effect. Critical Reviews in Plant Sciences 2003,22:151-184.
64. EEA: Greenhouse gas emission projections and costs1990–2030. European Environmental Agency, Technical paper2004/1 Copenhagen, Denmark; 2004:82.
65. Smith P, Andren O, Brussaard L, Dangerfield M, Ekschmitt K, LavelleP, Tate K: Soil biota and global change at the ecosystem level:describing soil biota in mathematical models. Global ChangeBiology 1998, 4:773-784.
66. NFCCC: Document on the Implementation of the BuenosAires Plan for Action. UNFCCC secretariat, UNFCCC/CP/20000/L.7, Bonn, Germany; 2001.
67. Krankina ON, Harmon ME, Cohen WB, Doug R, Oetter , Zyrina O,Duane MV: Carbon stores, sinks, and sources in forests ofNorthwestern Russia: Can we reconcile forest inventorieswith remote sensing results? Climatic Change 2004, 67:257-272.
68. Chen W, Chen JM, Price DT, Cihlar J, Liu J: Carbon offset poten-tials of four alternative forest management strategies inCanada: a simulation study. Mitigation and Adaptation Strategies forGlobal Change 2000, 5:143-169.
69. Liski J, Korotkov A, Prins CFL, Karjalainen T, Victor DG, Kauppi PE:Increased carbon sink in temperature and boreal forests. Cli-matic Change 2003, 61:89-99.
70. Cramer W, Solomon AM: Climatic classification and future glo-bal redistribution of agricultural land. Climate Research 1993,3:97-110.
71. Nabuurs GJ, Mohren GMJ: Carbon fixation through forestryactivities. IBN-DLO, Wageningen, the Netherlands, 93/4; 1993.
72. Cannell MGR: World Forest Biomass and Primary ProductionData. New York: Academic Press; New York; 1982:391.
73. Schober R: Ertragstafeln wichtiger Baumarten. J.D. SauerlanderVerlag, Frankfurt a.M; 1975:154.
74. Ilic J, Boland D, McDonald M, Downes G, Blakemore P: WoodyDensity Phase 1 – State of Knowledge. Australian GreenhouseOffice, Tech. Report 18 2000:234.
75. Gracia C, Sabate S: Aboveground biomass expansion factorsand biomass equations of forests in Catalonia. CREAF expertmeeting on biomass expansion factors (BEF); Valencia 2002:5.
76. NRRPC: Measurement of carbon sequestration in small non-industrial forest plantations. Northern Rivers Region PlantationCommittee, Technical Report Greenhouse Gas 2004:25.
77. Van de Hoef L, Hill B: Radiata pine for farm forestry. NRE, Agri-culture Notes AG1070 2003:2.
78. Tunctaner K: Sustainability of industrial forest plantations inTurkey. University of Zonguldak Kararaelmas, Faculty of Forestry, Tur-key, working paper 2004:19.
Page 20 of 20(page number not for citation purposes)