quantifying the business impact of customer service customer... · • customer service directly...
TRANSCRIPT

QUANTIFYING THE BUSINESS IMPACT OF CUSTOMER SERVICE
December 2018
Sponsored by

© 2018 Dimensional Research.All Rights Reserved. www.dimensionalresearch.com
QUANTIFYING THE BUSINESS IMPACT OF CUSTOMER SERVICE
Dimensional Research | December 2018
IntroductionIrritating issues affect customers daily. In every industry a customer will inevitably contact customer service to voice a problem. “I’ve bought your product but it doesn’t do what it’s supposed to do.” “I ordered the item last week and have still not received it.” “I am unable to access my account.” “I keep getting transferred from one customer service rep to the next.” “Nobody is letting me know the status of my issue.” While customer service issues are common, it is how and when your company resolves these customer service problems that will profoundly impact future purchases.
To successfully meet customer demands for more immediate, personalized attention, companies are leveraging new technologies that go beyond traditional voice and email. By implementing such channels as live chat, social media, mobile apps, SMS/text messages, self-help solutions, and more, companies can now be ready wherever and however the customer wants.
But just how meaningful are these experiences on consumer buying behavior? How long does the effect last? Do new technologies and recent cultural shifts significantly change the way experiences are evaluated? What expectations do customers have for the channels they use to contact support? And, do good interactions have the same long-term impact of negative interactions?
The following report, sponsored by Zendesk, is based on an online survey of 1,044 U.S. consumers who have received online or phone customer service. The research goal was to better understand present customer expectations and to quantify the impact of customer service on business results. Questions were asked about past experiences with customer service, as well as preferences and opinions. Certain questions were repeated from a similar 2013 survey to enable trend analysis.
Sponsored by

Dimensional Research | December 2018
www.dimensionalresearch.com © 2018 Dimensional Research.All Rights Reserved.Page 3
QUANTIFYING THE BUSINESS IMPACT OF CUSTOMER SERVICE
Key Findings• Customer service directly impacts long-term revenue
- 89% say a quick response to an initial inquiry is important when deciding which company to buy from
- 97% say bad customer service changes buying behavior, and 87% say good customer service changes buying behavior
- 46% continue to change their buying behavior two years after a bad customer service experience
• Excellent customer service requires a wide range of channels - Customer preferences include a broad mix of communication channels to contact customer service
◦ For simple service requests, 60% prefer email, 58% prefer phone, 48% prefer live chat, 24% prefer SMS/text, and 18% prefer social media
◦ For complicated service requests, 76% prefer phone, 43% prefer live chat, 40% prefer email, 15% prefer text, and 12% prefer social media
- 28% say multiple communication options are part of a good customer experience
- 27% say not being able to contact customer service with their preferred channel contributed to a bad customer experience
• Channels other than email and phone are gaining popularity for customer service - 67% have used live chat, social media, or texting for customer service
- 36% of Gen Z prefer social media for simple inquiries, although only 5% of Baby Boomers say the same
- 98% have used an FAQ, help center, or other self-serve online resources
• Service channels must be coordinated to be effective - 85% will use a different method if they don’t receive a response from their initial inquiry
- 51% wait less than an hour before trying another contact method if they haven’t heard back
• Expectations for good customer service are changing, especially for Millennials - 65% expect customer service to be faster now than it was five years ago
- 41% of Millennials want more options for contacting customer service
- 48% of Millennials are more likely to look for ways to solve problems on their own

Dimensional Research | December 2018
www.dimensionalresearch.com © 2018 Dimensional Research.All Rights Reserved.Page 4
QUANTIFYING THE BUSINESS IMPACT OF CUSTOMER SERVICE
Detailed Findings: Customer service directly impacts long-term revenueGood customer service impacts buying choicesPeople engage with companies on a regular basis and sometimes things don’t turn out as expected. But what exactly is considered a negative customer service experience from the human perspective? Our participants described bad experiences as anything from waiting too long to be helped to dealing with an unpleasant representative to facing challenges with the chosen contact method—or never getting the issue resolved at all. On the other side, their good customer service experiences included interacting with pleasant people, receiving fast, effective responses to inquiries, not having to explain the situation multiple times, and simply solving problems.
These factors are more than a nice to have, they directly impact purchasing decisions. A quick response is important (89%) when deciding what companies to buy from as is an overall smooth experience (85%).
Customer service changes buying behaviorsThere is a universal truth that good customer service will propel a company forward while bad service will set you back a few, or even many, steps from your desired goal. Customers will remember their experiences—good or bad—when it’s time to make their next purchases.
But how do good customer service interactions really change consumer behavior? Among survey participants reporting a good customer service experience, 87% reveal that their experience actually changed future buying behavior, from recommending products or services to other people (67%) to purchasing or using more products and services from that company (54%) to considering purchasing or using more from that company (39%).
41%
41%
44%
48%
14%
9%
2%
2%
0% 10% 20% 30% 40% 50% 60% 70% 80% 90% 100%
Smooth experience (not having to repeatinformation or send reminder inquiries, etc.)
Quick response to the initial inquiry
How much do the following factors impact your choice of which companies you buy from?
Critically importantVery importantNice to haveDoesn't have an impact
n = had a good customer experience
13%
39%
54%
67%
0% 10% 20% 30% 40% 50% 60% 70% 80%
No changes
I considered purchasing or using more products or services from that company
I purchased or used more products or services from that company
I recommended those products or services to others
Did this GOOD customer service interaction change your behavior in any way?
Dimensional Research | December 2018
www.dimensionalresearch.com © 2018 Dimensional Research.All Rights Reserved.Page 5
QUANTIFYING THE BUSINESS IMPACT OF CUSTOMER SERVICE
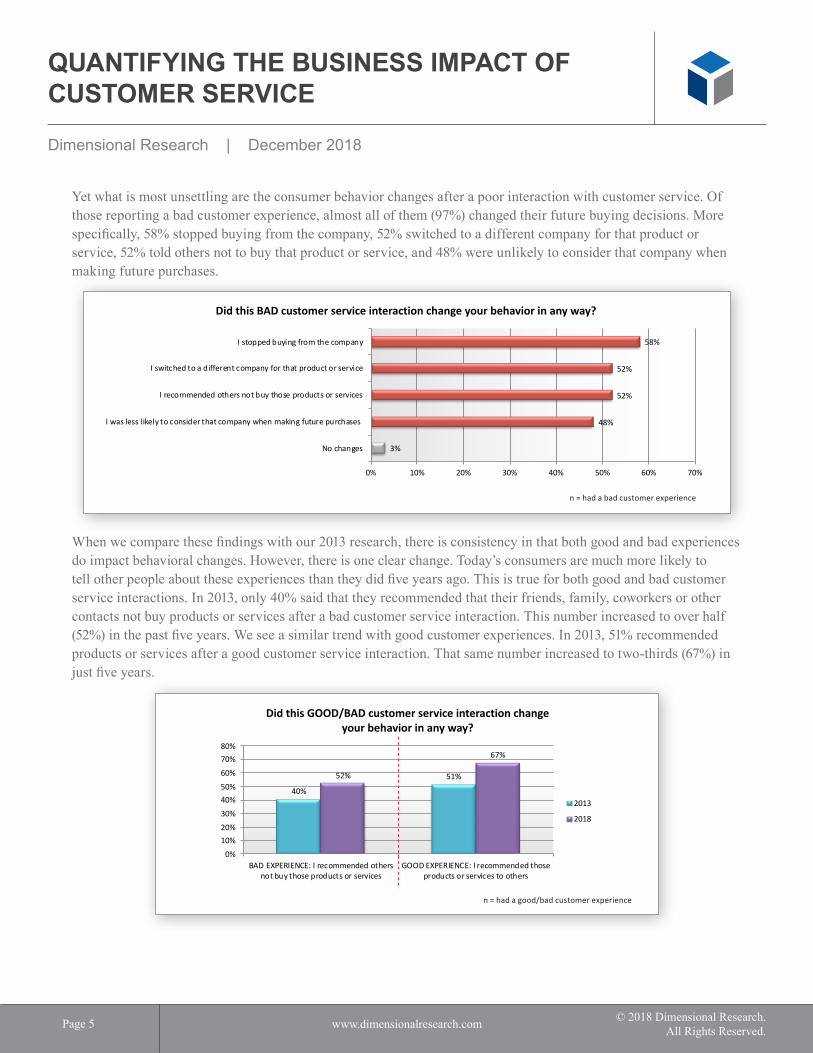
Yet what is most unsettling are the consumer behavior changes after a poor interaction with customer service. Of those reporting a bad customer experience, almost all of them (97%) changed their future buying decisions. More specifically, 58% stopped buying from the company, 52% switched to a different company for that product or service, 52% told others not to buy that product or service, and 48% were unlikely to consider that company when making future purchases.
When we compare these findings with our 2013 research, there is consistency in that both good and bad experiences do impact behavioral changes. However, there is one clear change. Today’s consumers are much more likely to tell other people about these experiences than they did five years ago. This is true for both good and bad customer service interactions. In 2013, only 40% said that they recommended that their friends, family, coworkers or other contacts not buy products or services after a bad customer service interaction. This number increased to over half (52%) in the past five years. We see a similar trend with good customer experiences. In 2013, 51% recommended products or services after a good customer service interaction. That same number increased to two-thirds (67%) in just five years.
3%
48%
52%
52%
58%
0% 10% 20% 30% 40% 50% 60% 70%
No changes
I was less likely to consider that company when making future purchases
I recommended others not buy those products or services
I switched to a different company for that product or service
I stopped buying from the company
Did this BAD customer service interaction change your behavior in any way?
n = had a bad customer experience
40%
51%52%
67%
0%
10%20%
30%
40%50%
60%
70%80%
BAD EXPERIENCE: I recommended othersnot buy those products or services
GOOD EXPERIENCE: I recommended thoseproducts or services to others
Did this GOOD/BAD customer service interaction change your behavior in any way?
2013
2018
n = had a good/bad customer experience

Dimensional Research | December 2018
www.dimensionalresearch.com © 2018 Dimensional Research.All Rights Reserved.Page 6
QUANTIFYING THE BUSINESS IMPACT OF CUSTOMER SERVICE
Customers remember bad experiences longer than good onesEven though the human mind recalls both the good and the bad, unfavorable interactions with customer service are longer lasting. People will often stop buying from a company altogether due to a poor experience. When consumers were asked about customer service experiences that happened a long time ago but still impact them today, 46% remember bad experiences from two or more years ago. In contrast, only 21% remember good experiences from a similar time period.
This trend is especially worrisome as more consumers (46%) are saying their purchase behaviors are impacted by bad experiences from two or more years ago, up from 39% in 2013. On the flip side, good experiences don’t last as long. Those saying their purchase behaviors continue to be impacted by good customer service experiences actually dropped from 24% to 21% in the same time frame.
n = had a good/bad customer experience
n = had a good/bad customer experience
26%
70%
29%
9%
46%
21%
0% 20% 40% 60% 80% 100%
Bad
Good
How long ago did you have the GOOD/BAD experience?
Less than one year ago
One year ago
Two years ago or more
39%
46%
24%21%
0%5%
10%15%20%25%30%35%40%45%50%
2013 2018 2013 2018
"Two years ago or more"
BAD GOOD

Dimensional Research | December 2018
www.dimensionalresearch.com © 2018 Dimensional Research.All Rights Reserved.Page 7
QUANTIFYING THE BUSINESS IMPACT OF CUSTOMER SERVICE
In addition to changing their buying behaviors, people will most likely share their experiences—good or bad—with others, which can significantly amplify the effects of their words on a company’s long-term business.
And, boy do they talk. Stories were most frequently told in person to friends and family (76% for bad and 74% for good). It was especially common to share experiences online after a negative run-in with customer service. They communicated bad experiences through social media more often than their good experiences (49% for bad and 38% for good.) The trend was similar for online review sites (46% for bad and 27% for good).
Detailed Findings: Excellent customer service requires a wide range of channelsCustomers use a broad mix of channels to contact customer serviceToday an omnichannel approach, one that incorporates a full range of voice and digital channels, is becoming the standard for meeting customer service expectations. Companies that excel in customer service are committed to the motto—give customers what they want in the way they want it.
Today’s consumers use a wide range of channels for customer service. Over the past 12 months, the most frequently used method for communicating with customer service was phone (81%) followed by email (70%), live chat (54%), social media (27%), and SMS/text (17%).
n = had a good/bad customer experience
17%
27%
54%
70%
81%
0% 10% 20% 30% 40% 50% 60% 70% 80% 90%
SMS/text
Social Media (Twitter, Facebook, Instagram, etc.)
Live chat
Phone
In the past 12 months, which of the following methods have you used to communicate with a customer service department to get information or resolve an issue?
5%
39%
46%
49%
57%
76%
16%
26%
27%
38%
50%
74%
0% 10% 20% 30% 40% 50% 60% 70% 80%
I did not tell anybody
Coworkers in person
Online review sites (i.e. Yelp)
Online friends (i.e. social media)
The company who provided the good/bad customer
Friends or family in person
Who did you tell about these GOOD/BAD customer service interactions?
Good
Bad

Dimensional Research | December 2018
www.dimensionalresearch.com © 2018 Dimensional Research.All Rights Reserved.Page 8
QUANTIFYING THE BUSINESS IMPACT OF CUSTOMER SERVICE
Preferences for service channels range greatlyPerhaps, one of the most important findings from this research is that consumers prefer different communication channels depending on the urgency and complexity of the issue. For simple information requests, such as getting shipping updates, information changes, and the like, consumers are more likely to report a preference for digital channels including email (60%), live chat (48%), SMS/text (24%), and social media (18%).
Conversely, for more complicated requests like troubleshooting a product malfunction or requesting a rebate, consumers have a clear preference for customer service by phone (76%).
Availability of preferred channels influences customer service experiencesToday’s consumers want it all. They demand near-instant solutions and expect a flawless experience from their channels of choice when contacting customer service. In fact, 28% report having multiple options for contacting customer service made it a good experience. While 27% report not being able to contact customer support using their preferred method made it a bad experience. Simply by making life easier for customers, customer support can transform the overall experience.
18%
24%
60%
48%
58%
12%
15%
40%
43%
76%
0% 10% 20% 30% 40% 50% 60% 70% 80%
Social Media (Twitter, Facebook, Instagram, etc.)
SMS/text
Live chat
Phone
How would you prefer to communicate with customer service for aSIMPLE/COMPLICATED request?
Complex
Simple
28% 27%
0%
5%
10%
15%
20%
25%
30%
GOOD EXPERIENCE: There were multipleoptions on how to contact customer service
BAD EXPERIENCE: I could not contact themusing the method I prefer
What specifically made these customer service interactions GOOD/BAD?
Dimensional Research | December 2018
www.dimensionalresearch.com © 2018 Dimensional Research.All Rights Reserved.Page 9
QUANTIFYING THE BUSINESS IMPACT OF CUSTOMER SERVICE
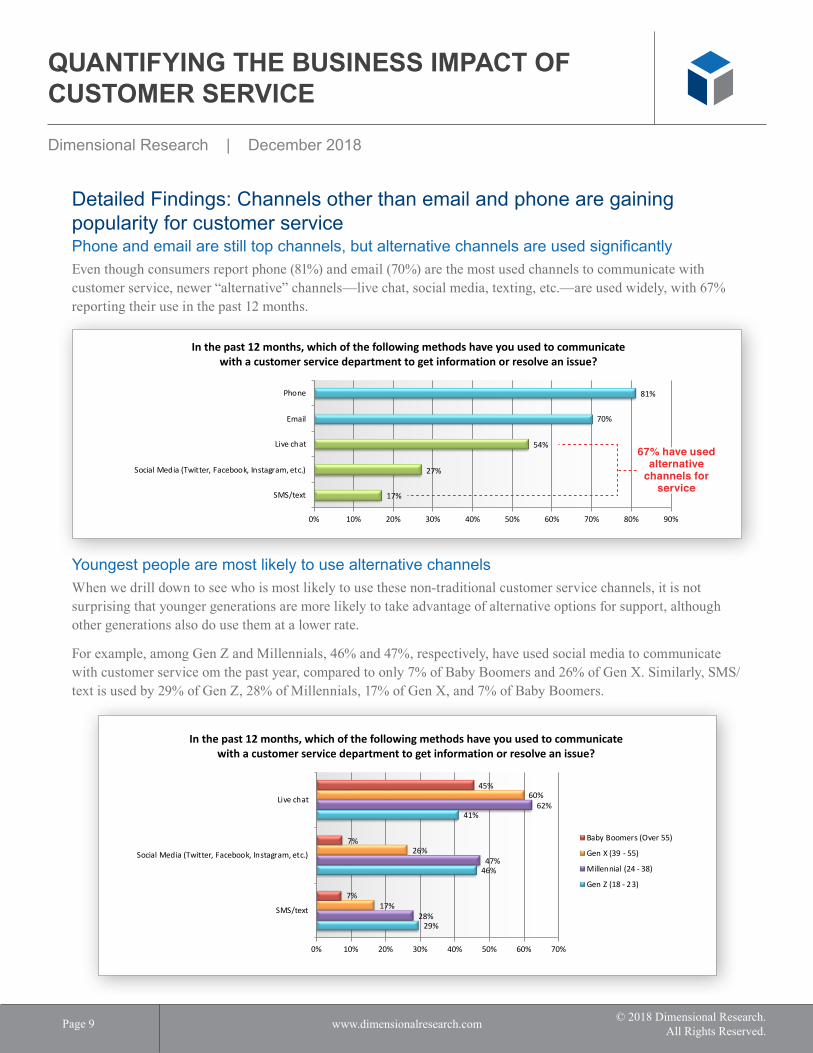
Detailed Findings: Channels other than email and phone are gaining popularity for customer servicePhone and email are still top channels, but alternative channels are used significantlyEven though consumers report phone (81%) and email (70%) are the most used channels to communicate with customer service, newer “alternative” channels—live chat, social media, texting, etc.—are used widely, with 67% reporting their use in the past 12 months.
Youngest people are most likely to use alternative channelsWhen we drill down to see who is most likely to use these non-traditional customer service channels, it is not surprising that younger generations are more likely to take advantage of alternative options for support, although other generations also do use them at a lower rate.
For example, among Gen Z and Millennials, 46% and 47%, respectively, have used social media to communicate with customer service om the past year, compared to only 7% of Baby Boomers and 26% of Gen X. Similarly, SMS/text is used by 29% of Gen Z, 28% of Millennials, 17% of Gen X, and 7% of Baby Boomers.
17%
27%
54%
70%
81%
0% 10% 20% 30% 40% 50% 60% 70% 80% 90%
SMS/text
Social Media (Twitter, Facebook, Instagram, etc.)
Live chat
Phone
In the past 12 months, which of the following methods have you used to communicate with a customer service department to get information or resolve an issue?
67% have used alternative
channels for service
29%
46%
41%
28%
47%
62%
17%
26%
60%
7%
7%
45%
0% 10% 20% 30% 40% 50% 60% 70%
SMS/text
Social Media (Twitter, Facebook, Instagram, etc.)
Live chat
In the past 12 months, which of the following methods have you used to communicate with a customer service department to get information or resolve an issue?
Baby Boomers (Over 55)
Gen X (39 - 55)
Millennial (24 - 38)
Gen Z (18 - 23)

Dimensional Research | December 2018
www.dimensionalresearch.com © 2018 Dimensional Research.All Rights Reserved.Page 10
QUANTIFYING THE BUSINESS IMPACT OF CUSTOMER SERVICE
Younger people prefer using social media for customer serviceYounger people, both Gen Z and Millennials, do prefer alternative channels when we examine both simple and complex customer service requests. When we asked consumers about their preference for one customer service communication method over another, more than a third (36%) of Gen Z choose social media for simple requests in contrast to only 5% of Baby Boomers. The same held with complex requests where 26% of Gen Z choose social media compared to only 2% of Baby Boomers.
To better understand why customers prefer using social media over other service channels, we asked participants about their rationale. More than two-thirds (67%) say social media is a convenient channel to contact customer service. Additionally, 62% prefer using social media because it’s easier to share pictures that show the problem.
36%
26%
29%
23%
18%
11%
5%2%
0%
5%
10%
15%
20%
25%
30%
35%
40%
Social media (Simple) Social media (Complex)
"Prefer social media for customer service"
Gen Z (18 - 23)
Millennial (24 - 38)
Gen X (39 - 55)
Baby Boomers (Over 55)
n = social media is a preferred channel
29%
53%
62%
67%
0% 10% 20% 30% 40% 50% 60% 70% 80%
I want other people to know about potential issues
I get faster service
Easier to share pictures that show the problem
It's convenient
Why would you prefer to use social media (Twitter, Facebook, Instagram, etc.) to contact customer service?

Dimensional Research | December 2018
www.dimensionalresearch.com © 2018 Dimensional Research.All Rights Reserved.Page 11
QUANTIFYING THE BUSINESS IMPACT OF CUSTOMER SERVICE
There are striking differences between generations in their motivations for using social media to contact customer service. If you’ve ever experienced communication challenges in trying to describe a particular issue to customer service, you know a picture is worth a thousand words. Our youngest participants couldn’t agree more with 81% of Gen Z stating they prefer social media because it’s easier to share pictures of the problem. In sharp contrast, only 38% of Baby Boomers use social media to share pictures of the problem. Instead, 69% of this oldest generation prefer social media so they can publicize potential issues to others.
Consumers are willing to search for answers on their ownOf course, if people can quickly solve problems on their own without contacting customer service that is good for both the customer that gets a quick answer and the service team that deflects ticket creation. Clearly, this is something customer service organizations should take seriously because 98% of consumers say they have tried a self-service solution, including searching a company’s FAQs, help center, or other online resources. And more than a third (37%) reveal that they do it always. By investing in more efficient self-service options, companies can decrease the number of help tickets submitted, reduce handling times, and increase customer satisfaction.
n = social media is a preferred channel
26%
81%
21%
59%
32%
62%
69%
38%
0% 10% 20% 30% 40% 50% 60% 70% 80% 90%
I want other people to know about potential issues
Easier to share pictures that show the problem
Why would you prefer to use social media (Twitter, Facebook, Instagram, etc.)to contact customer service?
Baby Boomers (Over 55)
Gen X (39 - 55)
Millennial (24 - 38)
Gen Z (18 - 23)
37% 43% 17% 2%
0% 10% 20% 30% 40% 50% 60% 70% 80% 90% 100%
Before contacting customer service directly, do you search for the answer or solution in the company's FAQs, help center, or other online resources?
Always
Usually, but not always
Occasionally
Never

Dimensional Research | December 2018
www.dimensionalresearch.com © 2018 Dimensional Research.All Rights Reserved.Page 12
QUANTIFYING THE BUSINESS IMPACT OF CUSTOMER SERVICE
Detailed Findings: Service channels must be coordinated to be effectiveMajority will try a different channel if they don’t get a response from their first methodAccording to our research, customers are impatient and 85% will jump from one service channel to another if they don’t get a response from their initial inquiries.
And it’s not just younger people who switch from phone to email to social media, and more for answers. While younger people are the most impatient, 91% of Gen Z and 92% of Millennials, say they try a different method if they don’t hear back from customer support after using their initial communication method. There is only slightly more patience among older generations with 87% of Gen X and 78% of Baby Boomers reporting the same thing.
Yes85%
No15%
When you do not receive a response from customer service using your initial chosen method, do you try using a different method to contact them?
91% 92%
87%
78%
50%
55%
60%
65%
70%
75%
80%
85%
90%
95%
Gen Z (18 - 23) Millennial (24 - 38) Gen X (39 - 55) Baby Boomers (Over 55)
"Yes"

Dimensional Research | December 2018
www.dimensionalresearch.com © 2018 Dimensional Research.All Rights Reserved.Page 13
QUANTIFYING THE BUSINESS IMPACT OF CUSTOMER SERVICE
Half will wait less than an hour before trying another contact methodSo just how long will customers wait before trying a different communication channel? Not long! More than half (51%) indicate they will wait less than an hour before trying a second contact method if they haven’t heard back. And 10% claim they will try another contact method after less than five minutes. When customers turn to another communications channel to get help, it can create confusion for the support organizations since multiple inquiries are not connected to the same issue and multiple reps work on the same issue.
Whatever the reasons behind these service delays, customers should never have to try again with their requests using a second (or third) communication method. Companies should be actively available wherever their customers need them and should strive to offer consistent customer service across all their channels.
Detailed Findings: Expectations for good customer service are changingCustomer needs are shifting, especially for MillennialsWhat’s next for customer service? Customers, especially Millennials, are reporting that their needs are changing, and good customer service organizations should respond. This means providing current and future customers with all the right self-service tools and communication channels, on their terms, not yours. This research suggests several practical ways to meet and exceed your customers’ changing customer service expectations.
First, offer more self-service options. All generations, but especially Millennials (48%), are increasingly trying to solve problems on their own by searching for answers online communities, FAQs, and the like.
Second, look for opportunities to streamline your internal processes so it’s easier for people to communicate with customer service. More than half (51%) of Millennials, 42% of Gen X, and 43% of Baby Boomers expect interactions to be less complicated than in the past. They are clear that they have no tolerance for repeating information or sending reminders.
10% 27% 14% 10% 11% 29%
0% 10% 20% 30% 40% 50% 60% 70% 80% 90% 100%
About how long do you wait before trying to contact customer service through a different method if you haven't heard a reply from your first method?
Less than 5 minutes
5-30 minutes
30-60 minutes
1-3 hours
3-12 hours
More than 12 hours
51%

Dimensional Research | December 2018
www.dimensionalresearch.com © 2018 Dimensional Research.All Rights Reserved.Page 14
QUANTIFYING THE BUSINESS IMPACT OF CUSTOMER SERVICE
Third, provide additional channels, such as live chat, SMS/text, social media, and more, for consumers to contact customer service. Again, this is particularly important to Millenials with almost half (41%) expressing that they want more options to contact customer service than what was offered five years ago. Gen X and Baby Boomers also share this sentiment, with 34% and 22%, respectively, expecting more touchpoints.
(Note: Gen Z was not included in this analysis as they have had limited experience with customer service five years ago.)
Consumers expect customer service to be faster than five years agoBecause the stakes are so high, companies must also lead in their response speed across all service channels. We found that nearly two-thirds (65%) of participants count on customer service to be faster than it was five years go.
41%
51%
48%
34%
42%
36%
22%
43%
23%
0% 10% 20% 30% 40% 50% 60%
I want more options for how to contact customerservice (live chat, social media, email, phone, etc.)
I expect less complicated interactions (needing torepeat information or send reminder inquiries, etc.)
I am more likely to look for ways to solve problems onmy own (online communities, FAQs, etc.)
How have your expectations of customer service changed in the past 5 years?
Baby Boomers (Over 55)
Gen X (39 - 55)
Millennial (24 - 38)
33% 32% 31% 3% 2%
0% 20% 40% 60% 80% 100%
How have your expectations changed in the past 5 years for the time a good customer service interaction should take?
Much faster
Somewhat faster
No change
Somewhat slower
Much slower
65%

Dimensional Research | December 2018
www.dimensionalresearch.com © 2018 Dimensional Research.All Rights Reserved.Page 15
QUANTIFYING THE BUSINESS IMPACT OF CUSTOMER SERVICE
As one of the most digital savvy generations, Millennials want their experiences short, sweet, and convenient—and they are not willing to wait. As such, this younger generation is changing the rules of customer service with 56% demanding faster customer service than what was provided five ago. In contrast, only 28% of Gen X and 18% of Baby Boomers expect speedier customer service. Because Millennials are now holding more of your purse strings, it’s important that your customer service be ready to serve these customers in way they want to be served.
Survey Methodology and Participant DemographicsIn October 2018, 1,044 individuals completed an online survey about their recent experiences with online or phone customer service. All participants lived in the United States and represented a wide range of ages, annual household incomes, and gender identities.
About Dimensional ResearchDimensional Research® provides practical market research for technology companies. We partner with our clients to deliver actionable information that reduces risks, increases customer satisfaction, and grows the business. Our researchers are experts in the applications, devices, and infrastructure used by modern businesses. We understand how corporate IT and technology stakeholders operate to meet the needs of their business. For more information, visit dimensionalresearch.com.
About ZendeskThe best customer experiences are built with Zendesk. Zendesk’s powerful and flexible customer service and engagement platform scales to meet the needs of any business, from startups and small businesses to growth companies and enterprises. Zendesk serves businesses across a multitude of industries, with more than 125,000 paid customer accounts offering service and support in more than 30 languages. Headquartered in San Francisco, Zendesk operates worldwide with 15 offices in North America, Europe, Asia, Australia, and South America. Learn more at www.zendesk.com.
Less than $25,00015%
$25,000 - $75,00042%
$75,000 - $150,00029%
Over $150,00014%
Annual Household IncomeGen Z (18 - 23)
8%
Millennial (24 - 38)26%
Gen X (39 - 55)30%
Baby Boomers (Over 55)
36%
Age
56%
28%18%
0%
20%
40%
60%
Millennial (24 - 38) Gen X (39 - 55) Baby Boomers (Over 55)
"Much faster"
Male49%
Female50%
Other1%
Gender