quantifying emissions of ammonia for air quality … emissions of ammonia for air quality analysis...
TRANSCRIPT
Quantifying Emissions of Ammonia For Air Quality Analysis
Viney P. AnejaDepartment of Marine, Earth, and Atmospheric Sciences
North Carolina State UniversityRaleigh, NC 27695-8208, U.S.A.
2009 Science Meeting "Total Reactive Nitrogen: Regional Haze Impacts and Mitigation Options”July 28-29, 2009Baltimore, MD
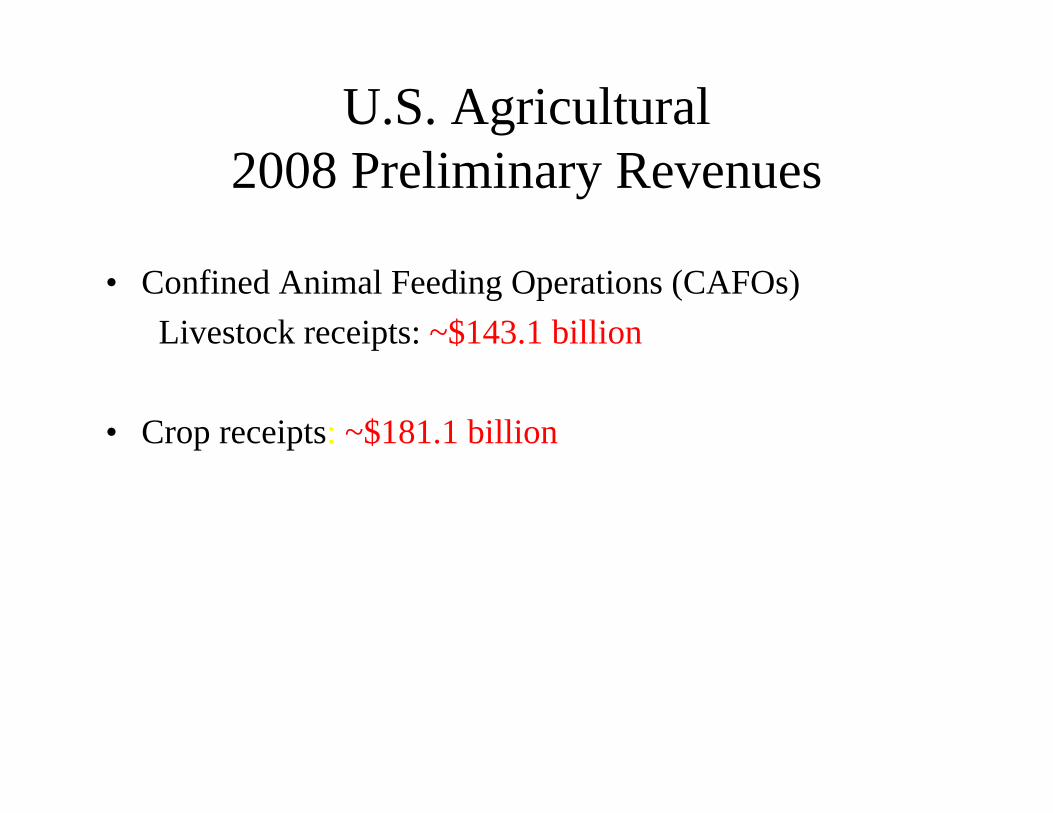
U.S. Agricultural 2008 Preliminary Revenues
• Confined Animal Feeding Operations (CAFOs)Livestock receipts: ~$143.1 billion
• Crop receipts: ~$181.1 billion
Source: http://www.ers.usda.gov/Briefing/FarmIncome/Data/cr_t3.htm
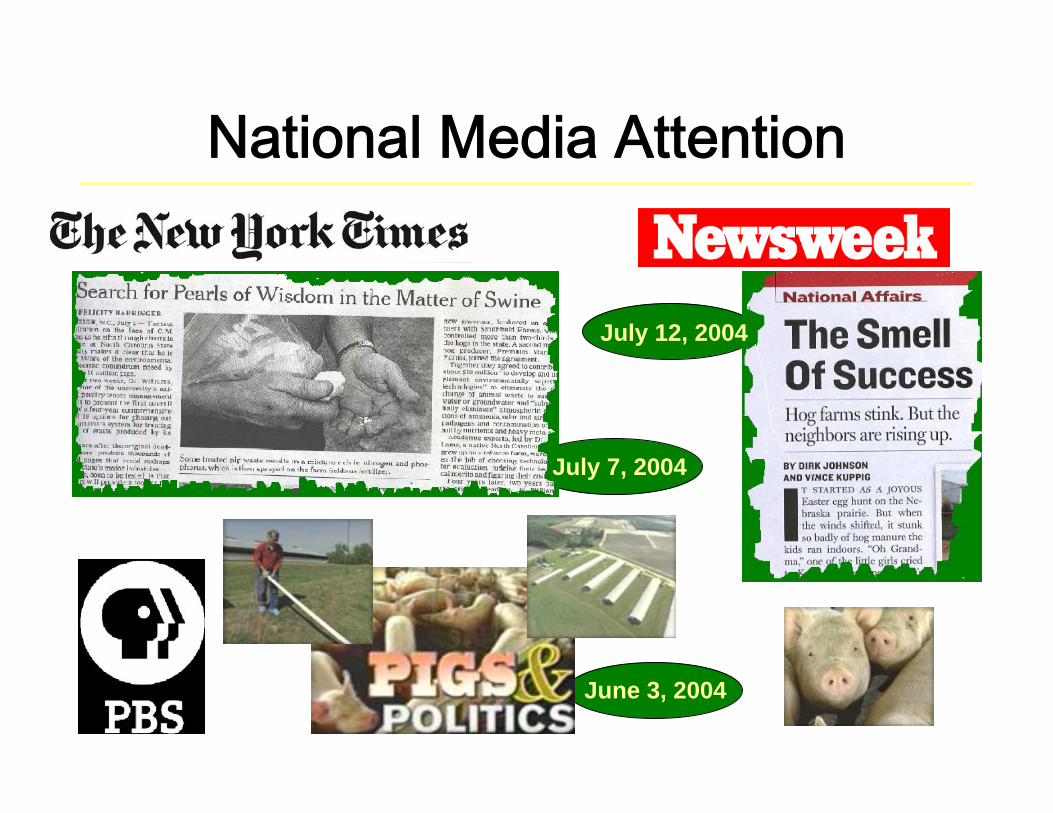
National Media Attention
July 7, 2004
July 12, 2004
June 3, 2004
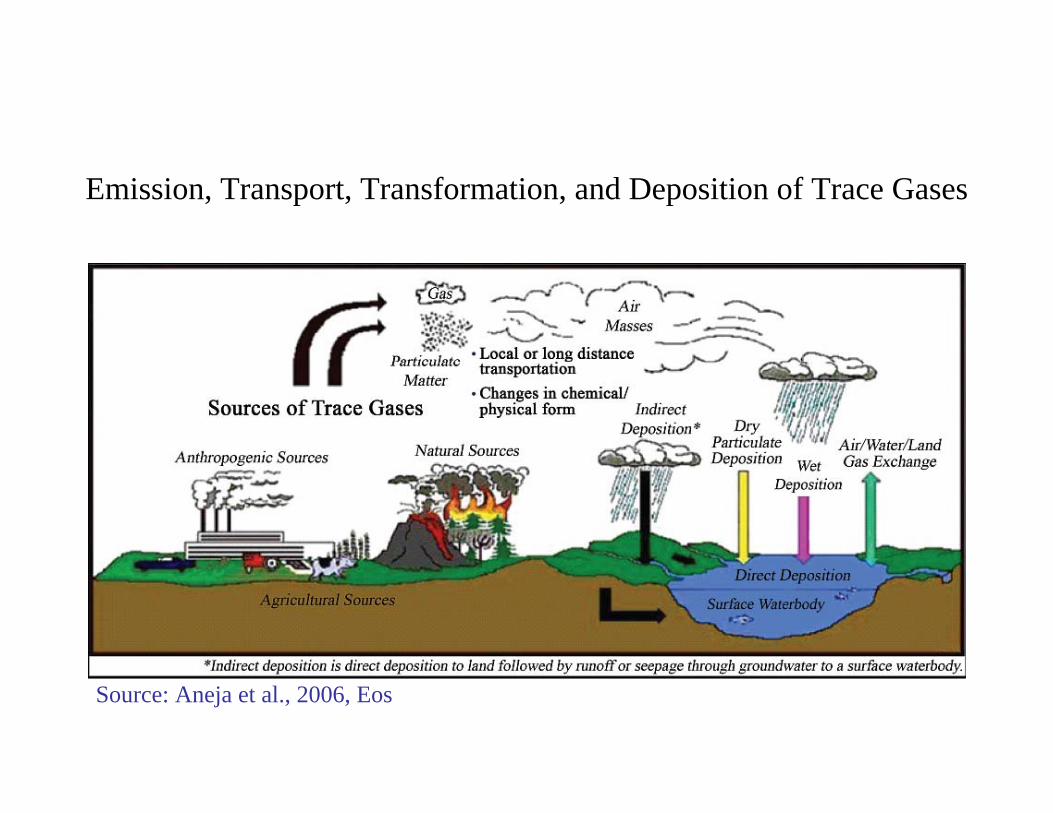
Emission, Transport, Transformation, and Deposition of Trace Gases
Source: Aneja et al., 2006, Eos
National Research Council, 2002Report “The Scientific Basis for Estimating Emissions from Animal Feeding Operations”
• “The stakes in this issue are large. More and more livestock are raised for at least part of their lives in AFO’s in response to economic factors that encourage further concentration. The impacts on the air in surrounding areas have grown to a point where further actions to mitigate them appear likely.”
• “EPA may use information from this project in determining how it will approach regulating both air and water quality impacts of AFOs. Substantial emissions of nitrogen (N), sulfate (S), carbon (C), particulate matter (PM), and other substances from AFOs do occur and cannot be ignored.”

Impacts of Enhanced Ammonia on the Environment
• Particulate matter (PM) formation• Visibility degradation• Nitrogen enrichment and eutrophication in
aquatic ecosystems• Impact on crop and forest production• Impact on ground water quality• Impact on biodiversity• Odors and odorants• Changes in rainfall chemistry

GasGas--ToTo--Particle Conversion ProcessesParticle Conversion Processes
HO2
NO23
SecondaryOrganicAerosol
CO, RH, RCHO
Gas-phaseProducts
Droplet Phase (Dp > 10um)
Aer
osol
Pha
se (D
p<
10um
)
Chemical coupling in the atmospheric gas, particle, and droplet phases (Meng, et al., 1997).
H2O2
HO2
NO
OHO3
NO3
NO3
PANRCO3
H2OHNO3
NH3
NH3
SO2
H2SO4
hv
N2O5
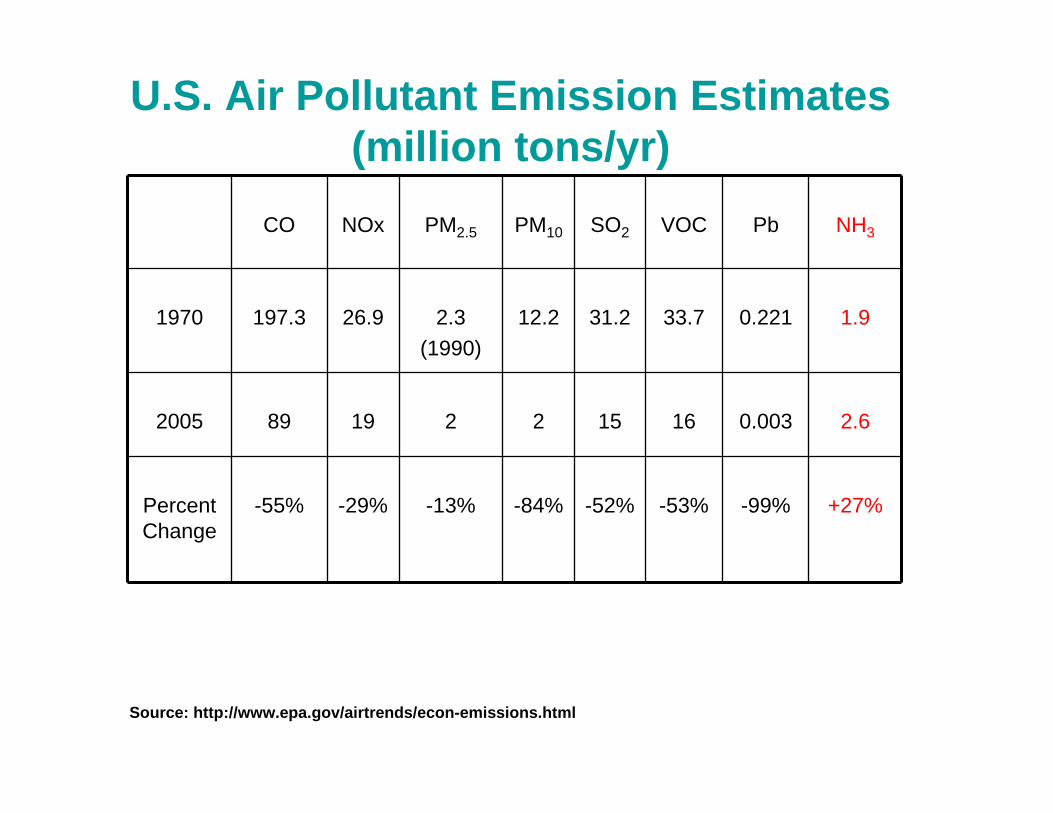
CO NOx PM2.5 PM10 SO2 VOC Pb NH3
1970 197.3 26.9 2.3(1990)
12.2 31.2 33.7 0.221 1.9
2005 89 19 2 2 15 16 0.003 2.6
Percent Change
-55% -29% -13% -84% -52% -53% -99% +27%
Source: http://www.epa.gov/airtrends/econ-emissions.html
U.S. Air Pollutant Emission Estimates (million tons/yr)
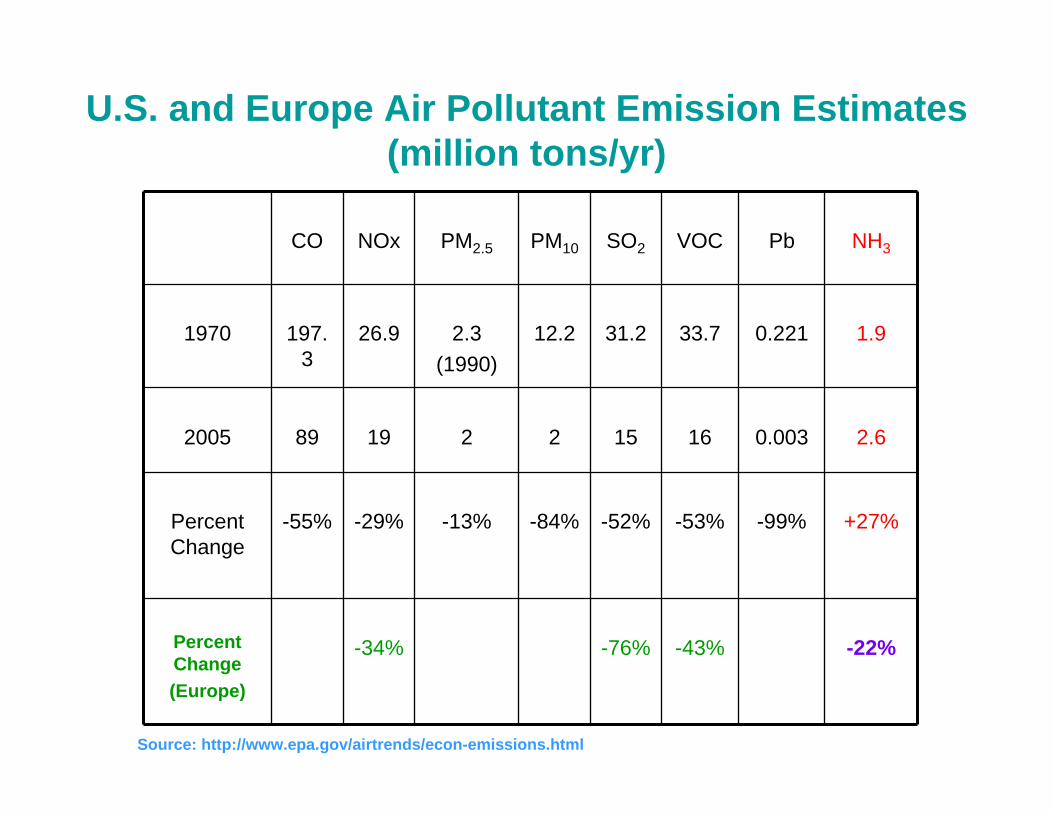
CO NOx PM2.5 PM10 SO2 VOC Pb NH3
1970 197.3
26.9 2.3(1990)
12.2 31.2 33.7 0.221 1.9
2005 89 19 2 2 15 16 0.003 2.6
Percent Change
-55% -29% -13% -84% -52% -53% -99% +27%
Percent Change(Europe)
-34% -76% -43% -22%
Source: http://www.epa.gov/airtrends/econ-emissions.html
U.S. and Europe Air Pollutant Emission Estimates (million tons/yr)
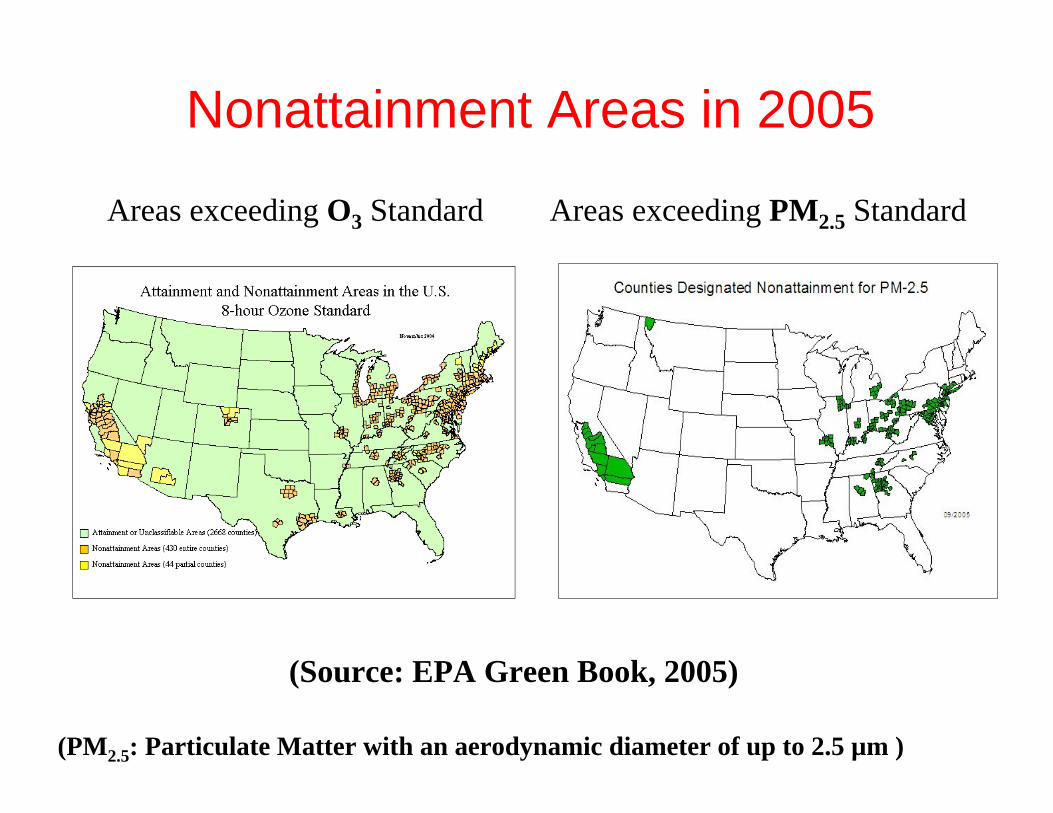
Nonattainment Areas in 2005
(Source: EPA Green Book, 2005)
Areas exceeding O3 Standard Areas exceeding PM2.5 Standard
(PM2.5: Particulate Matter with an aerodynamic diameter of up to 2.5 µm )

• Emission factors
• Emission based on inverse modeling
• Process based modeling
• Remote sensing
Methods to Quantify Ammonia Emissions
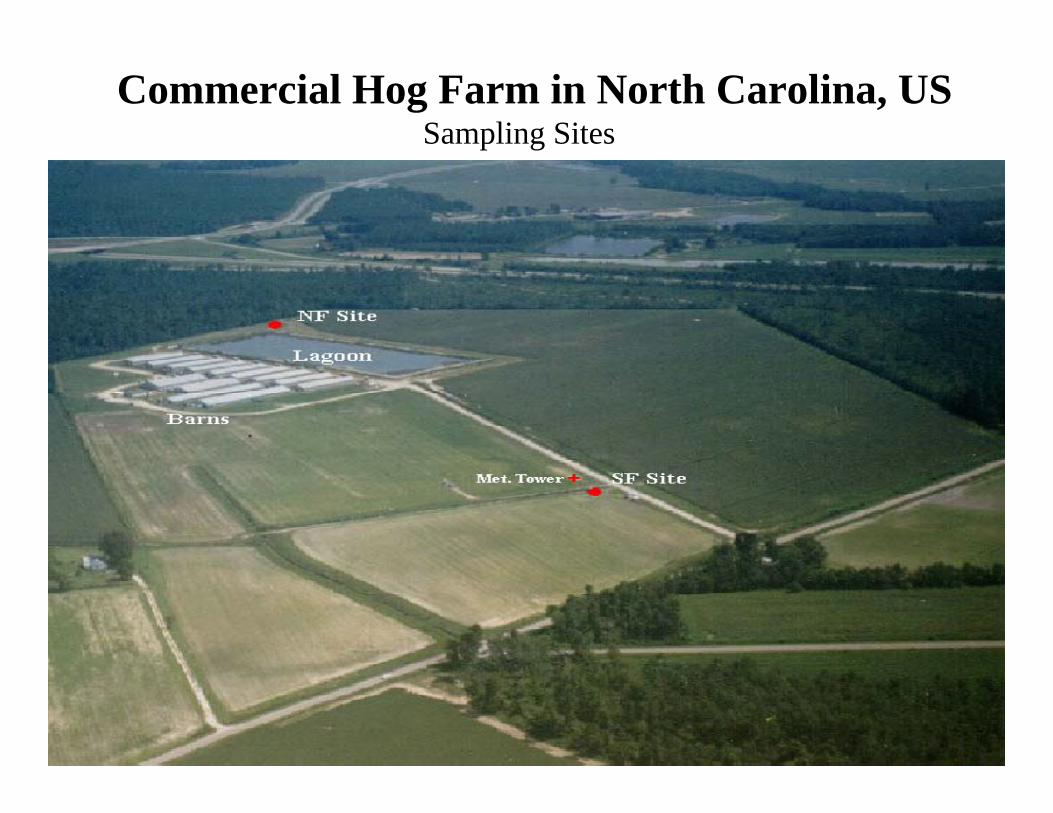
Commercial Hog Farm in North Carolina, USSampling Sites
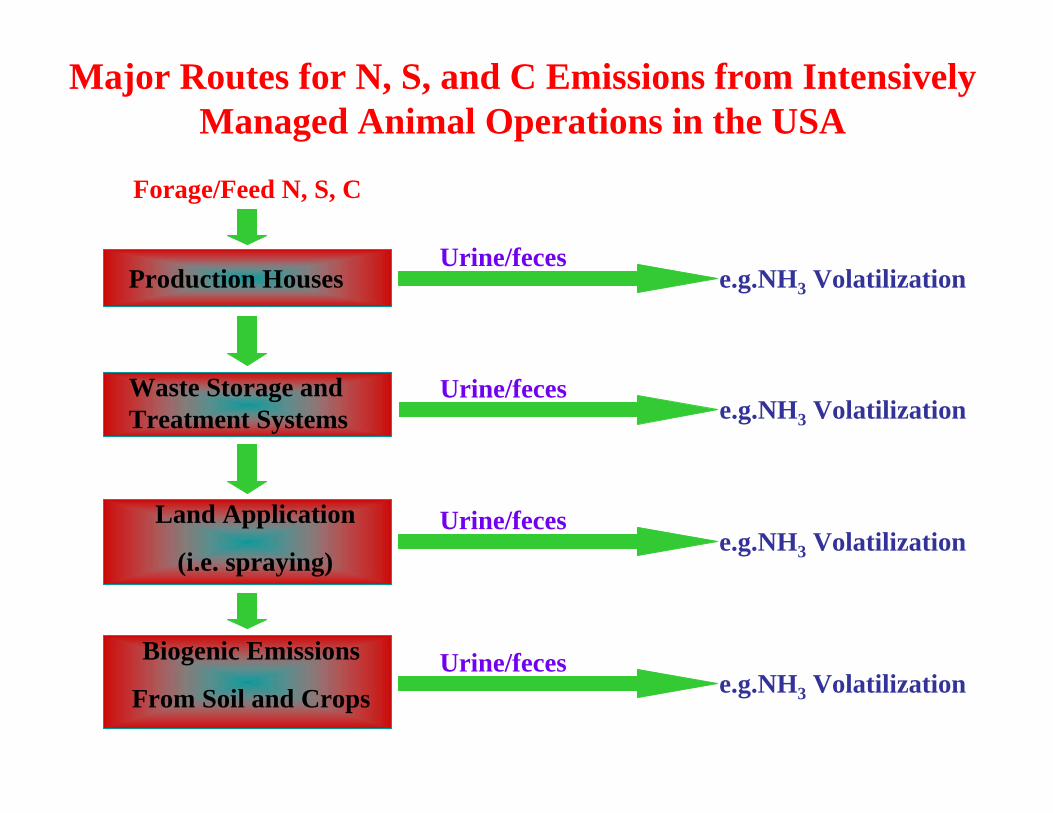
Production Houses
Forage/Feed N, S, C
Waste Storage and Treatment Systems
Land Application
(i.e. spraying)
Biogenic Emissions
From Soil and Crops
e.g.NH3 VolatilizationUrine/feces
e.g.NH3 VolatilizationUrine/feces
e.g.NH3 VolatilizationUrine/feces
e.g.NH3 VolatilizationUrine/feces
Major Routes for N, S, and C Emissions from Intensively Managed Animal Operations in the USA

Ammonia Flux Micrometeorological Experiment

Dynamic Flow-Through Chamber System
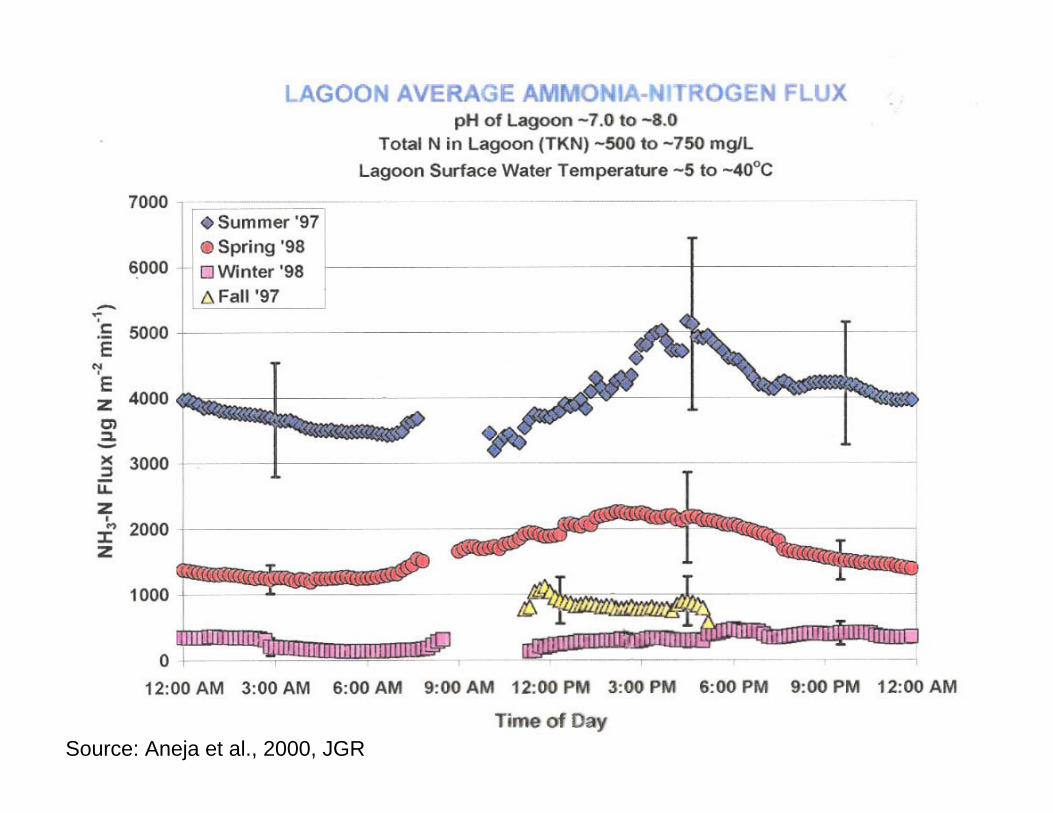
Source: Aneja et al., 2000, JGR

U.S. EPA WATER9 Model
Ammonia Flux MeasurementsLog
(Program OPEN)
Program OPEN
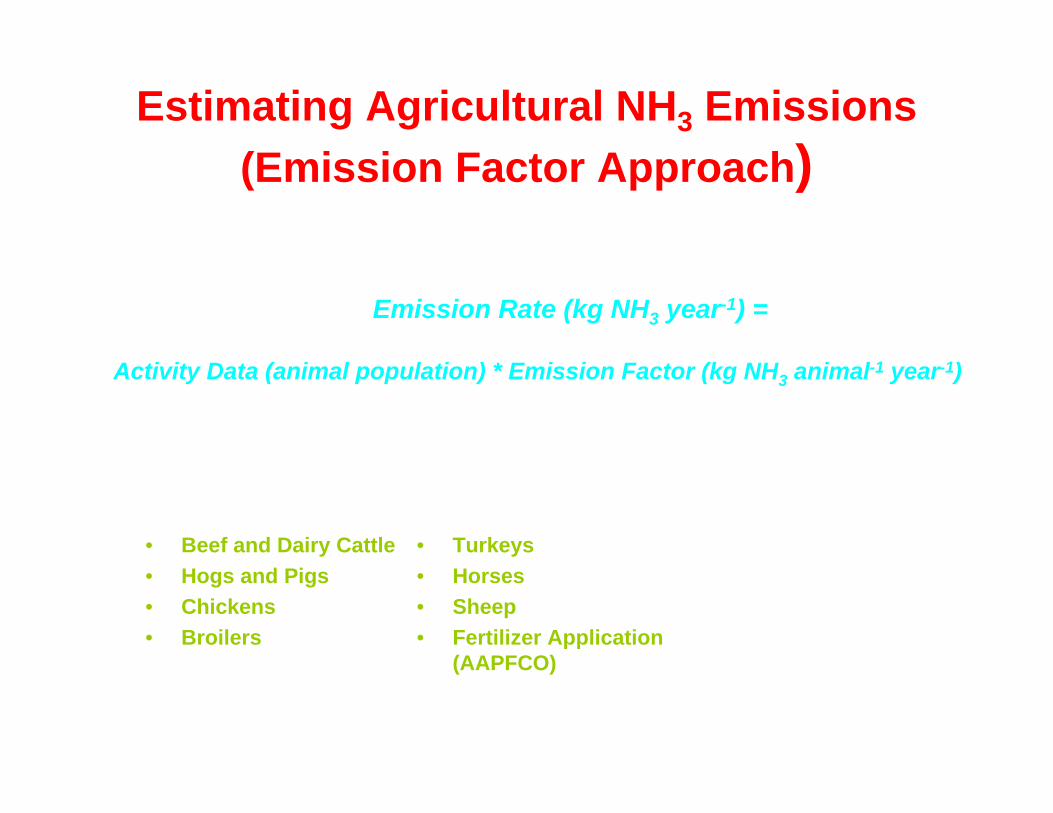
Estimating Agricultural NH3 Emissions (Emission Factor Approach)
• Activity Data: U.S. Census of Agriculture for 2002 at county-level
Emission Rate (kg NH3 year-1) =
Activity Data (animal population) * Emission Factor (kg NH3 animal-1 year-1)
• Beef and Dairy Cattle• Hogs and Pigs• Chickens• Broilers
• Turkeys• Horses• Sheep• Fertilizer Application
(AAPFCO)
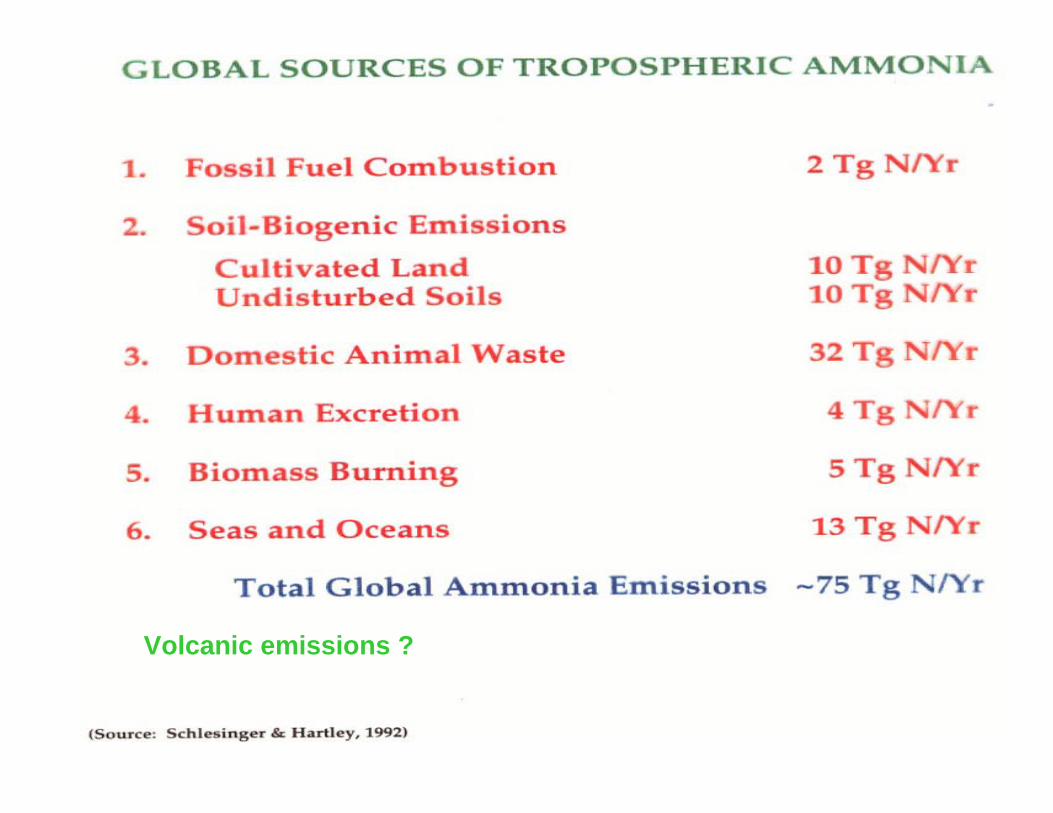
Volcanic emissions ?

Primary Sources of Ammonia Emissionsfor Animal Agriculture by Region
Based on current emission factor approach.

U.S. Ammonia Emission Factors for Animal and Crop AgricultureAnimal Agriculture Emission factor (kg-NH3/animal/ yr)
Animal Battye, Aneja, & Roelle, 20031 U.S. EPA: Battye et al., 19943
Dairy cow 28 40
Beef cow 10.2 27 (steers)
Sow 16.4 16
Finishing pig 6.4 7
Laying hen 0.31 0.31
Broiler 0.28 0.17
Sheep 1.34 3.4
Horses 8.0 12
Crop Agriculture Emission factor (kg NH3/Mg N)
Fertilizer Aneja et al., 20032 U.S. EPA: Battye et al., 19943
N-P-K 48 48
Nitrogen solutions 30 30
Ammonium phosphates 48 48
Anhydrous NH3 12 12
Urea 182 182
Ammonium nitrate 25 25
Other straight nitrogen 30 30
Ammonium sulfate 97 97
Aqua NH3 12 12
Ammonium thiosulfate 30 30
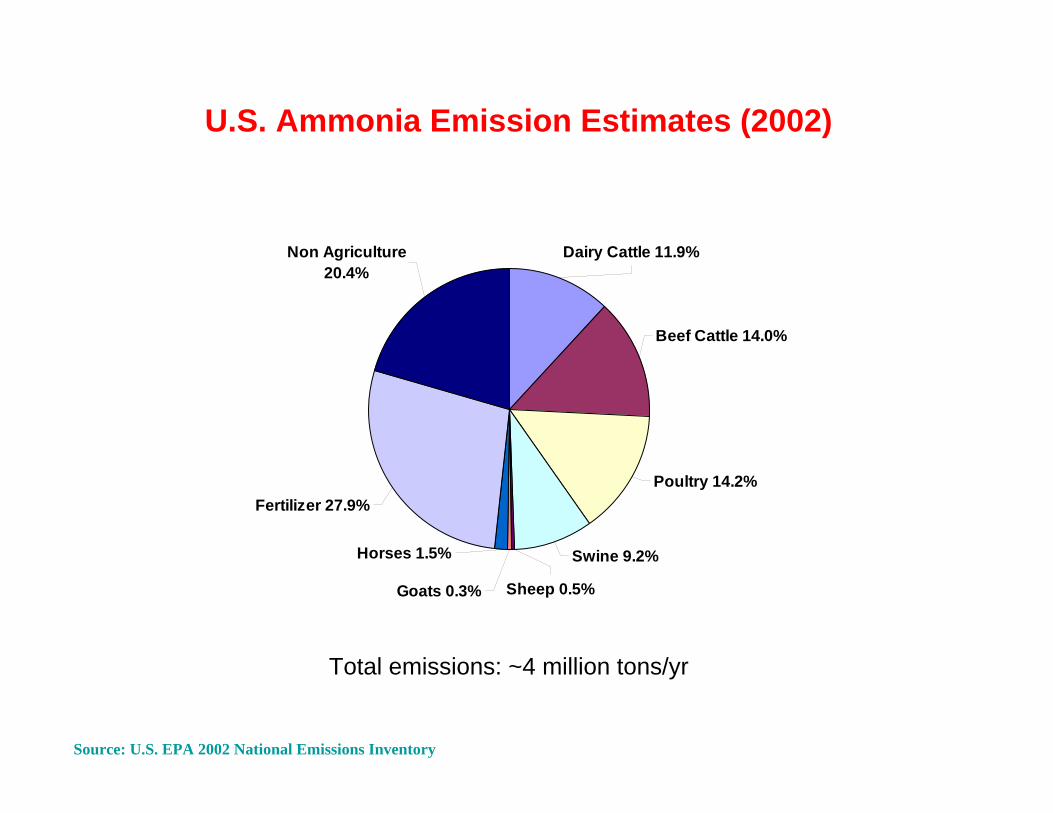
Fertilizer 27.9%
Non Agriculture 20.4%
Dairy Cattle 11.9%
Beef Cattle 14.0%
Poultry 14.2%
Swine 9.2%
Sheep 0.5%
Horses 1.5%
Goats 0.3%
U.S. Ammonia Emission Estimates (2002)
Total emissions: ~4 million tons/yr
Source: U.S. EPA 2002 National Emissions Inventory
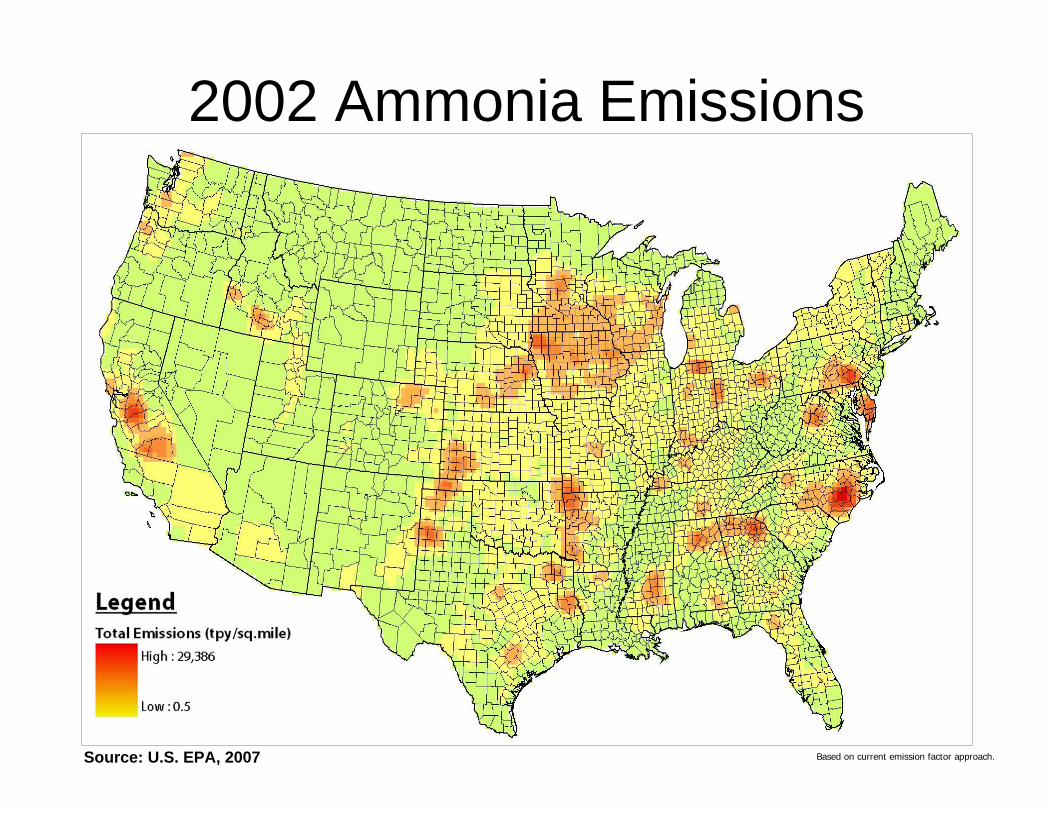
2002 Ammonia Emissions
Based on current emission factor approach.Source: U.S. EPA, 2007
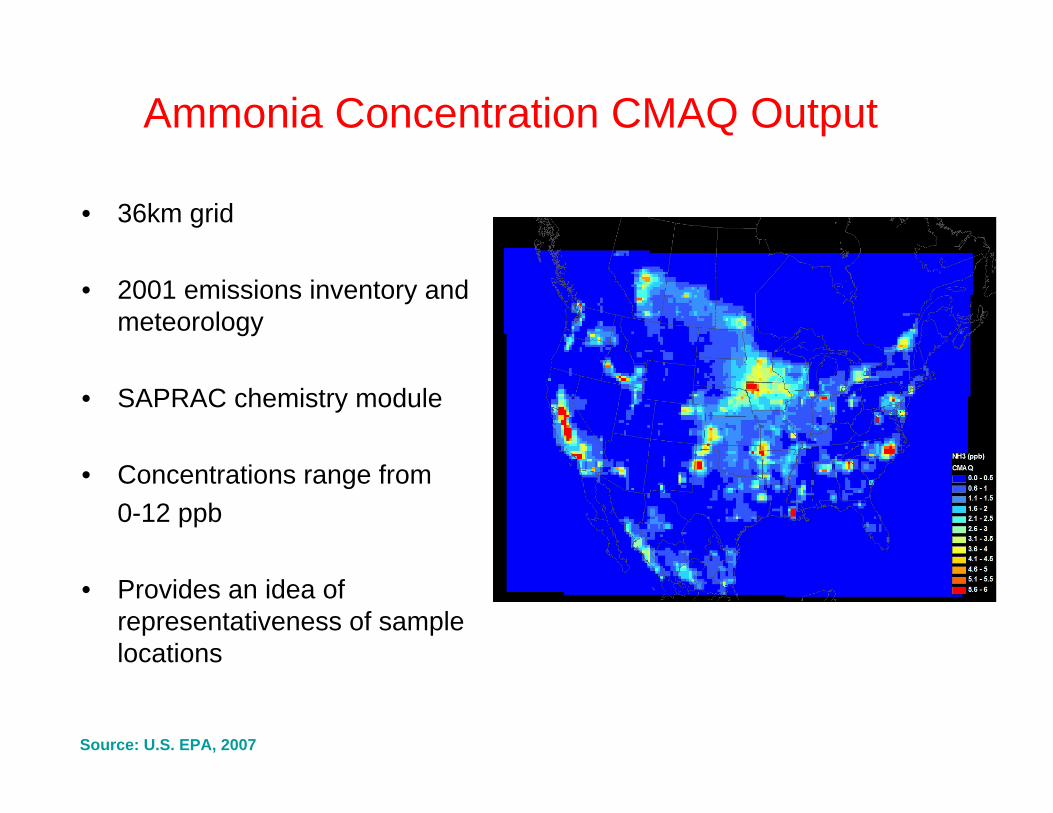
Ammonia Concentration CMAQ Output
• 36km grid
• 2001 emissions inventory and meteorology
• SAPRAC chemistry module
• Concentrations range from0-12 ppb
• Provides an idea of representativeness of sample locations
Source: U.S. EPA, 2007

Source: Gilliland et al., Atmos. Environ., 2006
Seasonal NH3 Emissions: Inverse Model EstimationComparison of model (CMAQ) and measured NH4
+ wet deposition

2003 20042002
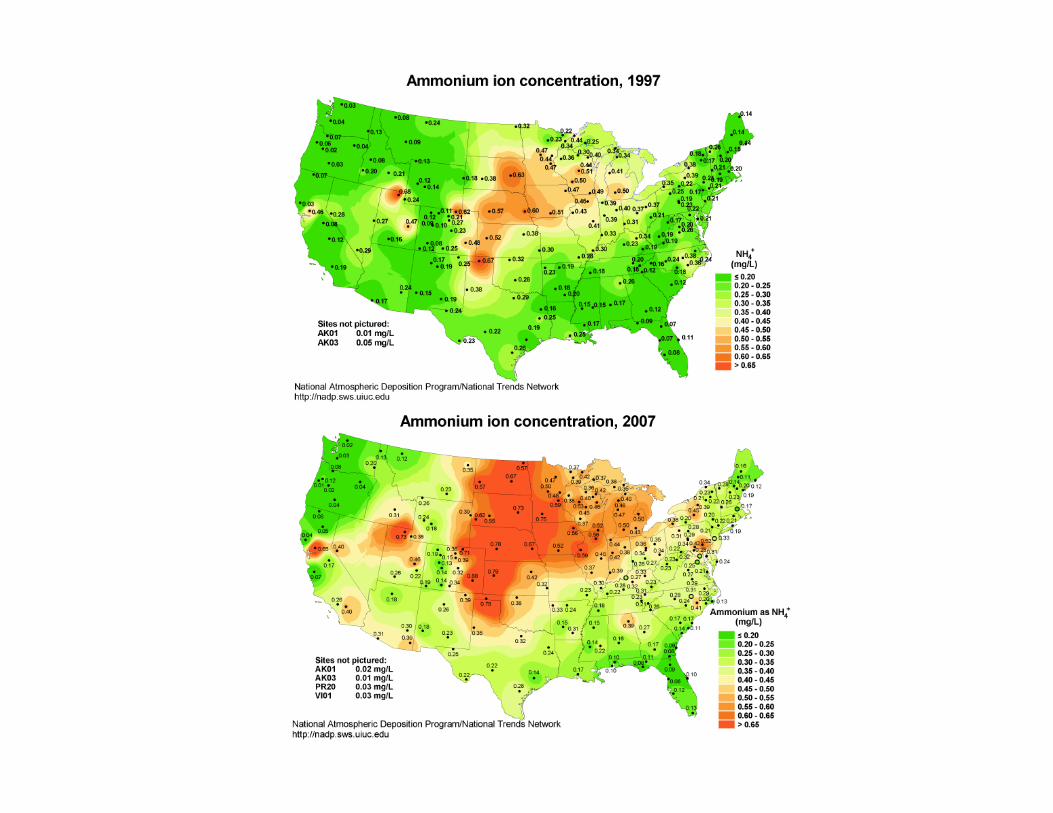
NADP Ammonium Ion Wet Deposition
CMAQ Ammonium Ion Wet Deposition
CMAQ is able tocapture main spatial pattern and magnitudeof wet deposition
Courtesy: R. Dennis/R. Mathur (EPA)

Commercial Hog Farm in North Carolina, USSampling Sites


0
1000
2000
3000
4000
0:00 6:00 12:00 18:00 0:00
Time of Day
NH
3 -N
Flu
x ( μ
g m
-2 m
in-1
)
Observed Modeled
Measurements Compared with NH3 MTCR Model
October 31, 2004
NH3 flux from a swine waste lagoon system: Fall 2004
R2 = 0.41
1000
1500
2000
2500
3000
3500
1000 1500 2000 2500 3000 3500
MTCR Modeled NH3 Flux
Mea
sure
d N
H3 F
lux

Satellite Remote Sensing for Ammonia and Particulate Matter

Ammonia Emission Projections
0
100
200
300
400
500
600
700
800
900
1,000
2000 2005 2010 2015 2020 2025 2030
Year
NH
3Em
issi
on
s (t
ho
usa
nd
to
ns/
yr)
Beef Cattle
Dairy Cattle
Poultry
Swine
Based on current emission factor approach.Source: U.S. EPA, 2007

Cattle
• Addition of Alum or Zeolite to slurry to stop volatilization
Alum Reduction2.5% 58 ± 6%6.25% 57 ± 10%
Zeolite Reduction2.5% 22 ± 6%6.25% 47 ± 10%
• Acidifying liquid cow manure with lactic or nitric acid
pH Lowered emissions by
5.73 65 %5.14 72 %4.18 88 %
Lactic Acid
pH Lowered emissions by
5.20 29 %4.49 49 %
Nitric Acid

Swine• Manure additives
– 24% reduction• Biotrickling filters (Hansen, 2006)
– Reduce odor• Winter – 54%• Summer – 28%
– Reduce ammonia• Storage spreading system with biological
treatment of manure (Loyon, 2006)– Reduced NH3
• 30-50% with separated manure• 68% with unseparated manure

Nitrification
Denitrification
Module
Phosphorus
Removal
Module
EffluentEffluent
CalciumCalcium
PhosphatePhosphate
Solid-liquid
Separation
Module
Separated Separated SolidsSolids
The Process
Super Soil SystemsNorth Carolina’s
Swine Waste Treatment Solution
Reuse

Summary and Conclusions
• Emission factors approach– Easy to use, but results may have uncertainty
• Process based and inverse modeling approach– Complex but results have less uncertainty
• Remote sensing approach– Emerging area of gaseous and PM emission analysis
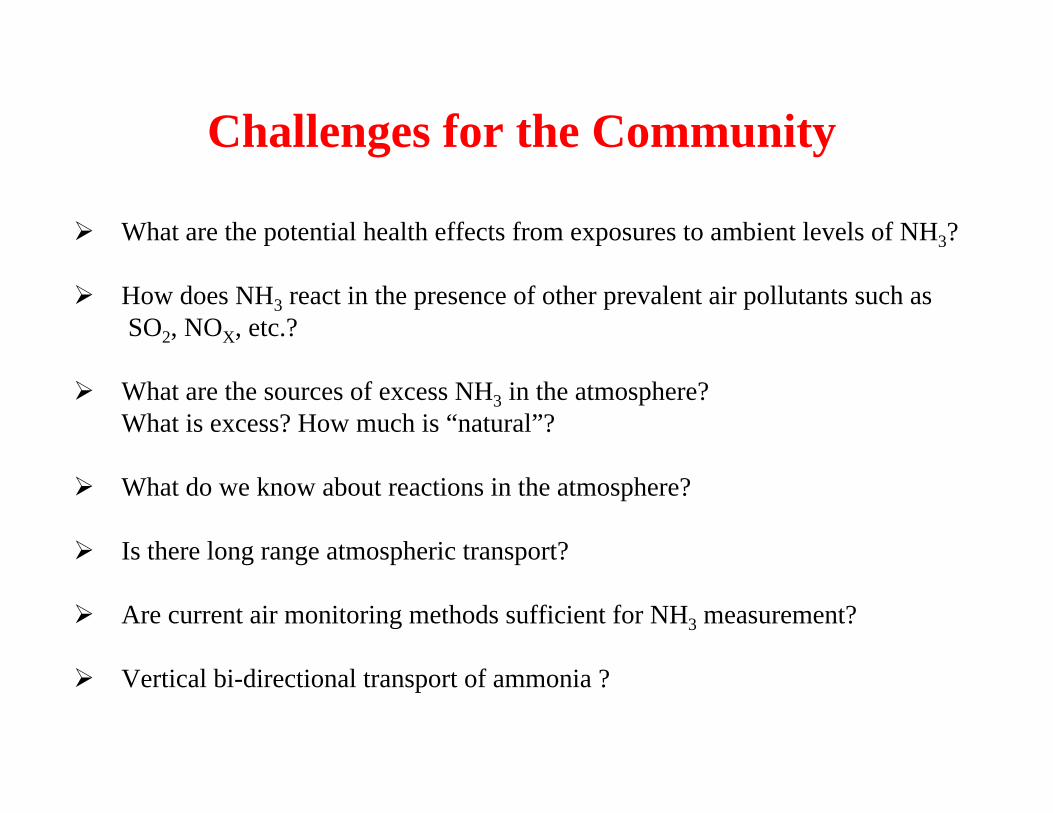
Challenges for the Community
What are the potential health effects from exposures to ambient levels of NH3?
How does NH3 react in the presence of other prevalent air pollutants such asSO2, NOX, etc.?
What are the sources of excess NH3 in the atmosphere? What is excess? How much is “natural”?
What do we know about reactions in the atmosphere?
Is there long range atmospheric transport?
Are current air monitoring methods sufficient for NH3 measurement?
Vertical bi-directional transport of ammonia ?

Are current air quality modeling techniques sufficient for analyzing the N cycle, including NH3?
Is it prudent to regulate NH3 and NOX or should we focus on the total N cycle?
How do we optimize and evaluate the impacts of reductions of the various forms of N and of other air pollutants?
Are control technologies for agricultural sources available? Are they feasible?
What are the proven methods (BMPs) and their associated costs for reducing NH3from agricultural sources?
Need for a network to monitor emissions from agricultural sources.
Challenges for the Community
• U.S. Department Of Agriculture – National Research Initiative,Contract No. 2004-35112-14253
• Phosphate Potash Institute, The Fertilizer Institute
• The National Science Foundation
• The Kenan Institute
• North Carolina Division of Air Quality, Contract No. EA 01001, and EA 8001
• Animal and Poultry Waste Management Center / Smithfield Foods
• Water Resource Research Institiute, Contract No. EA 7003
• Ms. Megan Gore
Acknowledgements

Quantifying Emissions of Ammonia For Air Quality Analysis
Viney P. AnejaDepartment of Marine, Earth, and Atmospheric Sciences
North Carolina State UniversityRaleigh, NC 27695-8208, U.S.A.
2009 Science Meeting "Total Reactive Nitrogen: Regional Haze Impacts and Mitigation Options”July 28-29, 2009Baltimore, MD

National Hog Farming Trends
States with most hogs
1992 2005Hog Population
58.2 million 61.3 million
Animals in Facilities > 2000 Head29% 79%
Changes in Production Facilities
0
5
10
15
20
1985 1990 1995 2000 2005
Year
Num
ber
of H
ogs
(Mill
ions
)
Iowa North Carolina Minnesota Illinois

Annual Average NH3 Emissions (2001)US EPA Emission Factor Based Inventory