quantifying cost benefit of wa lking and cycling...
TRANSCRIPT

QUANTIFYING COST BENEFIT OF WALKING AND CYCLING FACILITIES IMPROVEMENT; A PRELIMINARY STUDY FOR METHODOLOGY AND
APPLICATION IN JAKARTA
Muhammad Zulkifli,** Yasuo Hino*** and Indra Tjahjani****
1. Introduction
The number of Motorized vehicles in Jakarta has been
increasing very significantly as shown in Figure1. From 1985 to
2002, car ownership increased approximately three times and
motorcycle ownership three and a half times1). During the Asian
Economic Crisis period, the number of registrations especially for
motorcycles suddenly dropped. However, since 2001, with the
recovery of economic conditions, vehicle registration has
resumed its increasing trend. This phenomena is different in case
of Non Motorized Transport (NMT). NMT in here may include
walking, cycling and some types of paratransit. Study of
SITRAMP 2001 indicates that NMT decreased from 60%
(1970s) to 28.8 %. 2).
Figure 1: Number of motor vehicles in Jakarta, 2006
NMT role is crucial for livability of cities. It is the main
mode in connected with public transportation for the lower
income people. It has a very significant poverty impact. However,
during the period of motorization in Jakarta, there have been no
studies and policies that acknowledged the existence of NMT as a
part of the transportation system in Jakarta. Because the lack of
information concerning potential usage of NMT, no
transportation studies has recommended facilitating the use of
these modes3).
The trend of NMT decreasing above indicates the
transportation policy has limited attention to support NMT modes.
The principal investment has been made to support motor
vehicles development. NMT are seldom included in major urban
transportation planning. Subsidies are often only for expensive
infrastructure projects and NMT is often overlooked due to a lack
of powerful stakeholders.
2. Purpose and Framework
2.1. Purpose
Although NMT improvements do not usually rank as the
most cost effective way to overcome Jakarta’s transportation
problem, they tend to provide many benefits for transportation,
environment and community. However, conventional planning
tends to undercount and undervalue these modes. Discussion on
benefit of NMT is limited to the reduction of congestion only.
From this perspective, NMT may have a minor role to play in
overall transport system4).
Experiences with the Cost Benefit Analysis (CBA) of
NMT improvements on several indicators in Jakarta are rather
limited. In here, it is needed more comprehensive analysis to
recognizes and quantify the benefit of NMT on all modes and can
therefore identify one of optimal solution against transportation
problems in Jakarta.
The objective of this study is to evaluate and quantify cost
and benefit of walking cycling facilities development if they are
improved in Jakarta. The study will not only provide several
approaches to evaluate the benefits of improvement, but also
answer the hypothesis that investment on NMT development is
one of most cost effective and valuable measures on existing
situation of Jakarta.
2.2. Framework of Evaluation
Several methods using Contingent Valuation Methods
(CVM) such as Willingness To Pay (WTP), Willingness to Use
and other assumptions will be improved as methodology. This
study will explain how these methods will be applied for
quantifying the benefit of NMT in Jakarta. The analysis will be
done with evaluating reliable indicators and standards for Jakarta.
The evaluation will be carried out in five stages as shown in
Figure 2. At first stage, we will start by determining location of
pilot project for facility’s improvement. After then, we will
estimate the cost of project based on type and key characteristics
of it. In third stage, we will estimate demand for facility usage
and the change obtained by the project. In fourth stage, we
Motorcycle Cars Trucks Buses
_________________________________________________________ *Key Words : Jakarta, Walking, Cycling, Facilities, Cost Benefit Analysis. ** Reguler Member of JSCE, M.Eng., Faculty of Engineering, Osaka City University (Sugimoto3-3-138,Sumiyoshi-ku,Osaka,Japan,TEL.06-6605-2731, FAX .06-6605-3077). *** Reguler Member of JSCE, Dr.Eng.,Faculty of Engineering, Osaka City University. **** Non Member, M.T., Faculty of Engineering, Pancasila University Jakarta
evaluate how project will impact the overall mobility on location
and surrounding area. And as final stage, the benefit for facility
improvements will be valued.
Figure 2: Framework of evaluation
However, this study is, as a preliminary step, designed to
propose and discuss methodology that will be applied on
further steps of research. Then, the proposed methodology will
evaluate and recommend ways to CBA estimating for NMT
development facilities in Jakarta.
3. Discussion on methodology of research
3.1. Location of pilot project
A pedestrian mall project has been under construction since
2007 on Kota tua area, Central Jakarta as shown in Figure 3.
The project also included the restoration of areas along the Besar
River. If the project is completed, the speed of vehicles entering
pedestrian area will be restricted under the 30 kilometer per hour.
Figure 3: Pedestrian Mall Kota Area
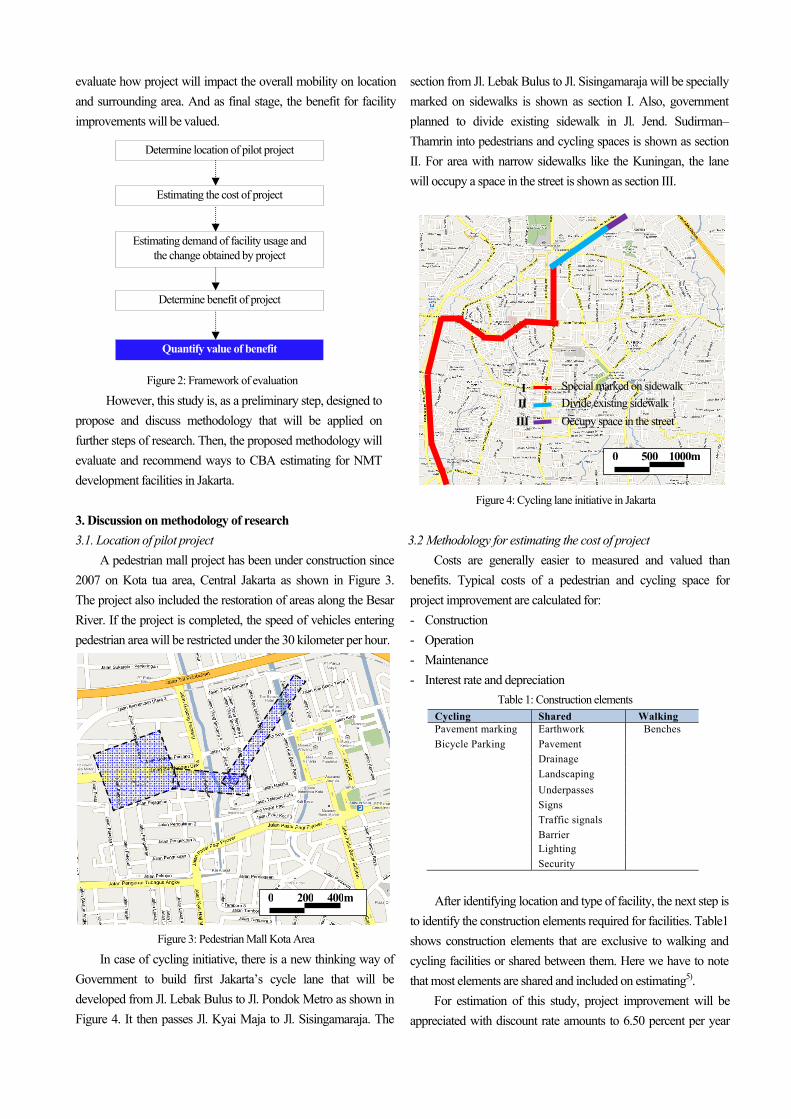
In case of cycling initiative, there is a new thinking way of
Government to build first Jakarta’s cycle lane that will be
developed from Jl. Lebak Bulus to Jl. Pondok Metro as shown in
Figure 4. It then passes Jl. Kyai Maja to Jl. Sisingamaraja. The
section from Jl. Lebak Bulus to Jl. Sisingamaraja will be specially
marked on sidewalks is shown as section I. Also, government
planned to divide existing sidewalk in Jl. Jend. Sudirman–
Thamrin into pedestrians and cycling spaces is shown as section
II. For area with narrow sidewalks like the Kuningan, the lane
will occupy a space in the street is shown as section III.
Figure 4: Cycling lane initiative in Jakarta
3.2 Methodology for estimating the cost of project
Costs are generally easier to measured and valued than
benefits. Typical costs of a pedestrian and cycling space for
project improvement are calculated for:
- Construction
- Operation
- Maintenance
- Interest rate and depreciation
Table 1: Construction elements Cycling Shared Walking Pavement marking Earthwork Benches
Bicycle Parking Pavement
Drainage
Landscaping
Underpasses
Signs
Traffic signals
Barrier Lighting
Security
After identifying location and type of facility, the next step is
to identify the construction elements required for facilities. Table1
shows construction elements that are exclusive to walking and
cycling facilities or shared between them. Here we have to note
that most elements are shared and included on estimating5).
For estimation of this study, project improvement will be
appreciated with discount rate amounts to 6.50 percent per year
Determine location of pilot project
Estimating the cost of project
Estimating demand of facility usage and the change obtained by project
Determine benefit of project
Quantify value of benefit
500 1000m0
200 400m0
Special marked on sidewalk
Divide existing sidewalk
Occupy space in the street
III
III

for 10 years, based on decisions by the Central Bank of Republic
of Indonesia.
3.3. Methodology for estimating demand by project
implementation.
For this study, demand estimating will be based on two
different calculations: estimating the total number of pedestrians
and cyclists in current condition, and estimating the number of
additional pedestrians and cyclists after project implementation6).
The data will come from a standardized questionnaire
survey that will be conducted on August 2010 in Jakarta. A quota
sample (residential area, age, gender, education level) will be
considered. Three different demand scenarios will be estimated :
(1) a change in the number and/or share of trips using walking
and cycling ; (2) a change in the number and/or share of trip
kilometers by pedestrians and cyclist; and (3) a change in the
amount of time spent for walking and cycling.
Using a questionnaire, this study also ask respondents
about their trips such as purpose, distance, duration, etc for
additional reference. Demand will be estimated from the
following question:“If facilities are improved, how
significantly influence your willingness to walk and use bicycle
more than currently?”
Table 2: Benefits of improvement for walking and cycling facilities
3.4. Benefit of project
The impact of improvement is consist of qualitative and
quantitative issues. Qualitative impacts are enjoyment, security,
safety, etc. Quantitative impacts are health, air pollution,etc7).
Some impacts are measurable and other impacts can be
particularly hard to value, but are not less than the others. In this
study, we consider benefits can be realized by improvement of
walking and cycling facilities as shown in Table2.
3.5. Methodology to Quantify the Benefits of Health, Safety
and Air pollution.
This study will quantify benefits of facility improvements in
Table 2 above. However, in this section, we try to discuss
methods how some kinds of benefits will be quantified and
valued. Of course, as actual benefits will vary according to
specific conditions, so these values should be adjusted
appropriately to reflect a general situation in Jakarta.
The valuing benefit will be discussed as follows:
1. Improvements in health by regular physical activity of new
cyclists (quantification of impacts is based on costs of risk illness),
2. Improvement in safety (based on accident costs),
3. Changes in atmospheric pollution (based on effect of air
pollution reduction).
3.5.1. Benefit of Health
There is overwhelming evidence that physical inactivity
increase the risk of several diseases. On the contrary, it is possible
to reduce mortality risk by increasing the level of physical as
shown in Figure58).
Figure 5: Physical activities and relative mortality risk
This study will estimate the value of health benefit (ΔBh)
based on following Equation1 :
ΔBh = MC2 – MC1 (Rp/Year)……….(1)
Where, MC2 : After implementation (Rp/Year)
MC1 : Before implementation(Rp/Year)
After this study calculates demand usage for improved
facilities, health benefits will be valued through threes
important steps as shown in Figure6.
Category
benefit Contents
ΔBh Improving Health (Rp/Year)
There is overwhelming evidence that physical inactivity increase the risk of several diseases. Activities for walking and cycling everyday would have a major effect on the prevention of a number of illnesses.
.ΔBa Safety-Accidents (Rp/Year)
Walking and cycling with safe facilities will reduce the number of traffic accidents involving pedestrians and cyclist and vehicles driver.
ΔBcc Vehicle Cost (Rp/Year)
Walking and cycling is not only a cheap mode of transport for society, the mode individual users can save money through such use.
ΔBpc Parking Cost Saving (Rp/Year)
Reduced automobile trips may simply result in unoccupied parking spaces. Space can be rent, sold or converted to other functions.
ΔBsc Security and Enjoyment (Rp/Year)
Many people enjoy walking and cycling, as indicated by their popularity as recreational activities. Walking and cycling is the most popular form of physical recreational activities. Improvement of walking and cycling conditions (such as sidewalks security improvement, lighting, etc.) can provide benefits for user enjoyment.
ΔBec Pollution(Rp/Year)
A clean and quiet means of walking and cycling can help to reduce urban air pollution and noise nuisance.

Figure 6: Major Steps for valuing health benefit
Discussions are still ongoing as for which types of
diseases can be reduced by physical activity and how
significant should be the effect of its. Table3 summarizes the
findings of Europe and WHO standards.
Table 3: Disease risk reduction by moderate exercise (%).
The next question is Value of Statistical Life (VSL) for
Jakarta. VSL is an economic value assigned to life in general,
commonly determined by looking at a person's WTP. In this
study, value of VSL for Jakarta’s standard will be identified by
asking respondents how much they would be willing to pay for
good health outcomes.
3.5.2. Benefit of Safety-Accidents
WTP and Gross Output are the two methods, which are
usually used to quantify the value of safety. Based on WTP
method, respondents will be asked to answer questions as
follows: How much are you willing to pay for reducing a
accidents probability risk. And, Gross Output is the method for
calculating accident cost by analyzing the casualty cost. The
casualty cost is divided into two components, Direct and
Indirect Cost 9).
Direct Cost in this study encompasses some items which
are: cost at accident, hospital cost, patient treatment,
psychotherapy, and other cost. And, Indirect costs are divided
into two components. First, loss of productivity, incurred in
respect of the loss of productive working time for casualties as
a result of the accident. Estimating will be done by using the
loss of casualties working time multiplied by their income or
wages. And Second, loss of quality of life is the cost covering
pain, grief and suffering as a result of the accident that could
reduce the quality of life.
The developing country including Indonesia has been
using Gross Output for valuing cost of safety. However many
studies conclude that Gross Output is inappropriate for
calculating human cost of non- fatal accident. On the other
hand, WTP is appropriate to value non fatal accident but tends
to give the ‘insensitive’ to risk reduction. Therefore, this study
tries to value the cost of safety by combination of Gross Output
and WTP method based on data collection and questionnaire
survey as shown in Figure7.
Figure 7: Major steps valuing safety benefit
We will estimate value of safety benefit (ΔBa) based on
following Equation210).
ΔBa = Cac × α × ΔTcar (Rp/Year)…….(2)
Where, Cac : Cost for accidents ( Rp/ Year)
α : Probability of accident risk by using car (Case/min)
ΔT : Change of trips (Min/Year)
3.5.3. Benefit of air pollution reduction
Emission from motor vehicles causes significant damage
to environment and human health. People who are exposed to
high levels of emissions may suffer from respiratory disease,
lung damage, or even cancer11).
In this study, analyses of emissions will focus on the
effects of air pollution on human health and they typically will
consider the types of emissions such as: Carbon monoxide
(CO), Nitrogen oxides (NOx), Sulfur oxides (SOX), (VOC)
and Fine particulates (PM10).
The basic equation for estimating benefit of air pollution
reduction (Δ Bec) is shown in Equation3 :
Δ Bec = Δec×α×P×Ev (Rp/Year)…….(3)
Where, Δec : Change in emission concentration
α : Exposure Response Cofficient by each emission.
P : Population at risk
Ev : Unit Economic value.
Disease Denmark 2003
WHO2003
Swiss 2001
Practicable Standard
Hypertension 32 30
Cardiovascular disorders
40 33 46 40
Diabetes >20 47 40
Osteoporosis 50 50 50
Breast cancer 50 20-25
28 40 Colon cancer 50 47 40
Gallstone 34 -
Depression 68 -
Back pain 26 -
Estimate reduction of pedestrians, cyclists and driver accidents based on project improvements
Valuing Cost for accidents
Quantify value of benefits
Gross Output Methods for fatal accidents
WTP Methods for non fatal accidents
Determine reduction of illness risk by physical activities
Estimate value of reduction of risk on Value of Statistical Life
Quantify value of benefits

The process of this evaluation consists of three important
steps as shown in Figure8.
Figure 8: Major steps for valuing air pollution reduction benefit
The next question is what methods can be applied to
determine the economic value per unit of pollution. In this
study, the combination methods of WTP and Cost of illness
(COI) will be used.
As this study explained above, in WTP method,
respondents will be required to answer questions on how much
they are willing to pay for reducing occurrence of disease
(morbidity) and the risk of death (mortality). And, Cost of
illness (COI) is the method to measure all costs associated with
a particular disease or condition including medical costs,
hospitalization and loss of wages due to illness. The basic
estimating data of this method will come from hospital and
health insurance company.
4. Conclusion and Next Steps
This study is located as a preliminary step to discuss the
framework of methodology, in order to evaluate cost and
benefit of waking cycling facilities improvement in Jakarta.
Some benefits are measurable and other benefits are hard to
valued, but we know that their impacts are significant.
Therefore, further qualitative study for quantifying value of
these benefits will become the next proposal for this research.
However, the reason for inclusion the theme of CBA is to
show an example of how beneficial NMT can be obtained
from several view points. Although improvement
infrastructure for motorized transport is important, existing
walking and cycling facilities in Jakarta also have extremely
beneficial to be developed as well as the improvement of
public transports. Executing CBA of walking and cycling will
show the hidden benefits of NMT, thereby decision maker can
put development of these modes as priority on the decision
agenda.
Relatively few researches have been conducted on this
field in Jakarta. Therefore, as a particular objective, this study
will help the government, municipal and decision maker to
know the significance role of NMT for the future.
References
1)Y.O.Susilo and Tri Basuki : A Reflection of Motorization
and Public Transport in Jakarta, IATSS Vol.31/2007.
2)BPS Jakarta (Jakarta City Statistical Bureau) (2006)
http://bps.jakarta.go.id.
3) A. Rahmah : Bicycle Initiative in Jakarta, Proceedings of the
EASTS, Vol.6, 2007
4)T. Litman: Quantifying the Benefits of Non Motorized
Transportation For Achieving Mobility Management
Objectives, Victoria Transport Policy Institute,2010.
5)T.Litman: Whose Roads? Evaluating Bicyclists’ and
Pedestrians’ Right to Use Public Roadways, VTPI
(www.vtpi.org); at www.vtpi.org/whoserd.pdf.
6)H. Foltynova and B.Kohlova, Cost Benefit Analysis of
Cycling Infrastructure: A case study of Pilsen, Charles
University Environment Centre Prague, 2006
7)T.Litman, Transportation Cost and Benefit Analysis, 2009,
VTPI (www.vtpi.org).
8)C. Ege and T. Krag : Cycling will Improve Environment and
Health, Thomas Krag Mobility Advice,2006
9)Ostro Bart: Estimating the Health and Economic Effects of
Particulate Matter in Jakarta: A Preliminary Assessment,
Fourth Annual Meeting of the International Society for
Environmental, 2006.
10)Japan Committee of Mobility Management (JCOMM):
Guidelines for Evaluation Mobility Management, 2008.
11)Public Health Monitoring of the Metro Manila Air Quality
Improvement Sector Development Program; Economic
impact of air pollution–related health effects, , Main
Report,2004.
Choose an appropriate money economic value Per unit of pollution
Estimate reduction of emission concentration based on changes in length km , time and trips
for motor vehicles
Quantify value of benefits