investigating travelers’ stated mode choice preferences...
TRANSCRIPT

1
Investigating Travelers’ Stated Mode Choice Preferences under the Influences of Various Mode Availability Options in
BRT System in Surabaya City
ABM Sertajur RAHMAN1, Akimasa FUJIWARA
2, Junyi ZHANG
3, Sudarmanto Budi
NUGHORO4, Togar Arifin SILABAN
5
1 Post Graduate Student, Graduate School for International Development and Cooperation, Hiroshima University,
(1-5-1 Higashi Hiroshima, Japan, )
E-mail:[email protected]
2 Professor, Graduate School for International Development and Cooperation, Hiroshima University,
(1-5-1 Higashi Hiroshima, Japan, )
E-mail: [email protected]
3Associate Professor,Graduate School for International Development and Cooperation, Hiroshima University,
( 1-5-1 Higashi Hiroshima, Japan,)
E-mail: [email protected]
4 Assistant Professor,Graduate School for International Development and Cooperation, Hiroshima University,
(1-5-1 Higashi Hiroshima, Japan.)
E-mail: [email protected]
5Chief, Urban Environmental Agency, Surabaya City
(Jalan Jimerto 25-27,Surabaya 60272, Indonesia,)
E-mail: [email protected]
Abstract: This study investigates commuters’ mode choice behavior for work trips in respect to
individual characteristics, socio economic variables, mode attributes, mode availability, vehicle
ownership etc. Mode choice models of multinomial logit type have widely been developed based on
stated preference survey considering some future hypothetical scenario where access mode, main mode
and egress mode availability differs from one trip makers to another. A model proposed in this study
analyzes using data from the Surabaya City. The analysis implies that important deterministic variables
for the individuals travel decision include household monthly income, job status, and main mode
preference. This study reveals commuters’ hidden preferences for modes that are not in existence, in
particular the Bus Rapid Transit System in the Surabaya City due to be fully implemented in 2012. The
developed models were then used to express complex travel behavior and forecasting travel demand for
new transport services by simulation analysis. Finally, changes in mode choice probabilities under
various mode availability options were determined under Bus Rapid Transit system.
Keywords: Stated preference survey, Mode availability, Bus Rapid Transit, Mode Choice Probability

2
1. INTRODUCTION:
Cities around the world are grappling with the
many consequences of rising motorization and
traffic congestion. In particular, the whole urban
transportation systems in developing cities are
changing rapidly due to economic development.
The negative externalities such as lost time and
productivity, vehicular accidents, greenhouse gas
emissions and associated health hazards has been
caused much more prompt and serious than the
adjustments of residents’ behavior and attitude.
To curb personal motor vehicle activity and its
impacts on Environment it is very important that
public transit service is maintained and enhanced in
developing cities. Many transportation measures
exist that could lead to significant improvements in
commuters’ exposure by reducing both in-vehicle
air pollution and commuting times. Among these
measures, Bus Rapid Transit (BRT) systems are
being implemented in cities around the world as an
efficient, sustainable, and low-cost alternative to
underground or elevated public transit system. BRT
systems provide a more rapid, metro-like service to
commuters by including such features as separated
bus ways, high capacity vehicles, and fixed stations
and off bus fare collection. Such improvements to
city’s bus systems can potentially lead to significant
environmental benefits by reducing the number of
vehicles on the road, controlling the number of
high-polluting starts and stops and replacing old
buses with new generation public transport vehicles
with improved technologies (Henry et al 2008).
This paper explores the factors that contribute to
improve the public transportation system based
on an analysis of the operational performance of
BRT in Surabaya City which is not yet existing
but likely to be implemented in near future.
2. STUDY AREA AND PROPOSED BUS
RAPID TRANSIT SYSTEM:
Surabaya City has been selected as study area
(figure 1). Surabaya, the capital of east Java
province is the second largest city in Indonesia.
Surabaya is a tropical city and located at coastal and
lowland area. The altitude varies from 3 to 10 m
above sea level. Population of Surabaya (In 2008)
was approximately 3 million in 2900.443 square km
of area having a population density of 8394 per
sqkm. The city is divided into 31 Districts and 163
sub districts (Anwar et al, 2010).
Table 1 Year wise number of vehicles in Surabaya City
Types of vehicles 2005 (unit) 2006
(unit)
2007
(unit)
Motorcycle 883838 928686 972645
Private Car 217428 228195 232888
Pickup 82116 84371 86671
Public Bus 1353 1077 804
Angkot 13878 12010 9822
Source: Transportation Department of Surabaya, 2009
While current urban bus transit takes an important
role to meet rapidly growing mass mobility needs,
and curbing personal motor vehicle activity and its
impacts at low cost, the state of Surabaya’s urban
bus transport systems unfortunately leaves much to
be desired, in terms of outcomes for users. The
city’s transport sector has been adversely affected
by the rapid urbanization and the economic
development of the country.

3
Surabaya city has relied predominantly on
motorcycle and private vehicles for years. On the
other hand public bus transit service is inadequate
and decreasing day by day (Table 1). This rapid
growth of motor vehicle activity in Surabaya city
has brought in its wake a range of adverse impacts.
Traffic congestion is increasing rapidly, causing
significant time and productivity losses. Air quality
has been poor in these centers since the late 1990s.
Surveys have shown daily average suspended
particulate levels, which are strongly correlated
with respiratory and cardiovascular diseases,
exceeding World Health Organization (WHO)
guideline limits almost daily in Surabaya. Moreover,
Surabaya’s road accident record, already a concern,
is deteriorating steadily, with the average death toll
of two persons per day. (Police Department,
Surabaya).
In Surabaya, from 2009 it has been decided by the
city authority to celebrate “car free day” on Sunday
and the time duration of celebration is from 6 AM
to 10 AM. One important street (Raya Darmo
Street) has been designated for car free day program
and during this particular time no car or motorcycle
is allowed to move through this street. Even, other
motorized vehicles like city bus, angkot (public
transport) etc are not allowed to go through this
road. Beside road block for motorized vehicles, the
celebration also consists of some other components
like local ambient air quality monitoring and air
quality improvement campaign etc.
Use of plastic bags in Surabaya has been enormous
which cause thousands of marine animal deaths
every year and manufacture of plastic bags adds
tones of carbon emissions into the air annually. To
make more and more people around the city
becoming aware of the environmental issues
surrounding plastic bags, Surabaya City authority
also launch “No plastic bag campaign” on regular
Fig. 1 Study Area and proposed BRT Network

4
basis .Beautiful bags made from cloths and papers
are distributed or sold to the people on various
occasions (also in car free day) by different
non-government organizations (NGO) who
describes the adverse effect of using plastic bags
and encourages people to avoid it.
There had been several such efforts for
environmental management in Surabaya City like
the soft policies stated above and the recent effort is
reduction of emission from vehicular emission. A
particularly important measure that combats many
of the impacts of traffic is the provision of rapid
and efficient public transport networks as an
alternative to private cars. BRT systems have been
identified as an inexpensive, efficient and
increasingly popular public transportation option.
Considering this fact, Surabaya City Government
has decided to implement BRT in Surabaya in
several phases.
Surabaya Transportation Department expect the
total capacity of BRT to carry 3868
person/hour/way in the peak period and 1627
person/hour/way in the off-peak period respectively.
The capacity is 85 persons per bus. In the first
phase the BRT line will be implemented in the
North South Direction and will gradually extend the
route in West-East direction in the second phase as
can be seen in fig 1. In order to maintain a good
level of service 54 bus unit is planned to operate in
a departure length of 19.8 km and return length of
20.9 km. Estimated travel time will be 39.6 minutes
and 41.2 minutes for departure and return. Headway
in the peak period is 1.31 minute and 3.14 minute in
the off-peak period. Fare for BRT has been decided
to keep fixed for travelling any distance and it will
be in between Rp 2500 and Rp 3500.
3. BACKGROUND:
As the people in Surabaya City have not
experienced the proposed BRT, it is impossible to
use only observed/recorded diary data about actual
travel behavior to represent people’s future
preferences. It is necessary to examine the
feasibility of SP approach. On the other hand, this
paper focuses on analyzing the influence of the
individual-specific context coming from changes in
availability of different transport mode on mode
choice behavior, while also incorporating the
influence of the alternative-specific context coming
from changes in level-of-service variables. Yet, it
should be kept in mind that there might be some
behavioral differences while conducting home
based trips and non-home based trips. Here, the
home based trips are dealt with, and non-home
based trip is left as a future research issue.
This study investigates complex travel behavior
after the introduction of BRT system. Besides, the
system is not familiar to the public; socio-economic
conditions will dramatically grow in future and the
existing various kinds of paratransit should be used
alternatively as access mode in Surabaya. Moreover,
the local government trusts the changes in the
public attitude as an effect of the above-mentioned
soft policies (i.e. car free day and no plastic
campaigns). To argue such a dramatic change in the
society, a stated preference survey has been applied
in this study.
The SP approach, originating in the mathematical
psychology, has been widely used in transportation
because it can measure how people choose
not-yet-existing travel modes or how people take
actions in case of introducing new policies (e.g.,
road pricing, introduction of new/intelligent

5
transport systems). This approach examines the
individual response to a series of experimentally
designed choice alternatives, which are typically
described in terms of combinations of attributes
with several predefined levels. In addition to the
ability to directly measure the demand/response
under not-yet-existing conditions, the SP approach
has other advantages over the RP approach, which
is based on the observed choice in real situations.
These advantages include the ability to control
statistical problems such as multicollinearity and
lack of variance in explanatory variables, the
increased possibility of including subjective or
qualitative factors as explanatory variables and
cost-efficiency to develop models from a relatively
small size of samples.
In recent years, there are some limited applications
of the related SP applications in developing
countries. Fillione et al. (2007) developed ordinal
and nested logit models in the context of transport
mode choice models in Metro Manilla based on a
questionnaire survey to determine what type and
characteristics of modes are used by the individual
and what modes were considered in his/her reduced
choice set. Thein et al. (2010) made an effort to
capture travelers’ stated mode choice preferences
under the influence of income levels in Yangon city,
Myanmar. Bhattacharjee et al. (1997) developed a
model based on stated preference survey to assess
commuters’ attitudes towards travel demand
management in Bangkok. Ortuzaret al. (2000)
studied on demand estimation for a cycle-way
network in Chile. Dissanayake and Morikawa
(2010) did transport policy analysis for developing
countries using a nested logit model of vehicle
usage, mode choice and trip chain case study in
Bangkok metropolitan region. Sjafruddin et al.
(2010) conducted demand rate and elasticity of the
urban taxi service based on the stated preference
data case study in Bandung, Indonesia. Furthermore,
Park et al. (2003) made a feasibility study on the
new transit system implementation to the congested
area in Seoul. It is obvious that the SP applications
are getting popular in many developing cities.
In many previous studies in developing countries, it
has been assumed that all the alternatives (including
both access/egress and line haul modes) are
available to all individuals. On contrary, this paper
assumes that not all the modes are necessary
available to all the commuters which have been
reflected in SP design. For Example, in Surabaya
becak is not allowable to operate on some certain
roads results in its non-availability as an access
mode to different users. The city also experienced
Car Free Day (Anwar et al, 2010) where neither car
nor motorcycle is allowed to operate in some major
routes of the city in some specific days resulting
non-availability of cars and motorcycle on some
particular route. Even long distance to the nearest
station or unavailability of some access mode
makes it difficult to avail some certain line haul
modes to some users. Charisma and Annesha
(2010) introduced a probabilistic choice set of
modes to account for the absence of actual mode
choice set data in Dhaka and developed a model to
predict the choice set probabilistically for the
choice context of Dhaka using socio‐economic
characteristics, origin‐destination and trip purpose.
In case of developed countries the network data
provides a reasonable basis for predicting the
choice sets for mode selection. But, in case of
developing countries like Indonesia the transport
network data is not well-structured. Paratransits
(and even in some cases traditional transits like
6
buses) operate beyond their permitted routes which
make it almost impossible to predict the
accessibility of different modes into different zones.
Moreover, in developing countries the affordability
of people plays a vital role in determining the
choice set, both for business and non‐business trips.
The number of users per car is generally very high
and car ownership alone is often not a suitable
proxy for car availability. For instance, if there are
five members and a single car in the household,
some household members may get priority over
others for the car usage (e.g. school going children,
elderly people, etc.) Or, for a same person who is
using car in one day of the week may not be avail
that car in another day for the same purpose. So, it’s
necessary to investigate attitude of the commuters
in response to the availability of different modes in
future.
On the other hand choice of access mode is strongly
dependent on the availability of main mode and
egress mode. This is necessary to determine the
most preferred combinations of access and egress
mode with the main mode for efficiently manage
the future Demand.
4. DATA COLLECTION
(1) Stated Preference Survey in Surabaya City:
The new consideration here in this paper is that the
stated preference survey design considered
influence of travel mode availability. In order to
control the number of motorcycles in congested
roads, the scenario has been designed as motorcycle
will not be used in the main roads and can be used
as only access mode of transport which can be
parked near BRT station paying a certain parking
charge and can be used as an access mode.
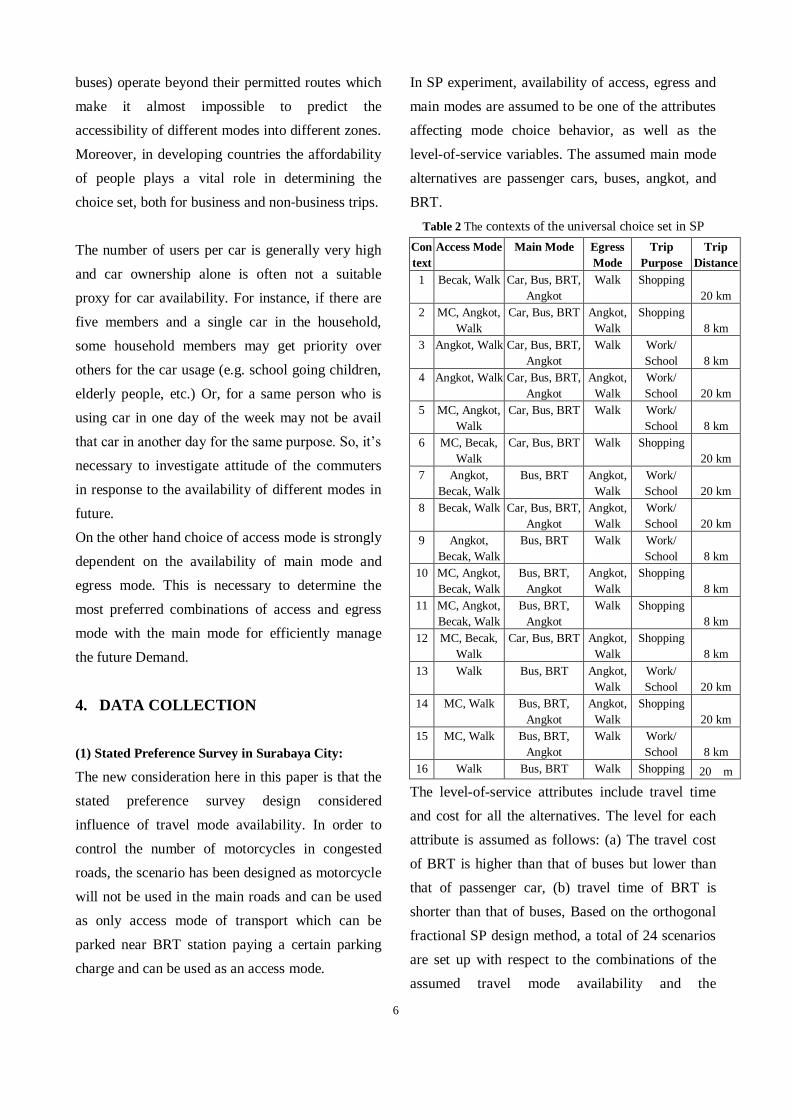
In SP experiment, availability of access, egress and
main modes are assumed to be one of the attributes
affecting mode choice behavior, as well as the
level-of-service variables. The assumed main mode
alternatives are passenger cars, buses, angkot, and
BRT.
Table 2 The contexts of the universal choice set in SP
Con
text
Access Mode Main Mode Egress
Mode
Trip
Purpose
Trip
Distance
1 Becak, Walk Car, Bus, BRT,
Angkot
Walk Shopping
20 km
2 MC, Angkot,
Walk
Car, Bus, BRT Angkot,
Walk
Shopping
8 km
3 Angkot, Walk Car, Bus, BRT,
Angkot
Walk Work/
School 8 km
4 Angkot, Walk Car, Bus, BRT,
Angkot
Angkot,
Walk
Work/
School 20 km
5 MC, Angkot,
Walk
Car, Bus, BRT Walk Work/
School 8 km
6 MC, Becak,
Walk
Car, Bus, BRT Walk Shopping
20 km
7 Angkot,
Becak, Walk
Bus, BRT Angkot,
Walk
Work/
School 20 km
8 Becak, Walk Car, Bus, BRT,
Angkot
Angkot,
Walk
Work/
School 20 km
9 Angkot,
Becak, Walk
Bus, BRT Walk Work/
School 8 km
10 MC, Angkot,
Becak, Walk
Bus, BRT,
Angkot
Angkot,
Walk
Shopping
8 km
11 MC, Angkot,
Becak, Walk
Bus, BRT,
Angkot
Walk Shopping
8 km
12 MC, Becak,
Walk
Car, Bus, BRT Angkot,
Walk
Shopping
8 km
13 Walk Bus, BRT Angkot,
Walk
Work/
School 20 km
14 MC, Walk Bus, BRT,
Angkot
Angkot,
Walk
Shopping
20 km
15 MC, Walk Bus, BRT,
Angkot
Walk Work/
School 8 km
16 Walk Bus, BRT Walk Shopping 20 m
The level-of-service attributes include travel time
and cost for all the alternatives. The level for each
attribute is assumed as follows: (a) The travel cost
of BRT is higher than that of buses but lower than
that of passenger car, (b) travel time of BRT is
shorter than that of buses, Based on the orthogonal
fractional SP design method, a total of 24 scenarios
are set up with respect to the combinations of the
assumed travel mode availability and the

7
level-of-service attributes with two levels. 16
scenarios (16 subsets as described in Table 2) are
based on home based trips and remaining 8 are
about non-home based trips.
In the questionnaire, to reduce respondents’ burden,
the 24 scenarios were grouped into four balanced
blocks. Each respondent received only one block
with six subsets and is asked to choose the most
preferred alternative. From the four predefined
travel modes with respect to various trip purposes,
considering the tradeoffs among the assumed
attributes. In addition to that the respondents are
also asked to report their socio-economic attributes,
trip frequency to the city center, main travel mode,
trip purpose, current level-of-service including
travel time, and access time to and egress time from
the nearest bus stop, railway station, etc.
(2) Survey implementation:
With the cooperation of Environmental Agency of
Surabaya City Government, the SP survey was
conducted to the randomly selected 350 residents in
March 2010. To the best of the authors’ knowledge,
this is the first attempt of an SP survey in Surabaya.
Owing to the cooperation of township officers and
residents’ high interests in the survey, 270 valid
questionnaires were successfully collected with a
high response rate of more than 80% on average.
The survey included commuters including students,
employed, businessmen, and housewives of
different income groups. The survey contents
included commuters’ individual attributes, trip
attributes, and their choices to choose bus, BRT,
private car and angkot. The utility information for
the new traffic mode for the forecasting model was
collected in a stated preference survey.
Fig. 2 Gender of the respondents
Fig. 3 Respondent’s age distribution
Fig. 4 Occupation of the respondents
Male
60%
Female
40%
10-19
11%
20-29
42%30-39
23%
40-49
15%
50-59
11%
Above
59
1%
Governme
nt Service
33%
Company
Service
25%
Un
employed
1%
Self
Employed
4%
Student
29%
House
wife 3% Other 5%

8
Fig. 5 Household income (million Rp)
Less than 1.0
(3%)
1.0 to 2.0 (20%)
2.0 to 3.0 (21%)
3.0 to 4.0 (16%)
4.0 to 5.0 (13%)
5.0 to 6.0 (8%)
6.0 to 7.0 (6%)
More than 7.0 (8%)
No Answer5%
36%
64%
No. of Household
having at
least one car
No. of Household
don’t
have any
car
88%
12%
No. of Household
having at
least one motorcycleNo. of Household
don’t have
any
motorcycle
Fig. 7 Motorcycle Ownership of the respondents
Fig. 7 Car ownership of the respondents
Walking
3%
Motorcycle
60%
Private Car/ Pickup
19%
Angkot
7% Bus
4%
Becak
2%
Bemo
2%
Bicycle
2%
Others
1%
Fig. 8 Modal Share for the first trip of the day of the respondents
Fig. 6 MC ownership of the respondents

9
0% 20% 40% 60% 80% 100%
Fare
Travel time
Punctuality
Convenience
Traffic safety
Security (criminal)
Comfort
Operation frequency
Operation routes
Operation hours
Driver manner
Coverage areas
Travel information
Connectivity
Air pollution caused
Noise caused
Overall service
Very Dissatisfied Dissatisfied
Neutral Satisfied
Very satisfied
0% 20%40%60%80%100%
Fare
Travel time
Punctuality
Convenience
Traffic safety
Security (criminal)
Comfort
Operation frequency
Operation routes
Operation hours
Driver manner
Coverage areas
Travel information
Connectivity to other travel modes
Air pollution caused
Noise caused
Overall service
Very Dissatisfied Dissatisfied
Neutral Satisfied
Very satisfied
Fig.10 Travelers’ Perception about angkot Fig.9 Travelers’ Perception about becak

10
Table 3 Frequency of three most preferred combinations of every context in SP survey
5. Model Structure:
The mode choice by an individual during the
morning home-to-work trip could involve complex
decision making processes which are
context-dependent, where the context can be
classified into individual-specific context,
alternative-specific context and circumstantial
context. The first type refers to individuals’ and
their households’ attributes such as income level,
car ownership, occupation, education level and
residential locations. The second includes the
number of alternatives and their attributes, the
correlation structure of attributes, and the
availability of alternatives. The last refers to
circumstantial factors that are common to decision
makers, such as economic conditions and tax levels
in the purchase of passenger cars. Here in this
model only the first two types of contexts are
considered.
Utility Equation of an individual for choosing a
particular mode k can be expressed as
(Uk)i= (Vk)i+ k)i (1)
Where,
kknk
n
nkmk
m
mkk XXXV
(2)
is a deterministic term of the kth main mode
option with mth mode attributes ( ) and nth
individual characteristics( ) and ω access/main
mode options (Xωk). The deterministic term Vk is
assumed to be a linear-in-parameters specification.
k) is a disturbance component hidden or
unobservable to the modeler.
In this paper, four competitive main modes (i.e. bus,
BRT, angkot and car) have been considered
whether all the modes may or may not be available
in the choice set for any individual i, then the
probability equation for individual i can be written
as
angcarbrtbus
bus
V
ang
V
car
VV
V
eeee
ebus
)Pr(
(3)
kV
mkX
nkX
Context
Mode Choice
Freq (%) Mode Choice
Freq (%) Mode Choice
Freq (%)
1 Walking-BRT-Walking 44% Car 30% Walking-Bus-Walking 14%
2 Car 26% Walking-BRT-Walking 21% Motorcycle-BRT-Walking 11%
3 Walking-BRT-Walking 32% Angkot-BRT-Walking 25% Car 21%
4 Car 29% Walking-BRT-Walking 23% Angkot-BRT-Walking 16%
5 Walking-BRT-Walking 37% Car 17% Motorcycle-BRT-Walking 14%
6 Walking-BRT-Walking 38% Car 26% Motorcycle-BRT-Walking 18%
7 Walking-BRT-Walking 32% Angkot-BRT-Walking 19% Angkot-BRT-Angkot 13%
8 Walking-BRT-Walking 24% Car 23% Walking-BRT-Angkot 17%
9 Walking-BRT-Walking 42% Angkot-BRT-Walking 31% Walking-Bus-Walking 13%
10 Walking-BRT-Walking 25% Walking-BRT-Angkot 15% Motorcycle-BRT-Walking 11%
11 Walking-BRT-Walking 34% Angkot-BRT-Walking 25% Motorcycle-BRT-Walking 15%
12 Car 30% Walking-BRT-Walking 26% Walking-BRT-Angkot 10%
13 Walking-BRT-Walking 55% Walking-Bus-Walking 21% Walking-BRT-Angkot 21%
14 Walking-BRT-Walking 39% Motorcycle-BRT-Walking 25% Walking-Bus-Walking 10%
15 Walking-BRT-Walking 46% Motorcycle-BRT-Walking 32% Walking-Bus-Walking 9%
16 Walking-BRT-Walking 84% Walking-Bus-Walking 16%

11
angcarbrtbus
brt
V
ang
V
car
VV
V
eeee
ebrt
)Pr(
(4)
angcarbrtbus
ang
V
ang
V
car
VV
V
ang
eeee
eang
)Pr(
(5)
angcarbrtbus
car
V
ang
V
car
VV
V
car
eeee
ecar
)Pr(
(6)
Where, ang =1, if angkot is available in the choice
set of individual i, =0, otherwise. car =1, if car is
available in the choice set, =0, otherwise.
Probability of access modes were also estimated
based on the similar types of equation
6. Model Estimation and Discussions
Here, two different mode choice models were
developed; one for main mode choice and another
access mode choice. The utility equations are
expressed in terms of the significant deterministic
variables which include the alternative specific
constant for each mode, alternative specific
socio-economic variables of the traveler and also
some interaction variables like age*gender etc.
The significant deterministic variables for main
mode choice and access mode choice are shown in
table 3 and table 4 respectively.
(1) Choice of main mode
It has been found that age and household income
have strong effects on main mode choice in
Surabaya. The sign indicates that aging people have
more utility on choosing public transit such as bus,
BRT and angkot, while younger generation tends to
use car in future. Household income has significant
positive correlation with the utility of car for all trip
makers as well as that of BRT for employed
persons. Other than that increases in household
income has negative effect on the utility of all other
modes. Level of education has significant negative
effect on Bus Choice. Travel makers having
educational background of at least graduation have
less utility to choose bus with more than 98 percent
level of significance. This may be due to the feeling
of status of the travel makers. The utility of all the
main modes have negative relationship with total
travel cost with 100 percent level of significance.
Table 4 Estimation results of the models for main mode Variables Specific
mode
Parameter t-
statistics
Education*gender (=1, if higher
education and male)
Angkot -0.423 -2.48
Student Car -1.958 -4.763
Employment (=1, if employed in
service)
Employed as Company Service
(=1, if company service)
BRT
Bus
0571
0.649
2.813
2.957
Age
Age
Age*gender (=1,if,male)
Age*occupation (=1,if employed
as company service)
Car
BRT
Bus
Angkot
-0.020
0.037
0.012
0.045
-1.799
5.901
1.965
4.172
Household income (Rp)
Household income (Rp)
Household income (Rp)
Household income (Rp)
Household income
(Rp)*occupation *education (=1,if
employed as company service and
higher education)
Car
Angkot
BRT
Bus
BRT
0.171E-06
-0.224E-06
0.120E-06
-0.770E-06
-0.144E-06
2.50
-2.46
2.204
-1.15
-3.193
Car Ownership
Car Ownership*Gender (=1,if
male)
To Car
To BRT
0.671
-0.324
4.046
-1.999
Total Travel Cost (Rp) All mode -0.508E-06 -9.102
Total Travel Time (minute) All mode -0.303E-03 -1.11
Travel Distance (km)
Travel Distance*Occupation (=1 if
employed as Govt Service)
Travel Distance* Occupation (=1
If Student)
Travel Distance*
Occupation*Gender (=1 If male
Student)
Car
BRT
Bus
Angkot
0.377
0.020
-0.082
0.039
8.863
1.692
-5.12
1.6205
Log likelihood at Zero
Log-Likelihood at convergence
McFadden’s Rho Square
Adjusted Mcfadden’s Rho Square
No of cases
-1153.234
-788.764
0.31603
0.29728
1080
Though the parameter of travel time is not
significant at 90 percent level, the negative sign of
the parameters is quite reasonable in the context of
12
development city like Surabaya. The sign of the
parameter quite reasonably point out that faster
travel mode is better for all trip makers in Surabaya.
The above model shows that students are
disinclined to use car as main mode with100
percent level of significance. Travel distance has
positive influence
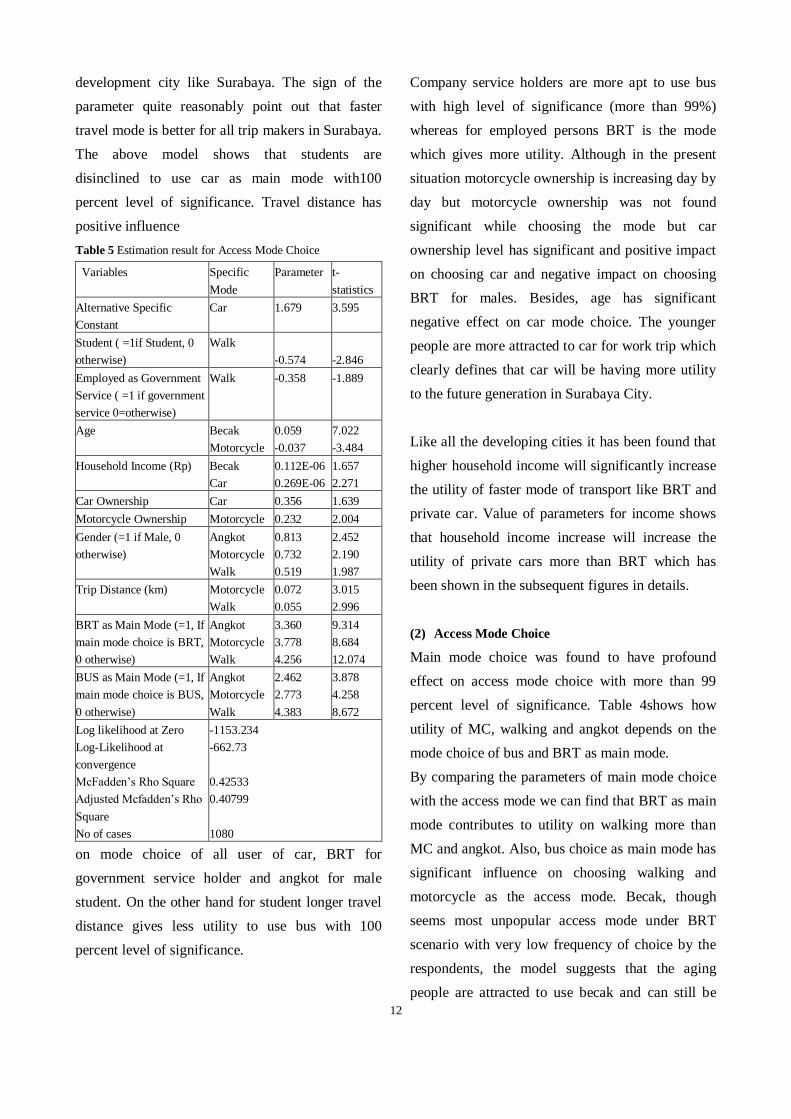
Table 5 Estimation result for Access Mode Choice
Variables Specific
Mode
Parameter t-
statistics
Alternative Specific
Constant
Car 1.679 3.595
Student ( =1if Student, 0
otherwise)
Walk
-0.574
-2.846
Employed as Government
Service ( =1 if government
service 0=otherwise)
Walk -0.358 -1.889
Age
Becak
Motorcycle
0.059
-0.037
7.022
-3.484
Household Income (Rp)
Becak
Car
0.112E-06
0.269E-06
1.657
2.271
Car Ownership Car 0.356 1.639
Motorcycle Ownership Motorcycle 0.232 2.004
Gender (=1 if Male, 0
otherwise)
Angkot
Motorcycle
Walk
0.813
0.732
0.519
2.452
2.190
1.987
Trip Distance (km)
Motorcycle
Walk
0.072
0.055
3.015
2.996
BRT as Main Mode (=1, If
main mode choice is BRT,
0 otherwise)
Angkot
Motorcycle
Walk
3.360
3.778
4.256
9.314
8.684
12.074
BUS as Main Mode (=1, If
main mode choice is BUS,
0 otherwise)
Angkot
Motorcycle
Walk
2.462
2.773
4.383
3.878
4.258
8.672
Log likelihood at Zero
Log-Likelihood at
convergence
McFadden’s Rho Square
Adjusted Mcfadden’s Rho
Square
No of cases
-1153.234
-662.73
0.42533
0.40799
1080
on mode choice of all user of car, BRT for
government service holder and angkot for male
student. On the other hand for student longer travel
distance gives less utility to use bus with 100
percent level of significance.
Company service holders are more apt to use bus
with high level of significance (more than 99%)
whereas for employed persons BRT is the mode
which gives more utility. Although in the present
situation motorcycle ownership is increasing day by
day but motorcycle ownership was not found
significant while choosing the mode but car
ownership level has significant and positive impact
on choosing car and negative impact on choosing
BRT for males. Besides, age has significant
negative effect on car mode choice. The younger
people are more attracted to car for work trip which
clearly defines that car will be having more utility
to the future generation in Surabaya City.
Like all the developing cities it has been found that
higher household income will significantly increase
the utility of faster mode of transport like BRT and
private car. Value of parameters for income shows
that household income increase will increase the
utility of private cars more than BRT which has
been shown in the subsequent figures in details.
(2) Access Mode Choice
Main mode choice was found to have profound
effect on access mode choice with more than 99
percent level of significance. Table 4shows how
utility of MC, walking and angkot depends on the
mode choice of bus and BRT as main mode.
By comparing the parameters of main mode choice
with the access mode we can find that BRT as main
mode contributes to utility on walking more than
MC and angkot. Also, bus choice as main mode has
significant influence on choosing walking and
motorcycle as the access mode. Becak, though
seems most unpopular access mode under BRT
scenario with very low frequency of choice by the
respondents, the model suggests that the aging
people are attracted to use becak and can still be

13
better for elderly people But, becak being a
expensive mode of transport and only more
Household income gives more utility to use becak
(with 97% level of significance).Traveler’s
perception about becak can be found from the
Figure 4. One can find that level of satisfaction over
the overall service of becak and angkot is not very
impressive and drivers’ manner, security from the
criminals, traffic safety, punctuality of the modes
and travel time are the major source of concern
which can greatly influence the future limited use
of angkot and becak. Becak which is becoming
expensive day by day and as it is a slower mode of
transport has a very low choice frequency as access
mode among the SP respondents. According to the
model, both students and Government employee are
less likely to prefer Walking with high significance
level. Besides, Surabaya people have high
motorcycle ownership, which has a significant
positive effect on choosing motorcycle as access
mode (with more than 95 % level of significance) It
also indicates that people of Surabaya are gradually
moving from non-motorized transports to motorized
transports and Motorcycle can be successfully used
as access mode for BRT and bus use.
7. SIMULATION ANALYSIS
(1) Sensitivity to increase in household income
To understand people’s travel mode choice
behavior in the future under BRT, simulation
analysis is conducted to examine the influence of
future income on the modal choice Probability
based on the assumptions that all the other
parameters are applicable over a long-term period.
The choice probability by travel mode is calculated
based on the estimated SP parameters. It is assumed
that for the existing travel modes, their relevant
level-of-service variables are all fixed at the current
average values. The medium level assumed in SP
Survey is adopted for each variable of the mode.
Simulation results for each scenario of mode
availability were done and typical results are shown
in from Fig 11 to Fig 20.
Fig.11 Sensitivity to HIC change on main mode choice probability in context 9
Base HIC 25% Increase 50% Increase 100% Increase 150% Increase 200% Increase
Pr(BUS) 0.169 0.159 0.150 0.137 0.128 0.122
Pr(BRT) 0.831 0.841 0.850 0.863 0.872 0.878
0.000
0.100
0.200
0.300
0.400
0.500
0.600
0.700
0.800
0.900
1.000
Avera
ge P
robabli
ty
Change in average probablity of main mode choice with % change in HIC ( context 9)

14
Base HIC25%
Increase
50%
Increase
100%
Increase
150%
Increase
200%
Increase
Pr(BECAK) 0.039 0.044 0.048 0.060 0.074 0.092
Pr(ANGKOT) 0.169 0.168 0.168 0.166 0.164 0.161
Pr(WALK) 0.792 0.788 0.784 0.774 0.762 0.747
0.000 0.100 0.200 0.300 0.400 0.500 0.600 0.700 0.800 0.900
Avera
ge P
robabli
ty
Change in average probablity of access mode with % change in income (context 9)
Fig. 12 Sensitivity to change in HIC to access mode choice probabilityunder subset 9
Base HIC 25% Increase 50% Increase100%
Increase
150%
Increase
200%
Increase
Pr(BUS) 0.106 0.099 0.093 0.083 0.075 0.068
Pr(BRT) 0.559 0.555 0.548 0.527 0.501 0.471
Pr(CAR) 0.246 0.270 0.294 0.341 0.387 0.431
Pr(ANG) 0.088 0.075 0.065 0.049 0.038 0.030
0.000 0.100
0.200 0.300 0.400 0.500
0.600
Avera
ge p
robabli
ty
Change in average probablity of main mode choice with % change in HIC (context 1)
Fig. 13 Sensitivity to change in HIC to main mode choice probability under subset 1
Fig. 14 Sensitivity to change in HIC to access mode choice probability under context 1
Base HIC25%
Increase
50%
Increase
100%
Increase
150%
Increase
200%
Increase
Pr(BECAK) 0.101 0.116 0.122 0.115 0.103 0.093
Pr(CAR) 0.226 0.276 0.315 0.394 0.475 0.549
Pr(WALK) 0.672 0.608 0.563 0.491 0.422 0.358
0.000
0.100
0.200
0.300
0.400
0.500
0.600
0.700
0.800
Avera
ge P
robabli
ty
Change in average probablity of access mode choice with % change in HIC (context 1)
15
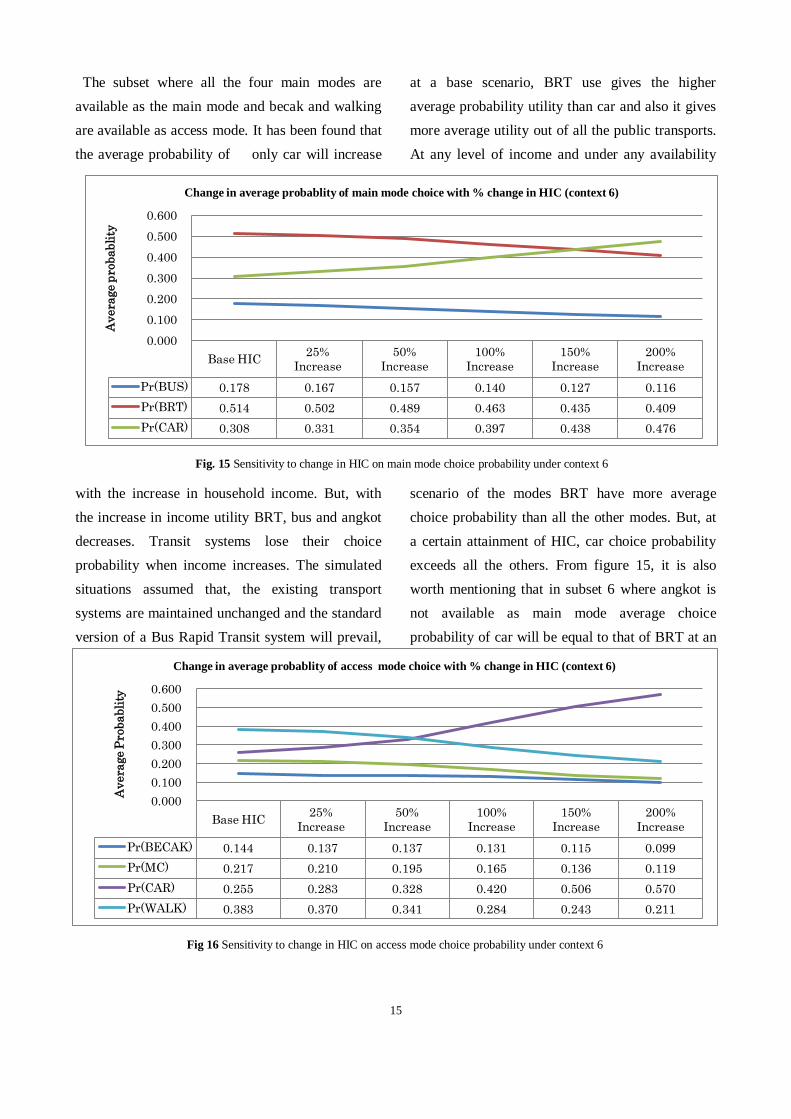
The subset where all the four main modes are
available as the main mode and becak and walking
are available as access mode. It has been found that
the average probability of only car will increase
with the increase in household income. But, with
the increase in income utility BRT, bus and angkot
decreases. Transit systems lose their choice
probability when income increases. The simulated
situations assumed that, the existing transport
systems are maintained unchanged and the standard
version of a Bus Rapid Transit system will prevail,
at a base scenario, BRT use gives the higher
average probability utility than car and also it gives
more average utility out of all the public transports.
At any level of income and under any availability
scenario of the modes BRT have more average
choice probability than all the other modes. But, at
a certain attainment of HIC, car choice probability
exceeds all the others. From figure 15, it is also
worth mentioning that in subset 6 where angkot is
not available as main mode average choice
probability of car will be equal to that of BRT at an
Base HIC25%
Increase
50%
Increase
100%
Increase
150%
Increase
200%
Increase
Pr(BECAK) 0.144 0.137 0.137 0.131 0.115 0.099
Pr(MC) 0.217 0.210 0.195 0.165 0.136 0.119
Pr(CAR) 0.255 0.283 0.328 0.420 0.506 0.570
Pr(WALK) 0.383 0.370 0.341 0.284 0.243 0.211
0.000
0.100
0.200
0.300
0.400
0.500
0.600
Avera
ge P
robabli
ty
Change in average probablity of access mode choice with % change in HIC (context 6)
Base HIC25%
Increase
50%
Increase
100%
Increase
150%
Increase
200%
Increase
Pr(BUS) 0.178 0.167 0.157 0.140 0.127 0.116
Pr(BRT) 0.514 0.502 0.489 0.463 0.435 0.409
Pr(CAR) 0.308 0.331 0.354 0.397 0.438 0.476
0.000
0.100
0.200
0.300
0.400
0.500
0.600
Avera
ge p
robabli
ty
Change in average probablity of main mode choice with % change in HIC (context 6)
Fig. 15 Sensitivity to change in HIC on main mode choice probability under context 6
Fig 16 Sensitivity to change in HIC on access mode choice probability under context 6

16
income level which is 2.5 times the present income
level. This however found different for different
scenario.For example, in the scenario where all
main modes are available as in Fig 13, average
choice probability of car exceeds that of BRT at a
household income level which is more than 3
times higher than the present.
Increase in car choice probability also affects the
access mode choice probability as shown in fig
16.The fig shows that increase in car choice
probability made reduction of walking as an access
mode. Fig11 and Fig 12explains scenario where
only bus and BRT is available as main mode and
increase in income increase BRT choice probability
making reduction of bus choice probability which
also results in reduction of angkot and walking
mode choice probability as an access mode.
Probability of BRT is more than bus choice
probability and angkot gives the least average
choice probability out of this four main modes.
With increase of household income walking as well
as angkot loses choice probability where as becak
has the potential to to be used as access mode under
increase in Household income
(2) Sensitivity to change in angkot / bus travel time
and travel cost on mode choice probability of
angkot/bus:
In the base scenario angkot has the lowest choice
probability among all the four modes followed by
bus. So, simulation has been done in quest for
policy issues to increase angkot’s usage.
Simulation has been done assuming that all other
variables for all the modes and all the socio
economic variables remain unchanged. It was found
Base
Scenario
90% of
Base TT
& TC
75% of
Base TT
&TC
Pr(BUS) 0.141 0.173 0.235
Pr(BRT) 0.602 0.580 0.540
Pr(CAR) 0.257 0.247 0.225
0.000
0.100
0.200
0.300
0.400
0.500
0.600
0.700
Avera
ge P
robabli
ty
Sensitivity of change in Bus Travel Time and Travel
cost to main mode choice Probablity (Context 5)
Base
Scenari
o
90% of
Base TT
& TC
75% of
Base TT
&TC
Pr(ANGKOT) 0.095 0.093 0.092
Pr(MC) 0.268 0.265 0.260
Pr(CAR) 0.210 0.204 0.204
Pr(WALK) 0.426 0.438 0.445
0.000
0.050
0.100
0.150
0.200
0.250
0.300
0.350
0.400
0.450
0.500 A
vera
ge P
robabil
ity
Sensitivity of change in Bus Travel Time and
Travel cost to Access mode choice Probablity
(Context 5)
Fig.17 Sensitivity to bus travel time and travel cost reduction
on main mode choice probability in context 5
Fig. 18 Sensitivity to bus travel time and travel cost reduction
on access mode choice probability in context 5

17
that (Fig 19) with 25 % reduction of angkot total
travel time and travel cost the choice probability of
angkot will be double the base scenario. Increase in
angkot’s choice probability also influenced to
increase the choice probability of MC as an access
mode as shown in Fig 20. Similar simulation was
also carried out for bus. Fig 17 shows that 25
percent reduction of bus travel time results in
drastic increase in choice probability of bus and
which equals the choice probability of car in base
scenario under subset 5 where there is no angkot
available as main mode. On the other hand increase
in bus choice probability brings corresponding
changes in access mode preference. Fig 18 shows
that bus main mode is synchronized with walking
as access mode. That’s why increase of choice
probability of bus also increases use of walk as
access mode and decrease the choice probability of
motorized access mode like MC and angkot.
Although, bus has more average utility than angkot,
in all the subset it has lower average choice
probability than BRT.
Fig.20 Sensitivity to angkot travel time and cost
reduction on access mode choice probability in context
14
In all the contexts, bus was assumed to exist with
the BRT and it was assumed to have cheaper and
slower attributes than BRT. It will be highly
infeasible for buses to operate on the routes where
BRT exists unless there are reduction of Travel
time and cost. On the other hand, bus has higher
average utility than angkot at any level of
household income and it can compete with angkot
to get the more modal share. So, unavailability of
BRT on any particular route can draw major trips in
to bus over angkot. So, operating bus and BRT in
the same route will not be feasible and bus can be
an immediate alternative to BRT on routes where
BRT is not implemented. Generally, a decrease in
the service quality of public transit leads to an
increase in demand of private vehicles. To illustrate
the effect of change in the public transport service
quality on the choice probability, we simulate the
case where 25 percent decrease in travel time for
bus and angkot was considered separately.
Base
Scen
ario
90%
of
Base
TT &
TC
75%
of
Base
TT
&TC
Pr(MC) 0.381 0.381 0.389
Pr(WALK) 0.619 0.619 0.611
0.000
0.100
0.200
0.300
0.400
0.500
0.600
0.700
Avera
ge P
robabil
ity
Sensitivity of change in angkot travel time
and travel cost to access mode choice
probablity (context 14)
Base
Scena
rio
90%
of
Base
TT &
TC
75%
of
Base
TT
&TC
Pr(BUS) 0.169 0.163 0.150
Pr(BRT) 0.725 0.695 0.634
Pr(ANG) 0.106 0.142 0.217
0.000 0.100 0.200 0.300 0.400 0.500 0.600 0.700 0.800
Avera
ge P
rob
ab
lity
Sensitivity of change in angkot travel time and
travel cost to main mode choice probablity
(Context 14)
Fig.19 Sensitivity to angkot travel time and cost
reduction on main mode choice probability in context 14
18
8. CONCLUSION:
Bus Rapid Transit system got the highest utility and
average choice probability among the public
transport modes, since it embodies the
characteristics of a mode that urban travelers
consider fast, comfortable, convenient and
accessible, not withstanding its highly subsidized
fare system. Hence, it is therefore important for the
government to focus its attention to the provision of
BRT system in Surabaya. And also for successful
implementation of BRT it is necessary to predict
the actual demand which might generate due to
introduction of BRT under predefined attributes.
Under BRT system access mode choice will be
dependent on main mode choice and unless good
walking facilities are provided there can be major
shift in motorized access mode in future. Walking
Facilities should be improved in the Surabaya City
which can reduce the use of private motorized
vehicles in Surabaya city as an access mode and can
also stimulate public transit use. Becak can still be
very effective for elderly people for access mode
choice and sufficient road safety and security
measure should be provided for its effective use.
And also under BRT system there should be park
and ride system for motorcycle so that commuters
can use this as a faster access mode. Travel time
and travel cost reduction of both angkot and bus can
be a solution for its existence in Surabaya City. In
future, angkot owners should have to make it faster
and safer from the criminal activities and it should
be more customers oriented.
This paper explores the factors which can affect the
utility of BRT in future. Various availability
options can be properly tested through this model
the outcome of the study can be used in demand
predictions as for changes in the variables both for
access mode and main mode; for instance travel
time and various scenarios of mode availability.
The proposed model can be used in Surabaya
metropolitan region to design and implement more
effective and appropriate transportation solutions
for relieving congestion under a sustainable
transportation horizon.
ACKNOWLEDGEMENT
We would like to take the opportunity to thank
different parties that contributed to our work. The
above research was done under an Internship
program organized and financed by G.ecbo of
Hiroshima University and the first author would
like to give gratitude to Gecbo and Hiroshima
University. Special thanks also go to Surabaya City
Government who is the host institution for
Internship and this subsequent research.
REFERENCES
1) Alexis M. FILLONE, Cresencio M. MONTALBO Jr,
Noriel Christopher C. Tiglao ; “Transport mode choice
models for metro manila and urban transport policy
applications” Journal of the Eastern Asia Society for
Transportation Studies, Vol. 7, 2007
2) Raquel Espino , Juan de Dios Ortu´zar, Concepcio´n
Roma´n;”Understanding suburban travel demand: Flexible
modeling with revealed and stated choice data.
Transportation Research Part A 41 (2007) 899–912
3) Ghebreegziabiher Debrezion , Eric Pels, Piet Rietveld
(2008); Modelling the joint access mode and railway
station choice. Transportation Research Part E 45
(2009) 270–283
4) Zhang Junyi, Fujiwara Akimasa, Thein Soe (2008)
Capturing Travellers Stated Mode Choice Preferences
19
Under Influence of Income in Yangoon City, Myanmar. J
transpn Sys Eng &IT, 2008, 8(4), 49-62
5) A.H.M. Mehbub ANWAR, Akimasa FUJIWARA, Togar
Arifin SILABAN, Victorino AQUITANIA. Evaluating Local
People Acceptance towards Car Free Day Program Using
Structural Equation Model: Study on Surabaya City of
Indonesia. Proceedings of the Eastern Asia Society for
Transportation Studies, Vol.7, 2009
6) Ortuzar J D, Iacobelli A, Valeze C. Estimating demand for
a cycle-way network. Transportation Research Part A, 2000
34(5): 353–373.
7) Dissanayake D, Morikawa T. A combined RP/SP nested
logit model to investigate household decisions on vehicle
usage, mode choice and trip chaining in developing countries.
Journal of the Eastern Asia Society for Transportation
Studies, 2001, 4(2): 235–244.
8) Bhattacharjee D, Haider, S W, Tanaboriboon Y, et al.
Commuters’ attitudes towards travel demand management in
Bangkok. Transport Policy, 1997, 4(3): 161–170.
9) Park N, Ieda H, Yoon H R. The feasibility study on the
new transit system implementation to the congested area in
Seoul, Journal of the Eastern Asia Society for
Transportation Studies, 2003, 5, 3169–3178.
10) Henry Wo¨hrnschimmel , Miriam Zuk , Gerardo
Martı´nez-Villa, Julia Cero´n Beatriz Ca ́ rdenas , Leonora
Rojas-Bracho , Adria´n Ferna´ndez-Bremauntz . The impact
of a Bus Rapid Transit system on commuters’ exposure to
Benzene, CO, PM2.5 and PM10 in Mexico City.
Atmospheric Environment 42 (2008) 8194–8203
11) Sjafruddin A, Widodo P, Kurniati T. Demand rate and
elasticity of the urban taxi service based on the stated
preference data case study in Bandung, Indonesia. Journal
of the Eastern Asia Society for Transportation Studies,
2001, 4(3):177–189
12) Enam A. and Choudhury C., Methodological Issues in
Developing Mode Choice Models for Dhaka City
Transportation Research Record, Journal of the
Transportation Research Board (forthcoming)
(Received May 6, 2011)