quant funds annual report
TRANSCRIPT
ANNUALREPORT
Q U A N T F U N D S
M A R C H 3 1 , 2 0 0 6
U.S. EQUITY FUNDS
Quant Small Cap Fund
Quant Growth and Income Fund
INTERNATIONAL EQUITY FUNDS
Quant Emerging Markets Fund
Quant Foreign Value Fund
Merrill Corp - Quant Funds Quant Funds Annual Report [Funds] 03-31-2006 [AUX] | sholt | 16-May-06 22:23 | 06-6021-1.aa | Sequence: 1CHKSUM Content: 44159 Layout: 43351 Graphics: 9726 CLEAN
JOB: 06-6021-1 CYCLE#;BL#: 10; 0 TRIM: 8.25" x 10.75" COMPOSITECOLORS: Black, PANTONE 540 U, ~note-color 2, ~note-color 3 GRAPHICS: quant_funds_540_40per_icon.eps V1.5

Merrill Corp - Quant Funds Quant Funds Annual Report [Funds] 03-31-2006 [AUX] | sholt | 16-May-06 22:23 | 06-6021-1.aa | Sequence: 2CHKSUM Content: No Content Layout: 37517 Graphics: No Graphics CLEAN
JOB: 06-6021-1 CYCLE#;BL#: 10; 0 TRIM: 8.25" x 10.75" COMPOSITECOLORS: ~note-color 2 GRAPHICS: none V1.5
President’s Letter................................................................................................................1
Useful Information About Your Fund Report ...........................................................................2
Portfolio Manager Commentaries
Quant Small Cap Fund ..................................................................................................3
Quant Growth and Income Fund.....................................................................................5
Quant Emerging Markets Fund.......................................................................................7
Quant Foreign Value Fund..............................................................................................9
Schedules of Investments
Quant Small Cap Fund ..................................................................................................11
Quant Growth and Income Fund.....................................................................................13
Quant Emerging Markets Fund.......................................................................................15
Quant Foreign Value Fund..............................................................................................17
Statement of Assets and Liabilities ......................................................................................19
Statement of Operations .....................................................................................................20
Statement of Changes in Net Assets ....................................................................................21
Financial Highlights .............................................................................................................23
Notes to Financial Statements .............................................................................................27
Report of Independent Registered Public Accountant .............................................................33
Information for Shareholders................................................................................................34
Privacy Statement ...............................................................................................................35
Trustees and Officers ..........................................................................................................37
Service Providers ................................................................................................................back cover
This report must be preceded or accompanied by a current Quant Funds prospectus. You should read the prospectuscarefully before investing because it contains more complete information on the Quant Funds’ investment objectives,risks, charges and expenses. Please consider this information carefully. For a prospectus and other information,call (800) 326-2151 or visit www.quantfunds.com.
NOT FDIC INSURED • MAY LOSE VALUE • NO BANK GUARANTEE
Neither the Quant Funds nor U.S. Boston Capital Corporation is a bank.
T A B L E O F C O N T E N T S
Merrill Corp - Quant Funds Quant Funds Annual Report [Funds] 03-31-2006 [AUX] | sholt | 16-May-06 22:23 | 06-6021-1.ba | Sequence: 1CHKSUM Content: 55828 Layout: 44572 Graphics: No Graphics CLEAN
JOB: 06-6021-1 CYCLE#;BL#: 8; 0 TRIM: 8.25" x 10.75" COMPOSITECOLORS: Black, PANTONE 540 U, ~note-color 2 GRAPHICS: none V1.5

Q U A N T F U N D S
1
55 Old Bedford Road, Lincoln, MA 01733 • voice 800-326-2151 • fax 781-259-1166 • www.QuantFunds.com • Distributed by U.S. Boston Capital Corp. • Member NASD, SIPC
Dear Fellow Shareholder:
We are pleased to provide you with the Annual Report of the Quant Funds for the year ended March 31,2006. This report is to update you on recent market conditions and the performance of the Quant Funds.
World equity market performance was very positive for the twelve-months ended March 31, 2006. The U.S.equity market (as represented by the Standard & Poor’s 500 Index) was up 11.73%, while small cap equities (asrepresented by the Russell 2000 Index) were up 25.85%, significantly outperforming the broader market.International equity markets outperformed the U.S. equity market by a substantial margin as measured by boththe Morgan Stanley Capital International Europe, Australasia and Far East (“MSCI EAFE”) Index, representativeof established foreign equity markets, at +24.94% and the Morgan Stanley Capital International EmergingMarkets (“MSCI EM”) Index, representative of emerging equity markets, at +47.98%.
The fiscal year’s positive equity market performance was achieved against a backdrop of serious challengessuch as significant weather-related disasters, terrorist threats, the continuing conflict in Iraq, increased concernsabout nuclear development in North Korea and Iran, political unrest in Europe and rising energy prices,particularly the price of oil. We believe the 2007 fiscal year will present similar economic, political and socialconcerns but we are optimistic about the potential for positive equity market performance.
While there are potential risks in the U.S. equity markets such as narrowing market leadership, lacklustertrading volume and continued interest rate increases, the U.S. economy appears strong. Key economic driversare positive. Corporate earnings generally have been in line with expectations. Corporate takeovers and sharebuybacks continue to be helped by relatively low borrowing costs and attractive equity valuations. Businessinvestments in intangibles – such as innovation and product design, brand-building and employee training – arebeing driven upward by the U.S. economy’s shift from an industrial economy to a knowledge-based economyand by the rigors of competing in today’s global economy.
Many foreign economies also appear strong. In Europe, for example, there are signs that the recovery inGermany may lead to a period of sustainable economic growth as exports rise driving industrial production andservice sector activity. In Asia, economic expansion in China continues and the Japanese economy has beenbuilding momentum mainly due to government restructuring policy initiatives.
Looking ahead, the portfolio managers for each of the Quant Funds are optimistic about the prospects forgood investment opportunities during the next fiscal year. We invite you to review the Investment Commentaryfor your Fund for more information.
We look forward to sharing another promising year with you and thank you for your continued confidencein Quant Funds. We always welcome your comments and feedback. Please feel free to email us [email protected] or call us at 800-326-2151 with any questions or for assistance on your account.
Willard UmphreyChief Executive Officer
Any information in this Shareholder Letter regarding market or economic trends or the factors influencing the historical or futureperformance of the Quant Funds are the views of Fund management as of the date of this report. These views are subject to change atany time based upon market and other conditions, and Fund management disclaims any responsibility to update such views. These viewsmay not be relied upon as investment advice or as an indication of trading intent on behalf of any Quant Fund. Any references to specificsecurities are not recommendations of such securities and may not be representative of any Quant Funds’ current or future investments.
Past performance is no guarantee of future results, and there is no guarantee that market forecasts will be realized.
Merrill Corp - Quant Funds Quant Funds Annual Report [Funds] 03-31-2006 [AUX] | sholt | 16-May-06 22:23 | 06-6021-1.ba | Sequence: 2CHKSUM Content: 59777 Layout: 60020 Graphics: 32772 CLEAN
JOB: 06-6021-1 CYCLE#;BL#: 8; 0 TRIM: 8.25" x 10.75" COMPOSITECOLORS: Black, PANTONE 540 U, ~note-color 2 GRAPHICS: willard_umphrey_sig.eps V1.5
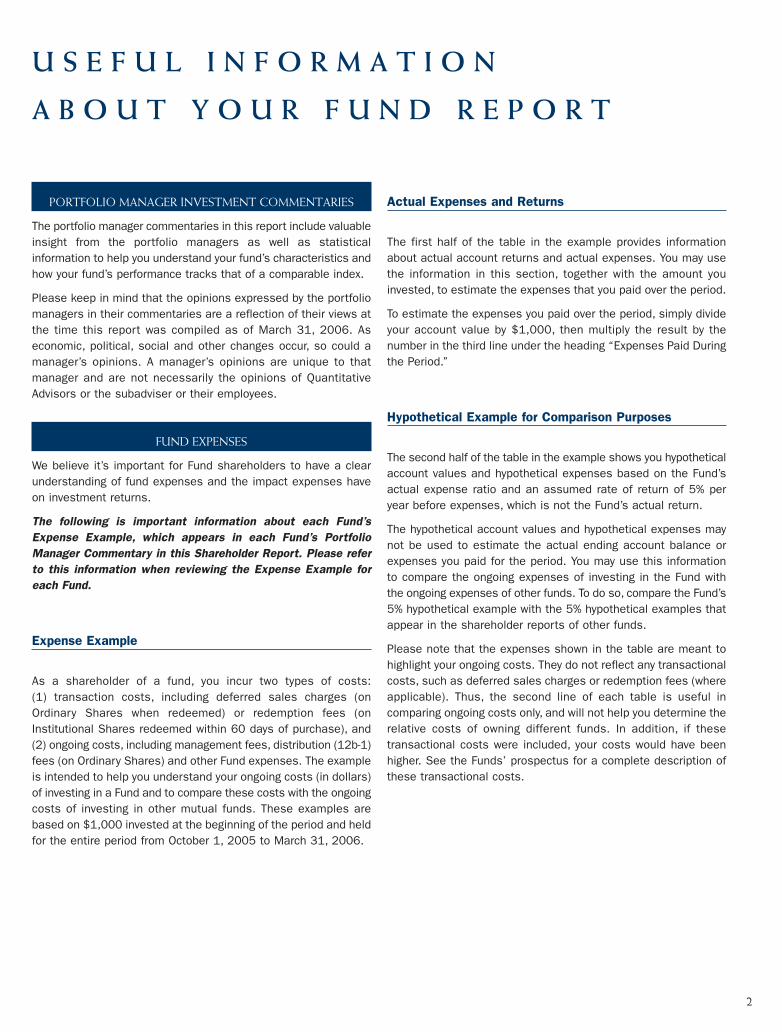
Actual Expenses and Returns
The first half of the table in the example provides informationabout actual account returns and actual expenses. You may usethe information in this section, together with the amount youinvested, to estimate the expenses that you paid over the period.
To estimate the expenses you paid over the period, simply divideyour account value by $1,000, then multiply the result by thenumber in the third line under the heading “Expenses Paid Duringthe Period.”
Hypothetical Example for Comparison Purposes
The second half of the table in the example shows you hypotheticalaccount values and hypothetical expenses based on the Fund’sactual expense ratio and an assumed rate of return of 5% peryear before expenses, which is not the Fund’s actual return.
The hypothetical account values and hypothetical expenses maynot be used to estimate the actual ending account balance orexpenses you paid for the period. You may use this informationto compare the ongoing expenses of investing in the Fund withthe ongoing expenses of other funds. To do so, compare the Fund’s5% hypothetical example with the 5% hypothetical examples thatappear in the shareholder reports of other funds.
Please note that the expenses shown in the table are meant tohighlight your ongoing costs. They do not reflect any transactionalcosts, such as deferred sales charges or redemption fees (whereapplicable). Thus, the second line of each table is useful incomparing ongoing costs only, and will not help you determine therelative costs of owning different funds. In addition, if thesetransactional costs were included, your costs would have beenhigher. See the Funds’ prospectus for a complete description ofthese transactional costs.
U S E F U L I N F O R M A T I O N
A B O U T Y O U R F U N D R E P O R T
PORTFOLIO MANAGER INVESTMENT COMMENTARIES
The portfolio manager commentaries in this report include valuableinsight from the portfolio managers as well as statisticalinformation to help you understand your fund’s characteristics andhow your fund’s performance tracks that of a comparable index.
Please keep in mind that the opinions expressed by the portfoliomanagers in their commentaries are a reflection of their views atthe time this report was compiled as of March 31, 2006. Aseconomic, political, social and other changes occur, so could amanager’s opinions. A manager’s opinions are unique to thatmanager and are not necessarily the opinions of QuantitativeAdvisors or the subadviser or their employees.
FUND EXPENSES
We believe it’s important for Fund shareholders to have a clearunderstanding of fund expenses and the impact expenses haveon investment returns.
The following is important information about each Fund’sExpense Example, which appears in each Fund’s PortfolioManager Commentary in this Shareholder Report. Please referto this information when reviewing the Expense Example foreach Fund.
Expense Example
As a shareholder of a fund, you incur two types of costs:(1) transaction costs, including deferred sales charges (onOrdinary Shares when redeemed) or redemption fees (onInstitutional Shares redeemed within 60 days of purchase), and(2) ongoing costs, including management fees, distribution (12b-1)fees (on Ordinary Shares) and other Fund expenses. The exampleis intended to help you understand your ongoing costs (in dollars)of investing in a Fund and to compare these costs with the ongoingcosts of investing in other mutual funds. These examples arebased on $1,000 invested at the beginning of the period and heldfor the entire period from October 1, 2005 to March 31, 2006.
2
Merrill Corp - Quant Funds Quant Funds Annual Report [Funds] 03-31-2006 [AUX] | sholt | 16-May-06 22:23 | 06-6021-1.ba | Sequence: 3CHKSUM Content: 7074 Layout: 32403 Graphics: No Graphics CLEAN
JOB: 06-6021-1 CYCLE#;BL#: 8; 0 TRIM: 8.25" x 10.75" COMPOSITECOLORS: Black, PANTONE 540 U, ~note-color 2 GRAPHICS: none V1.5

Q U A N T S M A L L C A P F U N DI N V E S T M E N T P R O F I L E A l l D a t a a s o f M a r c h 3 1 , 2 0 0 6
INVESTMENT COMMENTARY
3
The Fund is co-managed by Robert von Pentz, CFA, and Rhys Williams of Columbia Partners, L.L.C.Investment Management.
The Small Cap Fund Ordinary Shares earned a 23.3% total returnfor the one year period ending March 31, 2006, versus itsbenchmark the Russell 2000 Index, which had a return of 25.9%.Undeterred by rising energy prices and rising interest rates, smallcap stocks responded to a strong economy and good earningsacross many industries and companies. Although large cap and midcap stocks performed well during this period, both posting doubledigit gains, it was the small cap segment of the equity market thatboasted the best returns. While all sectors of the index showedpositive returns for the fiscal year, Energy was the best performingsector in the Russell 2000 Index earning an incredible 47.9% return.Sharply rising oil and natural gas prices were the catalyst for this
strong showing. Exploration and production as well as energy servicecompanies were seen as direct beneficiaries of the increasingworldwide demand for energy and the supply interruptions thatoccurred in the wake of Hurricane Katrina. Four other sectors withinthe index posted returns of over 30% for the fiscal year includingIndustrials +35.6%, Information Technology +31.2%,Telecommunications Services +30.3%, and Materials +30.1%.
Energy was also a top performer for the Fund for the year, and as aresult of our good stock selection and overweight in the sector, itwas a positive contributor to relative performance. Core Laboratories,an energy service company, was a key holding in this sector. Our bestsector contributors however, were Consumer Discretionary andTelecommunications Services, where we outperformed and wereoverweight both of these index sectors. Such varied names inConsumer Discretionary as homebuilder Toll Brothers, retailer DressBarn, auction house Sotheby’s Holdings and resort operator VailResorts were standouts in performance over the past year. InTelecommunications Services, returns were driven by Crown Castle,the tower company which was the single largest contributor to theFund’s performance for the fiscal year. Other sectors of the portfoliothat positively contributed to relative performance were Utilities and
Materials, which despite having small weightings both in an absoluteand relative sense, benefited from good stock selection. In Materialsfor example, Coeur d’Alene Mines was a solid performer, profitingfrom the rise in silver prices in recent months.
There were areas of underperformance in the Fund’s portfolio aswell during the fiscal year. Our underweighted positions in bothIndustrials and Information Technology as well as poor stockselection in these sectors combined to detract from overallperformance relative to the index. The Information Technology sectorhas been a difficult one to maneuver through since the tech bubbleburst a few years ago. Technology in many industries is changingrapidly and finding the companies that will participate and prosperremains a challenge.
Since our last report in September of 2005, we have slightly reducedour overweight in the Consumer Discretionary sector to approximately17% versus 13% for the index and went from an equal weight relativeto the index of roughly 18% in Information Technology to anunderweight of about 14%. Our exposure in Industrials has increasedto over 17%, closer to the index weight of approximately 18%, asthis sector is showing increasing signs of investor interest. In thekey energy sector, we remain overweight relative to the benchmarkindex, at approximately 9% versus 6%, as supply constraints andgeopolitical issues continue to put pressure on oil prices.
Despite rising interest rates and higher energy prices the U.S.economy continues to surprise with its resilience in the face of manyobstacles. The strengthening world economy, most notably in Japanand Europe, should in turn increase the demand for U.S. producedgoods and services. We believe the trends appear to be in place forcontinued moderate growth with relatively low inflation in the monthsahead which bodes well for the stock market. Balancing out thispositive outlook is the fact that events in the Middle East and Chinaas well as the Federal Reserve’s interest rate policy going forwardcould impact the markets’ direction going forward.
This past year proved to be another very successful year for theFund. We have enjoyed good performance not just in the bestperforming sectors but also by making profits in weak sectors forthe index. We continue to believe our strategy of focusing on stockselection in quality companies offers the best reward to investorsover a market cycle and we look forward to another successful yearahead. We thank you for your continued support.
Ticker Symbol USBNX (Ordinary)QBNAX (Institutional)
Number of Companies 67Price to Book Ratio 3.9Price to Earnings Ratio 19.1Net Assets Under Management $111.2 Million
FUND INFORMATION
Merrill Corp - Quant Funds Quant Funds Annual Report [Funds] 03-31-2006 [AUX] | sholt | 16-May-06 22:23 | 06-6021-1.ca | Sequence: 1CHKSUM Content: 16844 Layout: 12595 Graphics: No Graphics CLEAN
JOB: 06-6021-1 CYCLE#;BL#: 8; 0 TRIM: 8.25" x 10.75" COMPOSITECOLORS: Black, PANTONE 540 U, ~note-color 2 GRAPHICS: none V1.5

4
AVERAGE ANNUAL TOTAL RETURNS
1 Reflects deduction of a 1% deferred sales charge.2 Institutional Shares may only be purchased by certain categories of investors and are not subject to sales charges or distribution fees.3 The Russell 2000 Index is a market capitalization-weighted index of 2,000 small company stocks. It is widely recognized as representative of the general market for small company stocks. Index returnsassume the reinvestment of dividends and, unlike Fund returns, do not reflect any fees or expenses. You cannot invest directly in an Index. The beginning date for the Index is 9/30/92.
Small company stocks may trade less frequently and in a limited volume, and their prices may fluctuate more than stocks of othercompanies. Small company stocks may therefore be more vulnerable to adverse developments than those of larger companies.
1Q 2006 One Year Five Year Ten Year Since InceptionInception Date
Ordinary Shares 11.66% 24.51% 10.68% 10.22% 14.70% 8/3/92
Ordinary Shares(adjusted)1 10.54% 23.26% 10.45% 10.11% 14.62%
Institutional Shares2 11.80% 25.06% 11.23% 10.77% 13.62% 1/6/93
Russell 20003 13.94% 25.85% 12.59% 10.15% 12.11%
TOP TEN HOLDINGS
Company % Total Net AssetsCore Laboratories N.V. 4.9Crown Castle International Corporation 4.7Ventas, Inc. 4.3Sierra Health Services, Inc. 3.9Entertainment Properties Trust 3.7Coeur d’Alene Mines Corporation 2.7Kforce Inc. 2.6RARE Hospitality International Inc. 2.5Vail Resorts, Inc. 2.4Sotheby’s Holding Inc. 2.3There is no guarantee that such securities will continue to be viewed favorably or heldin the Fund’s portfolio.
SECTOR ALLOCATION
% Total Net AssetsFinancials 18.8Consumer Discretionary 17.2Industrials 16.0Information Technology 12.6Energy 9.0Health Care 9.0Telecommunication Services 5.9Materials 5.7Consumer Staples 3.4Utilities 0.9Cash and Other Assets (Net) 1.5
VALUE OF $10,000 INVESTED IN QUANT SMALL CAP (QSC)ORDINARY SHARES VS. RUSSELL 2000
ANNUAL FUND OPERATING EXPENSES
Please refer to page 2 for an explanation of the information presented in the followingExpense Example.
For each class of the Fund, expenses are equal to the annualized expense ratio for the class (1.86%for Ordinary and 1.36% for Institutional) multiplied by the average account value for the period,multiplied by 182/365 (to reflect the six month period).
Actual Performance Hypothetical Performance (5% return before expenses)
Ordinary Institutional Ordinary Institutional Shares Shares Shares Shares
Beginning Account Value
(10/01/05) $1,000.00 $1,000.00 $1,000.00 $1,000.00
Ending Account Value
(03/31/06) $1,119.97 $1,122.50 $1,015.64 $1,018.15
Expenses Paid During The Period $9.84 $7.20 $9.36 $6.84
Russell 2000$26,475
QSC$26,225
30000
25000
10000060596 0403020100999897
15000
20000 1
Performance data quoted represents past performance and is no guarantee of future results. Current performance may be lower or higher thanperformance data quoted. Investment return and principal value will fluctuate so that an investor’s shares, when redeemed, may be worth more or lessthan original cost. For the most recent month-end performance, visit the Fund’s website at www.quantfunds.com. Before investing, carefully considerthe Fund’s investment objectives, risks, charges and expenses. For this and other information obtain the Fund’s prospectus by calling(800) 326-2151 or visiting www.quantfunds.com. Please read the prospectus carefully before you invest.
Merrill Corp - Quant Funds Quant Funds Annual Report [Funds] 03-31-2006 [AUX] | sholt | 16-May-06 22:23 | 06-6021-1.ca | Sequence: 2CHKSUM Content: 23391 Layout: 42608 Graphics: 34590 CLEAN
JOB: 06-6021-1 CYCLE#;BL#: 8; 0 TRIM: 8.25" x 10.75" COMPOSITECOLORS: Black, PANTONE 540 U, ~note-color 2 GRAPHICS: 6021-1 Sm Cap line.eps V1.5

Q U A N T G R O W T H A N D I N C O M E F U N DI N V E S T M E N T P R O F I L E A l l D a t a a s o f M a r c h 3 1 , 2 0 0 6
INVESTMENT COMMENTARY
5
The Fund’s portfolio is managed by a team of portfolio managers at SSgA Funds Management, Inc. Thelead portfolio manager is James Johnson, CFA.
As of March 31, 2006, Quant Growth & Income Fund’s OrdinaryShares outperformed the S&P 500 Index return of 11.7% by 1.8%for the past 12 months. Our investment process incorporatesperspectives on valuation, quality and sentiment. Overall, thesefactors offered positive performance. Specifically, our estimaterevision, a proxy for earnings growth, and cash flow perspectives haveserved as strong predictors of stock price appreciation. Over thissame period, our quality component, which looks at cash versus non-cash earnings, has had weak forecasting skill.
Performance results for the Quant Growth & Income Fund areprimarily driven by stock selection positions. The fund’s sector andindustry exposures relative to the benchmark are a function of ourstock selection process. Overweights among health care, consumerdiscretionary and utility stocks made the largest contributionstowards outperformance. Express Scripts Inc. and Humana Inc. wereamong the top contributing stocks. Express Scripts climbed +90%after the company announced that its 2006 earnings will continueto benefit from growth in generic utilization and home delivery.Humana, the largest health insurer of military personnel, reportedstrong profit gains, leading the stock up +49%. USG Corp. climbeda stunning +242% over the past 12 months. This wallboard makerwas showered with good news, settling its asbestos liability claimsand reporting record sales. Among utilities stocks, TXU Corp. (+31%)bolstered returns as the Texas-based power producer benefited whensecond quarter profit rose 48% as gains from price increases morethan offset the loss in customers. The biggest positive contributorto the fund’s success was an overweight position in Apple ComputerInc. (+34%). The stock continued to rise as Apple unveiled newadditions to the extremely successful iPod product line. The fund’sperformance gains were tapered back slightly as a result of notholding some financials and telecommunication stocks. The funddid not hold JPMorgan Chase & Co, Goldman Sachs Group andMerrill Lynch & Co. Inc., which returned anywhere from +28% to+50%.
While this strategy remains consistent over time, during the sixmonths ended March 31, 2006, we have increased our positionsamong paper & forest products, manufacturing, specialty retail anddrug stocks. In addition, we have decreased our positions withinapparel, metals & mining, utilities, and semiconductor stocks. Oursector and industry exposures relative to the benchmark are afunction of bottom-up stock selection.
Risky instruments have performed well across the board over recentmonths, continuing to frustrate those who, in light of increasinginterest rates and potential economic risks, are seeking a morecautious approach via larger cap equities, higher-grade bonds, andless volatile markets. But liquidity still appears plentiful, and as longas global growth maintains its healthy pace, the more exoticrecipients of global investment flows may continue to perform well.We do see potential risks in the US equity market, with narrowingmarket leadership, deteriorating breadth, and lackluster tradingvolume. If continued interest rate hikes eventually take a toll on2006 earnings expectations, which currently reflect double-digitprofits growth, the second quarter could bring a meaningfulcorrection. On the other hand, a fresh burst of equity marketexuberance would likely stretch valuations relative to rising short-term rates and higher bond yields, setting up a tricky third quarterat an awkward juncture in the four-year election cycle. Either way,outperformance from more defensive asset classes may not arriveuntil and unless equity market conditions become less hospitable.We are presently finding attractive investment opportunities inpockets of the drug, paper & forest products, travel & leisure anddefense/aerospace industries.
Ticker Symbol USBOX (Ordinary)QGIAX (Institutional)
Number of Companies 66Price to Book Ratio 2.6Price to Earnings Ratio 14.8Net Assets Under Management $61.0 Million
FUND INFORMATION
Merrill Corp - Quant Funds Quant Funds Annual Report [Funds] 03-31-2006 [AUX] | sholt | 16-May-06 22:23 | 06-6021-1.ca | Sequence: 3CHKSUM Content: 40406 Layout: 45819 Graphics: No Graphics CLEAN
JOB: 06-6021-1 CYCLE#;BL#: 8; 0 TRIM: 8.25" x 10.75" COMPOSITECOLORS: Black, PANTONE 540 U, ~note-color 2 GRAPHICS: none V1.5
6
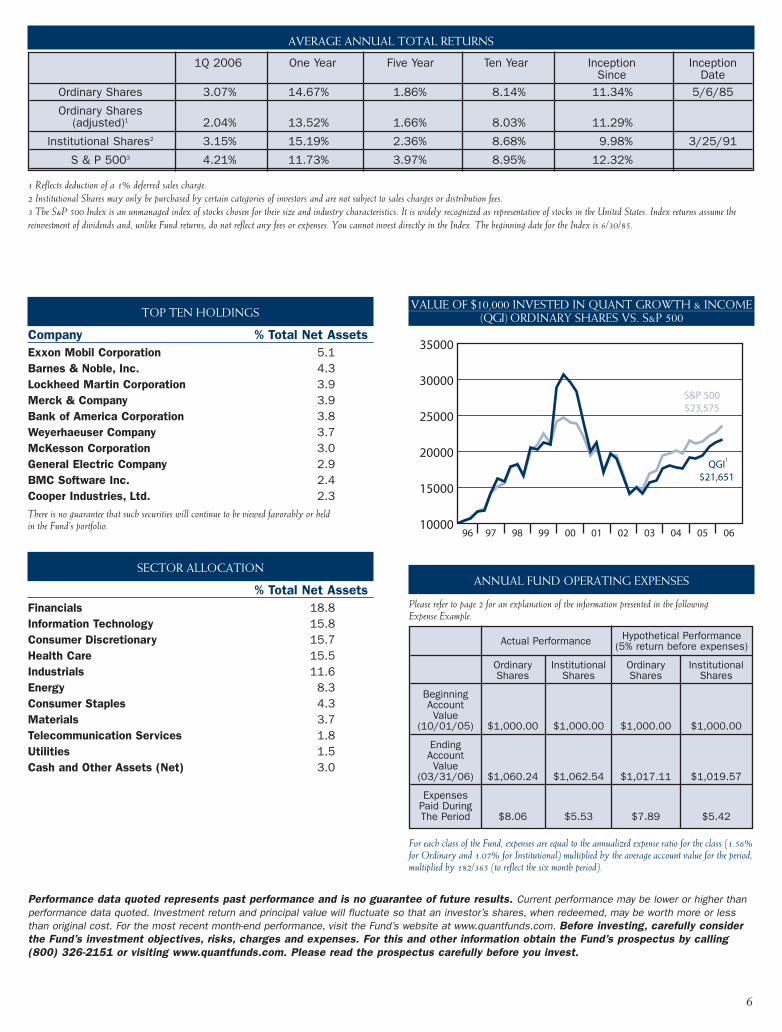
AVERAGE ANNUAL TOTAL RETURNS
1 Reflects deduction of a 1% deferred sales charge.2 Institutional Shares may only be purchased by certain categories of investors and are not subject to sales charges or distribution fees.3 The S&P 500 Index is an unmanaged index of stocks chosen for their size and industry characteristics. It is widely recognized as representative of stocks in the United States. Index returns assume thereinvestment of dividends and, unlike Fund returns, do not reflect any fees or expenses. You cannot invest directly in the Index. The beginning date for the Index is 6/30/85.
1Q 2006 One Year Five Year Ten Year Inception InceptionSince Date
Ordinary Shares 3.07% 14.67% 1.86% 8.14% 11.34% 5/6/85
Ordinary Shares(adjusted)1 2.04% 13.52% 1.66% 8.03% 11.29%
Institutional Shares2 3.15% 15.19% 2.36% 8.68% 9.98% 3/25/91
S & P 5003 4.21% 11.73% 3.97% 8.95% 12.32%
TOP TEN HOLDINGS
Company % Total Net AssetsExxon Mobil Corporation 5.1Barnes & Noble, Inc. 4.3Lockheed Martin Corporation 3.9Merck & Company 3.9Bank of America Corporation 3.8Weyerhaeuser Company 3.7McKesson Corporation 3.0General Electric Company 2.9BMC Software Inc. 2.4Cooper Industries, Ltd. 2.3There is no guarantee that such securities will continue to be viewed favorably or heldin the Fund’s portfolio.
SECTOR ALLOCATION
% Total Net AssetsFinancials 18.8Information Technology 15.8Consumer Discretionary 15.7Health Care 15.5Industrials 11.6Energy 8.3Consumer Staples 4.3Materials 3.7Telecommunication Services 1.8Utilities 1.5Cash and Other Assets (Net) 3.0
VALUE OF $10,000 INVESTED IN QUANT GROWTH & INCOME (QGI) ORDINARY SHARES VS. S&P 500
ANNUAL FUND OPERATING EXPENSES
Please refer to page 2 for an explanation of the information presented in the followingExpense Example.
For each class of the Fund, expenses are equal to the annualized expense ratio for the class (1.56%for Ordinary and 1.07% for Institutional) multiplied by the average account value for the period,multiplied by 182/365 (to reflect the six month period).
Actual Performance Hypothetical Performance (5% return before expenses)
Ordinary Institutional Ordinary Institutional Shares Shares Shares Shares
Beginning Account Value
(10/01/05) $1,000.00 $1,000.00 $1,000.00 $1,000.00
Ending Account Value
(03/31/06) $1,060.24 $1,062.54 $1,017.11 $1,019.57
Expenses Paid During The Period $8.06 $5.53 $7.89 $5.42
S&P 500$23,575
QGI$21,651
35000
30000
25000
10000060596 0403020100999897
15000
200001
Performance data quoted represents past performance and is no guarantee of future results. Current performance may be lower or higher thanperformance data quoted. Investment return and principal value will fluctuate so that an investor’s shares, when redeemed, may be worth more or lessthan original cost. For the most recent month-end performance, visit the Fund’s website at www.quantfunds.com. Before investing, carefully considerthe Fund’s investment objectives, risks, charges and expenses. For this and other information obtain the Fund’s prospectus by calling(800) 326-2151 or visiting www.quantfunds.com. Please read the prospectus carefully before you invest.
Merrill Corp - Quant Funds Quant Funds Annual Report [Funds] 03-31-2006 [AUX] | sholt | 16-May-06 22:23 | 06-6021-1.ca | Sequence: 4CHKSUM Content: 7604 Layout: 19959 Graphics: 3739 CLEAN
JOB: 06-6021-1 CYCLE#;BL#: 8; 0 TRIM: 8.25" x 10.75" COMPOSITECOLORS: Black, PANTONE 540 U, ~note-color 2 GRAPHICS: 6021-1 Gro Inc line.eps V1.5

Q U A N T E M E R G I N G M A R K E T S F U N DI N V E S T M E N T P R O F I L E A l l D a t a a s o f M a r c h 3 1 , 2 0 0 6
INVESTMENT COMMENTARY
7
The Fund’s portfolio is managed by a team of portfolio managers at Panagora Asset Management, Inc.The Fund’s co-lead portfolio managers are David P. Nolan and Brian R. Bruce.
For the fiscal year ended March 31, 2006, the Fund’s OrdinaryShares returned 46.77%, slightly underperforming its benchmark,the Morgan Stanley Emerging Markets Index, by 0.68%. Thebenchmark returned 47.45% for the same period.
Commodity prices in many different materials such as steel, cementand oil all rose dramatically during the year and the portfoliobenefitted from holding stocks in these industries. Shippingcompanies saw higher traffic, but rapidly rising fuel prices erodedprofits. Our holdings in the transportation industry were the largestdetractors from portfolio performance and contributed most to theunder performance versus the benchmark.
During the second half of the fiscal year, there were no materialchanges to the strategy or the portfolio. Over that period, we sawvery strong contributions to the Fund. We expect to see strength inthe emerging markets over the next year. The economicunderpinnings in most of these markets have continued to exhibitstrength and will continue to support stock prices in these markets.Of course, there are several global factors and events that couldinfluence the outcome in these markets including but not limited tochanges in crude oil prices, China’s economic policies, and worldwidepolitical concerns.
Rising oil prices will likely have the most impact in markets acrossthe world. The management of China’s rapidly growing economy isa concern to many markets that export to China. Loan growth inChina has grown dramatically, along with property ownershipincreasing. Creation of a real estate bubble is a major concern.Policy measures such as allowing the currency to appreciate,tightening lending control, or decreasing subsidies for things suchas exports or land and natural resources can all be used to reign ineconomic growth. Changes in these policies could have a verydifferent effect on the Chinese economy as well as its tradingpartners. Any new or expanded military or terrorist action couldimpact these markets either directly, such as it has in Egypt or moreindirectly if the price of oil is impacted by such an action.
The Asian markets have shown strength recently, and we expect thisto continue. Both Korea and Taiwan have seen a recent rise in GrossDomestic Product. In both cases the increases are both export-based as well as from internal demand. We expect to see someimpact of the instability in Israel, Egypt, and possibly Morocco if theconflicts and terror attacks increase in the Middle East. The factorsthat have produced the healthy returns in these markets are still inplace, and could support further appreciation if the conflictsdecrease.
In Latin America, we see strong fundamentals and expect to seereturns comparable to the growth in those fundamentals. The giantsin Latin America, Argentina and Brazil both look strong in terms ofinternal growth, export growth and fiscal policy.
Ticker Symbol QFFOX (Ordinary)QEMAX (Institutional)
Number of Companies 73Price to Book Ratio 2.4Price to Earnings Ratio 13.0Net Assets Under Management $145.8 Million
FUND INFORMATION
Merrill Corp - Quant Funds Quant Funds Annual Report [Funds] 03-31-2006 [AUX] | sholt | 16-May-06 22:23 | 06-6021-1.ca | Sequence: 5CHKSUM Content: 13062 Layout: 58342 Graphics: No Graphics CLEAN
JOB: 06-6021-1 CYCLE#;BL#: 8; 0 TRIM: 8.25" x 10.75" COMPOSITECOLORS: Black, PANTONE 540 U, ~note-color 2 GRAPHICS: none V1.5

8
AVERAGE ANNUAL TOTAL RETURNS
1 Reflects deduction of a 1% deferred sales charge.2 Institutional Shares may only be purchased by certain categories of investors and are not subject to sales charges or distribution fees.3 The Morgan Stanley Capital International Emerging Markets (“MSCI EM”) Index is an unmanaged index comprised of stocks located in countries other than the United States. It is widely recognizedas representative of the general market for emerging markets. Index returns assume the reinvestment of dividends and, unlike Fund returns, do not reflect fees or expenses. You cannot invest directly in anIndex. The beginning date for the Index is 6/30/85.
Investing in foreign markets, particularly emerging markets, can be more volatile than the U.S. market due to increased risks of adverseissuer, political, regulatory, market or economic developments and can perform differently than the U.S. market.
1Q 2006 One Year Five Year Ten Year Since InceptionInception Date
Ordinary Shares 14.08% 46.77% 27.32% 10.27% 7.52% 9/30/94
Ordinary Shares(adjusted)1 12.94% 45.30% 27.06% 10.16% 7.42%
Institutional Shares2 14.20% 47.39% 27.92% N/A 10.69% 4/2/96
MSCI EM3 12.12% 47.98% 23.57% 7.56% 5.28%
TOP TEN HOLDINGS
Company % Total Net AssetsSamsung Electronics Company Ltd. 3.7Taiwan Semiconductor Manufacturing Company Ltd. 3.3iShares MSCI Emerging Market Index 3.3LUKoil 3.2China Mobile Ltd. 2.8Tatneft 2.8Siliconware Precision Industries Co. 2.2Kookmin Bank 2.2Teva Pharmaceutical Industries Ltd. 2.1Petroleo Brasileiro SA 2.1There is no guarantee that such securities will continue to be viewed favorably or heldin the Fund’s portfolio.
SECTOR ALLOCATION
% Total Net AssetsSouth Korea 18.7Taiwan 13.2Brazil 12.8South Africa 10.8China 7.4Russia 5.9Mexico 4.6Israel 4.2Turkey 4.0India 4.0Hungary 2.1Thailand 1.9Philippines 1.9Poland 1.8Czech Republic 1.1Cash and Other Assets (Net) 5.6
VALUE OF $10,000 INVESTED IN QUANT EMERGING MARKETS(QEM) ORDINARY SHARES VS. MSCI EM
ANNUAL FUND OPERATING EXPENSES
Please refer to page 2 for an explanation of the information presented in the followingExpense Example.
For each class of the Fund, expenses are equal to the annualized expense ratio for the class (1.80%for Ordinary and 1.51% for Institutional) multiplied by the average account value for the period,multiplied by 182/365 (to reflect the six month period).
Actual Performance Hypothetical Performance (5% return before expenses)
Ordinary Institutional Ordinary Institutional Shares Shares Shares Shares
Beginning Account Value
(10/01/05) $1,000.00 $1,000.00 $1,000.00 $1,000.00
Ending Account Value
(03/31/06) $1,205.85 $1,207.82 $1,015.91 $1,017.37
Expenses Paid During The Period $9.95 $8.35 $9.09 $7.63
MSCI EM$21,034
QEM$26,267
30000
25000
20000
5000060596 0403020100999897
10000
15000
1
Performance data quoted represents past performance and is no guarantee of future results. Current performance may be lower or higher thanperformance data quoted. Investment return and principal value will fluctuate so that an investor’s shares, when redeemed, may be worth more or lessthan original cost. For the most recent month-end performance, visit the Fund’s website at www.quantfunds.com. Before investing, carefully considerthe Fund’s investment objectives, risks, charges and expenses. For this and other information obtain the Fund’s prospectus by calling(800) 326-2151 or visiting www.quantfunds.com. Please read the prospectus carefully before you invest.
Merrill Corp - Quant Funds Quant Funds Annual Report [Funds] 03-31-2006 [AUX] | sholt | 16-May-06 22:23 | 06-6021-1.ca | Sequence: 6CHKSUM Content: 52038 Layout: 19959 Graphics: 9688 CLEAN
JOB: 06-6021-1 CYCLE#;BL#: 8; 0 TRIM: 8.25" x 10.75" COMPOSITECOLORS: Black, PANTONE 540 U, ~note-color 2 GRAPHICS: 6021-1 Emg Mkts line.eps V1.5

Q U A N T F O R E I G N V A L U E F U N DI N V E S T M E N T P R O F I L E A l l D a t a a s o f M a r c h 3 1 , 2 0 0 6
INVESTMENT COMMENTARY
9
The Fund’s lead portfolio manager is Bernard R. Horn, Jr., of Polaris Capital Management, Inc.
For the fiscal year ended March 31, 2006, the Quant Foreign ValueFund’s Ordinary Shares achieved a total investment return of 25.3%,slightly outperforming its comparative benchmark, the MorganStanley Capital International Europe, Australasia, Far East Index(“MSCI EAFE”) which returned 24.9%. Despite the fact that foreigncurrencies were quite weak, especially during the first six months ofthe fiscal year, the Fund and the index bested the return offered bythe United States stock market by a wide margin for the fiscal year.Despite this outperformance, we believe that the promise ofinternational investing is still substantial relative to the U.S. Thelonger term performance of the Quant Foreign Value fund has beenvery strong and the comparisons relative to the benchmark remainexcellent.
The world economy has been showing growing strength with demandfrom China and other emerging economies such as India becomingan underpinning of aggregate demand. It is noteworthy that Japannow seems on a firm footing of economic recovery after many yearsof lackluster performance. The Japanese stock market representsan important part of the MSCI EAFE Index and made a goodcontribution during the fiscal year with the Nikkei 225 index returning34.5%. We have expanded our investments in Japan recently. Ourstrong positioning in materials stocks, South Africa, and inScandinavia performed well as these areas were stock marketleaders in the twelve month period. Finally, the strength of energystocks in the past year has been an important theme.
Three of our stocks in the materials sector were especially strongcontributors to the performance of the fund. South Africa miningcompany Impala Platinum was the single best stock in our portfolioin the twelve month period. This company has a thirty year productionplan to produce over 1.1 million ounces of platinum per year.Industrial demand has been growing rapidly and cash flow has beengreatly enhanced by the fact that the company is the lowest costproducer in the industry. Moreover, the safety record has beenexcellent. Cemex, a Mexican company that is one of the world’slargest producers of cement and other aggregates, was also anoutstanding contributor during the year. With operations extendingfar beyond Mexico, the company has been generating strong and
growing cash flows. BHP Billiton, based in Australia, was also anoteworthy contributor to the Fund’s strong performance. Thiscompany is the largest resource producer in the world, producingsteel making materials, copper, coal, nickel, uranium, and aluminum.The company also has a significant oil and gas exploration andproduction business. Cash flows have been growing rapidly and BHPcontinues to have a deep inventory of growth opportunities.
We have benefited substantially from our investments in the housingsector in the United Kingdom. Our holdings in Persimmon, BarrattDevelopments, and Bellway made a nice contribution to performance.Our strong Scandinavian holdings included YIT, a Finnish constructionand engineering firm, KCI Konecranes, another Finnish company thatmakes industrial cranes, and DNB NOR, a Norwegian bank. Otherindividual holdings that made a nice contribution included Showa Denko,a Japanese chemical company, Sasol, a South African energy company,and Korean stalwart electronics company Samsung Electronics.
We did have several holdings that impeded performance during theyear and we have purged several from the portfolio. These holdingsincluded Japanese internet software and services company eAccess,and UK industrial machinery company FKI. Another holding that wasan impediment was Samsung SDI, a Korean electronics equipmentmanufacturer. We are retaining this investment as we continue tosee promise.
Since our last semi-annual report we have slightly repositioned theportfolio to take advantage of better values we see throughout theworld. The most significant change in the portfolio composition wasthe increase in our allocation to Japan. Increased by about 10%, ournew investments followed a very productive research trip to Japanin February. Our new investments centered on shipping companiesand domestic consumer-oriented firms. To fund this significantincrease in Japanese investments, we cut back on many holdingswith particular emphasis in Europe and in the financial and consumerdiscretionary sectors.
The portfolio construction is a function of the bottom-up researchprocess; country and sector allocations are the result of stockselection. As a result of this process, we conclude that internationalmarkets are attractive relative to the U.S. and we see considerableopportunity in Asia, particularly in Japan where we have nowincreased our exposure considerably. We also see opportunities inLatin America and in emerging economies in Central Europe, and weintend to focus our research on these areas in coming months.
We are mindful of the effect of high oil prices on oil consumingcountries as well as the effect of higher commodity prices on theincreasingly important Chinese economy. These are risks that we willbe monitoring carefully.
Ticker Symbol QFVOX (Ordinary)QFVIX (Institutional)
Number of Companies 50Price to Book Ratio 2.4Price to Earnings Ratio 16.5Net Assets Under Management $472.6 Million
FUND INFORMATION
Merrill Corp - Quant Funds Quant Funds Annual Report [Funds] 03-31-2006 [AUX] | sholt | 16-May-06 22:23 | 06-6021-1.ca | Sequence: 7CHKSUM Content: 35970 Layout: 12595 Graphics: No Graphics CLEAN
JOB: 06-6021-1 CYCLE#;BL#: 8; 0 TRIM: 8.25" x 10.75" COMPOSITECOLORS: Black, PANTONE 540 U, ~note-color 2 GRAPHICS: none V1.5
10
AVERAGE ANNUAL TOTAL RETURNS
1 Reflects deduction of a 1% deferred sales charge.2 Institutional Shares may only be purchased by certain categories of investors and are not subject to sales charges or distribution fees.3 The Morgan Stanley Capital International Europe, Australasia, and Far East (“MSCI EAFE”) Index is an unmanaged index comprised of stocks in countries other than the United States. It is widelyrecognized as representative of the general market for foreign markets. Index returns assume the reinvestment of dividends and, unlike Fund returns, do not reflect any fees or expenses. You cannot investdirectly in an Index. The beginning date for the Index is 6/30/98.
Investing in foreign markets, particularly emerging markets, can be more volatile than the U.S. market due to increased risks of adverseissuer, political, regulatory, market or economic developments and can perform differently than the U.S. market.
1Q 2006 One Year Five Year Ten Year Since InceptionInception Date
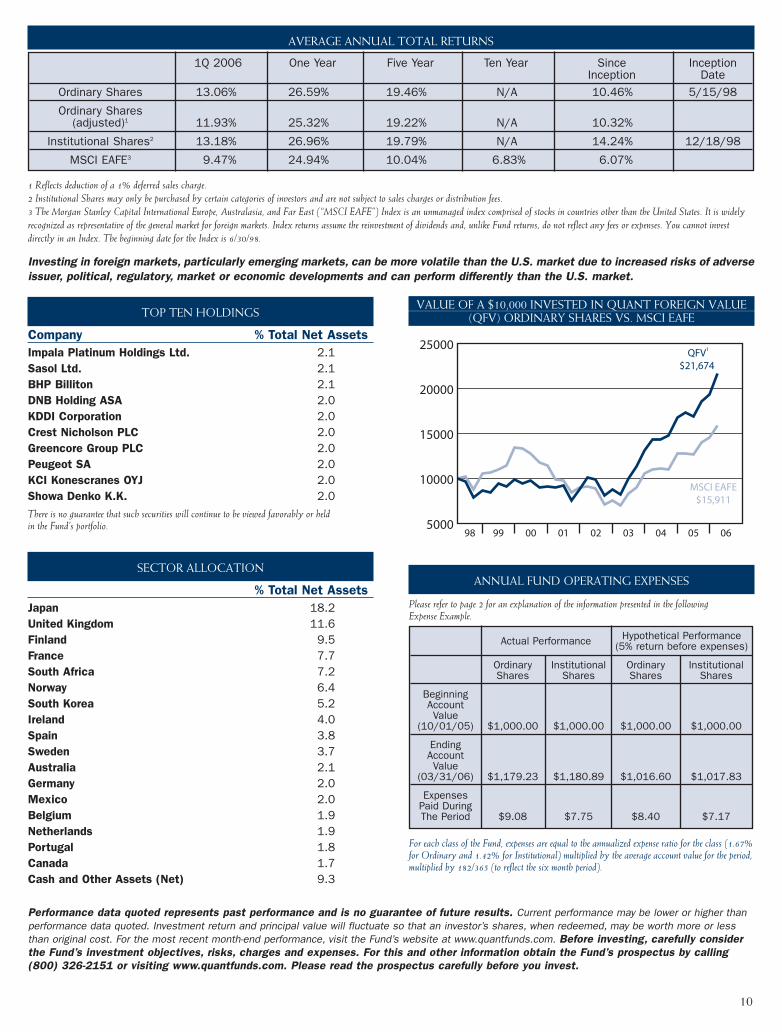
Ordinary Shares 13.06% 26.59% 19.46% N/A 10.46% 5/15/98
Ordinary Shares(adjusted)1 11.93% 25.32% 19.22% N/A 10.32%
Institutional Shares2 13.18% 26.96% 19.79% N/A 14.24% 12/18/98
MSCI EAFE3 9.47% 24.94% 10.04% 6.83% 6.07%
TOP TEN HOLDINGS
Company % Total Net AssetsImpala Platinum Holdings Ltd. 2.1Sasol Ltd. 2.1BHP Billiton 2.1DNB Holding ASA 2.0KDDI Corporation 2.0Crest Nicholson PLC 2.0Greencore Group PLC 2.0Peugeot SA 2.0KCI Konescranes OYJ 2.0Showa Denko K.K. 2.0There is no guarantee that such securities will continue to be viewed favorably or heldin the Fund’s portfolio.
SECTOR ALLOCATION
% Total Net AssetsJapan 18.2United Kingdom 11.6Finland 9.5France 7.7South Africa 7.2Norway 6.4South Korea 5.2Ireland 4.0Spain 3.8Sweden 3.7Australia 2.1Germany 2.0Mexico 2.0Belgium 1.9Netherlands 1.9Portugal 1.8Canada 1.7Cash and Other Assets (Net) 9.3
VALUE OF A $10,000 INVESTED IN QUANT FOREIGN VALUE(QFV) ORDINARY SHARES VS. MSCI EAFE
ANNUAL FUND OPERATING EXPENSES
Please refer to page 2 for an explanation of the information presented in the followingExpense Example.
For each class of the Fund, expenses are equal to the annualized expense ratio for the class (1.67%for Ordinary and 1.42% for Institutional) multiplied by the average account value for the period,multiplied by 182/365 (to reflect the six month period).
Actual Performance Hypothetical Performance (5% return before expenses)
Ordinary Institutional Ordinary Institutional Shares Shares Shares Shares
Beginning Account Value
(10/01/05) $1,000.00 $1,000.00 $1,000.00 $1,000.00
Ending Account Value
(03/31/06) $1,179.23 $1,180.89 $1,016.60 $1,017.83
Expenses Paid During The Period $9.08 $7.75 $8.40 $7.17
MSCI EAFE$15,911
QFV1
$21,674
25000
20000
5000060598 040302010099
10000
15000
Performance data quoted represents past performance and is no guarantee of future results. Current performance may be lower or higher thanperformance data quoted. Investment return and principal value will fluctuate so that an investor’s shares, when redeemed, may be worth more or lessthan original cost. For the most recent month-end performance, visit the Fund’s website at www.quantfunds.com. Before investing, carefully considerthe Fund’s investment objectives, risks, charges and expenses. For this and other information obtain the Fund’s prospectus by calling(800) 326-2151 or visiting www.quantfunds.com. Please read the prospectus carefully before you invest.
Merrill Corp - Quant Funds Quant Funds Annual Report [Funds] 03-31-2006 [AUX] | sholt | 16-May-06 22:23 | 06-6021-1.ca | Sequence: 8CHKSUM Content: 21786 Layout: 134 Graphics: 6075 CLEAN
JOB: 06-6021-1 CYCLE#;BL#: 8; 0 TRIM: 8.25" x 10.75" COMPOSITECOLORS: Black, PANTONE 540 U, ~note-color 2 GRAPHICS: 6021-1 Foreign Val line.eps V1.5
QUANT FUNDS
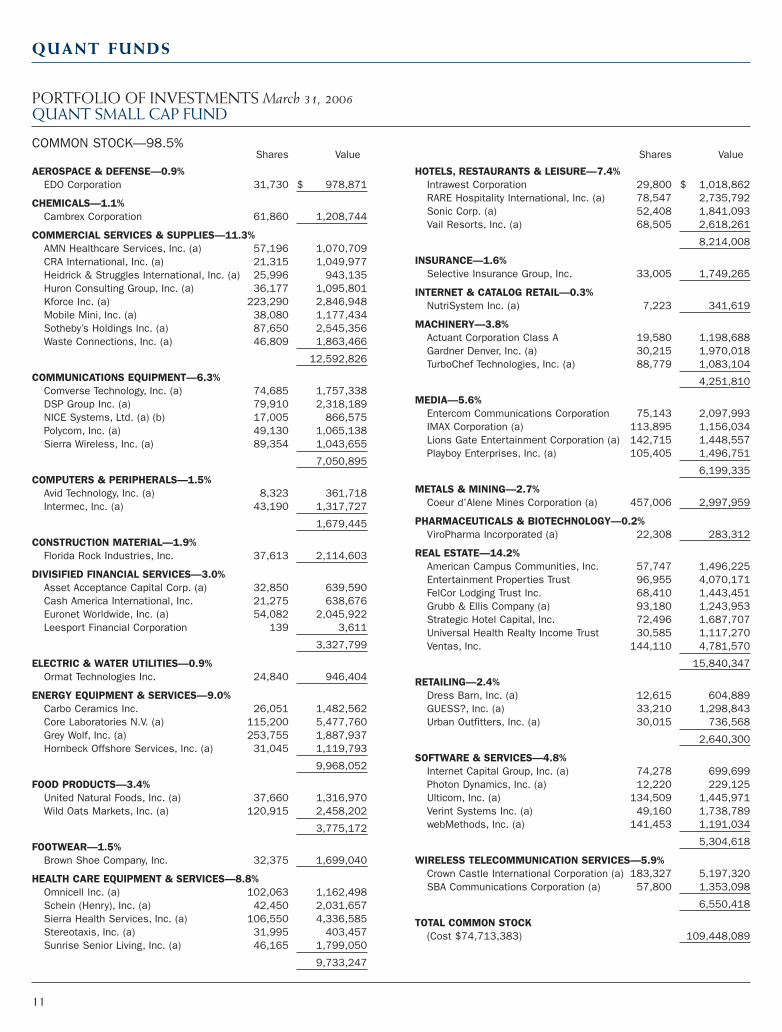
PORTFOLIO OF INVESTMENTS March 31, 2006QUANT SMALL CAP FUND
AEROSPACE & DEFENSE—0.9%EDO Corporation 31,730 $ 978,871
CHEMICALS—1.1%Cambrex Corporation 61,860 1,208,744
COMMERCIAL SERVICES & SUPPLIES—11.3%AMN Healthcare Services, Inc. (a) 57,196 1,070,709CRA International, Inc. (a) 21,315 1,049,977Heidrick & Struggles International, Inc. (a) 25,996 943,135Huron Consulting Group, Inc. (a) 36,177 1,095,801Kforce Inc. (a) 223,290 2,846,948Mobile Mini, Inc. (a) 38,080 1,177,434Sotheby’s Holdings Inc. (a) 87,650 2,545,356Waste Connections, Inc. (a) 46,809 1,863,466
12,592,826
COMMUNICATIONS EQUIPMENT—6.3%Comverse Technology, Inc. (a) 74,685 1,757,338DSP Group Inc. (a) 79,910 2,318,189NICE Systems, Ltd. (a) (b) 17,005 866,575Polycom, Inc. (a) 49,130 1,065,138Sierra Wireless, Inc. (a) 89,354 1,043,655
7,050,895
COMPUTERS & PERIPHERALS—1.5%Avid Technology, Inc. (a) 8,323 361,718Intermec, Inc. (a) 43,190 1,317,727
1,679,445
CONSTRUCTION MATERIAL—1.9%Florida Rock Industries, Inc. 37,613 2,114,603
DIVISIFIED FINANCIAL SERVICES—3.0%Asset Acceptance Capital Corp. (a) 32,850 639,590Cash America International, Inc. 21,275 638,676Euronet Worldwide, Inc. (a) 54,082 2,045,922Leesport Financial Corporation 139 3,611
3,327,799
ELECTRIC & WATER UTILITIES—0.9%Ormat Technologies Inc. 24,840 946,404
ENERGY EQUIPMENT & SERVICES—9.0%Carbo Ceramics Inc. 26,051 1,482,562Core Laboratories N.V. (a) 115,200 5,477,760Grey Wolf, Inc. (a) 253,755 1,887,937Hornbeck Offshore Services, Inc. (a) 31,045 1,119,793
9,968,052
FOOD PRODUCTS—3.4%United Natural Foods, Inc. (a) 37,660 1,316,970Wild Oats Markets, Inc. (a) 120,915 2,458,202
3,775,172
FOOTWEAR—1.5%Brown Shoe Company, Inc. 32,375 1,699,040
HEALTH CARE EQUIPMENT & SERVICES—8.8%Omnicell Inc. (a) 102,063 1,162,498Schein (Henry), Inc. (a) 42,450 2,031,657Sierra Health Services, Inc. (a) 106,550 4,336,585Stereotaxis, Inc. (a) 31,995 403,457Sunrise Senior Living, Inc. (a) 46,165 1,799,050
9,733,247
HOTELS, RESTAURANTS & LEISURE—7.4%Intrawest Corporation 29,800 $ 1,018,862RARE Hospitality International, Inc. (a) 78,547 2,735,792Sonic Corp. (a) 52,408 1,841,093Vail Resorts, Inc. (a) 68,505 2,618,261
8,214,008
INSURANCE—1.6%Selective Insurance Group, Inc. 33,005 1,749,265
INTERNET & CATALOG RETAIL—0.3%NutriSystem Inc. (a) 7,223 341,619
MACHINERY—3.8%Actuant Corporation Class A 19,580 1,198,688Gardner Denver, Inc. (a) 30,215 1,970,018TurboChef Technologies, Inc. (a) 88,779 1,083,104
4,251,810
MEDIA—5.6%Entercom Communications Corporation 75,143 2,097,993IMAX Corporation (a) 113,895 1,156,034Lions Gate Entertainment Corporation (a) 142,715 1,448,557Playboy Enterprises, Inc. (a) 105,405 1,496,751
6,199,335
METALS & MINING—2.7%Coeur d’Alene Mines Corporation (a) 457,006 2,997,959
PHARMACEUTICALS & BIOTECHNOLOGY—0.2%ViroPharma Incorporated (a) 22,308 283,312
REAL ESTATE—14.2%American Campus Communities, Inc. 57,747 1,496,225Entertainment Properties Trust 96,955 4,070,171FelCor Lodging Trust Inc. 68,410 1,443,451Grubb & Ellis Company (a) 93,180 1,243,953Strategic Hotel Capital, Inc. 72,496 1,687,707Universal Health Realty Income Trust 30,585 1,117,270Ventas, Inc. 144,110 4,781,570
15,840,347
RETAILING—2.4%Dress Barn, Inc. (a) 12,615 604,889GUESS?, Inc. (a) 33,210 1,298,843Urban Outfitters, Inc. (a) 30,015 736,568
2,640,300
SOFTWARE & SERVICES—4.8%Internet Capital Group, Inc. (a) 74,278 699,699Photon Dynamics, Inc. (a) 12,220 229,125Ulticom, Inc. (a) 134,509 1,445,971Verint Systems Inc. (a) 49,160 1,738,789webMethods, Inc. (a) 141,453 1,191,034
5,304,618
WIRELESS TELECOMMUNICATION SERVICES—5.9%Crown Castle International Corporation (a) 183,327 5,197,320SBA Communications Corporation (a) 57,800 1,353,098
6,550,418
TOTAL COMMON STOCK(Cost $74,713,383) 109,448,089
COMMON STOCK—98.5%Shares Value Shares Value
11
Merrill Corp - Quant Funds Quant Funds Annual Report [Funds] 03-31-2006 [AUX] | sholt | 16-May-06 22:23 | 06-6021-1.da | Sequence: 1CHKSUM Content: 40474 Layout: 851 Graphics: No Graphics CLEAN
JOB: 06-6021-1 CYCLE#;BL#: 8; 0 TRIM: 8.25" x 10.75" COMPOSITECOLORS: Black, PANTONE 540 U, ~note-color 2 GRAPHICS: none V1.5
QUANT FUNDS
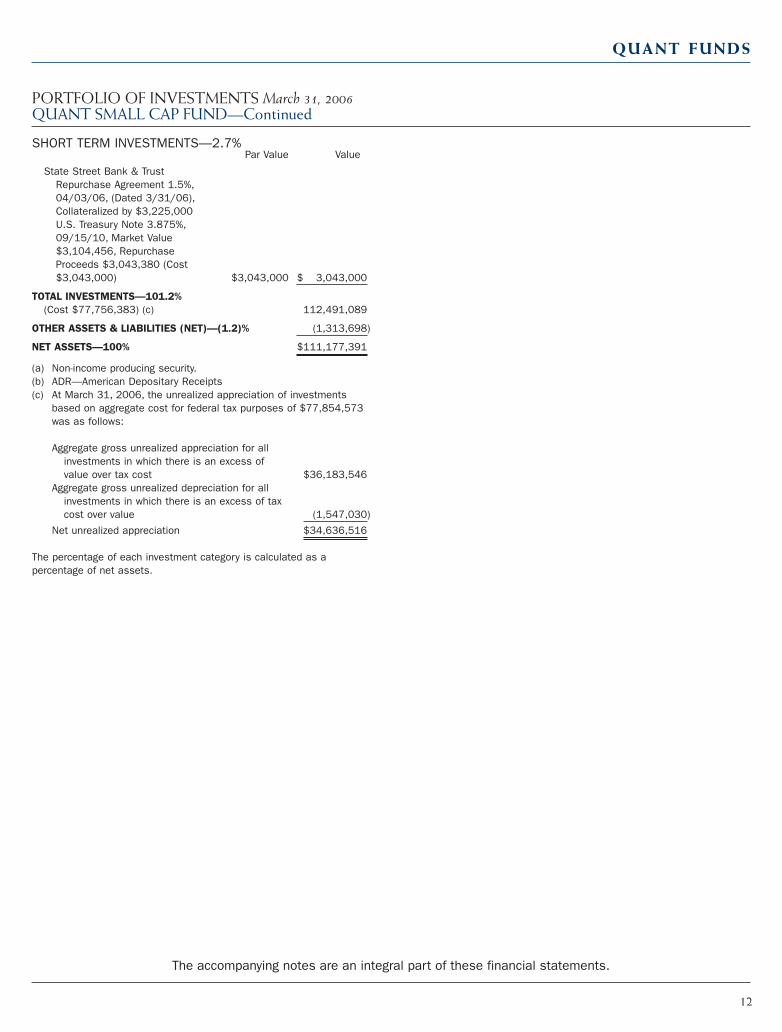
PORTFOLIO OF INVESTMENTS March 31, 2006QUANT SMALL CAP FUND—Continued
State Street Bank & TrustRepurchase Agreement 1.5%,04/03/06, (Dated 3/31/06),Collateralized by $3,225,000U.S. Treasury Note 3.875%,09/15/10, Market Value$3,104,456, RepurchaseProceeds $3,043,380 (Cost$3,043,000) $3,043,000 $ 3,043,000
TOTAL INVESTMENTS—101.2%(Cost $77,756,383) (c) 112,491,089
OTHER ASSETS & LIABILITIES (NET)—(1.2)% (1,313,698)
NET ASSETS—100% $111,177,391
(a) Non-income producing security.(b) ADR—American Depositary Receipts(c) At March 31, 2006, the unrealized appreciation of investments
based on aggregate cost for federal tax purposes of $77,854,573was as follows:
Aggregate gross unrealized appreciation for allinvestments in which there is an excess ofvalue over tax cost $36,183,546
Aggregate gross unrealized depreciation for allinvestments in which there is an excess of taxcost over value (1,547,030)
Net unrealized appreciation $34,636,516
The percentage of each investment category is calculated as apercentage of net assets.
SHORT TERM INVESTMENTS—2.7%Par Value Value
12
The accompanying notes are an integral part of these financial statements.
Merrill Corp - Quant Funds Quant Funds Annual Report [Funds] 03-31-2006 [AUX] | sholt | 16-May-06 22:23 | 06-6021-1.da | Sequence: 2CHKSUM Content: 47463 Layout: 33999 Graphics: No Graphics CLEAN
JOB: 06-6021-1 CYCLE#;BL#: 8; 0 TRIM: 8.25" x 10.75" COMPOSITECOLORS: Black, PANTONE 540 U, ~note-color 2 GRAPHICS: none V1.5
QUANT FUNDS
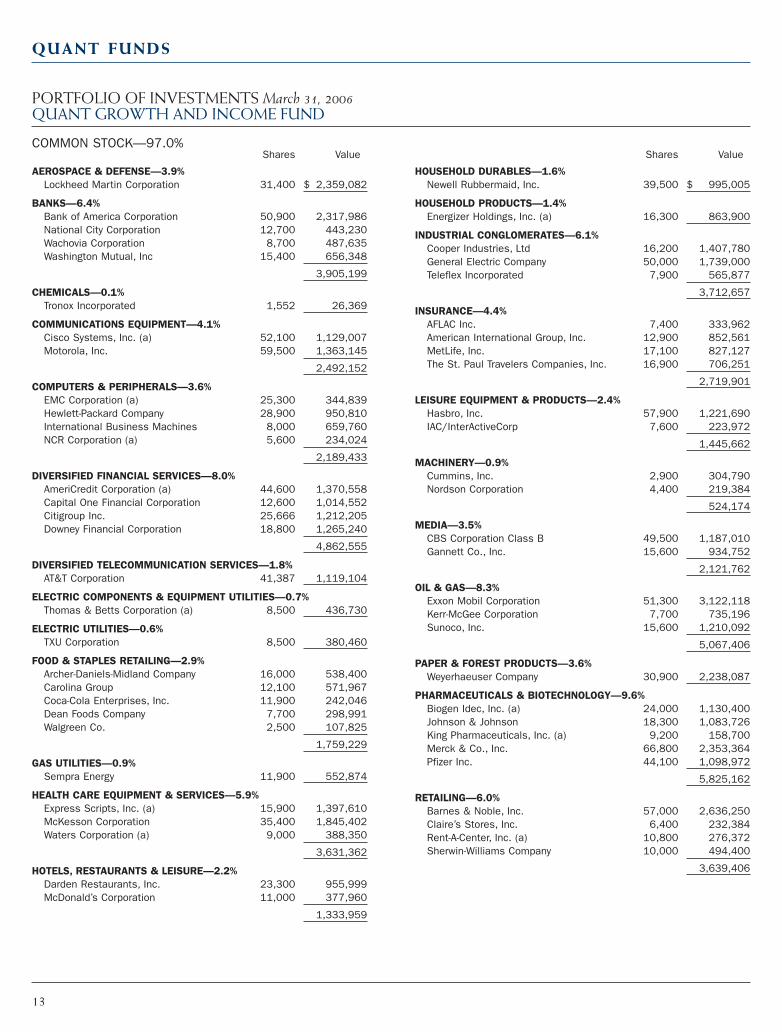
PORTFOLIO OF INVESTMENTS March 31, 2006QUANT GROWTH AND INCOME FUND
AEROSPACE & DEFENSE—3.9%Lockheed Martin Corporation 31,400 $ 2,359,082
BANKS—6.4%Bank of America Corporation 50,900 2,317,986National City Corporation 12,700 443,230Wachovia Corporation 8,700 487,635Washington Mutual, Inc 15,400 656,348
3,905,199
CHEMICALS—0.1%Tronox Incorporated 1,552 26,369
COMMUNICATIONS EQUIPMENT—4.1%Cisco Systems, Inc. (a) 52,100 1,129,007Motorola, Inc. 59,500 1,363,145
2,492,152
COMPUTERS & PERIPHERALS—3.6%EMC Corporation (a) 25,300 344,839Hewlett-Packard Company 28,900 950,810International Business Machines 8,000 659,760NCR Corporation (a) 5,600 234,024
2,189,433
DIVERSIFIED FINANCIAL SERVICES—8.0%AmeriCredit Corporation (a) 44,600 1,370,558Capital One Financial Corporation 12,600 1,014,552Citigroup Inc. 25,666 1,212,205Downey Financial Corporation 18,800 1,265,240
4,862,555
DIVERSIFIED TELECOMMUNICATION SERVICES—1.8%AT&T Corporation 41,387 1,119,104
ELECTRIC COMPONENTS & EQUIPMENT UTILITIES—0.7%Thomas & Betts Corporation (a) 8,500 436,730
ELECTRIC UTILITIES—0.6%TXU Corporation 8,500 380,460
FOOD & STAPLES RETAILING—2.9%Archer-Daniels-Midland Company 16,000 538,400Carolina Group 12,100 571,967Coca-Cola Enterprises, Inc. 11,900 242,046Dean Foods Company 7,700 298,991Walgreen Co. 2,500 107,825
1,759,229
GAS UTILITIES—0.9%Sempra Energy 11,900 552,874
HEALTH CARE EQUIPMENT & SERVICES—5.9%Express Scripts, Inc. (a) 15,900 1,397,610McKesson Corporation 35,400 1,845,402Waters Corporation (a) 9,000 388,350
3,631,362
HOTELS, RESTAURANTS & LEISURE—2.2%Darden Restaurants, Inc. 23,300 955,999McDonald’s Corporation 11,000 377,960
1,333,959
HOUSEHOLD DURABLES—1.6%Newell Rubbermaid, Inc. 39,500 $ 995,005
HOUSEHOLD PRODUCTS—1.4%Energizer Holdings, Inc. (a) 16,300 863,900
INDUSTRIAL CONGLOMERATES—6.1%Cooper Industries, Ltd 16,200 1,407,780General Electric Company 50,000 1,739,000Teleflex Incorporated 7,900 565,877
3,712,657
INSURANCE—4.4%AFLAC Inc. 7,400 333,962American International Group, Inc. 12,900 852,561MetLife, Inc. 17,100 827,127The St. Paul Travelers Companies, Inc. 16,900 706,251
2,719,901
LEISURE EQUIPMENT & PRODUCTS—2.4%Hasbro, Inc. 57,900 1,221,690IAC/InterActiveCorp 7,600 223,972
1,445,662
MACHINERY—0.9%Cummins, Inc. 2,900 304,790Nordson Corporation 4,400 219,384
524,174
MEDIA—3.5%CBS Corporation Class B 49,500 1,187,010Gannett Co., Inc. 15,600 934,752
2,121,762
OIL & GAS—8.3%Exxon Mobil Corporation 51,300 3,122,118Kerr-McGee Corporation 7,700 735,196Sunoco, Inc. 15,600 1,210,092
5,067,406
PAPER & FOREST PRODUCTS—3.6%Weyerhaeuser Company 30,900 2,238,087
PHARMACEUTICALS & BIOTECHNOLOGY—9.6%Biogen Idec, Inc. (a) 24,000 1,130,400Johnson & Johnson 18,300 1,083,726King Pharmaceuticals, Inc. (a) 9,200 158,700Merck & Co., Inc. 66,800 2,353,364Pfizer Inc. 44,100 1,098,972
5,825,162
RETAILING—6.0%Barnes & Noble, Inc. 57,000 2,636,250Claire’s Stores, Inc. 6,400 232,384Rent-A-Center, Inc. (a) 10,800 276,372Sherwin-Williams Company 10,000 494,400
3,639,406
COMMON STOCK—97.0%Shares Value Shares Value
13
Merrill Corp - Quant Funds Quant Funds Annual Report [Funds] 03-31-2006 [AUX] | sholt | 16-May-06 22:23 | 06-6021-1.da | Sequence: 3CHKSUM Content: 36145 Layout: 22720 Graphics: No Graphics CLEAN
JOB: 06-6021-1 CYCLE#;BL#: 8; 0 TRIM: 8.25" x 10.75" COMPOSITECOLORS: Black, PANTONE 540 U, ~note-color 2 GRAPHICS: none V1.5
QUANT FUNDS
PORTFOLIO OF INVESTMENTS March 31, 2006QUANT GROWTH AND INCOME FUND—Continued
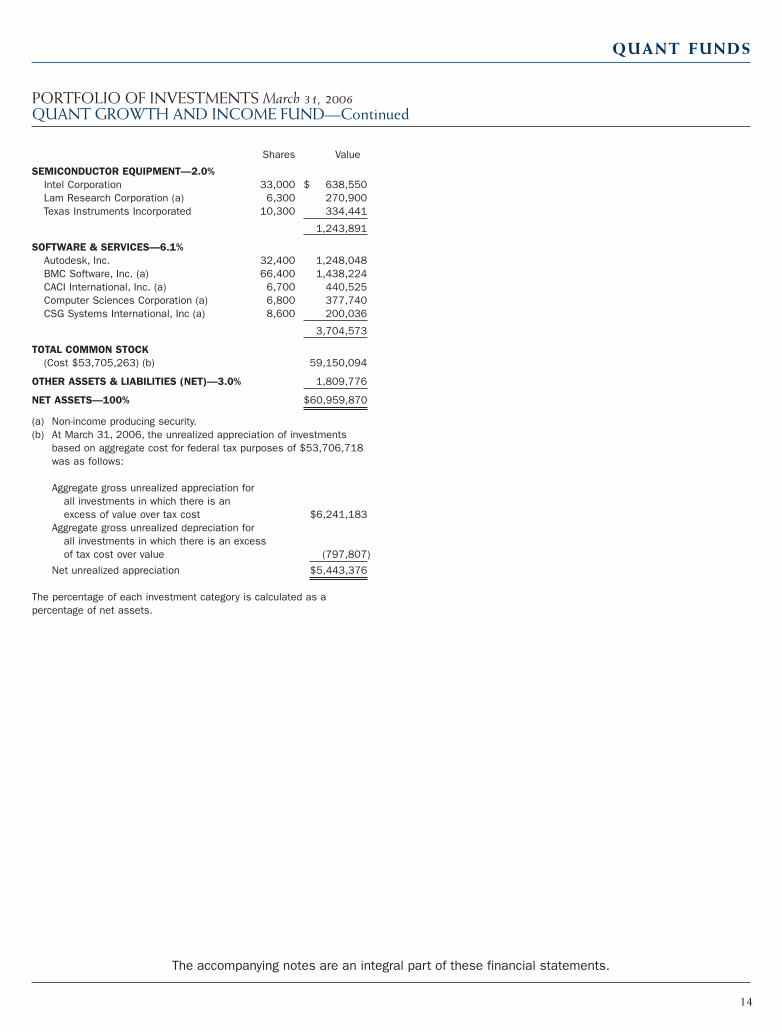
SEMICONDUCTOR EQUIPMENT—2.0%Intel Corporation 33,000 $ 638,550Lam Research Corporation (a) 6,300 270,900Texas Instruments Incorporated 10,300 334,441
1,243,891
SOFTWARE & SERVICES—6.1%Autodesk, Inc. 32,400 1,248,048BMC Software, Inc. (a) 66,400 1,438,224CACI International, Inc. (a) 6,700 440,525Computer Sciences Corporation (a) 6,800 377,740CSG Systems International, Inc (a) 8,600 200,036
3,704,573
TOTAL COMMON STOCK(Cost $53,705,263) (b) 59,150,094
OTHER ASSETS & LIABILITIES (NET)—3.0% 1,809,776
NET ASSETS—100% $60,959,870
(a) Non-income producing security.(b) At March 31, 2006, the unrealized appreciation of investments
based on aggregate cost for federal tax purposes of $53,706,718was as follows:
Aggregate gross unrealized appreciation for all investments in which there is an excess of value over tax cost $6,241,183
Aggregate gross unrealized depreciation for all investments in which there is an excess of tax cost over value (797,807)
Net unrealized appreciation $5,443,376
The percentage of each investment category is calculated as apercentage of net assets.
Shares Value
14
The accompanying notes are an integral part of these financial statements.
Merrill Corp - Quant Funds Quant Funds Annual Report [Funds] 03-31-2006 [AUX] | sholt | 16-May-06 22:23 | 06-6021-1.da | Sequence: 4CHKSUM Content: 54445 Layout: 33999 Graphics: No Graphics CLEAN
JOB: 06-6021-1 CYCLE#;BL#: 8; 0 TRIM: 8.25" x 10.75" COMPOSITECOLORS: Black, PANTONE 540 U, ~note-color 2 GRAPHICS: none V1.5
QUANT FUNDS
PORTFOLIO OF INVESTMENTS March 31, 2006QUANT EMERGING MARKETS FUND
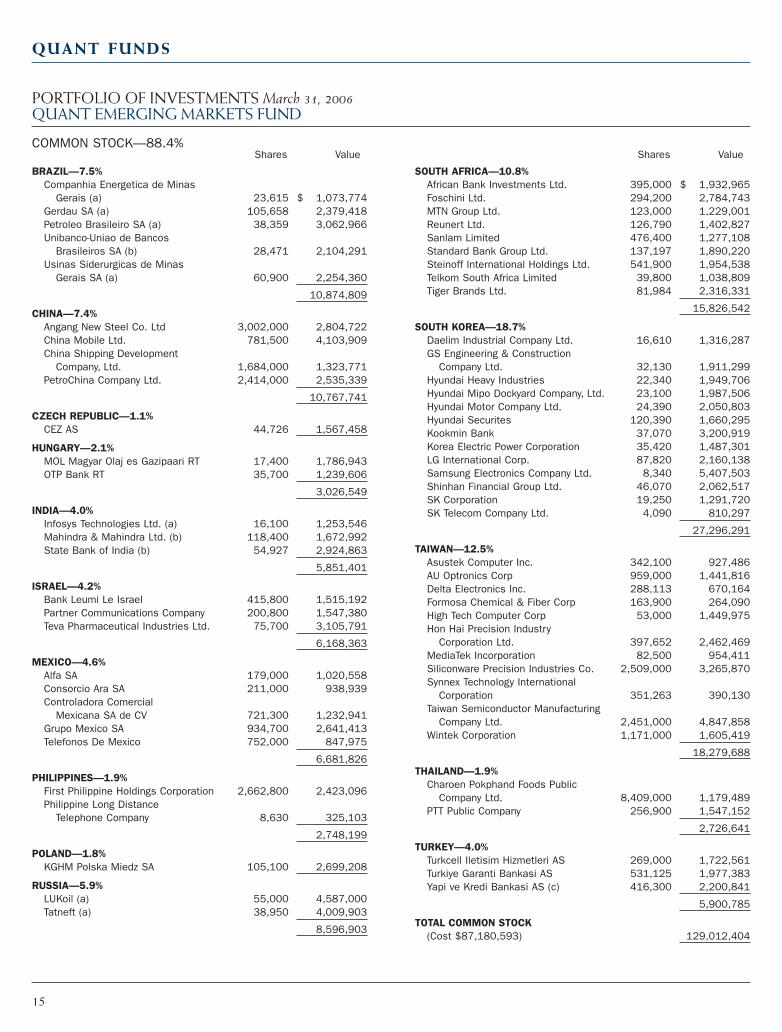
BRAZIL—7.5%Companhia Energetica de Minas
Gerais (a) 23,615 $ 1,073,774Gerdau SA (a) 105,658 2,379,418Petroleo Brasileiro SA (a) 38,359 3,062,966Unibanco-Uniao de Bancos
Brasileiros SA (b) 28,471 2,104,291Usinas Siderurgicas de Minas
Gerais SA (a) 60,900 2,254,360
10,874,809
CHINA—7.4%Angang New Steel Co. Ltd 3,002,000 2,804,722China Mobile Ltd. 781,500 4,103,909China Shipping Development
Company, Ltd. 1,684,000 1,323,771PetroChina Company Ltd. 2,414,000 2,535,339
10,767,741
CZECH REPUBLIC—1.1%CEZ AS 44,726 1,567,458
HUNGARY—2.1%MOL Magyar Olaj es Gazipaari RT 17,400 1,786,943OTP Bank RT 35,700 1,239,606
3,026,549
INDIA—4.0%Infosys Technologies Ltd. (a) 16,100 1,253,546Mahindra & Mahindra Ltd. (b) 118,400 1,672,992State Bank of India (b) 54,927 2,924,863
5,851,401
ISRAEL—4.2%Bank Leumi Le Israel 415,800 1,515,192Partner Communications Company 200,800 1,547,380Teva Pharmaceutical Industries Ltd. 75,700 3,105,791
6,168,363
MEXICO—4.6%Alfa SA 179,000 1,020,558Consorcio Ara SA 211,000 938,939Controladora Comercial
Mexicana SA de CV 721,300 1,232,941Grupo Mexico SA 934,700 2,641,413Telefonos De Mexico 752,000 847,975
6,681,826
PHILIPPINES—1.9%First Philippine Holdings Corporation 2,662,800 2,423,096Philippine Long Distance
Telephone Company 8,630 325,103
2,748,199
POLAND—1.8%KGHM Polska Miedz SA 105,100 2,699,208
RUSSIA—5.9%LUKoil (a) 55,000 4,587,000Tatneft (a) 38,950 4,009,903
8,596,903
SOUTH AFRICA—10.8%African Bank Investments Ltd. 395,000 $ 1,932,965Foschini Ltd. 294,200 2,784,743MTN Group Ltd. 123,000 1,229,001Reunert Ltd. 126,790 1,402,827Sanlam Limited 476,400 1,277,108Standard Bank Group Ltd. 137,197 1,890,220Steinoff International Holdings Ltd. 541,900 1,954,538Telkom South Africa Limited 39,800 1,038,809Tiger Brands Ltd. 81,984 2,316,331
15,826,542
SOUTH KOREA—18.7%Daelim Industrial Company Ltd. 16,610 1,316,287GS Engineering & Construction
Company Ltd. 32,130 1,911,299Hyundai Heavy Industries 22,340 1,949,706Hyundai Mipo Dockyard Company, Ltd. 23,100 1,987,506Hyundai Motor Company Ltd. 24,390 2,050,803Hyundai Securites 120,390 1,660,295Kookmin Bank 37,070 3,200,919Korea Electric Power Corporation 35,420 1,487,301LG International Corp. 87,820 2,160,138Samsung Electronics Company Ltd. 8,340 5,407,503Shinhan Financial Group Ltd. 46,070 2,062,517SK Corporation 19,250 1,291,720SK Telecom Company Ltd. 4,090 810,297
27,296,291
TAIWAN—12.5%Asustek Computer Inc. 342,100 927,486AU Optronics Corp 959,000 1,441,816Delta Electronics Inc. 288,113 670,164Formosa Chemical & Fiber Corp 163,900 264,090High Tech Computer Corp 53,000 1,449,975Hon Hai Precision Industry
Corporation Ltd. 397,652 2,462,469MediaTek Incorporation 82,500 954,411Siliconware Precision Industries Co. 2,509,000 3,265,870Synnex Technology International
Corporation 351,263 390,130Taiwan Semiconductor Manufacturing
Company Ltd. 2,451,000 4,847,858Wintek Corporation 1,171,000 1,605,419
18,279,688
THAILAND—1.9%Charoen Pokphand Foods Public
Company Ltd. 8,409,000 1,179,489PTT Public Company 256,900 1,547,152
2,726,641
TURKEY—4.0%Turkcell Iletisim Hizmetleri AS 269,000 1,722,561Turkiye Garanti Bankasi AS 531,125 1,977,383Yapi ve Kredi Bankasi AS (c) 416,300 2,200,841
5,900,785
TOTAL COMMON STOCK(Cost $87,180,593) 129,012,404
COMMON STOCK—88.4%Shares Value Shares Value
15
Merrill Corp - Quant Funds Quant Funds Annual Report [Funds] 03-31-2006 [AUX] | sholt | 16-May-06 22:23 | 06-6021-1.da | Sequence: 5CHKSUM Content: 31635 Layout: 22720 Graphics: No Graphics CLEAN
JOB: 06-6021-1 CYCLE#;BL#: 8; 0 TRIM: 8.25" x 10.75" COMPOSITECOLORS: Black, PANTONE 540 U, ~note-color 2 GRAPHICS: none V1.5

QUANT FUNDS
PORTFOLIO OF INVESTMENTS March 31, 2006QUANT EMERGING MARKETS FUND—Continued
BRAZIL—5.3%Banco Bradesco SA (a) 47,022 $ 1,688,560Braskem SA (a) 43,063 642,069CIA Vale do Rio Doce (a) 53,350 2,306,321Sadia SA (a) 43,699 1,184,680Tim Participacoes SA (a) 52,400 1,940,372
7,762,002
TOTAL PREFERRED STOCK(Cost $6,540,212) 7,762,002
EXCHANGE TRADED FUNDS—4.0%OTHER—3.3%
iShares MSCI Emerging Market Index 48,100 4,761,900TAIWAN—0.7%
iShares MSCI Taiwan Index Fund 76,000 967,480
TOTAL EXCHANGE TRADED FUNDS(Cost $5,400,420) 5,729,380
SHORT TERM INVESTMENTS—3.2%Par Value Value
State Street Bank & Trust Repurchase Agreement 1.5%,4/03/06, (Dated 3/31/06),Collateralized by $4,885,000U.S. Treasury Note 3.875%,09/15/10, Market Value$4,702,408, RepurchaseProceeds $4,606,576 (Cost$4,606,000) $4,606,000 $ 4,606,000
TOTAL INVESTMENTS—100.9%(Cost $103,727,225) (d) 147,109,786
OTHER ASSETS & LIABILITIES (NET)—(0.9)% (1,314,599)
NET ASSETS—100% $145,795,187
(a) ADR—American Depositary Receipts(b) GDR—Global Depositary Receipts(c) Non-income producing security.(d) At March 31, 2006, the unrealized appreciation of investments
based on aggregate cost for federal tax purposes of $103,728,512was as follows:
Aggregate gross unrealized appreciation for all investments in which there is an excess of value over tax cost $44,425,555
Aggregate gross unrealized depreciation for all investments in which there is an excess of tax cost over value (1,044,281)
Net unrealized appreciation $43,381,274
The percentage of each investment category is calculated as apercentage of net assets.
SECTOR ALLOCATIONS (as a percentage of Total Common, Preferred Stock,and Exchange Traded Funds)
Consumer Discretionary 6.6%Consumer Staples 4.2%Energy 13.2%Exchange Traded Funds 4.0%Financial 18.0%Health Care 2.2%Industrial 8.2%Information Technology 18.3%Material 11.2%Telecommunication Services 9.5%Utilities 4.6%
PREFERRED STOCK—5.3%Shares Value
16
The accompanying notes are an integral part of these financial statements.
Merrill Corp - Quant Funds Quant Funds Annual Report [Funds] 03-31-2006 [AUX] | sholt | 16-May-06 22:23 | 06-6021-1.da | Sequence: 6CHKSUM Content: 59718 Layout: 18369 Graphics: No Graphics CLEAN
JOB: 06-6021-1 CYCLE#;BL#: 8; 0 TRIM: 8.25" x 10.75" COMPOSITECOLORS: Black, PANTONE 540 U, ~note-color 2 GRAPHICS: none V1.5
QUANT FUNDS
PORTFOLIO OF INVESTMENTS March 31, 2006QUANT FOREIGN VALUE FUND
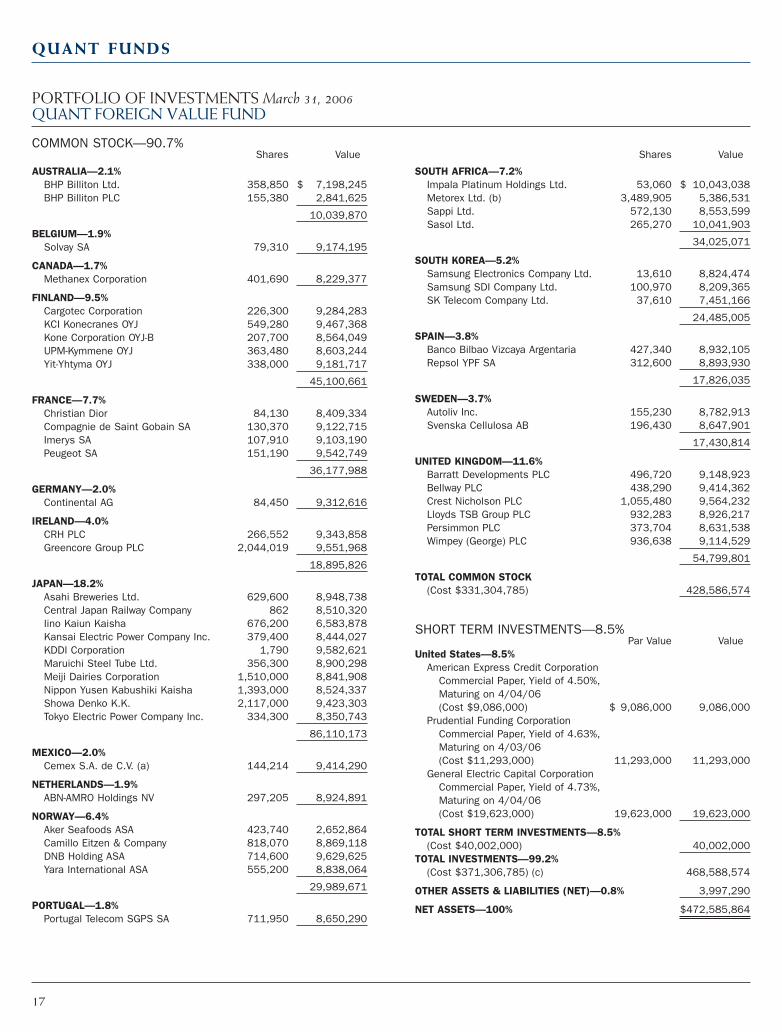
AUSTRALIA—2.1%BHP Billiton Ltd. 358,850 $ 7,198,245BHP Billiton PLC 155,380 2,841,625
10,039,870
BELGIUM—1.9%Solvay SA 79,310 9,174,195
CANADA—1.7%Methanex Corporation 401,690 8,229,377
FINLAND—9.5%Cargotec Corporation 226,300 9,284,283KCI Konecranes OYJ 549,280 9,467,368Kone Corporation OYJ-B 207,700 8,564,049UPM-Kymmene OYJ 363,480 8,603,244Yit-Yhtyma OYJ 338,000 9,181,717
45,100,661
FRANCE—7.7%Christian Dior 84,130 8,409,334Compagnie de Saint Gobain SA 130,370 9,122,715Imerys SA 107,910 9,103,190Peugeot SA 151,190 9,542,749
36,177,988
GERMANY—2.0%Continental AG 84,450 9,312,616
IRELAND—4.0%CRH PLC 266,552 9,343,858Greencore Group PLC 2,044,019 9,551,968
18,895,826
JAPAN—18.2%Asahi Breweries Ltd. 629,600 8,948,738Central Japan Railway Company 862 8,510,320Iino Kaiun Kaisha 676,200 6,583,878Kansai Electric Power Company Inc. 379,400 8,444,027KDDI Corporation 1,790 9,582,621Maruichi Steel Tube Ltd. 356,300 8,900,298Meiji Dairies Corporation 1,510,000 8,841,908Nippon Yusen Kabushiki Kaisha 1,393,000 8,524,337Showa Denko K.K. 2,117,000 9,423,303Tokyo Electric Power Company Inc. 334,300 8,350,743
86,110,173
MEXICO—2.0%Cemex S.A. de C.V. (a) 144,214 9,414,290
NETHERLANDS—1.9%ABN-AMRO Holdings NV 297,205 8,924,891
NORWAY—6.4%Aker Seafoods ASA 423,740 2,652,864Camillo Eitzen & Company 818,070 8,869,118DNB Holding ASA 714,600 9,629,625Yara International ASA 555,200 8,838,064
29,989,671
PORTUGAL—1.8%Portugal Telecom SGPS SA 711,950 8,650,290
SOUTH AFRICA—7.2%Impala Platinum Holdings Ltd. 53,060 $ 10,043,038Metorex Ltd. (b) 3,489,905 5,386,531Sappi Ltd. 572,130 8,553,599Sasol Ltd. 265,270 10,041,903
34,025,071
SOUTH KOREA—5.2%Samsung Electronics Company Ltd. 13,610 8,824,474Samsung SDI Company Ltd. 100,970 8,209,365SK Telecom Company Ltd. 37,610 7,451,166
24,485,005
SPAIN—3.8%Banco Bilbao Vizcaya Argentaria 427,340 8,932,105Repsol YPF SA 312,600 8,893,930
17,826,035
SWEDEN—3.7%Autoliv Inc. 155,230 8,782,913Svenska Cellulosa AB 196,430 8,647,901
17,430,814
UNITED KINGDOM—11.6%Barratt Developments PLC 496,720 9,148,923Bellway PLC 438,290 9,414,362Crest Nicholson PLC 1,055,480 9,564,232Lloyds TSB Group PLC 932,283 8,926,217Persimmon PLC 373,704 8,631,538Wimpey (George) PLC 936,638 9,114,529
54,799,801
TOTAL COMMON STOCK(Cost $331,304,785) 428,586,574
SHORT TERM INVESTMENTS—8.5%Par Value Value
United States—8.5%American Express Credit Corporation
Commercial Paper, Yield of 4.50%,Maturing on 4/04/06 (Cost $9,086,000) $ 9,086,000 9,086,000
Prudential Funding CorporationCommercial Paper, Yield of 4.63%,Maturing on 4/03/06(Cost $11,293,000) 11,293,000 11,293,000
General Electric Capital CorporationCommercial Paper, Yield of 4.73%,Maturing on 4/04/06(Cost $19,623,000) 19,623,000 19,623,000
TOTAL SHORT TERM INVESTMENTS—8.5%(Cost $40,002,000) 40,002,000
TOTAL INVESTMENTS—99.2%(Cost $371,306,785) (c) 468,588,574
OTHER ASSETS & LIABILITIES (NET)—0.8% 3,997,290
NET ASSETS—100% $472,585,864
COMMON STOCK—90.7%Shares Value Shares Value
17
Merrill Corp - Quant Funds Quant Funds Annual Report [Funds] 03-31-2006 [AUX] | sholt | 16-May-06 22:23 | 06-6021-1.da | Sequence: 7CHKSUM Content: 11343 Layout: 29905 Graphics: No Graphics CLEAN
JOB: 06-6021-1 CYCLE#;BL#: 8; 0 TRIM: 8.25" x 10.75" COMPOSITECOLORS: Black, PANTONE 540 U, ~note-color 2 GRAPHICS: none V1.5
QUANT FUNDS
PORTFOLIO OF INVESTMENTS March 31, 2006QUANT FOREIGN VALUE FUND—Continued
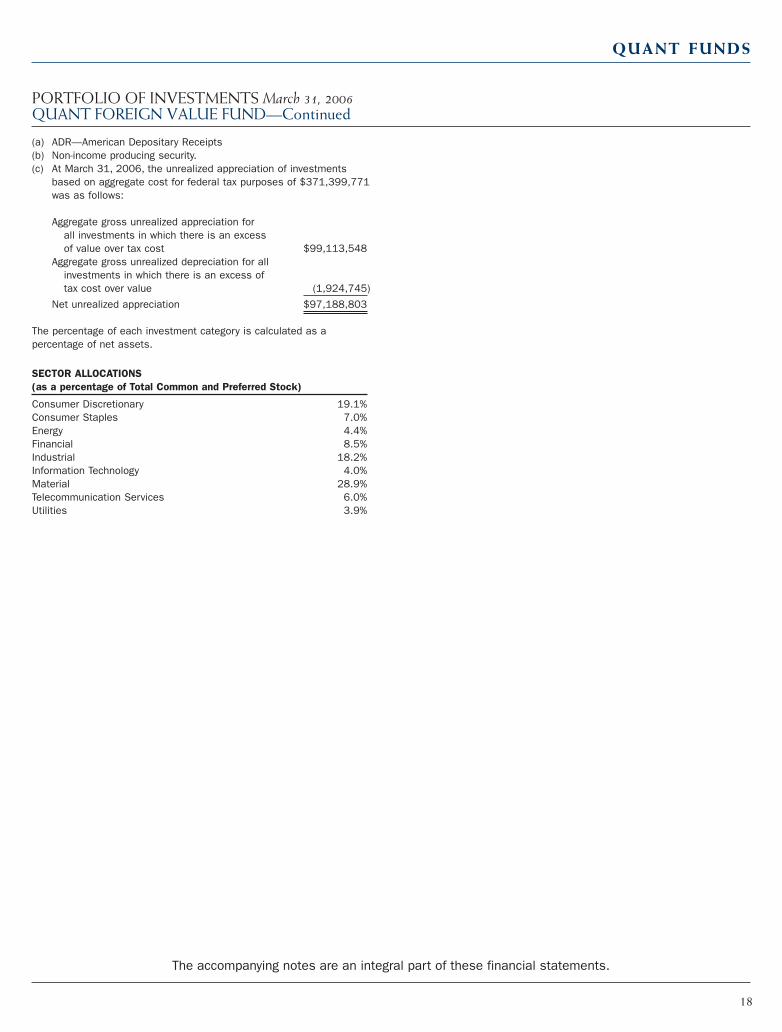
(a) ADR—American Depositary Receipts(b) Non-income producing security.(c) At March 31, 2006, the unrealized appreciation of investments
based on aggregate cost for federal tax purposes of $371,399,771was as follows:
Aggregate gross unrealized appreciation for all investments in which there is an excess of value over tax cost $99,113,548
Aggregate gross unrealized depreciation for all investments in which there is an excess of tax cost over value (1,924,745)
Net unrealized appreciation $97,188,803
The percentage of each investment category is calculated as apercentage of net assets.
SECTOR ALLOCATIONS (as a percentage of Total Common and Preferred Stock)
Consumer Discretionary 19.1%Consumer Staples 7.0%Energy 4.4%Financial 8.5%Industrial 18.2%Information Technology 4.0%Material 28.9%Telecommunication Services 6.0%Utilities 3.9%
18
The accompanying notes are an integral part of these financial statements.
Merrill Corp - Quant Funds Quant Funds Annual Report [Funds] 03-31-2006 [AUX] | sholt | 16-May-06 22:23 | 06-6021-1.da | Sequence: 8CHKSUM Content: 36485 Layout: 29390 Graphics: No Graphics CLEAN
JOB: 06-6021-1 CYCLE#;BL#: 8; 0 TRIM: 8.25" x 10.75" COMPOSITECOLORS: Black, PANTONE 540 U, ~note-color 2 GRAPHICS: none V1.5

STATEMENT OF ASSETS AND LIABILITIES March 31, 2006
Growth and Emerging ForeignSmall Cap Income Markets Value
Assets:Investments at value (Note 2) $109,448,089 $ 59,150,094 $142,503,786 $468,588,574Repurchase Agreements 3,043,000 — 4,606,000 —Foreign currency at value (Cost $255,349 for Emerging Markets
and $1,326,970 for Foreign Value) — — 254,783 1,329,932Cash 436 1,812,390 1,848 65,050Dividends, interest and foreign tax reclaims receivable 94,707 58,424 454,433 1,952,991Receivable for investments sold — — — 606,771Receivable for shares of beneficial interest sold 7,053 21,121 539,204 2,736,559Other assets 13,863 7,527 7,238 22,387
Total assets 112,607,148 61,049,556 148,367,292 475,302,264
Liabilities:Payable for investments purchased 1,249,960 — 2,152,837 1,888,248Payable for shares of beneficial interest repurchased 6,061 — 55,765 160,427Payable for compensation of Manager (Note 3) 91,621 38,753 115,883 372,388Payable for distribution fees (Note 3) 40,760 25,415 28,616 86,682Payable to custodian 3,927 203 17,912 31,646Payable to transfer agent (Note 3) 16,004 11,637 18,251 66,560Payable for foreign capital gain tax — — 143,874 —Other accrued expenses 21,424 13,678 38,967 110,449
Total liabilities 1,429,757 89,686 2,572,105 2,716,400
Net assets $111,177,391 $ 60,959,870 $145,795,187 $472,585,864
Net Assets consist of:Shares of beneficial interest $ 72,630,184 $ 59,083,313 $ 98,238,494 $345,920,775Undistributed net investment income — 117,007 621,680 2,242,437Accumulated net realized gain/(loss) on investments and
foreign denominated assets, liabilities and currency 3,812,501 (3,685,281) 3,687,371 27,133,520Unrealized appreciation/(depreciation) of investments
and foreign denominated assets, liabilities and currency 34,734,706 5,444,831 43,247,642* 97,289,132
Net assets $111,177,391 $ 60,959,870 $145,795,187 $472,585,864
Investments, at cost $ 77,756,383 $ 53,705,263 $103,727,225 $371,306,785
Net assetsOrdinary Shares $ 98,879,361 $ 59,975,554 $144,088,429 $441,614,059Institutional Shares $ 12,298,030 $ 984,316 $ 1,706,758 $ 30,971,805
Shares of beneficial interest outstanding (Unlimited number of shares authorized)
Ordinary Shares 4,300,874 4,064,335 7,259,027 22,175,000Institutional Shares 484,270 63,908 84,889 1,548,108
Net asset value and offering price per share**Ordinary Shares $ 22.99 $ 14.76 $ 19.85 $ 19.91Institutional Shares $ 25.39 $ 15.40 $ 20.11 $ 20.01
* Net of foreign capital gain tax of $143,874.** A deferred sales charge amounting to 1% of the net asset value of the Ordinary Shares redeemed is withheld and paid to the Distributor. No deferred
sales charge is withheld from redemptions of the Institutional Shares. A redemption fee of 2% is withheld and paid to the Fund on redemptions ofInstitutional Shares made within 60 days of purchase.
19
The accompanying notes are an integral part of these financial statements.
QUANT FUNDS
Merrill Corp - Quant Funds Quant Funds Annual Report [Funds] 03-31-2006 [AUX] | sholt | 16-May-06 22:24 | 06-6021-1.ea | Sequence: 1CHKSUM Content: 47426 Layout: 5208 Graphics: No Graphics CLEAN
JOB: 06-6021-1 CYCLE#;BL#: 8; 0 TRIM: 8.25" x 10.75" COMPOSITECOLORS: Black, PANTONE 540 U, ~note-color 2 GRAPHICS: none V1.5
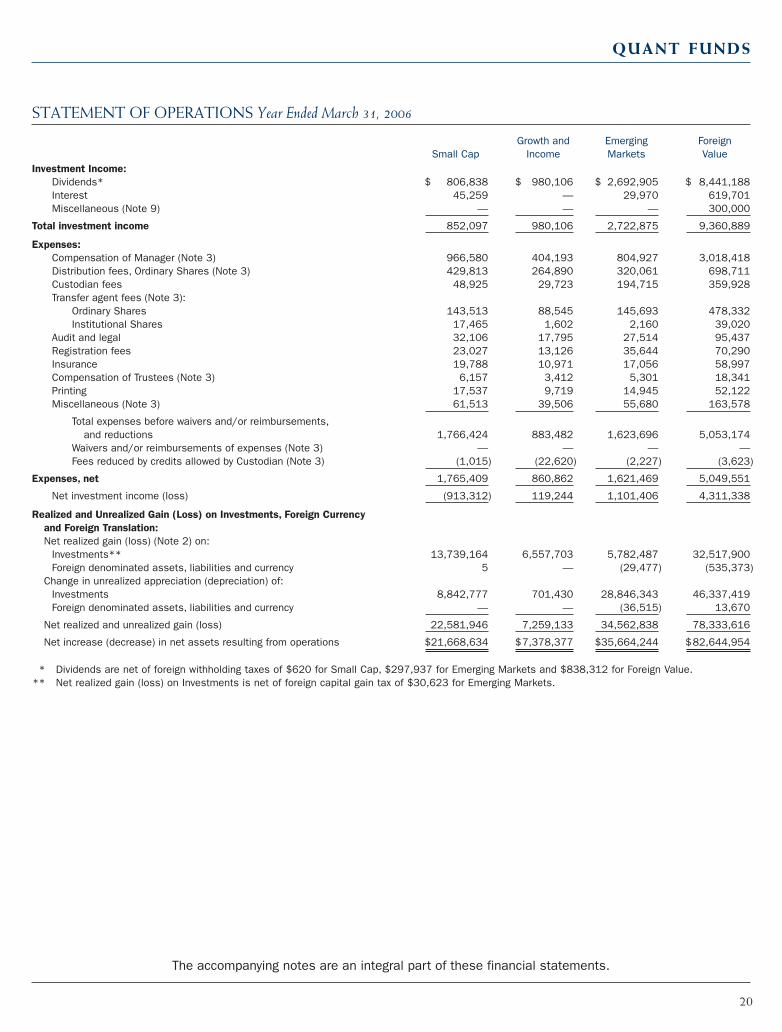
STATEMENT OF OPERATIONS Year Ended March 31, 2006
Growth and Emerging ForeignSmall Cap Income Markets Value
Investment Income:Dividends* $ 806,838 $ 980,106 $ 2,692,905 $ 8,441,188Interest 45,259 — 29,970 619,701Miscellaneous (Note 9) — — — 300,000
Total investment income 852,097 980,106 2,722,875 9,360,889
Expenses:Compensation of Manager (Note 3) 966,580 404,193 804,927 3,018,418Distribution fees, Ordinary Shares (Note 3) 429,813 264,890 320,061 698,711Custodian fees 48,925 29,723 194,715 359,928Transfer agent fees (Note 3):
Ordinary Shares 143,513 88,545 145,693 478,332Institutional Shares 17,465 1,602 2,160 39,020
Audit and legal 32,106 17,795 27,514 95,437Registration fees 23,027 13,126 35,644 70,290Insurance 19,788 10,971 17,056 58,997Compensation of Trustees (Note 3) 6,157 3,412 5,301 18,341Printing 17,537 9,719 14,945 52,122Miscellaneous (Note 3) 61,513 39,506 55,680 163,578
Total expenses before waivers and/or reimbursements,and reductions 1,766,424 883,482 1,623,696 5,053,174
Waivers and/or reimbursements of expenses (Note 3) — — — —Fees reduced by credits allowed by Custodian (Note 3) (1,015) (22,620) (2,227) (3,623)
Expenses, net 1,765,409 860,862 1,621,469 5,049,551
Net investment income (loss) (913,312) 119,244 1,101,406 4,311,338
Realized and Unrealized Gain (Loss) on Investments, Foreign Currency and Foreign Translation:Net realized gain (loss) (Note 2) on:
Investments** 13,739,164 6,557,703 5,782,487 32,517,900Foreign denominated assets, liabilities and currency 5 — (29,477) (535,373)
Change in unrealized appreciation (depreciation) of:Investments 8,842,777 701,430 28,846,343 46,337,419Foreign denominated assets, liabilities and currency — — (36,515) 13,670
Net realized and unrealized gain (loss) 22,581,946 7,259,133 34,562,838 78,333,616
Net increase (decrease) in net assets resulting from operations $21,668,634 $7,378,377 $35,664,244 $82,644,954
* Dividends are net of foreign withholding taxes of $620 for Small Cap, $297,937 for Emerging Markets and $838,312 for Foreign Value.** Net realized gain (loss) on Investments is net of foreign capital gain tax of $30,623 for Emerging Markets.
20
The accompanying notes are an integral part of these financial statements.
QUANT FUNDS
Merrill Corp - Quant Funds Quant Funds Annual Report [Funds] 03-31-2006 [AUX] | sholt | 16-May-06 22:24 | 06-6021-1.ea | Sequence: 2CHKSUM Content: 19352 Layout: 52247 Graphics: No Graphics CLEAN
JOB: 06-6021-1 CYCLE#;BL#: 8; 0 TRIM: 8.25" x 10.75" COMPOSITECOLORS: Black, PANTONE 540 U, ~note-color 2 GRAPHICS: none V1.5
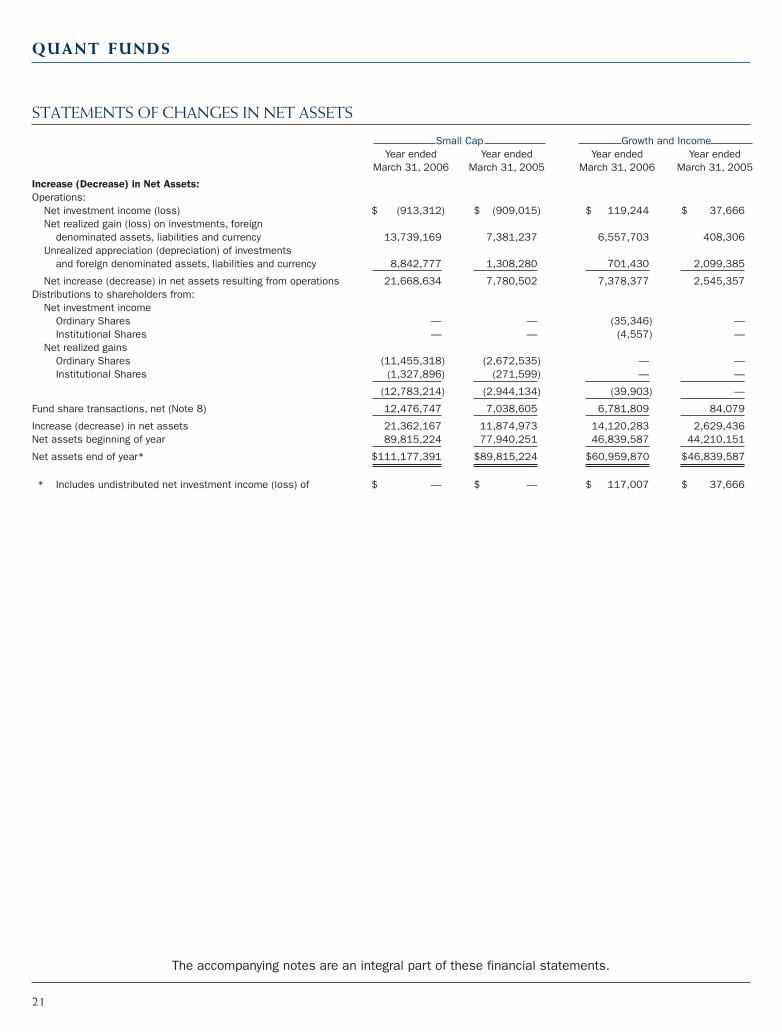
STATEMENTS OF CHANGES IN NET ASSETS
Small Cap Growth and IncomeYear ended Year ended Year ended Year ended
March 31, 2006 March 31, 2005 March 31, 2006 March 31, 2005
Increase (Decrease) in Net Assets:Operations:
Net investment income (loss) $ (913,312) $ (909,015) $ 119,244 $ 37,666Net realized gain (loss) on investments, foreign
denominated assets, liabilities and currency 13,739,169 7,381,237 6,557,703 408,306Unrealized appreciation (depreciation) of investments
and foreign denominated assets, liabilities and currency 8,842,777 1,308,280 701,430 2,099,385
Net increase (decrease) in net assets resulting from operations 21,668,634 7,780,502 7,378,377 2,545,357Distributions to shareholders from:
Net investment incomeOrdinary Shares — — (35,346) —Institutional Shares — — (4,557) —
Net realized gainsOrdinary Shares (11,455,318) (2,672,535) — —Institutional Shares (1,327,896) (271,599) — —
(12,783,214) (2,944,134) (39,903) —
Fund share transactions, net (Note 8) 12,476,747 7,038,605 6,781,809 84,079
Increase (decrease) in net assets 21,362,167 11,874,973 14,120,283 2,629,436Net assets beginning of year 89,815,224 77,940,251 46,839,587 44,210,151
Net assets end of year* $111,177,391 $89,815,224 $60,959,870 $46,839,587
* Includes undistributed net investment income (loss) of $ — $ — $ 117,007 $ 37,666
21
The accompanying notes are an integral part of these financial statements.
QUANT FUNDS
Merrill Corp - Quant Funds Quant Funds Annual Report [Funds] 03-31-2006 [AUX] | sholt | 16-May-06 22:24 | 06-6021-1.ea | Sequence: 3CHKSUM Content: 51911 Layout: 16204 Graphics: No Graphics CLEAN
JOB: 06-6021-1 CYCLE#;BL#: 8; 0 TRIM: 8.25" x 10.75" COMPOSITECOLORS: Black, PANTONE 540 U, ~note-color 2 GRAPHICS: none V1.5
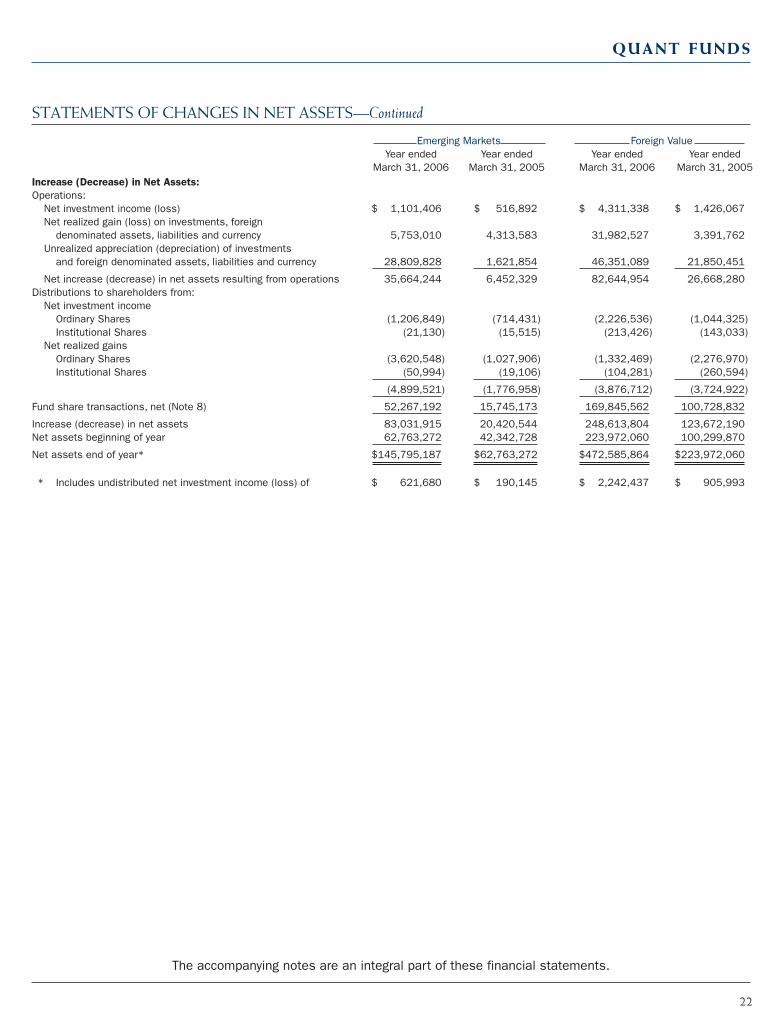
Emerging Markets Foreign ValueYear ended Year ended Year ended Year ended
March 31, 2006 March 31, 2005 March 31, 2006 March 31, 2005Increase (Decrease) in Net Assets:Operations:
Net investment income (loss) $ 1,101,406 $ 516,892 $ 4,311,338 $ 1,426,067Net realized gain (loss) on investments, foreign
denominated assets, liabilities and currency 5,753,010 4,313,583 31,982,527 3,391,762Unrealized appreciation (depreciation) of investments
and foreign denominated assets, liabilities and currency 28,809,828 1,621,854 46,351,089 21,850,451
Net increase (decrease) in net assets resulting from operations 35,664,244 6,452,329 82,644,954 26,668,280Distributions to shareholders from:
Net investment incomeOrdinary Shares (1,206,849) (714,431) (2,226,536) (1,044,325)Institutional Shares (21,130) (15,515) (213,426) (143,033)
Net realized gainsOrdinary Shares (3,620,548) (1,027,906) (1,332,469) (2,276,970)Institutional Shares (50,994) (19,106) (104,281) (260,594)
(4,899,521) (1,776,958) (3,876,712) (3,724,922)
Fund share transactions, net (Note 8) 52,267,192 15,745,173 169,845,562 100,728,832
Increase (decrease) in net assets 83,031,915 20,420,544 248,613,804 123,672,190Net assets beginning of year 62,763,272 42,342,728 223,972,060 100,299,870
Net assets end of year* $145,795,187 $62,763,272 $472,585,864 $223,972,060
* Includes undistributed net investment income (loss) of $ 621,680 $ 190,145 $ 2,242,437 $ 905,993
22
The accompanying notes are an integral part of these financial statements.
QUANT FUNDS
STATEMENTS OF CHANGES IN NET ASSETS—Continued
Merrill Corp - Quant Funds Quant Funds Annual Report [Funds] 03-31-2006 [AUX] | sholt | 16-May-06 22:24 | 06-6021-1.ea | Sequence: 4CHKSUM Content: 7832 Layout: 5808 Graphics: No Graphics CLEAN
JOB: 06-6021-1 CYCLE#;BL#: 8; 0 TRIM: 8.25" x 10.75" COMPOSITECOLORS: Black, PANTONE 540 U, ~note-color 2 GRAPHICS: none V1.5

FINANCIAL HIGHLIGHTS FOR QUANT SMALL CAP FUND(For a share outstanding throughout each period)
Ordinary Shares
Years Ended March 31,2006 2005 2004 2003 2002
Net Asset Value, Beginning of Period $ 21.13 $ 19.93 $ 12.44 $ 18.71 $ 17.46
Income from Investment Operations:Net investment income (loss) (a)(b)(c) (0.22) (0.24) (0.19) (0.12) (0.22)Net realized and unrealized gain/(loss) on securities 5.16 2.18 7.68 (5.32) 1.48
Total from Investment Operations 4.94 1.94 7.49 (5.44) 1.26
Less Distributions:Dividends from net investment income — — — — —Distributions from realized capital gains (3.08) (0.74) — (0.83) (0.01)
Total Distributions (3.08) (0.74) — (0.83) (0.01)
Net Asset Value, End of Period $ 22.99 $ 21.13 $ 19.93 $ 12.44 $ 18.71
Total Return (d) 24.51% 9.76% 60.21% (29.24)% 7.19%
Net Assets, End of Period (000’s) $98,879 $80,199 $69,851 $42,545 $65,153
Ratios and Supplemental Data:Ratios of expenses to average net assets: (e)
Excluding credits 1.88% 1.98% 2.00% 2.04% 1.97%Gross 1.88% 1.98% 2.00% 2.04% 1.97%Including custody credits 1.88% 1.98% 2.00% 2.04% 1.96%
Ratio of net investment income (loss) to average net assets (c) (1.00)% (1.17)% (1.13)% (0.81)% (1.18)%
Portfolio Turnover 57% 43% 67% 62% 93%
Institutional Shares
Years Ended March 31,2006 2005 2004 2003 2002
Net Asset Value, Beginning of Period $ 22.96 $ 21.48 $ 13.34 $ 19.88 $ 18.46
Income from Investment Operations:Net investment income (loss) (a)(b)(c) (0.12) (0.14) (0.11) (0.05) (0.14)Net realized and unrealized gain/(loss) on securities 5.63 2.36 8.25 (5.66) 1.57
Total from Investment Operations 5.51 2.22 8.14 (5.71) 1.43
Less Distributions:Dividends from net investment income — — — — —Distributions from realized capital gains (3.08) (0.74) — (0.83) (0.01)
Total Distributions (3.08) (0.74) — (0.83) (0.01)
Net Asset Value, End of Period $ 25.39 $ 22.96 $ 21.48 $ 13.34 $ 19.88
Total Return (d) 25.06% 10.37% 61.02% (28.87)% 7.72%
Net Assets, End of Period (000’s) $12,298 $ 9,616 $ 8,089 $ 5,459 $ 7,712
Ratios and Supplemental Data:Ratios of expenses to average net assets: (e)
Excluding credits 1.38% 1.48% 1.50% 1.54% 1.47%Gross 1.38% 1.48% 1.50% 1.54% 1.47%Including custody credits 1.38% 1.48% 1.50% 1.54% 1.46%
Ratio of net investment income (loss) to average net assets (c) (0.50)% (0.65)% (0.63)% (0.31)% (0.69)%
Portfolio Turnover 57% 43% 67% 62% 93%
(a) Per share numbers have been calculated using the average shares method.(b) Reflects expense waivers/reimbursements and reductions in effect during the period. See Note 3 to the Financial Statements.(c) Net investment income (loss) per share and the ratio of net investment income (loss) to average net assets reflect net investment income prior to
certain reclassifications for federal income or excise taxes.(d) Total Return does not include the deferred sales charge of 1% for the Ordinary Shares. The total return would have been lower if certain fees had not
been waived or if custodial fees had not been reduced by credits allowed by the custodian. See Note 3 to the financial statements.(e) Ratios of expenses to average net assets shows:
— Excluding Credits (total expenses less fee waivers and reimbursements by the investment advisor, if any).— Gross (total expenses not taking into account fee waivers and reimbursements by the investment advisor or custody earnings credits, if any).— Including Credits (expenses less fee waivers and reimbursements by the investment advisor and reduced by custody earnings credits, if any).
23
The accompanying notes are an integral part of these financial statements.
QUANT FUNDS
Merrill Corp - Quant Funds Quant Funds Annual Report [Funds] 03-31-2006 [AUX] | sholt | 16-May-06 22:24 | 06-6021-1.ea | Sequence: 5CHKSUM Content: 48132 Layout: 29677 Graphics: No Graphics CLEAN
JOB: 06-6021-1 CYCLE#;BL#: 8; 0 TRIM: 8.25" x 10.75" COMPOSITECOLORS: Black, PANTONE 540 U, ~note-color 2 GRAPHICS: none V1.5
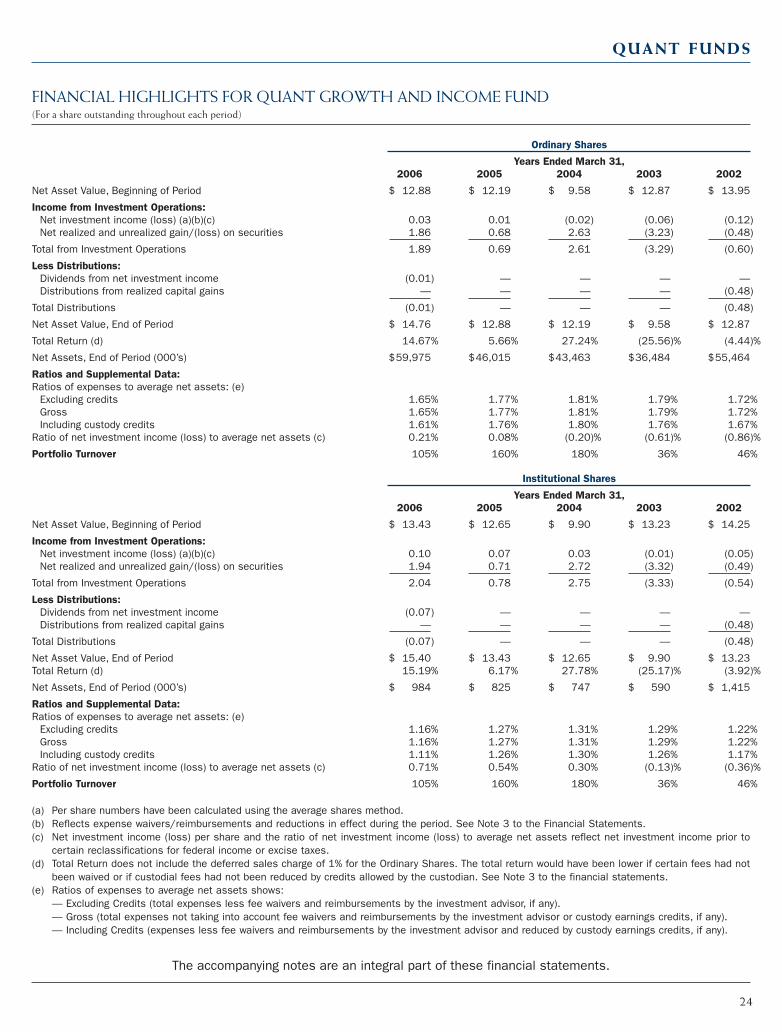
FINANCIAL HIGHLIGHTS FOR QUANT GROWTH AND INCOME FUND(For a share outstanding throughout each period)
Ordinary Shares
Years Ended March 31,2006 2005 2004 2003 2002
Net Asset Value, Beginning of Period $ 12.88 $ 12.19 $ 9.58 $ 12.87 $ 13.95
Income from Investment Operations:Net investment income (loss) (a)(b)(c) 0.03 0.01 (0.02) (0.06) (0.12)Net realized and unrealized gain/(loss) on securities 1.86 0.68 2.63 (3.23) (0.48)
Total from Investment Operations 1.89 0.69 2.61 (3.29) (0.60)
Less Distributions:Dividends from net investment income (0.01) — — — —Distributions from realized capital gains — — — — (0.48)
Total Distributions (0.01) — — — (0.48)
Net Asset Value, End of Period $ 14.76 $ 12.88 $ 12.19 $ 9.58 $ 12.87
Total Return (d) 14.67% 5.66% 27.24% (25.56)% (4.44)%
Net Assets, End of Period (000’s) $59,975 $46,015 $43,463 $36,484 $55,464
Ratios and Supplemental Data:Ratios of expenses to average net assets: (e)
Excluding credits 1.65% 1.77% 1.81% 1.79% 1.72%Gross 1.65% 1.77% 1.81% 1.79% 1.72%Including custody credits 1.61% 1.76% 1.80% 1.76% 1.67%
Ratio of net investment income (loss) to average net assets (c) 0.21% 0.08% (0.20)% (0.61)% (0.86)%
Portfolio Turnover 105% 160% 180% 36% 46%
Institutional Shares
Years Ended March 31,2006 2005 2004 2003 2002
Net Asset Value, Beginning of Period $ 13.43 $ 12.65 $ 9.90 $ 13.23 $ 14.25
Income from Investment Operations:Net investment income (loss) (a)(b)(c) 0.10 0.07 0.03 (0.01) (0.05)Net realized and unrealized gain/(loss) on securities 1.94 0.71 2.72 (3.32) (0.49)
Total from Investment Operations 2.04 0.78 2.75 (3.33) (0.54)
Less Distributions:Dividends from net investment income (0.07) — — — —Distributions from realized capital gains — — — — (0.48)
Total Distributions (0.07) — — — (0.48)
Net Asset Value, End of Period $ 15.40 $ 13.43 $ 12.65 $ 9.90 $ 13.23Total Return (d) 15.19% 6.17% 27.78% (25.17)% (3.92)%
Net Assets, End of Period (000’s) $ 984 $ 825 $ 747 $ 590 $ 1,415
Ratios and Supplemental Data:Ratios of expenses to average net assets: (e)
Excluding credits 1.16% 1.27% 1.31% 1.29% 1.22%Gross 1.16% 1.27% 1.31% 1.29% 1.22%Including custody credits 1.11% 1.26% 1.30% 1.26% 1.17%
Ratio of net investment income (loss) to average net assets (c) 0.71% 0.54% 0.30% (0.13)% (0.36)%
Portfolio Turnover 105% 160% 180% 36% 46%
(a) Per share numbers have been calculated using the average shares method.(b) Reflects expense waivers/reimbursements and reductions in effect during the period. See Note 3 to the Financial Statements.(c) Net investment income (loss) per share and the ratio of net investment income (loss) to average net assets reflect net investment income prior to
certain reclassifications for federal income or excise taxes.(d) Total Return does not include the deferred sales charge of 1% for the Ordinary Shares. The total return would have been lower if certain fees had not
been waived or if custodial fees had not been reduced by credits allowed by the custodian. See Note 3 to the financial statements.(e) Ratios of expenses to average net assets shows:
— Excluding Credits (total expenses less fee waivers and reimbursements by the investment advisor, if any).— Gross (total expenses not taking into account fee waivers and reimbursements by the investment advisor or custody earnings credits, if any).— Including Credits (expenses less fee waivers and reimbursements by the investment advisor and reduced by custody earnings credits, if any).
24
The accompanying notes are an integral part of these financial statements.
QUANT FUNDS
Merrill Corp - Quant Funds Quant Funds Annual Report [Funds] 03-31-2006 [AUX] | sholt | 16-May-06 22:24 | 06-6021-1.ea | Sequence: 6CHKSUM Content: 46297 Layout: 21865 Graphics: No Graphics CLEAN
JOB: 06-6021-1 CYCLE#;BL#: 8; 0 TRIM: 8.25" x 10.75" COMPOSITECOLORS: Black, PANTONE 540 U, ~note-color 2 GRAPHICS: none V1.5
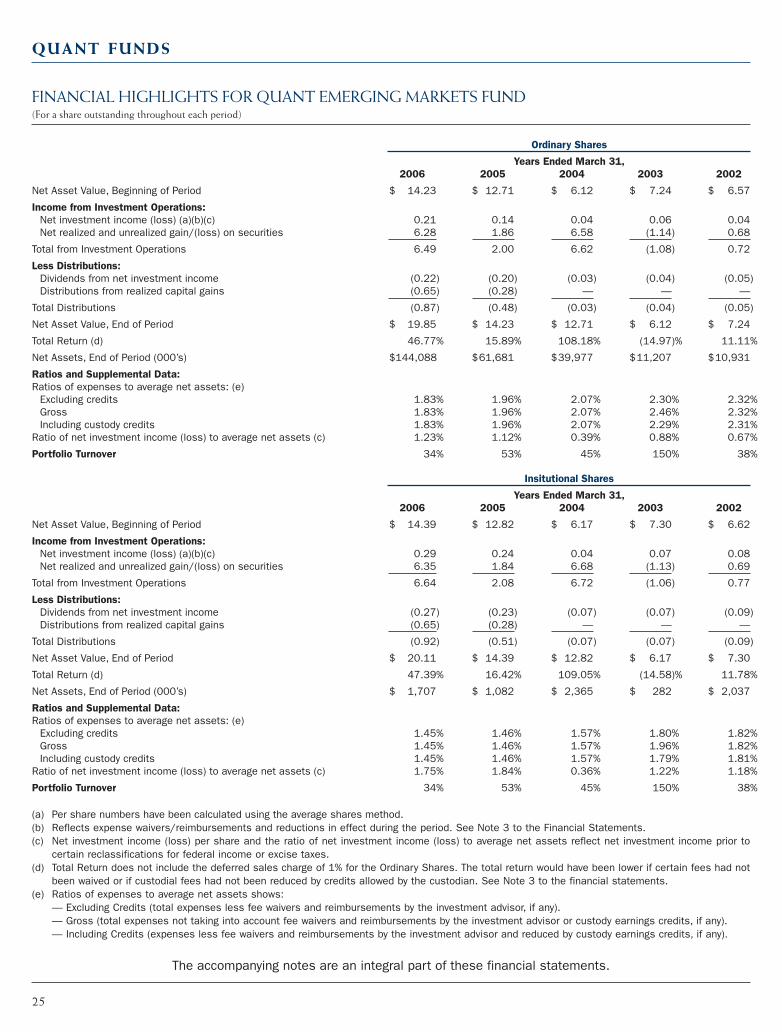
FINANCIAL HIGHLIGHTS FOR QUANT EMERGING MARKETS FUND(For a share outstanding throughout each period)
Ordinary Shares
Years Ended March 31,2006 2005 2004 2003 2002
Net Asset Value, Beginning of Period $ 14.23 $ 12.71 $ 6.12 $ 7.24 $ 6.57
Income from Investment Operations:Net investment income (loss) (a)(b)(c) 0.21 0.14 0.04 0.06 0.04Net realized and unrealized gain/(loss) on securities 6.28 1.86 6.58 (1.14) 0.68
Total from Investment Operations 6.49 2.00 6.62 (1.08) 0.72
Less Distributions:Dividends from net investment income (0.22) (0.20) (0.03) (0.04) (0.05)Distributions from realized capital gains (0.65) (0.28) — — —
Total Distributions (0.87) (0.48) (0.03) (0.04) (0.05)
Net Asset Value, End of Period $ 19.85 $ 14.23 $ 12.71 $ 6.12 $ 7.24
Total Return (d) 46.77% 15.89% 108.18% (14.97)% 11.11%
Net Assets, End of Period (000’s) $144,088 $61,681 $39,977 $11,207 $10,931
Ratios and Supplemental Data:Ratios of expenses to average net assets: (e)
Excluding credits 1.83% 1.96% 2.07% 2.30% 2.32%Gross 1.83% 1.96% 2.07% 2.46% 2.32%Including custody credits 1.83% 1.96% 2.07% 2.29% 2.31%
Ratio of net investment income (loss) to average net assets (c) 1.23% 1.12% 0.39% 0.88% 0.67%
Portfolio Turnover 34% 53% 45% 150% 38%
Insitutional Shares
Years Ended March 31,2006 2005 2004 2003 2002
Net Asset Value, Beginning of Period $ 14.39 $ 12.82 $ 6.17 $ 7.30 $ 6.62
Income from Investment Operations:Net investment income (loss) (a)(b)(c) 0.29 0.24 0.04 0.07 0.08Net realized and unrealized gain/(loss) on securities 6.35 1.84 6.68 (1.13) 0.69
Total from Investment Operations 6.64 2.08 6.72 (1.06) 0.77
Less Distributions:Dividends from net investment income (0.27) (0.23) (0.07) (0.07) (0.09)Distributions from realized capital gains (0.65) (0.28) — — —
Total Distributions (0.92) (0.51) (0.07) (0.07) (0.09)
Net Asset Value, End of Period $ 20.11 $ 14.39 $ 12.82 $ 6.17 $ 7.30
Total Return (d) 47.39% 16.42% 109.05% (14.58)% 11.78%
Net Assets, End of Period (000’s) $ 1,707 $ 1,082 $ 2,365 $ 282 $ 2,037
Ratios and Supplemental Data:Ratios of expenses to average net assets: (e)
Excluding credits 1.45% 1.46% 1.57% 1.80% 1.82%Gross 1.45% 1.46% 1.57% 1.96% 1.82%Including custody credits 1.45% 1.46% 1.57% 1.79% 1.81%
Ratio of net investment income (loss) to average net assets (c) 1.75% 1.84% 0.36% 1.22% 1.18%
Portfolio Turnover 34% 53% 45% 150% 38%
(a) Per share numbers have been calculated using the average shares method.(b) Reflects expense waivers/reimbursements and reductions in effect during the period. See Note 3 to the Financial Statements.(c) Net investment income (loss) per share and the ratio of net investment income (loss) to average net assets reflect net investment income prior to
certain reclassifications for federal income or excise taxes.(d) Total Return does not include the deferred sales charge of 1% for the Ordinary Shares. The total return would have been lower if certain fees had not
been waived or if custodial fees had not been reduced by credits allowed by the custodian. See Note 3 to the financial statements.(e) Ratios of expenses to average net assets shows:
— Excluding Credits (total expenses less fee waivers and reimbursements by the investment advisor, if any).— Gross (total expenses not taking into account fee waivers and reimbursements by the investment advisor or custody earnings credits, if any).— Including Credits (expenses less fee waivers and reimbursements by the investment advisor and reduced by custody earnings credits, if any).
25
The accompanying notes are an integral part of these financial statements.
QUANT FUNDS
Merrill Corp - Quant Funds Quant Funds Annual Report [Funds] 03-31-2006 [AUX] | sholt | 16-May-06 22:24 | 06-6021-1.ea | Sequence: 7CHKSUM Content: 45079 Layout: 24051 Graphics: No Graphics CLEAN
JOB: 06-6021-1 CYCLE#;BL#: 8; 0 TRIM: 8.25" x 10.75" COMPOSITECOLORS: Black, PANTONE 540 U, ~note-color 2 GRAPHICS: none V1.5
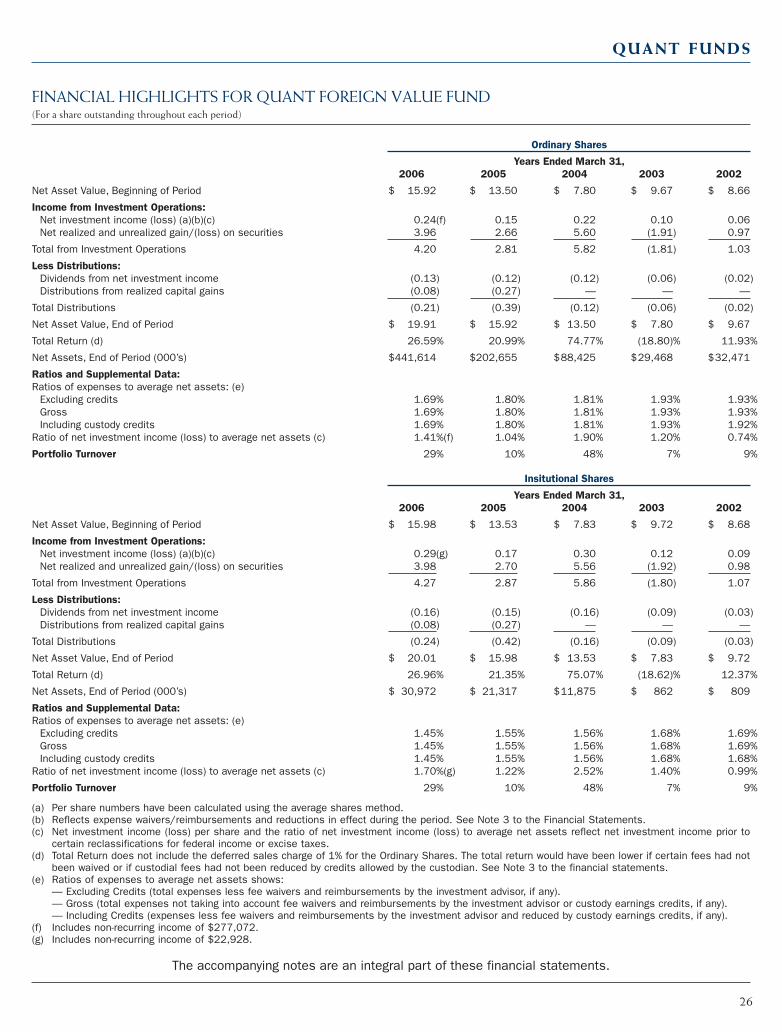
FINANCIAL HIGHLIGHTS FOR QUANT FOREIGN VALUE FUND(For a share outstanding throughout each period)
Ordinary Shares
Years Ended March 31,2006 2005 2004 2003 2002
Net Asset Value, Beginning of Period $ 15.92 $ 13.50 $ 7.80 $ 9.67 $ 8.66
Income from Investment Operations:Net investment income (loss) (a)(b)(c) 0.24(f) 0.15 0.22 0.10 0.06Net realized and unrealized gain/(loss) on securities 3.96 2.66 5.60 (1.91) 0.97
Total from Investment Operations 4.20 2.81 5.82 (1.81) 1.03
Less Distributions:Dividends from net investment income (0.13) (0.12) (0.12) (0.06) (0.02)Distributions from realized capital gains (0.08) (0.27) — — —
Total Distributions (0.21) (0.39) (0.12) (0.06) (0.02)
Net Asset Value, End of Period $ 19.91 $ 15.92 $ 13.50 $ 7.80 $ 9.67
Total Return (d) 26.59% 20.99% 74.77% (18.80)% 11.93%
Net Assets, End of Period (000’s) $441,614 $202,655 $88,425 $29,468 $32,471
Ratios and Supplemental Data:Ratios of expenses to average net assets: (e)
Excluding credits 1.69% 1.80% 1.81% 1.93% 1.93%Gross 1.69% 1.80% 1.81% 1.93% 1.93%Including custody credits 1.69% 1.80% 1.81% 1.93% 1.92%
Ratio of net investment income (loss) to average net assets (c) 1.41%(f) 1.04% 1.90% 1.20% 0.74%
Portfolio Turnover 29% 10% 48% 7% 9%
Insitutional Shares
Years Ended March 31,2006 2005 2004 2003 2002
Net Asset Value, Beginning of Period $ 15.98 $ 13.53 $ 7.83 $ 9.72 $ 8.68
Income from Investment Operations:Net investment income (loss) (a)(b)(c) 0.29(g) 0.17 0.30 0.12 0.09Net realized and unrealized gain/(loss) on securities 3.98 2.70 5.56 (1.92) 0.98
Total from Investment Operations 4.27 2.87 5.86 (1.80) 1.07
Less Distributions:Dividends from net investment income (0.16) (0.15) (0.16) (0.09) (0.03)Distributions from realized capital gains (0.08) (0.27) — — —
Total Distributions (0.24) (0.42) (0.16) (0.09) (0.03)
Net Asset Value, End of Period $ 20.01 $ 15.98 $ 13.53 $ 7.83 $ 9.72
Total Return (d) 26.96% 21.35% 75.07% (18.62)% 12.37%
Net Assets, End of Period (000’s) $ 30,972 $ 21,317 $11,875 $ 862 $ 809
Ratios and Supplemental Data:Ratios of expenses to average net assets: (e)
Excluding credits 1.45% 1.55% 1.56% 1.68% 1.69%Gross 1.45% 1.55% 1.56% 1.68% 1.69%Including custody credits 1.45% 1.55% 1.56% 1.68% 1.68%
Ratio of net investment income (loss) to average net assets (c) 1.70%(g) 1.22% 2.52% 1.40% 0.99%
Portfolio Turnover 29% 10% 48% 7% 9%
(a) Per share numbers have been calculated using the average shares method.(b) Reflects expense waivers/reimbursements and reductions in effect during the period. See Note 3 to the Financial Statements.(c) Net investment income (loss) per share and the ratio of net investment income (loss) to average net assets reflect net investment income prior to
certain reclassifications for federal income or excise taxes.(d) Total Return does not include the deferred sales charge of 1% for the Ordinary Shares. The total return would have been lower if certain fees had not
been waived or if custodial fees had not been reduced by credits allowed by the custodian. See Note 3 to the financial statements.(e) Ratios of expenses to average net assets shows:
— Excluding Credits (total expenses less fee waivers and reimbursements by the investment advisor, if any).— Gross (total expenses not taking into account fee waivers and reimbursements by the investment advisor or custody earnings credits, if any).— Including Credits (expenses less fee waivers and reimbursements by the investment advisor and reduced by custody earnings credits, if any).
(f) Includes non-recurring income of $277,072.(g) Includes non-recurring income of $22,928.
26
The accompanying notes are an integral part of these financial statements.
QUANT FUNDS
Merrill Corp - Quant Funds Quant Funds Annual Report [Funds] 03-31-2006 [AUX] | sholt | 16-May-06 22:24 | 06-6021-1.ea | Sequence: 8CHKSUM Content: 2666 Layout: 21216 Graphics: No Graphics CLEAN
JOB: 06-6021-1 CYCLE#;BL#: 8; 0 TRIM: 8.25" x 10.75" COMPOSITECOLORS: Black, PANTONE 540 U, ~note-color 2 GRAPHICS: none V1.5

NOTES TO FINANCIAL STATEMENTS
1. Organization of the Trust.
The Quantitative Group of Funds d/b/a “Quant Funds” (the“Trust”) is organized as a Massachusetts business trust and is reg-istered under the Investment Company Act of 1940, as amended,as a non-diversified, open-end management investment com-pany. The Trust currently has four series (each a “Fund” and col-lectively the “Funds”) each with a distinct investment objective:Quant Small Cap Fund, Quant Growth and Income Fund, QuantEmerging Markets Fund, and Quant Foreign Value Fund.
The Quant Small Cap Fund (“Small Cap”) seeks maximum long-term capital appreciation by investing primarily in commonstocks of companies with smaller market capitalizations.
The Quant Growth and Income Fund (“Growth and Income”)seeks long-term growth of capital and income by investing pri-marily in common stocks of larger companies having substantialequity capital.
The Quant Emerging Markets Fund (“Emerging Markets”) seekslong-term growth of capital by investing in securities of foreignissuers located in emerging markets.
The Quant Foreign Value Fund (“Foreign Value”) seeks long-term capital growth and income by investing in a diversifiedportfolio consisting primarily of foreign securities. Generally,the Fund invests in Western Europe, Australia, and the largercapital markets in the Far East. The Fund may also invest inemerging markets.
2. Significant Accounting Policies.
The following is a summary of significant accounting policiesfollowed by the Funds in the preparation of their financial state-ments. The policies are in conformity with generally acceptedaccounting principles for investment companies, which requiremanagement to make estimates and assumptions that affect thereported amounts and disclosures in the financial statements.Actual results could differ from those estimates.
Security Valuation.
Portfolio securities are valued each business day at the lastreported sale price on the principal exchange or market onwhich they are traded. If there is no such reported sale, the secu-rities generally are valued at the mean between the last reportedbid and asked prices. For certain securities, where no such saleshave been reported, the Fund may value such securities at the lastreported bid price. In the event that there is information sug-gesting that valuation of such securities based upon bid and/or
asked prices may not be accurate, a fund may value such securi-ties in good faith at fair value in accordance with proceduresestablished by the Funds’ Trustees (the “Trustees”), which mayinclude a determination to value such securities at the lastreported sales price. Short-term investments that mature in 60days or less are valued at amortized cost. Securities quoted in for-eign currencies are translated into U.S. dollars based upon theprevailing exchange rate on each business day. Other assets andsecurities for which no quotations are readily available are val-ued at fair value as determined in good faith using proceduresapproved by the Trustees. As a result, changes in the value ofthose currencies in relation to the U.S. dollar may affect theFund’s NAV. Because foreign markets may be open at differenttimes than the New York Stock Exchange, the value of theFund’s shares may change on days when shareholders are notable to buy or sell them. If events materially affecting the valuesof the Fund’s foreign investments occur between the close offoreign markets and the close of regular trading on the NewYork Stock Exchange, these investments may be valued at theirfair value as determined in good faith using procedures approvedby the Trustees.
Security Transactions and Related Investment Income.
Security transactions are accounted for on the trade date (thedate the order to buy or sell is executed). Dividend income isrecorded on the ex-dividend date, except that certain dividendsfrom foreign securities are recorded as soon as the Funds areinformed of the ex-dividend date. Interest income is recorded onthe accrual basis. In determining the net gain or loss on securi-ties sold, the cost of securities is determined on the identifiedcost basis. Each Fund’s investment income and realized and unre-alized gains and losses are allocated among classes based uponthe daily relative net assets.
Repurchase Agreements.
The Funds’ custodian takes possession through the federal book-entry system of securities collateralizing repurchase agreements.Collateral is marked-to-market daily to ensure that the marketvalue of the underlying assets remains sufficient to protect theFunds. The Funds may experience costs and delays in liquidat-ing the collateral if the issuer defaults or enters into bankruptcy.
Foreign Currency Transactions.
All monetary items denominated in foreign currencies are trans-lated into U.S. dollars based on the prevailing exchange rate atthe close of each business day. Income and expenses denomi-nated in foreign currencies are translated at the prevailing ratesof exchange when accrued or incurred.
27
QUANT FUNDS
Merrill Corp - Quant Funds Quant Funds Annual Report [Funds] 03-31-2006 [AUX] | sholt | 16-May-06 22:24 | 06-6021-1.fa | Sequence: 1CHKSUM Content: 40969 Layout: 42935 Graphics: No Graphics CLEAN
JOB: 06-6021-1 CYCLE#;BL#: 8; 0 TRIM: 8.25" x 10.75" COMPOSITECOLORS: Black, PANTONE 540 C, ~note-color 2 GRAPHICS: none V1.5
NOTES TO FINANCIAL STATEMENTS—Continued
Reported net realized gains and losses on foreign currency trans-actions represent net gains and losses from currency gains andlosses realized between the trade and settlement dates on invest-ment transactions, and the difference between the amount ofnet investment income accrued and the U.S. dollar amount actu-ally received. The effects of changes in foreign currencyexchange rates on investments in securities are not segregated inthe Statement of Operations from the effects of changes in mar-ket prices of those securities, but are included with the net real-ized and unrealized gain or loss on investments.
Expenses.
The majority of the expenses of the Funds are attributed to theindividual Fund for which they are incurred. Expenses that arenot attributed to a specific Fund are allocated in proportion tothe respective net assets of the Funds. Expenses allocable to aFund are borne pro rata by the holders of both classes of sharesof such Fund, except that 12b-1 Plan expenses will not be borneby the holders of Institutional Shares and each class has its owntransfer agency fee.
3. Management Fee, Advisory Contracts and OtherAffiliate Transactions.
The Funds have entered into a management agreement (the“Management Agreement”) with Quantitative InvestmentAdvisors, Inc. (the “Manager”) d/b/a Quantitative Advisors.Compensation of the Manager, for management and adminis-tration of the Funds, including selection and monitoring of theportfolio advisors, is paid monthly based on the average daily netasset value of each Fund for the month. The annual rate of suchfees is 1.00% of the average daily total net assets of Small Cap,Emerging Markets, and Foreign Value; 0.75% of the averagedaily net total asset value of the Growth and Income Fund. Priorto November 1, 2005, the annual rate for the Emerging MarketsFund was 0.80% of the average daily total net assets.
Under the Management Agreement, the Manager has agreed toreduce its compensation, and if necessary, assume expenses, withrespect to Small Cap and Growth and Income to the extent thatthe total expenses of any of these Funds individually exceed 2%of average net assets for any fiscal year. Fund expenses subject tothis limitation are exclusive of brokerage, interest, taxes andextraordinary expenses, which include incremental custody costsassociated with international securities. Expenses are calculatedgross of custody credits, if applicable.
For the year ended March 31, 2006, aggregate management feeswere $5,194,118 and no fees were reduced or waived.
The Manager has entered into advisory contracts with the fol-lowing sub advisors (collectively the “Advisors”) to provide
investment advisory services to the following Funds: ColumbiaPartners, L.L.C., Investment Management (Small Cap,), SSgAFunds Management, Inc. (Growth and Income), PanAgora AssetManagement, Inc. (Emerging Markets), and Polaris CapitalManagement, Inc. (Foreign Value).
For services rendered, the Manager pays to the Advisor of a Funda fee based on a percentage of the average daily total net assetsof the Fund. The fee for each Fund is determined separately.The fees paid by the Manager to the Advisors of the Funds areas follows: Small Cap – 0.50% of average daily total net assets;Emerging Markets – 0.40% of average daily total net assets;Growth and Income – 0.375% of the first $20 million and 0.30%of amounts in excess of $20 million of average daily total netassets, with an annual minimum of $25,000; and Foreign Value –0.35% of the first $35 million, 0.40% of amounts in excess of$35 million but less than $200 million and 0.50% for assets inexcess of $200 million of average daily total net assets.
Effective March 26, 2004, Columbia Partners, L.L.C.,Management Inc. (“Columbia”), the advisor to the Small CapFund, had a change in ownership level that resulted in a changeof control in the entities and other shareholders that ownColumbia. While this change did not have a material impact onhow the Small Cap Fund was managed, it resulted in an assign-ment of the advisory contract for the Fund, causing the contractto terminate. After due consideration, the Trustees approved anew contract on September 30, 2004 (which was subsequentlyreviewed and approved on April 21, 2005). To compensate theFund and its shareholders, the Board of Trustees requiredColumbia to return to the Fund its profits for the period fromMarch 26, 2004 through September 30, 2004 and to pay certainother expenses incurred. In total, Columbia paid $26,910, to theSmall Cap Fund.
The Funds have entered into a distribution agreement (the“Distribution Agreement“) with U.S. Boston Capital Corporation(the “Distributor”). For its services under the DistributionAgreement, the Distributor receives a monthly fee at the annualrate of (i) 0.50% of the average daily total net asset value ofOrdinary Share accounts of Small Cap, Growth and Income andEmerging Markets and (ii) 0.25% of the average daily total netasset value of Ordinary Share accounts of Foreign Value openduring the period the plan is in effect. The Distributor is volun-tarily reducing the monthly fee it receives from EmergingMarkets to 0.25% of the average daily total net asset value ofOrdinary Shareholder accounts of Emerging Markets for theperiod from November 1, 2005 through March 31, 2007. Thisreduction is voluntary and subject to review and there is no guar-antee that the Distributor will continue the reduction. Holdersof Institutional Shares bear no portion of the 12b-1 Planexpenses of the Funds and are not entitled to vote on matters
28
QUANT FUNDS
Merrill Corp - Quant Funds Quant Funds Annual Report [Funds] 03-31-2006 [AUX] | sholt | 16-May-06 22:24 | 06-6021-1.fa | Sequence: 2CHKSUM Content: 38227 Layout: 26776 Graphics: No Graphics CLEAN
JOB: 06-6021-1 CYCLE#;BL#: 8; 0 TRIM: 8.25" x 10.75" COMPOSITECOLORS: Black, PANTONE 540 C, ~note-color 2 GRAPHICS: none V1.5

NOTES TO FINANCIAL STATEMENTS—Continued
involving the 12b-1 Plan. During the year ended March 31,2006, the aggregate distribution fees of the Funds were$1,713,475.
A deferred sales charge of 1% of the net asset value of OrdinaryShares redeemed of Small Cap, Growth and Income, EmergingMarkets and Foreign Value is withheld from the redemptionproceeds and paid to the Distributor. The deferred sales chargeis not imposed on redemptions of Institutional Shares and cer-tain other transactions. The Funds have been advised that dur-ing the year ended March 31, 2006, such fees earned by theDistributor were $124,799.
Transfer agent functions are provided to the Funds byQuantitative Institutional Services, a division of the Manager(the “Transfer Agent”) pursuant to a transfer agent agreement(the “Transfer Agent Agreement”). The Transfer AgentAgreement provides for base fees that are payable to the TransferAgent at an annual rate of 0.16% of the average daily total netasset value of each class of shares of the Funds and for reim-bursement of out of pocket expenses. During the year endedMarch 31, 2006, the aggregate fees of the Funds were $916,330.
The Transfer Agent also provides the Fund with other servicesconsisting of in-house legal services, preparation and review ofsemi-annual and annual reports and EDGAR administration serv-ices. These services are provided as additional services agreed toby the Board of Trustees of the Funds under the provisions of theTransfer Agent Agreement. For the year ended March 31, 2006,aggregate transfer agent fees for these services were $133,980.
The By Laws of the Fund, as amended from time to time, permitthe Board of Trustees of the Fund to approve reimbursement tothe Manager for certain costs associated with providing regula-tory and compliance services to the Fund. For the period endedMarch 31, 2006, the Trustees have approved reimbursementsthat amounted to $112,390.
Custody and fund accounting services are provided by StateStreet Kansas City. Custody credits generated by interest earnedon uninvested cash balances maintained by the Funds are used tooffset custodial expenses of the Funds.
The Trustees receive an annual Trustee’s fee of $5,000 except theaudit committee members who receive an annual fee of $6,000.The fees are allocated to each Fund in proportion to its respec-tive net assets.
4. Purchases and Sales.
During the year ended March 31, 2006, purchases of investmentsecurities other than U.S. Government obligations and short-term investments, for Small Cap, Growth and Income, EmergingMarkets and Foreign Value were $53,853,350, $61,257,392,$75,797,908, and $222,929,811, respectively. Sales of such secu-rities for the Funds were $53,382,850, $55,387,575,$29,509,521, and $82,607,092, respectively.
5. Contingent Liability.
The Trust insures itself and all Funds under a policy with ICIMutual Insurance Company (“ICI Mutual”). The annual premiumis allocated among the Funds and the Transfer Agent.Additionally, the Funds have committed to ICI Mutual up to300% of the annual premium, one third of which was providedin cash, with each Fund’s pro rata portion recorded as an asset.The remainder is secured with an irrevocable letter of credit.
6. Concentration of Risk.
The relatively large investments of Emerging Markets in coun-tries with limited or developing capital markets may involvegreater risks than investments in more developed markets andthe prices of such investments may be volatile. The conse-quences of political, social or economic changes in these marketsmay have disruptive effects on the market prices of the Fund’sinvestments and the income they generate, as well as the Fund’sability to repatriate such amounts.
7. Federal Income Taxes.
It is the policy of the Funds to distribute all of their taxableincome within the prescribed time and otherwise comply withthe provisions of the Internal Revenue Code (“IRC”) applicableto regulated investment companies. Therefore no Federalincome tax provision is required.
The tax components of capital shown in the following tablesrepresent: (1) losses or deductions the Portfolios may be able tooffset against income and gains realized in future years, (2) dis-tribution requirements the Portfolios must satisfy under theincome tax regulations, and (3) unrealized appreciation or depre-ciation of investments for federal income tax purposes.
29
QUANT FUNDS
Merrill Corp - Quant Funds Quant Funds Annual Report [Funds] 03-31-2006 [AUX] | sholt | 16-May-06 22:24 | 06-6021-1.fa | Sequence: 3CHKSUM Content: 14056 Layout: 26808 Graphics: No Graphics CLEAN
JOB: 06-6021-1 CYCLE#;BL#: 8; 0 TRIM: 8.25" x 10.75" COMPOSITECOLORS: Black, PANTONE 540 C, ~note-color 2 GRAPHICS: none V1.5

Capital Loss Capital Loss Capital Loss Capital LossExpires Expires Expires Expires Total
Portfolio March 31, 2010 March 31, 2011 March 31, 2012 March 31, 2013 Capital Loss
Small Cap Fund $ — $ — $ — $ — $ —Growth and Income Fund — (1,935,898) (1,505,389) (242,539) (3,683,826)Emerging Markets Fund — — — — —Foreign Value Fund (3,055,405) (932,449) — — (3,987,854)
In 2006, the Portfolios noted in the table incurred no “Post-October” losses during the period from November 1, 2005 through March 31, 2006.
The primary differences between book and tax appreciation or depreciation of investments consist of wash sale loss deferrals, return ofcapital distributions by real estate investment trusts (“REITs”), mark to market on passive foreign investment companies (“PFICs”) heldand foreign capital gains taxes accrued. The net tax appreciation/depreciation in the table includes unrealized tax gain (loss) on foreigncurrency and investments.
March 31, 2006
Undistributed Undistributed Accumulated Post- Net Tax Ordinary Long-Term Capital October Appreciation/
Portfolio Income Gains Losses Deferral Depreciation
Small Cap Fund $ — $ 3,910,691 $ — $— $34,636,516Growth and Income Fund 117,007 — (3,683,826) — 5,443,376Emerging Markets Fund 1,094,794 3,215,544 — — 43,246,355Foreign Value Fund 2,242,437 31,214,360 (3,987,854) — 97,196,146
At March 31, 2006 the tax composition of dividends was as follows:
Ordinary Long Term Tax ReturnPortfolio Income Capital Gains Of Capital
Small Cap Fund $ — $12,783,214 $—Growth & Income Fund 39,903 — —Emerging Markets Fund 1,227,979 3,671,542 —Foreign Value Fund 2,439,962 1,436,750 —
For the year ended March 31, 2006 Small Cap incurred a net operating loss of $913,312. This net operating loss was reclassified to Sharesof Beneficial Interest.
Capital loss carryovers in the amount of $0, $6,530,758, $0, and $1,395,926 were utilized by Small Cap, Growth and Income, EmergingMarkets and Foreign Value, respectively during the fiscal year ending March 31, 2006.
NOTES TO FINANCIAL STATEMENTS—Continued
Certain Funds had capital loss carryovers at March 31, 2006. Theaccumulated capital losses noted in the table may be available tooffset future realized capital gains and thereby reduce future tax-able gain distributions. Foreign Value’s capital loss carryover was
30
QUANT FUNDS
acquired during a merger which took place on May 2, 2003 andmay be subject to annual limitations under applicable tax laws andtherefore may expire unutilized. As of March 31, 2006 the capi-tal loss carryovers were as follows:
Merrill Corp - Quant Funds Quant Funds Annual Report [Funds] 03-31-2006 [AUX] | sholt | 16-May-06 22:24 | 06-6021-1.fa | Sequence: 4CHKSUM Content: 64796 Layout: 4041 Graphics: No Graphics CLEAN
JOB: 06-6021-1 CYCLE#;BL#: 8; 0 TRIM: 8.25" x 10.75" COMPOSITECOLORS: Black, PANTONE 540 C, ~note-color 2 GRAPHICS: none V1.5
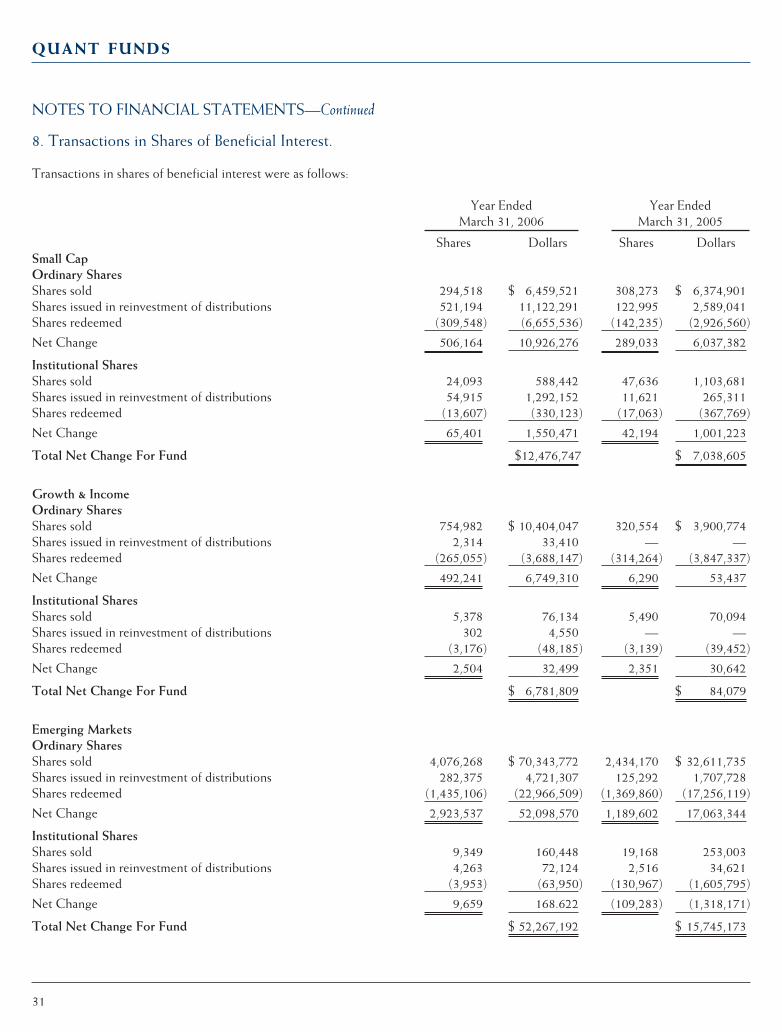
NOTES TO FINANCIAL STATEMENTS—Continued
8. Transactions in Shares of Beneficial Interest.
Transactions in shares of beneficial interest were as follows:
Year Ended Year EndedMarch 31, 2006 March 31, 2005
Shares Dollars Shares DollarsSmall CapOrdinary SharesShares sold 294,518 $ 6,459,521 308,273 $ 6,374,901Shares issued in reinvestment of distributions 521,194 11,122,291 122,995 2,589,041Shares redeemed (309,548) (6,655,536) (142,235) (2,926,560)
Net Change 506,164 10,926,276 289,033 6,037,382
Institutional SharesShares sold 24,093 588,442 47,636 1,103,681Shares issued in reinvestment of distributions 54,915 1,292,152 11,621 265,311Shares redeemed (13,607) (330,123) (17,063) (367,769)
Net Change 65,401 1,550,471 42,194 1,001,223
Total Net Change For Fund $12,476,747 $ 7,038,605
Growth & IncomeOrdinary SharesShares sold 754,982 $ 10,404,047 320,554 $ 3,900,774Shares issued in reinvestment of distributions 2,314 33,410 — —Shares redeemed (265,055) (3,688,147) (314,264) (3,847,337)
Net Change 492,241 6,749,310 6,290 53,437
Institutional SharesShares sold 5,378 76,134 5,490 70,094Shares issued in reinvestment of distributions 302 4,550 — —Shares redeemed (3,176) (48,185) (3,139) (39,452)
Net Change 2,504 32,499 2,351 30,642
Total Net Change For Fund $ 6,781,809 $ 84,079
Emerging MarketsOrdinary SharesShares sold 4,076,268 $ 70,343,772 2,434,170 $ 32,611,735Shares issued in reinvestment of distributions 282,375 4,721,307 125,292 1,707,728Shares redeemed (1,435,106) (22,966,509) (1,369,860) (17,256,119)
Net Change 2,923,537 52,098,570 1,189,602 17,063,344
Institutional SharesShares sold 9,349 160,448 19,168 253,003Shares issued in reinvestment of distributions 4,263 72,124 2,516 34,621Shares redeemed (3,953) (63,950) (130,967) (1,605,795)
Net Change 9,659 168.622 (109,283) (1,318,171)
Total Net Change For Fund $ 52,267,192 $ 15,745,173
31
QUANT FUNDS
Merrill Corp - Quant Funds Quant Funds Annual Report [Funds] 03-31-2006 [AUX] | sholt | 16-May-06 22:24 | 06-6021-1.fa | Sequence: 5CHKSUM Content: 17942 Layout: 18386 Graphics: No Graphics CLEAN
JOB: 06-6021-1 CYCLE#;BL#: 8; 0 TRIM: 8.25" x 10.75" COMPOSITECOLORS: Black, PANTONE 540 C, ~note-color 2 GRAPHICS: none V1.5
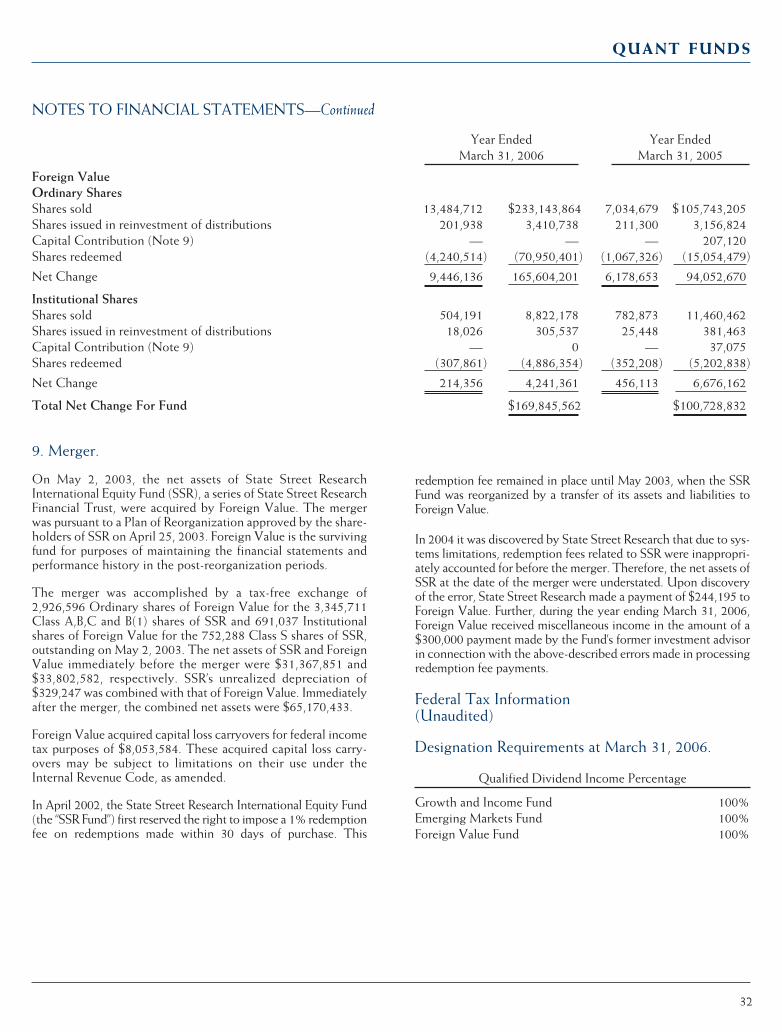
NOTES TO FINANCIAL STATEMENTS—Continued
Year Ended Year EndedMarch 31, 2006 March 31, 2005
Foreign ValueOrdinary SharesShares sold 13,484,712 $233,143,864 7,034,679 $105,743,205Shares issued in reinvestment of distributions 201,938 3,410,738 211,300 3,156,824Capital Contribution (Note 9) — — — 207,120Shares redeemed (4,240,514) (70,950,401) (1,067,326) (15,054,479)
Net Change 9,446,136 165,604,201 6,178,653 94,052,670
Institutional SharesShares sold 504,191 8,822,178 782,873 11,460,462Shares issued in reinvestment of distributions 18,026 305,537 25,448 381,463Capital Contribution (Note 9) — 0 — 37,075Shares redeemed (307,861) (4,886,354) (352,208) (5,202,838)
Net Change 214,356 4,241,361 456,113 6,676,162
Total Net Change For Fund $169,845,562 $100,728,832
redemption fee remained in place until May 2003, when the SSRFund was reorganized by a transfer of its assets and liabilities toForeign Value.
In 2004 it was discovered by State Street Research that due to sys-tems limitations, redemption fees related to SSR were inappropri-ately accounted for before the merger. Therefore, the net assets ofSSR at the date of the merger were understated. Upon discoveryof the error, State Street Research made a payment of $244,195 toForeign Value. Further, during the year ending March 31, 2006,Foreign Value received miscellaneous income in the amount of a$300,000 payment made by the Fund’s former investment advisorin connection with the above-described errors made in processingredemption fee payments.
Federal Tax Information (Unaudited)
Designation Requirements at March 31, 2006.
Qualified Dividend Income Percentage
Growth and Income Fund 100%Emerging Markets Fund 100%Foreign Value Fund 100%
32
QUANT FUNDS
9. Merger.
On May 2, 2003, the net assets of State Street ResearchInternational Equity Fund (SSR), a series of State Street ResearchFinancial Trust, were acquired by Foreign Value. The mergerwas pursuant to a Plan of Reorganization approved by the share-holders of SSR on April 25, 2003. Foreign Value is the survivingfund for purposes of maintaining the financial statements andperformance history in the post-reorganization periods.
The merger was accomplished by a tax-free exchange of2,926,596 Ordinary shares of Foreign Value for the 3,345,711Class A,B,C and B(1) shares of SSR and 691,037 Institutionalshares of Foreign Value for the 752,288 Class S shares of SSR,outstanding on May 2, 2003. The net assets of SSR and ForeignValue immediately before the merger were $31,367,851 and$33,802,582, respectively. SSR’s unrealized depreciation of$329,247 was combined with that of Foreign Value. Immediatelyafter the merger, the combined net assets were $65,170,433.
Foreign Value acquired capital loss carryovers for federal incometax purposes of $8,053,584. These acquired capital loss carry-overs may be subject to limitations on their use under theInternal Revenue Code, as amended.
In April 2002, the State Street Research International Equity Fund(the “SSR Fund”) first reserved the right to impose a 1% redemptionfee on redemptions made within 30 days of purchase. This
Merrill Corp - Quant Funds Quant Funds Annual Report [Funds] 03-31-2006 [AUX] | sholt | 16-May-06 22:24 | 06-6021-1.fa | Sequence: 6CHKSUM Content: 35584 Layout: 57290 Graphics: No Graphics CLEAN
JOB: 06-6021-1 CYCLE#;BL#: 8; 0 TRIM: 8.25" x 10.75" COMPOSITECOLORS: Black, PANTONE 540 C, ~note-color 2 GRAPHICS: none V1.5

REPORT OF INDEPENDENT REGISTERED PUBLIC ACCOUNTING FIRM
To the Shareholders and Trustees of the Quantitative Group of Funds d/b/a Quant Funds
In our opinion, the accompanying statements of assets and liabilities, including the portfolios of investments, and the related statementsof operations and of changes in net assets and the financial highlights present fairly, in all material respects, the financial position of eachof the portfolios constituting the Quantitative Group of Funds d/b/a Quant Funds (hereafter referred to as the “Funds”) at March 31, 2006,the results of each of their operations for the year then ended, the changes in each of their net assets for each of the two years in the periodthen ended and the financial highlights for each of the five years in the period then ended, in conformity with accounting principles gen-erally accepted in the United States of America. These financial statements and financial highlights (hereafter referred to as “financial state-ments”) are the responsibility of the Funds’ management; our responsibility is to express an opinion on these financial statements basedon our audits. We conducted our audits of these financial statements in accordance with the standards of the Public Company AccountingOversight Board (United States). Those standards require that we plan and perform the audit to obtain reasonable assurance aboutwhether the financial statements are free of material misstatement. An audit includes examining, on a test basis, evidence supporting theamounts and disclosures in the financial statements, assessing the accounting principles used and significant estimates made by manage-ment, and evaluating the overall financial statement presentation. We believe that our audits, which included confirmation of securitiesat March 31, 2006 by correspondence with the custodian and brokers, provide a reasonable basis for our opinion.
PricewaterhouseCoopers LLPBoston, MassachusettsMay 16, 2006
33
QUANT FUNDS
Merrill Corp - Quant Funds Quant Funds Annual Report [Funds] 03-31-2006 [AUX] | sholt | 16-May-06 22:24 | 06-6021-1.ga | Sequence: 1CHKSUM Content: 64664 Layout: 64895 Graphics: No Graphics CLEAN
JOB: 06-6021-1 CYCLE#;BL#: 8; 0 TRIM: 8.25" x 10.75" COMPOSITECOLORS: Black, PANTONE 540 U, ~note-color 2 GRAPHICS: none V1.5
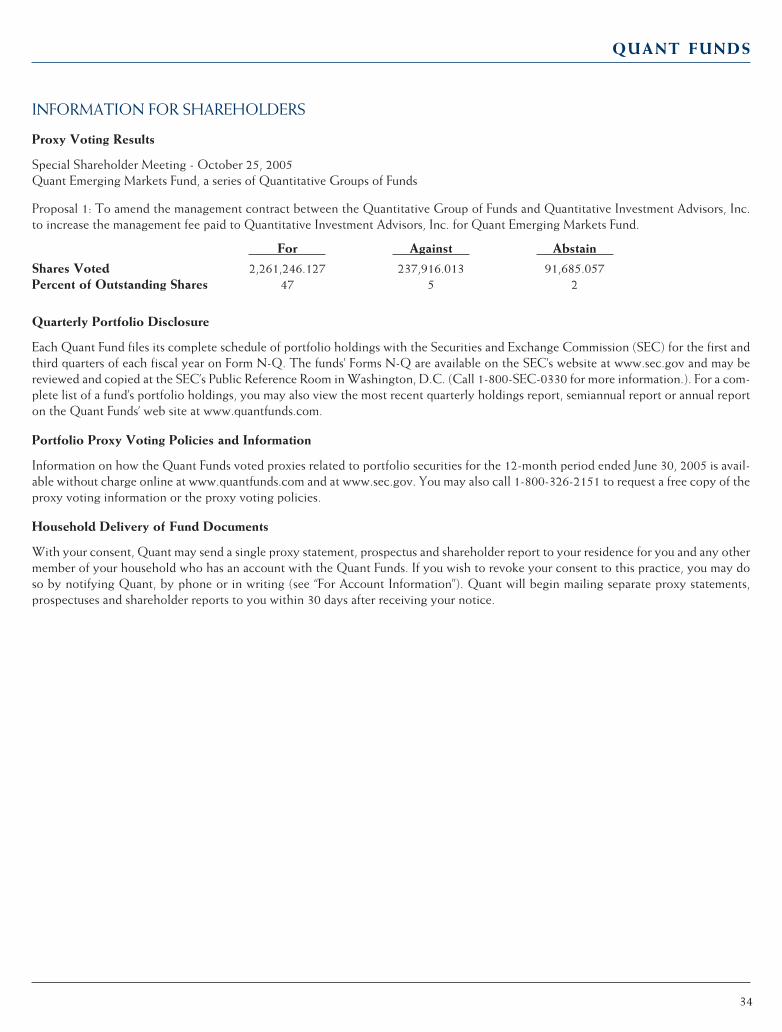
INFORMATION FOR SHAREHOLDERS
Proxy Voting Results
Special Shareholder Meeting - October 25, 2005Quant Emerging Markets Fund, a series of Quantitative Groups of Funds
Proposal 1: To amend the management contract between the Quantitative Group of Funds and Quantitative Investment Advisors, Inc.to increase the management fee paid to Quantitative Investment Advisors, Inc. for Quant Emerging Markets Fund.
For Against Abstain
Shares Voted 2,261,246.127 237,916.013 91,685.057Percent of Outstanding Shares 47 5 2
Quarterly Portfolio Disclosure
Each Quant Fund files its complete schedule of portfolio holdings with the Securities and Exchange Commission (SEC) for the first andthird quarters of each fiscal year on Form N-Q. The funds’ Forms N-Q are available on the SEC’s website at www.sec.gov and may bereviewed and copied at the SEC’s Public Reference Room in Washington, D.C. (Call 1-800-SEC-0330 for more information.). For a com-plete list of a fund’s portfolio holdings, you may also view the most recent quarterly holdings report, semiannual report or annual reporton the Quant Funds’ web site at www.quantfunds.com.
Portfolio Proxy Voting Policies and Information
Information on how the Quant Funds voted proxies related to portfolio securities for the 12-month period ended June 30, 2005 is avail-able without charge online at www.quantfunds.com and at www.sec.gov. You may also call 1-800-326-2151 to request a free copy of theproxy voting information or the proxy voting policies.
Household Delivery of Fund Documents
With your consent, Quant may send a single proxy statement, prospectus and shareholder report to your residence for you and any othermember of your household who has an account with the Quant Funds. If you wish to revoke your consent to this practice, you may doso by notifying Quant, by phone or in writing (see “For Account Information”). Quant will begin mailing separate proxy statements,prospectuses and shareholder reports to you within 30 days after receiving your notice.
34
QUANT FUNDS
Merrill Corp - Quant Funds Quant Funds Annual Report [Funds] 03-31-2006 [AUX] | sholt | 16-May-06 22:24 | 06-6021-1.ga | Sequence: 2CHKSUM Content: 49595 Layout: 42518 Graphics: No Graphics CLEAN
JOB: 06-6021-1 CYCLE#;BL#: 8; 0 TRIM: 8.25" x 10.75" COMPOSITECOLORS: Black, PANTONE 540 U, ~note-color 2 GRAPHICS: none V1.5

PRIVACY POLICY
Please read this important notice about the privacy of our customers’ personal information from Quantitative Investment
Advisors, Inc., Quantitative Group of Funds, and U.S. Boston Capital Corporation (collectively, “Quantitative”).
Quantitative Respects Your Privacy
Quantitative considers the privacy of our customers and former customers a matter of great importance. We respect your privacy andbelieve that any nonpublic personal information we have should be treated with the highest regard for its confidentiality. Nonpublic per-sonal information includes much of the information you provide to us and the related information about you and your transactions involv-ing your Quantitative investment products or services. Examples of nonpublic personal information include the information you provideon new account applications for Quantitative investment products or services, your share balance or transactional history and the factthat you are a shareholder or client of Quantitative.
Quantitative Privacy Policy
As noted above, Quantitative places a high priority on protecting the privacy of its customers’ financial information and other personal details.This Privacy Policy outlines our guidelines and practices for how we collect, use and protect information about individual customers.
Employees. Quantitative employees understand that they must keep your personal and financial information confidential when they haveaccess to it and when they see it as they communicate with you and process transactions on your or your financial intermediary’s instruc-tions. Employees are required to refrain from disclosing information to unauthorized persons.
Vendors. When Quantitative hires vendors, such as mail houses or data processors, to assist in delivering services to clients, we requirethese vendors to commit contractually to keep the information they handle in strict confidence.
Your Personal Information
We collect and record personal information that customers provide:
• on forms and applications• through electronic media• through information (commonly referred to as “cookies”) collected from the Web browser of your PC that allows our website to
recognize your browser• by telephone• in correspondence
We also collect and record information from:
• your financial advisor• your transactions with us and our affiliates• other firms, such as those from whom you transfer assets• third parties who may notify us of your change of address
Personal information may include:
• names• addresses• phone numbers• Social Security and/or Tax ID numbers• your investments in the Quantitative Group of Funds, such as your account balance and transaction activity• other account information
How Quantitative Uses Information
Quantitative gathers information to help us find better ways to serve clients and enhance other products and programs. For instance,
• we may share information with our affiliates when providing services to you or the Quantitative Group of Funds;• we may use information to send notices to you about products and services that we feel might interest you; or
35
QUANT FUNDS
Merrill Corp - Quant Funds Quant Funds Annual Report [Funds] 03-31-2006 [AUX] | sholt | 16-May-06 22:24 | 06-6021-1.ga | Sequence: 3CHKSUM Content: 49784 Layout: 64895 Graphics: No Graphics CLEAN
JOB: 06-6021-1 CYCLE#;BL#: 8; 0 TRIM: 8.25" x 10.75" COMPOSITECOLORS: Black, PANTONE 540 U, ~note-color 2 GRAPHICS: none V1.5
PRIVACY POLICY
• we may employ an unaffiliated company to survey all our customers about our products or the quality of our communications orservices.
Information gathered on clients is not sold to other firms, such as direct marketers. The details Quantitative collects will not generateany correspondence, e-mails or phone calls from unaffiliated marketers.
Quantitative may have to provide information to legally authorized agencies or individuals, such as the Securities and ExchangeCommission, Internal Revenue Service or other regulatory agencies, or as otherwise required by law. We also share client informationwith firms that we contracted with to deliver services to our customers or to other financial institutions with which we have joint mar-keting arrangements. We do not disclose any nonpublic personal information about customers or former customers to other parties, exceptas permitted by law. As noted above, however, these firms have contractually committed to protect the confidentiality of all Quantitativeinformation to which they have access.
We will send customers an updated Privacy Policy each year.
Security
Quantitative maintains physical, electronic and procedural safeguards that meet federal standards for guarding customer information.
We employ various forms of Internet security, such as
• data encryption• Secure Sockets Layer (SSL) protocol• user names and passwords
Passwords. If you access information through the Quantitative Group of Funds’ web site, www.quantfunds.com, you should not giveyour user name or passwords to anyone for any reason. Choosing to provide this information to a third party invites problems and putsthe confidentiality of your personal information at risk.
External Links
To provide you with more information that may be helpful, the Quantitative Group of Funds web site may contain links to other websites that are not affiliated with or maintained by Quantitative. Quantitative does not monitor the privacy practices of these third-partysites, and we do not exercise any authority over the sites. As a result, Quantitative does not assume any responsibility for the content ordata collection policies of the sites. When you access any of these third-party sites, Quantitative cannot guarantee that your privacy willbe protected in the same way as it is on the Quantitative Group of Funds’ web site.
Changes to the privacy policy
Quantitative reserves the right to change, modify, add or remove portions of this privacy policy as permitted by law at any time.Customers may want to review the policy periodically for changes. Customers can review the privacy policy by clicking on the link thatappears on the www.quantfunds.com home page.
Questions. If you have any questions or concerns about maintaining the privacy of your customer information at Quantitative, pleasecontact us at 800-326-2151 Monday through Friday, between the hours of 9:00 am and 5:00 pm Eastern Time.
This policy is effective September 30, 2005.
36
QUANT FUNDS
Merrill Corp - Quant Funds Quant Funds Annual Report [Funds] 03-31-2006 [AUX] | sholt | 16-May-06 22:24 | 06-6021-1.ga | Sequence: 4CHKSUM Content: 22296 Layout: 1736 Graphics: No Graphics CLEAN
JOB: 06-6021-1 CYCLE#;BL#: 8; 0 TRIM: 8.25" x 10.75" COMPOSITECOLORS: Black, PANTONE 540 U, ~note-color 2 GRAPHICS: none V1.5
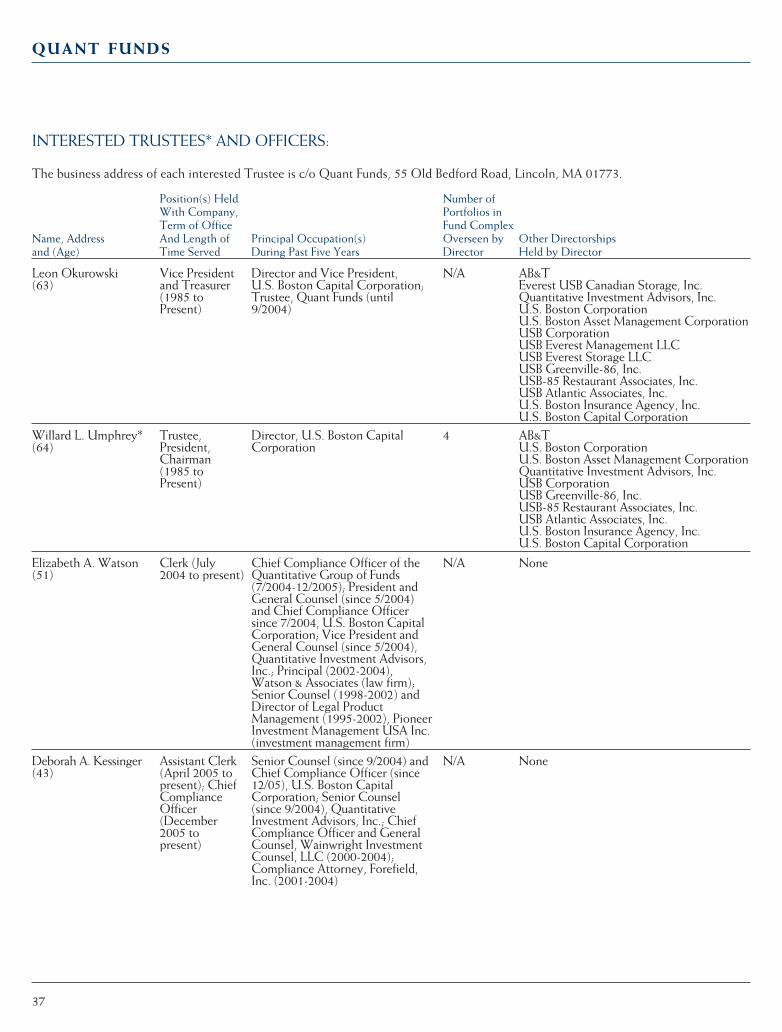
INTERESTED TRUSTEES* AND OFFICERS:
The business address of each interested Trustee is c/o Quant Funds, 55 Old Bedford Road, Lincoln, MA 01773.
Position(s) Held Number ofWith Company, Portfolios inTerm of Office Fund Complex
Name, Address And Length of Principal Occupation(s) Overseen by Other Directorshipsand (Age) Time Served During Past Five Years Director Held by Director
NoneN/ASenior Counsel (since 9/2004) andChief Compliance Officer (since12/05), U.S. Boston CapitalCorporation; Senior Counsel(since 9/2004), QuantitativeInvestment Advisors, Inc.; ChiefCompliance Officer and GeneralCounsel, Wainwright InvestmentCounsel, LLC (2000-2004);Compliance Attorney, Forefield,Inc. (2001-2004)
Assistant Clerk(April 2005 topresent); ChiefComplianceOfficer(December2005 topresent)
Deborah A. Kessinger(43)
NoneN/AChief Compliance Officer of theQuantitative Group of Funds(7/2004-12/2005); President andGeneral Counsel (since 5/2004)and Chief Compliance Officersince 7/2004, U.S. Boston CapitalCorporation; Vice President andGeneral Counsel (since 5/2004),Quantitative Investment Advisors,Inc.; Principal (2002-2004),Watson & Associates (law firm);Senior Counsel (1998-2002) andDirector of Legal ProductManagement (1995-2002), PioneerInvestment Management USA Inc.(investment management firm)
Clerk (July2004 to present)
Elizabeth A. Watson(51)
AB&TU.S. Boston CorporationU.S. Boston Asset Management CorporationQuantitative Investment Advisors, Inc.USB CorporationUSB Greenville-86, Inc.USB-85 Restaurant Associates, Inc.USB Atlantic Associates, Inc.U.S. Boston Insurance Agency, Inc.U.S. Boston Capital Corporation
4Director, U.S. Boston CapitalCorporation
Trustee,President,Chairman(1985 toPresent)
Willard L. Umphrey*(64)
AB&TEverest USB Canadian Storage, Inc.Quantitative Investment Advisors, Inc.U.S. Boston CorporationU.S. Boston Asset Management CorporationUSB CorporationUSB Everest Management LLCUSB Everest Storage LLCUSB Greenville-86, Inc.USB-85 Restaurant Associates, Inc.USB Atlantic Associates, Inc.U.S. Boston Insurance Agency, Inc.U.S. Boston Capital Corporation
N/ADirector and Vice President,U.S. Boston Capital Corporation;Trustee, Quant Funds (until9/2004)
Vice Presidentand Treasurer(1985 toPresent)
Leon Okurowski (63)
37
QUANT FUNDS
Merrill Corp - Quant Funds Quant Funds Annual Report [Funds] 03-31-2006 [AUX] | sholt | 16-May-06 22:24 | 06-6021-1.ga | Sequence: 5CHKSUM Content: 64741 Layout: 56187 Graphics: No Graphics CLEAN
JOB: 06-6021-1 CYCLE#;BL#: 8; 0 TRIM: 8.25" x 10.75" COMPOSITECOLORS: Black, PANTONE 540 U, ~note-color 2 GRAPHICS: none V1.5

NON-INTERESTED TRUSTEES:
The business address of each non-interested Trustee is c/o Quant Funds, 55 Old Bedford Road, Lincoln, MA 01773.
Position(s) Held Number ofWith Company, Portfolios inTerm of Office Fund Complex
Name, Address And Length of Principal Occupation(s) Overseen by Other Directorshipsand (Age) Time Served During Past Five Years Director Held by Director
Each Trustee and officer holds office until his or her successor is chosen and qualified or until his or her earlier death, resignation, retire-ment or removal. Messrs. Armstrong, Bulbrook, Burrows and Marshall are members of the Funds’ Audit Committee.
Mr. Caruso resigned as Trustee on December 1, 2005. His resignation was ratified by the board on December 4, 2005.
The Fund’s Statement of Additional Information (“SAI”) includes additional information about the Fund Trustees and is available withoutcharge, upon request. To obtain a free copy of the current SAI, please access the Funds’ web site at www.QuantFunds.com or call share-holder services at 1-800-326-2141.
* Trustees have been determined to be “Interested Trustees” by virtue of, among other things, affiliation with one or more of the trust, theFund’s investment advisor, Quantitative Advisors and the Fund’s distributor, U.S. Boston Capital Corporation.
None4Owner, Coastal CFO Solutions,CFO, Fore River Company,Finance Director, Northern YorkCounty Family YMCA,CFO and Board Member of GreatWorks Internet, CFO,Holographix, CFO, EVibe.com,CFO, HealthWatch Technologies.
Trustee (April2003 to present)
Clinton S. Marshall(49)
None4Independent consulting actuary-employee benefit plans
Trustee(1985 to Present)
Edward E. Burrows(73)
John M. Bulbrook Insurance Agency, Inc.4CEO and Treasurer, John M.Bulbrook Insurance Agency, Inc.
Trustee(1985 to Present)
John M. Bulbrook(63)
NewPage Corporation; NewPage HoldingCorporation
4President, Alumni CareerServices (consulting firm)
Trustee(1985 to Present)
Robert M. Armstrong (67)
38
QUANT FUNDS
Merrill Corp - Quant Funds Quant Funds Annual Report [Funds] 03-31-2006 [AUX] | sholt | 16-May-06 22:24 | 06-6021-1.ga | Sequence: 6CHKSUM Content: 43705 Layout: 49058 Graphics: No Graphics CLEAN
JOB: 06-6021-1 CYCLE#;BL#: 8; 0 TRIM: 8.25" x 10.75" COMPOSITECOLORS: Black, PANTONE 540 U, ~note-color 2 GRAPHICS: none V1.5

39
This page intentionally left blank.
QUANT FUNDS
Merrill Corp - Quant Funds Quant Funds Annual Report [Funds] 03-31-2006 [AUX] | sholt | 16-May-06 22:24 | 06-6021-1.ga | Sequence: 7CHKSUM Content: 58381 Layout: 58980 Graphics: No Graphics CLEAN
JOB: 06-6021-1 CYCLE#;BL#: 8; 0 TRIM: 8.25" x 10.75" COMPOSITECOLORS: Black, PANTONE 540 U, ~note-color 2 GRAPHICS: none V1.5
SERVICE PROVIDERS
For Quant Funds information, contact your financial adviser or, if you receive accountstatements directly from Quant Funds, you can also call 1-800-326-2151. Telephonerepresentatives are available from 9:00 a.m. to 5:00 p.m. Eastern Time. Or visit our website, www.QuantFunds.com.
For AccountInformation
Kirkpatrick & Lockhart Nicholson Graham LLP, State Street Financial Center, OneLincoln Street, Boston, MA 02111
Legal Counsel
PricewaterhouseCoopers LLP, 125 High Street, Boston, MA 02110IndependentRegisteredPublicAccounting Firm
Quantitative Institutional Services, 55 Old Bedford Road, Lincoln, MA 01773Transfer Agent
State Street Kansas City, 801 Pennsylvania Avenue, Kansas City, MO 64105 Custodian
U.S. Boston Capital Corporation, 55 Old Bedford Road, Lincoln, MA 01773 Distributor
Columbia Partners, L.L.C., Investment Management, 1775 Pennsylvania Avenue, N.W., Washington, DC 20006
SSgA Funds Management, Inc., State Street Financial Center, One Lincoln Street,Boston, MA 02111
PanAgora Asset Management, Inc., 260 Franklin Street, Boston, MA 02110
Polaris Capital Management, Inc., 125 Summer Street, Boston, MA 02110
Advisers
Quantitative Advisors, 55 Old Bedford Road, Lincoln, MA 01773Manager
QUANT FUNDS
Merrill Corp - Quant Funds Quant Funds Annual Report [Funds] 03-31-2006 [AUX] | dbaker | 17-May-06 14:30 | 06-6021-1.za | Sequence: 1CHKSUM Content: 33507 Layout: 46589 Graphics: No Graphics CLEAN
JOB: 06-6021-1 CYCLE#;BL#: 10; 0 TRIM: 8.25" x 10.75" COMPOSITECOLORS: Black, PANTONE 540 U, ~note-color 2 GRAPHICS: none V1.5

55 O
ld B
edfo
rd R
oad
Linc
oln,
MA
017
73w
ww
.qua
ntfu
nds.
com
Add
ress
Ser
vice
Req
uest
ed
© 2
006
U.S
. Bos
ton
Cap
ital
Cor
pora
tion
D
istr
ibut
or o
f the
Qua
nt F
unds
M
embe
r N
ASD
, SIP
C
Merrill Corp - Quant Funds Quant Funds Annual Report [Funds] 03-31-2006 [AUX] | dbaker | 17-May-06 14:30 | 06-6021-1.za | Sequence: 2CHKSUM Content: 41559 Layout: 18580 Graphics: 59788 CLEAN
JOB: 06-6021-1 CYCLE#;BL#: 10; 0 TRIM: 8.25" x 10.75" COMPOSITECOLORS: Black, PANTONE 540 U, ~note-color 2 GRAPHICS: quant_funds_540_logo.eps V1.5