chou funds 2014 annual report
DESCRIPTION
Chou Funds 2014 Annual ReportTRANSCRIPT

CHOU ASSOCIATES FUND CHOU ASIA FUND CHOU EUROPE FUND CHOU BOND FUND CHOU RRSP FUND Annual Report for Years ended December 31, 2014 and 2013

Illustration of an assumed investment of $10,000 in Canadian dollars (Unaudited)
CHOU ASSOCIATES FUND
Period ended Total value of shares
Dec.31, 1986 $10,000
Dec.31, 1987 10,502
Dec.31, 1988 12,001
Dec.31, 1989 14,244
Dec.31, 1990 12,722
Dec.31, 1991 15,681
Dec.31, 1992 18,817
Dec.31, 1993 21,863
Dec.31, 1994 21,300
Dec.31, 1995 27,904
Dec.31, 1996 34,235
Dec.31, 1997 48,035
Dec.31, 1998 59,187
Dec.31, 1999 53,489
Dec.31, 2000 57,967
Dec.31, 2001 70,397
Dec.31, 2002 91,504
Dec.31, 2003 94,773
Dec.31, 2004 103,319
Dec.31, 2005 117,462
Dec.31, 2006 139,511
Dec.31, 2007 125,258
Dec.31, 2008 88,553
Dec.31, 2009 114,854
Dec.31, 2010 136,916
Dec.31, 2011 113,776
Dec.31, 2012 144,446
Dec.31, 2013 204,142
Dec.31, 2014 $228,754
NOTE: Rates of return are historical total returns, include changes in unit prices, and assume the reinvestment of all distributions. These annual compounded returns do not take into account any sales charges, redemption fees, other optional expenses or income taxes that you have to pay and that could reduce these returns. The returns are not guaranteed. The Fund’s past performance does not necessarily indicate future performance.
The table is presented only to illustrate the effects of the compound growth rate and is not intended to reflect future values of the mutual funds or returns on the mutual funds.
Commissions, trailing commissions, management fees and expenses all may be associated with mutual fund investments. Please read the prospectus before investing.

TABLE OF CONTENTS Chou Associates Fund Manager’s Letter 1-6 Management’s Responsibility for Financial Reporting 7 Chou Funds Auditors’ Report 8 Chou Associates Fund
Statements of Financial Position 9 Statements of Comprehensive Income 10 Statements of Changes in Net Assets 11 Statements of Cash Flows 12 Schedule of Investments 13 Discussion of Financial Risk Management 14-16
Chou Asia Fund
Fund Manager’s Letter 17-19 Statements of Financial Position 20 Statements of Comprehensive Income 21 Statements of Changes in Net Assets 22 Statements of Cash Flows 23 Schedule of Investments 24 Discussion of Financial Risk Management 25-26
Chou Europe Fund
Fund Manager’s Letter 27-29 Statements of Financial Position 30 Statements of Comprehensive Income 31 Statements of Changes in Net Assets 32 Statements of Cash Flows 33 Schedule of Investments 34 Discussion of Financial Risk Management 35-36
Chou Bond Fund
Fund Manager’s Letter 37-40 Statements of Financial Position 41 Statements of Comprehensive Income 42 Statements of Changes in Net Assets 43 Statements of Cash Flows 44 Schedule of Investments 45 Discussion of Financial Risk Management 46-48
Chou RRSP Fund
Fund Manager’s Letter 49-52 Statements of Financial Position 53 Statements of Comprehensive Income 54 Statements of Changes in Net Assets 55 Statements of Cash Flows 56 Schedule of Investments 57 Discussion of Financial Risk Management 58-60
Notes to Financial Statements 61-82
1
CHOU ASSOCIATES FUND (unaudited)
March 16, 2015
Dear Unitholders of Chou Associates Fund,
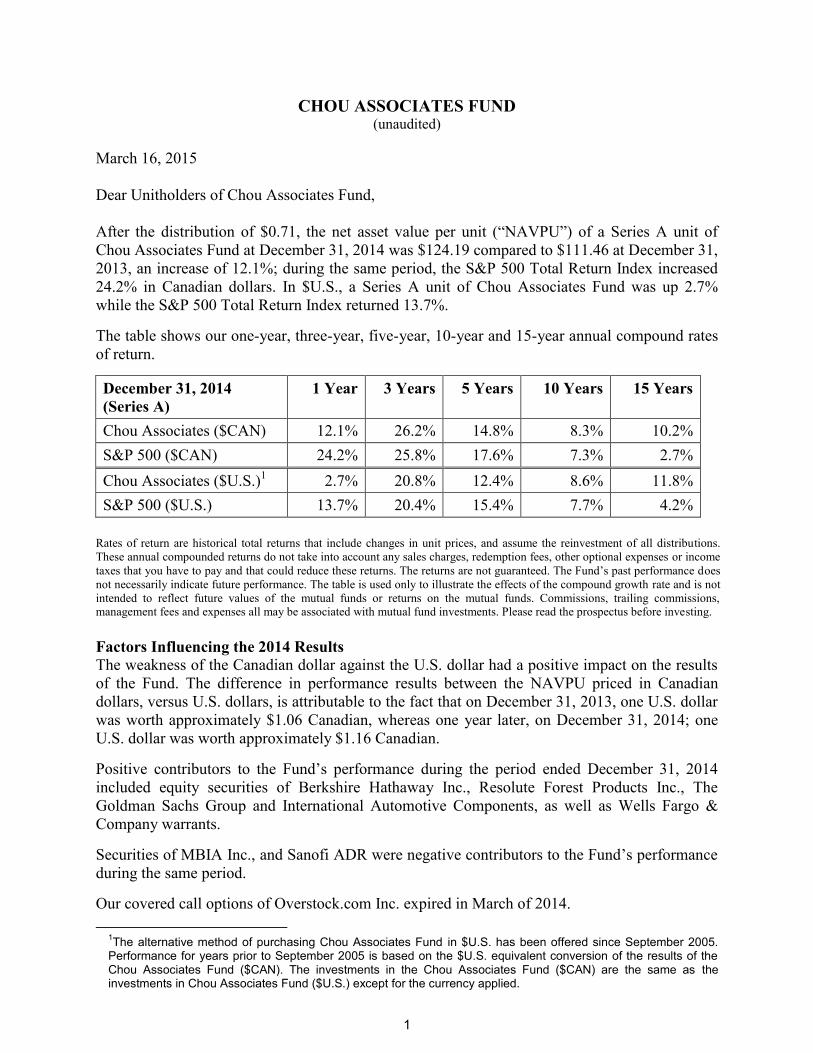
After the distribution of $0.71, the net asset value per unit (“NAVPU”) of a Series A unit of
Chou Associates Fund at December 31, 2014 was $124.19 compared to $111.46 at December 31,
2013, an increase of 12.1%; during the same period, the S&P 500 Total Return Index increased
24.2% in Canadian dollars. In $U.S., a Series A unit of Chou Associates Fund was up 2.7%
while the S&P 500 Total Return Index returned 13.7%.
The table shows our one-year, three-year, five-year, 10-year and 15-year annual compound rates
of return.
December 31, 2014
(Series A)
1 Year 3 Years 5 Years 10 Years 15 Years
Chou Associates ($CAN) 12.1% 26.2% 14.8% 8.3% 10.2%
S&P 500 ($CAN) 24.2% 25.8% 17.6% 7.3% 2.7%
Chou Associates ($U.S.)1 2.7% 20.8% 12.4% 8.6% 11.8%
S&P 500 ($U.S.) 13.7% 20.4% 15.4% 7.7% 4.2%
Rates of return are historical total returns that include changes in unit prices, and assume the reinvestment of all distributions.
These annual compounded returns do not take into account any sales charges, redemption fees, other optional expenses or income
taxes that you have to pay and that could reduce these returns. The returns are not guaranteed. The Fund’s past performance does
not necessarily indicate future performance. The table is used only to illustrate the effects of the compound growth rate and is not
intended to reflect future values of the mutual funds or returns on the mutual funds. Commissions, trailing commissions, management fees and expenses all may be associated with mutual fund investments. Please read the prospectus before investing.
Factors Influencing the 2014 Results
The weakness of the Canadian dollar against the U.S. dollar had a positive impact on the results
of the Fund. The difference in performance results between the NAVPU priced in Canadian
dollars, versus U.S. dollars, is attributable to the fact that on December 31, 2013, one U.S. dollar
was worth approximately $1.06 Canadian, whereas one year later, on December 31, 2014; one
U.S. dollar was worth approximately $1.16 Canadian.
Positive contributors to the Fund’s performance during the period ended December 31, 2014
included equity securities of Berkshire Hathaway Inc., Resolute Forest Products Inc., The
Goldman Sachs Group and International Automotive Components, as well as Wells Fargo &
Company warrants.
Securities of MBIA Inc., and Sanofi ADR were negative contributors to the Fund’s performance
during the same period.
Our covered call options of Overstock.com Inc. expired in March of 2014.
1The alternative method of purchasing Chou Associates Fund in $U.S. has been offered since September 2005.
Performance for years prior to September 2005 is based on the $U.S. equivalent conversion of the results of the Chou Associates Fund ($CAN). The investments in the Chou Associates Fund ($CAN) are the same as the investments in Chou Associates Fund ($U.S.) except for the currency applied.
2
PTGi Holdings Inc. changed its name to HC2 Holdings Incorporated, which were sold in their
entirety. The Fund also sold all of its equity holdings of Actavis PLC.
A Tale of two Scenarios I have been managing money since 1981 and one of the benefits of managing money for so long
is that you get exposed to many financial and economic scenarios.
When I was thinking about the current market, I couldn’t help but recall what happened over the
fifteen year period 1966 to 1981. The Dow Jones Industrial Average, hit a high of approximately
1000 in 1966 and for the next fifteen years it would approach that level only to recede back
again. Inflation, which was subdued in the 1960s, started to go up in the 1970s, the result of
printing money in the 1960s to finance the war in Vietnam.
By 1980, the combination of high inflation and low GDP growth was the story of the day.
Economists coined the term ‘Stagflation’. When Paul Volcker was named Chairman of the
Federal Reserve Board (Fed) in 1978, his first mandate was to tame inflation. By June 1981,
the federal funds rate rose to 20%. Eventually in June 1982, a highly important economic
measure - the prime interest rate, reached 21.5%. The 30-year bond hit a high of 15.2% yield
when he put the brakes on money printing. The Dow tumbled, selling at a severe discount to the
book value of the Dow.
At that time, I was wondering how much lower the market could go. This was how I looked at
the scenario; the interest rate was so high that I felt it could not remain at that level for any
extended period of time without just killing the economy. Volcker’s mandate was to break the
back of inflation, and when he did that, interest rates were bound to go lower. Even if they
didn’t, the market was incredibly cheap: approximately 6 times earnings and roughly 6%
dividend yield. The Dow had been earning for a long time, on average, 13% on its equity and
there was nothing to suggest that it was not going to earn the same in the future.
If interest rates went down, the end result would be that the companies would be worth a lot
more. The discount rate that you use to discount future earning power is somewhat linked to the
prevailing long term interest rate. When companies borrow money, the rate they pay, depending
on their credit rating, is benchmarked to the prevailing interest rate plus or minus a few points.
The climate for investing in 1980 was one of extreme fear. For example, pension funds, as a
group, invested only 9% of net investable assets in equities. In contrast, in 1971, 122% of net
funds available were purchased into equities; in other words, they sold bonds, to buy more of the
equities. Those who wanted to get into the investment field in the late 1970s and early 1980s
were considered pariahs at the time, and were to be avoided at all social gatherings as one who
would avoid the plague.
At that time I was getting totally immersed in the works of Benjamin Graham. I was hunting for
every scrap piece of information I could find in the library on Benjamin Graham and Warren
Buffett. Although I was new to the investment scene then, the scenario had the smell of sure
success for any value investor. Not just a success but something that would enable you to cook
up a grand career.
This is what I wrote in 1982, my first annual letter to my Unitholders.
"Is this the time to invest? Yes, definitely. Stocks, in this doom and gloom environment, are
cheap by every historical standard...What I would propose in the future, if the market is more

3
demoralized than what it is now, is that we should open this Fund to the public. There is no
better time to invest aggressively. Stocks are selling at a substantial discount from book value
and even during the Great Depression, the Dow Jones Industrial Average did not trade below
book value for more than a few months... Companies in the United States are selling at giveaway
prices."
The current scenario is totally the opposite. Some of the questions that bother me now are
opposite to what was bothering me in 1981.
1) How low can interest rates go? In Europe, some sovereign bonds are trading at negative
yields.
2) The Great Recession occurred in 2008, and now it is 2015 - that is seven long years. Although
the recovery has been anemic, at least it’s recovering.
3) The velocity of money for M2 is at an all-time low. This can be further highlighted if we
hypothesize about what would happen if M2 moved back up to the historical average. If a
regression to the mean were to occur – the price levels could be 25% higher than what it is today.
Carrying this logic one step further, with the current levels of money-printing growing at
approximately 7.2% annualized, this could see a potential price level increase of 50%, if the
velocity of money were to move back up to the historical average.
No one can predict the future with any high degree of certainty, but you wonder, if the current
policies continue for any extended period of time, when will the chickens come home to roost?
4) Deflationary forces are strong now; eventually, the supply and demand will bring everything
into equilibrium as they work through their economic cycles, but you cannot ‘un-print’ money.
5) Stock prices are close to an all time high if measured by price to earnings ratio, premium to
book value or current dividend yield.
6) Junk bonds, the biggest beneficiary of easy money, should be trading at 70, not at 100 cents
on a dollar with a 5.5% coupon rate.
7) What happens to the bond and stock markets if interest rates start to rise? In Europe some
sovereign bonds are selling at negative yields.
In 1981, I felt the economic conditions were such that you were set up for a huge success. You
just needed the courage to load up the truck and buy everything in sight. By contrast current
conditions make me feel that investors are being set up for a heartbreaking disappointment,
especially for the unwary.
Sears Holdings
As we have indicated before, we believe that Sears Holdings is a misunderstood story. There are
many moving parts but we believe Sears Holdings’ intrinsic value lies in its real estate assets. It
also has other valuable assets such as Kenmore, Craftsman and Diehard. Being a traditional
department store has become a tough business during the last decade but, according to
management, Sears is transitioning its historic focus on running a brick and mortar department
store into a business that provides and delivers value by serving its members in the manner most
convenient for them: whether in store, at home or through digital devices.
The value of its real estate allows Eddie Lampert, the controlling shareholder and CEO, the time
and money to effect the changes. What Lampert is doing is the right thing to do, considering the

4
possible outcomes – if it works, it’ll be a multi-bagger; if the transformation does not work out as
expected, we believe the real estate values are high enough that we would not lose money in our
investment at current prices after netting out all liabilities. If real estate was the only play from
Lampert’s viewpoint, it seems that he would have liquidated the company a long time ago.
Caveat Emptor: With Sears announcing the REIT plans for part of their real estate holdings,
which could be effected by the end of this year, those who bought Sears on the basis of that if the
retail operations do not pan out, the value is covered by its real estate - that kind of reasoning
will be less valid than before.
So, after the REIT transaction, you will be betting more on Sears' retail transformation,
ostensibly called as 'SHOPYOURWAY'. If it doesn't work out, Lampert will be called
'LOSTYOURWAY', and so will be the investors who are still holding the stock.
The various bonds and debentures in Sears will also have less coverage than before. Lampert was
smart enough to structure the debt in such a manner that if parts of Sears were spun off directly
or through rights offerings, fraudulent conveyance laws wouldn't come into play.
Some of the debt like the one at Sears, Roebuck and Acceptance Corp. (SRAC) are guaranteed
by Sears Holdings, but the assets of Lands' End, Sears Hometown and Sears Canada have flown
the coop. On some of these transactions, Sears did receive the cash, and that may mitigate the
argument of fraudulent conveyance laws. Unfortunately, the level at which cash is being
consumed is unacceptable and if the transformation does not happen soon enough or is not
sufficiently successful, it may make staying invested in Sears a highly risky investment, despite
its vast real estate holdings.
There is one unusual quirk in the latest bond issuance with a coupon of 8%, maturing in 2019. It
looks junior to the SRAC bonds but it gives the warrant holder the right to use this 8% bonds at
100 cents on a dollar to buy Sears Holdings stock at $28.41 per share. No wonder it is trading at
96 cents on a dollar versus 60 cents on a dollar for the SRAC bonds.
Debts at Negative Yields
I never thought that in my lifetime that we would ever see a situation in a developed economy
when there is a negative yield on interest rates. A few weeks ago, Finland floated a five-year
note at a negative yield. It sold 1 billion Euros worth of notes at an interest rate of negative
0.017%. In other words, noteholders or bondholders are willing to pay the government the
privilege of holding its notes. And this is not an aberration. Countries like Germany, France,
Sweden, Netherland, Belgium and Austria have seen their two-year sovereign debt trading at
negative yields.
Not to be outdone, a corporate bond of Nestle 3/4% maturing in October of 2016 is also trading
at a negative yield. So, you have come to this ridiculous situation where you can borrow money
for free.
The question now is, how can one capitalize on the situation? There are several possible ways of
doing that, but one way of seeking to take advantage of this type of situation is through an
interest rate swap. An interest rate swap is a derivative contract between two counterparties
whereby they agree to exchange one stream of interest payments for another, over a set period of
time.
5
We are still considering the use of interest rate swaps and other similar derivatives. If we do use
these contracts, we will do our best to quantify the risk of loss from these contracts and minimize
losses if interest rates do not move in the manner that we anticipate. Of course, there is no
guarantee that our use of these interest rate derivatives will work as intended or that we will
accurately predict or analyze the direction of future interest rates.
We are starting to look at credit default swaps (CDS)
One way of assessing investors' appetite for risk is to check the prices of credit default swaps
(CDS). In CDS, one party sells credit protection and the other party buys credit protection. Put
another way, one party is selling insurance and the counterparty is buying insurance against the
default of a specific third party’s debt. If the protection buyer does not own debt issued by the
third party, then CDS are more appropriately viewed as an investment transaction, rather than a
hedging transaction, for the protection buyer notwithstanding the insurance-like features of a
CDS. In most CDS, the protection buyer makes the premium payments over the life of the CDS,
frequently on a quarterly basis.
We believe that CDS are starting to sell at prices that are becoming interesting. At recent prices,
they appear to offer one of the potentially cheapest forms of insurance against market
disruptions. We are continuing to monitor CDS prices and may potentially invest in CDS in the
future. We are looking at who deals in such investments and we want to examine carefully what
counterparty risk we may be exposed to. The mechanics of investing in CDS have changed
somewhat from six years ago.
To make money in CDS, you don’t need a default of the third party’s debt. A dislocation in the
economy or deterioration in the credit profile of the issuer may cause the CDS price to rise from
these low levels. The negative aspect is that, like insurance, the premium paid for the protection
erodes over time and may expire worthless. There is no guarantee that the Manager will make
money for the Fund on any particular CDS or correctly predict an increase of value in any
particular CDS.
Caution to the Investors
Investors should be advised that we run a highly focused portfolio. In addition, we may have
securities that are non-U.S. and could be subjected to geopolitical risks, which may trump or at
least negatively influence the financial performance of the company. Also, we may enter into
some derivative contracts with regard to CDS and interest rate swaps. Because of these factors,
the net asset value of the Fund can be volatile. However, we are not bothered by this volatility
because our focus has always been, and continues to be, on how inexpensive we believe the
investments are relative to their intrinsic value.

6
Other Matters
FOREIGN CURRENCY CONTRACTS: None existed at December 31, 2014.
CREDIT DEFAULT SWAPS: None existed at December 31, 2014.
CONSTANT MATURITY SWAPS: None existed at December 31, 2014.
U.S. DOLLAR VALUATION: Any investor who wishes to purchase the Chou Funds in $U.S. is
now able to do so.
REDEMPTION FEE: We have a redemption fee of 2% if unitholders redeem their units in less
than two years. None of this fee goes to the Fund Manager. It is put back into the Fund for the
benefit of the remaining unitholders.
INDEPENDENT REVIEW COMMITTEE: The Manager has established an IRC as required by
NI 81-107. The members of the IRC are Sandford Borins, Peter Gregoire and Joe Tortolano.
The 2014 IRC Annual Report is available on our website www.choufunds.com.
As of March 16, 2015, the NAVPU of a Series A unit of the Fund was $132.93 and the cash
position was approximately 26.1% of net assets. The Fund is up 7.0% from the beginning of the
year. In $U.S., it is down 2.7%. While 2015 is off to a good start, please do not extrapolate these
returns into the future.
Except for the performance numbers of the Chou Associates Fund, this letter contains estimates
and opinions of the Fund Manager and is not intended to be a forecast of future events, a
guarantee of future returns or investment advice. Any recommendations contained or implied
herein may not be suitable for all investors.
Yours truly,
Francis Chou
Fund Manager

7
MANAGEMENT'S RESPONSIBILITY FOR FINANCIAL REPORTING
To the Unitholders of the Chou Funds:
The accompanying financial statements have been prepared by the management of Chou Associates Management Inc. Management is responsible for the information and representations made in these financial statements.
Management has applied appropriate processes to ensure that the statements contain relevant and reliable financial information. The financial statements have been produced in accordance with accounting principles generally accepted in Canada and include certain amounts based on estimates and judgments. The significant accounting policies that management believes are appropriate for the Chou Funds are described in note 2 to the financial statements.
The Trustee of each of the Trusts is responsible for reviewing and approving the financial statements, and for overseeing management's performance of its financial reporting responsibilities. The Trustee reviews the financial statements, the adequacy of internal controls, the audit process and the financial data with management and the external auditors.
The Board of Directors of Chou Associates Management is responsible for reviewing and approving the financial statements, and for overseeing management's performance of its financial reporting responsibilities. It reviews the financial statements, the adequacy of internal controls, the audit process and the financial data with management and the external auditors. Once satisfied, the Board approves the financial statements.
KPMG LLP is the external auditor of the Chou Funds. They are appointed by the respective Boards and cannot be changed without the prior approval of the Independent Review Committee and on 60 days notice to the unitholders.
Francis Chou Chou Associates Management Inc.

KPMG LLP Telephone (416) 777-8500 Bay Adelaide Centre Fax (416) 777-8818 333 Bay Street Suite 4600 Internet www.kpmg.ca Toronto ON M5H 2S5 Canada
KPMG LLP is a Canadian limited liability partnership and a member firm of the KPMG network of independent member firms affiliated with KPMG International Cooperative (“KPMG International”), a Swiss entity. KPMG Canada provides services to KPMG LLP.
8
INDEPENDENT AUDITORS' REPORT To the Trustee and Unitholders of:
Chou Associates Fund Chou Asia Fund Chou Europe Fund Chou Bond Fund Chou RRSP Fund (collectively the "Funds")
We have audited the accompanying financial statements of the Funds, which comprise the statements of financial position as at December 31, 2014, December 31, 2013 and January 1, 2013, the statements of comprehensive income, changes in net assets attributable to holders of redeemable units and cash flows for the years ended December 31, 2014 and December 31, 2013, and notes, comprising a summary of significant accounting policies and other explanatory information.
Management's Responsibility for the Financial Statements
Management is responsible for the preparation and fair presentation of these financial statements in accordance with International Financial Reporting Standards, and for such internal control as management determines is necessary to enable the preparation of financial statements that are free from material misstatement, whether due to fraud or error.
Auditors' Responsibility
Our responsibility is to express an opinion on these financial statements based on our audits. We conducted our audits in accordance with Canadian generally accepted auditing standards. Those standards require that we comply with ethical requirements and plan and perform the audit to obtain reasonable assurance about whether the financial statements are free from material misstatement.
An audit involves performing procedures to obtain audit evidence about the amounts and disclosures in the financial statements. The procedures selected depend on our judgment, including the assessment of the risks of material misstatement of the financial statements, whether due to fraud or error. In making those risk assessments, we consider internal control relevant to the entity's preparation and fair presentation of the financial statements in order to design audit procedures that are appropriate in the circumstances, but not for the purpose of expressing an opinion on the effectiveness of the entity's internal control. An audit also includes evaluating the appropriateness of accounting policies used and the reasonableness of accounting estimates made by management, as well as evaluating the overall presentation of the financial statements.
We believe that the audit evidence we have obtained in our audits is sufficient and appropriate to provide a basis for our audit opinion.
Opinion
In our opinion, the financial statements present fairly, in all material respects, the financial position of the Funds as at December 31, 2014, December 31, 2013 and January 1, 2013, and their financial performance and their cash flows for the years ended December 31, 2014 and December 31, 2013 in accordance with International Financial Reporting Standards.
Chartered Professional Accountants, Licensed Public Accountants March 20, 2015 Toronto, Canada

9
CHOU ASSOCIATES FUND Statements of Financial Position December 31, 2014, December 31, 2013 and January 1, 2013 December 31, December 31, January 1, 2014 2013 2013
(Note 10) (Note 10)
Assets
Current assets: Financial assets at fair value through profit or loss $ 345,994,347 $ 295,834,349 $ 318,004,822 Held-for-trading investments 51,653,088 39,626,972 23,187,360 Cash and cash equivalents 160,076,493 168,851,994 82,040,795 Receivable for units subscribed 368,864 310,439 44,973 Due from broker – – 3,064,154 Other receivable 361,591 319,525 165,880 Interest receivable 185,359 103,795 2,370,786 Dividends receivable – – 169,099
Total assets 558,639,742 505,047,074 429,047,869
Liabilities
Current liabilities: Financial liabilities at fair value through profit or loss – 568,087 – Accrued expenses 1,171,148 1,200,536 1,024,296 Payable for units redeemed 528,777 380,891 539,191 Distributions payable 118,415 384,458 461,860
Total liabilities 1,818,340 2,533,972 2,025,347
Net assets attributable to unitholders of redeemable units $ 556,821,402 $ 502,513,102 $ 427,022,522
Net assets attributable to unitholders of redeemable units: Series A $ 513,815,498 $ 468,682,187 $ 402,199,264 Series F 43,005,904 33,830,915 24,823,258
$ 556,821,402 $ 502,513,102 $ 427,022,522
Number of units outstanding (note 4): Series A 4,142,334 4,208,995 4,951,551 Series F 348,701 305,457 306,407
Net assets attributable to unitholders of redeemable units per unit (note 4):
Canadian dollars: Series A $ 124.04 $ 111.35 $ 81.23 Series F 123.33 110.76 81.01
U.S. dollars: Series A 106.88 104.72 81.66 Series F 106.27 104.16 81.44
See accompanying notes to financial statements.
Approved on behalf of the Board of Directors of Chou Associates Management Inc.:

10
CHOU ASSOCIATES FUND Statements of Comprehensive Income Years ended December 31, 2014 and 2013
2014 2013
(Note 10) Income:
Interest for distribution purposes and other $ 1,119,683 $ 976,815 Dividends 3,774,710 5,866,389 Securities lending income 3,852,694 2,868,166 Foreign currency gain on cash and other net assets 6,024,131 11,047,006 Other net changes in fair value of financial assets and
financial liabilities at fair value through profit or loss: Net realized gain on financial assets at fair value
through profit or loss 12,725,159 48,593,767 Net realized gain on held-for-trading investments 1,038,305 276,043 Change in unrealized appreciation on financial
assets at fair value through profit or loss 29,348,634 92,587,258 Change in unrealized appreciation on
held-for-trading investments 11,815,101 16,417,205
69,698,417 178,632,649 Expenses:
Management fees (note 5) 8,510,843 8,343,594 Custodian fees 561,705 587,500 Audit 54,750 88,889 Filing fees 45,625 50,100 Independent Review Committee fees 24,720 16,518 FundSERV fees 28,093 19,699 Legal fees 32,901 20,090 Foreign withholding taxes 193,097 609,911 Transaction costs 130,987 299,915
9,582,721 10,036,216
Increase in net assets attributable to unitholders of redeemable units $ 60,115,696 $ 168,596,433
Increase in net assets attributable to unitholders of
redeemable units: Series A $ 55,438,608 $ 158,725,306 Series F 4,677,088 9,871,127
$ 60,115,696 $ 168,596,433
Increase in net assets attributable to unitholders of
redeemable units per unit: Series A $ 13.31 $ 33.05 Series F 13.77 33.92
See accompanying notes to financial statements.

11
CHOU ASSOCIATES FUND Statements of Changes in Net Assets Attributable to Unitholders of Redeemable Units Years ended December 31, 2014 and 2013
2014 2013
(Note 10) Series A Net assets attributable to unitholders of redeemable units,
beginning of year $ 468,682,187 $ 402,199,264 Increase in net assets attributable to unitholders of
redeemable units 55,438,608 158,725,306 Proceeds from issue of units 33,224,005 26,355,749 Payments on redemption of units (43,470,813) (118,382,706) Distributions of income to unitholders:
Investment income (2,924,575) (605,233) Capital gains – (12,860,471)
Reinvested distributions 2,866,086 13,250,278
Net assets attributable to unitholders of redeemable units,
end of year 513,815,498 468,682,187 Series F Net assets attributable to unitholders of redeemable units,
beginning of year 33,830,915 24,823,258 Increase in net assets attributable to unitholders of
redeemable units 4,677,088 9,871,127 Proceeds from issue of units 14,063,642 5,717,985 Payments on redemption of units (9,504,333) (6,413,776) Distributions of income to unitholders:
Investment income (483,874) (298,242) Capital gains – (924,778)
Reinvested distributions 422,466 1,055,341
Net assets attributable to unitholders of redeemable units,
end of year 43,005,904 33,830,915
Total net assets attributable to unitholders of redeemable units, end of year $ 556,821,402 $ 502,513,102
See accompanying notes to financial statements.

12
CHOU ASSOCIATES FUND Statements of Cash Flows Years ended December 31, 2014 and 2013
2014 2013
(Note 10) (Note 10) Cash flows from operating activities:
Increase in net assets attributable to unitholders of redeemable units $ 60,115,696 $ 168,596,433
Adjustments for: Foreign currency gain on cash and other net assets (6,024,131) (11,047,006) Net realized gain on investments (13,763,464) (48,869,810) Change in unrealized appreciation on investments
and derivatives (41,163,735) (109,004,463) Change in non-cash operating working capital:
Decrease (increase) in interest receivable (81,564) 2,266,991 Decrease in dividends receivable – 169,099 Increase in other receivable (42,066) (153,645) Increase (decrease) in accrued expenses (29,388) 176,240 Purchase of investments (35,628,350) (32,605,565) Proceeds from sales of investments 27,801,348 199,842,940
Net cash generated from (used in) operating activities (8,815,654) 169,371,214 Cash flows from financing activities:
Distributions to unitholders of redeemable units, net of reinvested distributions (385,940) (460,507)
Proceeds from redeemable units issued 47,229,222 31,808,268 Amount paid on redemption of redeemable units (52,827,260) (124,954,782)
Net cash used in financing activities (5,983,978) (93,607,021) Foreign currency gain on cash and other net assets 6,024,131 11,047,006
Increase (decrease) in cash and cash equivalents (8,775,501) 86,811,199 Cash and cash equivalents, beginning of year 168,851,994 82,040,795
Cash and cash equivalents, end of year $ 160,076,493 $ 168,851,994
Supplemental information:
Interest received, net of withholding tax $ 1,038,119 $ 3,243,806 Dividends received, net of withholding tax 3,581,613 5,425,577 Security lending income received 3,810,628 2,714,521
See accompanying notes to financial statements.
13
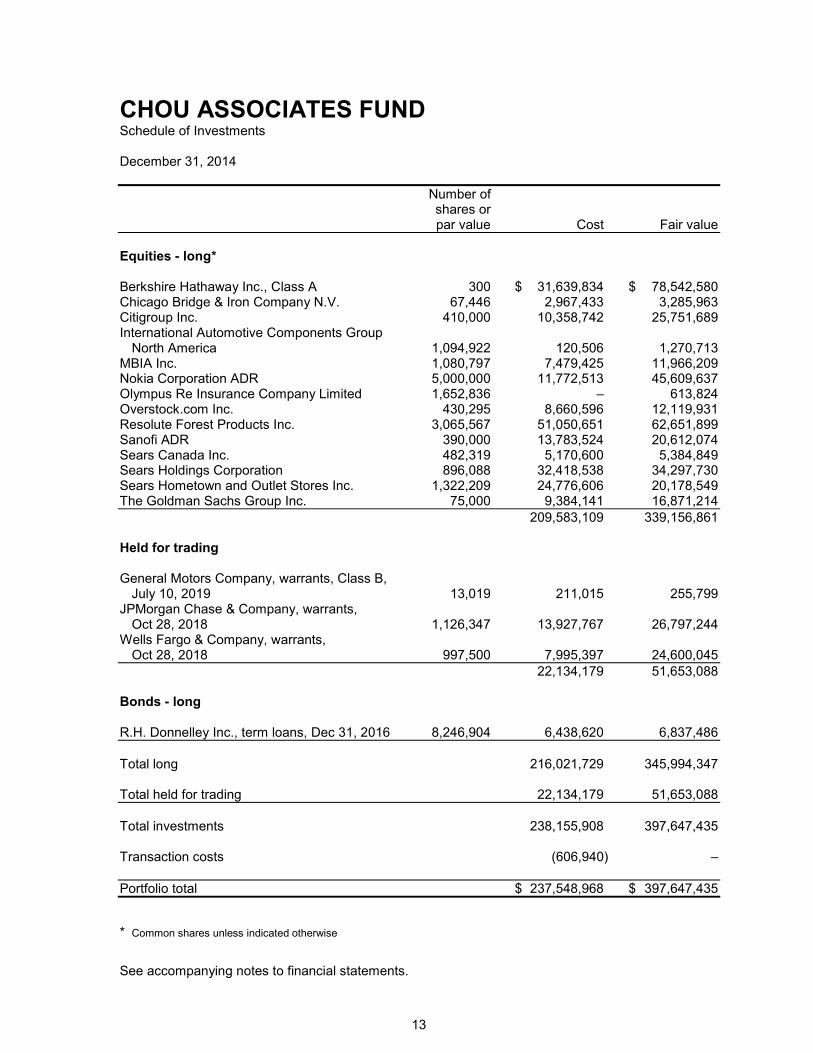
CHOU ASSOCIATES FUND Schedule of Investments December 31, 2014
Number of shares or par value Cost Fair value
Equities - long* Berkshire Hathaway Inc., Class A 300 $ 31,639,834 $ 78,542,580 Chicago Bridge & Iron Company N.V. 67,446 2,967,433 3,285,963 Citigroup Inc. 410,000 10,358,742 25,751,689 International Automotive Components Group
North America 1,094,922 120,506 1,270,713 MBIA Inc. 1,080,797 7,479,425 11,966,209 Nokia Corporation ADR 5,000,000 11,772,513 45,609,637 Olympus Re Insurance Company Limited 1,652,836 – 613,824 Overstock.com Inc. 430,295 8,660,596 12,119,931 Resolute Forest Products Inc. 3,065,567 51,050,651 62,651,899 Sanofi ADR 390,000 13,783,524 20,612,074 Sears Canada Inc. 482,319 5,170,600 5,384,849 Sears Holdings Corporation 896,088 32,418,538 34,297,730 Sears Hometown and Outlet Stores Inc. 1,322,209 24,776,606 20,178,549 The Goldman Sachs Group Inc. 75,000 9,384,141 16,871,214
209,583,109 339,156,861 Held for trading General Motors Company, warrants, Class B,
July 10, 2019 13,019 211,015 255,799 JPMorgan Chase & Company, warrants,
Oct 28, 2018 1,126,347 13,927,767 26,797,244 Wells Fargo & Company, warrants,
Oct 28, 2018 997,500 7,995,397 24,600,045
22,134,179 51,653,088 Bonds - long R.H. Donnelley Inc., term loans, Dec 31, 2016 8,246,904 6,438,620 6,837,486
Total long 216,021,729 345,994,347 Total held for trading 22,134,179 51,653,088
Total investments 238,155,908 397,647,435 Transaction costs (606,940) –
Portfolio total $ 237,548,968 $ 397,647,435
* Common shares unless indicated otherwise
See accompanying notes to financial statements.
CHOU ASSOCIATES FUND Discussion of Financial Risk Management (continued)
Years ended December 31, 2014 and 2013
14
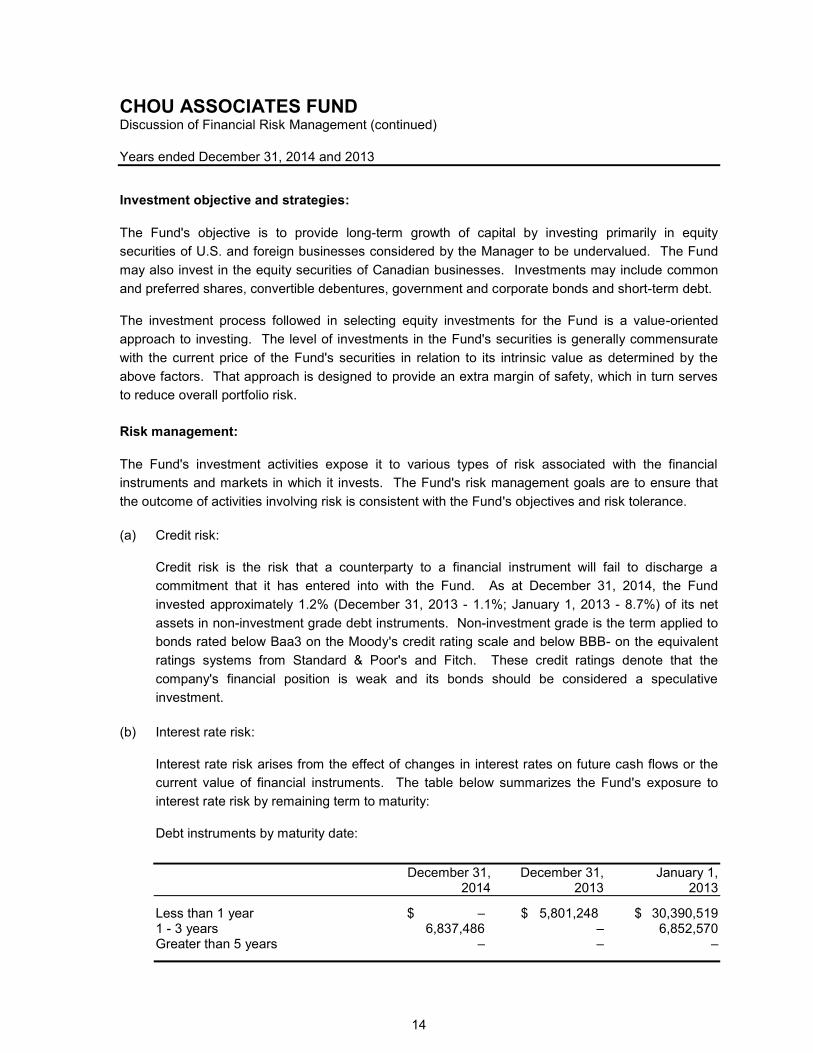
Investment objective and strategies:
The Fund's objective is to provide long-term growth of capital by investing primarily in equity
securities of U.S. and foreign businesses considered by the Manager to be undervalued. The Fund
may also invest in the equity securities of Canadian businesses. Investments may include common
and preferred shares, convertible debentures, government and corporate bonds and short-term debt.
The investment process followed in selecting equity investments for the Fund is a value-oriented
approach to investing. The level of investments in the Fund's securities is generally commensurate
with the current price of the Fund's securities in relation to its intrinsic value as determined by the
above factors. That approach is designed to provide an extra margin of safety, which in turn serves
to reduce overall portfolio risk.
Risk management:
The Fund's investment activities expose it to various types of risk associated with the financial
instruments and markets in which it invests. The Fund's risk management goals are to ensure that
the outcome of activities involving risk is consistent with the Fund's objectives and risk tolerance.
(a) Credit risk:
Credit risk is the risk that a counterparty to a financial instrument will fail to discharge a
commitment that it has entered into with the Fund. As at December 31, 2014, the Fund
invested approximately 1.2% (December 31, 2013 - 1.1%; January 1, 2013 - 8.7%) of its net
assets in non-investment grade debt instruments. Non-investment grade is the term applied to
bonds rated below Baa3 on the Moody's credit rating scale and below BBB- on the equivalent
ratings systems from Standard & Poor's and Fitch. These credit ratings denote that the
company's financial position is weak and its bonds should be considered a speculative
investment.
(b) Interest rate risk:
Interest rate risk arises from the effect of changes in interest rates on future cash flows or the
current value of financial instruments. The table below summarizes the Fund's exposure to
interest rate risk by remaining term to maturity:
Debt instruments by maturity date:
December 31, December 31, January 1, 2014 2013 2013
Less than 1 year $ – $ 5,801,248 $ 30,390,519 1 - 3 years 6,837,486 – 6,852,570 Greater than 5 years – – –

CHOU ASSOCIATES FUND Discussion of Financial Risk Management (continued)
Years ended December 31, 2014 and 2013
15
Risk management (continued):
As at December 31, 2014, had interest rates decreased or increased by 0.25%, with all other
variables remaining constant, the increase or decrease in net assets for the year would have
amounted to approximately $206,000 (December 31, 2013 - $257,000; January 1, 2013 -
$734,000).
In practice, the actual trading results may differ and the difference could be material.
(c) Other price risk:
Other price risk is the risk that the value of financial instruments will fluctuate as a result of
changes in market prices (other than those arising from interest rate risk or currency risk)
caused by factors specific to a security, its issuer or all factors affecting a market or a market
segment. Approximately 60.9% (December 31, 2013 - 67.0%; January 1, 2013 - 71.0%) of the
Fund's net assets held at December 31, 2014 were publicly traded equities. If equity prices on
the exchange had increased or decreased by 5% as at December 31, 2014, the net assets of
the Fund would have increased or decreased by approximately $16,958,000, or 3.0%
(December 31, 2013 - $16,479,000, or 3.2%; January 1, 2013 - $15,193,000, or 3.6%) of the
net assets, all other factors remaining constant.
In practice, the actual trading results may differ and the difference could be material.
(d) Foreign currency risk:
Currencies to which the Fund had exposure as at December 31, 2014, December 31, 2013 and
January 1, 2013 are as follows:
Financial Percentage December 31, 2014 instruments of NAV
United States dollar $ 444,637,610 79.8
Financial Percentage December 31, 2013 instruments of NAV
United States dollar $ 430,951,722 85.8
Financial Percentage January 1, 2013 instruments of NAV
United States dollar $ 419,339,502 98.2
CHOU ASSOCIATES FUND Discussion of Financial Risk Management (continued)
Years ended December 31, 2014 and 2013
16
Risk management (continued):
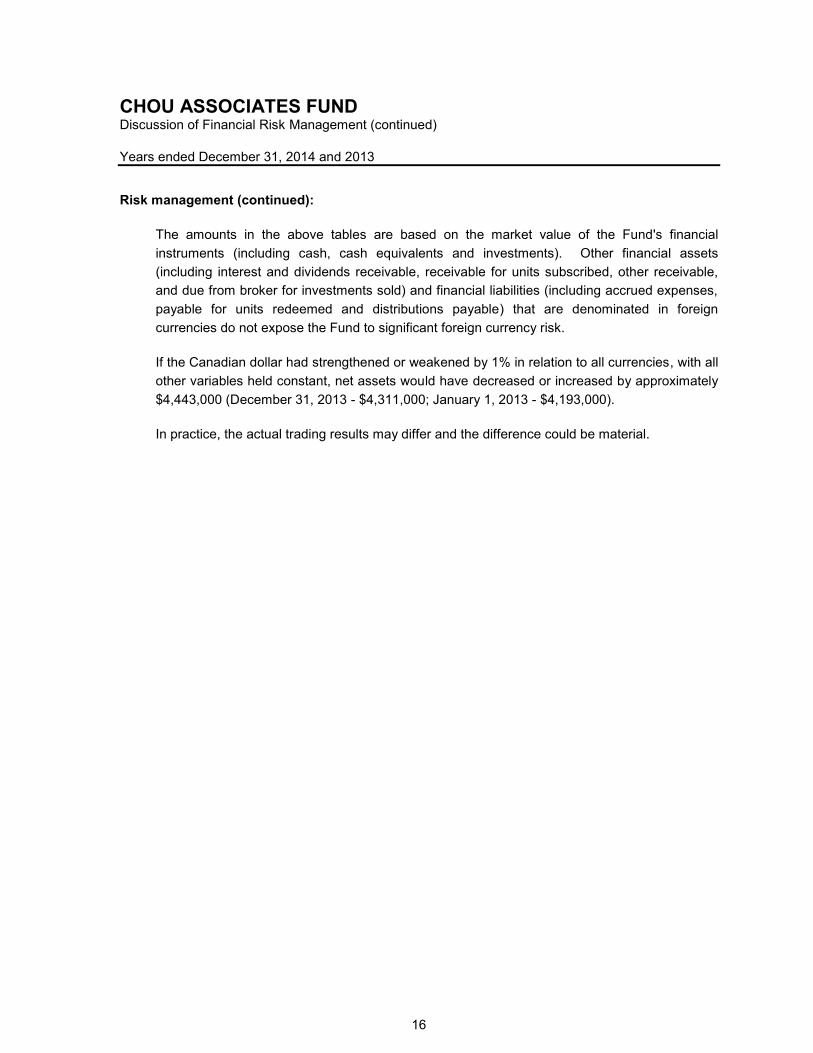
The amounts in the above tables are based on the market value of the Fund's financial
instruments (including cash, cash equivalents and investments). Other financial assets
(including interest and dividends receivable, receivable for units subscribed, other receivable,
and due from broker for investments sold) and financial liabilities (including accrued expenses,
payable for units redeemed and distributions payable) that are denominated in foreign
currencies do not expose the Fund to significant foreign currency risk.
If the Canadian dollar had strengthened or weakened by 1% in relation to all currencies, with all
other variables held constant, net assets would have decreased or increased by approximately
$4,443,000 (December 31, 2013 - $4,311,000; January 1, 2013 - $4,193,000).
In practice, the actual trading results may differ and the difference could be material.

17
CHOU ASIA FUND (unaudited)
March 16, 2015,
Dear Unitholders of Chou Asia Fund,
After the distribution of $0.32, the net asset value per unit (“NAVPU”) of a Series A unit of
Chou Asia Fund at December 31, 2014 was $17.70 compared to $16.74 at December 31, 2013,
an increase of 7.59%; during the same period, the MSCI AC (Morgan Stanley Capital
International All Country) Asia Pacific Total Return Index in Canadian dollars returned 9.5%. In
$U.S., a Series A unit of Chou Asia Fund was down 1.42% while the MSCI AC Asia Pacific
Total Return Index returned 0.5%.
The table shows our one-year, three-year, five-year and 10-year annual compound rates of return.
December 31, 2014
(Series A) 1 Year 3 Years 5 Years 10 Years
Chou Asia ($CAN) 7.6% 9.4% 6.6% 7.1%
MSCI AC Asia Pacific TR ($CAN) 9.5% 14.9% 7.9% 5.7%
Chou Asia ($U.S.)2 -1.4% 4.7% 4.5% 7.4%
MSCI AC Asia Pacific TR ($U.S.) 0.5% 9.9% 5.9% 6.1% Rates of return are historical total returns that include changes in unit prices, and assume the reinvestment of all distributions.
These annual compounded returns do not take into account any sales charges, redemption fees, other optional expenses or income
taxes that you have to pay and that could reduce these returns. The returns are not guaranteed. The Fund’s past performance does
not necessarily indicate future performance. The table is used only to illustrate the effects of the compound growth rate and is not
intended to reflect future values of the mutual funds or returns on the mutual funds. Commissions, trailing commissions,
management fees and expenses all may be associated with mutual fund investments. Please read the prospectus before investing.
Factors Influencing the 2014 Results
The largest positive impact on the Fund stemmed from the weakness of the Canadian dollar vis-
a-vis the Hong Kong dollar ($HK) on the NAVPU of the Fund. For example, on December 31,
2013, one $HK was worth approximately $0.14 Canadian, whereas one year later, on December
31, 2014, one $HK was worth approximately $0.15 Canadian.
BYD Electronic (International) Company, Pyne Gould Corporation Ltd, BYD Company Limited
and China Yuchai International Limited were positive contributors to the Fund’s performance.
Most of the declines came from the equity securities of Hanfeng Evergreen Inc., and Glacier
Media Inc.
Shares of Hanfeng Evergreen Inc. have been delisted, therefore we have taken our valuation to
$0.05 per share.
2The alternative method of purchasing Chou Asia Fund in $U.S. has been offered since September 2005.
Performance for years prior to September 2005 is based on the $U.S. equivalent conversion of the results of the Chou Asia Fund ($CAN). The investments in the Chou Asia Fund ($CAN) are the same as the investments in Chou Asia Fund ($U.S.) except for the currency applied.
18
The Fund decreased its holdings in BYD Electronic (International) Company, and sold all its
shares of Resolute Forest Products Inc., Sankyo Company Limited and UTStarcom Holdings
Corporation.
China
We do not believe that China’s economy is as healthy as the government wants us to think.
Constant reminders are the huge sums of money that were put into building cities from the
ground up, complete with highways, skyscrapers and shopping malls, ready for a city’s
population to move in. Over the years, we have seen many examples where these cities were
built unnecessarily to maintain China’s desired level of growth, but now remain eerily empty,
without a soul in sight. I would be wary of investing in a company where the price of a
commodity plays a significant role in the company’s ability to make money.
Notwithstanding how we feel about China, if we do happen to find a bargain we feel is worth it,
we will not hesitate to invest in it. As an example, we purchased BYD Electronic International, a
company that researches, develops, and manufactures handset components for handset
manufacturers, for an average cost price of approximately $HK1.83. Its stock price rose to
$HK7.50 as at December 31, 2014. Similarly, we purchased BYD Company Limited for an
average cost price of approximately $HK13.35, and on December 31, 2014, it stood at
$HK30.35.
Japan Japan has a number of serious issues to address and when the Prime Minister Shinzo Abe was
elected in late 2012, he undertook an aggressive monetary policy that he said would double the
country’s monetary base. Many think that this creation of an almost limitless supply of money is
benign, as long as the economy does not show any visible sign of high inflation in the short term.
In fact it is generally accepted that low inflation (in the 3% range) is good for the economy.
However, printing money has serious repercussions. It creates asset bubbles and sets the stage
for a financial crisis as it has done in the past. For example, spectacular real estate bubbles
happened in Japan in the 1980s and more recently in Ireland, Spain, the United Kingdom and the
United States in the 2000s, and when the bubble burst as it should have, it led to severe
recessions and financial crisis.
We have some investments in Japan but we do not feel comfortable adding more in the future.
However, if we do find a genuine bargain and purchase it for the Fund, we would most likely
hedge the Japanese currency. In other words, we are betting on the security but, at the same time,
not letting the currency affect the total return. We think the Japanese yen should weaken versus
the dollar when viewed from a long-term perspective.
All the cash holdings we had in Japanese yen have been converted to Canadian dollars.
We do not know if there is an instrument that we can use to take advantage of this anomaly - one
of the biggest debtors in the world and one of the lowest interest rates among the developed
nations, but we are looking around.

19
Other Matters
FOREIGN CURRENCY CONTRACTS: None existed at December 31, 2014.
CREDIT DEFAULT SWAPS: None existed at December 31, 2014.
CONSTANT MATURITY SWAPS: None existed at December 31, 2014.
U.S. DOLLAR VALUATION: Any investor who wishes to purchase the Chou Funds in $U.S. is
now able to do so.
REDEMPTION FEE: We have a redemption fee of 2% if unitholders redeem their units in less
than two years. None of this fee goes to the Fund Manager. It is put back into the Fund for the
benefit of the remaining unitholders.
INDEPENDENT REVIEW COMMITTEE: The Manager has established an IRC as required by
NI 81-107. The members of the IRC are Sandford Borins, Peter Gregoire and Joe Tortolano.
The 2014 IRC Annual Report is available on our website www.choufunds.com.
As of March 16, 2015, the NAVPU of a Series A unit of the Fund was $19.58 and the cash
position was approximately 39.3% of net assets. The Fund is up 10.6% from the beginning of the
year. In $U.S., it is up 0.6%. While 2015 is off to a good start, please do not extrapolate these
returns into the future.
Except for the performance numbers of the Chou Asia Fund, this letter contains estimates and
opinions of the Fund Manager and is not intended to be a forecast of future events, a guarantee of
future returns or investment advice. Any recommendations contained or implied herein may not
be suitable for all investors.
Yours truly,
Francis Chou
Fund Manager

20
CHOU ASIA FUND Statements of Financial Position December 31, 2014, December 31, 2013 and January 1, 2013 December 31, December 31, January 1, 2014 2013 2013
(Note 10) (Note 10)
Assets
Current assets: Financial assets at fair value through profit or loss $ 19,156,832 $ 24,245,031 $ 20,367,616 Cash and cash equivalents 20,023,286 15,497,629 17,458,211 Receivable for units subscribed 35,318 35,380 24,146 Other receivable 2,070 19,745 – Dividends receivable 10,100 10,266 –
Total assets 39,227,606 39,808,051 37,849,973
Liabilities
Current liabilities: Accrued expenses 61,732 77,997 82,227 Payable for units redeemed 5,673 20,595 49,870 Distributions payable 12,561 – 517
Total liabilities 79,966 98,592 132,614
Net assets attributable to unitholders of redeemable units $ 39,147,640 $ 39,709,459 $ 37,717,359
Net assets attributable to unitholders of redeemable units: Series A $ 37,324,196 $ 38,370,273 $ 36,646,830 Series F 1,823,444 1,339,186 1,070,529
$ 39,147,640 $ 39,709,459 $ 37,717,359
Number of units outstanding (note 4): Series A 2,109,279 2,291,643 2,711,744 Series F 102,055 79,004 78,634
Net assets attributable to unitholders of redeemable units per unit (note 4):
Canadian dollars: Series A $ 17.70 $ 16.74 $ 13.51 Series F 17.87 16.95 13.61
U.S. dollars: Series A 15.25 15.74 13.58 Series F 15.40 15.94 13.68
See accompanying notes to financial statements.
Approved on behalf of the Board of Directors of Chou Associates Management Inc.:

21
CHOU ASIA FUND Statements of Comprehensive Income Years ended December 31, 2014 and 2013
2014 2013
(Note 10) Income:
Interest for distribution purposes and other $ 4,840 $ 2,848 Dividends 454,163 501,341 Securities lending income 136,918 236,472 Foreign currency gain (loss) on cash and other net assets 1,124,566 (92,578) Other net changes in fair value of financial assets and
financial liabilities at fair value through profit or loss: Net realized gain on financial assets at fair value
through profit or loss 1,228,609 519,315 Change in unrealized appreciation on investments
and derivatives 713,168 7,841,701
3,662,264 9,009,099 Expenses:
Management fees (note 5) 657,820 634,763 Custodian fees 43,801 43,802 Audit 3,650 5,664 Filing fees 347 1,720 Independent Review Committee fees 1,978 1,351 FundSERV fees 577 860 Legal fees 991 – Foreign withholding taxes 59,237 57,914 Transaction costs 15,479 12,282
783,880 758,356
Increase in net assets attributable to unitholders of redeemable units $ 2,878,384 $ 8,250,743
Increase in net assets attributable to unitholders of
redeemable units: Series A $ 2,785,938 $ 8,007,565 Series F 92,446 243,178
$ 2,878,384 $ 8,250,743
Increase in net assets attributable to unitholders of
redeemable units per unit: Series A $ 1.29 $ 3.26 Series F 1.13 3.23
See accompanying notes to financial statements.

22
CHOU ASIA FUND Statements of Changes in Net Assets Attributable to Unitholders of Redeemable Units Years ended December 31, 2014 and 2013
2014 2013
(Note 10) Series A Net assets attributable to unitholders of redeemable units,
beginning of year $ 38,370,273 $ 36,646,830 Increase in net assets attributable to unitholders of
redeemable units 2,785,938 8,007,565 Proceeds from issue of units 1,814,263 850,464 Payments on redemption of units (5,636,420) (7,134,586) Distributions of income to unitholders:
Capital gains (654,367) – Reinvested distributions 644,509 –
Net assets attributable to unitholders of redeemable units,
end of year 37,324,196 38,370,273 Series F Net assets attributable to unitholders of redeemable units,
beginning of year 1,339,186 1,070,529 Increase in net assets attributable to unitholders of
redeemable units 92,446 243,178 Proceeds from issue of units 838,038 414,467 Payments on redemption of units (443,523) (389,006) Distributions of income to unitholders:
Capital gains (46,568) – Reinvested distributions 43,865 18
Net assets attributable to unitholders of redeemable units,
end of year 1,823,444 1,339,186
Total net assets attributable to unitholders of redeemable units, end of year $ 39,147,640 $ 39,709,459
See accompanying notes to financial statements.

23
CHOU ASIA FUND Statements of Cash Flows Years ended December 31, 2014 and 2013
2014 2013
(Note 10) (Note 10) Cash flows from operating activities:
Increase in net assets attributable to unitholders of redeemable units $ 2,878,384 $ 8,250,743
Adjustments for: Foreign currency loss (gain) on cash and
other net assets (1,124,566) 92,578 Net realized gain on investments (1,228,609) (519,315) Change in unrealized appreciation on investments
and derivatives (713,168) (7,841,701) Change in non-cash operating working capital:
Decrease (increase) in dividends receivable 166 (10,266) Decrease (increase) in other receivable 17,675 (19,745) Decrease in accrued expenses (16,265) (4,230) Purchase of investments – (389,173) Proceeds from sales of investments 7,029,976 4,872,774
Net cash generated from operating activities 6,843,593 4,431,665 Cash flows from financing activities:
Distributions to unitholders of redeemable units, net of reinvested distributions – (499)
Proceeds from redeemable units issued 2,652,363 1,253,697 Amount paid on redemption of redeemable units (6,094,865) (7,552,867)
Net cash used in financing activities (3,442,502) (6,299,669) Foreign currency gain (loss) on cash and other net assets 1,124,566 (92,578)
Increase (decrease) in cash and cash equivalents 4,525,657 (1,960,582) Cash and cash equivalents, beginning of year 15,497,629 17,458,211
Cash and cash equivalents, end of year $ 20,023,286 $ 15,497,629
Supplemental information:
Interest received, net of withholding tax $ 4,840 $ 2,848 Dividends received, net of withholding tax 395,092 433,161 Security lending income received 154,593 216,727
See accompanying notes to financial statements.

24
CHOU ASIA FUND Schedule of Investments December 31, 2014
Number of shares or par value Cost Fair value
Equities - long* AJIS Company Limited 15,200 $ 213,157 $ 270,756 BYD Company Limited, Class H 573,000 989,812 2,602,998 BYD Electronic (International) Company Limited 1,798,000 436,061 2,018,419 China Yuchai International Limited 25,537 341,981 563,103 Chunghwa Telecom Company Limited ADR 132,088 2,812,134 4,505,334 Glacier Media Inc. 505,007 1,363,645 757,511 Hanfeng Evergreen Inc. 95,850 228,548 4,793 PRONEXUS Inc. 657,500 3,093,387 4,773,909 Pyne Gould Corporation Limited 9,627,219 2,155,762 3,660,009
Total long 11,634,487 19,156,832
Total investments 11,634,487 19,156,832 Transaction costs (8,331) –
Portfolio total $ 11,626,156 $ 19,156,832
*Common shares unless indicated otherwise
See accompanying notes to financial statements.

CHOU ASIA FUND Discussion of Financial Risk Management (continued) Years ended December 31, 2014 and 2013
25
Investment objective and strategies:
The Fund's objective is to provide long-term growth of capital by investing primarily in equity
securities of Asian businesses considered by the Manager to be undervalued. Investments may be
made in securities other than equities and in businesses located outside of Asia. Investments may
include common and preferred shares, convertible debentures, government and corporate bonds and
short-term debt.
The investment process followed in selecting equity investments for the Fund is a value-oriented
approach to investing that focuses on the Asian market. The investment strategy follows strong
disciplines with regard to price paid to acquire portfolio investments. The level of investments in the
Fund's securities is generally commensurate with the current price of the company's securities in
relation to its intrinsic value as determined by the above factors. That approach is designed to
provide an extra margin of safety, which in turn serves to reduce overall portfolio risk.
Risk management:
The Fund's investment activities expose it to various types of risk associated with the financial
instruments and markets in which it invests. The Fund's risk management goals are to ensure that
the outcome of activities involving risk is consistent with the Fund's objectives and risk tolerance.
(a) Other price risk:
Other price risk is the risk that the value of financial instruments will fluctuate as a result of
changes in market prices (other than those arising from interest rate risk or currency risk)
caused by factors specific to a security, its issuer or all factors affecting a market or a market
segment. Approximately 48.9% (December 31, 2013 - 61.0%; January 1, 2013 - 54.0%) of the
Fund's net assets held at December 31, 2014 were publicly traded equities. If equity prices on
the exchange had increased or decreased by 5% as at December 31, 2014, the net assets of
the Fund would have increased or decreased by approximately $958,000, or 2.4%
(December 31, 2013 - $1,211,000 or 3.0%; January 1, 2013 - $1,018,000 or 2.7%) of the net
assets, all other factors remaining constant.
In practice, the actual trading results may differ and the difference could be material.

CHOU ASIA FUND Discussion of Financial Risk Management (continued) Years ended December 31, 2014 and 2013
26
Risk management (continued):
(b) Foreign currency risk:
Currencies to which the Fund had exposure as at December 31, 2014, December 31, 2013 and
January 1, 2013 are as follows:
Financial Percentage December 31, 2014 instruments of NAV
Hong Kong dollar $ 13,606,569 34.8 United States dollar $ 7,745,128 19.8 Japanese yen ¥ 7,379,441 18.9 New Zealand dollar $ 3,784,805 9.7 Singapore dollar $ 152,822 0.4
Financial Percentage December 31, 2013 instruments of NAV
Japanese yen ¥ 12,946,070 32.6 Hong Kong dollar $ 10,678,997 26.9 United States dollar $ 7,012,433 17.7 New Zealand dollar $ 4,163,438 10.5 Singapore dollar $ 146,899 0.4
Financial Percentage January 1, 2013 instruments of NAV
United States dollar $ 16,224,848 43.0 Japanese yen ¥ 12,039,391 31.9 Hong Kong dollar $ 5,700,089 15.1 New Zealand dollar $ 1,780,444 4.8 Singapore dollar $ 142,016 0.4
The amounts in the above tables are based on the market value of the Fund's financial
instruments (including cash, cash equivalents and investments). Other financial assets
(including dividends receivable and receivable for units subscribed) and financial liabilities
(including accrued expenses, payable for units redeemed and distributions payable) that are
denominated in foreign currencies do not expose the Fund to significant foreign currency risk.
If the Canadian dollar had strengthened or weakened by 1% in relation to all currencies, with all
other variables held constant, net assets would have decreased or increased by approximately
$327,000 (December 31, 2013 - $350,000; January 1, 2013 - $359,000).
In practice, the actual trading results may differ and the difference could be material.

27
CHOU EUROPE FUND (unaudited)
March 16, 2015
Dear Unitholders of Chou Europe Fund,
After the distribution of $0.02, the net asset value per unit (“NAVPU”) of a Series A unit of
Chou Europe Fund at December 31, 2014 was $11.72 compared to $11.62 at December 31,
2013, an increase of 0.94%; during the same period, the MSCI AC (Morgan Stanley Capital
International All Country) Europe Total Return Index in Canadian dollars returned 2.2%. In
$U.S., a Series A unit of Chou Europe Fund was down 7.51% while the MSCI AC Europe Total
Return Index was down 6.5%.
The table shows our one-year, three-year, five-year and 10-year annual compound rates of return.
December 31, 2014
(Series A)
1 Year 3 Years 5 Years 10 Years
Chou Europe ($CAN) 0.9% 22.0% 11.4% 3.1%
MSCI AC Europe TR ($CAN) 2.2% 16.9% 7.6% 4.8%
Chou Europe ($U.S.)3 -7.5% 16.3% 8.8% 3.3%
MSCI AC Europe TR ($U.S.) -6.5% 11.8% 5.5% 5.2%
Rates of return are historical total returns that include changes in unit prices, and assume the reinvestment of all distributions.
These annual compounded returns do not take into account any sales charges, redemption fees, other optional expenses or income
taxes that you have to pay and that could reduce these returns. The returns are not guaranteed. The Fund’s past performance does
not necessarily indicate future performance. The table is used only to illustrate the effects of the compound growth rate and is not
intended to reflect future values of the mutual funds or returns on the mutual funds. Commissions, trailing commissions,
management fees and expenses all may be associated with mutual fund investments. Please read the prospectus before investing.
Factors Influencing the 2014 Results
The biggest impact on the results of the Fund stemmed from the weakness of the Canadian dollar
against three major currencies: the U.S. dollar, the pound sterling and the Euro. The difference in
performance results between the NAVPU priced in Canadian dollars, versus U.S. dollars, is
attributable to the fact that on December 31, 2013, one U.S. dollar was worth approximately
$1.06 Canadian, whereas one year later, on December 31, 2014, one U.S. dollar was worth
approximately $1.16 Canadian. On December 31, 2013, one pound sterling was worth
approximately $1.76 Canadian, whereas on December 31, 2014, one pound sterling was worth
approximately $1.81 Canadian. And on December 31, 2013, one Euro was worth approximately
$1.47 Canadian, whereas on December 31, 2014, one Euro was worth approximately $1.40
Canadian.
Positive contributors to the Fund’s performance during the year ended December 31, 2014
included equity securities of Next PLC, AstraZeneca PLC, Ryanair Holdings PLC ADR, the
3 The alternative method of purchasing Chou Europe Fund in $U.S. has been offered since September 2005.
Performance for years prior to September 2005 is based on the $U.S. equivalent conversion of the results of the Chou Europe Fund ($CAN). The investments in the Chou Europe Fund ($CAN) are the same as the investments in Chou Europe Fund ($U.S.) except for the currency applied.

28
Bank of Ireland and Abbey PLC. The Canadian currency depreciated against the pound sterling,
which also contributed to the positive performance of the Fund.
The Fund’s largest equity decliners during the year were Sanofi ADR, BP PLC ADR,
GlaxoSmithKline PLC and Heracles General Cement Company SA.
We received common shares of Verizon Communications Inc. due to a spinoff from Vodafone
Group PLC ADR. In 2014, the Fund initiated new positions in Avangardco Investments, EFG
Eurobank Ergasias, Intralot S.A. and Pharmstandard GDR. We also sold all our holdings in
Vodafone Group PLC.
Portfolio Commentary
We were doing well in the first half of 2014 but in the second half some of our investments in
Greece and Ukraine were impacted by geopolitical factors. In Greece, when the incumbent
government announced a new election, there were fears after the election, about how the new
government would deal with the austerity measures, relations with Europe and the EU, and how
the Greek sovereign debts would be restructured. The stock market fell and almost all stocks
were decimated including the ones we own. Some of them have recovered to our purchase price
but Eurobank is substantially down from our cost price.
We have a small holding in the common shares Avangardco Investments. It is one of the leading
agro-industrial companies in Ukraine, focusing on the production of shell eggs and egg products.
According to the Pro-Consulting Report, it has a market share of approximately 57% of all
industrially produced shell eggs and 91% of all dry egg products produced in Ukraine in 2013.
The stock is down but the company has a strong balance sheets and decent financial operations
count, but we have to be cognizant of the fact that when investing in a country where there is a
civil war fueled by Putin, geopolitics can trump solid financials.
However, the flip side is that you won't find a decent bargain unless the company or the
environment they are operating in, has perceived serious issues. Baron Rothschild, a member of
the famous Rothschild banking family, made a killing in the panic that ensued after the Battle of
Waterloo against Napoleon. He is quoted to have said, "Buy when there's blood in the streets,
even if the blood is your own."
We believe that it is still too early to know whether our foray into Ukraine will continue to be
unprofitable in the long term. So far, we think it is more likely to be a short-term quotational loss
and not a permanent loss of capital.
Debts at Negative Yields
I never thought that in my lifetime that we would ever see a situation in a developed economy
when there is a negative yield on interest rates. A few weeks ago, Finland floated a five-year
note at a negative yield. It sold 1 billion Euros worth of notes at an interest rate of negative
0.017%. In other words, noteholders or bondholders are willing to pay the government for the
privilege of holding its notes. And this is not an aberration. Countries like Germany, France,
Sweden, Netherland, Belgium and Austria have seen their two-year sovereign debt trading at
negative yields.
The question now is, how can one capitalize on the situation? There are several possible ways of
doing that, but one way of seeking to take advantage of this type of situation is through an
interest rate swap. An interest rate swap is a derivative contract between two counterparties

29
whereby they agree to exchange one stream of interest payments for another, over a set period of
time.
We are still considering the use of interest rate swaps and other similar derivatives. If we do use
these contracts, we will do our best to quantify the risk of loss from these contracts and minimize
losses if interest rates do not move in the manner that we anticipate. Of course, there is no
guarantee that our use of these interest rate derivatives will work as intended or that we will
accurately predict or analyze the direction of future interest rates.
Other Matters
FOREIGN CURRENCY CONTRACTS: None existed at December 31, 2014.
CREDIT DEFAULT SWAPS: None existed at December 31, 2014.
CONSTANT MATURITY SWAPS: None existed at December 31, 2014.
U.S. DOLLAR VALUATION: Any investor who wishes to purchase the Chou Funds in $U.S. is
now able to do so.
REDEMPTION FEE: We have a redemption fee of 2% if unitholders redeem their units in less
than two years. None of this fee goes to the Fund Manager. It is put back into the Fund for the
benefit of the remaining unitholders.
INDEPENDENT REVIEW COMMITTEE: The Manager has established an IRC as required by
NI 81-107. The members of the IRC are Sandford Borins, Peter Gregoire and Joe Tortolano.
The 2014 IRC Annual Report is available on our website www.choufunds.com.
As of March 16, 2015, the NAVPU of a Series A unit of the Fund was $12.67 and the cash
position was approximately 36.1% of net assets. The Fund is up 8.1% from the beginning of the
year. In $U.S., it is down 1.7%. While 2015 is off to a positive start, please do not extrapolate
these returns into the future.
Except for the performance numbers of the Chou Europe Fund, this letter contains estimates and
opinions of the Fund Manager and is not intended to be a forecast of future events, a guarantee of
future returns or investment advice. Any recommendations contained or implied herein may not
be suitable for all investors.
Yours truly,
Francis Chou
Fund Manager

30
CHOU EUROPE FUND Statements of Financial Position December 31, 2014, December 31, 2013 and January 1, 2013 December 31, December 31, January 1, 2014 2013 2013
(Note 10) (Note 10)
Assets
Current assets: Financial assets at fair value through profit or loss $ 14,151,438 $ 8,430,391 $ 6,243,824 Cash and cash equivalents 9,250,100 10,159,297 1,547,846 Receivable for units subscribed 39,335 322,783 20,000 Dividends receivable 25,667 22,818 20,988
Total assets 23,466,540 18,935,289 7,832,658
Liabilities
Current liabilities: Accrued expenses 36,515 3,407 5,886 Payable for units redeemed 175,091 41,135 – Distributions payable 4,762 10,231 5,117
Total liabilities 216,368 54,773 11,003
Net assets attributable to unitholders of redeemable units $ 23,250,172 $ 18,880,516 $ 7,821,655
Net assets attributable to unitholders of redeemable units: Series A $ 20,884,225 $ 17,951,190 $ 7,803,332 Series F 2,365,947 929,326 18,323
$ 23,250,172 $ 18,880,516 $ 7,821,655
Number of units outstanding (note 4): Series A 1,785,202 1,544,393 937,889 Series F 200,686 79,132 2,180
Net assets attributable to unitholders of redeemable units per unit (note 4):
Canadian dollars: Series A $ 11.70 $ 11.62 $ 8.32 Series F 11.79 11.74 8.41
U.S. dollars: Series A 10.08 10.93 8.36 Series F 10.16 11.04 8.45
See accompanying notes to financial statements.
Approved on behalf of the Board of Directors of Chou Associates Management Inc.:
31
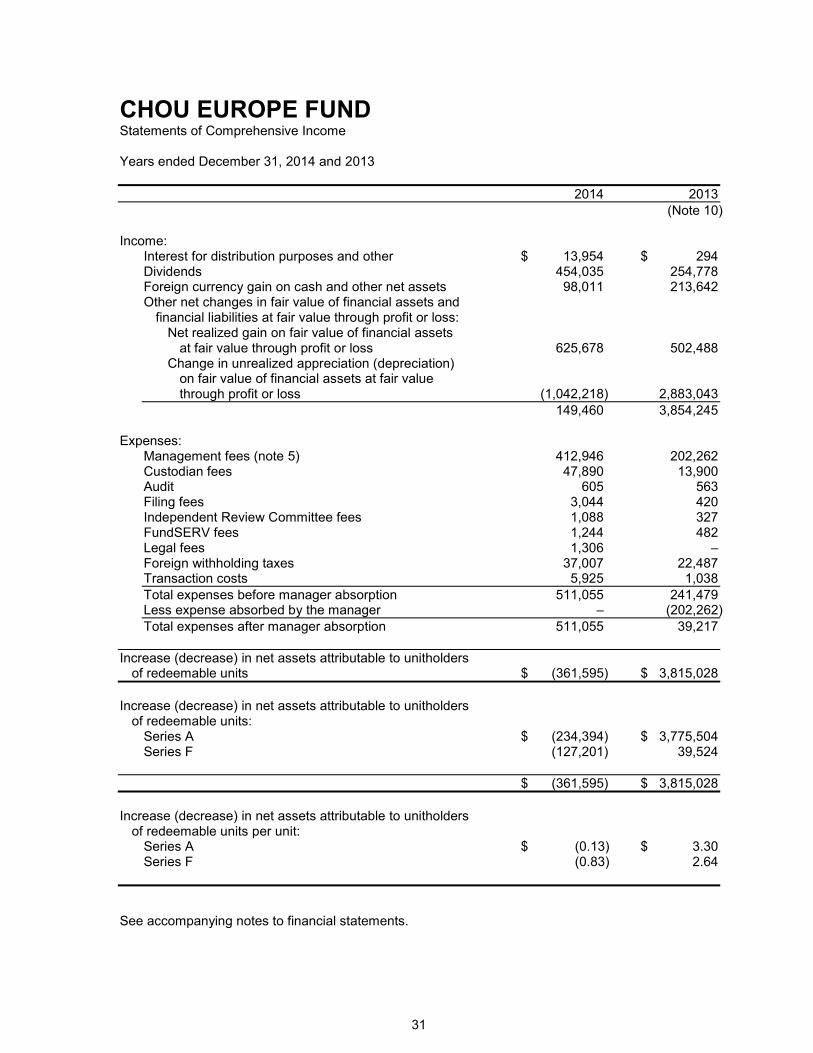
CHOU EUROPE FUND Statements of Comprehensive Income Years ended December 31, 2014 and 2013
2014 2013
(Note 10) Income:
Interest for distribution purposes and other $ 13,954 $ 294 Dividends 454,035 254,778 Foreign currency gain on cash and other net assets 98,011 213,642 Other net changes in fair value of financial assets and
financial liabilities at fair value through profit or loss: Net realized gain on fair value of financial assets
at fair value through profit or loss 625,678 502,488 Change in unrealized appreciation (depreciation)
on fair value of financial assets at fair value through profit or loss (1,042,218) 2,883,043
149,460 3,854,245 Expenses:
Management fees (note 5) 412,946 202,262 Custodian fees 47,890 13,900 Audit 605 563 Filing fees 3,044 420 Independent Review Committee fees 1,088 327 FundSERV fees 1,244 482 Legal fees 1,306 – Foreign withholding taxes 37,007 22,487 Transaction costs 5,925 1,038
Total expenses before manager absorption 511,055 241,479 Less expense absorbed by the manager – (202,262)
Total expenses after manager absorption 511,055 39,217
Increase (decrease) in net assets attributable to unitholders of redeemable units $ (361,595) $ 3,815,028
Increase (decrease) in net assets attributable to unitholders
of redeemable units: Series A $ (234,394) $ 3,775,504 Series F (127,201) 39,524
$ (361,595) $ 3,815,028
Increase (decrease) in net assets attributable to unitholders
of redeemable units per unit: Series A $ (0.13) $ 3.30 Series F (0.83) 2.64
See accompanying notes to financial statements.

32
CHOU EUROPE FUND Statements of Changes in Net Assets Attributable to Unitholders of Redeemable Units Years ended December 31, 2014 and 2013
2014 2013
(Note 10) Series A Net assets attributable to unitholders of redeemable units,
beginning of year $ 17,951,190 $ 7,803,332 Increase (decrease) in net assets attributable to unitholders
of redeemable units (234,394) 3,775,504 Proceeds from issue of units 9,523,946 7,843,566 Payments on redemption of units (6,355,311) (1,459,878) Distributions of income to unitholders:
Investment income (28,517) (205,855) Reinvested distributions 27,311 194,521
Net assets attributable to unitholders of redeemable units,
end of year 20,884,225 17,951,190 Series F Net assets attributable to unitholders of redeemable units,
beginning of year 929,326 18,323 Increase (decrease) in net assets attributable to unitholders
of redeemable units (127,201) 39,524 Proceeds from issue of units 2,195,879 871,662 Payments on redemption of units (628,501) – Distributions of income to unitholders:
Investment income (24,733) (10,686) Reinvested distributions 21,177 10,503
Net assets attributable to unitholders of redeemable units,
end of year 2,365,947 929,326
Total net assets attributable to unitholders of redeemable units, end of year $ 23,250,172 $ 18,880,516
See accompanying notes to financial statements.

33
CHOU EUROPE FUND Statements of Cash Flows Years ended December 31, 2014 and 2013
2014 2013
(Note 10) (Note 10) Cash flows from operating activities:
Increase (decrease) in net assets attributable to unitholders of redeemable units $ (361,595) $ 3,815,028
Adjustments for: Foreign currency gain on cash and other net assets (98,011) (213,642) Net realized gain on investments (625,678) (502,488) Change in unrealized depreciation (appreciation)
on investments and derivatives 1,042,218 (2,883,043) Change in non-cash operating working capital:
Increase in dividends receivable (2,849) (1,830) Increase (decrease) in accrued expenses 33,108 (2,480) Purchase of investments (7,465,014) – Proceeds from sales of investments 1,327,427 1,198,964
Net cash generated from (used in) operating activities (6,150,394) 1,410,509 Cash flows from financing activities:
Distributions to unitholders of redeemable units, net of reinvested distributions (10,231) (6,403)
Proceeds from redeemable units issued 12,003,273 8,412,446 Amount paid on redemption of redeemable units (6,849,856) (1,418,743)
Net cash generated from financing activities 5,143,186 6,987,300 Foreign currency gain on cash and other net assets 98,011 213,642
Increase (decrease) in cash and cash equivalents (909,197) 8,611,451 Cash and cash equivalents, beginning of year 10,159,297 1,547,846
Cash and cash equivalents, end of year $ 9,250,100 $ 10,159,297
Supplemental information:
Interest received, net of withholding tax $ 13,954 $ 294 Dividends received, net of withholding tax 414,179 230,461
See accompanying notes to financial statements.

34
CHOU EUROPE FUND Schedule of Investments December 31, 2014
Number of shares or par value Cost Fair value
Equities - long* Abbey PLC 33,005 $ 237,128 $ 504,240 AstraZeneca PLC 13,000 701,770 1,070,526 Avangardco Investments Public Limited 120,000 1,081,819 268,087 BP PLC ADR 10,000 313,497 442,170 EFG Eurobank Ergasias 5,000,000 2,356,029 1,312,926 GlaxoSmithKline PLC 18,000 491,338 447,722 Heracles General Cement Company S.A. 59 292 99 Intralot S.A. 717,575 1,659,636 1,078,151 Next PLC 18,000 581,417 2,219,090 OTCPharm PJSC 235,938 – 410,727 Pharmstandard GDR 177,605 1,385,014 1,240,840 Ryanair Holdings PLC ADR 17,000 478,533 1,406,111 Sanofi ADR 20,000 884,092 1,057,029 The Governor and Company of the
Bank of Ireland 3,400,000 383,114 1,494,348 Trastor Real Estate Investment Company 854,133 797,009 1,199,372
Total long 11,350,688 14,151,438
Total investments 11,350,688 14,151,438 Transaction costs (2,623) –
Portfolio total $ 11,348,065 $ 14,151,438
*Common shares unless indicated otherwise
See accompanying notes to financial statements.

CHOU EUROPE FUND Discussion of Financial Risk Management (continued) Years ended December 31, 2014 and 2013
35
Investment objective and strategies:
The Fund's objective is to provide long-term growth of capital by investing primarily in equity
securities of European businesses considered by the Manager to be undervalued. Investments may
be made in securities other than equities and in businesses located outside of Europe. Investments
may include common and preferred shares, convertible debentures, government and corporate bonds
and short-term debt.
The investment strategy follows strong disciplines with regard to price paid to acquire portfolio
investments. The level of investments in the Fund's securities is generally commensurate with the
current price of the Fund's securities in relation to its intrinsic value as determined by the above
factors. That approach is designed to provide an extra margin of safety, which in turn serves to
reduce overall portfolio risk.
Financial risk management:
The Fund's investment activities expose it to various types of risk associated with the financial
instruments and markets in which it invests. The Fund's risk management goals are to ensure that
the outcome of activities involving risk is consistent with the Fund's objectives and risk tolerance.
(a) Other price risk:
Other price risk is the risk that the value of financial instruments will fluctuate as a result of
changes in market prices (other than those arising from interest rate risk or currency risk)
caused by factors specific to a security, its issuer or all factors affecting a market or a market
segment. Approximately 60.9% (December 31, 2013 - 44.6%; January 1, 2013 - 79.8%) of the
Fund's net assets held at December 31, 2014 were publicly traded equities. If equity prices on
the exchange had increased or decreased by 5% as at December 31, 2014, the net assets of
the Fund would have increased or decreased by approximately $707,000, or 3.0%
(December 31, 2013 - $421,000, or 2.2%; January 1, 2013 - $312,000, or 4.0%) of the net
assets, all other factors remaining constant.
In practice, the actual trading results may differ and the difference could be material.

CHOU EUROPE FUND Discussion of Financial Risk Management (continued) Years ended December 31, 2014 and 2013
36
Financial risk management (continued):
(b) Foreign currency risk:
Currencies to which the Fund had exposure as at December 31, 2014, December 31, 2013 and
January 1, 2013 are as follows:
Financial Percentage December 31, 2014 instruments of NAV
Euro currency € 5,769,586 24.8 United States dollar $ 5,154,980 22.2 Sterling pound £ 3,737,337 16.1
Financial Percentage December 31, 2013 instruments of NAV
United States dollar $ 4,429,795 23.5 Sterling pound £ 3,588,285 19.0 Euro currency € 3,597,532 19.1
Financial Percentage January 1, 2013 instruments of NAV
United States dollar $ 3,164,353 40.5 Sterling pound £ 2,372,308 30.3 Euro currency € 2,020,156 25.8
The amounts in the above tables are based on the market value of the Fund's financial
instruments (including cash, cash equivalents and investments). Other financial assets
(including dividends receivable, other receivable and receivable for units subscribed) and
financial liabilities (including accrued expenses, payable for units redeemed and distributions
payable) that are denominated in foreign currencies do not expose the Fund to significant
foreign currency risk.
As at December 31, 2014, if the Canadian dollar had strengthened or weakened by 1% in
relation to all currencies with all other variables held constant, net assets would have
decreased or increased by approximately $147,000 (December 31, 2013 - $116,000;
January 1, 2013 - $54,000).
In practice, the actual trading results may differ and the difference could be material.

37
CHOU BOND FUND (unaudited)
March 16, 2015,
Dear Unitholders of Chou Bond Fund,
After the distribution of $0.62, the net asset value per unit (“NAVPU”) of a Series A unit of
Chou Bond Fund at December 31, 2014 was $9.96 compared to $9.64 at December 31, 2013, an
increase of 9.77%; during the same period, Barclays’ U.S. High Yield Index ($CAN) returned
11.3%. In $U.S., a Series A unit of Chou Bond Fund was up 0.58% while the Barclays U.S.
Corporate High Yield Index returned 2.5%.
The table shows our one-year, three-year and five-year and since inception annual compound
rates of return.
December 31, 2014
(Series A) 1 Year 3 Years 5 Years Since
Inception
Chou Bond ($CAN) 9.8% 15.3% 10.7% 6.7%
Barclays’ U.S. High Yield ($CAN) 11.3% 13.2% 11.2% 7.8%
Chou Bond ($U.S.) 4 0.6% 10.4% 8.4% 6.8%
Barclays’ U.S High Yield ($U.S.) 2.5% 8.4% 9.0% 8.2%
Rates of return are historical total returns that include changes in unit prices, and assume the reinvestment of all distributions.
These annual compounded returns do not take into account any sales charges, redemption fees, other optional expenses or income
taxes that you have to pay and that could reduce these returns. The returns are not guaranteed. The Fund’s past performance does
not necessarily indicate future performance. The table is used only to illustrate the effects of the compound growth rate and is not
intended to reflect future values of the mutual funds or returns on the mutual funds. Commissions, trailing commissions,
management fees and expenses all may be associated with mutual fund investments. Please read the prospectus before investing.
Factors Influencing the 2014 Results
The biggest impact on the results of the Fund stemmed from the weakness of the Canadian dollar
against the U.S. dollar which had a large positive impact on the results of the Fund. The
difference in performance results between the NAVPU priced in Canadian dollars, versus U.S.
dollars, is attributable to the fact that on December 31, 2013, one U.S. dollar was worth
approximately $1.06 Canadian, whereas one year later, on December 31, 2014, one U.S. dollar
was worth approximately $1.16 Canadian.
The equity securities of Resolute Forest Products Inc contributed positively to the Fund’s
performance during 2014, with the debt securities of Catalyst Paper Corporation, Atlanticus
Holdings Corporation and RH Donnelley Inc. contributing positively as well.
4 The alternative method of purchasing Chou Bond Fund in $U.S. has been offered since September 2005. The
investments in the Chou Bond Fund ($CAN) are the same as the investments in Chou Bond Fund ($U.S.) except for the currency applied.

38
The debt securities of Dex Media Inc. and Fortress Paper Limited contributed negatively to the
Fund’s performance during the year.
The Fund purchased debt securities of Ascent Capital Group Inc. 4% due July 15, 2020, Fortress
Paper Limited 6.5% due December 31, 2016, UkrLandFarming PLC 10.875% due March 26,
2018 and Avangardco Investments Public Limited 10.0% due October 29, 2015.
The Fund increased positions in convertible debentures of Fortress Paper Limited 7% due
December 31, 2019 and Catalyst Paper Corporation 11.0% due October 30, 2017. We reduced
holdings in the equity securities of Resolute Forest Products Inc. The term loan holdings of Dex
Media West LLC and RH Donnelley Inc. were decreased due to a cash flow sweep, which means
that any free cash flow remaining after all operational needs are met can be used to buy back
debt at par from its holders. All the equity securities in the Fund are the result of debt
restructuring.
The Fund sold all of its Level 3 Communications Inc. as well as Mega Brands Inc. bonds at
101% of the principal amount due to the acquisition through the wholly-owned subsidiary of
Mattel Inc.
Portfolio Commentary
Several of our debt securities were up for the year 2014. R.H. Donnelley's term loan rose from
61.20 cents on a dollar as of December 31, 2013 to 72.25 cents on a dollar as of December 31,
2014. Dex Media West's term loan rose from 78.60 cents on a dollar as of December 31, 2013 to
87.96 cents on a dollar as of December 31, 2014. At the time we bought into these two
companies, we believed they were well covered by their earning power, assets, and covenants
that are protective to debt holders. In addition, these term loans come with a cash-flow sweep,
which means that any free cash flow remaining after all operational needs are met can be used to
buy back debt at par from its holders. We continue to believe that at current prices, R.H
Donnelley and Dex Media West are underpriced.
Our primary losses came from our purchases of debt securities of two Ukrainian companies,
UkrLandFarming PLC and Avangardco Investments. UkrLandFarming PLC operates as an
integrated agricultural producer and distributor. The company engages in crops farming, eggs
and egg products production, sugar production, as well as cattle and meat production and
distribution.
Avangardco Investments is one of the leading agroindustrial companies in Ukraine, focusing on
the production of shell eggs and egg products. According to the Pro-Consulting Report, it has a
market share of approximately 57% of all industrially produced shell eggs and 91% of all dry
egg products produced in Ukraine in 2013.
The bonds are down from their purchase price but we expect the prices of the bonds we
purchased to be volatile and could be subjected to a permanent loss of capital. The companies
have strong balance sheets and decent financial operations count, but we have to be cognizant of
the fact that when investing in a country where there is a civil war fueled by Putin, geopolitics
can trump solid financials.
However, the flip side is that you won't find a decent bargain unless the company or the
environment they are operating in, has perceived serious issues. Baron Rothschild, a member of
39
the famous Rothschild banking family, made a killing in the panic that ensued after the Battle of
Waterloo against Napoleon. He is quoted to have said, "Buy when there's blood in the streets,
even if the blood is your own."
We believe that it is still too early to know whether our foray into Ukraine will continue to be
unprofitable in the long term. So far, we think it is more likely to be a short-term quotational loss
and not a permanent loss of capital.
Debts at Negative Yields
I never thought that in my lifetime that we would ever see a situation in a developed economy
when there is a negative yield on interest rates. A few weeks ago, Finland floated a five-year
note at a negative yield. It sold 1 billion Euros worth of notes at an interest rate of negative
0.017%. In other words, noteholders or bondholders are willing to pay the government for the
privilege of holding its notes. And this is not an aberration. Countries like Germany, France,
Sweden, Netherland, Belgium and Austria have seen their two-year sovereign debt trading at
negative yields.
Not to be outdone, a corporate bond of Nestle 3/4% maturing in October of 2016 is also trading
at a negative yield. So, you have come to this ridiculous situation where you can borrow money
for free.
The question now is, how can one capitalize on the situation? There are several possible ways of
doing that, but one way of seeking to take advantage of this type of situation is through an
interest rate swap. An interest rate swap is a derivative contract between two counterparties
whereby they agree to exchange one stream of interest payments for another, over a set period of
time.
We are still considering the use of interest rate swaps and other similar derivatives. If we do use
these contracts, we will do our best to quantify the risk of loss from these contracts and minimize
losses if interest rates do not move in the manner that we anticipate. Of course, there is no
guarantee that our use of these interest rate derivatives will work as intended or that we will
accurately predict or analyze the direction of future interest rates.
We are starting to look at credit default swaps (CDS)
We believe that CDS are starting to sell at prices that are becoming interesting. At recent prices,
they appear to offer one of the potentially cheapest forms of insurance against market
disruptions. We are continuing to monitor CDS prices and may potentially invest in CDS in the
future. We are looking at who deals in such investments and we want to examine carefully what
counterparty risk we may be exposed to. The mechanics of investing in CDS have changed
somewhat from six years ago.
To make money in CDS, you don’t need a default of the third party’s debt. A dislocation in the
economy or deterioration in the credit profile of the issuer may cause the CDS price to rise from
these low levels. The negative aspect is that, like insurance, the premium paid for the protection
erodes over time and may expire worthless. There is no guarantee that the Manager will make
money for the Fund on any particular CDS or correctly predict an increase of value in any
particular CDS.
40
Other Matters
DROPPING INDEX: Chou Bond Fund has been using two indices: Citigroup WGBI All
Maturities ("WGBI") Index and Barclays U.S. Corporate High Yield Index ("Barclays"). Moving
forward, the Fund will only make use of the Barclays Index.
Chou Bond Fund has been investing primarily in non-investment grade fixed income securities
and as such we believe the Barclays index is the most appropriate measurement against the Chou
Bond Fund. We believe that WGBI is no longer appropriate as a benchmark for performance
measurement.
FOREIGN CURRENCY CONTRACTS: None existed at December 31, 2014.
CREDIT DEFAULT SWAPS: None existed at December 31, 2014.
CONSTANT MATURITY SWAPS: None existed at December 31, 2014.
REDEMPTION FEE: We have a redemption fee of 2% if unitholders redeem their units in less
than two years. None of this fee goes to the Fund Manager. It is put back into the Fund for the
benefit of the remaining unitholders.
INDEPENDENT REVIEW COMMITTEE: The Manager has established an IRC as required by
NI 81-107. The members of the IRC are Sandford Borins, Peter Gregoire and Joe Tortolano.
The 2014 IRC Annual Report is available on our website www.choufunds.com.
As of March 16, 2015, the NAVPU of a Series A unit of the Fund was $10.57 and the cash
position was approximately 25% of net assets. The Fund is up 6.1% from the beginning of the
year. In $U.S., it is down 3.5%. While 2015 is off to a good start, please do not extrapolate these
returns into the future.
Except for the performance numbers of the Chou Bond Fund, this letter contains estimates and
opinions of the Fund Manager and is not intended to be a forecast of future events, a guarantee of
future returns or investment advice. Any recommendations contained or implied herein may not
be suitable for all investors.
Yours truly,
Francis Chou
Fund Manager
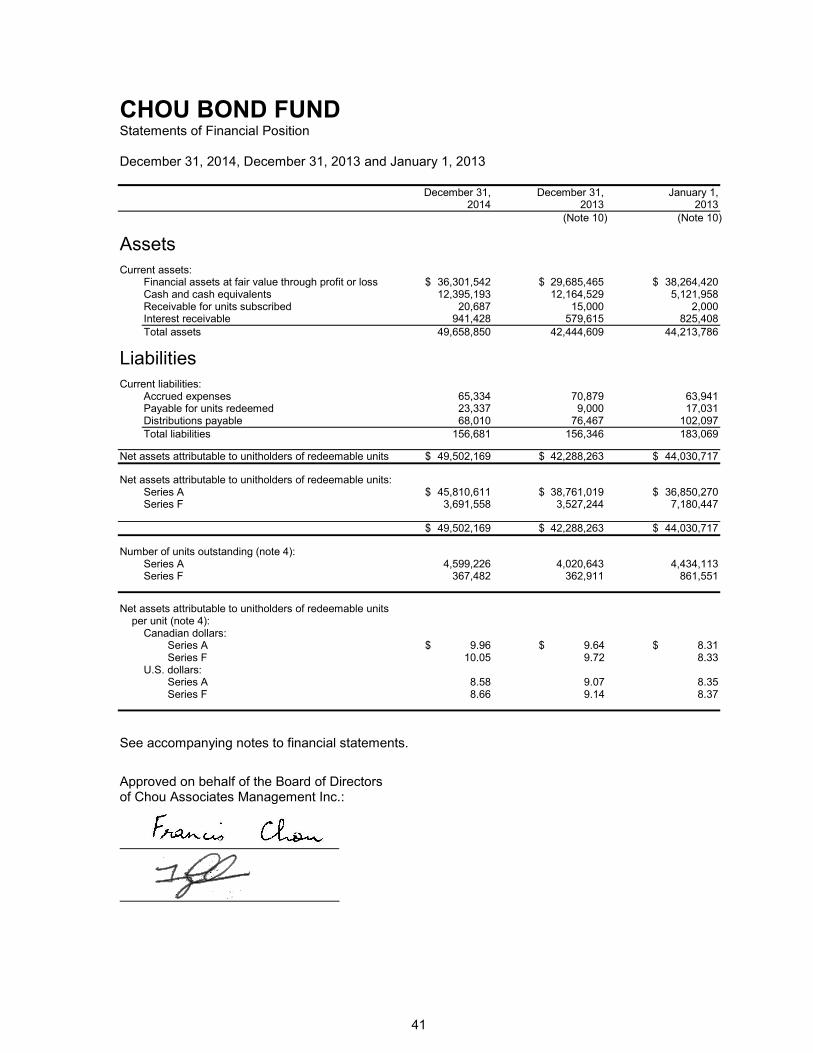
41
CHOU BOND FUND Statements of Financial Position December 31, 2014, December 31, 2013 and January 1, 2013 December 31, December 31, January 1, 2014 2013 2013
(Note 10) (Note 10)
Assets
Current assets: Financial assets at fair value through profit or loss $ 36,301,542 $ 29,685,465 $ 38,264,420 Cash and cash equivalents 12,395,193 12,164,529 5,121,958 Receivable for units subscribed 20,687 15,000 2,000 Interest receivable 941,428 579,615 825,408
Total assets 49,658,850 42,444,609 44,213,786
Liabilities
Current liabilities: Accrued expenses 65,334 70,879 63,941 Payable for units redeemed 23,337 9,000 17,031 Distributions payable 68,010 76,467 102,097
Total liabilities 156,681 156,346 183,069
Net assets attributable to unitholders of redeemable units $ 49,502,169 $ 42,288,263 $ 44,030,717
Net assets attributable to unitholders of redeemable units: Series A $ 45,810,611 $ 38,761,019 $ 36,850,270 Series F 3,691,558 3,527,244 7,180,447
$ 49,502,169 $ 42,288,263 $ 44,030,717
Number of units outstanding (note 4): Series A 4,599,226 4,020,643 4,434,113 Series F 367,482 362,911 861,551
Net assets attributable to unitholders of redeemable units per unit (note 4):
Canadian dollars: Series A $ 9.96 $ 9.64 $ 8.31 Series F 10.05 9.72 8.33
U.S. dollars: Series A 8.58 9.07 8.35 Series F 8.66 9.14 8.37
See accompanying notes to financial statements.
Approved on behalf of the Board of Directors of Chou Associates Management Inc.:
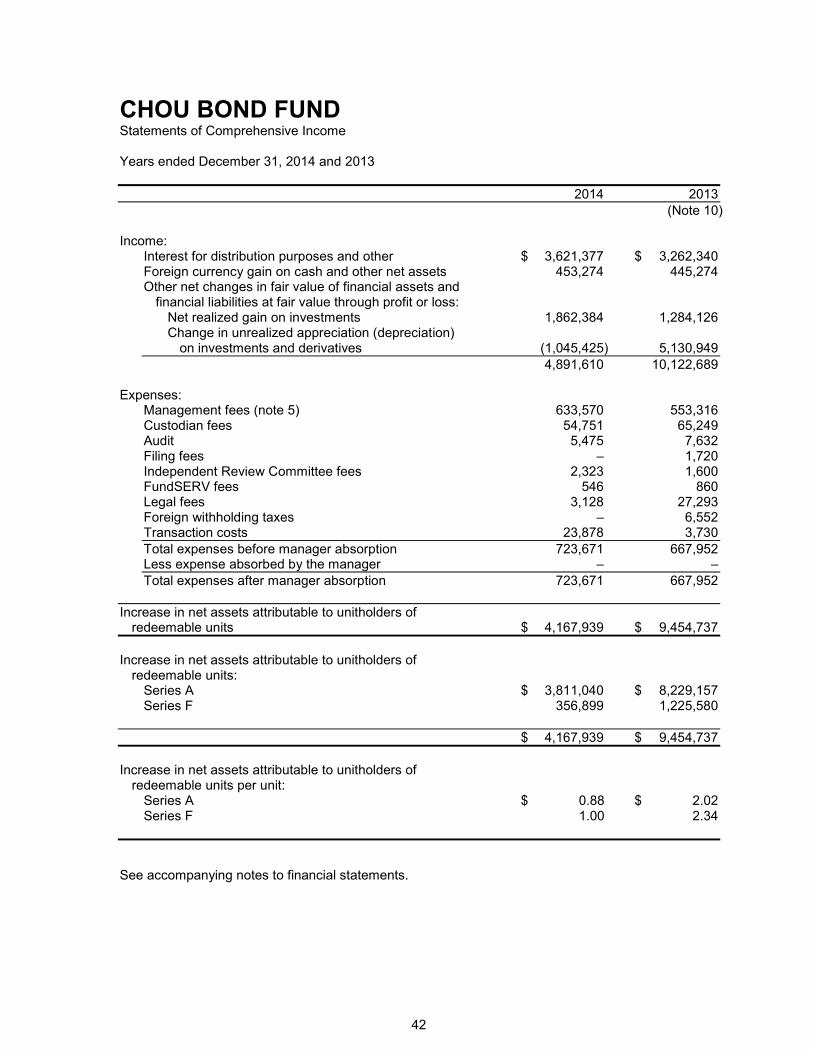
42
CHOU BOND FUND Statements of Comprehensive Income Years ended December 31, 2014 and 2013
2014 2013
(Note 10) Income:
Interest for distribution purposes and other $ 3,621,377 $ 3,262,340 Foreign currency gain on cash and other net assets 453,274 445,274 Other net changes in fair value of financial assets and
financial liabilities at fair value through profit or loss: Net realized gain on investments 1,862,384 1,284,126 Change in unrealized appreciation (depreciation)
on investments and derivatives (1,045,425) 5,130,949
4,891,610 10,122,689 Expenses:
Management fees (note 5) 633,570 553,316 Custodian fees 54,751 65,249 Audit 5,475 7,632 Filing fees – 1,720 Independent Review Committee fees 2,323 1,600 FundSERV fees 546 860 Legal fees 3,128 27,293 Foreign withholding taxes – 6,552 Transaction costs 23,878 3,730
Total expenses before manager absorption 723,671 667,952 Less expense absorbed by the manager – –
Total expenses after manager absorption 723,671 667,952
Increase in net assets attributable to unitholders of redeemable units $ 4,167,939 $ 9,454,737
Increase in net assets attributable to unitholders of
redeemable units: Series A $ 3,811,040 $ 8,229,157 Series F 356,899 1,225,580
$ 4,167,939 $ 9,454,737
Increase in net assets attributable to unitholders of
redeemable units per unit: Series A $ 0.88 $ 2.02 Series F 1.00 2.34
See accompanying notes to financial statements.

43
CHOU BOND FUND Statements of Changes in Net Assets Attributable to Unitholders of Redeemable Units Years ended December 31, 2014 and 2013
2014 2013
(Note 10) Series A Net assets attributable to unitholders of redeemable units,
beginning of year $ 38,761,019 $ 36,850,270 Increase in net assets attributable to unitholders of
redeemable units 3,811,040 8,229,157 Proceeds from issue of units 8,322,832 1,132,758 Payments on redemption of units (5,028,650) (7,380,349) Distributions of income to unitholders:
Investment income (2,695,544) (2,431,091) Reinvested distributions 2,639,914 2,360,274
Net assets attributable to unitholders of redeemable units,
end of year 45,810,611 38,761,019 Series F Net assets attributable to unitholders of redeemable units,
beginning of year 3,527,244 7,180,447 Increase in net assets attributable to unitholders of
redeemable units 356,899 1,225,580 Proceeds from issue of units 539,865 60,183 Payments on redemption of units (720,070) (4,933,476) Distributions of income to unitholders:
Investment income (222,185) (209,350) Reinvested distributions 209,805 203,860
Net assets attributable to unitholders of redeemable units,
end of year 3,691,558 3,527,244
Total net assets attributable to unitholders of redeemable units, end of year $ 49,502,169 $ 42,288,263
See accompanying notes to financial statements.

44
CHOU BOND FUND Statements of Cash Flows Years ended December 31, 2014 and 2013
2014 2013
(Note 10) (Note 10) Cash flows from operating activities:
Increase in net assets attributable to unitholders of redeemable units $ 4,167,939 $ 9,454,737
Adjustments for: Foreign currency gain on cash and other net assets (453,274) (445,274) Net realized gain on investments (1,862,384) (1,284,126) Change in unrealized depreciation (appreciation)
on investments and derivatives 1,045,425 (5,130,949) Change in non-cash operating working capital:
Decrease (increase) in interest receivable (361,813) 245,793 Increase (decrease) in accrued expenses (5,545) 6,938 Purchase of investments (15,056,001) (4,980,809) Proceeds from sales of investments 9,256,883 19,974,839
Net cash generated from (used in) operating activities (3,268,770) 17,841,149 Cash flows from financing activities:
Distributions to unitholders of redeemable units, net of reinvested distributions (76,467) (101,937)
Proceeds from redeemable units issued 8,857,010 1,179,941 Amount paid on redemption of redeemable units (5,734,383) (12,321,856)
Net cash generated from (used in) financing activities 3,046,160 (11,243,852) Foreign currency gain on cash and other net assets 453,274 445,274
Increase in cash and cash equivalents 230,664 7,042,571 Cash and cash equivalents, beginning of year 12,164,529 5,121,958
Cash and cash equivalents, end of year $ 12,395,193 $ 12,164,529
Supplemental information:
Interest received, net of withholding tax $ 3,259,564 $ 3,501,581
See accompanying notes to financial statements.

45
CHOU BOND FUND Schedule of Investments December 31, 2014
Number of units or par value Cost Fair value
Equities - long* Catalyst Paper Corporation** 108,606 $ 47,448 $ 331,248 Resolute Forest Products Inc.** 391,463 3,529,372 8,000,445
3,576,820 8,331,693 Bonds - long Ascent Capital Group Inc, 4.000% conv.,
July 15, 2020 2,683,000 2,776,137 2,570,189 Atlanticus Holdings Corporation, 5.875%,
Nov 30, 2035 11,300,000 5,002,061 5,360,438 Avangardco Investments Public Limited,
10.000%,Oct 29, 2015 2,725,000 2,665,927 1,957,398 Catalyst Paper Corporation, 11.000%,
Oct 30, 2017 1,946,981 1,549,757 2,123,996 Dex Media, Inc., 14.000%, Jan 29, 2017 3,638,594 2,880,924 1,327,402 Dex Media West LLC, term loans Dec 31, 2016 1,318,466 792,286 1,826,771 Fortress Paper Limited, 6.500%, Dec 31, 2016 100,000 63,230 54,500 Fortress Paper Limited, 7.000%, conv.,
Dec 31, 2019 4,659,000 2,621,102 1,351,110 Interstate Bakeries Corporation, 6.00%,
Aug 15, 2015 500,000 – – Rainmaker Entertainment Inc., 8.000%, conv.,
Mar 31, 2016 2,612,000 2,612,000 2,873,200 R.H. Donnelley Inc., term loans, Dec 31, 2016 4,010,312 3,275,951 3,324,939 Taiga Building Products Limited, 14.000%,
Sep 1, 2020 1,712,000 1,705,899 1,857,520 Ukrlandfarming PLC, 10.875%, Mar 26, 2018 6,000,000 5,305,314 3,342,386
31,250,588 27,969,849
Total long 34,827,408 36,301,542
Total investments 34,827,408 36,301,542 Transaction costs (12,071) –
Portfolio total $ 34,815,337 $ 36,301,542
* Common shares unless indicated otherwise ** Shares received from debt restructuring
See accompanying notes to financial statements.

CHOU BOND FUND Discussion of Financial Risk Management (continued) Years ended December 31, 2014 and 2013
46
Investment objective and strategies:
The Fund's objective is to provide conservation of principal and income production with capital
appreciation as a secondary consideration. The Fund invests primarily in Canadian and U.S. bonds.
These bonds include, but are not limited to, Government of Canada, provincial, municipal and
corporate issues, including convertibles and high yield bonds. Investments may be made in bonds
outside of Canada and the U.S.
The Fund seeks to achieve its investment objectives by investing in securities that it believes are
undervalued. The Fund will generally be fully invested. A combination of investment strategies will
be utilized in managing the portfolio including relative value trades, yield enhancement strategies and
interest rate anticipation traces. Investments made by the Fund are not guaranteed. Fixed income
securities issued by governments may decrease in value as a result of changes in interest rates.
Fixed income securities issued by corporations may decrease in value due to general market
conditions or credit risks associated with the issuer.
Financial risk management:
The Fund's investment activities expose it to various types of risk associated with the financial
instruments and markets in which it invests. The Fund's risk management goals are to ensure that
the outcome of activities involving risk is consistent with the Fund's objectives and risk tolerance.
(a) Credit risk:
Credit risk is the risk that a counterparty to a financial instrument will fail to discharge a
commitment that it has entered into with the Fund. As at December 31, 2014, the Fund
invested approximately 56.5% (December 31, 2013 - 43.0%; January 1, 2013 - 67.7%) of its
net assets in non-investment grade debt instruments. Non-investment grade is the term
applied to bonds rated below Baa3 on the Moody's credit rating scale and below BBB- on the
equivalent ratings systems from Standard & Poor's and Fitch. These credit ratings denote that
the company's financial position is weak and its bonds should be considered a speculative
investment.
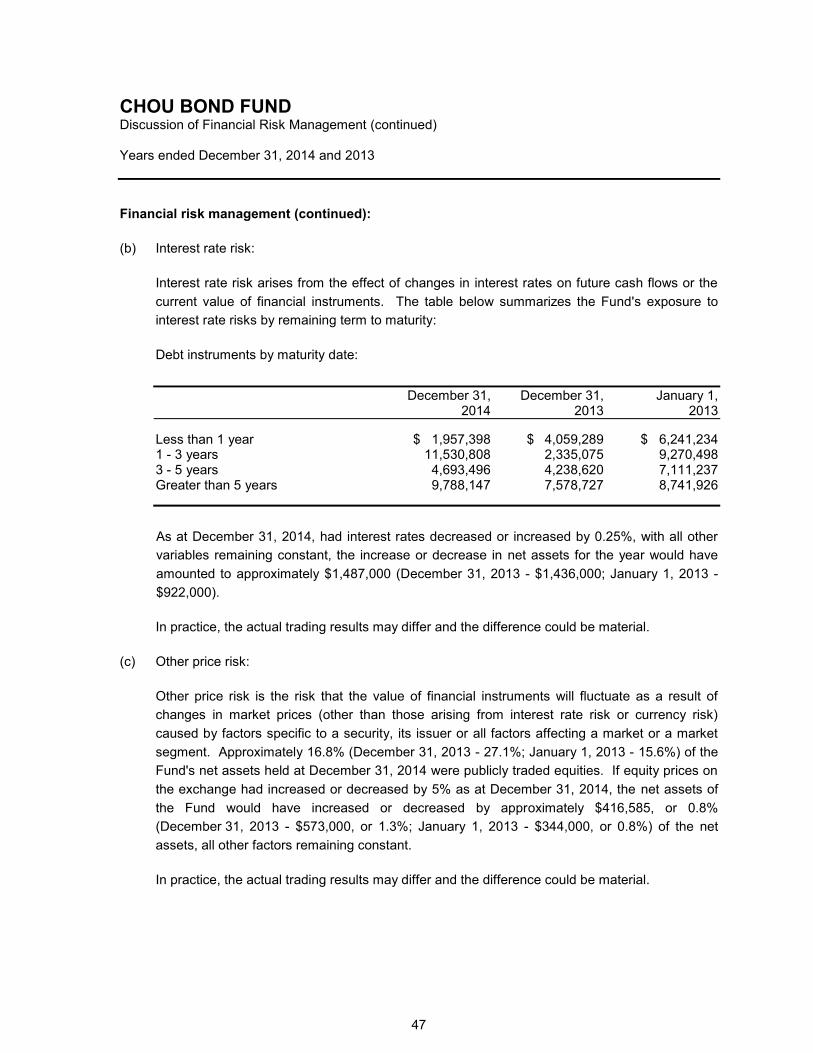
CHOU BOND FUND Discussion of Financial Risk Management (continued) Years ended December 31, 2014 and 2013
47
Financial risk management (continued):
(b) Interest rate risk:
Interest rate risk arises from the effect of changes in interest rates on future cash flows or the
current value of financial instruments. The table below summarizes the Fund's exposure to
interest rate risks by remaining term to maturity:
Debt instruments by maturity date:
December 31, December 31, January 1, 2014 2013 2013
Less than 1 year $ 1,957,398 $ 4,059,289 $ 6,241,234 1 - 3 years 11,530,808 2,335,075 9,270,498 3 - 5 years 4,693,496 4,238,620 7,111,237 Greater than 5 years 9,788,147 7,578,727 8,741,926
As at December 31, 2014, had interest rates decreased or increased by 0.25%, with all other
variables remaining constant, the increase or decrease in net assets for the year would have
amounted to approximately $1,487,000 (December 31, 2013 - $1,436,000; January 1, 2013 -
$922,000).
In practice, the actual trading results may differ and the difference could be material.
(c) Other price risk:
Other price risk is the risk that the value of financial instruments will fluctuate as a result of
changes in market prices (other than those arising from interest rate risk or currency risk)
caused by factors specific to a security, its issuer or all factors affecting a market or a market
segment. Approximately 16.8% (December 31, 2013 - 27.1%; January 1, 2013 - 15.6%) of the
Fund's net assets held at December 31, 2014 were publicly traded equities. If equity prices on
the exchange had increased or decreased by 5% as at December 31, 2014, the net assets of
the Fund would have increased or decreased by approximately $416,585, or 0.8%
(December 31, 2013 - $573,000, or 1.3%; January 1, 2013 - $344,000, or 0.8%) of the net
assets, all other factors remaining constant.
In practice, the actual trading results may differ and the difference could be material.

CHOU BOND FUND Discussion of Financial Risk Management (continued) Years ended December 31, 2014 and 2013
48
Financial risk management (continued):
(d) Foreign currency risk:
Currencies to which the Fund had exposure as at December 31, 2014, December 31, 2013 and
January 1, 2013 are as follows:
Financial Percentage December 31, 2014 instruments of NAV
United States dollar $ 32,614,905 65.9
Financial Percentage December 31, 2013 instruments of NAV
United States dollar $ 36,880,299 87.2
Financial Percentage January 1, 2013 instruments of NAV
United States dollar $ 38,635,794 87.8
The amounts in the above tables are based on the market value of the Fund's financial
instruments (including cash, cash equivalents and investments). Other financial assets
(including interest receivable and receivable for units subscribed) and financial liabilities
(including accrued expenses, payable for units redeemed and distributions payable) that are
denominated in foreign currencies do not expose the Fund to significant foreign currency risk.
If the Canadian dollar had strengthened or weakened by 1% in relation to all currencies, with all
other variables held constant, net assets would have decreased or increased by approximately
$326,000 (December 31, 2013 - $369,000; January 1, 2013 - $387,000).
In practice, the actual trading results may differ and the difference could be material.

49
CHOU RRSP FUND (unaudited)
March 16, 2015,
Dear Unitholders of Chou RRSP Fund,
The net asset value per unit (“NAVPU”) of a Series A unit of Chou RRSP Fund at December 31,
2014 was $35.33 compared to $30.94 at December 31, 2013, an increase of 14.2%; during the
same period, the S&P/TSX Total Return Index increased 10.6% in Canadian dollars. In $U.S., a
Series A unit of Chou RRSP Fund was up 4.6% while the S&P/TSX Total Return Index returned
1.2%.
The table shows our 1-year, 3-year, 5-year, 10-year and 15-year annual compound rates of
return.
December 31, 2014
(Series A) 1 Year 3 Years 5 Years 10 Years 15 Years
Chou RRSP ($CAN) 14.2% 22.9% 16.6% 6.2% 10.0%
S&P/TSX ($CAN) 10.6% 10.2% 7.5% 7.6% 6.2%
Chou RRSP ($U.S.)5 4.6% 17.6% 14.3% 6.6% 11.7%
S&P/TSX ($U.S.) 1.2% 5.4% 5.5% 7.9% 7.8% Rates of return are historical total returns that include changes in unit prices, and assume the reinvestment of all distributions.
These annual compounded returns do not take into account any sales charges, redemption fees, other optional expenses or income
taxes that you have to pay and that could reduce these returns. The returns are not guaranteed. The Fund’s past performance does
not necessarily indicate future performance. The table is used only to illustrate the effects of the compound growth rate and is not
intended to reflect future values of the mutual funds or returns on the mutual funds. Commissions, trailing commissions,
management fees and expenses all may be associated with mutual fund investments. Please read the prospectus before investing.
Factors Influencing the 2014 Results
The weakness of the Canadian dollar against the U.S. dollar had a large positive impact on the
results of the Fund. The difference in performance results between the NAVPU priced in
Canadian dollars, versus U.S. dollars, is attributable to the fact that on December 31, 2013, one
U.S. dollar was worth approximately $1.06 Canadian, whereas one year later, on December 31,
2014, one U.S. dollar was worth approximately $1.16 Canadian.
Torstar Corporation*, Interfor Corporation, Resolute Forest Products, Ridley Inc., Blackberry
and Canfor Pulp Products were major positive contributors to the Fund’s performance.
The largest equity decliners for the year ended December 31, 2014 were TVA Group Inc., Danier
Leather Inc. and Overstock.com Ltd.
During 2014, the Fund increased its holdings of Reitmans Canada. MEGA Brands Inc. was
acquired through a wholly-owned subsidiary of Mattel, Inc. in April 2014 and the Fund received
$17.75 per common share
5The alternative method of purchasing Chou RRSP Fund in $U.S. has been offered since September 2005. Performance for
years prior to September 2005 is based on the $U.S. equivalent conversion of the results of the Chou RRSP Fund ($CAN). The
investments in the Chou RRSP Fund ($CAN) are the same as the investments in Chou RRSP Fund ($U.S.) except for the
currency applied.
* In the Annual Management Discussion of Fund Performance for the year ended December 31, 2013, it was incorrectly
reported that we had decreased our holdings in Torstar Corporation when in fact we increased our holdings by 4,700 shares, or
0.37%.
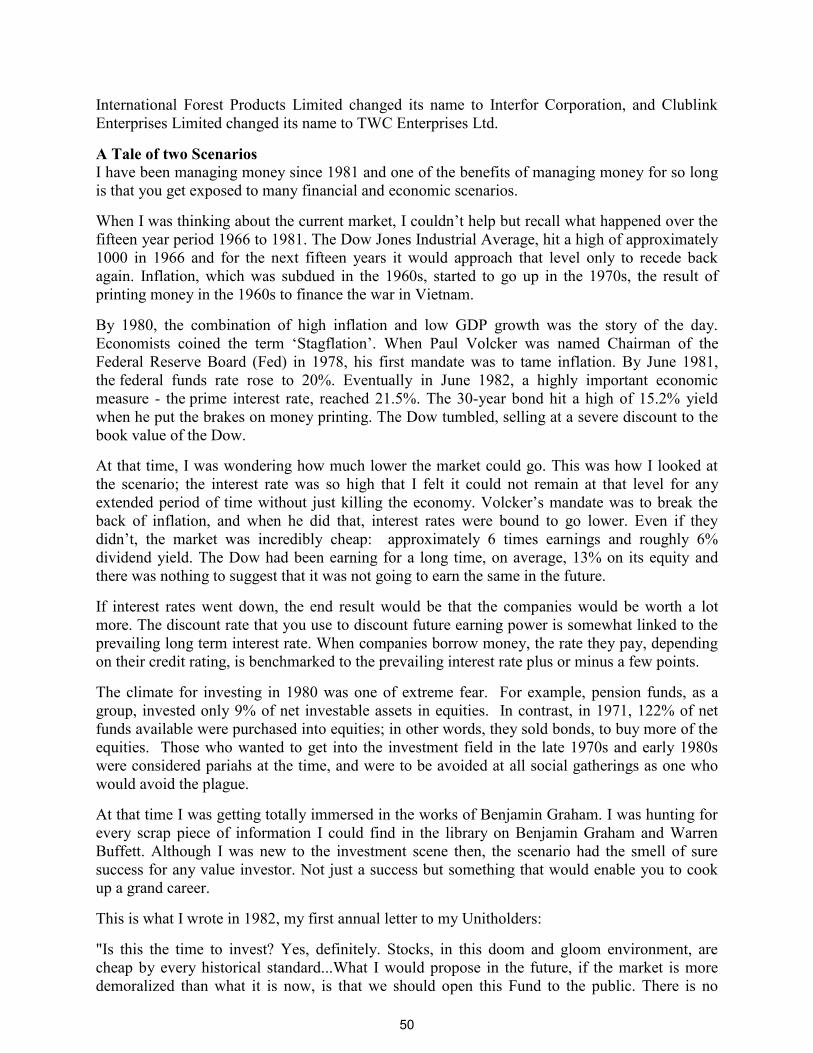
50
International Forest Products Limited changed its name to Interfor Corporation, and Clublink
Enterprises Limited changed its name to TWC Enterprises Ltd.
A Tale of two Scenarios
I have been managing money since 1981 and one of the benefits of managing money for so long
is that you get exposed to many financial and economic scenarios.
When I was thinking about the current market, I couldn’t help but recall what happened over the
fifteen year period 1966 to 1981. The Dow Jones Industrial Average, hit a high of approximately
1000 in 1966 and for the next fifteen years it would approach that level only to recede back
again. Inflation, which was subdued in the 1960s, started to go up in the 1970s, the result of
printing money in the 1960s to finance the war in Vietnam.
By 1980, the combination of high inflation and low GDP growth was the story of the day.
Economists coined the term ‘Stagflation’. When Paul Volcker was named Chairman of the
Federal Reserve Board (Fed) in 1978, his first mandate was to tame inflation. By June 1981,
the federal funds rate rose to 20%. Eventually in June 1982, a highly important economic
measure - the prime interest rate, reached 21.5%. The 30-year bond hit a high of 15.2% yield
when he put the brakes on money printing. The Dow tumbled, selling at a severe discount to the
book value of the Dow.
At that time, I was wondering how much lower the market could go. This was how I looked at
the scenario; the interest rate was so high that I felt it could not remain at that level for any
extended period of time without just killing the economy. Volcker’s mandate was to break the
back of inflation, and when he did that, interest rates were bound to go lower. Even if they
didn’t, the market was incredibly cheap: approximately 6 times earnings and roughly 6%
dividend yield. The Dow had been earning for a long time, on average, 13% on its equity and
there was nothing to suggest that it was not going to earn the same in the future.
If interest rates went down, the end result would be that the companies would be worth a lot
more. The discount rate that you use to discount future earning power is somewhat linked to the
prevailing long term interest rate. When companies borrow money, the rate they pay, depending
on their credit rating, is benchmarked to the prevailing interest rate plus or minus a few points.
The climate for investing in 1980 was one of extreme fear. For example, pension funds, as a
group, invested only 9% of net investable assets in equities. In contrast, in 1971, 122% of net
funds available were purchased into equities; in other words, they sold bonds, to buy more of the
equities. Those who wanted to get into the investment field in the late 1970s and early 1980s
were considered pariahs at the time, and were to be avoided at all social gatherings as one who
would avoid the plague.
At that time I was getting totally immersed in the works of Benjamin Graham. I was hunting for
every scrap piece of information I could find in the library on Benjamin Graham and Warren
Buffett. Although I was new to the investment scene then, the scenario had the smell of sure
success for any value investor. Not just a success but something that would enable you to cook
up a grand career.
This is what I wrote in 1982, my first annual letter to my Unitholders:
"Is this the time to invest? Yes, definitely. Stocks, in this doom and gloom environment, are
cheap by every historical standard...What I would propose in the future, if the market is more
demoralized than what it is now, is that we should open this Fund to the public. There is no
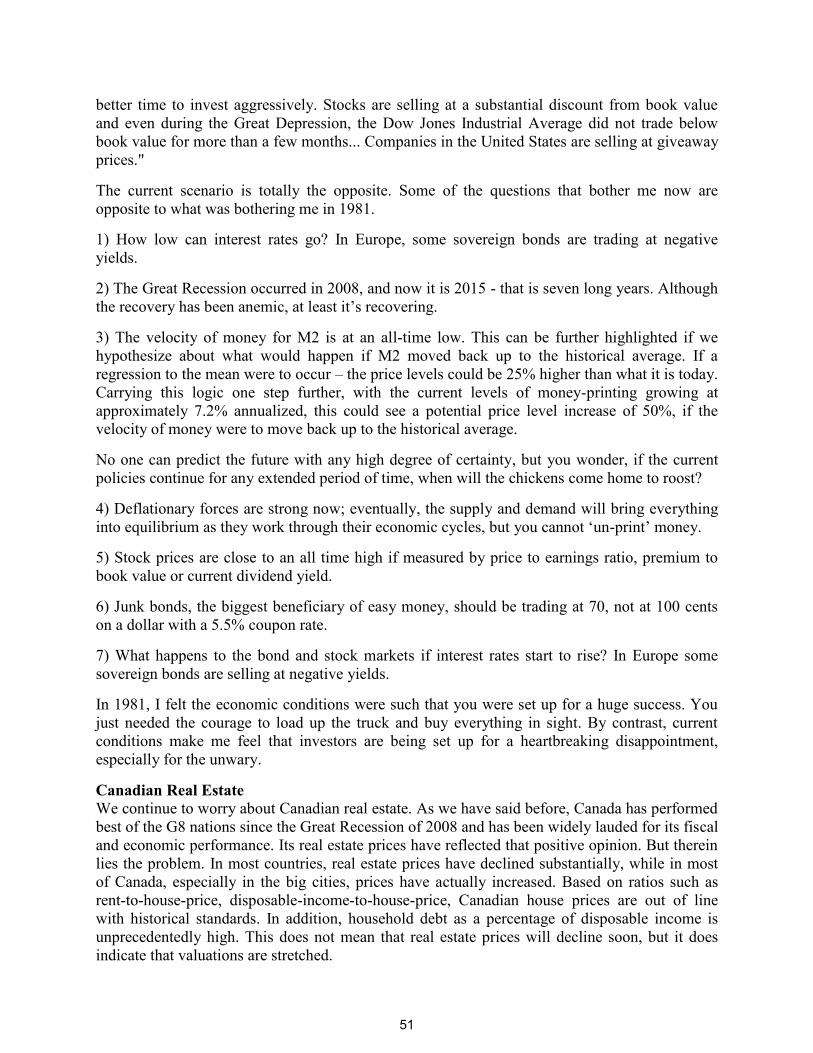
51
better time to invest aggressively. Stocks are selling at a substantial discount from book value
and even during the Great Depression, the Dow Jones Industrial Average did not trade below
book value for more than a few months... Companies in the United States are selling at giveaway
prices."
The current scenario is totally the opposite. Some of the questions that bother me now are
opposite to what was bothering me in 1981.
1) How low can interest rates go? In Europe, some sovereign bonds are trading at negative
yields.
2) The Great Recession occurred in 2008, and now it is 2015 - that is seven long years. Although
the recovery has been anemic, at least it’s recovering.
3) The velocity of money for M2 is at an all-time low. This can be further highlighted if we
hypothesize about what would happen if M2 moved back up to the historical average. If a
regression to the mean were to occur – the price levels could be 25% higher than what it is today.
Carrying this logic one step further, with the current levels of money-printing growing at
approximately 7.2% annualized, this could see a potential price level increase of 50%, if the
velocity of money were to move back up to the historical average.
No one can predict the future with any high degree of certainty, but you wonder, if the current
policies continue for any extended period of time, when will the chickens come home to roost?
4) Deflationary forces are strong now; eventually, the supply and demand will bring everything
into equilibrium as they work through their economic cycles, but you cannot ‘un-print’ money.
5) Stock prices are close to an all time high if measured by price to earnings ratio, premium to
book value or current dividend yield.
6) Junk bonds, the biggest beneficiary of easy money, should be trading at 70, not at 100 cents
on a dollar with a 5.5% coupon rate.
7) What happens to the bond and stock markets if interest rates start to rise? In Europe some
sovereign bonds are selling at negative yields.
In 1981, I felt the economic conditions were such that you were set up for a huge success. You
just needed the courage to load up the truck and buy everything in sight. By contrast, current
conditions make me feel that investors are being set up for a heartbreaking disappointment,
especially for the unwary.
Canadian Real Estate
We continue to worry about Canadian real estate. As we have said before, Canada has performed
best of the G8 nations since the Great Recession of 2008 and has been widely lauded for its fiscal
and economic performance. Its real estate prices have reflected that positive opinion. But therein
lies the problem. In most countries, real estate prices have declined substantially, while in most
of Canada, especially in the big cities, prices have actually increased. Based on ratios such as
rent-to-house-price, disposable-income-to-house-price, Canadian house prices are out of line
with historical standards. In addition, household debt as a percentage of disposable income is
unprecedentedly high. This does not mean that real estate prices will decline soon, but it does
indicate that valuations are stretched.

52
If the price of real estate goes down in Canada, it will negatively impact the natural resources
industry. We have avoided this industry for the last 20 years. One area that has piqued our
interest is the oil and gas industry. We continue to monitor them with great interest.
We are starting to look at credit default swaps (CDS)
One way of assessing investors' appetite for risk is to check the prices of credit default swaps
(CDS). In CDS, one party sells credit protection and the other party buys credit protection. Put
another way, one party is selling insurance and the counterparty is buying insurance against the
default of a specific third party’s debt. If the protection buyer does not own debt issued by the
third party, then CDS are more appropriately viewed as an investment transaction, rather than a
hedging transaction, for the protection buyer notwithstanding the insurance-like features of a
CDS. In most CDS, the protection buyer makes the premium payments over the life of the CDS,
frequently on a quarterly basis.
We believe that CDS are starting to sell at prices that are becoming interesting. At recent prices,
they appear to offer one of the potentially cheapest forms of insurance against market
disruptions. We are continuing to monitor CDS prices and may potentially invest in CDS in the
future. We are looking at who deals in such investments and we want to examine carefully what
counterparty risk we may be exposed to. The mechanics of investing in CDS have changed
somewhat from six years ago.
To make money in CDS, you don’t need a default of the third party’s debt. A dislocation in the
economy or deterioration in the credit profile of the issuer may cause the CDS price to rise from
these low levels. The negative aspect is that, like insurance, the premium paid for the protection
erodes over time and may expire worthless. There is no guarantee that the Manager will make
money for the Fund on any particular CDS or correctly predict an increase of value in any
particular CDS.
Other Matters INDEPENDENT REVIEW COMMITTEE: The Manager has established an IRC as required by
NI 81-107. The members of the IRC are Sandford Borins, Peter Gregoire and Joe Tortolano.
The 2014 IRC Annual Report is available on our website www.choufunds.com.
As of March 16, 2015, the NAVPU of a Series A unit of the Fund was $34.46 and the cash
position was approximately 22.1% of net assets. The Fund is down 2.5% from the beginning of
the year. In $U.S., it is down 11.3%. While 2015 is off to a slightly negative start, please do not
extrapolate these returns into the future.
Except for the performance numbers of the Chou RRSP Fund, this letter contains estimates and
opinions of the Fund Manager and is not intended to be a forecast of future events, a guarantee of
future returns or investment advice. Any recommendations contained or implied herein may not
be suitable for all investors.
Yours truly,
Francis Chou
Fund Manager

53
CHOU RRSP FUND Statements of Financial Position December 31, 2014, December 31, 2013 and January 1, 2013 December 31, December 31, January 1, 2014 2013 2013
(Note 10) (Note 10)
Assets
Current assets: Financial assets at fair value through profit or loss $ 89,336,509 $ 83,451,039 $ 106,065,010 Held for trading investments 6,778,821 5,757,276 5,778,119 Cash and cash equivalents 32,417,012 33,720,588 1,253,782 Receivable for units subscribed 47,500 16,500 30,000 Other receivable 12,895 3,198 – Accrued interest receivable 38,157 38,157 38,157
Total assets 128,630,894 122,986,758 113,165,068
Liabilities
Current liabilities: Financial liabilities at fair value through profit or loss – 38,281 – Accrued expenses 220,187 217,713 205,492 Payable for units redeemed 64,712 88,064 98,342 Distributions payable – 14,669 7,303
Total liabilities 284,899 358,727 311,137
Net assets attributable to unitholders of redeemable units $ 128,345,995 $ 122,628,031 $ 112,853,931
Net assets attributable to unitholders of redeemable units: Series A $ 123,027,948 $ 117,867,041 $ 110,179,082 Series F 5,318,047 4,760,990 2,674,849
$ 128,345,995 $ 122,628,031 $ 112,853,931
Number of units outstanding (note 4): Series A 3,486,572 3,811,998 4,279,790 Series F 150,658 154,729 104,004
Net assets attributable to unitholders of redeemable units per unit (note 4):
Canadian dollars: Series A $ 35.29 $ 30.92 $ 25.74 Series F 35.30 30.77 25.72
U.S. dollars: Series A 30.41 29.08 25.88 Series F 30.42 28.94 25.86
See accompanying notes to financial statements.
Approved on behalf of the Board of Directors of Chou Associates Management Inc.:

54
CHOU RRSP FUND Statements of Comprehensive Income Years ended December 31, 2014 and 2013
2014 2013
(Note 10) Income:
Interest for distribution purposes and other $ 983,887 $ 946,378 Dividends 1,534,205 2,779,242 Securities lending income 77,779 47,813 Foreign currency gain on cash and other net assets 857,934 431,975 Other net changes in fair value:
Net realized gain on financial assets at fair value through profit or loss 6,429,518 37,386,530
Net realized gain on held-for-trading securities 217,569 392,413 Change in unrealized appreciation (depreciation) on
financial assets at fair value through profit or loss 7,745,106 (18,069,652) Change in unrealized appreciation on
held-for-trading securities 1,021,545 1,049,800
18,867,543 24,964,499 Expenses:
Management fees (note 5) 2,054,789 1,962,285 Custodian fees 138,700 138,699 Audit 10,950 19,381 Filing fees 14,600 14,600 Independent Review Committee fees 6,225 4,113 FundSERV fees 10,950 8,181 Legal fees 8,678 4,275 Transaction costs 36,494 92,602
2,281,386 2,244,136
Increase in net assets attributable to unitholders of redeemable units $ 16,586,157 $ 22,720,363
Increase in net assets attributable to unitholders of
redeemable units: Series A $ 15,907,234 $ 22,081,742 Series F 678,923 638,621
$ 16,586,157 $ 22,720,363
Increase in net assets attributable to unitholders of
redeemable units per unit: Series A $ 4.40 $ 5.48 Series F 4.46 5.70
See accompanying notes to financial statements.
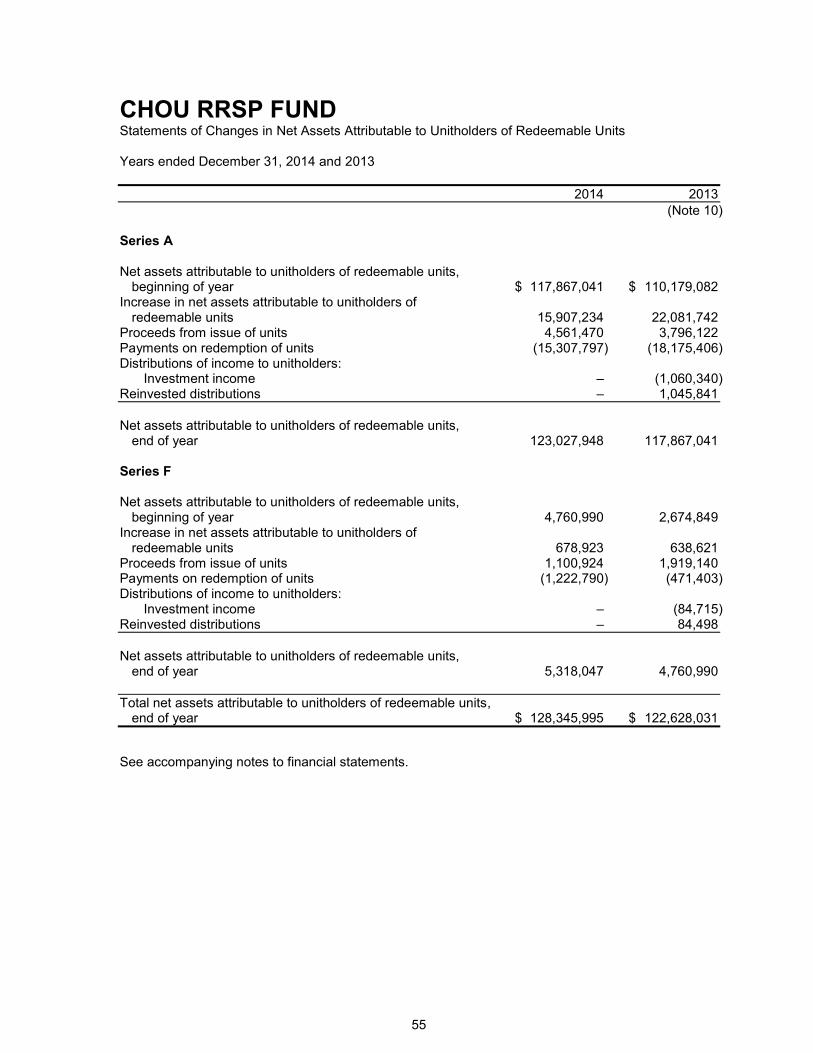
55
CHOU RRSP FUND Statements of Changes in Net Assets Attributable to Unitholders of Redeemable Units Years ended December 31, 2014 and 2013
2014 2013
(Note 10) Series A Net assets attributable to unitholders of redeemable units,
beginning of year $ 117,867,041 $ 110,179,082 Increase in net assets attributable to unitholders of
redeemable units 15,907,234 22,081,742 Proceeds from issue of units 4,561,470 3,796,122 Payments on redemption of units (15,307,797) (18,175,406) Distributions of income to unitholders:
Investment income – (1,060,340) Reinvested distributions – 1,045,841
Net assets attributable to unitholders of redeemable units,
end of year 123,027,948 117,867,041 Series F Net assets attributable to unitholders of redeemable units,
beginning of year 4,760,990 2,674,849 Increase in net assets attributable to unitholders of
redeemable units 678,923 638,621 Proceeds from issue of units 1,100,924 1,919,140 Payments on redemption of units (1,222,790) (471,403) Distributions of income to unitholders:
Investment income – (84,715) Reinvested distributions – 84,498
Net assets attributable to unitholders of redeemable units,
end of year 5,318,047 4,760,990
Total net assets attributable to unitholders of redeemable units, end of year $ 128,345,995 $ 122,628,031
See accompanying notes to financial statements.

56
CHOU RRSP FUND Statements of Cash Flows Years ended December 31, 2014 and 2013
2014 2013
(Note 10) (Note 10) Cash flows from operating activities:
Increase in net assets attributable to unitholders of redeemable units $ 16,586,157 $ 22,720,363
Adjustments for: Foreign currency gain on cash and other net assets (857,934) (431,975) Net realized gain on investments (6,647,087) (37,778,943) Change in unrealized depreciation (appreciation)
on investments and derivatives (8,766,651) 17,019,852 Change in non-cash operating working capital:
Increase in other receivable (9,697) (3,198) Increase in accrued expenses 2,474 12,221 Purchase of investments (4,561,474) (11,358,606) Proceeds from sales of investments 13,029,916 54,790,792
Net cash generated from operating activities 8,775,704 44,970,506 Cash flows from financing activities:
Distributions to unitholders of redeemable units, net of reinvested distributions (14,669) (7,350)
Proceeds from redeemable units issued 5,631,394 5,728,762 Amount paid on redemption of redeemable units (16,553,939) (18,657,087)
Net cash used in financing activities (10,937,214) (12,935,675) Foreign currency gain on cash and other net assets 857,934 431,975
Increase (decrease) in cash and cash equivalents (1,303,576) 32,466,806 Cash and cash equivalents, beginning of year 33,720,588 1,253,782
Cash and cash equivalents, end of year $ 32,417,012 $ 33,720,588
Supplemental information:
Interest received, net of withholding tax $ 983,887 $ 946,378 Dividends received, net of withholding tax 1,534,205 2,779,242 Security lending income received 68,082 44,615
See accompanying notes to financial statements.

57
CHOU RRSP FUND Schedule of Investments December 31, 2014
Number of shares or par value Cost Fair value
Equities - long* Blackberry Limited 529,040 $ 4,122,657 $ 6,739,970 Canfor Pulp Products Inc. 493,900 1,405,445 7,191,184 Danier Leather Inc. 679,200 6,453,777 3,973,320 Dundee Corporation, Class A 100,000 1,179,245 1,281,000 Interfor Corporation 525,500 3,125,203 11,534,725 Overstock.com Inc. 151,976 3,166,145 4,280,641 Rainmaker Entertainment Inc. 2,536,800 5,227,610 456,624 Reitmans (Canada) Limited 215,300 1,241,858 1,507,100 Reitmans (Canada) Limited, Class A 440,800 2,557,439 3,398,568 Resolute Forest Products Inc. 624,188 10,166,745 12,756,714 Ridley Inc. 313,200 2,511,607 9,486,828 Sears Canada Inc. 292,830 2,667,681 3,291,409 Taiga Building Products Limited 159,700 212,401 134,148 Torstar Corporation, Class B 1,259,416 27,484,475 8,211,392 TVA Group Inc., Class B 783,128 11,323,079 5,626,775 TWC Enterprises Limited 194,919 1,077,639 2,132,414
83,923,006 82,002,812 Held-for-trading Bank of America Corporation, warrants,
Class A, Jan 16, 2019 836,825 2,984,789 6,778,821 Bonds - long Taiga Building Products Limited 14.000%,
Sep 1, 2020 6,759,168 6,759,168 7,333,697
Total long 90,682,174 89,336,509 Total held for trading 2,984,789 6,778,821
Total investments 93,666,963 96,115,330 Transaction costs (477,826) –
Portfolio total $ 93,189,137 $ 96,115,330
* Common shares unless indicated otherwise
See accompanying notes to financial statements.

CHOU RRSP FUND Discussion of Financial Risk Management (continued) Years ended December 31, 2014 and 2013
58
Investment objective and strategies:
The Fund's objective is to provide long-term growth of capital by investing primarily in equity
securities of Canadian businesses considered by the Manager to be undervalued. The Fund may
also invest in equity and debt instruments of U.S. and foreign businesses. Investments may include
common and preferred shares, convertible debentures, government and corporate bonds and short-
term debt.
The investment strategy follows strong disciplines with regard to price paid to acquire portfolio
investments. The level of investments in the company's securities is generally commensurate with
the current price of the company's securities in relation to its intrinsic value as determined by the
above factors. That approach is designed to provide an extra margin of safety, which in turn serves
to reduce overall portfolio risk.
Financial risk management:
The Fund's investment activities expose it to various types of risk associated with the financial
instruments and markets in which it invests. The Fund's risk management goals are to ensure that
the outcome of activities involving risk is consistent with the Fund's objectives and risk tolerance.
(a) Credit risk:
Credit risk is the risk that a counterparty to a financial instrument will fail to discharge a
commitment that it has entered into with the Fund. As at December 31, 2014, the Fund
invested approximately 5.7% (December 31, 2013 - 5.8%; January 1, 2013 - 6.3%) of its net
assets in non-investment grade debt instruments. Non-investment grade is the term applied to
bonds rated below Baa3 on the Moody's credit rating scale and below BBB- on the equivalent
ratings systems from Standard & Poor's and Fitch. These credit ratings denote that the
company's financial position is weak and its bonds should be considered a speculative
investment.

CHOU RRSP FUND Discussion of Financial Risk Management (continued) Years ended December 31, 2014 and 2013
59
Financial risk management (continued):
(b) Interest rate risk:
Interest rate risk arises from the effect of changes in interest rates on future cash flows or the
current value of financial instruments. The table below summarizes the Fund's exposure to
interest rate risk by remaining term to maturity:
Debt instruments by maturity date:
December 31, December 31, January 1, 2014 2013 2013
Less than 1 year $ – $ – $ – 1 - 3 years – – – 3 - 5 years – – – Greater than 5 years 7,333,697 7,150,524 7,093,747
As at December 31, 2014, had interest rates decreased or increased by 0.25%, with all other
variables remaining constant, the increase or decrease in net assets for the year would have
amounted to approximately $119,000 (December 31, 2013 - $119,000; January 1, 2013 -
$119,000).
In practice, the actual trading results may differ and the difference could be material.
(c) Other price risk:
Other price risk is the risk that the value of financial instruments will fluctuate as a result of
changes in market prices (other than those arising from interest rate risk or currency risk)
caused by factors specific to a security, its issuer or all factors affecting a market or a market
segment. Approximately 63.9% (December 31, 2013 - 66.8%; January 1, 2013 - 92.8%) of the
Fund's net assets held at December 31, 2014 were publicly traded equities. If equity prices on
the exchange had increased or decreased by 5% as at December 31, 2014, the net assets of
the Fund would have increased or decreased by approximately $4,100,000, or 3.2%
(December 31, 2013 - $4,090,000, or 3.3%; January 1, 2013 - $5,210,000, or 4.6%) of the net
assets, all other factors remaining constant.
In practice, the actual trading results may differ and the difference could be material.

CHOU RRSP FUND Discussion of Financial Risk Management (continued) Years ended December 31, 2014 and 2013
60
Financial risk management (continued):
(d) Foreign currency risk:
Currencies to which the Fund had exposure as at December 31, 2014, December 31, 2013 and
January 1, 2013 are as follows:
Financial Percentage December 31, 2014 instruments of NAV
United States dollar $ 34,100,324 26.6
Financial Percentage December 31, 2013 instruments of NAV
United States dollar $ 30,630,217 25.0
Financial Percentage January 1, 2013 instruments of NAV
United States dollar $ 19,992,891 17.7
The amounts in the above tables are based on the market value of the Fund's financial
instruments (including cash, cash equivalents and investments). Other financial assets
(including accrued interest receivable, receivable for units subscribed and other receivable) and
financial liabilities (including accrued expenses, payable for units redeemed and distributions
payable) that are denominated in foreign currencies do not expose the Fund to significant
foreign currency risk.
As at December 31, 2014, if the Canadian dollar had strengthened or weakened by 1% in
relation to all currencies, with all other variables held constant, net assets would have
decreased or increased by approximately $341,000 (December 31, 2013 - $306,000;
January 1, 2013 - $198,000).
In practice, the actual trading results may differ and the difference could be material.

CHOU FUNDS Notes to Financial Statements (continued) Years ended December 31, 2014 and 2013
61
1. Formation of the Chou Funds:
The individual funds comprising the family of Chou Funds (the "Chou Funds" or the "Funds")
are open-ended investment mutual fund trusts formed pursuant to Declarations of Trust under
the laws of the Province of Ontario. Chou Associates Management Inc. is the Manager and
Trustee of the Chou Funds. The address of the Funds' registered office is: 110 Sheppard
Avenue East, Suite 301, Box 18, Toronto, Ontario, M2N 6Y8.
The Funds were formed on the following dates:
Chou Associates Fund September 1, 1986 Chou Asia Fund August 26, 2003 Chou Europe Fund August 26, 2003 Chou Bond Fund August 10, 2005 Chou RRSP Fund September 1, 1986
2. Significant accounting policies:
These financial statements have been prepared in accordance with International Financial
Reporting Standards ("IFRS") applicable to the preparation of financial statements, including
IFRS 1, First-time Adoption of International Financial Reporting Standards ("IFRS 1"). The
Funds adopted this basis of accounting in 2014 as required by Canadian Securities legislation
and the Canadian Accounting Standards Board. Previously, the Funds prepared their financial
statements in accordance with Canadian general accepted accounting principles ("Canadian
GAAP") as defined in Part IV of the Chartered Professional Accountants of Canada ("CPA
Canada") Handbook. The Funds have consistently applied the accounting policies used in the
preparation of their opening IFRS statement of financial position at January 1, 2013 and
throughout all periods presented, as if these policies had always been in effect. Note 10
discloses the impact of the transition to IFRS on the Funds' reported financial position, financial
performance and cash flows, including the nature and effect of significant changes in
accounting policies from those used in the Funds' financial statements for the year ended
December 31, 2013 prepared under Canadian GAAP.
The policies applied in these financial statements are based on IFRS issued and outstanding
as of March 20, 2015, which is the date on which the financial statements were authorized for
issue by the Manager.
CHOU FUNDS Notes to Financial Statements (continued) Years ended December 31, 2014 and 2013
62
2. Significant accounting policies (continued):
The following is a summary of significant accounting policies used by the Funds:
(a) Recognition, initial measurement and classification:
Financial assets and financial liabilities at fair value through profit or loss ("FVTPL") are
initially recognized on the trade date, at fair value, with transaction costs recognized in
profit or loss. Other financial assets and financial liabilities are recognized on the date on
which they are originated at fair value.
The Funds classify financial assets and financial liabilities into the following categories:
Financial assets at FVTPL:
Held-for-trading: derivative financial instruments; and
Designated as at FVTPL: debt securities and equity investments.
Financial liabilities at FVTPL:
Held-for-trading: securities sold short and derivative financial instruments.
All other financial assets and financial liabilities are measured at amortized cost and are
classified as loans and receivables and other financial liabilities, respectively. The
amortized cost of a financial asset or financial liability is the amount at which the financial
asset or financial liability is measured at initial recognition, minus principal repayments, plus
or minus the cumulative amortization using the effective interest rate method of any
difference between the initial amount recognized and the maturity amount, minus any
reduction for impairment. The Funds' obligations for net assets attributable to unitholders is
measured at FVTPL, with fair value being the redemption amount as of the reporting dates.
(b) Fair value measurement:
When available, the Funds measure the fair value of a financial instrument using the
quoted price in an active market for that instrument. The Funds measure instruments
quoted in an active market at the last traded market price.
Bonds and debentures are valued at their last evaluated bid price received from recognized
investment dealers for long positions and their last evaluated ask price for short positions.

CHOU FUNDS Notes to Financial Statements (continued) Years ended December 31, 2014 and 2013
63
2. Significant accounting policies (continued):
If there is no quoted price in an active market, then the Funds use valuation techniques that
maximize the use of relevant observable inputs and minimize the use of unobservable
inputs. The chosen valuation technique incorporates all of the factors that market
participants would take into account in pricing a transaction.
Financial assets classified as loans and receivables are carried at amortized cost using the
effective interest rate method, less impairment losses, if any.
There are no differences between the Funds' method for measuring fair value for financial
reporting purposes and that for the purposes of calculating net asset value for unitholder
transactions.
Derecognition:
The Fund derecognizes a financial asset when the contractual rights to the cash flows from
the financial asset expire, or it transfers the right to receive the contractual cash flows in a
transaction in which substantially all of the risks and rewards of ownership of the financial
asset are transferred or in which the Funds neither transfer nor retain substantially all of the
risks and rewards of ownership and do not retain control of the financial asset.
The Funds derecognize a financial liability when its contractual obligations are discharged,
or cancelled, or expired.
(c) Critical accounting estimates and judgments:
The preparation of financial statements requires management to use judgment in applying
its accounting policies and to make estimates and assumptions about the future. The
following discusses the most significant accounting judgments and estimates that the
Funds have made in preparing the financial statements:
(i) Fair value measurement of held-for-trading securities and securities not quoted in an active market:
The Funds hold financial instruments that are not quoted in active markets, including
held-for-trading securities. Fair values of such instruments are determined using
valuation techniques and may be determined using reputable pricing sources (such as
pricing agencies) or indicative prices from market makers. Broker quotes as obtained
from the pricing sources may be indicative and not executable or binding. Where no
market data is available, the Funds may value positions using their own models, which
are usually based on valuation methods and techniques generally recognized as
standard within the industry. The models used to determine fair values are validated
and periodically reviewed by experienced personnel of the Manager, independent of
the party that created them.

CHOU FUNDS Notes to Financial Statements (continued) Years ended December 31, 2014 and 2013
64
2. Significant accounting policies (continued):
Models use observable data, to the extent practicable. However, areas such as credit
risk (both own and counterparty), volatilities and correlations require the Manager to
make estimates. Changes in assumptions about these factors could affect the reported
fair values of financial instruments. The Funds consider observable data to be market
data that is readily available, regularly distributed and updated, reliable and verifiable,
not proprietary, and provided by independent sources that are actively involved in the
relevant market. Refer to note 8 for further information about the fair value
measurement of the Funds' financial instruments.
(d) Cost of investments:
The cost of investments represents the amount paid for each security, and is determined
on an average cost basis excluding transaction costs. Investment transactions are
accounted for as of the trade date. These financial statements are presented in Canadian
dollars, which is the Funds' functional currency.
(e) Transaction costs:
Transaction costs are incremental costs directly attributable to the acquisition, issue or
disposal of an investment, which include fees and commissions paid to agents, advisors,
brokers and dealers, levies by regulatory agencies and securities exchanges and transfer
taxes and duties. In accordance with IFRS, transaction costs are expensed and are
included in transaction costs in the statements of comprehensive income.
(f) Cash and cash equivalents:
Cash and cash equivalents consist of cash held at a Canadian bank.
(g) Investment transactions and income recognition:
All investment transactions are reported on the business day the order to buy or sell is
executed.
Distributions received from investment trusts are recorded as income, capital gains or a
return of capital, based on the best information available to the Manager. Due to the nature
of these investments, actual allocations could vary from this information. Distributions from
investment trusts that are treated as a return of capital for income tax purposes reduce the
average cost of the underlying investment trust on the schedule of investments.
CHOU FUNDS Notes to Financial Statements (continued) Years ended December 31, 2014 and 2013
65
2. Significant accounting policies (continued):
The interest for distribution purposes shown on the statements of comprehensive income
represents the coupon interest received by the Funds accounted for on an accrual basis.
The Funds do not amortize premiums paid or discounts received on the purchase of fixed
income securities. Dividend income and distributions from investment trusts are
recognized on the ex-dividend dates.
(h) Foreign exchange:
Securities and other assets and liabilities denominated in foreign currencies are translated
into Canadian dollars at the exchange rates prevailing on each valuation day. Purchases
and sales of investments, income and expenses are translated into Canadian dollars at the
exchange rates prevailing on the respective dates of such transactions. Realized and
unrealized foreign exchange gains (losses) on investments are included in realized gain
(loss) on sale of investments and change in unrealized appreciation (depreciation) on
investments, respectively, in the statements of comprehensive income.
(i) Derivative transactions:
The Manager may use options to hedge against losses from changes in the prices of the
Funds' investments instead of buying and selling securities directly. There can be no
assurance that the hedging strategies will be effective. Losses may also arise if the
counterparty does not perform under the contract.
(i) Options and warrants:
The premium paid for purchased warrants is included in held-for-trading investments on
the statements of financial position. The unrealized gain or loss is reflected in the
statements of comprehensive income in unrealized gain (loss) on held-for-trading
investments.
The premium received upon writing an option on futures or an over-the-counter option
is recorded at cost in investments, at fair value in the statements of financial position.
As long as the position of the written option is maintained, the liability for written options
is revalued at an amount equal to the current market value of the option, which would
have the effect of closing the position. Any gain or loss resulting from revaluation is
reflected in the statements of comprehensive income in net realized and unrealized
gain (loss) on held-for-trading investments.
The gain or loss on sale or expiry of options and warrants is reflected in the statements
of comprehensive income in change in unrealized appreciation (depreciation) on held-
for-trading investments.

CHOU FUNDS Notes to Financial Statements (continued) Years ended December 31, 2014 and 2013
66
2. Significant accounting policies (continued):
(j) Multi-series funds:
Where a Fund offers more than one series of units, the realized gains/losses from the sale
of investments, changes in unrealized gains on investments, income and expenses that are
common to the Fund as a whole, are allocated daily to each series based on the
proportionate share of the net asset value of the series. The proportionate share of each
series is determined by adding the current day's net unitholder subscriptions of the series to
the prior day's net asset value of the series. Any income or expense amounts that are
unique to a particular series (for example, management fees) are accounted for separately
in that particular series so as to not affect the net asset value of the other series.
(k) Valuation of Fund units:
The net assets attributable to holders of redeemable units of each Fund are computed by
dividing the net assets attributable to holders of a series of units by the total number of
units of the series outstanding at the time. The net assets attributable to holders of
redeemable units are determined at the close of business each Friday.
(l) Securities lending income:
The Funds lend portfolio securities from time to time in order to earn additional income.
Income from securities lending is included in the statements of comprehensive income of
the Funds and is recognized on an accrual basis.
(m) Classification of redeemable units issued by the Fund:
The Funds' redeemable units entitle unitholders the right to redeem their interest in the
Funds for cash equal to their proportionate share of the net asset value of the Funds,
amongst other contractual rights. These redeemable units involve multiple contractual
obligations on the part of the Funds and, therefore, meet the criteria for classification as
financial liabilities. The Funds' obligations for net assets attributable to unitholders is
measured at FVTPL, with fair value being the redemption amount as of the reporting dates.

CHOU FUNDS Notes to Financial Statements (continued) Years ended December 31, 2014 and 2013
67
2. Significant accounting policies (continued):
(n) Future accounting standards:
IFRS 9 was issued by the IASB in November 2009 and will replace International
Accounting Standard 39, Financial Instruments - Recognition and Measurement ("IAS 39").
IFRS 9 uses a single approach to determine whether a financial asset is measured at
amortized cost or fair value, replacing the multiple rules in IAS 39. The approach in IFRS 9
is based on how an entity manages its financial instruments in the context of its business
model and the contractual cash flow characteristics of the financial assets. The new
standard also requires a single impairment method to be used, replacing the multiple
impairment methods in IAS 39. In October 2010, the IASB issued a revised version of
IFRS 9. The revised standard adds guidance on the classification and measurement of
financial liabilities. The issued installments of IFRS 9 have an effective date of January 1,
2018. The Fund continues to evaluate the impact of IFRS 9 on its financial statements,
particularly with regard to the recording of its investments.
3. Financial instruments and risk management:
Investment activities of the Funds expose them to a variety of financial risks: credit risk, liquidity
risk and market risk (including interest rate risk, other price risk and currency risk). The level of
risk depends on each of the Funds' investment objectives and the type of securities each Fund
invests in. Funds that invest in underlying funds are also exposed to indirect financial risks in
the event that the underlying funds are exposed to these risks.
The Manager of the Funds seeks to minimize these risks by managing the security portfolios of
the Funds on a daily basis according to market events and the investment objectives of the
Funds. CPA Canada Handbook disclosures that are specific to each of the Funds are
presented in the discussion on financial risk management under the schedule of investments.
The sensitivity analysis shown in the discussion on financial risk management may differ from
actual results and the difference could be significant.
The Manager maintains a risk management practice that includes monitoring compliance with
investment restrictions to ensure that the Funds are being managed in accordance with the
Funds' stated investment objectives, strategies and securities regulations. The risk positions
noted below are monitored by the Manager on a regular basis.

CHOU FUNDS Notes to Financial Statements (continued) Years ended December 31, 2014 and 2013
68
3. Financial instruments and risk management (continued):
(a) Credit risk:
Credit risk is the risk that a counterparty to a financial instrument will fail to discharge a
commitment that it has entered into with the Funds. The fair value of a financial instrument
takes into account the credit rating of its issuer, and accordingly, represents the maximum
credit risk exposure of a Fund. The Funds' main credit risk concentration is in debt
securities and trading derivative instruments which are disclosed in the respective Funds'
schedule of investments. All transactions in securities are settled or paid for upon delivery
through brokers. As such, credit risk is considered minimal in the Funds on investment
transactions, as delivery of securities sold is made once the broker has received payment.
Payment is made on a purchase once the securities have been received by the broker.
The trade will fail if either party fails to meet its obligations.
(b) Interest rate risk:
Interest rate risk is the risk that the fair value of the Funds' interest-bearing investments will
fluctuate due to changes in the prevailing levels of market interest rates. The Funds'
exposure to interest rate risk is concentrated in investments in debt securities (such as
bonds and debentures or short-term instruments) and interest rate held-for-trading
instruments, if any. Other assets and liabilities are short-term in nature and are
non-interest bearing. There is minimal sensitivity to interest rate fluctuations on cash and
cash equivalents invested at short-term market interest rates.
(c) Currency risk:
Currency risk is the risk that the value of a financial instrument will fluctuate due to changes
in foreign exchange rates. Currency risk arises from financial instruments (including cash
and cash equivalents and foreign currency derivative instruments) that are denominated in
a currency other than Canadian dollars, which represents the functional currency of the
Funds. Therefore, the Funds' financial instruments that are denominated in other
currencies will fluctuate due to changes in the foreign exchange rates of those currencies in
relation to the Funds' functional currency.
(d) Liquidity risk:
Liquidity risk is the risk that the Funds may not be able to settle or meet their obligations on
time or at a reasonable price. The Funds are exposed to redemptions as units are
redeemable on demand and unitholders may redeem their units on each valuation date.
Therefore, in accordance with the Funds' Simplified Prospectus, the Funds invest their
assets in investments that are traded in an active market and can be readily disposed. In
addition, each Fund aims to retain sufficient cash and cash equivalent positions to maintain
liquidity. The Funds may, from time to time, invest in securities that are not traded in an
active market and may be illiquid.
CHOU FUNDS Notes to Financial Statements (continued) Years ended December 31, 2014 and 2013
69
3. Financial instruments and risk management (continued):
(e) Other price risk:
Other price risk is the risk that the value of financial instruments will fluctuate as a result of
changes in market prices (other than those arising from interest rate risk or currency risk)
caused by factors specific to a security, its issuer or all factors affecting a market or a
market segment. The Funds are exposed to market risk since all financial instruments held
by the Funds present a risk of loss of capital. The maximum risk resulting from financial
instruments is equivalent to their fair value, except for options written and future contracts
where possible losses can be unlimited.
4. Holders of redeemable units:
The Manager considers the Funds' capital to consist of holders of redeemable units
representing the net assets attributable to holders of redeemable units. The Funds' capital is
managed in accordance with each of the Funds' investment objectives, policies, and
restrictions, as outlined in the Funds' Prospectus. Changes in the Funds' capital during the
period are reflected in the statements of changes in net assets attributable to unitholders of
redeemable units. The Funds have no specific restrictions or specific capital requirements on
the subscriptions and redemptions of redeemable units, other than minimum subscription
requirements. The Funds endeavor to invest the subscriptions received in appropriate
investments while maintaining sufficient liquidity to meet redemptions. Holders of redeemable
units are entitled to distributions when declared. Distributions on redeemable units of a Fund
are reinvested in additional redeemable units of the Fund or at the option of the holders of
redeemable units, paid in cash. Redeemable units of the Funds are redeemable at the option
of the holders of redeemable units in accordance with the Prospectus.
Series A Series F 2014 2013 2014 2013
Chou Associates Fund
Units outstanding, beginning of year 4,208,995 4,951,551 305,457 306,407 Add units issued during the year 284,940 265,301 121,061 55,915 Deduct units redeemed during the year (374,681) (1,126,735) (81,238) (66,386)
Units outstanding before income distribution 4,119,254 4,090,117 345,280 295,936 Add units issued on reinvested income 23,080 118,878 3,421 9,521
Units outstanding, end of year 4,142,334 4,208,995 348,701 305,457

CHOU FUNDS Notes to Financial Statements (continued) Years ended December 31, 2014 and 2013
70
4. Holders of redeemable units' capital (continued):
Series A Series F 2014 2013 2014 2013
Chou Asia Fund
Units outstanding, beginning of year 2,291,643 2,711,744 79,004 78,634 Add units issued during the year 101,927 56,296 45,512 26,803 Deduct units redeemed during the year (320,708) (476,397) (24,916) (26,434)
Units outstanding before income distribution 2,072,862 2,291,643 99,600 79,003 Add units issued on reinvested income 36,417 – 2,455 1
Units outstanding, end of year 2,109,279 2,291,643 102,055 79,004
Chou Europe Fund
Units outstanding, beginning of year 1,544,393 937,889 79,132 2,180 Add units issued during the year 739,909 731,980 169,145 76,058 Deduct units redeemed during the year (501,541) (142,321) (49,384) –
Units outstanding before income distribution 1,782,761 1,527,548 198,893 78,238 Add units issued on reinvested income 2,441 16,845 1,793 894
Units outstanding, end of year 1,785,202 1,544,393 200,686 79,132
Chou Bond Fund
Units outstanding, beginning of year 4,020,643 4,434,113 362,911 861,551 Add units issued during the year 785,887 120,418 50,860 5,957 Deduct units redeemed during the year (472,348) (778,720) (67,175) (525,572)
Units outstanding before income distribution 4,334,182 3,775,811 346,596 341,936 Add units issued on reinvested income 265,044 244,832 20,886 20,975
Units outstanding, end of year 4,599,226 4,020,643 367,482 362,911
Chou RRSP Fund
Units outstanding, beginning of year 3,811,998 4,279,790 154,729 104,004 Add units issued during the year 135,979 132,488 33,012 64,335 Deduct units redeemed during the year (461,410) (634,092) (37,083) (16,355)
Units outstanding before income distribution 3,486,567 3,778,186 150,658 151,984 Add units issued on reinvested income 5 33,812 – 2,745
Units outstanding, end of year 3,486,572 3,811,998 150,658 154,729
CHOU FUNDS Notes to Financial Statements (continued) Years ended December 31, 2014 and 2013
71
5. Related party transactions:
Management fees:
The Manager manages the Chou Funds under a management agreement dated August 10,
2005. The Manager is entitled to an annual investment management fee equal to 1.5% of the
net asset value of Series A units and 1.0% of the net asset value of Series F units for all Funds
other than the Chou Bond Fund on which the Manager is entitled to an annual investment
management fee equal to 1.5% of the net asset value of Series A units and 1.0% of the net
asset value of Series F units. All other expenses attributable to the Funds are also payable out
of the assets of the Funds.
During the year, management fees for each Fund are as follows:
2014 2013
Chou Associates Fund $ 8,510,843 $ 8,343,594 Chou Asia Fund 657,820 634,763 Chou Europe Fund 412,946 – Chou Bond Fund 633,570 553,316 Chou RRSP Fund 2,054,789 1,962,285
As at year end, included in accrued expenses of each fund are the following amounts due to
the Manager, for management fees payable:
December 31, December 31, January 1, 2014 2013 2013
Chou Associates Fund $ 811,746 $ 765,519 $ 589,992 Chou Asia Fund 58,424 57,071 52,975 Chou Europe Fund 36,120 – – Chou Bond Fund 56,625 46,868 46,673 Chou RRSP Fund 184,008 174,992 156,585
The Manager, its officers and directors invest in units of the Funds from time to time in the
normal course of business. All transactions with the Manager are measured at the exchange
amounts.

CHOU FUNDS Notes to Financial Statements (continued) Years ended December 31, 2014 and 2013
72
5. Related party transactions (continued):
As at December 31, 2014, the following amounts of Series A redeemable units held by
employees of the Manager. No amounts of Series F redeemable units were held by employees
of the Manager.
December 31, December 31, January 1, 2014 2013 2013
Chou Associates Fund 175,287 174,295 169,128 Chou Asia Fund 353,013 346,825 346,825 Chou Europe Fund 535,761 535,031 528,880 Chou Bond Fund 1,935,292 1,821,534 1,262,814 Chou RRSP Fund 294,713 294,713 291,312
(a) Chou Associates Fund:
As at December 31, 2014, 4.2% of Class A redeemable units (December 31, 2013 - 4.1%;
January 1, 2013 - 3.4%) were held by employees of the Manager.
(b) Chou Asia Fund:
As at December 31, 2014, 6.7% of Class A redeemable units (December 31, 2013 -
45.3%; January 1, 2013 - 28.5%) were held by employees of the Manager.
(c) Chou Europe Fund:
As at December 31, 2014, 30.0% of Class A redeemable units (December 31, 2013 -
34.6%; January 1, 2013 - 56.4%) were held by employees of the Manager.
(d) Chou Bond Fund:
As at December 31, 2014, 42.1% of Class A redeemable units (December 31, 2013 -
45.3%; January 1, 2013 - 28.5%) were held by employees of the Manager.
(e) Chou RRSP Fund:
As at December 31, 2014, 8.5% of Class A redeemable units (December 31, 2013 - 7.7%;
January 1, 2013 - 6.8%) were held by employees of the Manager.
No amounts of Series F redeemable units were held by employees of the Manager.
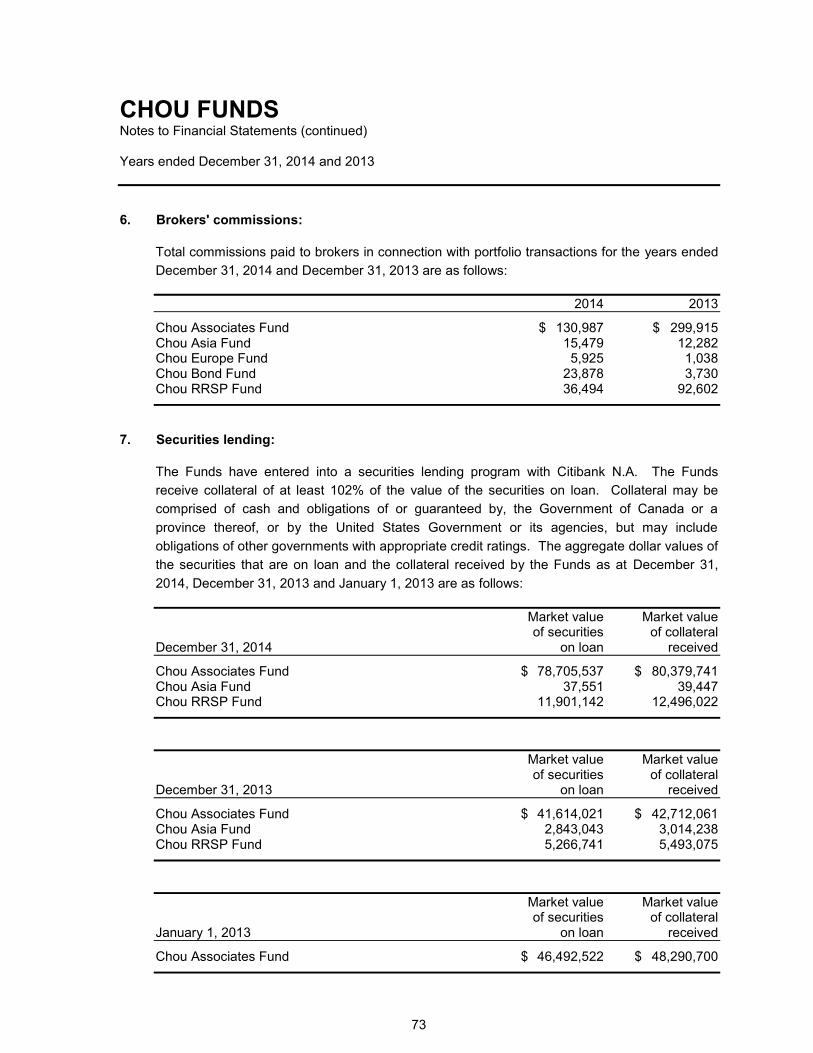
CHOU FUNDS Notes to Financial Statements (continued) Years ended December 31, 2014 and 2013
73
6. Brokers' commissions:
Total commissions paid to brokers in connection with portfolio transactions for the years ended
December 31, 2014 and December 31, 2013 are as follows:
2014 2013
Chou Associates Fund $ 130,987 $ 299,915 Chou Asia Fund 15,479 12,282 Chou Europe Fund 5,925 1,038 Chou Bond Fund 23,878 3,730 Chou RRSP Fund 36,494 92,602
7. Securities lending:
The Funds have entered into a securities lending program with Citibank N.A. The Funds
receive collateral of at least 102% of the value of the securities on loan. Collateral may be
comprised of cash and obligations of or guaranteed by, the Government of Canada or a
province thereof, or by the United States Government or its agencies, but may include
obligations of other governments with appropriate credit ratings. The aggregate dollar values of
the securities that are on loan and the collateral received by the Funds as at December 31,
2014, December 31, 2013 and January 1, 2013 are as follows:
Market value Market value of securities of collateral December 31, 2014 on loan received
Chou Associates Fund $ 78,705,537 $ 80,379,741 Chou Asia Fund 37,551 39,447 Chou RRSP Fund 11,901,142 12,496,022
Market value Market value of securities of collateral December 31, 2013 on loan received
Chou Associates Fund $ 41,614,021 $ 42,712,061 Chou Asia Fund 2,843,043 3,014,238 Chou RRSP Fund 5,266,741 5,493,075
Market value Market value of securities of collateral January 1, 2013 on loan received
Chou Associates Fund $ 46,492,522 $ 48,290,700

CHOU FUNDS Notes to Financial Statements (continued) Years ended December 31, 2014 and 2013
74
8. Fair value measurement:
Below is a classification of fair measurements of the Funds' investments based on a three level
fair value hierarchy and a reconciliation of transactions and transfers within that hierarchy. The
hierarchy of fair valuation inputs is summarized as follows:
Level 1 - quoted prices (unadjusted) in active markets for identical assets or liabilities;
Level 2 - inputs other than quoted prices included within Level 1 that are observable for the
assets or liabilities, either directly (i.e. as prices) or indirectly (i.e. derived from prices); and
Level 3 - inputs for the assets or liabilities that are not based on observable market data.
Additional quantitative disclosures are required for Level 3 securities.
(a) Chou Associates Fund:
December 31, 2014 Level 1 Level 2 Level 3 Total
Equities - long $ 388,925,413 $ – $ 1,884,536 $ 390,809,949 Bonds – 6,837,486 – 6,837,486
Total $ 388,925,413 $ 6,837,486 $ 1,884,536 $ 397,647,435
December 31, 2013 Level 1 Level 2 Level 3 Total
Equities - long $ 328,089,323 $ – $ 1,570,750 $ 329,660,073 Bonds – 5,801,248 – 5,801,248
328,089,323 5,801,248 1,570,750 335,461,321
Options - short (568,087) – – (568,087)
Total $ 327,521,236 $ 5,801,248 $ 1,570,750 $ 334,893,234
January 1, 2013 Level 1 Level 2 Level 3 Total
Equities - long $ 302,427,318 $ – $ 1,521,775 $ 303,949,093 Bonds – 37,243,089 – 37,243,089
Total $ 302,427,318 $ 37,243,089 $ 1,521,775 $ 341,192,182
During the years ended December 31, 2014 and 2013, there were no significant transfers
between Level 1, Level 2, and Level 3.

CHOU FUNDS Notes to Financial Statements (continued) Years ended December 31, 2014 and 2013
75
8. Fair value measurement (continued):
Fair value measurements using Level 3 inputs:
Equities - long Bonds Total
Balance, December 31, 2013 $ 1,570,750 $ – $ 1,570,750 Proceeds from sales during the year (470,283) – (470,283) Net realized gain on sale of investments 470,283 – 470,283 Change in unrealized appreciation
in value of investments 313,786 – 313,786
Balance, December 31, 2014 $ 1,884,536 $ – $ 1,884,536
Equities - long Bonds Total
Balance, January 1, 2013 $ 1,521,775 $ – $ 1,521,775 Change in unrealized appreciation
in value of investments 48,975 – 48,975
Balance, December 31, 2013 $ 1,570,750 $ – $ 1,570,750
(b) Chou Asia Fund:
December 31, 2014 Level 1 Level 2 Level 3 Total
Equities - long $ 19,152,040 $ – $ 4,792 $ 19,156,832
December 31, 2013 Level 1 Level 2 Level 3 Total
Equities - long $ 24,245,031 $ – $ – $ 24,245,031
January 1, 2013 Level 1 Level 2 Level 3 Total
Equities - long $ 20,367,616 $ – $ – $ 20,367,616
During the years ended December 31, 2014 and 2013, there were no significant transfers
between Level 1, Level 2, and Level 3.

CHOU FUNDS Notes to Financial Statements (continued) Years ended December 31, 2014 and 2013
76
8. Fair value measurement (continued):
Fair value measurements using Level 3 inputs:
Equities - long Bonds Total
Balance, December 31, 2013 $ – $ – $ – Net transfer in during the year 228,548 – 228,548 Change in unrealized depreciation
in value of investments (223,756) – (223,756)
Balance, December 31, 2014 $ 4,792 $ – $ 4,792
(c) Chou Europe Fund:
December 31, 2014 Level 1 Level 2 Level 3 Total
Equities - long $ 13,236,471 $ 504,240 $ 410,727 $ 14,151,438
December 31, 2013 Level 1 Level 2 Level 3 Total
Equities - long $ 8,430,391 $ – $ – $ 8,430,391
January 1, 2013 Level 1 Level 2 Level 3 Total
Equities - long $ 6,243,824 $ – $ – $ 6,243,824
Fair value measurements using Level 3 inputs:
Equities - long Bonds Total
Balance, December 31, 2013 $ – $ – $ – Change in unrealized appreciation
in value of investments 410,727 – 410,727
Balance, December 31, 2014 $ 410,727 $ – $ 410,727
During the years ended December 31, 2014 and 2013, there were no significant transfers
between Level 1, Level 2, and Level 3.
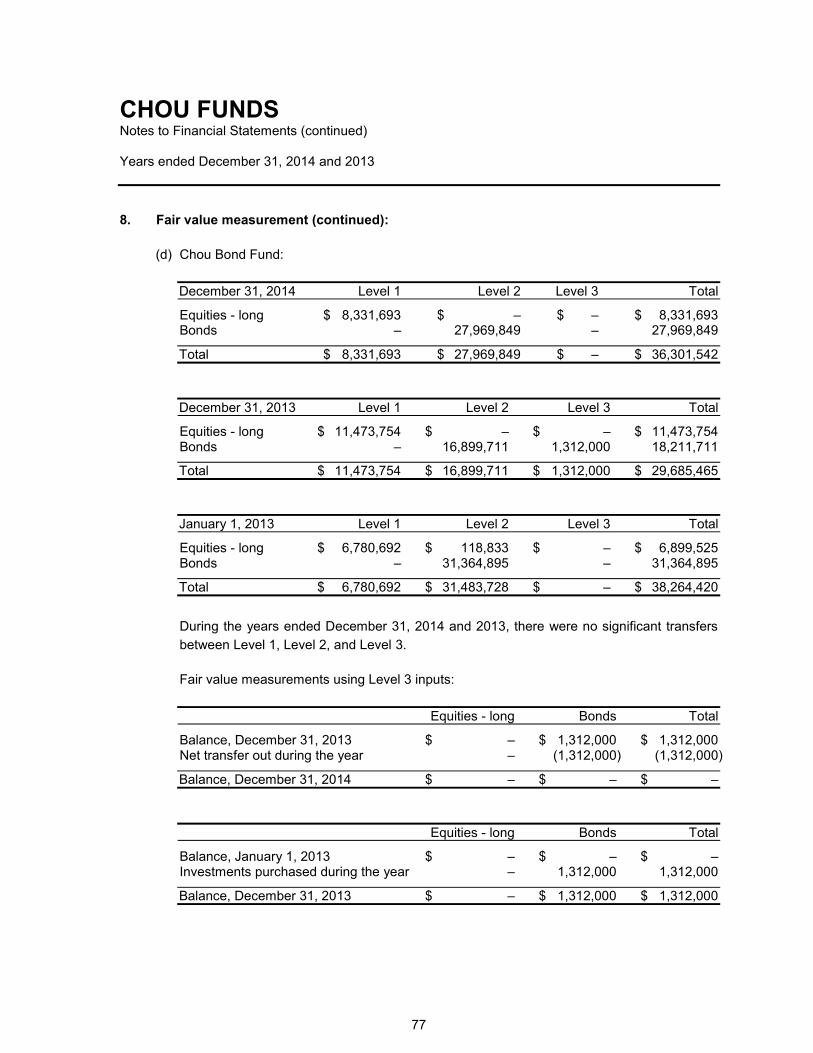
CHOU FUNDS Notes to Financial Statements (continued) Years ended December 31, 2014 and 2013
77
8. Fair value measurement (continued):
(d) Chou Bond Fund:
December 31, 2014 Level 1 Level 2 Level 3 Total
Equities - long $ 8,331,693 $ – $ – $ 8,331,693 Bonds – 27,969,849 – 27,969,849
Total $ 8,331,693 $ 27,969,849 $ – $ 36,301,542
December 31, 2013 Level 1 Level 2 Level 3 Total
Equities - long $ 11,473,754 $ – $ – $ 11,473,754 Bonds – 16,899,711 1,312,000 18,211,711
Total $ 11,473,754 $ 16,899,711 $ 1,312,000 $ 29,685,465
January 1, 2013 Level 1 Level 2 Level 3 Total
Equities - long $ 6,780,692 $ 118,833 $ – $ 6,899,525 Bonds – 31,364,895 – 31,364,895
Total $ 6,780,692 $ 31,483,728 $ – $ 38,264,420
During the years ended December 31, 2014 and 2013, there were no significant transfers
between Level 1, Level 2, and Level 3.
Fair value measurements using Level 3 inputs:
Equities - long Bonds Total
Balance, December 31, 2013 $ – $ 1,312,000 $ 1,312,000 Net transfer out during the year – (1,312,000) (1,312,000)
Balance, December 31, 2014 $ – $ – $ –
Equities - long Bonds Total
Balance, January 1, 2013 $ – $ – $ – Investments purchased during the year – 1,312,000 1,312,000
Balance, December 31, 2013 $ – $ 1,312,000 $ 1,312,000

CHOU FUNDS Notes to Financial Statements (continued) Years ended December 31, 2014 and 2013
78
8. Fair value measurement (continued):
(e) Chou RRSP Fund:
December 31, 2014 Level 1 Level 2 Level 3 Total
Equities - long $ 88,781,633 $ – $ – $ 88,781,633 Bonds – 7,333,697 – 7,333,697
Total $ 88,781,633 $ 7,333,697 $ – $ 96,115,330
December 31, 2013 Level 1 Level 2 Level 3 Total
Equities - long $ 82,057,791 $ – $ – $ 82,057,791 Bonds – 7,150,524 – 7,150,524
82,057,791 7,150,524 – 89,208,315
Options - short (38,821) – – (38,821)
Total $ 82,018,970 $ 7,150,524 $ – $ 89,169,494
January 1, 2013 Level 1 Level 2 Level 3 Total
Equities - long $ 104,749,382 $ – $ – $ 104,749,382 Bonds – 7,093,747 – 7,093,747
Total $ 104,749,382 $ 7,093,747 $ – $ 111,843,129
During the years ended December 31, 2014 and 2013, there were no significant transfers
between Level 1, Level 2, and Level 3.
9. Taxes:
(a) Income taxes:
The Chou Funds qualify as mutual fund trusts under the provisions of the Income Tax Act
(Canada). General income tax rules apply to the Chou Funds; however, no income tax is
payable by the Chou Funds on investment income and/or net realized capital gains which
are distributed to unitholders. In addition, income taxes payable on undistributed net
realized capital gains are refundable on a formula basis when units of the Fund are
redeemed. Sufficient net income and realized capital gains of the Chou Funds, have been,
or will be distributed to the unitholders such that no tax is payable by the Chou Funds and,
accordingly, no provision for taxes has been made in the financial statements.
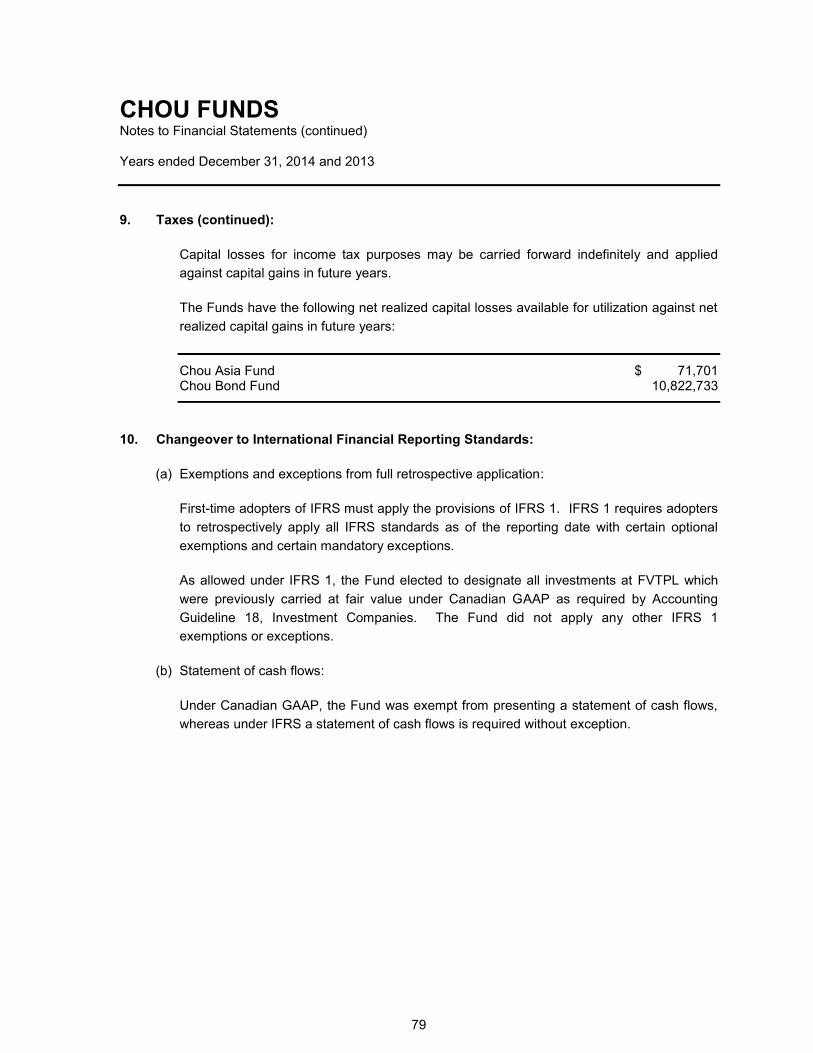
CHOU FUNDS Notes to Financial Statements (continued) Years ended December 31, 2014 and 2013
79
9. Taxes (continued):
Capital losses for income tax purposes may be carried forward indefinitely and applied
against capital gains in future years.
The Funds have the following net realized capital losses available for utilization against net
realized capital gains in future years:
Chou Asia Fund $ 71,701 Chou Bond Fund 10,822,733
10. Changeover to International Financial Reporting Standards:
(a) Exemptions and exceptions from full retrospective application:
First-time adopters of IFRS must apply the provisions of IFRS 1. IFRS 1 requires adopters
to retrospectively apply all IFRS standards as of the reporting date with certain optional
exemptions and certain mandatory exceptions.
As allowed under IFRS 1, the Fund elected to designate all investments at FVTPL which
were previously carried at fair value under Canadian GAAP as required by Accounting
Guideline 18, Investment Companies. The Fund did not apply any other IFRS 1
exemptions or exceptions.
(b) Statement of cash flows:
Under Canadian GAAP, the Fund was exempt from presenting a statement of cash flows,
whereas under IFRS a statement of cash flows is required without exception.

CHOU FUNDS Notes to Financial Statements (continued) Years ended December 31, 2014 and 2013
80
10. Changeover to International Financial Reporting Standards (continued):
(c) Reconciliation of equity and comprehensive income as previously reported under Canadian
GAAP to IFRS:
The following is a reconciliation of equity as previously reported under Canadian GAAP to
IFRS on January 1, 2013 and December 31, 2013:
Statement of financial position:
Chou Associates Fund:
December 31, January 1, 2013 2013
Net assets reported under Canadian GAAP $ 502,441,284 $ 426,935,098 Revaluation of investments at FVTPL 71,818 87,424
Net assets attributable to holders of redeemable units
$ 502,513,102 $ 427,022,522
Chou Asia Fund:
December 31, January 1, 2013 2013
Net assets reported under Canadian GAAP $ 39,676,907 $ 37,665,092 Revaluation of investments at FVTPL
(ii) 32,552 52,267
Net assets attributable to holders of redeemable units
(i) $ 39,709,459 $ 37,717,359
Chou Europe Fund:
December 31, January 1, 2013 2013
Net assets reported under Canadian GAAP $ 18,862,317 $ 7,793,352 Revaluation of investments at FVTPL
(ii) 18,199 28,303
Net assets attributable to holders of redeemable units
(i) $ 18,880,516 $ 7,821,655
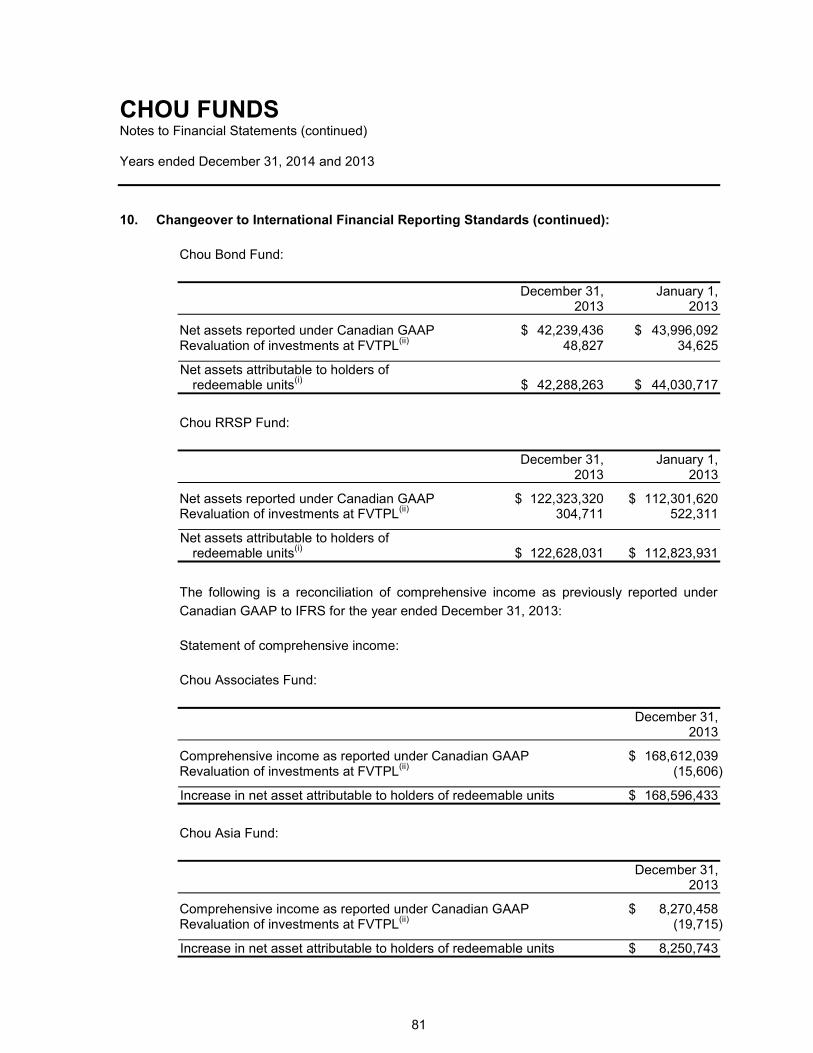
CHOU FUNDS Notes to Financial Statements (continued) Years ended December 31, 2014 and 2013
81
10. Changeover to International Financial Reporting Standards (continued):
Chou Bond Fund:
December 31, January 1, 2013 2013
Net assets reported under Canadian GAAP $ 42,239,436 $ 43,996,092 Revaluation of investments at FVTPL
(ii) 48,827 34,625
Net assets attributable to holders of redeemable units
(i) $ 42,288,263 $ 44,030,717
Chou RRSP Fund:
December 31, January 1, 2013 2013
Net assets reported under Canadian GAAP $ 122,323,320 $ 112,301,620 Revaluation of investments at FVTPL
(ii) 304,711 522,311
Net assets attributable to holders of redeemable units
(i) $ 122,628,031 $ 112,823,931
The following is a reconciliation of comprehensive income as previously reported under
Canadian GAAP to IFRS for the year ended December 31, 2013:
Statement of comprehensive income:
Chou Associates Fund:
December 31, 2013
Comprehensive income as reported under Canadian GAAP $ 168,612,039 Revaluation of investments at FVTPL
(ii) (15,606)
Increase in net asset attributable to holders of redeemable units $ 168,596,433
Chou Asia Fund:
December 31, 2013
Comprehensive income as reported under Canadian GAAP $ 8,270,458 Revaluation of investments at FVTPL
(ii) (19,715)
Increase in net asset attributable to holders of redeemable units $ 8,250,743

CHOU FUNDS Notes to Financial Statements (continued) Years ended December 31, 2014 and 2013
82
10. Changeover to International Financial Reporting Standards (continued):
Chou Europe Fund:
December 31, 2013
Comprehensive income as reported under Canadian GAAP $ 3,825,131 Revaluation of investments at FVTPL
(ii) (10,104)
Increase in net asset attributable to holders of redeemable units $ 3,815,027
Chou Bond Fund:
December 31, 2013
Comprehensive income as reported under Canadian GAAP $ 9,440,535 Revaluation of investments at FVTPL
(ii) 14,202
Increase in net asset attributable to holders of redeemable units $ 9,454,737
Chou RRSP Fund:
December 31, 2013
Comprehensive income as reported under Canadian GAAP $ 22,967,963 Revaluation of investments at FVTPL
(ii) (247,600)
Increase in net asset attributable to holders of redeemable units $ 22,720,363
(i) Classification of redeemable units issued by the Fund:
Previously under Canadian GAAP, the units of the Funds were classified as equity
instruments. In accordance with IAS 32, Financial Instruments - Presentation, the units
of the Funds are classified as financial liabilities as there is a requirement to distribute
or as a result of the different classes of units not having identical features.
(ii) Revaluation of investments at FVTPL:
Previously under Canadian GAAP, the fair value of the Funds' investments was
measured at bid prices for financial assets and ask prices for financial liabilities. Under
IFRS, the Manager concluded that mid-market prices for such instruments are
representative of fair value and to use the last trade price for measurement of financial
assets and financial liabilities.
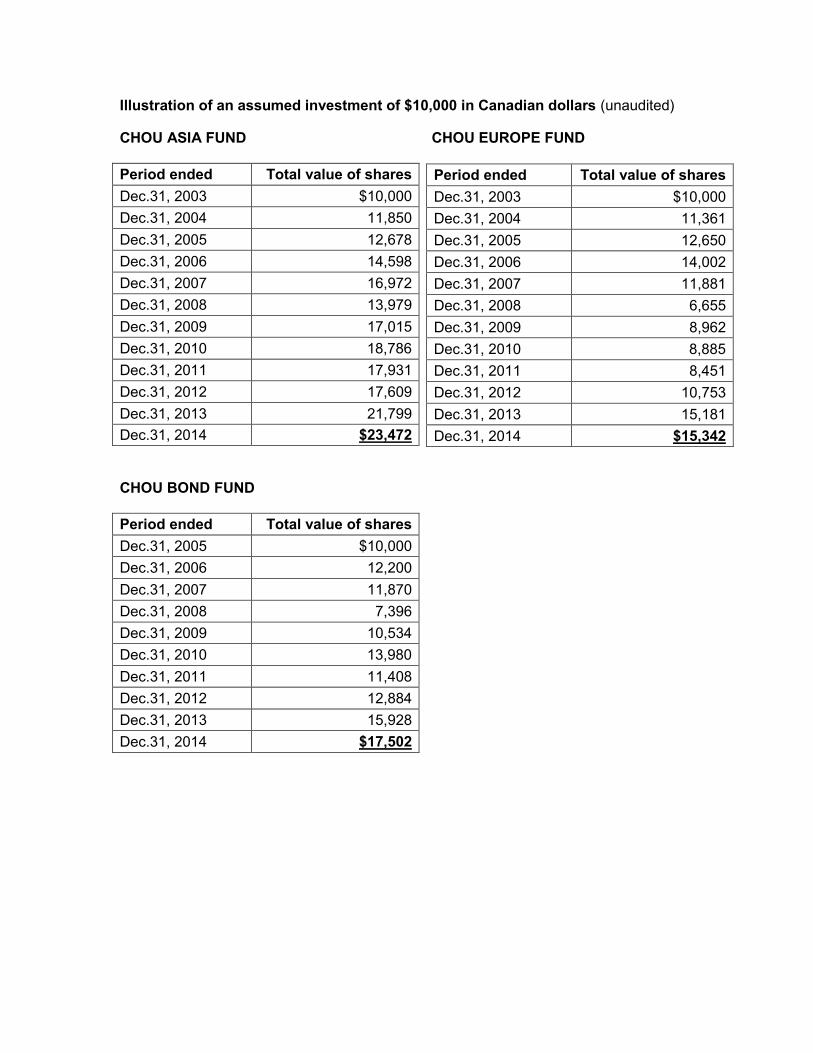
Illustration of an assumed investment of $10,000 in Canadian dollars (unaudited)
CHOU ASIA FUND CHOU EUROPE FUND
Period ended Total value of shares
Dec.31, 2003 $10,000
Dec.31, 2004 11,850
Dec.31, 2005 12,678
Dec.31, 2006 14,598
Dec.31, 2007 16,972
Dec.31, 2008 13,979
Dec.31, 2009 17,015
Dec.31, 2010 18,786
Dec.31, 2011 17,931
Dec.31, 2012 17,609
Dec.31, 2013 21,799
Dec.31, 2014 $23,472
CHOU BOND FUND
Period ended Total value of shares
Dec.31, 2005 $10,000
Dec.31, 2006 12,200
Dec.31, 2007 11,870
Dec.31, 2008 7,396
Dec.31, 2009 10,534
Dec.31, 2010 13,980
Dec.31, 2011 11,408
Dec.31, 2012 12,884
Dec.31, 2013 15,928
Dec.31, 2014 $17,502
Period ended Total value of shares
Dec.31, 2003 $10,000
Dec.31, 2004 11,361
Dec.31, 2005 12,650
Dec.31, 2006 14,002
Dec.31, 2007 11,881
Dec.31, 2008 6,655
Dec.31, 2009 8,962
Dec.31, 2010 8,885
Dec.31, 2011 8,451
Dec.31, 2012 10,753
Dec.31, 2013 15,181
Dec.31, 2014 $15,342

Illustration of an assumed investment of $10,000 in Canadian dollars (unaudited)
CHOU RRSP FUND
Period ended Total value of
shares
Dec.31, 1986 $10,000
Dec.31, 1987 10,818
Dec.31, 1988 12,281
Dec.31, 1989 14,350
Dec.31, 1990 12,722
Dec.31, 1991 13,284
Dec.31, 1992 14,500
Dec.31, 1993 16,727
Dec.31, 1994 14,961
Dec.31, 1995 17,808
Dec.31, 1996 21,735
Dec.31, 1997 32,741
Dec.31, 1998 38,806
Dec.31, 1999 36,217
Dec.31, 2000 42,188
Dec.31, 2001 49,370
Dec.31, 2002 65,095
Dec.31, 2003 72,658
Dec.31, 2004 82,362
Dec.31, 2005 95,294
Dec.31, 2006 104,479
Dec.31, 2007 94,817
Dec.31, 2008 54,629
Dec.31, 2009 69,818
Dec.31, 2010 102,367
Dec.31, 2011 81,150
Dec.31, 2012 108,860
Dec.31, 2013 132,029
Dec.31, 2014 $150,763
NOTE: Rates of return are historical total returns, include changes in unit prices, and assume the reinvestment of all distributions. These annual compounded returns do not take into account any sales charges, redemption fees, other optional expenses or income taxes that you have to pay and that could reduce these returns. The returns are not guaranteed. The Fund’s past performance does not necessarily indicate future performance.
The table is presented only to illustrate the effects of the compound growth rate and is not intended to reflect future values of the mutual funds or returns on the mutual funds.
Commissions, trailing commissions, management fees and expenses all may be associated with mutual fund investments. Please read the prospectus before investing.

Chou Associates Management Inc. 110 Sheppard Ave. East Suite 301, Box 18 Toronto, Ontario M2N 6Y8 Tel: 416-214-0675 Toll Free: 1-888-357-5070 Fax: 416-214-1733 Web: www.choufunds.com E-mail: [email protected] Recordkeeping and Custodian Citigroup Fund Services Canada, Inc. 100 – 5900 Hurontario St Mississauga, Ontario L5R 0E8 Tel: 905-214-8224 Toll Free: 1-866-379-3266 Fax: 1-866-877-9477 Auditors KPMG LLP Bay Adelaide Centre 333 Bay Street, Suite 4600 Toronto, Ontario M5H 2S5
Legal Counsel Owens, Wright LLP 20 Holly Street Suite 300 Toronto, Ontario M4S 3B1