aia annual funds report 2020
TRANSCRIPT
AIA ANNUAL FUNDS REPORT 2020For Policyholders
AIA ANNUAL FUNDS REPORT 2020 1
CONTENTSCEO MESSAGE 2
INTRODUCTION 4
IMPORTANT NOTICE 5
FUND PERFORMANCE SUMMARY 6
PORTFOLIO STATEMENT AIA Acorns of Asia Fund 8AIA Elite Funds 13AIA Emerging Markets Balanced/Equity Fund 30AIA European Equity Fund 35AIA Global Balanced Fund 39AIA Global Bond Fund 44AIA Global Dynamic Income Fund 48AIA Global Equity Fund 53AIA Global Property Returns Fund 57AIA Global Resources Fund 61AIA Global Technology Fund 65 AIA Greater China Balanced/Equity Fund 69AIA Growth Fund 74AIA India Balanced/Opportunities Fund 79AIA India Equity Fund 85AIA International Health Care Fund 89AIA Japan Balanced/Equity Fund 93AIA Managed Portfolios 99AIA Multi Select 109AIA Regional Equity Fund 116AIA Regional Fixed Income Fund 120AIA S$ Money Market Fund 124AIA US Equity Fund 127
STATEMENT OF ASSETS AND LIABILITIES 131
CAPITAL AND INCOME ACCOUNT 138
NOTES TO THE STATEMENTS 151
INDEPENDENT AUDITOR’S REPORT 154
ANNUAL STRATEGIC ASSET ALLOCATIONUPDATE FOR GUIDED PORTFOLIOS 157

AIA ANNUAL FUNDS REPORT 20202
10 March 2021
Dear AIA Policyholder
We would like to keep you informed on the performance of AIA Annual Funds for the Year 2020.
2020 had been a challenging year for the world. The highly transmissible nature of the coronavirus (COVID-19) left many governments worldwide with little choice but to implement strict lockdown measures on their nations in the first half of the year that brought the global economy to a standstill. As a result of this, the global economy experienced a deep recession and the financial market was marked by steep plunges in the price of risk assets coupled with indiscriminate widening of the credit spreads in favor of safe haven assets. The free-fall price action, however, found the trough in March, which sustainably recovered and more thereafter. This was attributed largely to the unprecedented response by the central banks around the world, led by the Federal Reserve (Fed) and the European Central Bank (ECB) through the cutting of interest rates and the implementation of bond purchase programs which enabled yields to stay at ultra-low levels and provide ample liquidity in the financial system. In addition, the announcement of significant government stimulus and relief packages had also helped to buttress the ailing global economy.
In 2020, the 10-year US Treasury (UST) yield fell from 1.91% at beginning of the year to a low of 0.50% in early August, before moderating back to 0.91% by year-end as risk-on sentiment took hold. Similarly, in Singapore, the 10-year Singapore Government Securities (SGS) yield fell from 1.74% coming into the year to 0.84% by year-end. For corporate bonds, credit spreads of Asian USD Investment Grade bonds (as proxied by the JPM JACI Investment Grade Blended Spread Index) had widened from 176 basis points (bps) at the beginning of the year to a peak of 314 bps in March, before moderating back to 215 bps by year-end.
Furthermore, global equity markets recovered from bear-market lows earlier in March and headed straight into a bull-market recovery by the third quarter. Global equities (as proxied by the MSCI World Index including dividends in USD terms) had swung from a loss of 31.75% at its trough to a gain of 16.53% by the end of the year.
By the end of 2020, the world heaved a sigh of relief on the good news of the availability of a number of vaccines that had demonstrated good efficacy. The development and distribution of vaccines could indeed aid in preventing the 2020-style lockdown. Nevertheless, the speed and willingness of the population across countries, to be vaccinated will be critical to the world economy recovery in 2021. Adding to the optimism for the new year is the outcome of the US election and Democrats’ gaining control of the Senate which effectively gives them control of the Congress, lifting the chances of another large stimulus package.
Stepping into 2021, the world economy is likely to return to some sense of normalcy as vaccine progress continues. Monetary policies are expected to remain accommodative, while fiscal policy tools will likely be utilised whenever required. This provides a backdrop that lends support to risk assets such as equities. Global markets should also see meaningful earnings recovery in 2021 on the back of the sharp decline last year, with earnings revisions having decidedly turned positive in the middle of 2020. Within Asia, focus will be on the evolving US-China trade relationship under the new Biden administration, with China leading regional growth and spurring domestic innovation and demand. The Singapore economy is also expected to continue growing gradually with the
AIA ANNUAL FUNDS REPORT 2020 3
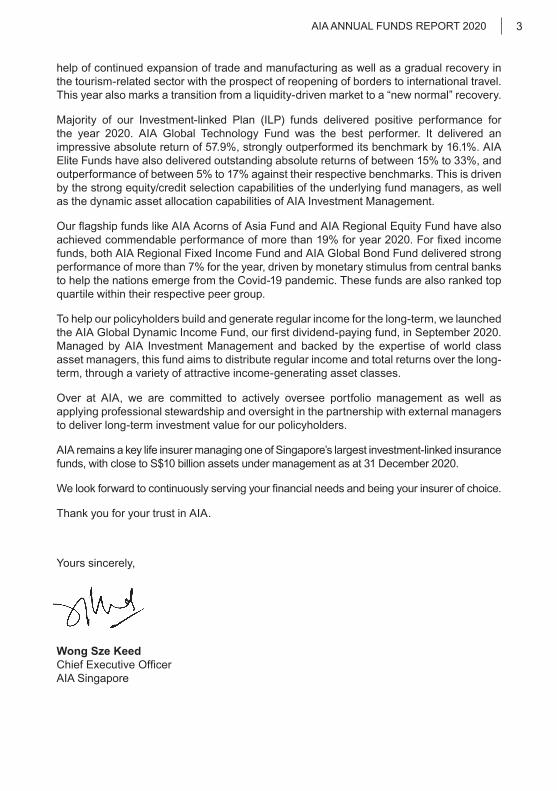
help of continued expansion of trade and manufacturing as well as a gradual recovery in the tourism-related sector with the prospect of reopening of borders to international travel. This year also marks a transition from a liquidity-driven market to a “new normal” recovery.
Majority of our Investment-linked Plan (ILP) funds delivered positive performance for the year 2020. AIA Global Technology Fund was the best performer. It delivered an impressive absolute return of 57.9%, strongly outperformed its benchmark by 16.1%. AIA Elite Funds have also delivered outstanding absolute returns of between 15% to 33%, and outperformance of between 5% to 17% against their respective benchmarks. This is driven by the strong equity/credit selection capabilities of the underlying fund managers, as well as the dynamic asset allocation capabilities of AIA Investment Management.
Our flagship funds like AIA Acorns of Asia Fund and AIA Regional Equity Fund have also achieved commendable performance of more than 19% for year 2020. For fixed income funds, both AIA Regional Fixed Income Fund and AIA Global Bond Fund delivered strong performance of more than 7% for the year, driven by monetary stimulus from central banks to help the nations emerge from the Covid-19 pandemic. These funds are also ranked top quartile within their respective peer group.
To help our policyholders build and generate regular income for the long-term, we launched the AIA Global Dynamic Income Fund, our first dividend-paying fund, in September 2020. Managed by AIA Investment Management and backed by the expertise of world class asset managers, this fund aims to distribute regular income and total returns over the long-term, through a variety of attractive income-generating asset classes.
Over at AIA, we are committed to actively oversee portfolio management as well as applying professional stewardship and oversight in the partnership with external managers to deliver long-term investment value for our policyholders.
AIA remains a key life insurer managing one of Singapore’s largest investment-linked insurance funds, with close to S$10 billion assets under management as at 31 December 2020.
We look forward to continuously serving your financial needs and being your insurer of choice.
Thank you for your trust in AIA.
Yours sincerely,
Wong Sze KeedChief Executive OfficerAIA Singapore
AIA ANNUAL FUNDS REPORT 20204
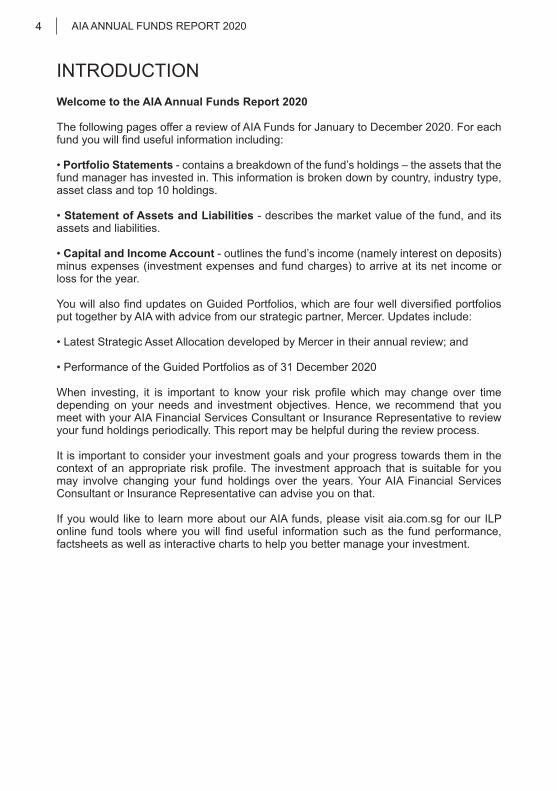
INTRODUCTIONWelcome to the AIA Annual Funds Report 2020
The following pages offer a review of AIA Funds for January to December 2020. For each fund you will find useful information including:
• Portfolio Statements - contains a breakdown of the fund’s holdings – the assets that the fund manager has invested in. This information is broken down by country, industry type, asset class and top 10 holdings.
• Statement of Assets and Liabilities - describes the market value of the fund, and its assets and liabilities.
• Capital and Income Account - outlines the fund’s income (namely interest on deposits) minus expenses (investment expenses and fund charges) to arrive at its net income or loss for the year.
You will also find updates on Guided Portfolios, which are four well diversified portfolios put together by AIA with advice from our strategic partner, Mercer. Updates include:
• Latest Strategic Asset Allocation developed by Mercer in their annual review; and
• Performance of the Guided Portfolios as of 31 December 2020
When investing, it is important to know your risk profile which may change over time depending on your needs and investment objectives. Hence, we recommend that you meet with your AIA Financial Services Consultant or Insurance Representative to review your fund holdings periodically. This report may be helpful during the review process.
It is important to consider your investment goals and your progress towards them in the context of an appropriate risk profile. The investment approach that is suitable for you may involve changing your fund holdings over the years. Your AIA Financial Services Consultant or Insurance Representative can advise you on that.
If you would like to learn more about our AIA funds, please visit aia.com.sg for our ILP online fund tools where you will find useful information such as the fund performance, factsheets as well as interactive charts to help you better manage your investment.
AIA ANNUAL FUNDS REPORT 2020 5
Important Notice
This report is published for informational purposes only. Fund returns are in Singapore dollars on a bid-to-bid price basis with net dividends reinvested. The AIA Funds are investment-linked policy sub-funds offered by AIA Singapore Private Limited (AIA) and are only available under AIA Investment-Linked Policies. AIA is the product provider.
Investments are subject to investment risks including the possible loss of the principal amount invested. Past performance, as well as the prediction, projection or forecast on the economy, securities markets or the economic trends of the markets are not necessarily indicative of the future or likely performance of the AIA Funds. The performance of the AIA Funds is not guaranteed and the value of the units in the AIA Funds and the income accruing to the units, if any, may fall or rise. Investments in the securities, instruments, currencies and other assets mentioned herein are not deposits or other obligations of, or guaranteed or insured by AIA.
This report does not constitute investment advice and was prepared without regard to the specific objectives, financial situation or needs of any particular person who may read it. It is not to be taken in substitution of the exercise of judgment by the reader, who should seek separate legal and financial advice and should read the relevant documents before investing. If such person chooses not to do so, he should consider carefully whether an investment in the security, instrument, currency or other asset is suitable for him. Any reliance on the information or opinions herein is therefore entirely at the reader’s own risk. AIA accepts no liability for any direct, special, indirect, consequential, incidental damages or any other loss or damages of any kind arising from any such use of the information herein (including any error, omission or misstatement herein, negligent or otherwise) or further communication thereof, even if AIA or any other person has been advised of the possibility thereof.
Although the information was compiled from sources believed to be reliable, AIA does not guarantee its accuracy, completeness, correctness or timeliness for any particular purpose and the information and opinions contained may change without notice. The opinions may be formulated based on a number of assumptions, which may turn out to be invalid, and in reliance on the views of research teams within the group situated outside of Singapore. All third party data are copyrighted by and proprietary to the provider. AIA and its associates, their directors, officers and/or employees may have positions or other interests in, and may effect transactions in the securities, instruments, currencies and other assets mentioned herein for themselves or their clients.
A product summary and product highlight sheets relating to the AIA Funds are available and may be obtained from your AIA Financial Services Consultant or Insurance Representative. You should read the product summary and the product highlight sheets before deciding whether to subscribe for units in any AIA Funds.
This report is not intended for distribution to, or use by, any person or entity in any jurisdiction or country where such distribution or use would be contrary to law or regulation and may not be published, circulated or reproduced in whole or in part without the prior written consent of AIA.
If you have any queries arising from, or in connection with, the information contained in this report, please contact AIA Singapore Private Limited (Company Registration No. 201106386R).

As at 31 December 2020
AIA ANNUAL FUNDS REPORT 20206
3-month 6-monthFund Benchmark* Fund Benchmark*
% % % %AIA Acorns of Asia Fund 10.55 8.89 19.42 14.67 AIA Elite Adventurous Fund^^ 9.87 9.41 21.68 15.04 AIA Elite Adventurous Fund (USD)^^ 12.87 13.00 27.15 21.43 AIA Elite Balanced Fund^^ 6.70 6.61 14.47 10.61AIA Elite Balanced Fund (USD)^^ 9.92 10.11 20.02 16.76AIA Elite Conservative Fund^^ 3.60 3.79 7.28 6.21 AIA Elite Conservative Fund (USD)^^ 6.38 7.20 11.81 12.11 AIA Emerging Markets Balanced Fund 12.90 9.51 18.96 14.64 AIA Emerging Markets Equity Fund 20.46 15.89 29.69 24.24 AIA European Equity Fund 14.40 11.93 17.33 14.47 AIA Global Balanced Fund 6.06 5.84 9.49 9.51 AIA Global Bond Fund 1.01 0.28 2.20 1.08 AIA Global Dynamic Income Fund** 1.91 - N/A - AIA Global Equity Fund 10.97 11.03 21.17 17.48 AIA Global Property Returns Fund 4.86 9.66 8.55 9.54 AIA Global Resources Fund 16.97 18.69 17.40 15.40 AIA Global Technology Fund 10.72 9.37 22.75 19.76 AIA Greater China Balanced Fund 6.83 6.35 13.94 12.79 AIA Greater China Equity Fund 10.16 10.49 21.13 20.99 AIA Growth Fund 12.03 10.73 9.31 8.61 AIA India Balanced Fund 12.51 10.28 17.31 18.85 AIA India Equity Fund 13.22 17.19 25.77 31.82 AIA India Opportunities Fund 20.22 17.31 27.67 32.14 AIA International Health Care Fund 3.07 3.43 7.35 6.05AIA Japan Balanced Fund 8.30 6.16 12.13 9.87 AIA Japan Equity Fund 12.91 10.01 18.63 15.59 AIA Multi Select 30 3.49 3.25 5.73 5.54 AIA Multi Select 50 6.91 6.26 11.12 10.08 AIA Multi Select 70 10.64 9.27 17.08 14.71 AIA Portfolio 30 3.75 3.30 6.55 5.59 AIA Portfolio 50 5.53 5.32 9.26 8.70 AIA Portfolio 70 7.24 7.34 12.40 11.82 AIA Portfolio 100 8.18 5.13 9.98 8.01 AIA Regional Equity Fund 14.78 14.83 27.42 24.34 AIA Regional Fixed Income Fund 1.39 0.34 2.85 1.22 AIA S$ Money Market Fund 0.00 0.04 0.00 0.08 AIA US Equity Fund 5.77 8.44 11.41 15.45
^^ Only available in AIA Platinum Wealth Elite and AIA Platinum Retirement Elite** Only available in AIA Invest Easy (Cash/SRS)
Fund Performance SummaryTABLE OF FUND PERFORMANCE
As at 31 December 2020
AIA ANNUAL FUNDS REPORT 2020 7
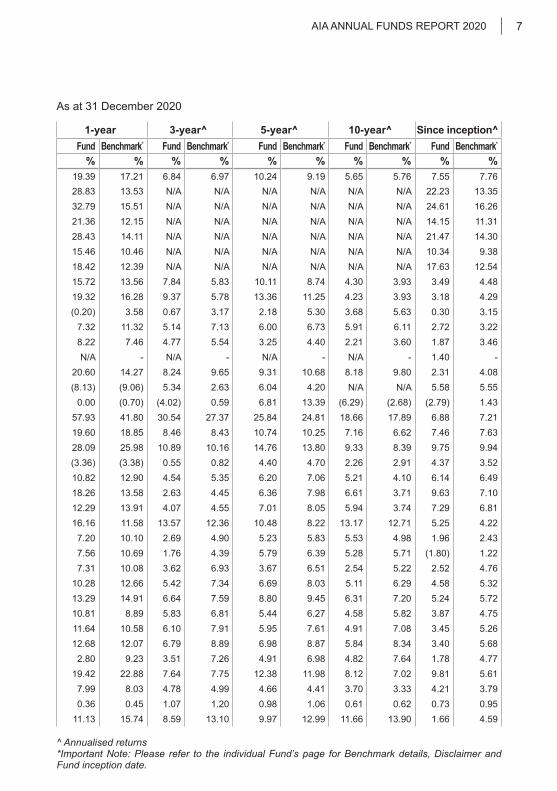
1-year 3-year^ 5-year^ 10-year^ Since inception^Fund Benchmark* Fund Benchmark* Fund Benchmark* Fund Benchmark* Fund Benchmark*
% % % % % % % % % % 19.39 17.21 6.84 6.97 10.24 9.19 5.65 5.76 7.55 7.76 28.83 13.53 N/A N/A N/A N/A N/A N/A 22.23 13.35 32.79 15.51 N/A N/A N/A N/A N/A N/A 24.61 16.26 21.36 12.15 N/A N/A N/A N/A N/A N/A 14.15 11.3128.43 14.11 N/A N/A N/A N/A N/A N/A 21.47 14.30 15.46 10.46 N/A N/A N/A N/A N/A N/A 10.34 9.38 18.42 12.39 N/A N/A N/A N/A N/A N/A 17.63 12.54 15.72 13.56 7.84 5.83 10.11 8.74 4.30 3.93 3.49 4.48 19.32 16.28 9.37 5.78 13.36 11.25 4.23 3.93 3.18 4.29 (0.20) 3.58 0.67 3.17 2.18 5.30 3.68 5.63 0.30 3.15
7.32 11.32 5.14 7.13 6.00 6.73 5.91 6.11 2.72 3.22 8.22 7.46 4.77 5.54 3.25 4.40 2.21 3.60 1.87 3.46 N/A - N/A - N/A - N/A - 1.40 -
20.60 14.27 8.24 9.65 9.31 10.68 8.18 9.80 2.31 4.08 (8.13) (9.06) 5.34 2.63 6.04 4.20 N/A N/A 5.58 5.55
0.00 (0.70) (4.02) 0.59 6.81 13.39 (6.29) (2.68) (2.79) 1.43 57.93 41.80 30.54 27.37 25.84 24.81 18.66 17.89 6.88 7.21 19.60 18.85 8.46 8.43 10.74 10.25 7.16 6.62 7.46 7.63 28.09 25.98 10.89 10.16 14.76 13.80 9.33 8.39 9.75 9.94 (3.36) (3.38) 0.55 0.82 4.40 4.70 2.26 2.91 4.37 3.52 10.82 12.90 4.54 5.35 6.20 7.06 5.21 4.10 6.14 6.49 18.26 13.58 2.63 4.45 6.36 7.98 6.61 3.71 9.63 7.10 12.29 13.91 4.07 4.55 7.01 8.05 5.94 3.74 7.29 6.81 16.16 11.58 13.57 12.36 10.48 8.22 13.17 12.71 5.25 4.22 7.20 10.10 2.69 4.90 5.23 5.83 5.53 4.98 1.96 2.43 7.56 10.69 1.76 4.39 5.79 6.39 5.28 5.71 (1.80) 1.22 7.31 10.08 3.62 6.93 3.67 6.51 2.54 5.22 2.52 4.76
10.28 12.66 5.42 7.34 6.69 8.03 5.11 6.29 4.58 5.32 13.29 14.91 6.64 7.59 8.80 9.45 6.31 7.20 5.24 5.72 10.81 8.89 5.83 6.81 5.44 6.27 4.58 5.82 3.87 4.75 11.64 10.58 6.10 7.91 5.95 7.61 4.91 7.08 3.45 5.26 12.68 12.07 6.79 8.89 6.98 8.87 5.84 8.34 3.40 5.68
2.80 9.23 3.51 7.26 4.91 6.98 4.82 7.64 1.78 4.77 19.42 22.88 7.64 7.75 12.38 11.98 8.12 7.02 9.81 5.61
7.99 8.03 4.78 4.99 4.66 4.41 3.70 3.33 4.21 3.79 0.36 0.45 1.07 1.20 0.98 1.06 0.61 0.62 0.73 0.95
11.13 15.74 8.59 13.10 9.97 12.99 11.66 13.90 1.66 4.59
^ Annualised returns*Important Note: Please refer to the individual Fund’s page for Benchmark details, Disclaimer and Fund inception date.
As at 31 December 2020
AIA ANNUAL FUNDS REPORT 20208
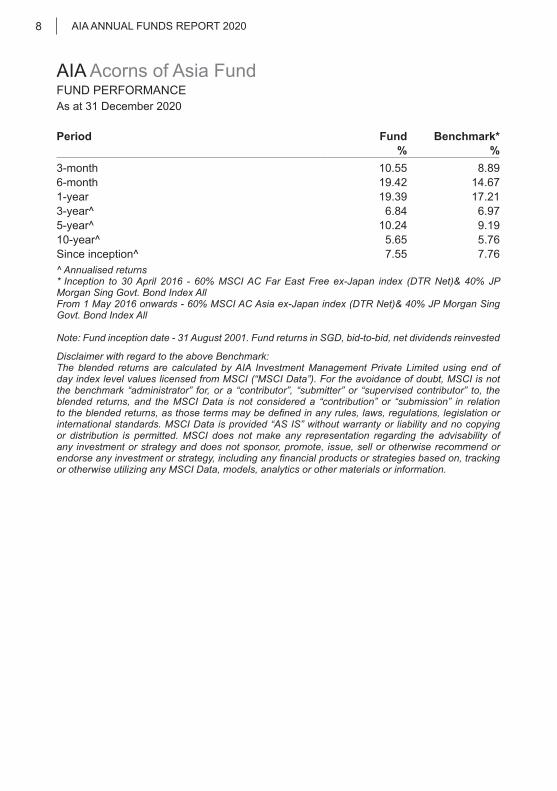
AIA Acorns of Asia FundFUND PERFORMANCE
Period Fund Benchmark*% %
3-month 10.55 8.89 6-month 19.42 14.67 1-year 19.39 17.21 3-year^ 6.84 6.97 5-year^ 10.24 9.19 10-year^ 5.65 5.76 Since inception^ 7.55 7.76 ^ Annualised returns* Inception to 30 April 2016 - 60% MSCI AC Far East Free ex-Japan index (DTR Net)& 40% JP Morgan Sing Govt. Bond Index AllFrom 1 May 2016 onwards - 60% MSCI AC Asia ex-Japan index (DTR Net)& 40% JP Morgan Sing Govt. Bond Index All
Note: Fund inception date - 31 August 2001. Fund returns in SGD, bid-to-bid, net dividends reinvested
Disclaimer with regard to the above Benchmark:The blended returns are calculated by AIA Investment Management Private Limited using end of day index level values licensed from MSCI (“MSCI Data”). For the avoidance of doubt, MSCI is not the benchmark “administrator” for, or a “contributor”, “submitter” or “supervised contributor” to, the blended returns, and the MSCI Data is not considered a “contribution” or “submission” in relation to the blended returns, as those terms may be defined in any rules, laws, regulations, legislation or international standards. MSCI Data is provided “AS IS” without warranty or liability and no copying or distribution is permitted. MSCI does not make any representation regarding the advisability of any investment or strategy and does not sponsor, promote, issue, sell or otherwise recommend or endorse any investment or strategy, including any financial products or strategies based on, tracking or otherwise utilizing any MSCI Data, models, analytics or other materials or information.

As at 31 December 2020
AIA ANNUAL FUNDS REPORT 2020 9
AIA Acorns of Asia FundPORTFOLIO STATEMENTS
Country Allocation^ Market Value SGD
% of Net Asset Value
Singapore 520,471,702 33.33 China 386,110,221 24.72 Hong Kong 168,812,431 10.81 Korea 139,486,758 8.93 India 125,139,801 8.01 Taiwan 116,642,954 7.47 Australia 27,532,088 1.76 United Kingdom 8,980,313 0.57 Sri Lanka 7,482,953 0.48 Switzerland 7,216,655 0.46 Thailand 6,646,951 0.43 Philippines 5,882,805 0.38 France 5,345,850 0.34 Netherlands 4,036,000 0.26 Canada 2,057,940 0.13
Portfolio of Investments 1,531,845,422 98.08Other Net Assets 30,027,312 1.92 Total 1,561,872,734 100.00
As at 31 December 2020
AIA ANNUAL FUNDS REPORT 202010
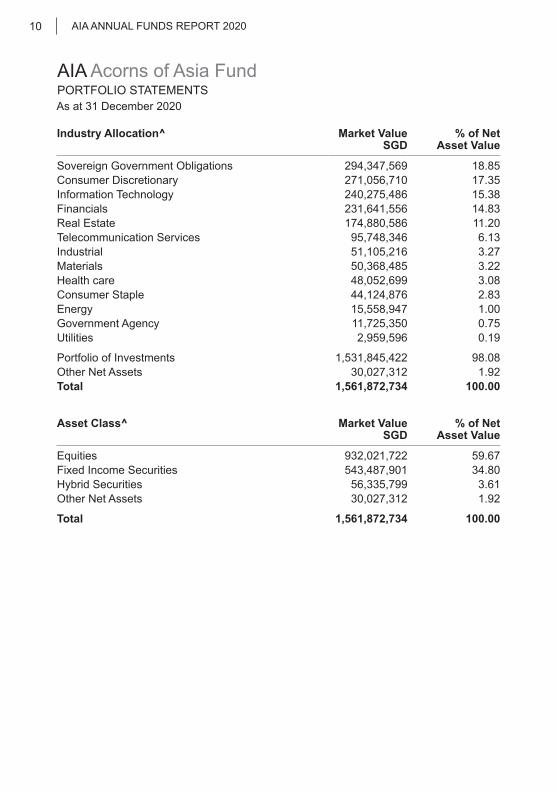
AIA Acorns of Asia FundPORTFOLIO STATEMENTS
Industry Allocation^ Market Value SGD
% of Net Asset Value
Sovereign Government Obligations 294,347,569 18.85 Consumer Discretionary 271,056,710 17.35 Information Technology 240,275,486 15.38 Financials 231,641,556 14.83 Real Estate 174,880,586 11.20 Telecommunication Services 95,748,346 6.13 Industrial 51,105,216 3.27 Materials 50,368,485 3.22 Health care 48,052,699 3.08 Consumer Staple 44,124,876 2.83 Energy 15,558,947 1.00 Government Agency 11,725,350 0.75 Utilities 2,959,596 0.19
Portfolio of Investments 1,531,845,422 98.08Other Net Assets 30,027,312 1.92 Total 1,561,872,734 100.00
Asset Class^ Market Value SGD
% of Net Asset Value
Equities 932,021,722 59.67Fixed Income Securities 543,487,901 34.80Hybrid Securities 56,335,799 3.61Other Net Assets 30,027,312 1.92
Total 1,561,872,734 100.00
As at 31 December 2020
AIA ANNUAL FUNDS REPORT 2020 11
AIA Acorns of Asia FundPORTFOLIO STATEMENTS
Credit Rating of Debt Securities**^ Market Value SGD
% of Net Asset Value
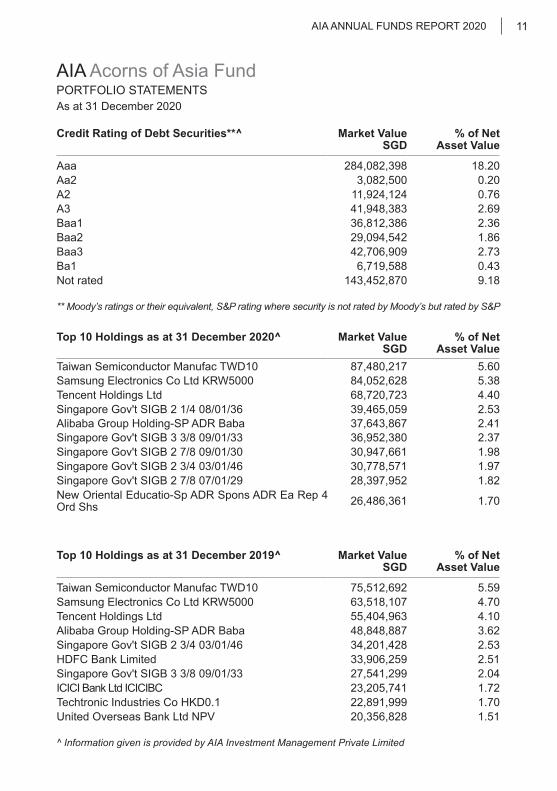
Aaa 284,082,398 18.20Aa2 3,082,500 0.20A2 11,924,124 0.76A3 41,948,383 2.69Baa1 36,812,386 2.36Baa2 29,094,542 1.86Baa3 42,706,909 2.73Ba1 6,719,588 0.43Not rated 143,452,870 9.18
** Moody’s ratings or their equivalent, S&P rating where security is not rated by Moody’s but rated by S&P
Top 10 Holdings as at 31 December 2020^ Market Value SGD
% of Net Asset Value
Taiwan Semiconductor Manufac TWD10 87,480,217 5.60Samsung Electronics Co Ltd KRW5000 84,052,628 5.38Tencent Holdings Ltd 68,720,723 4.40Singapore Gov't SIGB 2 1/4 08/01/36 39,465,059 2.53Alibaba Group Holding-SP ADR Baba 37,643,867 2.41Singapore Gov't SIGB 3 3/8 09/01/33 36,952,380 2.37Singapore Gov't SIGB 2 7/8 09/01/30 30,947,661 1.98Singapore Gov't SIGB 2 3/4 03/01/46 30,778,571 1.97Singapore Gov't SIGB 2 7/8 07/01/29 28,397,952 1.82New Oriental Educatio-Sp ADR Spons ADR Ea Rep 4 Ord Shs 26,486,361 1.70
Top 10 Holdings as at 31 December 2019^ Market Value SGD
% of Net Asset Value
Taiwan Semiconductor Manufac TWD10 75,512,692 5.59Samsung Electronics Co Ltd KRW5000 63,518,107 4.70Tencent Holdings Ltd 55,404,963 4.10Alibaba Group Holding-SP ADR Baba 48,848,887 3.62Singapore Gov't SIGB 2 3/4 03/01/46 34,201,428 2.53HDFC Bank Limited 33,906,259 2.51Singapore Gov't SIGB 3 3/8 09/01/33 27,541,299 2.04ICICI Bank Ltd ICICIBC 23,205,741 1.72Techtronic Industries Co HKD0.1 22,891,999 1.70United Overseas Bank Ltd NPV 20,356,828 1.51
^ Information given is provided by AIA Investment Management Private Limited
As at 31 December 2020
AIA ANNUAL FUNDS REPORT 202012
AIA Acorns of Asia FundOTHER INFORMATION
Exposure To Derivatives Market ValueSGD
% of Net AssetValue
Realised Gains/
(Losses)SGD
Unrealised Gains/
(Losses) SGD
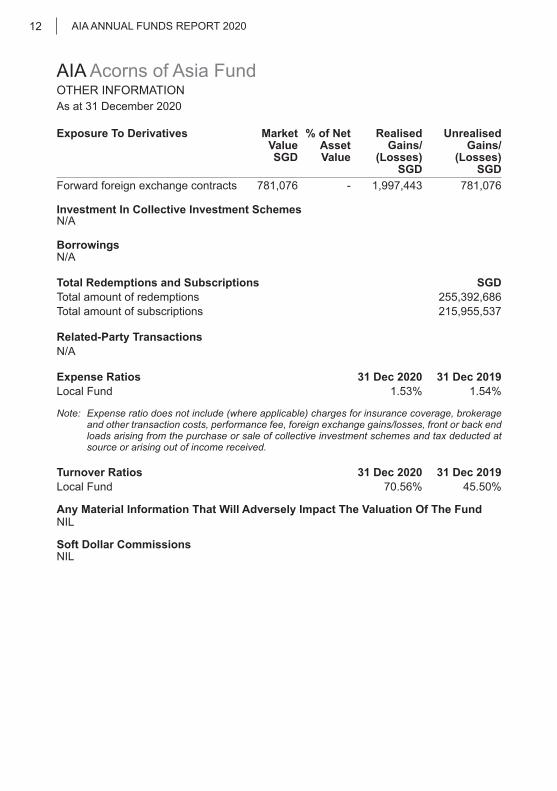
Forward foreign exchange contracts 781,076 - 1,997,443 781,076
Investment In Collective Investment SchemesN/A
BorrowingsN/A
Total Redemptions and Subscriptions SGDTotal amount of redemptions 255,392,686Total amount of subscriptions 215,955,537
Related-Party Transactions N/A
Expense Ratios 31 Dec 2020 31 Dec 2019 Local Fund 1.53% 1.54%
Note: Expense ratio does not include (where applicable) charges for insurance coverage, brokerage and other transaction costs, performance fee, foreign exchange gains/losses, front or back end loads arising from the purchase or sale of collective investment schemes and tax deducted at source or arising out of income received.
Turnover Ratios 31 Dec 2020 31 Dec 2019 Local Fund 70.56% 45.50%
Any Material Information That Will Adversely Impact The Valuation Of The FundNIL
Soft Dollar CommissionsNIL

As at 31 December 2020
AIA ANNUAL FUNDS REPORT 2020 13
AIA Elite FundsFUND PERFORMANCE
AIA Elite Adventurous Fund Period Fund Benchmark*
% %3-month 9.87 9.41 6-month 21.68 15.04 1-year 28.83 13.53 3-year^ N/A N/A5-year^ N/A N/A10-year^ N/A N/ASince inception^ 22.23 13.35
^Annualised Returns*90% MSCI World Total Net Return Index and 10% Bloomberg Barclays Global Aggregate Corporate Total Return Index.
Note: Fund Inception date - 19 July 2019. Fund returns in SGD, bid to bid, net dividends reinvested
AIA Elite Adventurous Fund (USD)Period Fund Benchmark*
% %3-month 12.87 13.00 6-month 27.15 21.43 1-year 32.79 15.51 3-year^ N/A N/A5-year^ N/A N/A10-year^ N/A N/ASince inception^ 24.61 16.26
^Annualised Returns*90% MSCI World Total Net Return Index & 10% Bloomberg Barclays Global Aggregate Corporate Total Return Index.
Note: Fund Inception date - 19 July 2019. Fund returns in USD, bid to bid, net dividends reinvested
As at 31 December 2020
AIA ANNUAL FUNDS REPORT 202014
AIA Elite FundsFUND PERFORMANCE
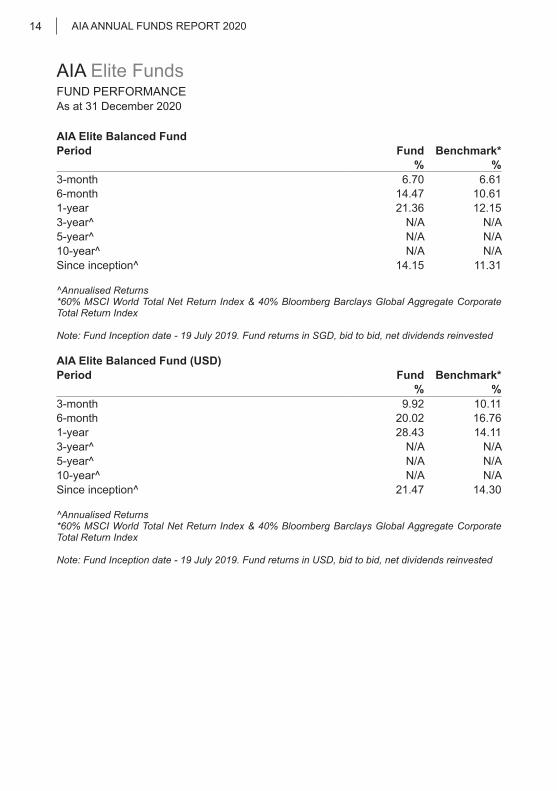
AIA Elite Balanced Fund Period Fund Benchmark*
% %3-month 6.70 6.61 6-month 14.47 10.61 1-year 21.36 12.15 3-year^ N/A N/A5-year^ N/A N/A10-year^ N/A N/ASince inception^ 14.15 11.31
^Annualised Returns*60% MSCI World Total Net Return Index & 40% Bloomberg Barclays Global Aggregate Corporate Total Return Index
Note: Fund Inception date - 19 July 2019. Fund returns in SGD, bid to bid, net dividends reinvested
AIA Elite Balanced Fund (USD)Period Fund Benchmark*
% %3-month 9.92 10.11 6-month 20.02 16.76 1-year 28.43 14.11 3-year^ N/A N/A5-year^ N/A N/A10-year^ N/A N/ASince inception^ 21.47 14.30
^Annualised Returns*60% MSCI World Total Net Return Index & 40% Bloomberg Barclays Global Aggregate Corporate Total Return Index
Note: Fund Inception date - 19 July 2019. Fund returns in USD, bid to bid, net dividends reinvested

As at 31 December 2020
AIA ANNUAL FUNDS REPORT 2020 15
AIA Elite FundsFUND PERFORMANCE
AIA Elite Conservative Fund Period Fund Benchmark*
% %3-month 3.60 3.79 6-month 7.28 6.21 1-year 15.46 10.46 3-year^ N/A N/A5-year^ N/A N/A10-year^ N/A N/ASince inception^ 10.34 9.38
^Annualised Returns*30% MSCI World Total Net Return Index & 70% Bloomberg Barclays Global Aggregate Corporate Total Return Index
Note: Fund Inception date - 19 July 2019. Fund returns in SGD, bid to bid, net dividends reinvested
AIA Elite Conservative Fund (USD)Period Fund Benchmark*
% %3-month 6.38 7.20 6-month 11.81 12.11 1-year 18.42 12.39 3-year^ N/A N/A5-year^ N/A N/A10-year^ N/A N/ASince inception^ 17.63 12.54
^Annualised Returns*30% MSCI World Total Net Return Index & 70% Bloomberg Barclays Global Aggregate Corporate Total Return Index
Note: Fund Inception date - 19 July 2019. Fund returns in USD, bid to bid, net dividends reinvested
Disclaimer with regard to the above Benchmark for AIA Elite Funds:The blended returns are calculated by AIA Investment Management Private Limited using end of day index level values licensed from MSCI (“MSCI Data”). For the avoidance of doubt, MSCI is not the benchmark “administrator” for, or a “contributor”, “submitter” or “supervised contributor” to, the blended returns, and the MSCI Data is not considered a “contribution” or “submission” in relation to the blended returns, as those terms may be defined in any rules, laws, regulations, legislation or international standards. MSCI Data is provided “AS IS” without warranty or liability and no copying or distribution is permitted. MSCI does not make any representation regarding the advisability of any investment or strategy and does not sponsor, promote, issue, sell or otherwise recommend or endorse any investment or strategy, including any financial products or strategies based on, tracking or otherwise utilizing any MSCI Data, models, analytics or other materials or information.
As at 31 December 2020
AIA ANNUAL FUNDS REPORT 202016
AIA Elite FundsPORTFOLIO STATEMENTS
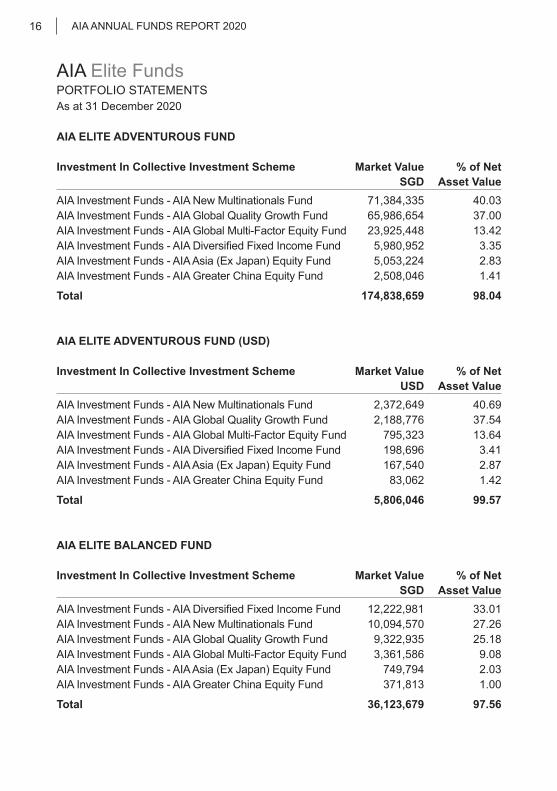
AIA ELITE ADVENTUROUS FUND
Investment In Collective Investment Scheme Market Value % of Net SGD Asset Value
AIA Investment Funds - AIA New Multinationals Fund 71,384,335 40.03 AIA Investment Funds - AIA Global Quality Growth Fund 65,986,654 37.00 AIA Investment Funds - AIA Global Multi-Factor Equity Fund 23,925,448 13.42 AIA Investment Funds - AIA Diversified Fixed Income Fund 5,980,952 3.35 AIA Investment Funds - AIA Asia (Ex Japan) Equity Fund 5,053,224 2.83 AIA Investment Funds - AIA Greater China Equity Fund 2,508,046 1.41
Total 174,838,659 98.04
AIA ELITE ADVENTUROUS FUND (USD)
Investment In Collective Investment Scheme Market Value % of Net USD Asset Value
AIA Investment Funds - AIA New Multinationals Fund 2,372,649 40.69 AIA Investment Funds - AIA Global Quality Growth Fund 2,188,776 37.54 AIA Investment Funds - AIA Global Multi-Factor Equity Fund 795,323 13.64 AIA Investment Funds - AIA Diversified Fixed Income Fund 198,696 3.41 AIA Investment Funds - AIA Asia (Ex Japan) Equity Fund 167,540 2.87 AIA Investment Funds - AIA Greater China Equity Fund 83,062 1.42
Total 5,806,046 99.57
AIA ELITE BALANCED FUND
Investment In Collective Investment Scheme Market Value % of Net SGD Asset Value
AIA Investment Funds - AIA Diversified Fixed Income Fund 12,222,981 33.01 AIA Investment Funds - AIA New Multinationals Fund 10,094,570 27.26 AIA Investment Funds - AIA Global Quality Growth Fund 9,322,935 25.18 AIA Investment Funds - AIA Global Multi-Factor Equity Fund 3,361,586 9.08 AIA Investment Funds - AIA Asia (Ex Japan) Equity Fund 749,794 2.03 AIA Investment Funds - AIA Greater China Equity Fund 371,813 1.00
Total 36,123,679 97.56
As at 31 December 2020
AIA ANNUAL FUNDS REPORT 2020 17
AIA Elite FundsPORTFOLIO STATEMENTS
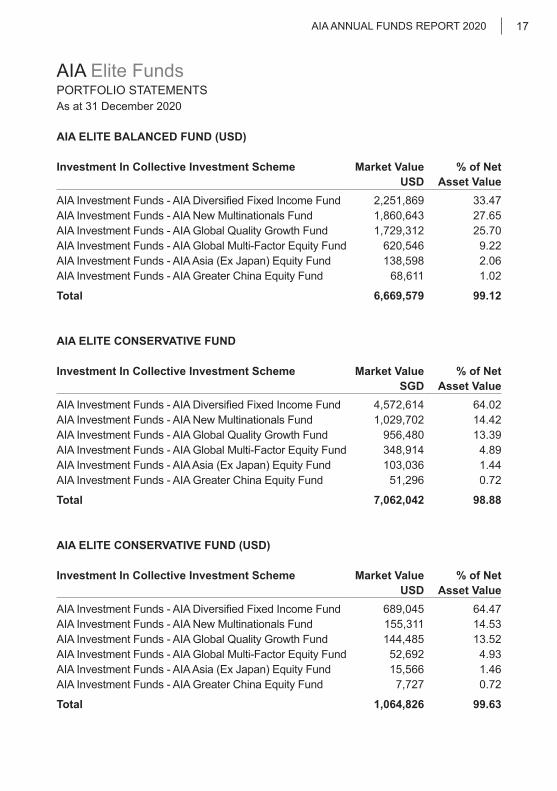
AIA ELITE BALANCED FUND (USD)
Investment In Collective Investment Scheme Market Value % of Net USD Asset Value
AIA Investment Funds - AIA Diversified Fixed Income Fund 2,251,869 33.47 AIA Investment Funds - AIA New Multinationals Fund 1,860,643 27.65 AIA Investment Funds - AIA Global Quality Growth Fund 1,729,312 25.70 AIA Investment Funds - AIA Global Multi-Factor Equity Fund 620,546 9.22 AIA Investment Funds - AIA Asia (Ex Japan) Equity Fund 138,598 2.06 AIA Investment Funds - AIA Greater China Equity Fund 68,611 1.02
Total 6,669,579 99.12
AIA ELITE CONSERVATIVE FUND
Investment In Collective Investment Scheme Market Value % of Net SGD Asset Value
AIA Investment Funds - AIA Diversified Fixed Income Fund 4,572,614 64.02 AIA Investment Funds - AIA New Multinationals Fund 1,029,702 14.42 AIA Investment Funds - AIA Global Quality Growth Fund 956,480 13.39 AIA Investment Funds - AIA Global Multi-Factor Equity Fund 348,914 4.89 AIA Investment Funds - AIA Asia (Ex Japan) Equity Fund 103,036 1.44 AIA Investment Funds - AIA Greater China Equity Fund 51,296 0.72
Total 7,062,042 98.88
AIA ELITE CONSERVATIVE FUND (USD)
Investment In Collective Investment Scheme Market Value % of Net USD Asset Value
AIA Investment Funds - AIA Diversified Fixed Income Fund 689,045 64.47 AIA Investment Funds - AIA New Multinationals Fund 155,311 14.53 AIA Investment Funds - AIA Global Quality Growth Fund 144,485 13.52 AIA Investment Funds - AIA Global Multi-Factor Equity Fund 52,692 4.93 AIA Investment Funds - AIA Asia (Ex Japan) Equity Fund 15,566 1.46 AIA Investment Funds - AIA Greater China Equity Fund 7,727 0.72
Total 1,064,826 99.63
As at 31 December 2020
AIA ANNUAL FUNDS REPORT 202018
AIA Elite FundsPORTFOLIO STATEMENTS
AIA ELITE ADVENTUROUS FUND
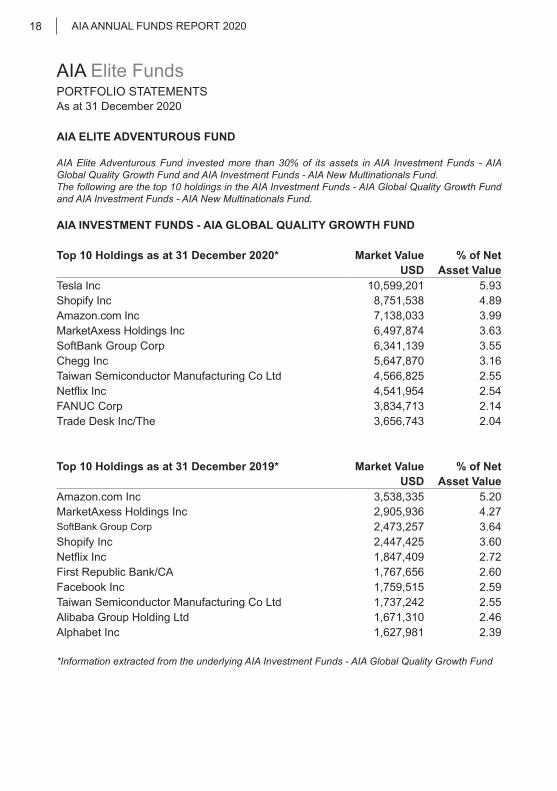
AIA Elite Adventurous Fund invested more than 30% of its assets in AIA Investment Funds - AIA Global Quality Growth Fund and AIA Investment Funds - AIA New Multinationals Fund. The following are the top 10 holdings in the AIA Investment Funds - AIA Global Quality Growth Fund and AIA Investment Funds - AIA New Multinationals Fund.
AIA INVESTMENT FUNDS - AIA GLOBAL QUALITY GROWTH FUND
Top 10 Holdings as at 31 December 2020* Market Value % of Net USD Asset Value
Tesla Inc 10,599,201 5.93 Shopify Inc 8,751,538 4.89 Amazon.com Inc 7,138,033 3.99 MarketAxess Holdings Inc 6,497,874 3.63 SoftBank Group Corp 6,341,139 3.55 Chegg Inc 5,647,870 3.16 Taiwan Semiconductor Manufacturing Co Ltd 4,566,825 2.55 Netflix Inc 4,541,954 2.54 FANUC Corp 3,834,713 2.14 Trade Desk Inc/The 3,656,743 2.04
Top 10 Holdings as at 31 December 2019* Market Value % of Net USD Asset Value
Amazon.com Inc 3,538,335 5.20MarketAxess Holdings Inc 2,905,936 4.27SoftBank Group Corp 2,473,257 3.64Shopify Inc 2,447,425 3.60Netflix Inc 1,847,409 2.72First Republic Bank/CA 1,767,656 2.60Facebook Inc 1,759,515 2.59Taiwan Semiconductor Manufacturing Co Ltd 1,737,242 2.55Alibaba Group Holding Ltd 1,671,310 2.46Alphabet Inc 1,627,981 2.39
*Information extracted from the underlying AIA Investment Funds - AIA Global Quality Growth Fund

As at 31 December 2020
AIA ANNUAL FUNDS REPORT 2020 19
AIA Elite FundsPORTFOLIO STATEMENTS
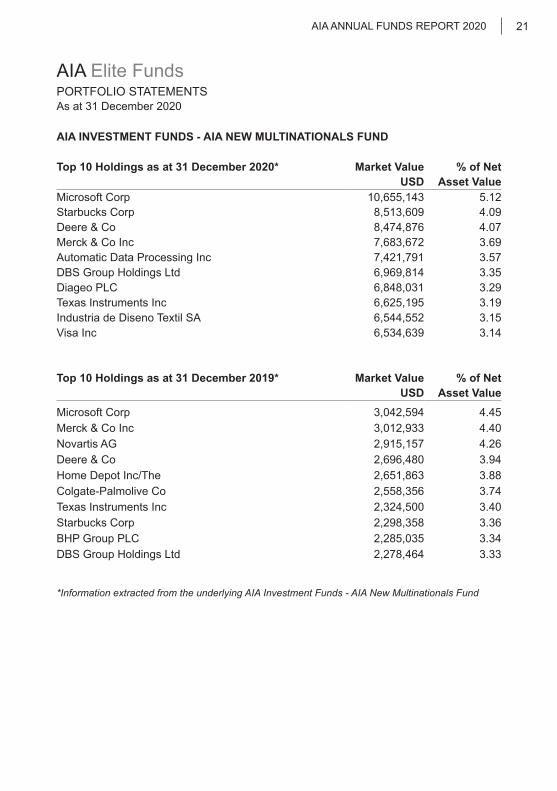
AIA INVESTMENT FUNDS - AIA NEW MULTINATIONALS FUND
Top 10 Holdings as at 31 December 2020* Market Value % of Net USD Asset Value
Microsoft Corp 10,655,143 5.12Starbucks Corp 8,513,609 4.09Deere & Co 8,474,876 4.07Merck & Co Inc 7,683,672 3.69Automatic Data Processing Inc 7,421,791 3.57DBS Group Holdings Ltd 6,969,814 3.35Diageo PLC 6,848,031 3.29Texas Instruments Inc 6,625,195 3.19Industria de Diseno Textil SA 6,544,552 3.15Visa Inc 6,534,639 3.14
Top 10 Holdings as at 31 December 2019* Market Value % of Net USD Asset Value
Microsoft Corp 3,042,594 4.45 Merck & Co Inc 3,012,933 4.40 Novartis AG 2,915,157 4.26 Deere & Co 2,696,480 3.94 Home Depot Inc/The 2,651,863 3.88 Colgate-Palmolive Co 2,558,356 3.74 Texas Instruments Inc 2,324,500 3.40 Starbucks Corp 2,298,358 3.36 BHP Group PLC 2,285,035 3.34 DBS Group Holdings Ltd 2,278,464 3.33
*Information extracted from the underlying AIA Investment Funds - AIA New Multinationals Fund
As at 31 December 2020
AIA ANNUAL FUNDS REPORT 202020
AIA Elite FundsPORTFOLIO STATEMENTS
AIA ELITE ADVENTUROUS FUND (USD)
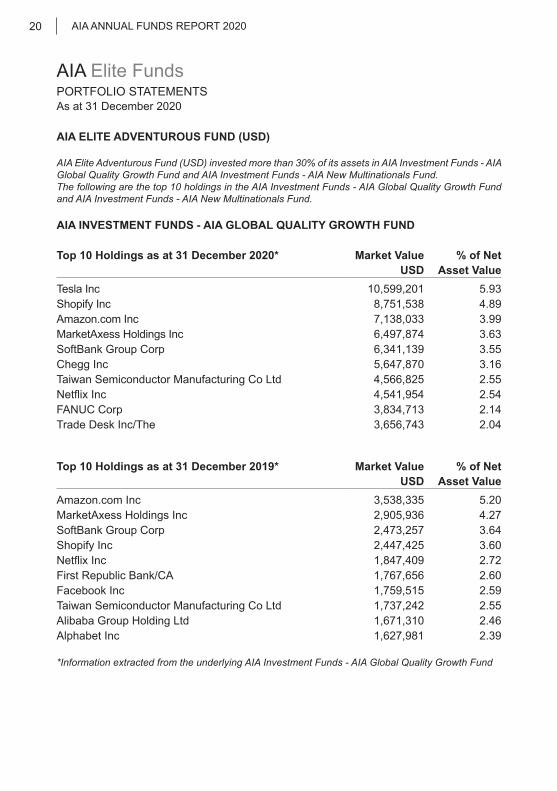
AIA Elite Adventurous Fund (USD) invested more than 30% of its assets in AIA Investment Funds - AIA Global Quality Growth Fund and AIA Investment Funds - AIA New Multinationals Fund. The following are the top 10 holdings in the AIA Investment Funds - AIA Global Quality Growth Fund and AIA Investment Funds - AIA New Multinationals Fund.
AIA INVESTMENT FUNDS - AIA GLOBAL QUALITY GROWTH FUND
Top 10 Holdings as at 31 December 2020* Market Value % of Net USD Asset Value
Tesla Inc 10,599,201 5.93 Shopify Inc 8,751,538 4.89 Amazon.com Inc 7,138,033 3.99 MarketAxess Holdings Inc 6,497,874 3.63 SoftBank Group Corp 6,341,139 3.55 Chegg Inc 5,647,870 3.16 Taiwan Semiconductor Manufacturing Co Ltd 4,566,825 2.55 Netflix Inc 4,541,954 2.54 FANUC Corp 3,834,713 2.14 Trade Desk Inc/The 3,656,743 2.04
Top 10 Holdings as at 31 December 2019* Market Value % of Net USD Asset Value
Amazon.com Inc 3,538,335 5.20MarketAxess Holdings Inc 2,905,936 4.27SoftBank Group Corp 2,473,257 3.64Shopify Inc 2,447,425 3.60Netflix Inc 1,847,409 2.72First Republic Bank/CA 1,767,656 2.60Facebook Inc 1,759,515 2.59Taiwan Semiconductor Manufacturing Co Ltd 1,737,242 2.55Alibaba Group Holding Ltd 1,671,310 2.46Alphabet Inc 1,627,981 2.39
*Information extracted from the underlying AIA Investment Funds - AIA Global Quality Growth Fund
As at 31 December 2020
AIA ANNUAL FUNDS REPORT 2020 21
AIA Elite FundsPORTFOLIO STATEMENTS
AIA INVESTMENT FUNDS - AIA NEW MULTINATIONALS FUND
Top 10 Holdings as at 31 December 2020* Market Value % of Net USD Asset Value
Microsoft Corp 10,655,143 5.12Starbucks Corp 8,513,609 4.09Deere & Co 8,474,876 4.07Merck & Co Inc 7,683,672 3.69Automatic Data Processing Inc 7,421,791 3.57DBS Group Holdings Ltd 6,969,814 3.35Diageo PLC 6,848,031 3.29Texas Instruments Inc 6,625,195 3.19Industria de Diseno Textil SA 6,544,552 3.15Visa Inc 6,534,639 3.14
Top 10 Holdings as at 31 December 2019* Market Value % of Net USD Asset Value
Microsoft Corp 3,042,594 4.45 Merck & Co Inc 3,012,933 4.40 Novartis AG 2,915,157 4.26 Deere & Co 2,696,480 3.94 Home Depot Inc/The 2,651,863 3.88 Colgate-Palmolive Co 2,558,356 3.74 Texas Instruments Inc 2,324,500 3.40 Starbucks Corp 2,298,358 3.36 BHP Group PLC 2,285,035 3.34 DBS Group Holdings Ltd 2,278,464 3.33
*Information extracted from the underlying AIA Investment Funds - AIA New Multinationals Fund

As at 31 December 2020
AIA ANNUAL FUNDS REPORT 202022
AIA Elite FundsPORTFOLIO STATEMENTS
AIA ELITE BALANCED FUND
AIA Elite Balanced Fund invested more than 30% of its assets in AIA Investment Funds - AIA Diversified Fixed Income Fund.The following are the top 10 holdings in the AIA Investment Funds - AIA Diversified Fixed Income Fund
AIA INVESTMENT FUNDS - AIA DIVERSIFIED FIXED INCOME FUND
Top 10 Holdings as at 31 December 2020* Market Value % of Net USD Asset Value
CBT US 2YR NOTE (CBT) Mar21 24,085,169 13.87CBT US 10YR NOTE (CBT)Mar21 12,005,321 6.92CBT US LONG BOND(CBT) Mar21 2,594,766 1.49JPMorgan Chase Co 2.083% VRN 22/04/2026 1,387,020 0.80BMW US Capital LLC 3.9% 09/04/2025 1,184,509 0.68Corp Nacional del Cobre de Chile 3.75% 15/01/2031 1,124,385 0.65TMobile USA Inc 3.875% 15/04/2030 985,501 0.57Citigroup Inc 3.106% VRN 08/04/2026 973,503 0.56HCA Inc 4.5% 15/02/2027 928,955 0.54Wells Fargo Co 3.196% VRN 17/06/2027 918,841 0.53
Top 10 Holdings as at 31 December 2019* Market Value % of Net USD Asset Value
WEA Finance LLC 2.875% 15/01/2027 1,139,355 1.05Capital One Financial Co 3.75% 09/03/2027 916,369 0.84JPMorgan Chase Co 3.96% VRN 29/01/2027 853,721 0.78Vale Overseas Ltd 6.25% 10/08/2026 777,924 0.71New York State Dormitory State Muni 2.657% 15/2/28 746,669 0.69Marathon Oil Corp 4.4% 15/07/2027 743,202 0.68AbbVie Inc 3.2% 21/11/2029 723,101 0.66Wells Fargo And Company 5.9% VRN Perp 723,066 0.66Colbun SA 4.5% 10/07/2024 702,842 0.65Bank of America Corp 3.366% VRN 23/01/26 689,503 0.63
*Information extracted from the underlying AIA Investment Funds - AIA Diversified Fixed Income Fund

As at 31 December 2020
AIA ANNUAL FUNDS REPORT 2020 23
AIA Elite FundsPORTFOLIO STATEMENTS
AIA ELITE BALANCED FUND (USD)
AIA Elite Balanced Fund (USD) invested more than 30% of its assets in AIA Investment Funds - AIA Diversified Fixed Income Fund.The following are the top 10 holdings in the AIA Investment Funds - AIA Diversified Fixed Income Fund
Top 10 Holdings as at 31 December 2020* Market Value % of Net USD Asset Value
CBT US 2YR NOTE (CBT) Mar21 24,085,169 13.87 CBT US 10YR NOTE (CBT)Mar21 12,005,321 6.92 CBT US LONG BOND(CBT) Mar21 2,594,766 1.49 JPMorgan Chase Co 2.083% VRN 22/04/2026 1,387,020 0.80 BMW US Capital LLC 3.9% 09/04/2025 1,184,509 0.68 Corp Nacional del Cobre de Chile 3.75% 15/01/2031 1,124,385 0.65 TMobile USA Inc 3.875% 15/04/2030 985,501 0.57 Citigroup Inc 3.106% VRN 08/04/2026 973,503 0.56 HCA Inc 4.5% 15/02/2027 928,955 0.54 Wells Fargo Co 3.196% VRN 17/06/2027 918,841 0.53
Top 10 Holdings as at 31 December 2019* Market Value % of Net USD Asset Value
WEA Finance LLC 2.875% 15/01/2027 1,139,355 1.05Capital One Financial Co 3.75% 09/03/2027 916,369 0.84JPMorgan Chase Co 3.96% VRN 29/01/2027 853,721 0.78Vale Overseas Ltd 6.25% 10/08/2026 777,924 0.71New York State Dormitory State Muni 2.657% 15/2/28 746,669 0.69Marathon Oil Corp 4.4% 15/07/2027 743,202 0.68AbbVie Inc 3.2% 21/11/2029 723,101 0.66Wells Fargo And Company 5.9% VRN Perp 723,066 0.66Colbun SA 4.5% 10/07/2024 702,842 0.65Bank of America Corp 3.366% VRN 23/01/26 689,503 0.63
*Information extracted from the underlying AIA Investment Funds - AIA Diversified Fixed Income Fund
As at 31 December 2020
AIA ANNUAL FUNDS REPORT 202024
AIA Elite FundsPORTFOLIO STATEMENTS
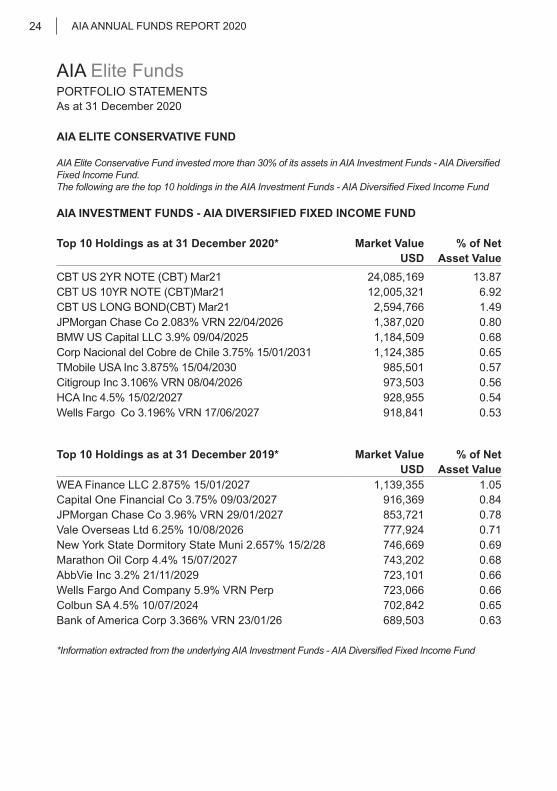
AIA ELITE CONSERVATIVE FUND
AIA Elite Conservative Fund invested more than 30% of its assets in AIA Investment Funds - AIA Diversified Fixed Income Fund.The following are the top 10 holdings in the AIA Investment Funds - AIA Diversified Fixed Income Fund
AIA INVESTMENT FUNDS - AIA DIVERSIFIED FIXED INCOME FUND
Top 10 Holdings as at 31 December 2020* Market Value % of Net USD Asset Value
CBT US 2YR NOTE (CBT) Mar21 24,085,169 13.87 CBT US 10YR NOTE (CBT)Mar21 12,005,321 6.92 CBT US LONG BOND(CBT) Mar21 2,594,766 1.49 JPMorgan Chase Co 2.083% VRN 22/04/2026 1,387,020 0.80 BMW US Capital LLC 3.9% 09/04/2025 1,184,509 0.68 Corp Nacional del Cobre de Chile 3.75% 15/01/2031 1,124,385 0.65 TMobile USA Inc 3.875% 15/04/2030 985,501 0.57 Citigroup Inc 3.106% VRN 08/04/2026 973,503 0.56 HCA Inc 4.5% 15/02/2027 928,955 0.54 Wells Fargo Co 3.196% VRN 17/06/2027 918,841 0.53
Top 10 Holdings as at 31 December 2019* Market Value % of Net USD Asset Value
WEA Finance LLC 2.875% 15/01/2027 1,139,355 1.05Capital One Financial Co 3.75% 09/03/2027 916,369 0.84JPMorgan Chase Co 3.96% VRN 29/01/2027 853,721 0.78Vale Overseas Ltd 6.25% 10/08/2026 777,924 0.71New York State Dormitory State Muni 2.657% 15/2/28 746,669 0.69Marathon Oil Corp 4.4% 15/07/2027 743,202 0.68AbbVie Inc 3.2% 21/11/2029 723,101 0.66Wells Fargo And Company 5.9% VRN Perp 723,066 0.66Colbun SA 4.5% 10/07/2024 702,842 0.65Bank of America Corp 3.366% VRN 23/01/26 689,503 0.63
*Information extracted from the underlying AIA Investment Funds - AIA Diversified Fixed Income Fund
As at 31 December 2020
AIA ANNUAL FUNDS REPORT 2020 25
AIA Elite FundsPORTFOLIO STATEMENTS
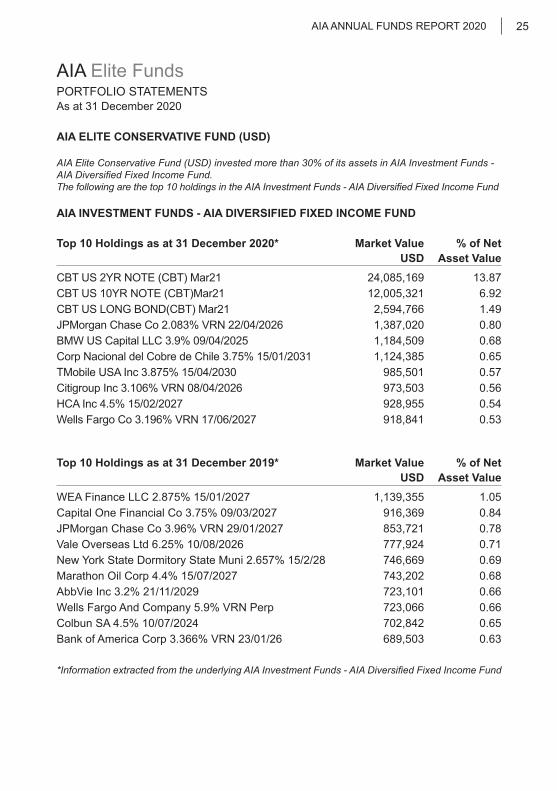
AIA ELITE CONSERVATIVE FUND (USD)
AIA Elite Conservative Fund (USD) invested more than 30% of its assets in AIA Investment Funds - AIA Diversified Fixed Income Fund.The following are the top 10 holdings in the AIA Investment Funds - AIA Diversified Fixed Income Fund
AIA INVESTMENT FUNDS - AIA DIVERSIFIED FIXED INCOME FUND
Top 10 Holdings as at 31 December 2020* Market Value % of Net USD Asset Value
CBT US 2YR NOTE (CBT) Mar21 24,085,169 13.87 CBT US 10YR NOTE (CBT)Mar21 12,005,321 6.92 CBT US LONG BOND(CBT) Mar21 2,594,766 1.49 JPMorgan Chase Co 2.083% VRN 22/04/2026 1,387,020 0.80 BMW US Capital LLC 3.9% 09/04/2025 1,184,509 0.68 Corp Nacional del Cobre de Chile 3.75% 15/01/2031 1,124,385 0.65 TMobile USA Inc 3.875% 15/04/2030 985,501 0.57 Citigroup Inc 3.106% VRN 08/04/2026 973,503 0.56 HCA Inc 4.5% 15/02/2027 928,955 0.54 Wells Fargo Co 3.196% VRN 17/06/2027 918,841 0.53
Top 10 Holdings as at 31 December 2019* Market Value % of Net USD Asset Value
WEA Finance LLC 2.875% 15/01/2027 1,139,355 1.05Capital One Financial Co 3.75% 09/03/2027 916,369 0.84JPMorgan Chase Co 3.96% VRN 29/01/2027 853,721 0.78Vale Overseas Ltd 6.25% 10/08/2026 777,924 0.71New York State Dormitory State Muni 2.657% 15/2/28 746,669 0.69Marathon Oil Corp 4.4% 15/07/2027 743,202 0.68AbbVie Inc 3.2% 21/11/2029 723,101 0.66Wells Fargo And Company 5.9% VRN Perp 723,066 0.66Colbun SA 4.5% 10/07/2024 702,842 0.65Bank of America Corp 3.366% VRN 23/01/26 689,503 0.63
*Information extracted from the underlying AIA Investment Funds - AIA Diversified Fixed Income Fund
As at 31 December 2020
AIA ANNUAL FUNDS REPORT 202026
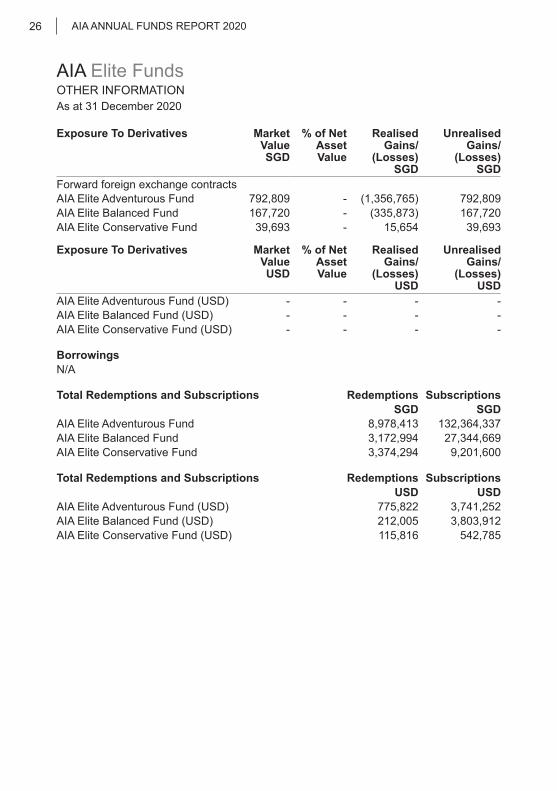
AIA Elite FundsOTHER INFORMATION
Exposure To Derivatives Market Value SGD
% of NetAsset Value
Realised Gains/
(Losses) SGD
Unrealised Gains/
(Losses) SGD
Forward foreign exchange contractsAIA Elite Adventurous Fund 792,809 - (1,356,765) 792,809 AIA Elite Balanced Fund 167,720 - (335,873) 167,720 AIA Elite Conservative Fund 39,693 - 15,654 39,693
Exposure To Derivatives Market Value USD
% of NetAsset Value
Realised Gains/
(Losses) USD
Unrealised Gains/
(Losses) USD
AIA Elite Adventurous Fund (USD) - - - -AIA Elite Balanced Fund (USD) - - - -AIA Elite Conservative Fund (USD) - - - -
BorrowingsN/A
Total Redemptions and Subscriptions Redemptions Subscriptions SGD SGD
AIA Elite Adventurous Fund 8,978,413 132,364,337 AIA Elite Balanced Fund 3,172,994 27,344,669 AIA Elite Conservative Fund 3,374,294 9,201,600
Total Redemptions and Subscriptions Redemptions Subscriptions USD USD
AIA Elite Adventurous Fund (USD) 775,822 3,741,252 AIA Elite Balanced Fund (USD) 212,005 3,803,912 AIA Elite Conservative Fund (USD) 115,816 542,785
As at 31 December 2020
AIA ANNUAL FUNDS REPORT 2020 27
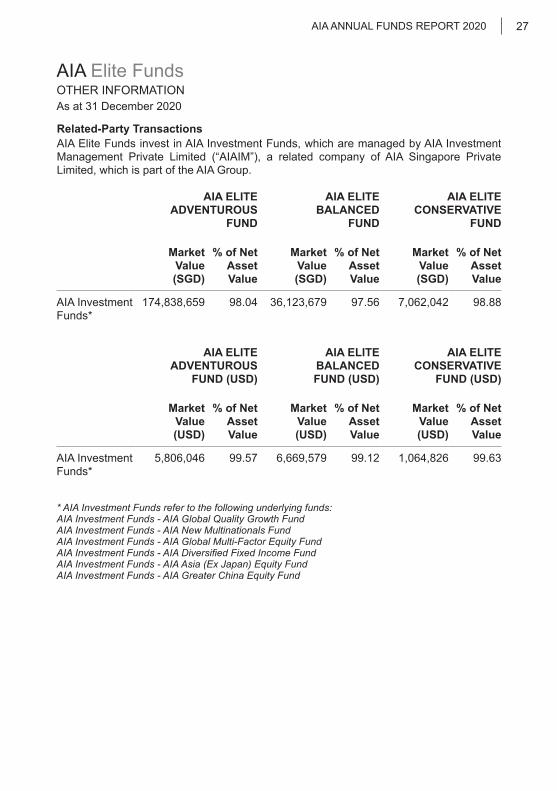
AIA Elite FundsOTHER INFORMATION
Related-Party Transactions AIA Elite Funds invest in AIA Investment Funds, which are managed by AIA Investment Management Private Limited (“AIAIM”), a related company of AIA Singapore Private Limited, which is part of the AIA Group.
AIA ELITE ADVENTUROUS
FUND
AIA ELITE BALANCED
FUND
AIA ELITE CONSERVATIVE
FUND
Market Value (SGD)
% of Net Asset Value
Market Value (SGD)
% of Net Asset Value
Market Value (SGD)
% of Net Asset Value
AIA Investment Funds*
174,838,659 98.04 36,123,679 97.56 7,062,042 98.88
AIA ELITE ADVENTUROUS
FUND (USD)
AIA ELITE BALANCED FUND (USD)
AIA ELITE CONSERVATIVE
FUND (USD)
Market Value (USD)
% of Net Asset Value
Market Value (USD)
% of Net Asset Value
Market Value (USD)
% of Net Asset Value
AIA Investment Funds*
5,806,046 99.57 6,669,579 99.12 1,064,826 99.63
* AIA Investment Funds refer to the following underlying funds:AIA Investment Funds - AIA Global Quality Growth FundAIA Investment Funds - AIA New Multinationals FundAIA Investment Funds - AIA Global Multi-Factor Equity FundAIA Investment Funds - AIA Diversified Fixed Income FundAIA Investment Funds - AIA Asia (Ex Japan) Equity Fund AIA Investment Funds - AIA Greater China Equity Fund
As at 31 December 2020
AIA ANNUAL FUNDS REPORT 202028
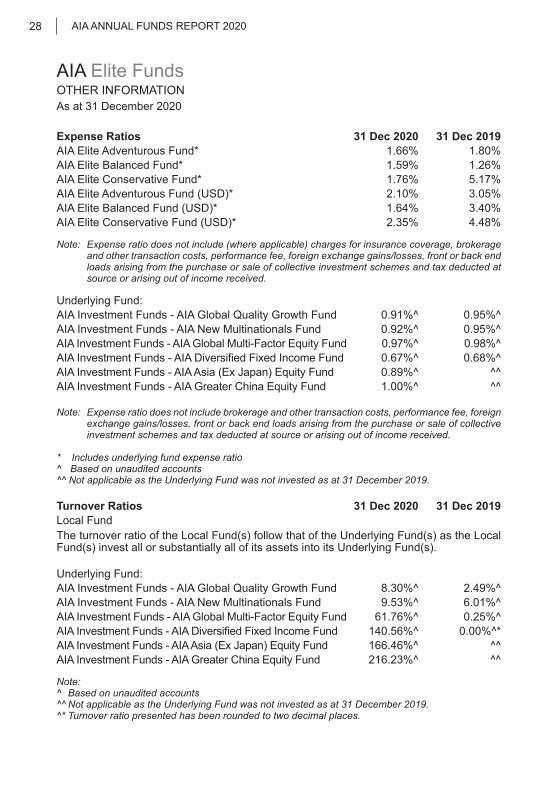
Expense Ratios 31 Dec 2020 31 Dec 2019AIA Elite Adventurous Fund* 1.66% 1.80%AIA Elite Balanced Fund* 1.59% 1.26%AIA Elite Conservative Fund* 1.76% 5.17%AIA Elite Adventurous Fund (USD)* 2.10% 3.05%AIA Elite Balanced Fund (USD)* 1.64% 3.40%AIA Elite Conservative Fund (USD)* 2.35% 4.48%
Note: Expense ratio does not include (where applicable) charges for insurance coverage, brokerage and other transaction costs, performance fee, foreign exchange gains/losses, front or back end loads arising from the purchase or sale of collective investment schemes and tax deducted at source or arising out of income received.
Underlying Fund:AIA Investment Funds - AIA Global Quality Growth Fund 0.91%^ 0.95%^AIA Investment Funds - AIA New Multinationals Fund 0.92%^ 0.95%^AIA Investment Funds - AIA Global Multi-Factor Equity Fund 0.97%^ 0.98%^AIA Investment Funds - AIA Diversified Fixed Income Fund 0.67%^ 0.68%^AIA Investment Funds - AIA Asia (Ex Japan) Equity Fund 0.89%^ ^^AIA Investment Funds - AIA Greater China Equity Fund 1.00%^ ^^
Note: Expense ratio does not include brokerage and other transaction costs, performance fee, foreign exchange gains/losses, front or back end loads arising from the purchase or sale of collective investment schemes and tax deducted at source or arising out of income received.
* Includes underlying fund expense ratio^ Based on unaudited accounts ^^ Not applicable as the Underlying Fund was not invested as at 31 December 2019.
Turnover Ratios 31 Dec 2020 31 Dec 2019 Local FundThe turnover ratio of the Local Fund(s) follow that of the Underlying Fund(s) as the Local Fund(s) invest all or substantially all of its assets into its Underlying Fund(s).
Underlying Fund:AIA Investment Funds - AIA Global Quality Growth Fund 8.30%^ 2.49%^AIA Investment Funds - AIA New Multinationals Fund 9.53%^ 6.01%^AIA Investment Funds - AIA Global Multi-Factor Equity Fund 61.76%^ 0.25%^AIA Investment Funds - AIA Diversified Fixed Income Fund 140.56%^ 0.00%^*AIA Investment Funds - AIA Asia (Ex Japan) Equity Fund 166.46%^ ^^AIA Investment Funds - AIA Greater China Equity Fund 216.23%^ ^^
Note:^ Based on unaudited accounts ^^ Not applicable as the Underlying Fund was not invested as at 31 December 2019.^* Turnover ratio presented has been rounded to two decimal places.
AIA Elite FundsOTHER INFORMATION
As at 31 December 2020
AIA ANNUAL FUNDS REPORT 2020 29
AIA Elite FundsOTHER INFORMATION
Any Material Information That Will Adversely Impact The Valuation Of The FundNIL
Soft Dollar ComissionsAIA Investment Funds - AIA Global Quality Growth FundAIA Investment Funds - AIA New Multinationals FundAIA Investment Funds - AIA Diversified Fixed Income FundAIA Investment Funds - AIA Global Multi-Factor Equity FundAIA Investment Funds - AIA Asia (Ex Japan) Equity FundAIA Investment Funds - AIA Greater China Equity Fund(collectively, the “Sub-Funds” and each a “Sub-Fund”)
None of the Management Company, the Investment Manager, the Sub-Investment Manager or any of their connected persons will retain cash or other rebates from brokers or dealers in consideration of directing transactions for a Sub-Fund to such brokers or dealers, save that goods and services (soft dollars) as described in the paragraph below may be retained.
Any such cash commission or rebates received from any such brokers or dealers shall be for the account of the relevant Sub-Fund and entered into in the best interests of the Fund and the shareholders (taken as a body and in their capacity as such).
The Management Company, the Investment Manager, the Sub-Investment Manager and/or any of their connected persons reserves the right to effect transactions by or through a broker or dealer, which are legal entities (as opposed to individuals), with whom the Management Company, the Investment Manager, the Sub-Investment Manager and/or any of their connected persons has an arrangement under which that broker or dealer will from time to time provide to or procure for the Management Company, the Investment Manager, the Sub-Investment Manager and/or any of their connected persons goods or services for which no direct payment is made but instead the Management Company, the Investment Manager, the Sub-Investment Manager and/or any of their connected persons undertakes to place business with that broker or dealer.
The Investment Manager shall procure that no such arrangements are entered into unless (i) the goods and services to be provided pursuant thereto are of demonstrable benefit to the shareholders (taken as a body and in their capacity as such) whether by assisting the Management Company, the Investment Manager and/or the Sub-Investment Manager in their ability to manage the relevant Sub-Fund or otherwise; (ii) the transaction execution is consistent with best execution standards and brokerage rates are not in excess of customary institutional full-service brokerage rates; (iii) periodic disclosure is made in the annual report of the Fund or the relevant Sub-Fund in the form of a statement describing the soft dollar policies and practices of the Management Company, the Investment Manager or the Sub-Investment Manager, including a description of goods and services received by them; and (iv) the availability of soft dollar arrangements is not the sole or primary purpose to perform or arrange transaction with such broker or dealer.
Such goods and services may include research and advisory services, economic and political analysis, portfolio analysis including valuation and performance measurement, market analysis, data and quotation services, computer hardware and software incidental to the above goods and services, clearing and custodian services and investment-related publications. For the avoidance of doubt, such goods and services do not include travel, accommodation, entertainment, general administrative goods or services, general office equipment or premises, membership fees, employee salaries or direct money payments.

As at 31 December 2020
AIA ANNUAL FUNDS REPORT 202030
AIA Emerging Markets Balanced/Equity FundFUND PERFORMANCE
AIA EMERGING MARKETS BALANCED FUND
Period Fund Benchmark*% %
3-month 12.90 9.51 6-month 18.96 14.64 1-year 15.72 13.56 3-year^ 7.84 5.83 5-year^ 10.11 8.74 10-year^ 4.30 3.93 Since inception^ 3.49 4.48 ^ Annualised returns* 60% MSCI Emerging Markets DTR Net & 40% JP Morgan Sing Govt Bond Index All
Disclaimer with regard to the above Benchmark:The blended returns are calculated by AIA Investment Management Private Limited using end of day index level values licensed from MSCI (“MSCI Data”). For the avoidance of doubt, MSCI is not the benchmark “administrator” for, or a “contributor”, “submitter” or “supervised contributor” to, the blended returns, and the MSCI Data is not considered a “contribution” or “submission” in relation to the blended returns, as those terms may be defined in any rules, laws, regulations, legislation or international standards. MSCI Data is provided “AS IS” without warranty or liability and no copying or distribution is permitted. MSCI does not make any representation regarding the advisability of any investment or strategy and does not sponsor, promote, issue, sell or otherwise recommend or endorse any investment or strategy, including any financial products or strategies based on, tracking or otherwise utilising any MSCI Data, models, analytics or other materials or information.
Note: Fund inception date - 11 April 2006. Fund returns in SGD, bid-to-bid, net dividends reinvested
AIA EMERGING MARKETS EQUITY FUND
Period Fund%
Benchmark*%
3-month 20.46 15.89 6-month 29.69 24.24 1-year 19.32 16.28 3-year^ 9.37 5.78 5-year^ 13.36 11.25 10-year^ 4.23 3.93 Since inception^ 3.18 4.29
^ Annualised returns* MSCI Emerging Markets DTR Net
Note: Fund inception date - 11 April 2006. Fund returns in SGD, bid-to-bid, net dividends reinvested
As at 31 December 2020
AIA ANNUAL FUNDS REPORT 2020 31
AIA Emerging Markets Balanced/Equity FundPORTFOLIO STATEMENTS
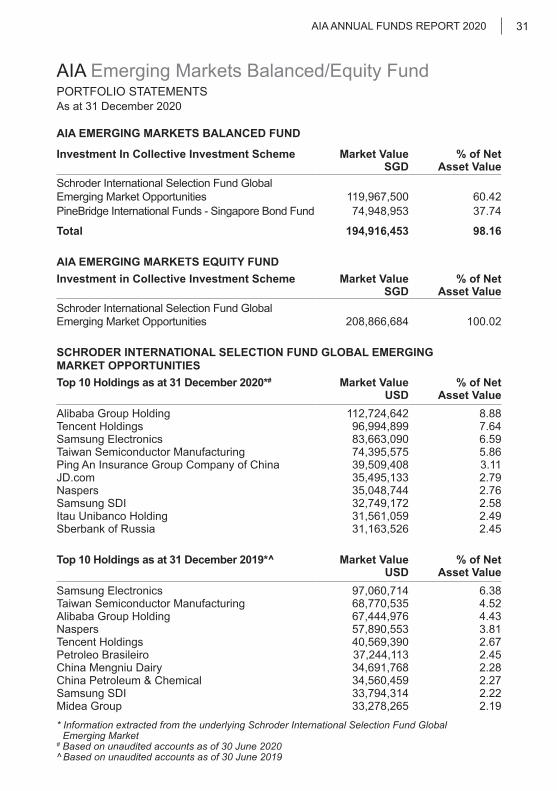
AIA EMERGING MARKETS BALANCED FUND
Investment In Collective Investment Scheme Market Value SGD
% of NetAsset Value
Schroder International Selection Fund Global Emerging Market Opportunities 119,967,500 60.42PineBridge International Funds - Singapore Bond Fund 74,948,953 37.74
Total 194,916,453 98.16
AIA EMERGING MARKETS EQUITY FUNDInvestment in Collective Investment Scheme Market Value
SGD% of Net
Asset ValueSchroder International Selection Fund Global Emerging Market Opportunities 208,866,684 100.02
SCHRODER INTERNATIONAL SELECTION FUND GLOBAL EMERGING MARKET OPPORTUNITIES Top 10 Holdings as at 31 December 2020*# Market Value
USD % of Net
Asset ValueAlibaba Group Holding 112,724,642 8.88 Tencent Holdings 96,994,899 7.64 Samsung Electronics 83,663,090 6.59 Taiwan Semiconductor Manufacturing 74,395,575 5.86 Ping An Insurance Group Company of China 39,509,408 3.11 JD.com 35,495,133 2.79 Naspers 35,048,744 2.76 Samsung SDI 32,749,172 2.58 Itau Unibanco Holding 31,561,059 2.49 Sberbank of Russia 31,163,526 2.45
Top 10 Holdings as at 31 December 2019*^ Market Value USD
% of NetAsset Value
Samsung Electronics 97,060,714 6.38 Taiwan Semiconductor Manufacturing 68,770,535 4.52 Alibaba Group Holding 67,444,976 4.43 Naspers 57,890,553 3.81 Tencent Holdings 40,569,390 2.67 Petroleo Brasileiro 37,244,113 2.45 China Mengniu Dairy 34,691,768 2.28 China Petroleum & Chemical 34,560,459 2.27 Samsung SDI 33,794,314 2.22 Midea Group 33,278,265 2.19 * Information extracted from the underlying Schroder International Selection Fund Global Emerging Market # Based on unaudited accounts as of 30 June 2020^ Based on unaudited accounts as of 30 June 2019

As at 31 December 2020
AIA ANNUAL FUNDS REPORT 202032
AIA Emerging Markets Balanced/Equity FundPORTFOLIO STATEMENTS
PINEBRIDGE INTERNATIONAL FUNDS - SINGAPORE BOND FUNDTop 10 Holdings as at 31 December 2020* Market Value
SGD % of Net
Asset Value
Singapore Gov't 2.75 SIGB 04/01/42 22,421,943 4.08Singapore Gov't SIGB 0 1/2 11/01/25 20,028,600 3.64Singapore T-Bill SITB 06/01/21 19,961,554 3.63Singapore Gov't SIGB 2 1/4 08/01/36 18,519,545 3.37Singapore Gov't SIGB 2 7/8 09/01/30 17,809,650 3.24Singapore Gov't SIGB 2 1/4 06/01/21 15,111,000 2.75Singapore Gov't SIGB 2 3/4 03/01/46 10,734,573 1.95Singapore Gov't SIGB 2 3/8 07/01/39 8,943,825 1.63Housing & Dev HDBSP 2.315 09/18/34 8,735,517 1.59Fukoku Mutual Life Insur Frn 12/29/49 8,463,526 1.54
Top 10 Holdings as at 31 December 2019* Market Value SGD
% of NetAsset Value
Singapore Gov't 2.75 SIGB 04/01/42 23,086,825 4.96Singapore Gov't SIGB 2 1/4 08/01/36 22,027,341 4.73Singapore Gov't SIGB 2 3/4 03/01/46 17,005,075 3.65Singapore Gov't SIGB 2 7/8 07/01/29 13,725,500 2.95Singapore Gov't SIGB 3 3/8 09/01/33 12,397,245 2.66Horse Gallop ICBCIH 0 06/28/21 12,027,604 2.58MAS Bill MASPSP 01/24/20 10,488,557 2.25CDBL Funding 1 CDLFU 0 11/15/21 10,342,082 2.22Housing & Dev HDBSP 2.598 10/30/29 8,084,040 1.74Xingsheng BVI CJIANT 4 1/2 09/20/21 7,907,785 1.70
*Information extracted from underlying PineBridge International Funds - Singapore Bond Fund
As at 31 December 2020
AIA ANNUAL FUNDS REPORT 2020 33
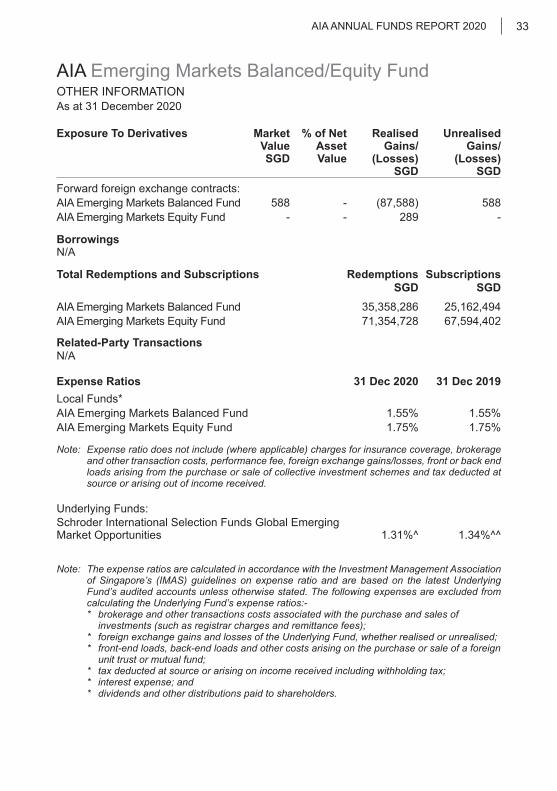
AIA Emerging Markets Balanced/Equity FundOTHER INFORMATION
Exposure To Derivatives Market ValueSGD
% of Net AssetValue
Realised Gains/
(Losses)SGD
Unrealised Gains/
(Losses) SGD
Forward foreign exchange contracts:AIA Emerging Markets Balanced Fund 588 - (87,588) 588 AIA Emerging Markets Equity Fund - - 289 -
BorrowingsN/A
Total Redemptions and Subscriptions RedemptionsSGD
SubscriptionsSGD
AIA Emerging Markets Balanced Fund 35,358,286 25,162,494 AIA Emerging Markets Equity Fund 71,354,728 67,594,402
Related-Party Transactions N/A
Expense Ratios 31 Dec 2020 31 Dec 2019 Local Funds*AIA Emerging Markets Balanced Fund 1.55% 1.55%AIA Emerging Markets Equity Fund 1.75% 1.75%
Note: Expense ratio does not include (where applicable) charges for insurance coverage, brokerage and other transaction costs, performance fee, foreign exchange gains/losses, front or back end loads arising from the purchase or sale of collective investment schemes and tax deducted at source or arising out of income received.
Underlying Funds:Schroder International Selection Funds Global Emerging Market Opportunities 1.31%^ 1.34%^^
Note: The expense ratios are calculated in accordance with the Investment Management Association of Singapore’s (IMAS) guidelines on expense ratio and are based on the latest Underlying Fund’s audited accounts unless otherwise stated. The following expenses are excluded from calculating the Underlying Fund’s expense ratios:-* brokerage and other transactions costs associated with the purchase and sales of
investments (such as registrar charges and remittance fees);* foreign exchange gains and losses of the Underlying Fund, whether realised or unrealised;* front-end loads, back-end loads and other costs arising on the purchase or sale of a foreign
unit trust or mutual fund;* tax deducted at source or arising on income received including withholding tax;* interest expense; and* dividends and other distributions paid to shareholders.
As at 31 December 2020
AIA ANNUAL FUNDS REPORT 202034
AIA Emerging Markets Balanced/Equity FundOTHER INFORMATION
Note: Expense ratio does not include brokerage and other transaction costs, performance fee, foreign exchange gains/losses, front or back end loads arising from the purchase or sale of collective investment schemes and tax deducted at source or arising out of income received.
* Includes underlying fund expense ratio** Based on unaudited accounts^ Based on unaudited accounts as of 30 September 2020 ^^ Based on unaudited accounts as of 30 June 2019
Turnover Ratios 31 Dec 2020 31 Dec 2019
Local Funds: The turnover ratio of the Local Fund(s) follow that of the Underlying Fund(s) as the Local Fund(s) invest all or substantially all of its assets into its Underlying Fund(s).
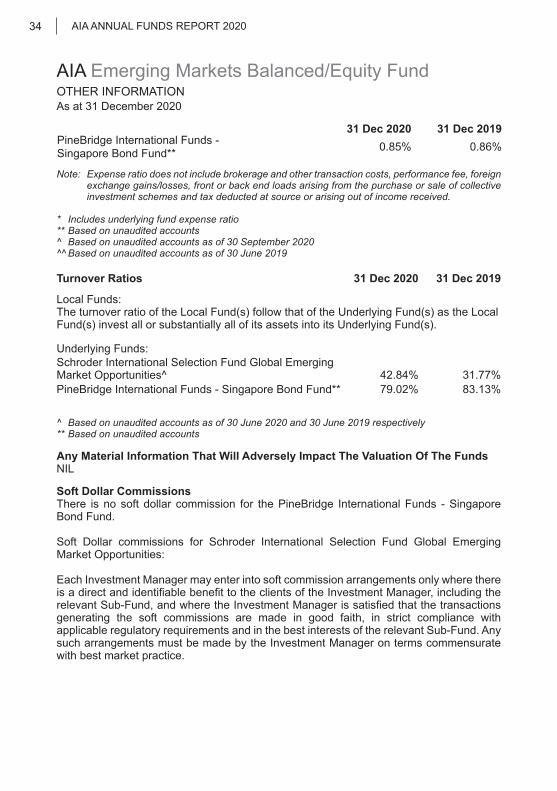
Underlying Funds:Schroder International Selection Fund Global Emerging Market Opportunities^ 42.84% 31.77%PineBridge International Funds - Singapore Bond Fund** 79.02% 83.13%
^ Based on unaudited accounts as of 30 June 2020 and 30 June 2019 respectively** Based on unaudited accounts
Any Material Information That Will Adversely Impact The Valuation Of The Funds NIL
Soft Dollar Commissions There is no soft dollar commission for the PineBridge International Funds - Singapore Bond Fund.
Soft Dollar commissions for Schroder International Selection Fund Global Emerging Market Opportunities:
Each Investment Manager may enter into soft commission arrangements only where there is a direct and identifiable benefit to the clients of the Investment Manager, including the relevant Sub-Fund, and where the Investment Manager is satisfied that the transactions generating the soft commissions are made in good faith, in strict compliance with applicable regulatory requirements and in the best interests of the relevant Sub-Fund. Any such arrangements must be made by the Investment Manager on terms commensurate with best market practice.
31 Dec 2020 31 Dec 2019 PineBridge International Funds - Singapore Bond Fund** 0.85% 0.86%

As at 31 December 2020
AIA ANNUAL FUNDS REPORT 2020 35
AIA European Equity FundFUND PERFORMANCE
Period Fund Benchmark*% %
3-month 14.40 11.93 6-month 17.33 14.47 1-year (0.20) 3.58 3-year^ 0.67 3.17 5-year^ 2.18 5.30 10-year^ 3.68 5.63 Since inception^ 0.30 3.15 ^ Annualised returns* MSCI Europe Daily Total Return Net
Note: Fund inception date - 11 December 2000. Fund returns in SGD, bid-to-bid, net dividends reinvested
PORTFOLIO STATEMENTSAs at 31 December 2020
Investment In Collective Investment Scheme Market Value SGD
% of Net Asset Value
Capital Group European Growth and Income Fund (Lux) 9,860,851 99.86

As at 31 December 2020
AIA ANNUAL FUNDS REPORT 202036
AIA European Equity FundPORTFOLIO STATEMENTS
CAPITAL GROUP EUROPEAN GROWTH AND INCOME FUND (LUX)Top 10 Holdings as at 31 December 2020* Market Value
USD % of Net
Asset Value
Taylor Wimpey PLC 13,064,357 5.68Imperial Brands PLC 10,724,565 4.67Airbus SE (Bearer) 6,759,749 2.94ASML Holding NV 6,586,644 2.87Prosus NV 6,461,907 2.81Rio Tinto PLC 6,405,539 2.79Yandex NV 6,397,378 2.78Richter Gedeon Nyrt 5,991,408 2.61Novartis AG 5,696,346 2.48Avast PLC 5,322,210 2.32
Top 10 Holdings as at 31 December 2019* Market Value USD
% of Net Asset Value
E.ON SE 16,635,462 4.68Novartis AG 14,888,573 4.19Tag Immobilien AG 13,773,564 3.87Pernod Ricard SA 12,928,334 3.63Total SA 12,751,914 3.58Rio Tinto PLC 12,486,102 3.51Kering SA 11,751,708 3.30BP PLC 9,881,756 2.78Basf SE 9,753,960 2.74British American Tobacco PLC 9,492,359 2.67
*Information extracted from the underlying Capital Group European Growth and Income Fund (Lux)

As at 31 December 2020
AIA ANNUAL FUNDS REPORT 2020 37
AIA European Equity FundOTHER INFORMATION
Exposure To Derivatives Market ValueSGD
% of Net AssetValue
Realised Gains/
(Losses)SGD
Unrealised Gains/
(Losses) SGD
Forward foreign exchange contracts - - - - BorrowingsN/A
Total Redemptions and Subscriptions SGDTotal amount of redemptions 2,818,142Total amount of subscriptions 2,442,543
Related-Party Transactions N/A
Expense Ratios 31 Dec 2020 31 Dec 2019Local Fund* 1.74% 1.73%Note: Expense ratio does not include (where applicable) charges for insurance coverage, brokerage
and other transaction costs, performance fee, foreign exchange gains/losses, front or back end loads arising from the purchase or sale of collective investment schemes and tax deducted at source or arising out of income received.
Underlying Fund:Capital Group European Growth and Income Fund (Lux) 0.90%^ 0.90%*^
Note: Expense ratio does not include brokerage and other transaction costs, performance fee, foreign exchange gains/losses, front or back end loads arising from the purchase or sale of collective investment schemes and tax deducted at source or arising out of income received.
* Includes underlying fund expense ratio^ Based on unaudted accounts *^ Based on audited accounts
As at 31 December 2020
AIA ANNUAL FUNDS REPORT 202038
AIA European Equity FundOTHER INFORMATION
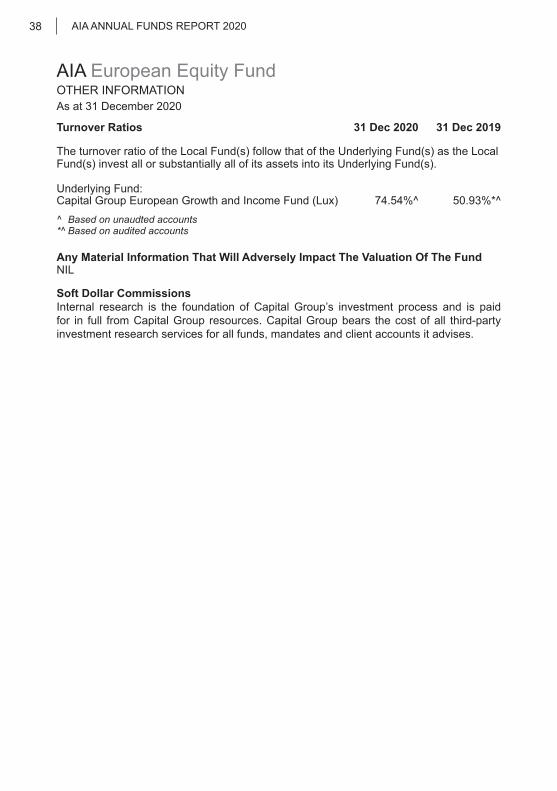
Turnover Ratios 31 Dec 2020 31 Dec 2019
The turnover ratio of the Local Fund(s) follow that of the Underlying Fund(s) as the Local Fund(s) invest all or substantially all of its assets into its Underlying Fund(s).
Underlying Fund: Capital Group European Growth and Income Fund (Lux) 74.54%^ 50.93%*^^ Based on unaudted accounts *^ Based on audited accounts
Any Material Information That Will Adversely Impact The Valuation Of The FundNIL
Soft Dollar CommissionsInternal research is the foundation of Capital Group’s investment process and is paid for in full from Capital Group resources. Capital Group bears the cost of all third-party investment research services for all funds, mandates and client accounts it advises.
As at 31 December 2020
AIA ANNUAL FUNDS REPORT 2020 39
AIA Global Balanced FundFUND PERFORMANCE
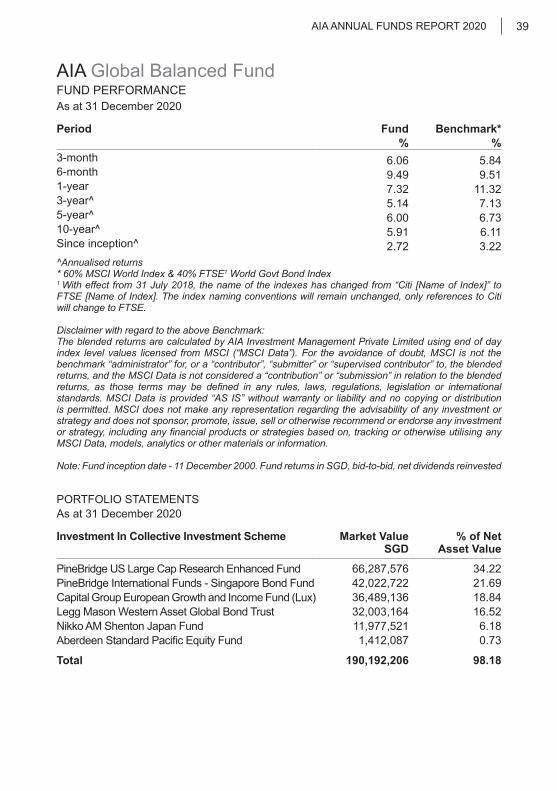
Period Fund Benchmark*% %
3-month 6.06 5.84 6-month 9.49 9.51 1-year 7.32 11.32 3-year^ 5.14 7.13 5-year^ 6.00 6.73 10-year^ 5.91 6.11 Since inception^ 2.72 3.22 ^Annualised returns* 60% MSCI World Index & 40% FTSE1 World Govt Bond Index1 With effect from 31 July 2018, the name of the indexes has changed from “Citi [Name of Index]” to FTSE [Name of Index]. The index naming conventions will remain unchanged, only references to Citi will change to FTSE.
Disclaimer with regard to the above Benchmark:The blended returns are calculated by AIA Investment Management Private Limited using end of day index level values licensed from MSCI (“MSCI Data”). For the avoidance of doubt, MSCI is not the benchmark “administrator” for, or a “contributor”, “submitter” or “supervised contributor” to, the blended returns, and the MSCI Data is not considered a “contribution” or “submission” in relation to the blended returns, as those terms may be defined in any rules, laws, regulations, legislation or international standards. MSCI Data is provided “AS IS” without warranty or liability and no copying or distribution is permitted. MSCI does not make any representation regarding the advisability of any investment or strategy and does not sponsor, promote, issue, sell or otherwise recommend or endorse any investment or strategy, including any financial products or strategies based on, tracking or otherwise utilising any MSCI Data, models, analytics or other materials or information.
Note: Fund inception date - 11 December 2000. Fund returns in SGD, bid-to-bid, net dividends reinvested
PORTFOLIO STATEMENTSAs at 31 December 2020
Investment In Collective Investment Scheme Market Value SGD
% of Net Asset Value
PineBridge US Large Cap Research Enhanced Fund 66,287,576 34.22 PineBridge International Funds - Singapore Bond Fund 42,022,722 21.69 Capital Group European Growth and Income Fund (Lux) 36,489,136 18.84 Legg Mason Western Asset Global Bond Trust 32,003,164 16.52 Nikko AM Shenton Japan Fund 11,977,521 6.18 Aberdeen Standard Pacific Equity Fund 1,412,087 0.73
Total 190,192,206 98.18
As at 31 December 2020
AIA ANNUAL FUNDS REPORT 202040
AIA Global Balanced FundPORTFOLIO STATEMENTS
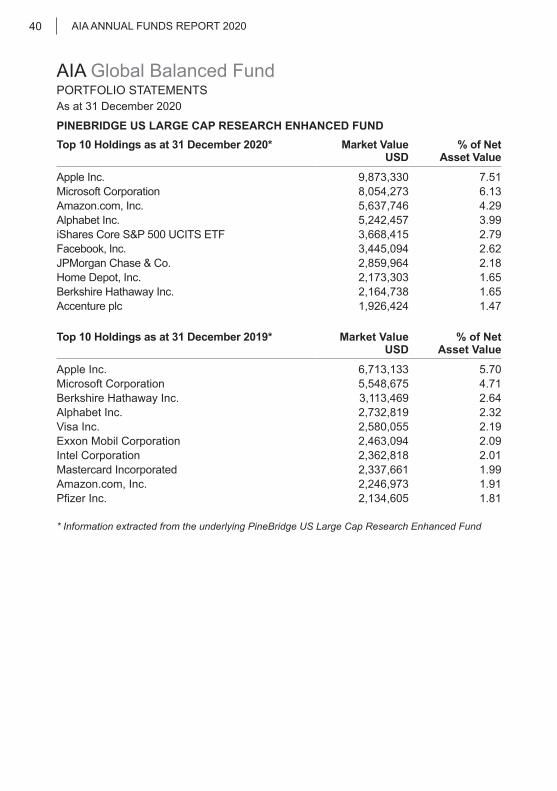
PINEBRIDGE US LARGE CAP RESEARCH ENHANCED FUNDTop 10 Holdings as at 31 December 2020* Market Value
USD % of Net
Asset Value
Apple Inc. 9,873,330 7.51 Microsoft Corporation 8,054,273 6.13 Amazon.com, Inc. 5,637,746 4.29 Alphabet Inc. 5,242,457 3.99 iShares Core S&P 500 UCITS ETF 3,668,415 2.79 Facebook, Inc. 3,445,094 2.62 JPMorgan Chase & Co. 2,859,964 2.18 Home Depot, Inc. 2,173,303 1.65 Berkshire Hathaway Inc. 2,164,738 1.65 Accenture plc 1,926,424 1.47
Top 10 Holdings as at 31 December 2019* Market Value USD
% of Net Asset Value
Apple Inc. 6,713,133 5.70Microsoft Corporation 5,548,675 4.71Berkshire Hathaway Inc. 3,113,469 2.64Alphabet Inc. 2,732,819 2.32Visa Inc. 2,580,055 2.19Exxon Mobil Corporation 2,463,094 2.09Intel Corporation 2,362,818 2.01Mastercard Incorporated 2,337,661 1.99Amazon.com, Inc. 2,246,973 1.91Pfizer Inc. 2,134,605 1.81
* Information extracted from the underlying PineBridge US Large Cap Research Enhanced Fund
As at 31 December 2020
AIA ANNUAL FUNDS REPORT 2020 41
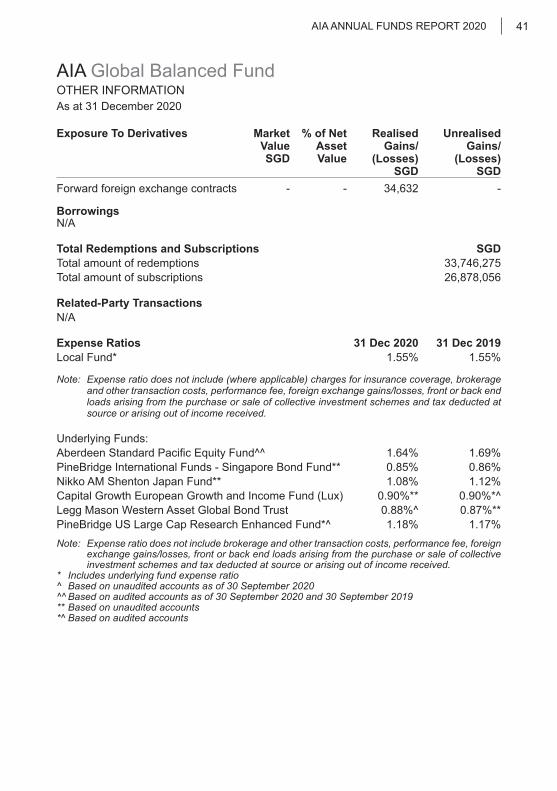
AIA Global Balanced FundOTHER INFORMATION
Exposure To Derivatives Market ValueSGD
% of Net Asset Value
Realised Gains/
(Losses)SGD
Unrealised Gains/
(Losses) SGD
Forward foreign exchange contracts - - 34,632 -
BorrowingsN/A
Total Redemptions and Subscriptions SGDTotal amount of redemptions 33,746,275Total amount of subscriptions 26,878,056
Related-Party Transactions N/A
Expense Ratios 31 Dec 2020 31 Dec 2019Local Fund* 1.55% 1.55%
Note: Expense ratio does not include (where applicable) charges for insurance coverage, brokerage and other transaction costs, performance fee, foreign exchange gains/losses, front or back end loads arising from the purchase or sale of collective investment schemes and tax deducted at source or arising out of income received.
Underlying Funds: Aberdeen Standard Pacific Equity Fund^^ 1.64% 1.69%PineBridge International Funds - Singapore Bond Fund** 0.85% 0.86%Nikko AM Shenton Japan Fund** 1.08% 1.12%Capital Growth European Growth and Income Fund (Lux) 0.90%** 0.90%*^Legg Mason Western Asset Global Bond Trust 0.88%^ 0.87%**PineBridge US Large Cap Research Enhanced Fund*^ 1.18% 1.17%Note: Expense ratio does not include brokerage and other transaction costs, performance fee, foreign
exchange gains/losses, front or back end loads arising from the purchase or sale of collective investment schemes and tax deducted at source or arising out of income received.
* Includes underlying fund expense ratio^ Based on unaudited accounts as of 30 September 2020^^ Based on audited accounts as of 30 September 2020 and 30 September 2019** Based on unaudited accounts*^ Based on audited accounts

As at 31 December 2020
AIA ANNUAL FUNDS REPORT 202042
AIA Global Balanced FundOTHER INFORMATION
Turnover Ratios 31 Dec 2020 31 Dec 2019
Local Fund: The turnover ratio of the Local Fund(s) follow that of the Underlying Fund(s) as the Local Fund(s) invest all or substantially all of its assets into its Underlying Fund(s).
Underlying Fund: Aberdeen Standard Pacific Equity Fund^^ 33.42% 17.02%PineBridge International Funds - Singapore Bond Fund** 79.02% 83.13%Nikko AM Shenton Japan Fund** 29.90% 40.97%Capital Growth European Growth and Income Fund (Lux) 74.54%** 50.93%*^Legg Mason Western Asset Global Bond Trust 9.12%^ 51.26%**PineBridge US Large Cap Research Enhanced Fund*^ 135.32% 126.46%^ Based on unaudited accounts as of 30 September 2020^^ Based on audited accounts as of 30 September 2020 and 30 September 2019** Based on unaudited accounts*^ Based on audited accounts
Any Material Information That Will Adversely Impact The Valuation Of The FundNIL
Soft Dollar Commissions
Soft dollar commisions for Aberdeen Standard Pacific Equity Fund:
The Manager does not receive soft-dollar commissions or cash rebates from dealing on the Aberdeen Standard Pacific Equity Fund.
Soft dollar commissions for PineBridge International Funds - Singapore Bond Fund.
There is no soft dollar commissions for PineBridge International Funds - Singapore Bond Fund.
Soft dollar commisions for Nikko AM Shenton Japan Fund:
In their management of the Nikko AM Shenton Japan Fund (“Fund”), the Managers currently do not receive or enter into any soft dollar commissions or arrangements. The Sub-Managers of the Fund do not receive or intend to receive soft dollar commissions, or enter into soft dollar arrangements, in respect of the Fund.
Soft dollar commisions for Capital Group European Growth and Income Fund:
Internal research is the foundation of Capital Group’s investment process and is paid for in full from Capital Group resources. Capital Group bears the cost of all third-party investment research services for all funds, mandates and client accounts it advises.

As at 31 December 2020
AIA ANNUAL FUNDS REPORT 2020 43
AIA Global Balanced FundOTHER INFORMATION
Soft dollar commisions for Legg Mason Western Asset Global Bond Trust:
The Managers and the Sub-Managers currently do not but shall be entitled to receive or enter into soft-dollar commissions/arrangements in respect of the underlying Fund. The Managers and sub-Managers will comply with applicable regulatory and industry standards on soft-dollars. The soft-dollar commissions which the Managers may receive include specific advice as to the advisability of dealing in, or the value of any investments, research and advisory services, economic and political analyses, portfolio analyses including valuation and performance measurements, market analyses, data and quotation services, computer hardware and software or any other information facilities to the extent that they are used to support the investment decision making process, the giving of advice, or the conduct of research or analysis, and custodial service in relation to the investments managed for clients.
Soft-dollar commissions received shall not include travel, accommodation, entertainment, general administrative goods and services, general office equipment or premises, membership fees, employees’ salaries or direct money payment.
The Managers and the sub-Managers will not accept or enter into soft dollar commissions/arrangements unless such soft-dollar commissions/arrangements would, in the opinion of the Managers, assist the Managers in their management of the Underlying Fund, provided that the Managers shall ensure at all times that best execution is carried out for the transactions, and that no unnecessary trades are entered into in order to qualify for such soft-dollar commissions/arrangements. Soft dollar commisions for PineBridge US Large Cap Research Enhanced Fund:
PineBridge Investments LLC (“PineBridge”) has entered into soft dollar commission arrangements with selected brokers where it obtains services from third parties. These services relate to research and are eligible under the safe harbor of Section 28(e) of the Securities and Exchange Act of 1934. These services generally benefit all of PineBridge’s clients in terms of input into the investment decision making process. The soft dollar credits utilized are not allocated on a specific client basis. PineBridge further confirms that, as per our Compliance Manual, we seek to obtain best execution on all transactions.
As at 31 December 2020
AIA ANNUAL FUNDS REPORT 202044
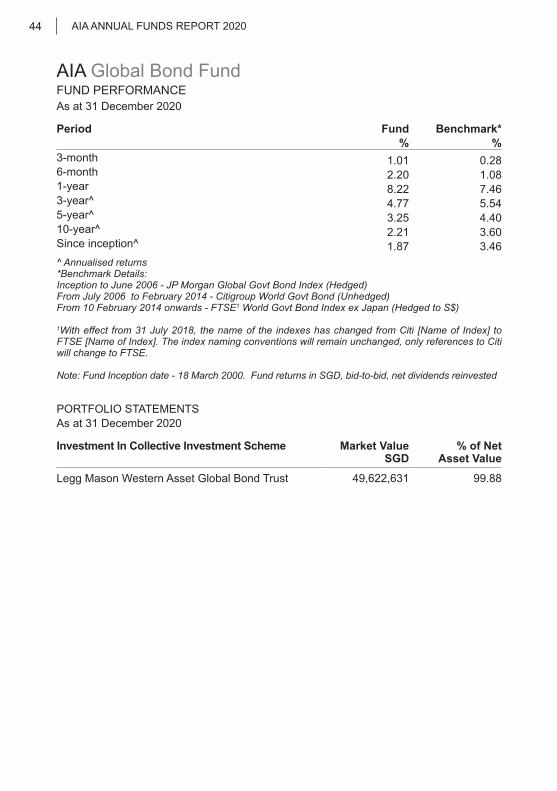
AIA Global Bond FundFUND PERFORMANCE
Period Fund Benchmark*% %
3-month 1.01 0.28 6-month 2.20 1.08 1-year 8.22 7.46 3-year^ 4.77 5.54 5-year^ 3.25 4.40 10-year^ 2.21 3.60 Since inception^ 1.87 3.46 ^ Annualised returns *Benchmark Details: Inception to June 2006 - JP Morgan Global Govt Bond Index (Hedged) From July 2006 to February 2014 - Citigroup World Govt Bond (Unhedged) From 10 February 2014 onwards - FTSE1 World Govt Bond Index ex Japan (Hedged to S$)
1With effect from 31 July 2018, the name of the indexes has changed from Citi [Name of Index] to FTSE [Name of Index]. The index naming conventions will remain unchanged, only references to Citi will change to FTSE.
Note: Fund Inception date - 18 March 2000. Fund returns in SGD, bid-to-bid, net dividends reinvested
PORTFOLIO STATEMENTSAs at 31 December 2020
Investment In Collective Investment Scheme Market Value SGD
% of Net Asset Value
Legg Mason Western Asset Global Bond Trust 49,622,631 99.88

As at 31 December 2020
AIA ANNUAL FUNDS REPORT 2020 45
AIA Global Bond FundPORTFOLIO STATEMENTS
LEGG MASON WESTERN ASSET GLOBAL BOND TRUST
Top 10 Holdings as at 31 December 2020* Market Value USD
% of Net Asset Value
US Treasury N/B 2.125% 29/02/2024 32,281,712 6.95US Treasury N/B 1.625% 15/11/2022 31,213,308 6.72Bundesrepub. Deutschland (Br) 1.75% 15/02/2024 29,415,221 6.33US Treasury N/B 2.250% 15/11/2024 20,892,882 4.50US Treasury N/B 2% 31/10/2022 16,325,962 3.52US Treasury 2.875% 15/05/2049 14,168,800 3.05Bundesrepublik Deutschland Bundesanleihe (Reg S) (Br) .25% 15/02/2029 14,099,878 3.04Mex Bonds Desarr Fix Rt Ser M7.75% 13/11/2042 13,827,658 2.98UK Treasury 4.25% 07/12/2040 12,621,170 2.72Bonos Y Oblig Del Estado (Reg S)5.9% 30/07/2026 11,948,438 2.57
Top 10 Holdings as at 31 December 2019* Market Value USD
% of Net Asset Value
US Treasury Bond 1.625% 15/11/2022 17,288,453 8.36Bundesrepub Deutschland (Br) 1.75% 15/02/2024 15,584,627 7.54US Treasury Bond 2.125% 29/02/2024 12,227,388 5.91US Treasury Bond 2% 31/10/2022 9,079,241 4.39Poland (Govt Of) (Ser 428) 2.75% 25 /04/2028 7,794,186 3.77UK Treasury 4.25% 07/12/2040 6,420,846 3.11Bonos Y Oblig Del Estado (Reg S) 5.9% 30/07/2026 6,330,837 3.06France (Rep Of) Ser Oat FRN 25/07/2027 6,223,125 3.01US Treasury 0.5% 15/04/2024 5,906,892 2.86Mex Bonds Desarr Fix RT Ser M 7.75% 13/11/2042 5,679,319 2.75
*Information extracted from the underlying Legg Mason Western Asset Global Bond Trust
As at 31 December 2020
AIA ANNUAL FUNDS REPORT 202046
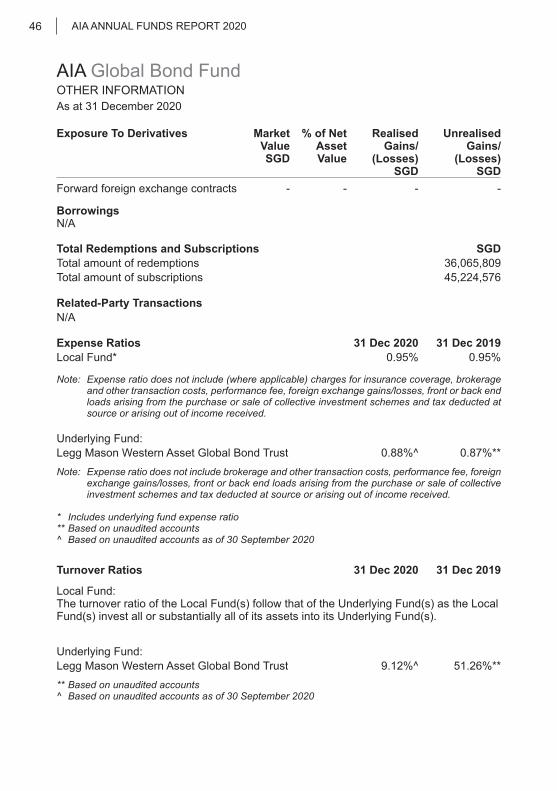
AIA Global Bond FundOTHER INFORMATION
Exposure To Derivatives Market ValueSGD
% of Net Asset Value
Realised Gains/
(Losses)SGD
Unrealised Gains/
(Losses) SGD
Forward foreign exchange contracts - - - -
BorrowingsN/A
Total Redemptions and Subscriptions SGDTotal amount of redemptions 36,065,809Total amount of subscriptions 45,224,576
Related-Party Transactions N/A
Expense Ratios 31 Dec 2020 31 Dec 2019Local Fund* 0.95% 0.95%
Note: Expense ratio does not include (where applicable) charges for insurance coverage, brokerage and other transaction costs, performance fee, foreign exchange gains/losses, front or back end loads arising from the purchase or sale of collective investment schemes and tax deducted at source or arising out of income received.
Underlying Fund: Legg Mason Western Asset Global Bond Trust 0.88%^ 0.87%**Note: Expense ratio does not include brokerage and other transaction costs, performance fee, foreign
exchange gains/losses, front or back end loads arising from the purchase or sale of collective investment schemes and tax deducted at source or arising out of income received.
* Includes underlying fund expense ratio** Based on unaudited accounts ^ Based on unaudited accounts as of 30 September 2020
Turnover Ratios 31 Dec 2020 31 Dec 2019
Local Fund: The turnover ratio of the Local Fund(s) follow that of the Underlying Fund(s) as the Local Fund(s) invest all or substantially all of its assets into its Underlying Fund(s).
Underlying Fund:Legg Mason Western Asset Global Bond Trust 9.12%^ 51.26%**** Based on unaudited accounts ^ Based on unaudited accounts as of 30 September 2020

As at 31 December 2020
AIA ANNUAL FUNDS REPORT 2020 47
Any Material Information That Will Adversely Impact The Valuation Of The FundNIL
Soft Dollar CommissionsThe Managers and the Sub-Managers currently do not but shall be entitled to receive or enter into soft-dollar commissions/arrangements in respect of the underlying Fund. The Managers and sub-Managers will comply with applicable regulatory and industry standards on soft-dollars. The soft-dollar commissions which the Managers may receive include specific advice as to the advisability of dealing in, or the value of any investments, research and advisory services, economic and political analyses, portfolio analyses including valuation and performance measurements, market analyses, data and quotation services, computer hardware and software or any other information facilities to the extent that they are used to support the investment decision making process, the giving of advice, or the conduct of research or analysis, and custodial service in relation to the investments managed for clients.
Soft-dollar commissions received shall not include travel, accommodation, entertainment, general administrative goods and services, general office equipment or premises, membership fees, employees’ salaries or direct money payment.
The Managers and the sub-Managers will not accept or enter into soft dollar commissions/arrangements unless such soft-dollar commissions/arrangements would, in the opinion of the Managers, assist the Managers in their management of the Underlying Fund, provided that the Managers shall ensure at all times that best execution is carried out for the transactions, and that no unnecessary trades are entered into in order to qualify for such soft-dollar commissions/arrangements.
AIA Global Bond FundOTHER INFORMATION
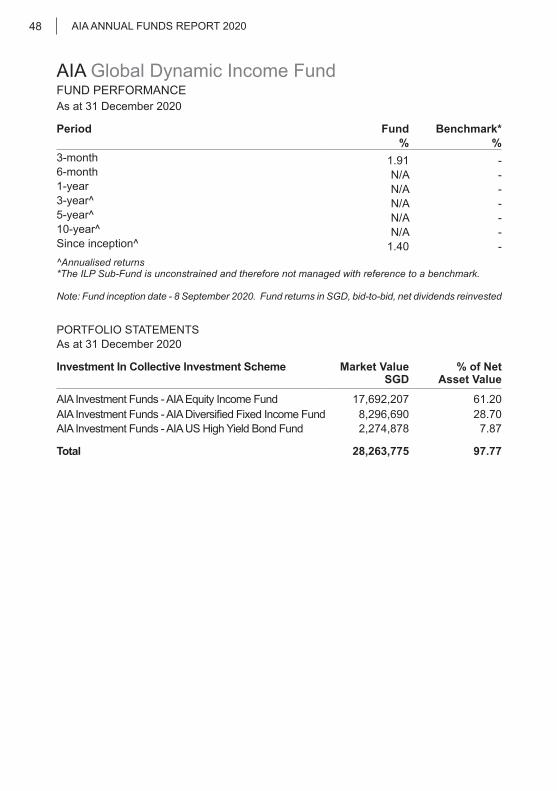
As at 31 December 2020
AIA ANNUAL FUNDS REPORT 202048
AIA Global Dynamic Income FundFUND PERFORMANCE
Period Fund Benchmark*% %
3-month 1.91 - 6-month N/A - 1-year N/A - 3-year^ N/A - 5-year^ N/A - 10-year^ N/A - Since inception^ 1.40 - ^Annualised returns*The ILP Sub-Fund is unconstrained and therefore not managed with reference to a benchmark.
Note: Fund inception date - 8 September 2020. Fund returns in SGD, bid-to-bid, net dividends reinvested
PORTFOLIO STATEMENTSAs at 31 December 2020
Investment In Collective Investment Scheme Market Value SGD
% of Net Asset Value
AIA Investment Funds - AIA Equity Income Fund 17,692,207 61.20 AIA Investment Funds - AIA Diversified Fixed Income Fund 8,296,690 28.70 AIA Investment Funds - AIA US High Yield Bond Fund 2,274,878 7.87
Total 28,263,775 97.77
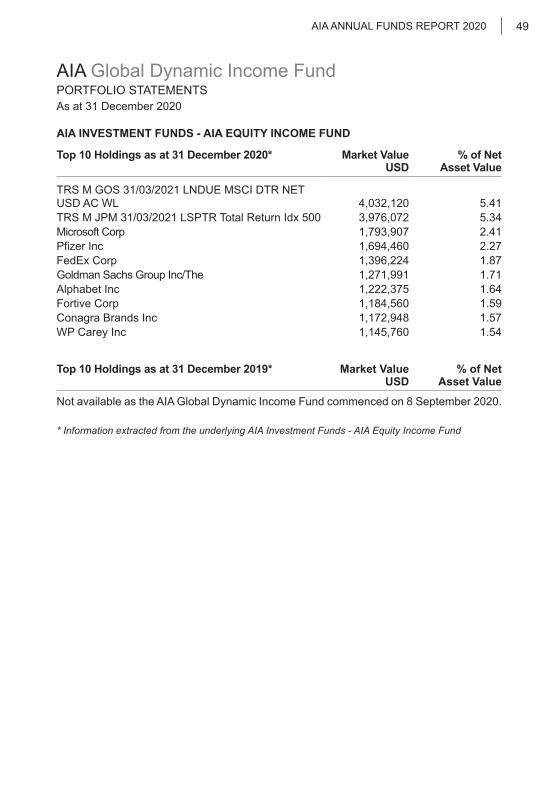
As at 31 December 2020
AIA ANNUAL FUNDS REPORT 2020 49
AIA Global Dynamic Income FundPORTFOLIO STATEMENTS
AIA INVESTMENT FUNDS - AIA EQUITY INCOME FUND
Top 10 Holdings as at 31 December 2020* Market Value USD
% of Net Asset Value
TRS M GOS 31/03/2021 LNDUE MSCI DTR NET USD AC WL 4,032,120 5.41TRS M JPM 31/03/2021 LSPTR Total Return Idx 500 3,976,072 5.34Microsoft Corp 1,793,907 2.41Pfizer Inc 1,694,460 2.27FedEx Corp 1,396,224 1.87Goldman Sachs Group Inc/The 1,271,991 1.71Alphabet Inc 1,222,375 1.64Fortive Corp 1,184,560 1.59Conagra Brands Inc 1,172,948 1.57WP Carey Inc 1,145,760 1.54
Top 10 Holdings as at 31 December 2019* Market Value USD
% of Net Asset Value
Not available as the AIA Global Dynamic Income Fund commenced on 8 September 2020.
* Information extracted from the underlying AIA Investment Funds - AIA Equity Income Fund

As at 31 December 2020
AIA ANNUAL FUNDS REPORT 202050
AIA Global Dynamic Income FundOTHER INFORMATION
Exposure To Derivatives Market ValueSGD
% of Net Asset Value
Realised Gains/
(Losses)SGD
Unrealised Gains/
(Losses) SGD
Forward foreign exchange contracts (2,320) - (25,282) (2,320)
BorrowingsN/A
Total Redemptions and Subscriptions SGDTotal amount of redemptions 946,616Total amount of subscriptions 29,462,263
Related-Party Transactions AIA Global Dynamic Income Fund invests in AIA Investment Funds, which is managed by AIA Investment Management Private Limited (“AIAIM”), a related company of AIA Singapore Private Limited, which is part of the AIA Group.
Market Value (SGD)
% of Net Asset Value
AIA Investment Funds - AIA Diversified Fixed Income Fund28,263,775 97.77AIA Investment Funds - AIA Equity Income Fund
AIA Investment Funds - AIA US High Yield Bond Fund
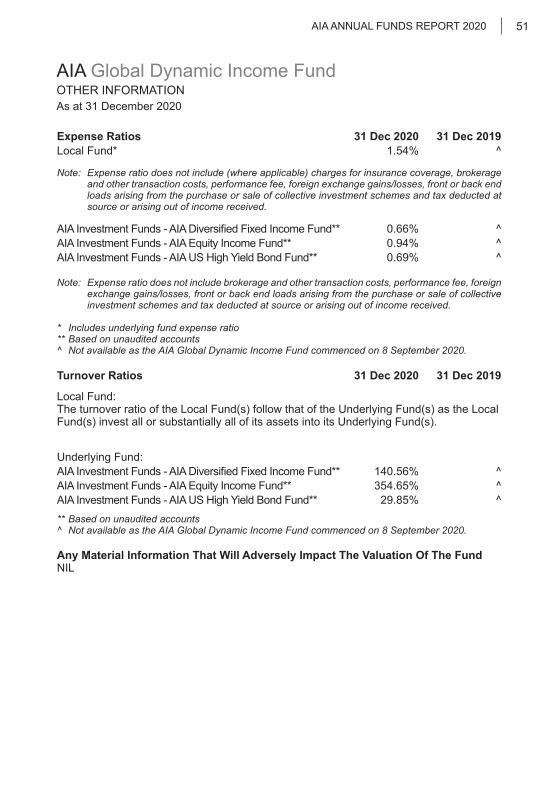
As at 31 December 2020
AIA ANNUAL FUNDS REPORT 2020 51
AIA Global Dynamic Income FundOTHER INFORMATION
Expense Ratios 31 Dec 2020 31 Dec 2019Local Fund* 1.54% ^
Note: Expense ratio does not include (where applicable) charges for insurance coverage, brokerage and other transaction costs, performance fee, foreign exchange gains/losses, front or back end loads arising from the purchase or sale of collective investment schemes and tax deducted at source or arising out of income received.
AIA Investment Funds - AIA Diversified Fixed Income Fund** 0.66% ^AIA Investment Funds - AIA Equity Income Fund** 0.94% ^AIA Investment Funds - AIA US High Yield Bond Fund** 0.69% ^
Note: Expense ratio does not include brokerage and other transaction costs, performance fee, foreign exchange gains/losses, front or back end loads arising from the purchase or sale of collective investment schemes and tax deducted at source or arising out of income received.
* Includes underlying fund expense ratio** Based on unaudited accounts ^ Not available as the AIA Global Dynamic Income Fund commenced on 8 September 2020.
Turnover Ratios 31 Dec 2020 31 Dec 2019
Local Fund: The turnover ratio of the Local Fund(s) follow that of the Underlying Fund(s) as the Local Fund(s) invest all or substantially all of its assets into its Underlying Fund(s).
Underlying Fund:AIA Investment Funds - AIA Diversified Fixed Income Fund** 140.56% ^AIA Investment Funds - AIA Equity Income Fund** 354.65% ^AIA Investment Funds - AIA US High Yield Bond Fund** 29.85% ^** Based on unaudited accounts^ Not available as the AIA Global Dynamic Income Fund commenced on 8 September 2020.
Any Material Information That Will Adversely Impact The Valuation Of The FundNIL
As at 31 December 2020
AIA ANNUAL FUNDS REPORT 202052
Soft Dollar CommissionsAIA Investment Funds - AIA Diversified Fixed Income FundAIA Investment Funds - AIA US High Yield Bond FundAIA Investment Funds - AIA Diversified Fixed Income Fund(collectively, the “Sub-Funds” and each a “Sub-Fund”)
None of the Management Company, the Investment Manager, the Sub-Investment Manager or any of their connected persons will retain cash or other rebates from brokers or dealers in consideration of directing transactions for a Sub-Fund to such brokers or dealers, save that goods and services (soft dollars) as described in the paragraph below may be retained.
Any such cash commission or rebates received from any such brokers or dealers shall be for the account of the relevant Sub-Fund and entered into in the best interests of the Fund and the shareholders (taken as a body and in their capacity as such).
The Management Company, the Investment Manager, the Sub-Investment Manager and/or any of their connected persons reserves the right to effect transactions by or through a broker or dealer, which are legal entities (as opposed to individuals), with whom the Management Company, the Investment Manager, the Sub-Investment Manager and/or any of their connected persons has an arrangement under which that broker or dealer will from time to time provide to or procure for the Management Company, the Investment Manager, the Sub-Investment Manager and/or any of their connected persons goods or services for which no direct payment is made but instead the Management Company, the Investment Manager, the Sub-Investment Manager and/or any of their connected persons undertakes to place business with that broker or dealer.
The Investment Manager shall procure that no such arrangements are entered into unless (i) the goods and services to be provided pursuant thereto are of demonstrable benefit to the shareholders (taken as a body and in their capacity as such) whether by assisting the Management Company, the Investment Manager and/or the Sub-Investment Manager in their ability to manage the relevant Sub-Fund or otherwise; (ii) the transaction execution is consistent with best execution standards and brokerage rates are not in excess of customary institutional full-service brokerage rates; (iii) periodic disclosure is made in the annual report of the Fund or the relevant Sub-Fund in the form of a statement describing the soft dollar policies and practices of the Management Company, the Investment Manager or the Sub-Investment Manager, including a description of goods and services received by them; and (iv) the availability of soft dollar arrangements is not the sole or primary purpose to perform or arrange transaction with such broker or dealer.
Such goods and services may include research and advisory services, economic and political analysis, portfolio analysis including valuation and performance measurement, market analysis, data and quotation services, computer hardware and software incidental to the above goods and services, clearing and custodian services and investment-related publications. For the avoidance of doubt, such goods and services do not include travel, accommodation, entertainment, general administrative goods or services, general office equipment or premises, membership fees, employee salaries or direct money payments.
AIA Global Dynamic Income FundOTHER INFORMATION
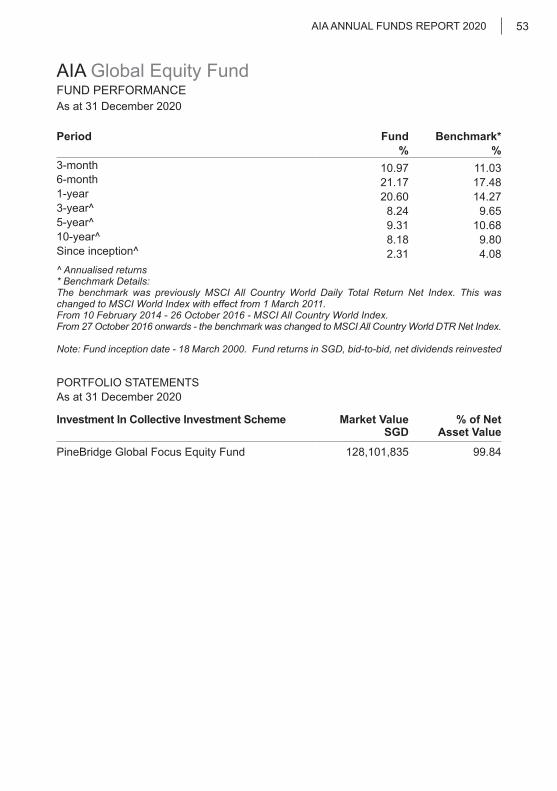
As at 31 December 2020
AIA ANNUAL FUNDS REPORT 2020 53
AIA Global Equity FundFUND PERFORMANCE
Period Fund Benchmark*% %
3-month 10.97 11.03 6-month 21.17 17.48 1-year 20.60 14.27 3-year^ 8.24 9.65 5-year^ 9.31 10.68 10-year^ 8.18 9.80 Since inception^ 2.31 4.08 ^ Annualised returns* Benchmark Details:The benchmark was previously MSCI All Country World Daily Total Return Net Index. This was changed to MSCI World Index with effect from 1 March 2011.From 10 February 2014 - 26 October 2016 - MSCI All Country World Index.From 27 October 2016 onwards - the benchmark was changed to MSCI All Country World DTR Net Index.
Note: Fund inception date - 18 March 2000. Fund returns in SGD, bid-to-bid, net dividends reinvested
PORTFOLIO STATEMENTSAs at 31 December 2020
Investment In Collective Investment Scheme Market Value SGD
% of Net Asset Value
PineBridge Global Focus Equity Fund 128,101,835 99.84
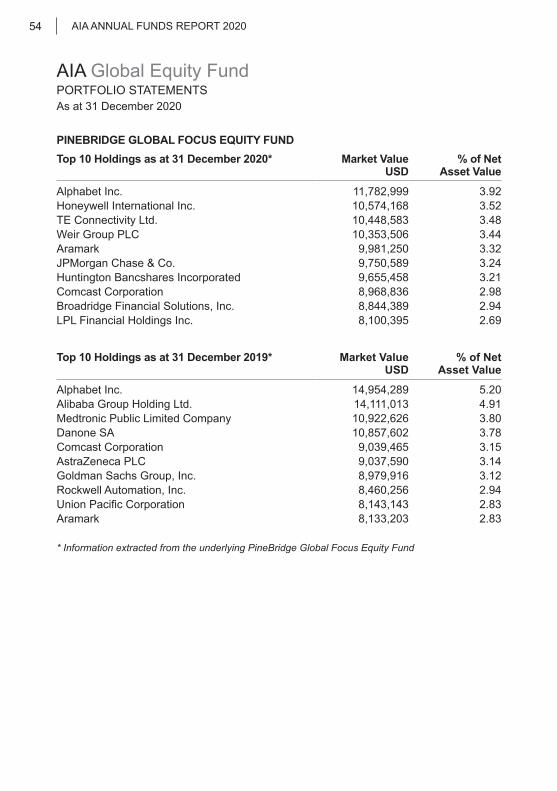
As at 31 December 2020
AIA ANNUAL FUNDS REPORT 202054
AIA Global Equity FundPORTFOLIO STATEMENTS
PINEBRIDGE GLOBAL FOCUS EQUITY FUNDTop 10 Holdings as at 31 December 2020* Market Value
USD % of Net
Asset Value
Alphabet Inc. 11,782,999 3.92Honeywell International Inc. 10,574,168 3.52TE Connectivity Ltd. 10,448,583 3.48Weir Group PLC 10,353,506 3.44Aramark 9,981,250 3.32JPMorgan Chase & Co. 9,750,589 3.24Huntington Bancshares Incorporated 9,655,458 3.21Comcast Corporation 8,968,836 2.98Broadridge Financial Solutions, Inc. 8,844,389 2.94LPL Financial Holdings Inc. 8,100,395 2.69
Top 10 Holdings as at 31 December 2019* Market Value USD
% of Net Asset Value
Alphabet Inc. 14,954,289 5.20Alibaba Group Holding Ltd. 14,111,013 4.91Medtronic Public Limited Company 10,922,626 3.80Danone SA 10,857,602 3.78Comcast Corporation 9,039,465 3.15AstraZeneca PLC 9,037,590 3.14Goldman Sachs Group, Inc. 8,979,916 3.12Rockwell Automation, Inc. 8,460,256 2.94Union Pacific Corporation 8,143,143 2.83Aramark 8,133,203 2.83
* Information extracted from the underlying PineBridge Global Focus Equity Fund
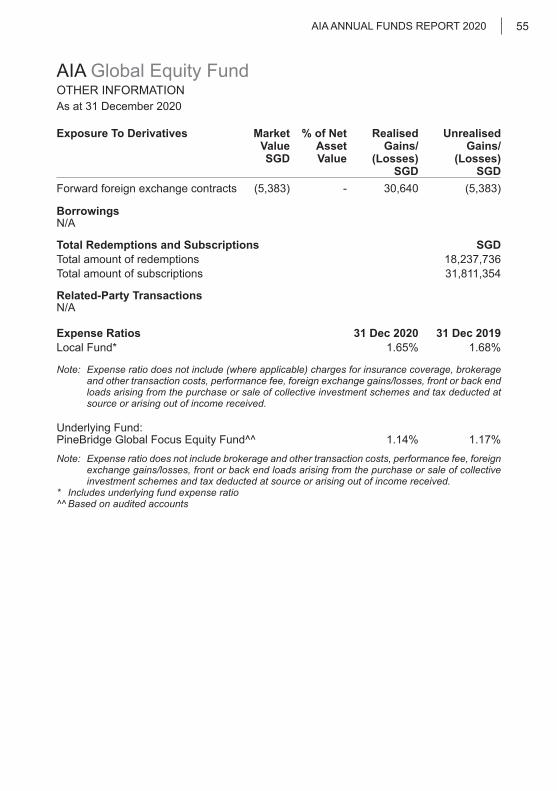
As at 31 December 2020
AIA ANNUAL FUNDS REPORT 2020 55
AIA Global Equity FundOTHER INFORMATION
Exposure To Derivatives Market ValueSGD
% of Net Asset Value
Realised Gains/
(Losses)SGD
Unrealised Gains/
(Losses) SGD
Forward foreign exchange contracts (5,383) - 30,640 (5,383)
BorrowingsN/A
Total Redemptions and Subscriptions SGDTotal amount of redemptions 18,237,736Total amount of subscriptions 31,811,354
Related-Party TransactionsN/A
Expense Ratios 31 Dec 2020 31 Dec 2019Local Fund* 1.65% 1.68%
Note: Expense ratio does not include (where applicable) charges for insurance coverage, brokerage and other transaction costs, performance fee, foreign exchange gains/losses, front or back end loads arising from the purchase or sale of collective investment schemes and tax deducted at source or arising out of income received.
Underlying Fund: PineBridge Global Focus Equity Fund^^ 1.14% 1.17%Note: Expense ratio does not include brokerage and other transaction costs, performance fee, foreign
exchange gains/losses, front or back end loads arising from the purchase or sale of collective investment schemes and tax deducted at source or arising out of income received.
* Includes underlying fund expense ratio^^ Based on audited accounts
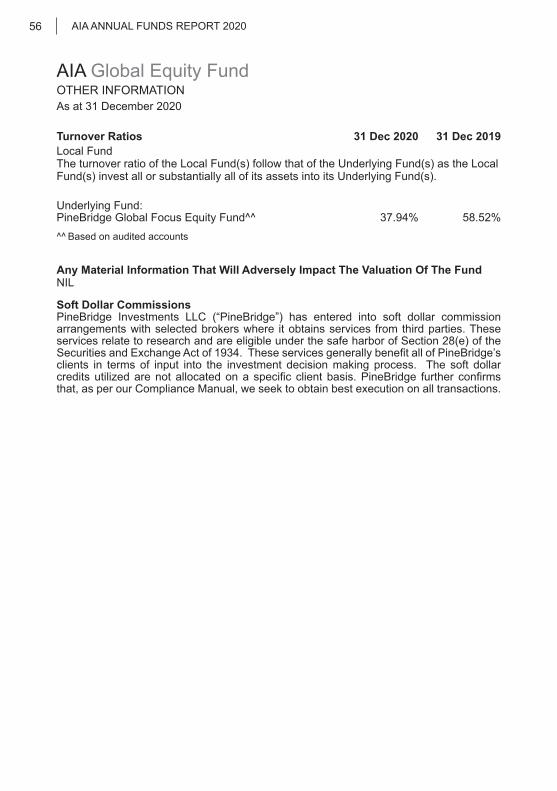
As at 31 December 2020
AIA ANNUAL FUNDS REPORT 202056
Turnover Ratios 31 Dec 2020 31 Dec 2019 Local FundThe turnover ratio of the Local Fund(s) follow that of the Underlying Fund(s) as the Local Fund(s) invest all or substantially all of its assets into its Underlying Fund(s).
Underlying Fund: PineBridge Global Focus Equity Fund^^ 37.94% 58.52%^^ Based on audited accounts
Any Material Information That Will Adversely Impact The Valuation Of The FundNIL
Soft Dollar CommissionsPineBridge Investments LLC (“PineBridge”) has entered into soft dollar commission arrangements with selected brokers where it obtains services from third parties. These services relate to research and are eligible under the safe harbor of Section 28(e) of the Securities and Exchange Act of 1934. These services generally benefit all of PineBridge’s clients in terms of input into the investment decision making process. The soft dollar credits utilized are not allocated on a specific client basis. PineBridge further confirms that, as per our Compliance Manual, we seek to obtain best execution on all transactions.
AIA Global Equity FundOTHER INFORMATION
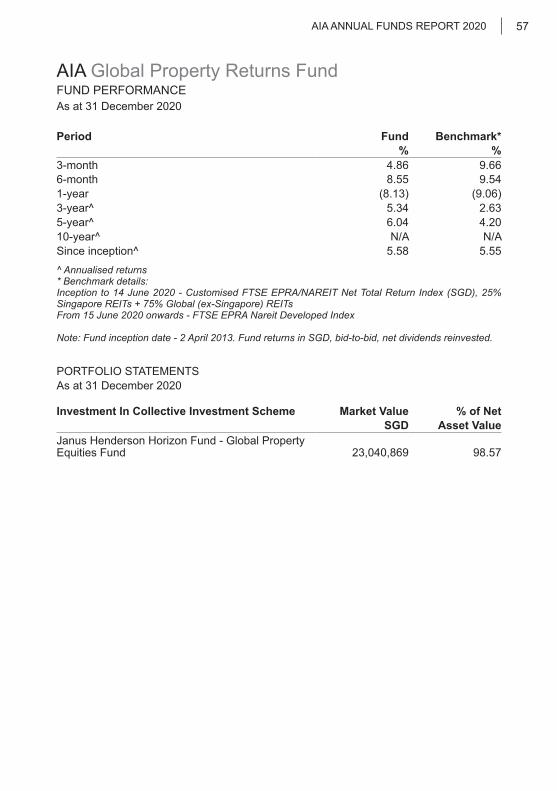
As at 31 December 2020
AIA ANNUAL FUNDS REPORT 2020 57
AIA Global Property Returns FundFUND PERFORMANCE
Period Fund Benchmark*% %
3-month 4.86 9.66 6-month 8.55 9.54 1-year (8.13) (9.06)3-year^ 5.34 2.63 5-year^ 6.04 4.20 10-year^ N/A N/ASince inception^ 5.58 5.55 ^ Annualised returns * Benchmark details: Inception to 14 June 2020 - Customised FTSE EPRA/NAREIT Net Total Return Index (SGD), 25% Singapore REITs + 75% Global (ex-Singapore) REITs From 15 June 2020 onwards - FTSE EPRA Nareit Developed Index
Note: Fund inception date - 2 April 2013. Fund returns in SGD, bid-to-bid, net dividends reinvested.
PORTFOLIO STATEMENTSAs at 31 December 2020
Investment In Collective Investment Scheme Market Value % of NetSGD Asset Value
Janus Henderson Horizon Fund - Global Property Equities Fund 23,040,869 98.57
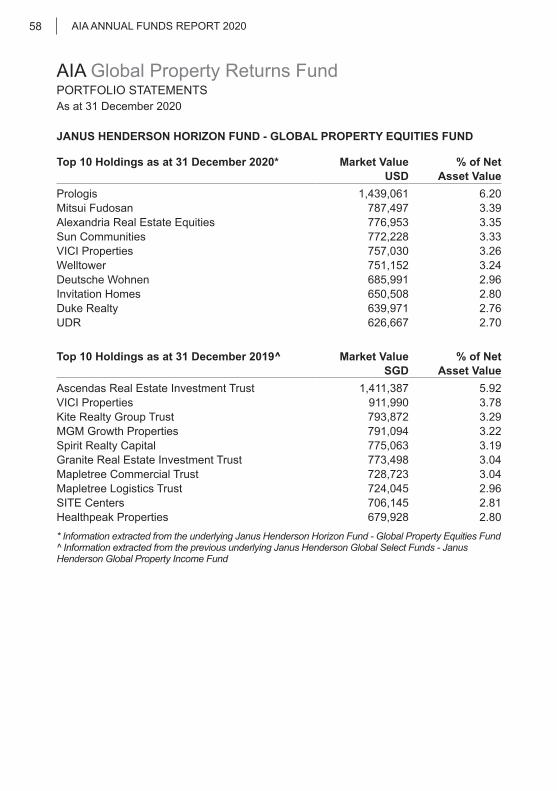
As at 31 December 2020
AIA ANNUAL FUNDS REPORT 202058
JANUS HENDERSON HORIZON FUND - GLOBAL PROPERTY EQUITIES FUND
Top 10 Holdings as at 31 December 2020* Market Value % of NetUSD Asset Value
Prologis 1,439,061 6.20Mitsui Fudosan 787,497 3.39Alexandria Real Estate Equities 776,953 3.35Sun Communities 772,228 3.33VICI Properties 757,030 3.26Welltower 751,152 3.24Deutsche Wohnen 685,991 2.96Invitation Homes 650,508 2.80Duke Realty 639,971 2.76UDR 626,667 2.70
Top 10 Holdings as at 31 December 2019^ Market Value % of NetSGD Asset Value
Ascendas Real Estate Investment Trust 1,411,387 5.92VICI Properties 911,990 3.78Kite Realty Group Trust 793,872 3.29MGM Growth Properties 791,094 3.22Spirit Realty Capital 775,063 3.19Granite Real Estate Investment Trust 773,498 3.04Mapletree Commercial Trust 728,723 3.04Mapletree Logistics Trust 724,045 2.96SITE Centers 706,145 2.81Healthpeak Properties 679,928 2.80* Information extracted from the underlying Janus Henderson Horizon Fund - Global Property Equities Fund^ Information extracted from the previous underlying Janus Henderson Global Select Funds - Janus Henderson Global Property Income Fund
AIA Global Property Returns FundPORTFOLIO STATEMENTS
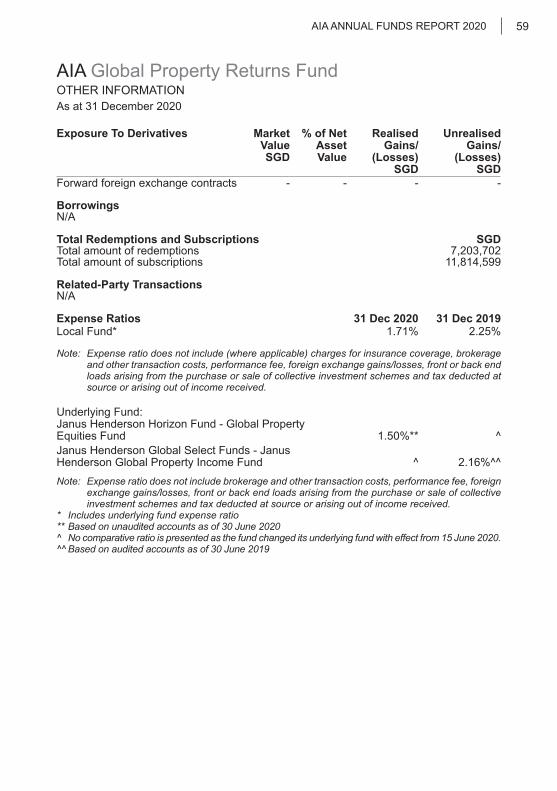
As at 31 December 2020
AIA ANNUAL FUNDS REPORT 2020 59
AIA Global Property Returns FundOTHER INFORMATION
Exposure To Derivatives Market Value SGD
% of NetAsset Value
Realised Gains/
(Losses) SGD
Unrealised Gains/
(Losses) SGD
Forward foreign exchange contracts - - - -
BorrowingsN/A
Total Redemptions and Subscriptions SGDTotal amount of redemptions 7,203,702Total amount of subscriptions 11,814,599
Related-Party Transactions N/A
Expense Ratios 31 Dec 2020 31 Dec 2019Local Fund* 1.71% 2.25%
Note: Expense ratio does not include (where applicable) charges for insurance coverage, brokerage and other transaction costs, performance fee, foreign exchange gains/losses, front or back end loads arising from the purchase or sale of collective investment schemes and tax deducted at source or arising out of income received.
Underlying Fund:Janus Henderson Horizon Fund - Global Property Equities Fund 1.50%** ^Janus Henderson Global Select Funds - Janus Henderson Global Property Income Fund ^ 2.16%^^Note: Expense ratio does not include brokerage and other transaction costs, performance fee, foreign
exchange gains/losses, front or back end loads arising from the purchase or sale of collective investment schemes and tax deducted at source or arising out of income received.
* Includes underlying fund expense ratio** Based on unaudited accounts as of 30 June 2020^ No comparative ratio is presented as the fund changed its underlying fund with effect from 15 June 2020.^^ Based on audited accounts as of 30 June 2019
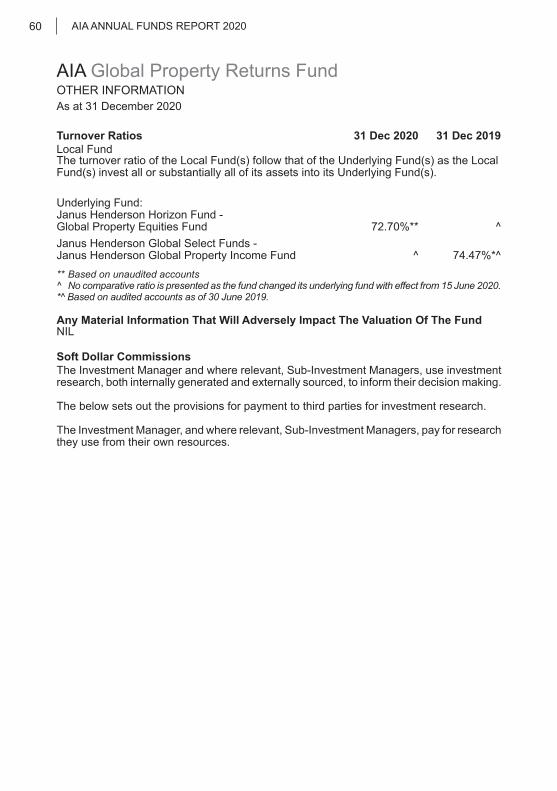
As at 31 December 2020
AIA ANNUAL FUNDS REPORT 202060
AIA Global Property Returns FundOTHER INFORMATION
Turnover Ratios 31 Dec 2020 31 Dec 2019 Local FundThe turnover ratio of the Local Fund(s) follow that of the Underlying Fund(s) as the Local Fund(s) invest all or substantially all of its assets into its Underlying Fund(s).
Underlying Fund:Janus Henderson Horizon Fund - Global Property Equities Fund 72.70%** ^Janus Henderson Global Select Funds -Janus Henderson Global Property Income Fund ^ 74.47%*^** Based on unaudited accounts^ No comparative ratio is presented as the fund changed its underlying fund with effect from 15 June 2020.*^ Based on audited accounts as of 30 June 2019.
Any Material Information That Will Adversely Impact The Valuation Of The FundNIL
Soft Dollar CommissionsThe Investment Manager and where relevant, Sub-Investment Managers, use investment research, both internally generated and externally sourced, to inform their decision making.
The below sets out the provisions for payment to third parties for investment research.
The Investment Manager, and where relevant, Sub-Investment Managers, pay for research they use from their own resources.
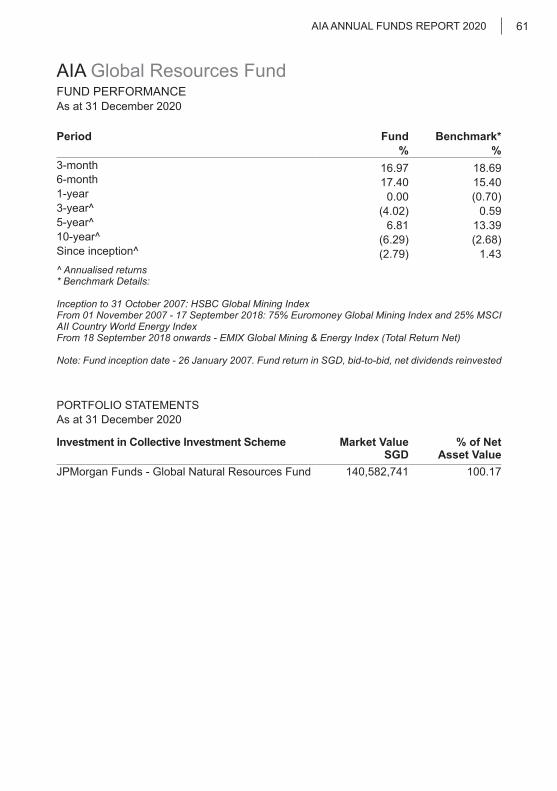
As at 31 December 2020
AIA ANNUAL FUNDS REPORT 2020 61
AIA Global Resources FundFUND PERFORMANCE
Period Fund Benchmark*% %
3-month 16.97 18.69 6-month 17.40 15.40 1-year 0.00 (0.70)3-year^ (4.02) 0.59 5-year^ 6.81 13.39 10-year^ (6.29) (2.68)Since inception^ (2.79) 1.43 ^ Annualised returns* Benchmark Details:
Inception to 31 October 2007: HSBC Global Mining Index From 01 November 2007 - 17 September 2018: 75% Euromoney Global Mining Index and 25% MSCI AII Country World Energy IndexFrom 18 September 2018 onwards - EMIX Global Mining & Energy Index (Total Return Net)
Note: Fund inception date - 26 January 2007. Fund return in SGD, bid-to-bid, net dividends reinvested
PORTFOLIO STATEMENTSAs at 31 December 2020
Investment in Collective Investment Scheme Market Value SGD
% of Net Asset Value
JPMorgan Funds - Global Natural Resources Fund 140,582,741 100.17
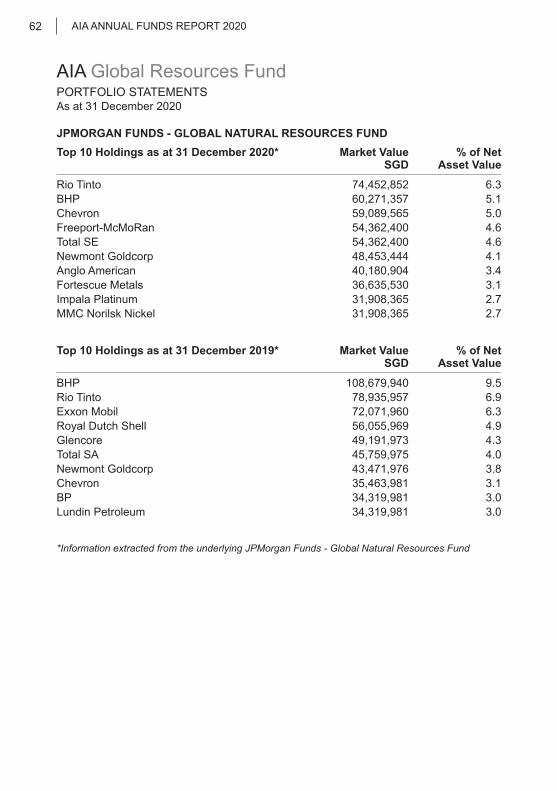
As at 31 December 2020
AIA ANNUAL FUNDS REPORT 202062
AIA Global Resources FundPORTFOLIO STATEMENTS
JPMORGAN FUNDS - GLOBAL NATURAL RESOURCES FUNDTop 10 Holdings as at 31 December 2020* Market Value
SGD % of Net
Asset Value
Rio Tinto 74,452,852 6.3BHP 60,271,357 5.1Chevron 59,089,565 5.0Freeport-McMoRan 54,362,400 4.6Total SE 54,362,400 4.6Newmont Goldcorp 48,453,444 4.1Anglo American 40,180,904 3.4Fortescue Metals 36,635,530 3.1Impala Platinum 31,908,365 2.7MMC Norilsk Nickel 31,908,365 2.7
Top 10 Holdings as at 31 December 2019* Market Value SGD
% of NetAsset Value
BHP 108,679,940 9.5Rio Tinto 78,935,957 6.9Exxon Mobil 72,071,960 6.3Royal Dutch Shell 56,055,969 4.9Glencore 49,191,973 4.3Total SA 45,759,975 4.0Newmont Goldcorp 43,471,976 3.8Chevron 35,463,981 3.1BP 34,319,981 3.0Lundin Petroleum 34,319,981 3.0
*Information extracted from the underlying JPMorgan Funds - Global Natural Resources Fund
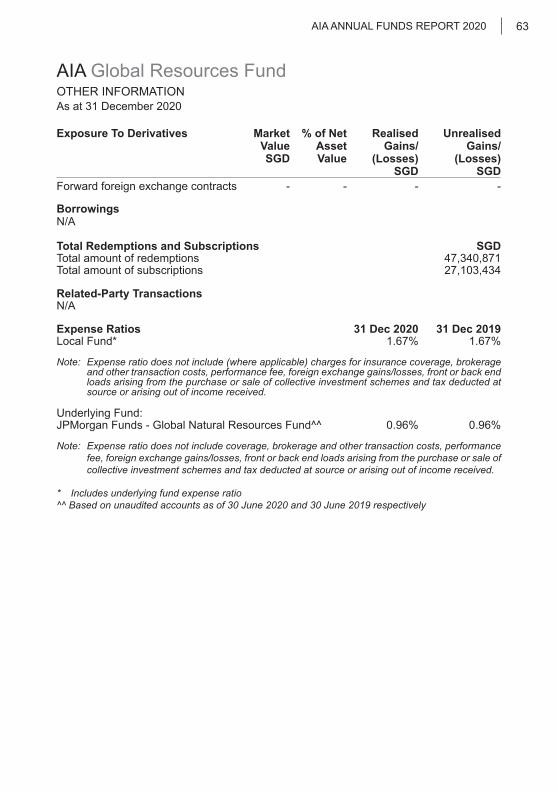
As at 31 December 2020
AIA ANNUAL FUNDS REPORT 2020 63
AIA Global Resources FundOTHER INFORMATION
Exposure To Derivatives Market ValueSGD
% of Net AssetValue
Realised Gains/
(Losses)SGD
Unrealised Gains/
(Losses) SGD
Forward foreign exchange contracts - - - -
BorrowingsN/A
Total Redemptions and Subscriptions SGDTotal amount of redemptions 47,340,871Total amount of subscriptions 27,103,434
Related-Party Transactions N/A
Expense Ratios 31 Dec 2020 31 Dec 2019Local Fund* 1.67% 1.67%
Note: Expense ratio does not include (where applicable) charges for insurance coverage, brokerage and other transaction costs, performance fee, foreign exchange gains/losses, front or back end loads arising from the purchase or sale of collective investment schemes and tax deducted at source or arising out of income received.
Underlying Fund:JPMorgan Funds - Global Natural Resources Fund^^ 0.96% 0.96%
Note: Expense ratio does not include coverage, brokerage and other transaction costs, performance fee, foreign exchange gains/losses, front or back end loads arising from the purchase or sale of collective investment schemes and tax deducted at source or arising out of income received.
* Includes underlying fund expense ratio^^ Based on unaudited accounts as of 30 June 2020 and 30 June 2019 respectively
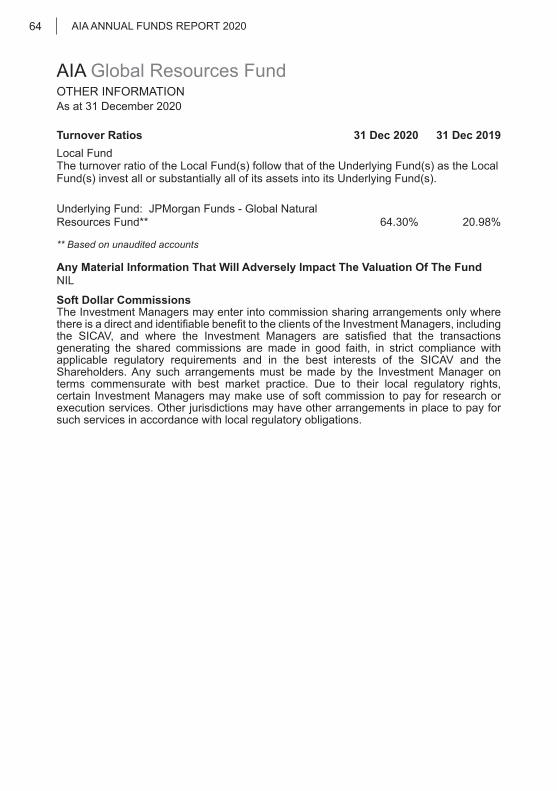
As at 31 December 2020
AIA ANNUAL FUNDS REPORT 202064
AIA Global Resources FundOTHER INFORMATION
Turnover Ratios 31 Dec 2020 31 Dec 2019Local FundThe turnover ratio of the Local Fund(s) follow that of the Underlying Fund(s) as the Local Fund(s) invest all or substantially all of its assets into its Underlying Fund(s).
Underlying Fund: JPMorgan Funds - Global Natural Resources Fund** 64.30% 20.98%
** Based on unaudited accounts
Any Material Information That Will Adversely Impact The Valuation Of The FundNIL
Soft Dollar Commissions The Investment Managers may enter into commission sharing arrangements only where there is a direct and identifiable benefit to the clients of the Investment Managers, including the SICAV, and where the Investment Managers are satisfied that the transactions generating the shared commissions are made in good faith, in strict compliance with applicable regulatory requirements and in the best interests of the SICAV and the Shareholders. Any such arrangements must be made by the Investment Manager on terms commensurate with best market practice. Due to their local regulatory rights, certain Investment Managers may make use of soft commission to pay for research or execution services. Other jurisdictions may have other arrangements in place to pay for such services in accordance with local regulatory obligations.
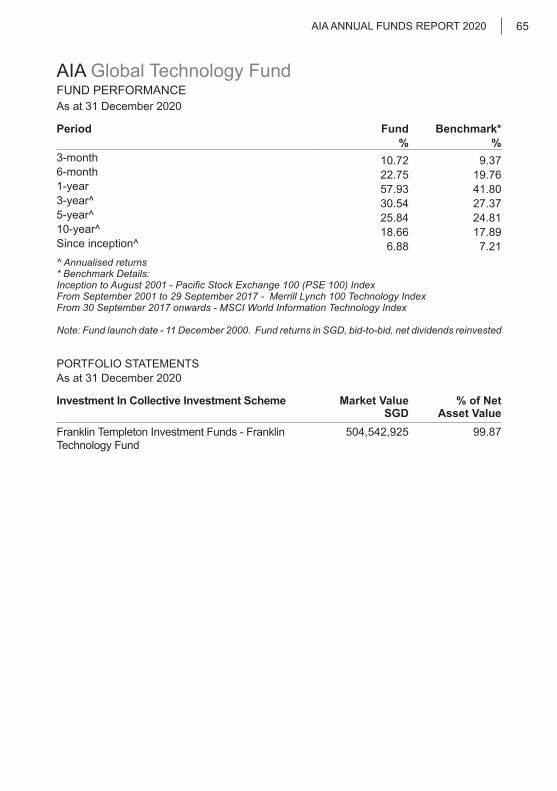
As at 31 December 2020
AIA ANNUAL FUNDS REPORT 2020 65
AIA Global Technology FundFUND PERFORMANCE
Period Fund Benchmark*% %
3-month 10.72 9.37 6-month 22.75 19.76 1-year 57.93 41.80 3-year^ 30.54 27.37 5-year^ 25.84 24.81 10-year^ 18.66 17.89 Since inception^ 6.88 7.21 ^ Annualised returns* Benchmark Details:Inception to August 2001 - Pacific Stock Exchange 100 (PSE 100) IndexFrom September 2001 to 29 September 2017 - Merrill Lynch 100 Technology IndexFrom 30 September 2017 onwards - MSCI World Information Technology Index
Note: Fund launch date - 11 December 2000. Fund returns in SGD, bid-to-bid, net dividends reinvested
PORTFOLIO STATEMENTSAs at 31 December 2020
Investment In Collective Investment Scheme Market Value SGD
% of Net Asset Value
Franklin Templeton Investment Funds - Franklin Technology Fund
504,542,925 99.87
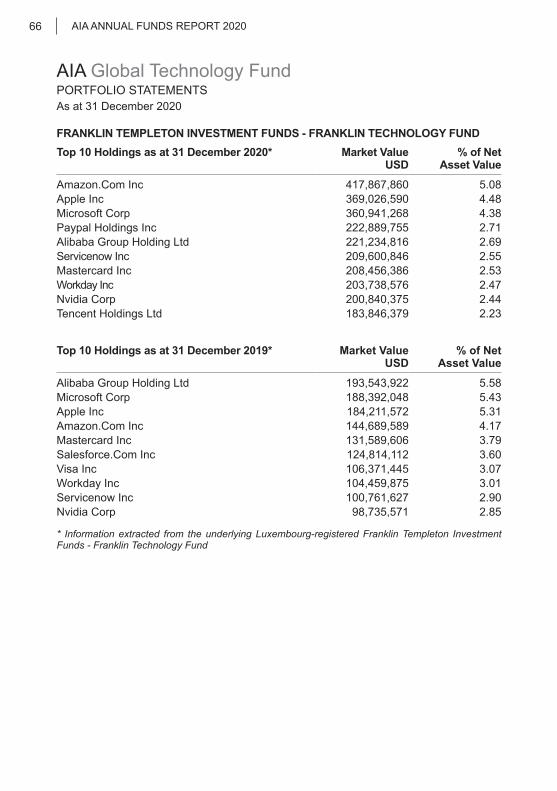
As at 31 December 2020
AIA ANNUAL FUNDS REPORT 202066
AIA Global Technology FundPORTFOLIO STATEMENTS
FRANKLIN TEMPLETON INVESTMENT FUNDS - FRANKLIN TECHNOLOGY FUNDTop 10 Holdings as at 31 December 2020* Market Value
USD % of Net
Asset Value
Amazon.Com Inc 417,867,860 5.08Apple Inc 369,026,590 4.48Microsoft Corp 360,941,268 4.38Paypal Holdings Inc 222,889,755 2.71Alibaba Group Holding Ltd 221,234,816 2.69Servicenow Inc 209,600,846 2.55Mastercard Inc 208,456,386 2.53Workday Inc 203,738,576 2.47Nvidia Corp 200,840,375 2.44Tencent Holdings Ltd 183,846,379 2.23
Top 10 Holdings as at 31 December 2019* Market Value USD
% of Net Asset Value
Alibaba Group Holding Ltd 193,543,922 5.58Microsoft Corp 188,392,048 5.43Apple Inc 184,211,572 5.31Amazon.Com Inc 144,689,589 4.17Mastercard Inc 131,589,606 3.79Salesforce.Com Inc 124,814,112 3.60Visa Inc 106,371,445 3.07Workday Inc 104,459,875 3.01Servicenow Inc 100,761,627 2.90Nvidia Corp 98,735,571 2.85
* Information extracted from the underlying Luxembourg-registered Franklin Templeton Investment Funds - Franklin Technology Fund

As at 31 December 2020
AIA ANNUAL FUNDS REPORT 2020 67
AIA Global Technology FundOTHER INFORMATION
Exposure To Derivatives Market ValueSGD
% of Net AssetValue
Realised Gains/
(Losses)SGD
Unrealised Gains/
(Losses) SGD
Forward foreign exchange contracts (2,700) - (209,991) (2,700)
BorrowingsN/A
Total Redemptions and Subscriptions SGDTotal amount of redemptions 146,413,814Total amount of subscriptions 247,120,857
Related-Party Transactions N/A
Expense Ratios 31 Dec 2020 31 Dec 2019Local Fund* 1.75% 1.75%Note: Expense ratio does not include (where applicable) charges for insurance coverage, brokerage
and other transaction costs, performance fee, foreign exchange gains/losses, front or back end loads arising from the purchase or sale of collective investment schemes and tax deducted at source or arising out of income received.
Underlying Fund: Franklin Templeton Investment Funds - Franklin Technology Fund** 1.84% 1.81%Note: Expense ratio does not include in brokerage and other transaction costs, performance fee,
foreign exchange gains/losses, front or back end loads arising from the purchase or sale of collective investment schemes and tax deducted at source or arising out of income received.
* Includes underlying fund expense ratio** Based on unaudited accounts
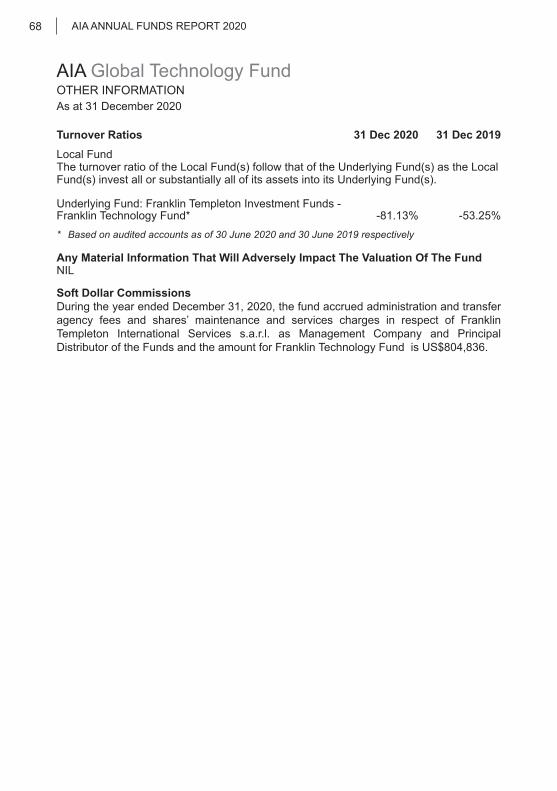
As at 31 December 2020
AIA ANNUAL FUNDS REPORT 202068
AIA Global Technology FundOTHER INFORMATION
Turnover Ratios 31 Dec 2020 31 Dec 2019 Local FundThe turnover ratio of the Local Fund(s) follow that of the Underlying Fund(s) as the Local Fund(s) invest all or substantially all of its assets into its Underlying Fund(s).
Underlying Fund: Franklin Templeton Investment Funds - Franklin Technology Fund* -81.13% -53.25%* Based on audited accounts as of 30 June 2020 and 30 June 2019 respectively
Any Material Information That Will Adversely Impact The Valuation Of The FundNIL
Soft Dollar CommissionsDuring the year ended December 31, 2020, the fund accrued administration and transfer agency fees and shares’ maintenance and services charges in respect of Franklin Templeton International Services s.a.r.l. as Management Company and Principal Distributor of the Funds and the amount for Franklin Technology Fund is US$804,836.

As at 31 December 2020
AIA ANNUAL FUNDS REPORT 2020 69
AIA Greater China Balanced/Equity FundFUND PERFORMANCE
AIA GREATER CHINA BALANCED FUND
Period Fund Benchmark*% %
3-month 6.83 6.35 6-month 13.94 12.79 1-year 19.60 18.85 3-year^ 8.46 8.43 5-year^ 10.74 10.25 10-year^ 7.16 6.62 Since inception^ 7.46 7.63 ^ Annualised returns* 60% MSCI Golden Dragon DTR Net & 40% JP Morgan Sing Govt Bond Index All
Disclaimer with regard to the above Benchmark:The blended returns are calculated by AIA Investment Management Private Limited using end of day index level values licensed from MSCI (“MSCI Data”). For the avoidance of doubt, MSCI is not the benchmark “administrator” for, or a “contributor”, “submitter” or “supervised contributor” to, the blended returns, and the MSCI Data is not considered a “contribution” or “submission” in relation to the blended returns, as those terms may be defined in any rules, laws, regulations, legislation or international standards. MSCI Data is provided “AS IS” without warranty or liability and no copying or distribution is permitted. MSCI does not make any representation regarding the advisability of any investment or strategy and does not sponsor, promote, issue, sell or otherwise recommend or endorse any investment or strategy, including any financial products or strategies based on, tracking or otherwise utilising any MSCI Data, models, analytics or other materials or information.
Note: Fund inception date - 21 January 2003. Fund returns in SGD, bid-to-bid, net dividends reinvested
AIA GREATER CHINA EQUITY FUND
Period Fund%
Benchmark*%
3-month 10.16 10.49 6-month 21.13 20.99 1-year 28.09 25.98 3-year^ 10.89 10.16 5-year^ 14.76 13.80 10-year^ 9.33 8.39 Since inception^ 9.75 9.94
^ Annualised returns* MSCI Golden Dragon DTR Net
Note: Fund inception date - 21 January 2003. Fund returns in SGD, bid-to-bid, net dividends reinvested
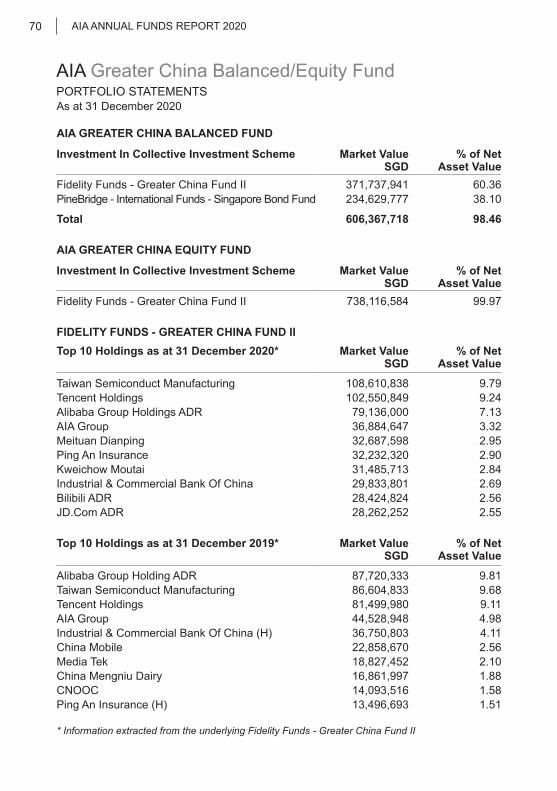
As at 31 December 2020
AIA ANNUAL FUNDS REPORT 202070
AIA Greater China Balanced/Equity FundPORTFOLIO STATEMENTS
AIA GREATER CHINA BALANCED FUND
Investment In Collective Investment Scheme Market Value SGD
% of NetAsset Value
Fidelity Funds - Greater China Fund II 371,737,941 60.36 PineBridge - International Funds - Singapore Bond Fund 234,629,777 38.10
Total 606,367,718 98.46
AIA GREATER CHINA EQUITY FUND
Investment In Collective Investment Scheme Market Value SGD
% of NetAsset Value
Fidelity Funds - Greater China Fund II 738,116,584 99.97
FIDELITY FUNDS - GREATER CHINA FUND IITop 10 Holdings as at 31 December 2020* Market Value
SGD % of Net
Asset Value
Taiwan Semiconduct Manufacturing 108,610,838 9.79Tencent Holdings 102,550,849 9.24Alibaba Group Holdings ADR 79,136,000 7.13AIA Group 36,884,647 3.32Meituan Dianping 32,687,598 2.95Ping An Insurance 32,232,320 2.90Kweichow Moutai 31,485,713 2.84Industrial & Commercial Bank Of China 29,833,801 2.69Bilibili ADR 28,424,824 2.56JD.Com ADR 28,262,252 2.55
Top 10 Holdings as at 31 December 2019* Market Value SGD
% of NetAsset Value
Alibaba Group Holding ADR 87,720,333 9.81Taiwan Semiconduct Manufacturing 86,604,833 9.68Tencent Holdings 81,499,980 9.11AIA Group 44,528,948 4.98Industrial & Commercial Bank Of China (H) 36,750,803 4.11China Mobile 22,858,670 2.56Media Tek 18,827,452 2.10China Mengniu Dairy 16,861,997 1.88CNOOC 14,093,516 1.58Ping An Insurance (H) 13,496,693 1.51
* Information extracted from the underlying Fidelity Funds - Greater China Fund II
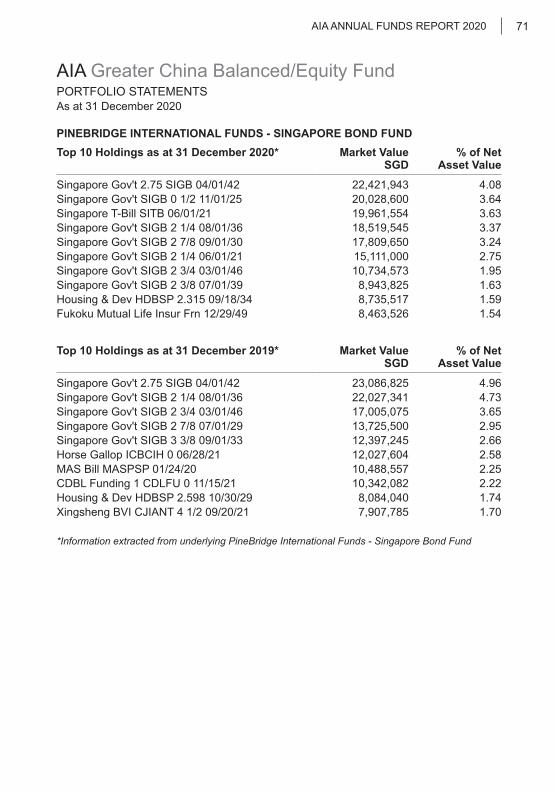
As at 31 December 2020
AIA ANNUAL FUNDS REPORT 2020 71
AIA Greater China Balanced/Equity FundPORTFOLIO STATEMENTS
PINEBRIDGE INTERNATIONAL FUNDS - SINGAPORE BOND FUNDTop 10 Holdings as at 31 December 2020* Market Value
SGD % of Net
Asset Value
Singapore Gov't 2.75 SIGB 04/01/42 22,421,943 4.08Singapore Gov't SIGB 0 1/2 11/01/25 20,028,600 3.64Singapore T-Bill SITB 06/01/21 19,961,554 3.63Singapore Gov't SIGB 2 1/4 08/01/36 18,519,545 3.37Singapore Gov't SIGB 2 7/8 09/01/30 17,809,650 3.24Singapore Gov't SIGB 2 1/4 06/01/21 15,111,000 2.75Singapore Gov't SIGB 2 3/4 03/01/46 10,734,573 1.95Singapore Gov't SIGB 2 3/8 07/01/39 8,943,825 1.63Housing & Dev HDBSP 2.315 09/18/34 8,735,517 1.59Fukoku Mutual Life Insur Frn 12/29/49 8,463,526 1.54
Top 10 Holdings as at 31 December 2019* Market Value SGD
% of NetAsset Value
Singapore Gov't 2.75 SIGB 04/01/42 23,086,825 4.96Singapore Gov't SIGB 2 1/4 08/01/36 22,027,341 4.73Singapore Gov't SIGB 2 3/4 03/01/46 17,005,075 3.65Singapore Gov't SIGB 2 7/8 07/01/29 13,725,500 2.95Singapore Gov't SIGB 3 3/8 09/01/33 12,397,245 2.66Horse Gallop ICBCIH 0 06/28/21 12,027,604 2.58MAS Bill MASPSP 01/24/20 10,488,557 2.25CDBL Funding 1 CDLFU 0 11/15/21 10,342,082 2.22Housing & Dev HDBSP 2.598 10/30/29 8,084,040 1.74Xingsheng BVI CJIANT 4 1/2 09/20/21 7,907,785 1.70
*Information extracted from underlying PineBridge International Funds - Singapore Bond Fund
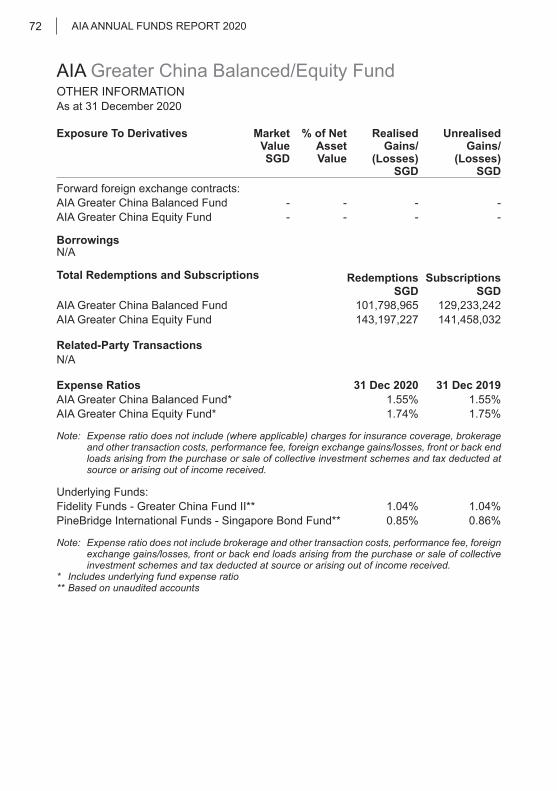
As at 31 December 2020
AIA ANNUAL FUNDS REPORT 202072
AIA Greater China Balanced/Equity FundOTHER INFORMATION
Exposure To Derivatives Market ValueSGD
% of Net AssetValue
Realised Gains/
(Losses)SGD
Unrealised Gains/
(Losses) SGD
Forward foreign exchange contracts:AIA Greater China Balanced Fund - - - - AIA Greater China Equity Fund - - - -
BorrowingsN/A
Total Redemptions and Subscriptions RedemptionsSGD
Subscriptions SGD
AIA Greater China Balanced Fund 101,798,965 129,233,242 AIA Greater China Equity Fund 143,197,227 141,458,032
Related-Party Transactions N/A
Expense Ratios 31 Dec 2020 31 Dec 2019AIA Greater China Balanced Fund* 1.55% 1.55%AIA Greater China Equity Fund* 1.74% 1.75%
Note: Expense ratio does not include (where applicable) charges for insurance coverage, brokerage and other transaction costs, performance fee, foreign exchange gains/losses, front or back end loads arising from the purchase or sale of collective investment schemes and tax deducted at source or arising out of income received.
Underlying Funds:Fidelity Funds - Greater China Fund II** 1.04% 1.04%PineBridge International Funds - Singapore Bond Fund** 0.85% 0.86%
Note: Expense ratio does not include brokerage and other transaction costs, performance fee, foreign exchange gains/losses, front or back end loads arising from the purchase or sale of collective investment schemes and tax deducted at source or arising out of income received.
* Includes underlying fund expense ratio** Based on unaudited accounts

As at 31 December 2020
AIA ANNUAL FUNDS REPORT 2020 73
AIA Greater China Balanced/Equity FundOTHER INFORMATION
Turnover Ratios 31 Dec 2020 31 Dec 2019 Local Funds:The turnover ratio of the Local Fund(s) follow that of the Underlying Fund(s) as the Local Fund(s) invest all or substantially all of its assets into its Underlying Fund(s).
Underlying Funds:Fidelity Funds - Greater China Fund II** 50.08% 38.58%PineBridge International Funds - Singapore Bond Fund** 79.02% 83.13%** Based on unaudited accounts
Any Material Information That Will Adversely Impact The Valuation Of The FundNIL
Soft Dollar CommissionsThere is no soft dollar commission for the PineBridge International Funds - Singapore Bond Fund.
Soft dollar commission for Fidelity Funds - Greater China Fund II: The Investment Manager and any of its delegates may effect transactions by or through the agency of another person with whom the Investment Manager and any of its delegates have an arrangement under which that party will from time to time provide to or procure for the Investment Manager and any of its delegates goods, services or other benefits (such as research and advisory services, where permitted by regulation only), the nature of which is such that their provision can reasonably be expected to benefit the Fund as a whole and may contribute to an improvement in the performance of the Fund and that of the Investment Manager or any of its delegates in providing services to the Fund and for which no direct payment is made but instead the Investment Manager and any of its delegates undertake to place business with that party. For the avoidance of doubt, such goods and services do not include travel, accommodation, entertainment, general administrative goods or services, general office equipment or premises, membership fees, employee salaries or direct money payments. The Investment Manager and any of its delegates shall not retain the benefit of any cash commission rebate (being repayment of a cash commission made by a broker or dealer to the Investment Manager and/or any delegates) paid or payable from any such broker or dealer in respect of any business placed with such broker or dealer by the Investment Manager or any of its delegates for or on behalf the Fund. Any such cash commission rebate from any such broker or dealer will be held by the Investment Manager and any of its delegates for the account of the Fund. Brokerage rates will not be excessive of customary brokerage rates. All transactions will be done with best execution. Due to rounding, numbers presented throughout this report and other documents may not add up precisely to the totals provided and percentages may not precisely reflect the absolute figures.

As at 31 December 2020
AIA ANNUAL FUNDS REPORT 202074
AIA Growth FundFUND PERFORMANCE
Period Fund Benchmark*% %
3-month 12.03 10.73 6-month 9.31 8.61 1-year (3.36) (3.38)3-year^ 0.55 0.82 5-year^ 4.40 4.70 10-year^ 2.26 2.91 Since inception^ 4.37 3.52
^ Annualised returns* Benchmark Details:Inception to December 1997 - 80% Customised Equity Index (80% SESALL + 20% MSCI Singapore) 20% 1 mth SIBOR (mid)January 1998 to August 1998 - 50% MSCI Singapore + 30% MSCI Malaysia (SGD) + 20% 1 mth SIBOR (bid)September 1998 to November 1999 - 80% MSCI Singapore + 20% 1 mth SIBOR (bid)December 1999 to 11 April 2001 - 80% SES AII Index + 20% 1 mth SIBOR (bid)From 12 April 2001 onwards - 70% SES AII Index (Price Return) & 30% JP Morgan Sing Govt Bond Index AIlFrom 1 July 2006 onwards - 70% FTSE Singapore Total Return & 30% JP Morgan Sing Govt Bond Index AllFrom 24 October 2014 onwards - 70% MSCI Singapore & 30% JP Morgan Sing Govt Bond Index All
Disclaimer with regard to the above Benchmark:The blended returns are calculated by AIA Investment Management Private Limited using end of day index level values licensed from MSCI (“MSCI Data”). For the avoidance of doubt, MSCI is not the benchmark “administrator” for, or a “contributor”, “submitter” or “supervised contributor” to, the blended returns, and the MSCI Data is not considered a “contribution” or “submission” in relation to the blended returns, as those terms may be defined in any rules, laws, regulations, legislation or international standards. MSCI Data is provided “AS IS” without warranty or liability and no copying or distribution is permitted. MSCI does not make any representation regarding the advisability of any investment or strategy and does not sponsor, promote, issue, sell or otherwise recommend or endorse any investment or strategy, including any financial products or strategies based on, tracking or otherwiseutilizing any MSCI Data, models, analytics or other materials or information.
Note: Fund inception date - 12 September 1995. Fund returns in SGD, bid-to-bid, net dividends reinvested
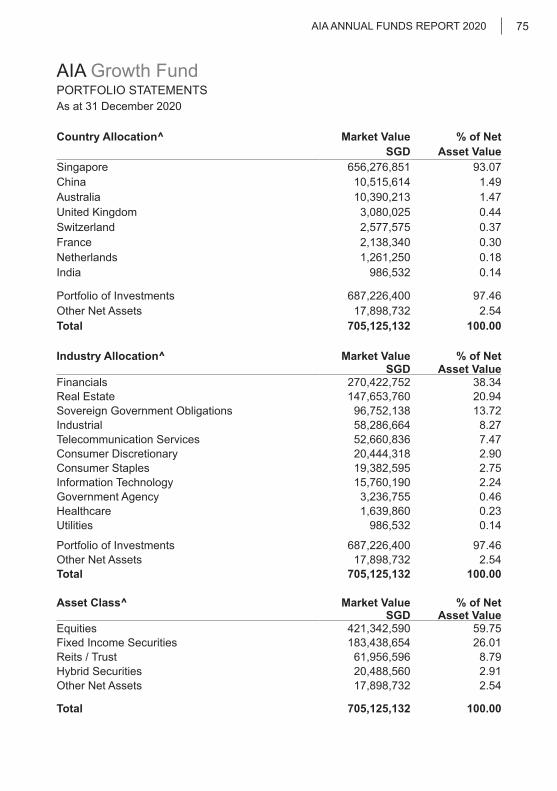
As at 31 December 2020
AIA ANNUAL FUNDS REPORT 2020 75
AIA Growth FundPORTFOLIO STATEMENTS
Country Allocation^ Market Value % of Net SGD Asset Value
Singapore 656,276,851 93.07 China 10,515,614 1.49 Australia 10,390,213 1.47 United Kingdom 3,080,025 0.44 Switzerland 2,577,575 0.37 France 2,138,340 0.30 Netherlands 1,261,250 0.18 India 986,532 0.14
Portfolio of Investments 687,226,400 97.46 Other Net Assets 17,898,732 2.54 Total 705,125,132 100.00
Industry Allocation^ Market Value % of Net SGD Asset Value
Financials 270,422,752 38.34 Real Estate 147,653,760 20.94 Sovereign Government Obligations 96,752,138 13.72 Industrial 58,286,664 8.27 Telecommunication Services 52,660,836 7.47 Consumer Discretionary 20,444,318 2.90 Consumer Staples 19,382,595 2.75 Information Technology 15,760,190 2.24 Government Agency 3,236,755 0.46 Healthcare 1,639,860 0.23 Utilities 986,532 0.14
Portfolio of Investments 687,226,400 97.46Other Net Assets 17,898,732 2.54 Total 705,125,132 100.00
Asset Class^ Market Value % of Net SGD Asset Value
Equities 421,342,590 59.75Fixed Income Securities 183,438,654 26.01Reits / Trust 61,956,596 8.79Hybrid Securities 20,488,560 2.91Other Net Assets 17,898,732 2.54
Total 705,125,132 100.00
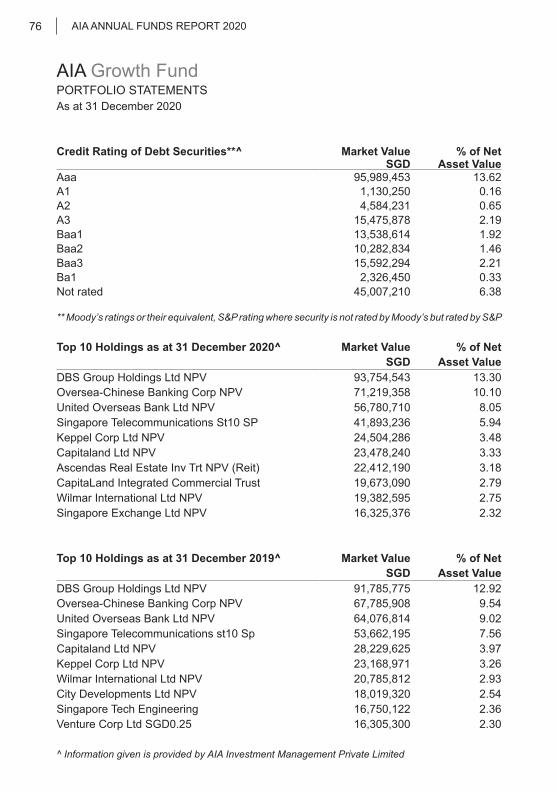
As at 31 December 2020
AIA ANNUAL FUNDS REPORT 202076
AIA Growth FundPORTFOLIO STATEMENTS
Credit Rating of Debt Securities**^ Market Value % of Net SGD Asset Value
Aaa 95,989,453 13.62A1 1,130,250 0.16A2 4,584,231 0.65A3 15,475,878 2.19Baa1 13,538,614 1.92Baa2 10,282,834 1.46Baa3 15,592,294 2.21Ba1 2,326,450 0.33Not rated 45,007,210 6.38
** Moody’s ratings or their equivalent, S&P rating where security is not rated by Moody’s but rated by S&P
Top 10 Holdings as at 31 December 2020^ Market Value % of Net SGD Asset Value
DBS Group Holdings Ltd NPV 93,754,543 13.30Oversea-Chinese Banking Corp NPV 71,219,358 10.10United Overseas Bank Ltd NPV 56,780,710 8.05Singapore Telecommunications St10 SP 41,893,236 5.94Keppel Corp Ltd NPV 24,504,286 3.48Capitaland Ltd NPV 23,478,240 3.33Ascendas Real Estate Inv Trt NPV (Reit) 22,412,190 3.18CapitaLand Integrated Commercial Trust 19,673,090 2.79Wilmar International Ltd NPV 19,382,595 2.75Singapore Exchange Ltd NPV 16,325,376 2.32
Top 10 Holdings as at 31 December 2019^ Market Value % of Net SGD Asset Value
DBS Group Holdings Ltd NPV 91,785,775 12.92Oversea-Chinese Banking Corp NPV 67,785,908 9.54United Overseas Bank Ltd NPV 64,076,814 9.02Singapore Telecommunications st10 Sp 53,662,195 7.56Capitaland Ltd NPV 28,229,625 3.97Keppel Corp Ltd NPV 23,168,971 3.26Wilmar International Ltd NPV 20,785,812 2.93City Developments Ltd NPV 18,019,320 2.54Singapore Tech Engineering 16,750,122 2.36Venture Corp Ltd SGD0.25 16,305,300 2.30
^ Information given is provided by AIA Investment Management Private Limited
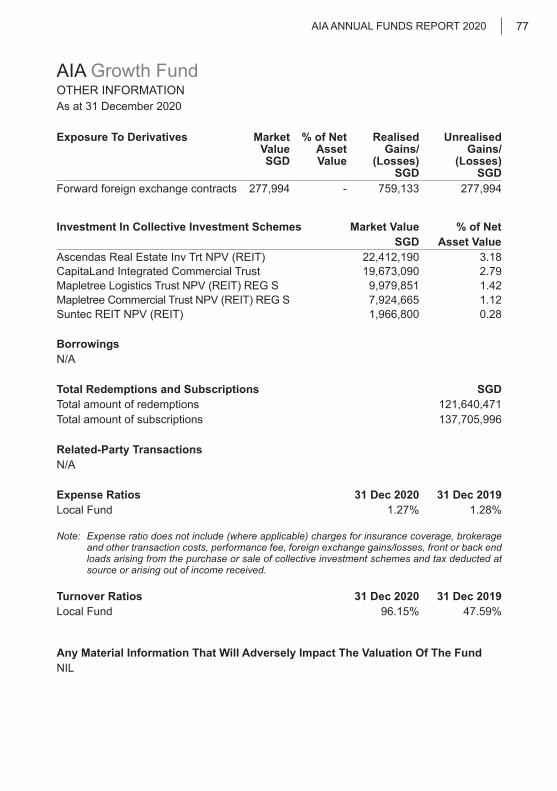
As at 31 December 2020
AIA ANNUAL FUNDS REPORT 2020 77
AIA Growth FundOTHER INFORMATION
Exposure To Derivatives Market Value SGD
% of NetAsset Value
Realised Gains/
(Losses) SGD
Unrealised Gains/
(Losses) SGD
Forward foreign exchange contracts 277,994 - 759,133 277,994
Investment In Collective Investment Schemes Market Value % of Net SGD Asset Value
Ascendas Real Estate Inv Trt NPV (REIT) 22,412,190 3.18CapitaLand Integrated Commercial Trust 19,673,090 2.79Mapletree Logistics Trust NPV (REIT) REG S 9,979,851 1.42Mapletree Commercial Trust NPV (REIT) REG S 7,924,665 1.12Suntec REIT NPV (REIT) 1,966,800 0.28
BorrowingsN/A
Total Redemptions and Subscriptions SGDTotal amount of redemptions 121,640,471Total amount of subscriptions 137,705,996
Related-Party Transactions N/A
Expense Ratios 31 Dec 2020 31 Dec 2019Local Fund 1.27% 1.28%
Note: Expense ratio does not include (where applicable) charges for insurance coverage, brokerage and other transaction costs, performance fee, foreign exchange gains/losses, front or back end loads arising from the purchase or sale of collective investment schemes and tax deducted at source or arising out of income received.
Turnover Ratios 31 Dec 2020 31 Dec 2019Local Fund 96.15% 47.59%
Any Material Information That Will Adversely Impact The Valuation Of The FundNIL
As at 31 December 2020
AIA ANNUAL FUNDS REPORT 202078
AIA Growth FundOTHER INFORMATION
Soft Dollar CommissionsIn the management of the Fund, the Investment Manager may enter into soft dollar arrangements (“Soft Dollars”) with brokers who execute trades on behalf of the Fund. “Soft” commission relates to services to facilitate portfolio management including but not limited to:
(i) Research and advisory services;(ii) Portfolio analyses, including valuation and performance;(iii) Market analyses;(iv) Data and quotation services;(v) Computer hardware and software or any other information facilities to the extent that
they are used to support the investment decision making process, the giving of advice, or the conduct of research or analysis.
The Investment Manager may not engage in Soft Dollars unless:
(a) such Soft Dollars shall assist the Investment Manager in their management of the Fund,(b) transactions are executed on the best available terms, taking into account the market at
the time for transactions of the kind and size concerned, and(c) that no unnecessary trades are entered into to achieve a sufficient volume of
transactions to qualify for Soft Dollars.
The following good and services are not permitted as Soft Dollars:
• Travel• Accommodation• Entertainment• General administrative goods and services• General office equipment or premises• Membership fees• Employee salaries or direct money payment

As at 31 December 2020
AIA ANNUAL FUNDS REPORT 2020 79
AIA India Balanced/Opportunities FundFUND PERFORMANCE
AIA INDIA BALANCED FUND
Period Fund Benchmark*% %
3-month 12.51 10.28 6-month 17.31 18.85 1-year 10.82 12.90 3-year^ 4.54 5.35 5-year^ 6.20 7.06 10-year^ 5.21 4.10 Since inception^ 6.14 6.49
^ Annualised returns* 60% MSCI India Index & 40% JP Morgan Sing Govt Bond Index All
Disclaimer with regard to the above Benchmark:The blended returns are calculated by AIA Investment Management Private Limited using end of day index level values licensed from MSCI (“MSCI Data”). For the avoidance of doubt, MSCI is not the benchmark “administrator” for, or a “contributor”, “submitter” or “supervised contributor” to, the blended returns, and the MSCI Data is not considered a “contribution” or “submission” in relation to the blended returns, as those terms may be defined in any rules, laws, regulations, legislation or international standards. MSCI Data is provided “AS IS” without warranty or liability and no copying or distribution is permitted. MSCI does not make any representation regarding the advisability of any investment or strategy and does not sponsor, promote, issue, sell or otherwise recommend or endorse any investment or strategy, including any financial products or strategies based on, tracking or otherwiseutilising any MSCI Data, models, analytics or other materials or information.
Note: Fund inception date - 10 August 2005. Fund returns in SGD, bid-to-bid, net dividends reinvested
AIA INDIA OPPORTUNITIES FUND
Period Fund Benchmark*% %
3-month 20.22 17.31 6-month 27.67 32.14 1-year 12.29 13.91 3-year^ 4.07 4.55 5-year^ 7.01 8.05 10-year^ 5.94 3.74 Since inception^ 7.29 6.81
^ Annualised returns* MSCI India Index
Note: Fund inception date - 06 December 2005. Fund returns in SGD, bid-to-bid, net dividends reinvested
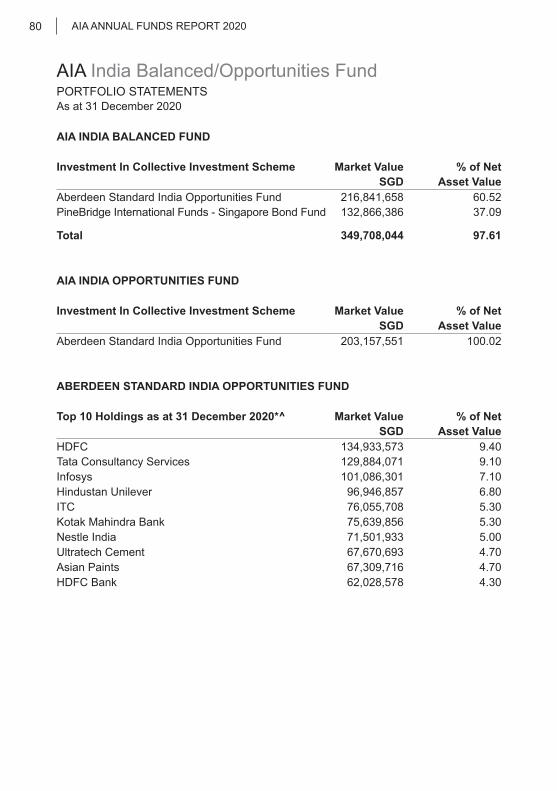
As at 31 December 2020
AIA ANNUAL FUNDS REPORT 202080
AIA India Balanced/Opportunities FundPORTFOLIO STATEMENTS
AIA INDIA BALANCED FUND
Investment In Collective Investment Scheme Market Value % of NetSGD Asset Value
Aberdeen Standard India Opportunities Fund 216,841,658 60.52 PineBridge International Funds - Singapore Bond Fund 132,866,386 37.09
Total 349,708,044 97.61
AIA INDIA OPPORTUNITIES FUND
Investment In Collective Investment Scheme Market Value % of NetSGD Asset Value
Aberdeen Standard India Opportunities Fund 203,157,551 100.02
ABERDEEN STANDARD INDIA OPPORTUNITIES FUND
Top 10 Holdings as at 31 December 2020*^ Market Value % of Net SGD Asset Value
HDFC 134,933,573 9.40Tata Consultancy Services 129,884,071 9.10Infosys 101,086,301 7.10Hindustan Unilever 96,946,857 6.80ITC 76,055,708 5.30Kotak Mahindra Bank 75,639,856 5.30Nestle India 71,501,933 5.00Ultratech Cement 67,670,693 4.70Asian Paints 67,309,716 4.70HDFC Bank 62,028,578 4.30
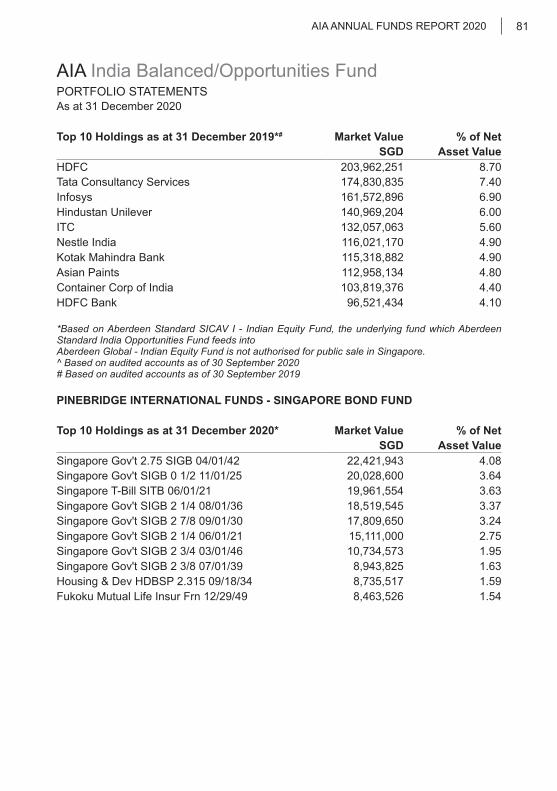
As at 31 December 2020
AIA ANNUAL FUNDS REPORT 2020 81
AIA India Balanced/Opportunities FundPORTFOLIO STATEMENTS
Top 10 Holdings as at 31 December 2019*# Market Value % of Net SGD Asset Value
HDFC 203,962,251 8.70Tata Consultancy Services 174,830,835 7.40Infosys 161,572,896 6.90Hindustan Unilever 140,969,204 6.00ITC 132,057,063 5.60Nestle India 116,021,170 4.90Kotak Mahindra Bank 115,318,882 4.90Asian Paints 112,958,134 4.80Container Corp of India 103,819,376 4.40HDFC Bank 96,521,434 4.10
*Based on Aberdeen Standard SICAV I - Indian Equity Fund, the underlying fund which Aberdeen Standard India Opportunities Fund feeds intoAberdeen Global - Indian Equity Fund is not authorised for public sale in Singapore.^ Based on audited accounts as of 30 September 2020# Based on audited accounts as of 30 September 2019
PINEBRIDGE INTERNATIONAL FUNDS - SINGAPORE BOND FUND
Top 10 Holdings as at 31 December 2020* Market Value % of Net SGD Asset Value
Singapore Gov't 2.75 SIGB 04/01/42 22,421,943 4.08Singapore Gov't SIGB 0 1/2 11/01/25 20,028,600 3.64Singapore T-Bill SITB 06/01/21 19,961,554 3.63Singapore Gov't SIGB 2 1/4 08/01/36 18,519,545 3.37Singapore Gov't SIGB 2 7/8 09/01/30 17,809,650 3.24Singapore Gov't SIGB 2 1/4 06/01/21 15,111,000 2.75Singapore Gov't SIGB 2 3/4 03/01/46 10,734,573 1.95Singapore Gov't SIGB 2 3/8 07/01/39 8,943,825 1.63Housing & Dev HDBSP 2.315 09/18/34 8,735,517 1.59Fukoku Mutual Life Insur Frn 12/29/49 8,463,526 1.54
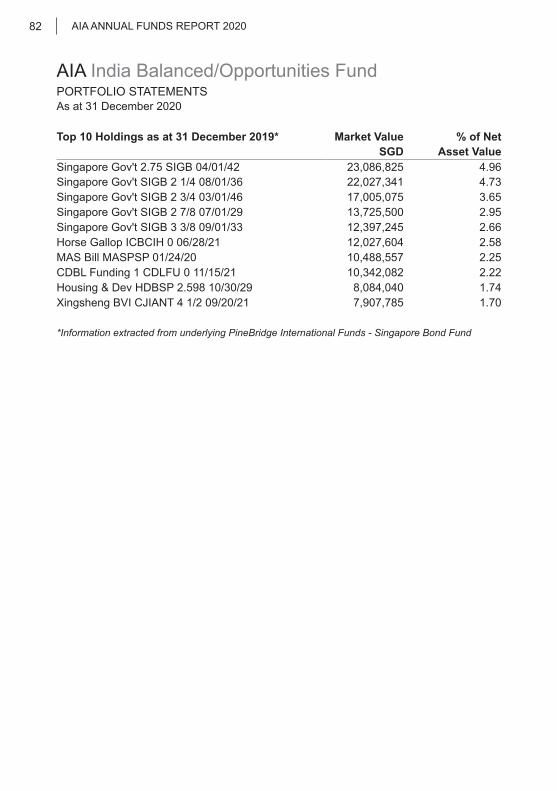
As at 31 December 2020
AIA ANNUAL FUNDS REPORT 202082
AIA India Balanced/Opportunities FundPORTFOLIO STATEMENTS
Top 10 Holdings as at 31 December 2019* Market Value % of Net SGD Asset Value
Singapore Gov't 2.75 SIGB 04/01/42 23,086,825 4.96Singapore Gov't SIGB 2 1/4 08/01/36 22,027,341 4.73Singapore Gov't SIGB 2 3/4 03/01/46 17,005,075 3.65Singapore Gov't SIGB 2 7/8 07/01/29 13,725,500 2.95Singapore Gov't SIGB 3 3/8 09/01/33 12,397,245 2.66Horse Gallop ICBCIH 0 06/28/21 12,027,604 2.58MAS Bill MASPSP 01/24/20 10,488,557 2.25CDBL Funding 1 CDLFU 0 11/15/21 10,342,082 2.22Housing & Dev HDBSP 2.598 10/30/29 8,084,040 1.74Xingsheng BVI CJIANT 4 1/2 09/20/21 7,907,785 1.70
*Information extracted from underlying PineBridge International Funds - Singapore Bond Fund
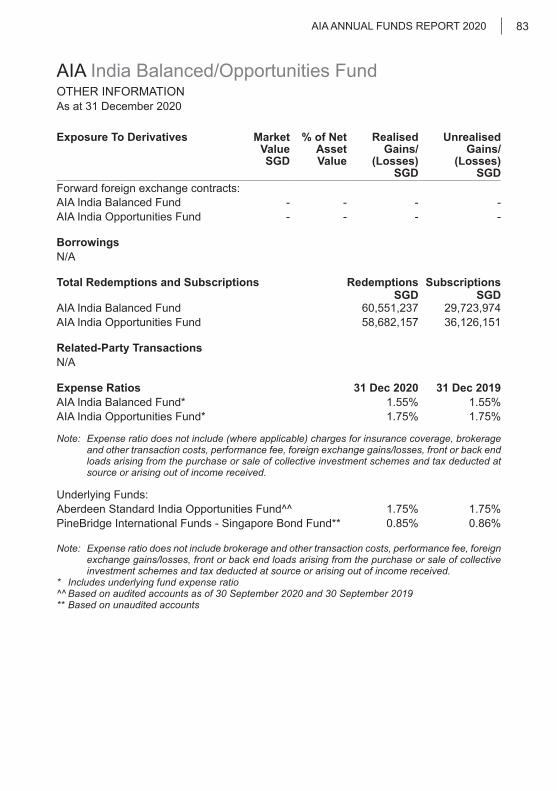
As at 31 December 2020
AIA ANNUAL FUNDS REPORT 2020 83
AIA India Balanced/Opportunities FundOTHER INFORMATION
Exposure To Derivatives Market Value SGD
% of NetAsset Value
Realised Gains/
(Losses) SGD
Unrealised Gains/
(Losses) SGD
Forward foreign exchange contracts:AIA India Balanced Fund - - - - AIA India Opportunities Fund - - - -
BorrowingsN/A
Total Redemptions and Subscriptions Redemptions SubscriptionsSGD SGD
AIA India Balanced Fund 60,551,237 29,723,974 AIA India Opportunities Fund 58,682,157 36,126,151
Related-Party TransactionsN/A
Expense Ratios 31 Dec 2020 31 Dec 2019AIA India Balanced Fund* 1.55% 1.55%AIA India Opportunities Fund* 1.75% 1.75%
Note: Expense ratio does not include (where applicable) charges for insurance coverage, brokerage and other transaction costs, performance fee, foreign exchange gains/losses, front or back end loads arising from the purchase or sale of collective investment schemes and tax deducted at source or arising out of income received.
Underlying Funds:Aberdeen Standard India Opportunities Fund^^ 1.75% 1.75%PineBridge International Funds - Singapore Bond Fund** 0.85% 0.86%
Note: Expense ratio does not include brokerage and other transaction costs, performance fee, foreign exchange gains/losses, front or back end loads arising from the purchase or sale of collective investment schemes and tax deducted at source or arising out of income received.
* Includes underlying fund expense ratio ^^ Based on audited accounts as of 30 September 2020 and 30 September 2019** Based on unaudited accounts
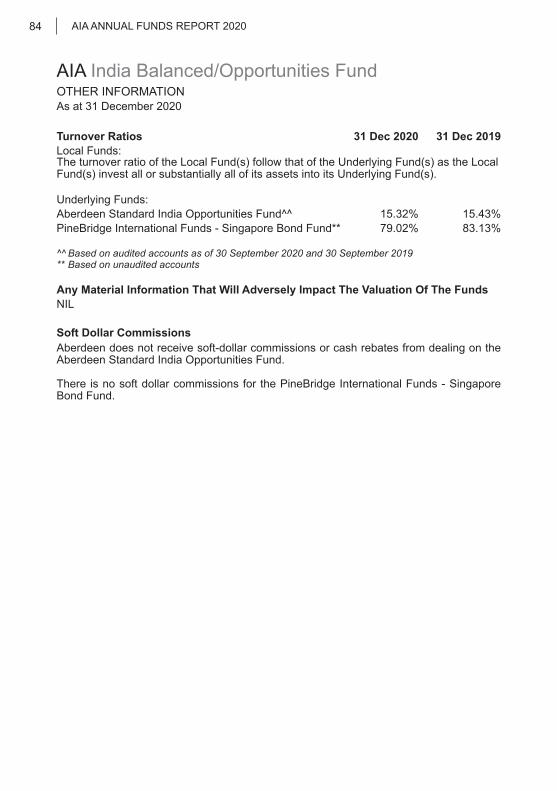
As at 31 December 2020
AIA ANNUAL FUNDS REPORT 202084
AIA India Balanced/Opportunities FundOTHER INFORMATION
Turnover Ratios 31 Dec 2020 31 Dec 2019 Local Funds: The turnover ratio of the Local Fund(s) follow that of the Underlying Fund(s) as the Local Fund(s) invest all or substantially all of its assets into its Underlying Fund(s).
Underlying Funds:Aberdeen Standard India Opportunities Fund^^ 15.32% 15.43%PineBridge International Funds - Singapore Bond Fund** 79.02% 83.13%
^^ Based on audited accounts as of 30 September 2020 and 30 September 2019** Based on unaudited accounts
Any Material Information That Will Adversely Impact The Valuation Of The FundsNIL
Soft Dollar CommissionsAberdeen does not receive soft-dollar commissions or cash rebates from dealing on the Aberdeen Standard India Opportunities Fund.
There is no soft dollar commissions for the PineBridge International Funds - Singapore Bond Fund.
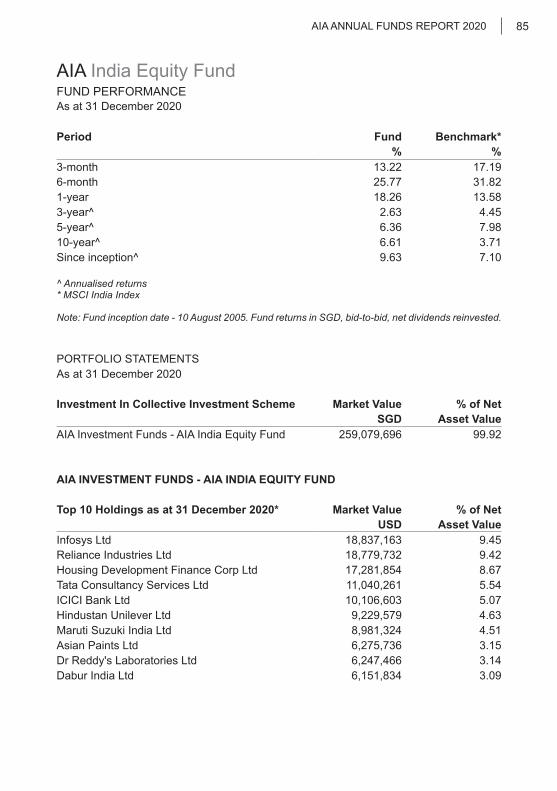
As at 31 December 2020
AIA ANNUAL FUNDS REPORT 2020 85
AIA India Equity FundFUND PERFORMANCE
Period Fund Benchmark*% %
3-month 13.22 17.19 6-month 25.77 31.82 1-year 18.26 13.58 3-year^ 2.63 4.45 5-year^ 6.36 7.98 10-year^ 6.61 3.71 Since inception^ 9.63 7.10
^ Annualised returns* MSCI India Index
Note: Fund inception date - 10 August 2005. Fund returns in SGD, bid-to-bid, net dividends reinvested.
PORTFOLIO STATEMENTS As at 31 December 2020
Investment In Collective Investment Scheme Market Value % of NetSGD Asset Value
AIA Investment Funds - AIA India Equity Fund 259,079,696 99.92
AIA INVESTMENT FUNDS - AIA INDIA EQUITY FUND
Top 10 Holdings as at 31 December 2020* Market Value % of Net USD Asset Value
Infosys Ltd 18,837,163 9.45Reliance Industries Ltd 18,779,732 9.42Housing Development Finance Corp Ltd 17,281,854 8.67Tata Consultancy Services Ltd 11,040,261 5.54ICICI Bank Ltd 10,106,603 5.07Hindustan Unilever Ltd 9,229,579 4.63Maruti Suzuki India Ltd 8,981,324 4.51Asian Paints Ltd 6,275,736 3.15Dr Reddy's Laboratories Ltd 6,247,466 3.14Dabur India Ltd 6,151,834 3.09
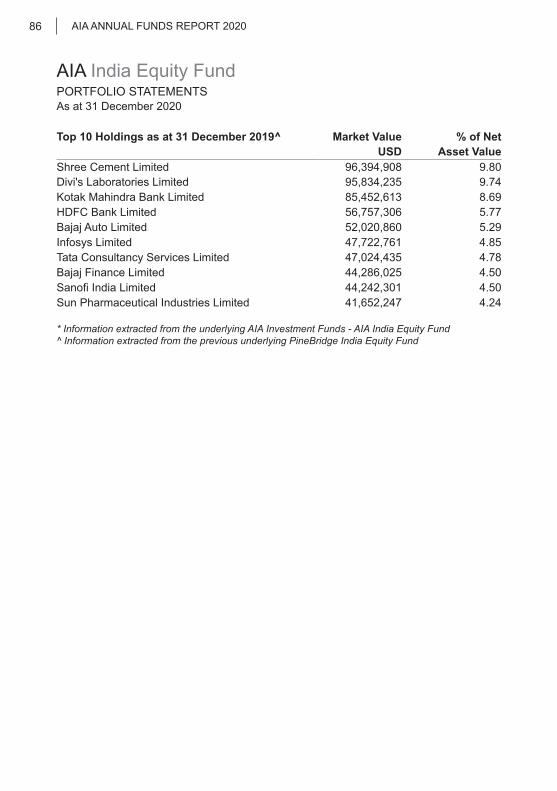
As at 31 December 2020
AIA ANNUAL FUNDS REPORT 202086
AIA India Equity FundPORTFOLIO STATEMENTS
Top 10 Holdings as at 31 December 2019^ Market Value % of Net USD Asset Value
Shree Cement Limited 96,394,908 9.80Divi's Laboratories Limited 95,834,235 9.74Kotak Mahindra Bank Limited 85,452,613 8.69HDFC Bank Limited 56,757,306 5.77Bajaj Auto Limited 52,020,860 5.29Infosys Limited 47,722,761 4.85Tata Consultancy Services Limited 47,024,435 4.78Bajaj Finance Limited 44,286,025 4.50Sanofi India Limited 44,242,301 4.50Sun Pharmaceutical Industries Limited 41,652,247 4.24
* Information extracted from the underlying AIA Investment Funds - AIA India Equity Fund^ Information extracted from the previous underlying PineBridge India Equity Fund
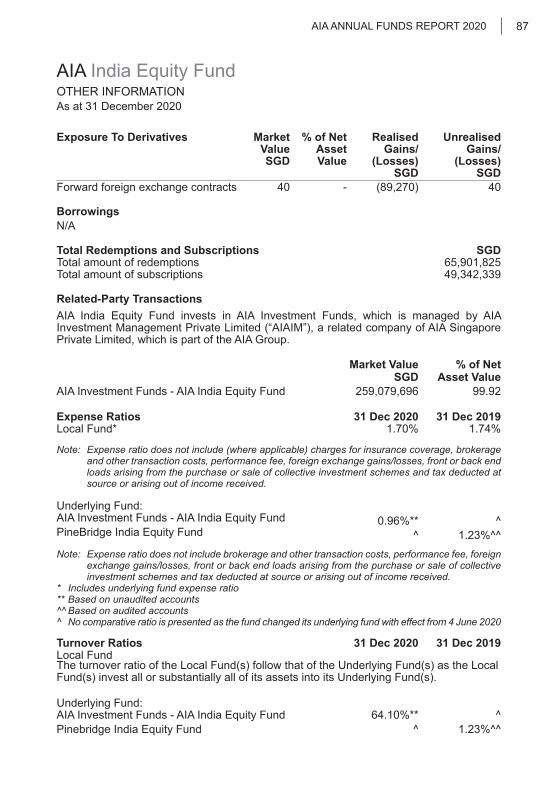
As at 31 December 2020
AIA ANNUAL FUNDS REPORT 2020 87
AIA India Equity FundOTHER INFORMATION
Exposure To Derivatives Market Value SGD
% of NetAsset Value
Realised Gains/
(Losses) SGD
Unrealised Gains/
(Losses) SGD
Forward foreign exchange contracts 40 - (89,270) 40
BorrowingsN/A
Total Redemptions and Subscriptions SGDTotal amount of redemptions 65,901,825Total amount of subscriptions 49,342,339
Related-Party Transactions AIA India Equity Fund invests in AIA Investment Funds, which is managed by AIA Investment Management Private Limited (“AIAIM”), a related company of AIA Singapore Private Limited, which is part of the AIA Group.
Market Value SGD
% of NetAsset Value
AIA Investment Funds - AIA India Equity Fund 259,079,696 99.92
Expense Ratios 31 Dec 2020 31 Dec 2019Local Fund* 1.70% 1.74%
Note: Expense ratio does not include (where applicable) charges for insurance coverage, brokerage and other transaction costs, performance fee, foreign exchange gains/losses, front or back end loads arising from the purchase or sale of collective investment schemes and tax deducted at source or arising out of income received.
Underlying Fund:AIA Investment Funds - AIA India Equity Fund 0.96%** ^PineBridge India Equity Fund ^ 1.23%^^Note: Expense ratio does not include brokerage and other transaction costs, performance fee, foreign
exchange gains/losses, front or back end loads arising from the purchase or sale of collective investment schemes and tax deducted at source or arising out of income received.
* Includes underlying fund expense ratio** Based on unaudited accounts ^^ Based on audited accounts^ No comparative ratio is presented as the fund changed its underlying fund with effect from 4 June 2020
Turnover Ratios 31 Dec 2020 31 Dec 2019 Local FundThe turnover ratio of the Local Fund(s) follow that of the Underlying Fund(s) as the Local Fund(s) invest all or substantially all of its assets into its Underlying Fund(s).
Underlying Fund:AIA Investment Funds - AIA India Equity Fund 64.10%** ^Pinebridge India Equity Fund ^ 1.23%^^

As at 31 December 2020
AIA ANNUAL FUNDS REPORT 202088
** Based on unaudited accounts ^ No comparative ratio is presented as the fund changed its underlying fund with effect from 4 June 2020^^ Based on audited accounts
Any Material Information That Will Adversely Impact The Valuation Of The FundNIL
Soft Dollar CommissionsNone of the Management Company, the Investment Manager, the Sub-Investment Manager or any of their connected persons will retain cash or other rebates from brokers or dealers in consideration of directing transactions for a Sub-Fund to such brokers or dealers, save that goods and services (soft dollars) as described in the paragraph below may be retained.
Any such cash commission or rebates received from any such brokers or dealers shall be for the account of the relevant Sub-Fund and entered into in the best interests of the Fund and the shareholders (taken as a body and in their capacity as such).
The Management Company, the Investment Manager, the Sub-Investment Manager and/or any of their connected persons reserves the right to effect transactions by or through a broker or dealer, which are legal entities (as opposed to individuals), with whom the Management Company, the Investment Manager, the Sub-Investment Manager and/or any of their connected persons has an arrangement under which that broker or dealer will from time to time provide to or procure for the Management Company, the Investment Manager, the Sub-Investment Manager and/or any of their connected persons goods or services for which no direct payment is made but instead the Management Company, the Investment Manager, the Sub-Investment Manager and/or any of their connected persons undertakes to place business with that broker or dealer.
The Investment Manager shall procure that no such arrangements are entered into unless (i) the goods and services to be provided pursuant thereto are of demonstrable benefit to the shareholders (taken as a body and in their capacity as such) whether by assisting the Management Company, the Investment Manager and/or the Sub-Investment Manager in their ability to manage the relevant Sub-Fund or otherwise; (ii) the transaction execution is consistent with best execution standards and brokerage rates are not in excess of customary institutional full-service brokerage rates; (iii) periodic disclosure is made in the annual report of the Fund or the relevant Sub-Fund in the form of a statement describing the soft dollar policies and practices of the Management Company, the Investment Manager or the Sub-Investment Manager, including a description of goods and services received by them; and (iv) the availability of soft dollar arrangements is not the sole or primary purpose to perform or arrange transaction with such broker or dealer.
Such goods and services may include research and advisory services, economic and political analysis, portfolio analysis including valuation and performance measurement, market analysis, data and quotation services, computer hardware and software incidental to the above goods and services, clearing and custodian services and investment-related publications. For the avoidance of doubt, such goods and services do not include travel, accommodation, entertainment, general administrative goods or services, general office equipment or premises, membership fees, employee salaries or direct money payments.
AIA India Equity FundOTHER INFORMATION

As at 31 December 2020
AIA ANNUAL FUNDS REPORT 2020 89
AIA International Health Care FundFUND PERFORMANCE
Period Fund Benchmark*% %
3-month 3.07 3.43 6-month 7.35 6.05 1-year 16.16 11.58 3-year^ 13.57 12.36 5-year^ 10.48 8.22 10-year^ 13.17 12.71 Since inception^ 5.25 4.22
^ Annualised returns* MSCI World Health Care Index
Note: Fund launch date - 12 March 2001. Fund returns in SGD, bid-to-bid, net dividends reinvested
PORTFOLIO STATEMENTSAs at 31 December 2020
Investment In Collective Investment Scheme Market Value % of NetSGD Asset Value
AB SICAV I - International Health Care Portfolio 105,540,561 99.89
AB SICAV I - INTERNATIONAL HEALTH CARE PORTFOLIO
Top 10 Holdings as at 31 December 2020* Market Value % of Net USD Asset Value
UnitedHealth Group, Inc. 132,311,564 8.27Roche Holding AG 112,666,575 7.04Amgen, Inc. 74,726,299 4.67Vertex Pharmaceuticals, Inc. 71,377,280 4.46Pfizer, Inc. 65,465,849 4.09Zoetis, Inc. 58,691,265 3.67Intuitive Surgical, Inc. 58,273,263 3.64Novo Nordisk A/S - Class B 56,565,620 3.53IDEXX Laboratories, Inc. 55,980,441 3.50CSL Ltd. 51,861,392 3.24
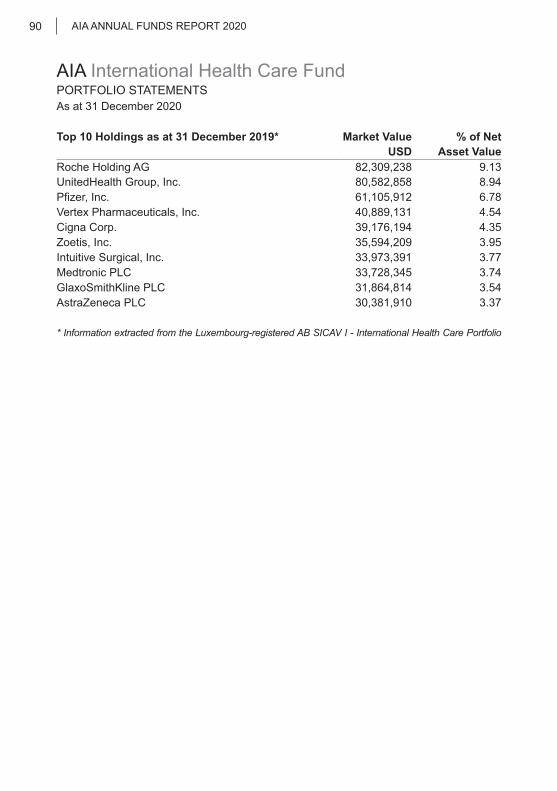
As at 31 December 2020
AIA ANNUAL FUNDS REPORT 202090
AIA International Health Care FundPORTFOLIO STATEMENTS
Top 10 Holdings as at 31 December 2019* Market Value % of Net USD Asset Value
Roche Holding AG 82,309,238 9.13UnitedHealth Group, Inc. 80,582,858 8.94Pfizer, Inc. 61,105,912 6.78Vertex Pharmaceuticals, Inc. 40,889,131 4.54Cigna Corp. 39,176,194 4.35Zoetis, Inc. 35,594,209 3.95Intuitive Surgical, Inc. 33,973,391 3.77Medtronic PLC 33,728,345 3.74GlaxoSmithKline PLC 31,864,814 3.54AstraZeneca PLC 30,381,910 3.37
* Information extracted from the Luxembourg-registered AB SICAV I - International Health Care Portfolio

As at 31 December 2020
AIA ANNUAL FUNDS REPORT 2020 91
AIA International Health Care FundOTHER INFORMATION
Exposure To Derivatives Market Value SGD
% of NetAsset Value
Realised Gains/
(Losses) SGD
Unrealised Gains/
(Losses) SGD
Forward foreign exchange contracts (1,353) - (57,225) (1,353)
BorrowingsN/A
Total Redemptions and Subscriptions SGDTotal amount of redemptions 18,169,362Total amount of subscriptions 33,115,657
Related-Party Transactions N/A
Expense Ratios 31 Dec 2020 31 Dec 2019Local Fund* 2.06% 1.99%
Note: Expense ratio does not include (where applicable) charges for insurance coverage, brokerage and other transaction costs, performance fee, foreign exchange gains/losses, front or back end loads arising from the purchase or sale of collective investment schemes and tax deducted at source or arising out of income received.
Underlying Fund: AB SICAV I - International Health Care Portfolio^^ 1.21% 1.21%
Note: Expense ratio does not include brokerage and other transaction costs, performance fee, foreign exchange gains/losses, front or back end loads arising from the purchase or sale of collective investment schemes and tax deducted at source or arising out of income received.
* Include underlying fund expense ratio^^ Based on audited figures as of 31 May 2020 and 31 May 2019 respectively.
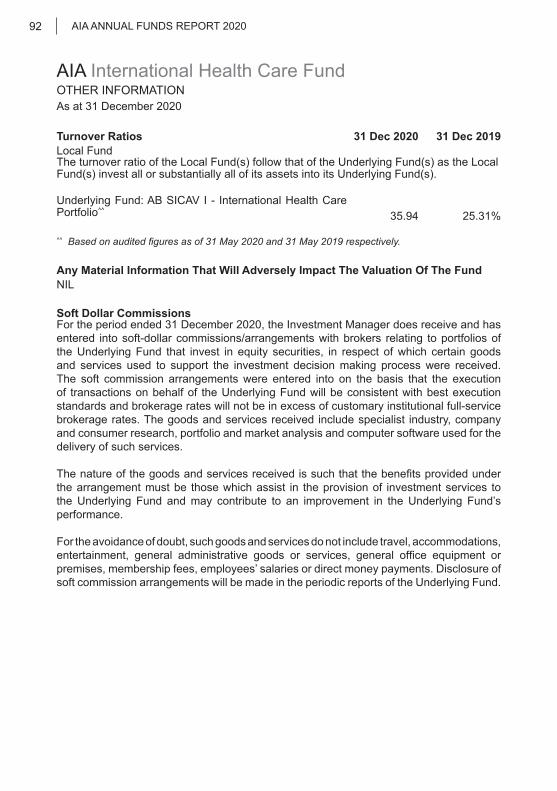
As at 31 December 2020
AIA ANNUAL FUNDS REPORT 202092
AIA International Health Care FundOTHER INFORMATION
Turnover Ratios 31 Dec 2020 31 Dec 2019Local FundThe turnover ratio of the Local Fund(s) follow that of the Underlying Fund(s) as the Local Fund(s) invest all or substantially all of its assets into its Underlying Fund(s).
Underlying Fund: AB SICAV I - International Health Care Portfolio^^
35.94 25.31%
^^ Based on audited figures as of 31 May 2020 and 31 May 2019 respectively.
Any Material Information That Will Adversely Impact The Valuation Of The FundNIL
Soft Dollar CommissionsFor the period ended 31 December 2020, the Investment Manager does receive and has entered into soft-dollar commissions/arrangements with brokers relating to portfolios of the Underlying Fund that invest in equity securities, in respect of which certain goods and services used to support the investment decision making process were received. The soft commission arrangements were entered into on the basis that the execution of transactions on behalf of the Underlying Fund will be consistent with best execution standards and brokerage rates will not be in excess of customary institutional full-service brokerage rates. The goods and services received include specialist industry, company and consumer research, portfolio and market analysis and computer software used for the delivery of such services.
The nature of the goods and services received is such that the benefits provided under the arrangement must be those which assist in the provision of investment services to the Underlying Fund and may contribute to an improvement in the Underlying Fund’s performance.
For the avoidance of doubt, such goods and services do not include travel, accommodations, entertainment, general administrative goods or services, general office equipment or premises, membership fees, employees’ salaries or direct money payments. Disclosure of soft commission arrangements will be made in the periodic reports of the Underlying Fund.

As at 31 December 2020
AIA ANNUAL FUNDS REPORT 2020 93
AIA Japan Balanced/Equity FundFUND PERFORMANCE
AIA JAPAN BALANCED FUNDPeriod Fund Benchmark*
% %3-month 8.30 6.16 6-month 12.13 9.87 1-year 7.20 10.10 3-year^ 2.69 4.90 5-year^ 5.23 5.83 10-year^ 5.53 4.98 Since inception^ 1.96 2.43
^ Annualised returns* Benchmark Details:From inception to 30 June 2011 - 60% MSCI Japan DTR Net & 40% JP Morgan Sing Govt Bond Index AllFrom 1 July 2011 onwards - 60% TOPIX1 Index & 40% JP Morgan Sing Govt Bond Index All
1 Prior to 1 May 2017, the performance returns of the benchmark is calculated using price index methodology. With effect from 1 May 2017, it is calculated using net total return index methodology.
Disclaimer with regard to the above Benchmark:The blended returns are calculated by AIA Investment Management Private Limited using end of day index level values licensed from MSCI (“MSCI Data”). For the avoidance of doubt, MSCI is not the benchmark “administrator” for, or a “contributor”, “submitter” or “supervised contributor” to, the blended returns, and the MSCI Data is not considered a “contribution” or “submission” in relation to the blended returns, as those terms may be defined in any rules, laws, regulations, legislation or international standards. MSCI Data is provided “AS IS” without warranty or liability and no copying or distribution is permitted. MSCI does not make any representation regarding the advisability of any investment or strategy and does not sponsor, promote, issue, sell or otherwise recommend or endorse any investment or strategy, including any financial products or strategies based on, tracking or otherwiseutilising any MSCI Data, models, analytics or other materials or information.
Note: Fund inception date - 9 March 2006. Fund returns in SGD, bid-to-bid, net dividends reinvested
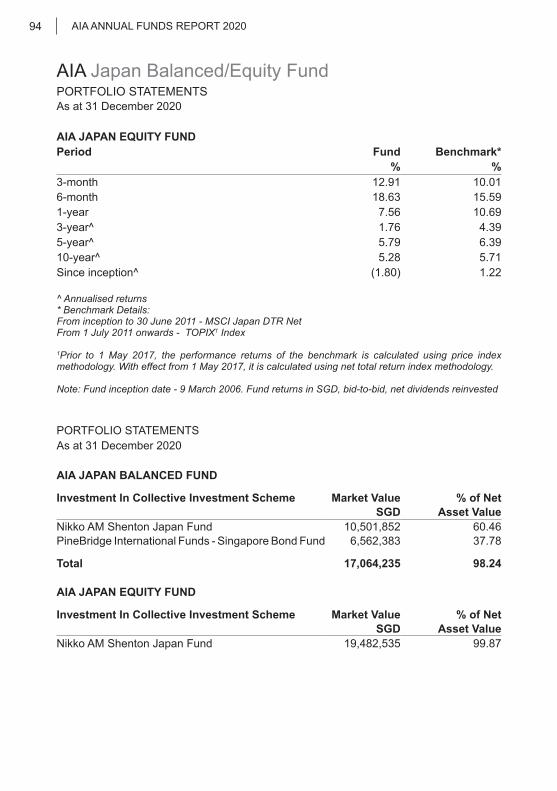
As at 31 December 2020
AIA ANNUAL FUNDS REPORT 202094
AIA Japan Balanced/Equity FundPORTFOLIO STATEMENTS
AIA JAPAN EQUITY FUNDPeriod Fund Benchmark*
% %3-month 12.91 10.01 6-month 18.63 15.59 1-year 7.56 10.69 3-year^ 1.76 4.39 5-year^ 5.79 6.39 10-year^ 5.28 5.71 Since inception^ (1.80) 1.22
^ Annualised returns* Benchmark Details:From inception to 30 June 2011 - MSCI Japan DTR Net From 1 July 2011 onwards - TOPIX1 Index
1Prior to 1 May 2017, the performance returns of the benchmark is calculated using price index methodology. With effect from 1 May 2017, it is calculated using net total return index methodology.
Note: Fund inception date - 9 March 2006. Fund returns in SGD, bid-to-bid, net dividends reinvested
PORTFOLIO STATEMENTSAs at 31 December 2020
AIA JAPAN BALANCED FUND
Investment In Collective Investment Scheme Market Value % of NetSGD Asset Value
Nikko AM Shenton Japan Fund 10,501,852 60.46PineBridge International Funds - Singapore Bond Fund 6,562,383 37.78
Total 17,064,235 98.24
AIA JAPAN EQUITY FUND
Investment In Collective Investment Scheme Market Value % of NetSGD Asset Value
Nikko AM Shenton Japan Fund 19,482,535 99.87
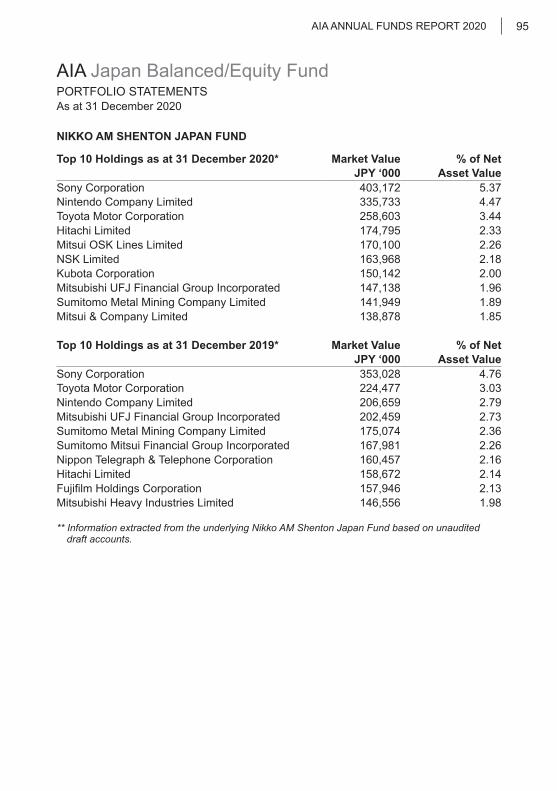
As at 31 December 2020
AIA ANNUAL FUNDS REPORT 2020 95
AIA Japan Balanced/Equity FundPORTFOLIO STATEMENTS
NIKKO AM SHENTON JAPAN FUND
Top 10 Holdings as at 31 December 2020* Market Value % of Net JPY ‘000 Asset Value
Sony Corporation 403,172 5.37Nintendo Company Limited 335,733 4.47Toyota Motor Corporation 258,603 3.44Hitachi Limited 174,795 2.33Mitsui OSK Lines Limited 170,100 2.26NSK Limited 163,968 2.18Kubota Corporation 150,142 2.00Mitsubishi UFJ Financial Group Incorporated 147,138 1.96Sumitomo Metal Mining Company Limited 141,949 1.89Mitsui & Company Limited 138,878 1.85
Top 10 Holdings as at 31 December 2019* Market Value % of Net JPY ‘000 Asset Value
Sony Corporation 353,028 4.76Toyota Motor Corporation 224,477 3.03Nintendo Company Limited 206,659 2.79Mitsubishi UFJ Financial Group Incorporated 202,459 2.73Sumitomo Metal Mining Company Limited 175,074 2.36Sumitomo Mitsui Financial Group Incorporated 167,981 2.26Nippon Telegraph & Telephone Corporation 160,457 2.16Hitachi Limited 158,672 2.14Fujifilm Holdings Corporation 157,946 2.13Mitsubishi Heavy Industries Limited 146,556 1.98
** Information extracted from the underlying Nikko AM Shenton Japan Fund based on unaudited draft accounts.
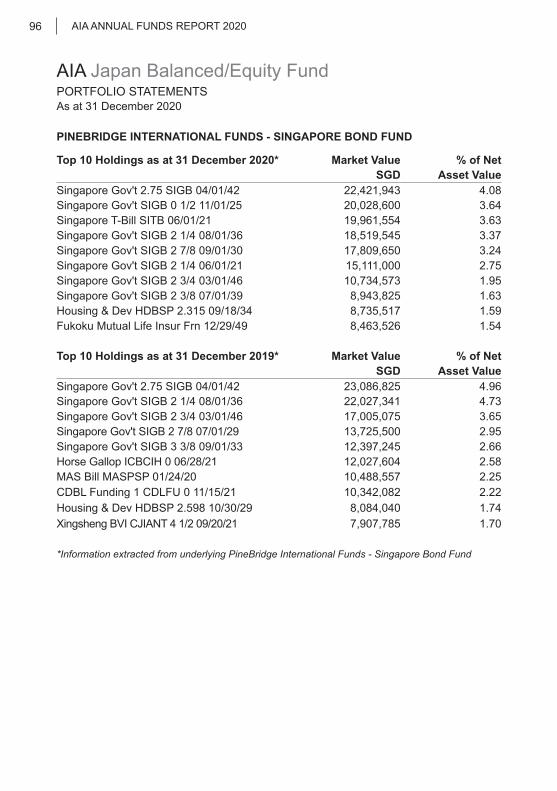
As at 31 December 2020
AIA ANNUAL FUNDS REPORT 202096
PINEBRIDGE INTERNATIONAL FUNDS - SINGAPORE BOND FUND
Top 10 Holdings as at 31 December 2020* Market Value % of Net SGD Asset Value
Singapore Gov't 2.75 SIGB 04/01/42 22,421,943 4.08Singapore Gov't SIGB 0 1/2 11/01/25 20,028,600 3.64Singapore T-Bill SITB 06/01/21 19,961,554 3.63Singapore Gov't SIGB 2 1/4 08/01/36 18,519,545 3.37Singapore Gov't SIGB 2 7/8 09/01/30 17,809,650 3.24Singapore Gov't SIGB 2 1/4 06/01/21 15,111,000 2.75Singapore Gov't SIGB 2 3/4 03/01/46 10,734,573 1.95Singapore Gov't SIGB 2 3/8 07/01/39 8,943,825 1.63Housing & Dev HDBSP 2.315 09/18/34 8,735,517 1.59Fukoku Mutual Life Insur Frn 12/29/49 8,463,526 1.54
Top 10 Holdings as at 31 December 2019* Market Value % of Net SGD Asset Value
Singapore Gov't 2.75 SIGB 04/01/42 23,086,825 4.96Singapore Gov't SIGB 2 1/4 08/01/36 22,027,341 4.73Singapore Gov't SIGB 2 3/4 03/01/46 17,005,075 3.65Singapore Gov't SIGB 2 7/8 07/01/29 13,725,500 2.95Singapore Gov't SIGB 3 3/8 09/01/33 12,397,245 2.66Horse Gallop ICBCIH 0 06/28/21 12,027,604 2.58MAS Bill MASPSP 01/24/20 10,488,557 2.25CDBL Funding 1 CDLFU 0 11/15/21 10,342,082 2.22Housing & Dev HDBSP 2.598 10/30/29 8,084,040 1.74Xingsheng BVI CJIANT 4 1/2 09/20/21 7,907,785 1.70
*Information extracted from underlying PineBridge International Funds - Singapore Bond Fund
AIA Japan Balanced/Equity FundPORTFOLIO STATEMENTS

As at 31 December 2020
AIA ANNUAL FUNDS REPORT 2020 97
AIA Japan Balanced/Equity FundOTHER INFORMATION
Exposure To Derivatives Market Value SGD
% of NetAsset Value
Realised Gains/
(Losses) SGD
Unrealised Gains/
(Losses) SGD
Forward foreign exchange contractsAIA Japan Balanced Fund - - - - AIA Japan Equity Fund - - - -
BorrowingsN/A
Redemptions SubscriptionsTotal Redemptions and Subscriptions SGD SGDAIA Japan Balanced Fund 4,216,011 2,277,038 AIA Japan Equity Fund 9,600,878 7,631,310
Related-Party Transactions N/A
Expense Ratios 31 Dec 2020 31 Dec 2019AIA Japan Balanced Fund* 1.55% 1.55%AIA Japan Equity Fund* 1.61% 1.66%
Note: Expense ratio does not include (where applicable) charges for insurance coverage, brokerage and other transaction costs, performance fee, foreign exchange gains/losses, front or back end loads arising from the purchase or sale of collective investment schemes and tax deducted at source or arising out of income received.
Underlying Funds:Nikko AM Shenton Japan Fund** 1.08% 1.12%PineBridge International Funds - Singapore Bond Fund** 0.85% 0.86%
Note: Expense ratio does not include brokerage and other transaction costs, performance fee, foreign exchange gains/losses, front or back end loads arising from the purchase or sale of collective investment schemes and tax deducted at source or arising out of income received.
* Includes underlying fund expense ratio** Based on unaudited accounts
Turnover Ratios 31 Dec 2020 31 Dec 2019 Local Funds: The turnover ratio of the Local Fund(s) follow that of the Underlying Fund(s) as the Local Fund(s) invest all or substantially all of its assets into its Underlying Fund(s).
Underlying Funds:Nikko AM Shenton Japan Fund** 29.90% 40.97%PineBridge International Fund - Singapore Bond Fund** 79.02% 83.13%
** Based on unaudited accounts
As at 31 December 2020
AIA ANNUAL FUNDS REPORT 202098
Any Material Information That Will Adversely Impact The Valuation Of The FundsNil
Soft Dollar CommissionsThere is no soft dollar commissions for the PineBridge International Funds - Singapore Bond Fund.
Soft dollar commisions for Nikko AM Shenton Japan Fund:
In their management of the Nikko AM Shenton Japan Fund (“Fund”), the Managers currently do not receive or enter into any soft dollar commissions or arrangements. The Sub-Managers of the Fund do not receive or intend to receive soft dollar commissions, or enter into soft dollar arrangements, in respect of the Fund.
AIA Japan Balanced/Equity FundOTHER INFORMATION
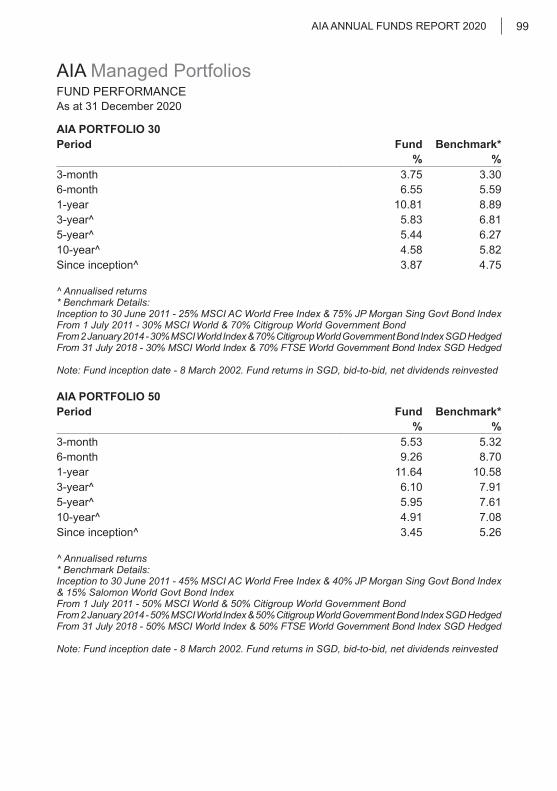
As at 31 December 2020
AIA ANNUAL FUNDS REPORT 2020 99
AIA Managed PortfoliosFUND PERFORMANCE
AIA PORTFOLIO 30Period Fund Benchmark*
% %3-month 3.75 3.30 6-month 6.55 5.59 1-year 10.81 8.89 3-year^ 5.83 6.81 5-year^ 5.44 6.27 10-year^ 4.58 5.82 Since inception^ 3.87 4.75
^ Annualised returns* Benchmark Details:Inception to 30 June 2011 - 25% MSCI AC World Free Index & 75% JP Morgan Sing Govt Bond IndexFrom 1 July 2011 - 30% MSCI World & 70% Citigroup World Government BondFrom 2 January 2014 - 30% MSCI World Index & 70% Citigroup World Government Bond Index SGD HedgedFrom 31 July 2018 - 30% MSCI World Index & 70% FTSE World Government Bond Index SGD Hedged
Note: Fund inception date - 8 March 2002. Fund returns in SGD, bid-to-bid, net dividends reinvested
AIA PORTFOLIO 50Period Fund Benchmark*
% %3-month 5.53 5.32 6-month 9.26 8.70 1-year 11.64 10.58 3-year^ 6.10 7.91 5-year^ 5.95 7.61 10-year^ 4.91 7.08 Since inception^ 3.45 5.26
^ Annualised returns* Benchmark Details:Inception to 30 June 2011 - 45% MSCI AC World Free Index & 40% JP Morgan Sing Govt Bond Index & 15% Salomon World Govt Bond IndexFrom 1 July 2011 - 50% MSCI World & 50% Citigroup World Government BondFrom 2 January 2014 - 50% MSCI World Index & 50% Citigroup World Government Bond Index SGD HedgedFrom 31 July 2018 - 50% MSCI World Index & 50% FTSE World Government Bond Index SGD Hedged
Note: Fund inception date - 8 March 2002. Fund returns in SGD, bid-to-bid, net dividends reinvested

As at 31 December 2020
AIA ANNUAL FUNDS REPORT 2020100
AIA Managed PortfoliosFUND PERFORMANCE
AIA PORTFOLIO 70Period Fund Benchmark*
% %3-month 7.24 7.34 6-month 12.40 11.82 1-year 12.68 12.07 3-year^ 6.79 8.89 5-year^ 6.98 8.87 10-year^ 5.84 8.34 Since inception^ 3.40 5.68
^ Annualised returns* Benchmark Details:Inception to 30 June 2011 - 65% MSCI AC World Free Index & 20% JP Morgan Sing Govt Bond Index & 15% Salomon World Govt Bond IndexFrom 1 July 2011 - 70% MSCI World & 30% Citigroup World Government BondFrom 2 January 2014 - 70% MSCI World Index & 30% Citigroup World Government Bond Index SGD HedgedFrom 31 July 2018 - 70% MSCI World Index & 30% FTSE World Government Bond Index SGD Hedged
Note: Fund inception date - 8 March 2002. Fund returns in SGD, bid-to-bid, net dividends reinvested
AIA PORTFOLIO 100Period Fund Benchmark*
% %3-month 8.18 5.13 6-month 9.98 8.01 1-year 2.80 9.23 3-year^ 3.51 7.26 5-year^ 4.91 6.98 10-year^ 4.82 7.64 Since inception^ 1.78 4.77
^ Annualised returns* Benchmark Details:Inception to 30 June 2011 - MSCI World Free Index From 1 July 2011 - 60% MSCI World & 40% Dividend Yield (MSCI World)
Note: Fund inception date - 8 March 2002. Fund returns in SGD, bid-to-bid, net dividends reinvested

As at 31 December 2020
AIA ANNUAL FUNDS REPORT 2020 101
AIA Managed PortfoliosPORTFOLIO STATEMENTS
PORTFOLIO 30Investment In Collective Investment Scheme Market Value % of Net
SGD Asset ValueSchroder Multi-Asset Revolution 30 18,811,187 99.78
PORTFOLIO 50Investment In Collective Investment Scheme Market Value % of Net
SGD Asset ValueSchroder Multi-Asset Revolution 50 38,292,232 99.88
PORTFOLIO 70Investment In Collective Investment Scheme Market Value % of Net
SGD Asset ValueSchroder Multi-Asset Revolution 70 55,256,316 99.87
PORTFOLIO 100Investment In Collective Investment Scheme Market Value % of Net
SGD Asset ValueAllianz Global Investors Premier Funds - Global High Payout Fund 10,778,728 93.66

As at 31 December 2020
AIA ANNUAL FUNDS REPORT 2020102
AIA Managed PortfoliosPORTFOLIO STATEMENTS
SCHRODER MULTI-ASSET REVOLUTION 30
Top 10 Holdings as at 31 December 2020*# Market Value % of Net SGD Asset Value
Schroder Global Quality Bond Class I USD Acc 9,489,609 21.90 Schroder Singapore Fixed Income Fund Class I 7,144,733 16.49 SISF - Global Corporate Bond I Acc 6,771,528 15.63 MAS Bill Series 84 17 Jul 2020 3,472,635 8.01 SISF - US Large Cap I Acc 3,471,033 8.01 SISF - QEP Global Core I Acc 2,418,186 5.58 SISF - Global Inflation Linked Bond I Acc 2,390,936 5.52 SISF - EURO Equity I Acc 1,818,236 4.20 SISF - Global Equity Alpha I Acc 1,333,423 3.08 Lyxor S&P 500 UCITS ETF Class Acc 908,407 2.10
Top 10 Holdings as at 31 December 2019*^ Market Value % of Net SGD Asset Value
Schroder Global Quality Bond Class I USD Acc 10,477,554 25.88 Schroder Singapore Fixed Income Fund Class I 8,437,057 20.84 SISF - US Large Cap I Acc 4,947,610 12.23 MAS Bill Series 84 16 Aug 2019 2,700,463 6.67 SISF - Global Inflation Linked Bond I Acc 2,272,811 5.61 SISF - QEP Global Core I Acc 2,232,238 5.51 SISF - QEP Global Quality I Acc 1,918,773 4.74 SISF - Global Corporate Bond I Acc 1,597,337 3.95 SISF - Euro Equity I Acc 967,762 2.39 SPDR Gold Shares ETF 836,753 2.07
* Information extracted from the underlying Schroder Multi-Asset Revolution 30# Based on unaudited accounts as of 30 June 2020^ Based on unaudited accounts as of 30 June 2019
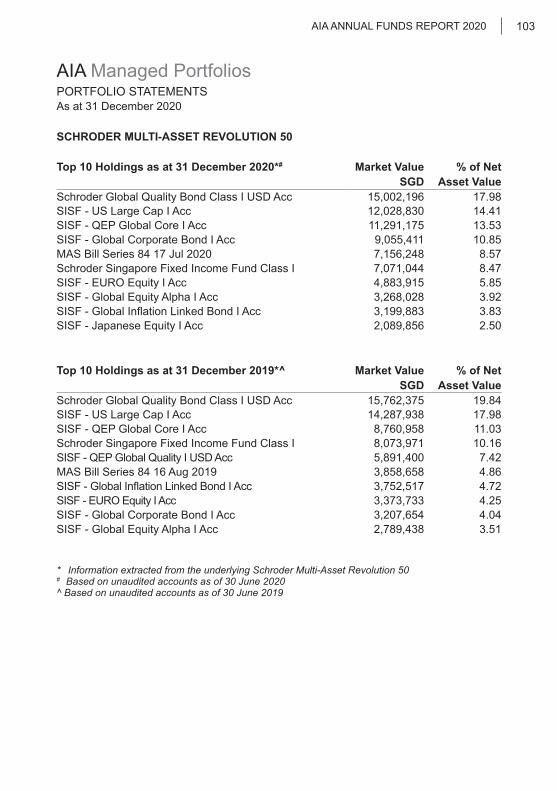
As at 31 December 2020
AIA ANNUAL FUNDS REPORT 2020 103
AIA Managed PortfoliosPORTFOLIO STATEMENTS
SCHRODER MULTI-ASSET REVOLUTION 50
Top 10 Holdings as at 31 December 2020*# Market Value % of Net SGD Asset Value
Schroder Global Quality Bond Class I USD Acc 15,002,196 17.98 SISF - US Large Cap I Acc 12,028,830 14.41 SISF - QEP Global Core I Acc 11,291,175 13.53 SISF - Global Corporate Bond I Acc 9,055,411 10.85 MAS Bill Series 84 17 Jul 2020 7,156,248 8.57 Schroder Singapore Fixed Income Fund Class I 7,071,044 8.47 SISF - EURO Equity I Acc 4,883,915 5.85 SISF - Global Equity Alpha I Acc 3,268,028 3.92 SISF - Global Inflation Linked Bond I Acc 3,199,883 3.83 SISF - Japanese Equity I Acc 2,089,856 2.50
Top 10 Holdings as at 31 December 2019*^ Market Value % of Net SGD Asset Value
Schroder Global Quality Bond Class I USD Acc 15,762,375 19.84 SISF - US Large Cap I Acc 14,287,938 17.98 SISF - QEP Global Core I Acc 8,760,958 11.03 Schroder Singapore Fixed Income Fund Class I 8,073,971 10.16 SISF - QEP Global Quality I USD Acc 5,891,400 7.42 MAS Bill Series 84 16 Aug 2019 3,858,658 4.86 SISF - Global Inflation Linked Bond I Acc 3,752,517 4.72 SISF - EURO Equity I Acc 3,373,733 4.25 SISF - Global Corporate Bond I Acc 3,207,654 4.04 SISF - Global Equity Alpha I Acc 2,789,438 3.51
* Information extracted from the underlying Schroder Multi-Asset Revolution 50# Based on unaudited accounts as of 30 June 2020^ Based on unaudited accounts as of 30 June 2019
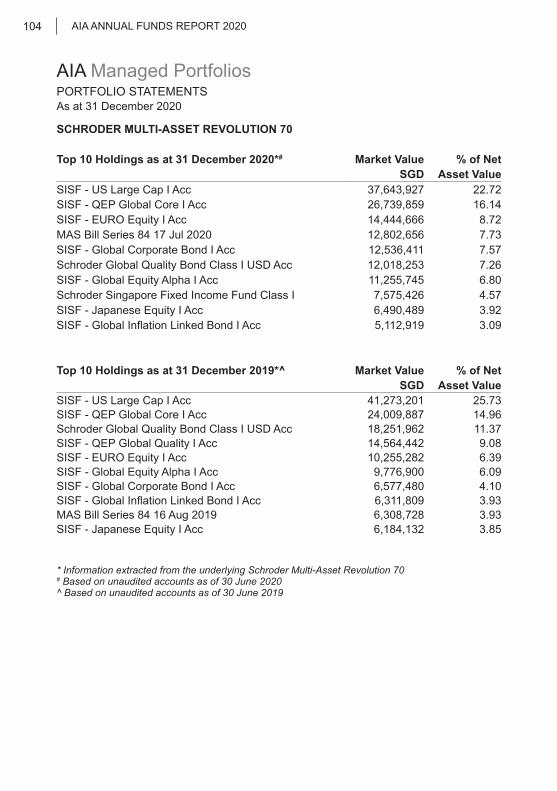
As at 31 December 2020
AIA ANNUAL FUNDS REPORT 2020104
AIA Managed PortfoliosPORTFOLIO STATEMENTS
SCHRODER MULTI-ASSET REVOLUTION 70
Top 10 Holdings as at 31 December 2020*# Market Value % of Net SGD Asset Value
SISF - US Large Cap I Acc 37,643,927 22.72 SISF - QEP Global Core I Acc 26,739,859 16.14 SISF - EURO Equity I Acc 14,444,666 8.72 MAS Bill Series 84 17 Jul 2020 12,802,656 7.73 SISF - Global Corporate Bond I Acc 12,536,411 7.57 Schroder Global Quality Bond Class I USD Acc 12,018,253 7.26 SISF - Global Equity Alpha I Acc 11,255,745 6.80 Schroder Singapore Fixed Income Fund Class I 7,575,426 4.57 SISF - Japanese Equity I Acc 6,490,489 3.92 SISF - Global Inflation Linked Bond I Acc 5,112,919 3.09
Top 10 Holdings as at 31 December 2019*^ Market Value % of Net SGD Asset Value
SISF - US Large Cap I Acc 41,273,201 25.73SISF - QEP Global Core I Acc 24,009,887 14.96 Schroder Global Quality Bond Class I USD Acc 18,251,962 11.37 SISF - QEP Global Quality I Acc 14,564,442 9.08 SISF - EURO Equity I Acc 10,255,282 6.39 SISF - Global Equity Alpha I Acc 9,776,900 6.09 SISF - Global Corporate Bond I Acc 6,577,480 4.10 SISF - Global Inflation Linked Bond I Acc 6,311,809 3.93 MAS Bill Series 84 16 Aug 2019 6,308,728 3.93 SISF - Japanese Equity I Acc 6,184,132 3.85
* Information extracted from the underlying Schroder Multi-Asset Revolution 70 # Based on unaudited accounts as of 30 June 2020^ Based on unaudited accounts as of 30 June 2019

As at 31 December 2020
AIA ANNUAL FUNDS REPORT 2020 105
AIA Managed PortfoliosPORTFOLIO STATEMENTS
ALLIANZ GLOBAL INVESTORS PREMIER FUNDS - ALLIANZ GLOBAL HIGH PAYOUT FUND
Top 10 Holdings as at 31 December 2020* Market Value % of Net USD Asset Value
Microsoft Corp 2,203,515 4.01 Johnson & Johnson 961,907 1.75 Thermo Fisher Scientific Inc 837,007 1.52 Apple Inc 826,526 1.50 Roche Holdings-Genusschein 771,961 1.40 Pfizer Inc 700,862 1.27 Merck & Co Inc 682,130 1.24 Partners Group Holding 665,476 1.21 Bristol-Myers Squibb Co 641,266 1.17 Nestle SA 637,095 1.15
Top 10 Holdings as at 31 December 2019* Market Value % of Net USD Asset Value
Microsoft Corp 1,926,306 3.23 AT & T Inc 1,201,984 2.02 Procter & Gamble Co 1,165,317 1.96 Pfizer Inc 1,160,120 1.95 Nestle SA 1,096,222 1.84 Johnson & Johnson 833,064 1.40 Rio Tinto PLC 826,678 1.39 Comcast Corp Cl A Com 813,912 1.37 Apple Inc Com 812,530 1.36 Cisco Systems Inc 811,147 1.36
*Information extracted from underlying Allianz Global Investors Premier Funds - Allianz Global High Payout Fund
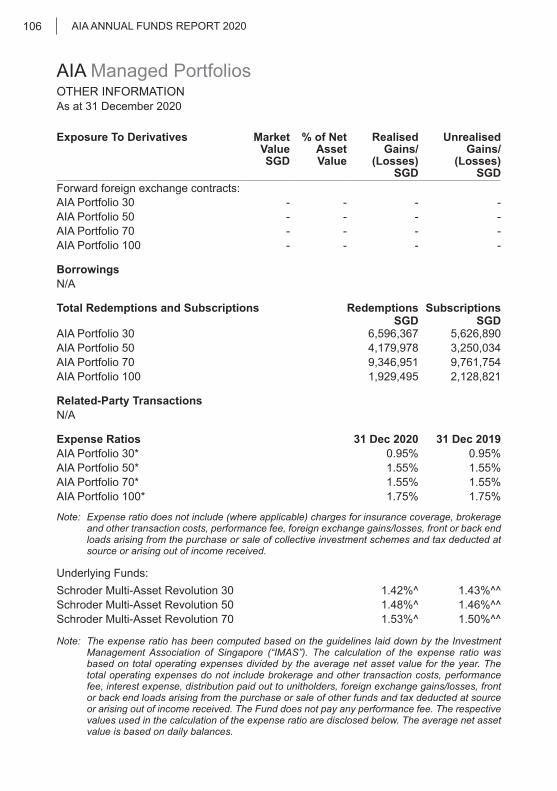
As at 31 December 2020
AIA ANNUAL FUNDS REPORT 2020106
AIA Managed PortfoliosOTHER INFORMATION
Exposure To Derivatives Market Value SGD
% of NetAsset Value
Realised Gains/
(Losses) SGD
Unrealised Gains/
(Losses) SGD
Forward foreign exchange contracts:AIA Portfolio 30 - - - - AIA Portfolio 50 - - - - AIA Portfolio 70 - - - - AIA Portfolio 100 - - - -
BorrowingsN/A
Total Redemptions and Subscriptions Redemptions SubscriptionsSGD SGD
AIA Portfolio 30 6,596,367 5,626,890 AIA Portfolio 50 4,179,978 3,250,034 AIA Portfolio 70 9,346,951 9,761,754 AIA Portfolio 100 1,929,495 2,128,821
Related-Party Transactions N/A
Expense Ratios 31 Dec 2020 31 Dec 2019AIA Portfolio 30* 0.95% 0.95%AIA Portfolio 50* 1.55% 1.55%AIA Portfolio 70* 1.55% 1.55%AIA Portfolio 100* 1.75% 1.75%
Note: Expense ratio does not include (where applicable) charges for insurance coverage, brokerage and other transaction costs, performance fee, foreign exchange gains/losses, front or back end loads arising from the purchase or sale of collective investment schemes and tax deducted at source or arising out of income received.
Underlying Funds:Schroder Multi-Asset Revolution 30 1.42%^ 1.43%^^Schroder Multi-Asset Revolution 50 1.48%^ 1.46%^^Schroder Multi-Asset Revolution 70 1.53%^ 1.50%^^
Note: The expense ratio has been computed based on the guidelines laid down by the Investment Management Association of Singapore (“IMAS”). The calculation of the expense ratio was based on total operating expenses divided by the average net asset value for the year. The total operating expenses do not include brokerage and other transaction costs, performance fee, interest expense, distribution paid out to unitholders, foreign exchange gains/losses, front or back end loads arising from the purchase or sale of other funds and tax deducted at source or arising out of income received. The Fund does not pay any performance fee. The respective values used in the calculation of the expense ratio are disclosed below. The average net asset value is based on daily balances.

As at 31 December 2020
AIA ANNUAL FUNDS REPORT 2020 107
AIA Managed PortfoliosOTHER INFORMATION
Note: Expense ratio does not include brokerage and other transaction costs, performance fee, foreign exchange gains/losses, front or back end loads arising from the purchase or sale of collective investment schemes and tax deducted at source or arising out of income received.
* Includes underlying fund expense ratio^ Based on unaudited accounts as of 30 September 2020^^ Based on unaudited accounts as of 30 June 2019# Based on unaudited accounts
Turnover Ratios 31 Dec 2020 31 Dec 2019Local Funds:The turnover ratio of the Local Fund(s) follow that of the Underlying Fund(s) as the Local Fund(s) invest all or substantially all of its assets into its Underlying Fund(s).
Underlying Funds:Schroder Multi-Asset Revolution 30^ 98.47% 63.79%Schroder Multi-Asset Revolution 50^ 94.89% 67.80%Schroder Multi-Asset Revolution 70^ 98.44% 70.86%Allianz Global Investors Premier Funds - Allianz Global High Payout Fund# 74.98% 89.25%
^ Based on unaudited accounts as of 30 June 2020 and 30 June 2019 respectively# Based on unaudited accounts
31 Dec 2020 31 Dec 2019Allianz Global Investors Premier Funds- Allianz Global High Payout Fund#
1.67% 1.68%
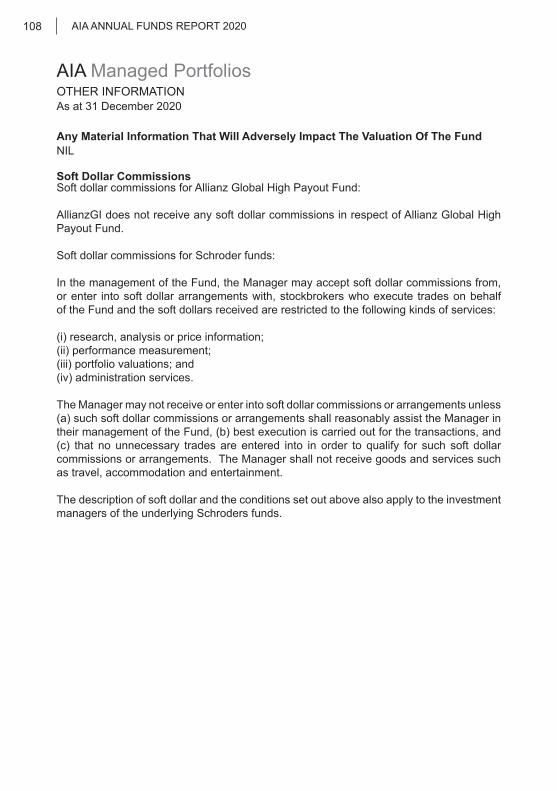
As at 31 December 2020
AIA ANNUAL FUNDS REPORT 2020108
AIA Managed PortfoliosOTHER INFORMATION
Any Material Information That Will Adversely Impact The Valuation Of The FundNIL
Soft Dollar CommissionsSoft dollar commissions for Allianz Global High Payout Fund:
AllianzGI does not receive any soft dollar commissions in respect of Allianz Global High Payout Fund.
Soft dollar commissions for Schroder funds:
In the management of the Fund, the Manager may accept soft dollar commissions from, or enter into soft dollar arrangements with, stockbrokers who execute trades on behalf of the Fund and the soft dollars received are restricted to the following kinds of services:
(i) research, analysis or price information;(ii) performance measurement;(iii) portfolio valuations; and(iv) administration services.
The Manager may not receive or enter into soft dollar commissions or arrangements unless (a) such soft dollar commissions or arrangements shall reasonably assist the Manager in their management of the Fund, (b) best execution is carried out for the transactions, and (c) that no unnecessary trades are entered into in order to qualify for such soft dollar commissions or arrangements. The Manager shall not receive goods and services such as travel, accommodation and entertainment.
The description of soft dollar and the conditions set out above also apply to the investment managers of the underlying Schroders funds.
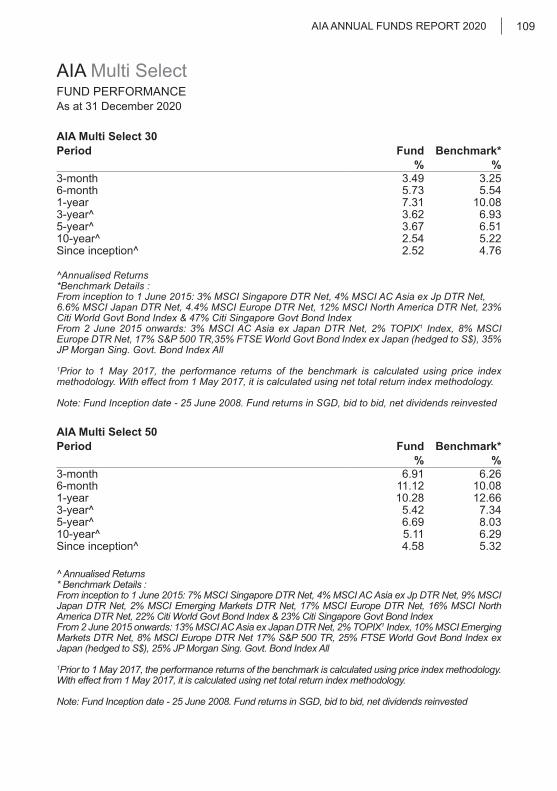
As at 31 December 2020
AIA ANNUAL FUNDS REPORT 2020 109
AIA Multi SelectFUND PERFORMANCE
AIA Multi Select 30Period Fund Benchmark*
% %3-month 3.49 3.25 6-month 5.73 5.54 1-year 7.31 10.08 3-year^ 3.62 6.93 5-year^ 3.67 6.51 10-year^ 2.54 5.22 Since inception^ 2.52 4.76
^Annualised Returns*Benchmark Details :From inception to 1 June 2015: 3% MSCI Singapore DTR Net, 4% MSCI AC Asia ex Jp DTR Net,6.6% MSCI Japan DTR Net, 4.4% MSCI Europe DTR Net, 12% MSCI North America DTR Net, 23% Citi World Govt Bond Index & 47% Citi Singapore Govt Bond IndexFrom 2 June 2015 onwards: 3% MSCI AC Asia ex Japan DTR Net, 2% TOPIX1 Index, 8% MSCI Europe DTR Net, 17% S&P 500 TR,35% FTSE World Govt Bond Index ex Japan (hedged to S$), 35% JP Morgan Sing. Govt. Bond Index All
1Prior to 1 May 2017, the performance returns of the benchmark is calculated using price index methodology. With effect from 1 May 2017, it is calculated using net total return index methodology.
Note: Fund Inception date - 25 June 2008. Fund returns in SGD, bid to bid, net dividends reinvested
AIA Multi Select 50Period Fund Benchmark*
% %3-month 6.91 6.26 6-month 11.12 10.08 1-year 10.28 12.66 3-year^ 5.42 7.34 5-year^ 6.69 8.03 10-year^ 5.11 6.29 Since inception^ 4.58 5.32
^ Annualised Returns* Benchmark Details :From inception to 1 June 2015: 7% MSCI Singapore DTR Net, 4% MSCI AC Asia ex Jp DTR Net, 9% MSCI Japan DTR Net, 2% MSCI Emerging Markets DTR Net, 17% MSCI Europe DTR Net, 16% MSCI North America DTR Net, 22% Citi World Govt Bond Index & 23% Citi Singapore Govt Bond IndexFrom 2 June 2015 onwards: 13% MSCI AC Asia ex Japan DTR Net, 2% TOPIX1 Index, 10% MSCI Emerging Markets DTR Net, 8% MSCI Europe DTR Net 17% S&P 500 TR, 25% FTSE World Govt Bond Index ex Japan (hedged to S$), 25% JP Morgan Sing. Govt. Bond Index All
1Prior to 1 May 2017, the performance returns of the benchmark is calculated using price index methodology. With effect from 1 May 2017, it is calculated using net total return index methodology.
Note: Fund Inception date - 25 June 2008. Fund returns in SGD, bid to bid, net dividends reinvested
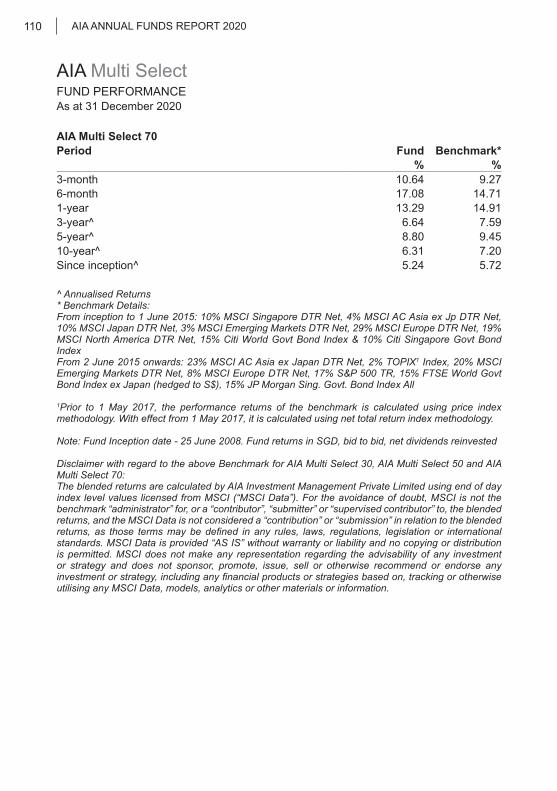
As at 31 December 2020
AIA ANNUAL FUNDS REPORT 2020110
AIA Multi SelectFUND PERFORMANCE
AIA Multi Select 70Period Fund Benchmark*
% %3-month 10.64 9.27 6-month 17.08 14.71 1-year 13.29 14.91 3-year^ 6.64 7.59 5-year^ 8.80 9.45 10-year^ 6.31 7.20 Since inception^ 5.24 5.72
^ Annualised Returns* Benchmark Details: From inception to 1 June 2015: 10% MSCI Singapore DTR Net, 4% MSCI AC Asia ex Jp DTR Net, 10% MSCI Japan DTR Net, 3% MSCI Emerging Markets DTR Net, 29% MSCI Europe DTR Net, 19% MSCI North America DTR Net, 15% Citi World Govt Bond Index & 10% Citi Singapore Govt Bond IndexFrom 2 June 2015 onwards: 23% MSCI AC Asia ex Japan DTR Net, 2% TOPIX1 Index, 20% MSCI Emerging Markets DTR Net, 8% MSCI Europe DTR Net, 17% S&P 500 TR, 15% FTSE World Govt Bond Index ex Japan (hedged to S$), 15% JP Morgan Sing. Govt. Bond Index All
1Prior to 1 May 2017, the performance returns of the benchmark is calculated using price index methodology. With effect from 1 May 2017, it is calculated using net total return index methodology.
Note: Fund Inception date - 25 June 2008. Fund returns in SGD, bid to bid, net dividends reinvested
Disclaimer with regard to the above Benchmark for AIA Multi Select 30, AIA Multi Select 50 and AIA Multi Select 70:The blended returns are calculated by AIA Investment Management Private Limited using end of day index level values licensed from MSCI (“MSCI Data”). For the avoidance of doubt, MSCI is not the benchmark “administrator” for, or a “contributor”, “submitter” or “supervised contributor” to, the blended returns, and the MSCI Data is not considered a “contribution” or “submission” in relation to the blended returns, as those terms may be defined in any rules, laws, regulations, legislation or international standards. MSCI Data is provided “AS IS” without warranty or liability and no copying or distribution is permitted. MSCI does not make any representation regarding the advisability of any investment or strategy and does not sponsor, promote, issue, sell or otherwise recommend or endorse any investment or strategy, including any financial products or strategies based on, tracking or otherwise utilising any MSCI Data, models, analytics or other materials or information.
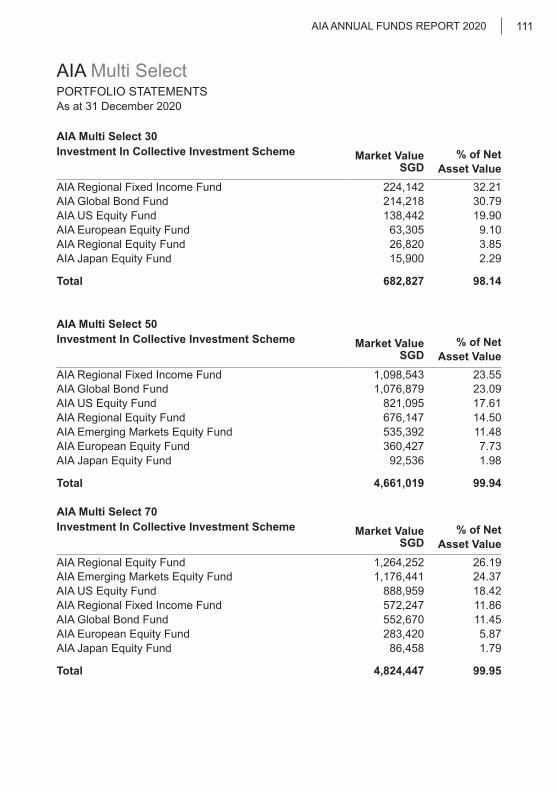
As at 31 December 2020
AIA ANNUAL FUNDS REPORT 2020 111
AIA Multi SelectPORTFOLIO STATEMENTS
AIA Multi Select 30Investment In Collective Investment Scheme Market Value
SGD% of Net
Asset ValueAIA Regional Fixed Income Fund 224,142 32.21 AIA Global Bond Fund 214,218 30.79 AIA US Equity Fund 138,442 19.90 AIA European Equity Fund 63,305 9.10 AIA Regional Equity Fund 26,820 3.85 AIA Japan Equity Fund 15,900 2.29
Total 682,827 98.14
AIA Multi Select 50Investment In Collective Investment Scheme Market Value
SGD% of Net
Asset ValueAIA Regional Fixed Income Fund 1,098,543 23.55 AIA Global Bond Fund 1,076,879 23.09 AIA US Equity Fund 821,095 17.61 AIA Regional Equity Fund 676,147 14.50 AIA Emerging Markets Equity Fund 535,392 11.48 AIA European Equity Fund 360,427 7.73 AIA Japan Equity Fund 92,536 1.98
Total 4,661,019 99.94
AIA Multi Select 70Investment In Collective Investment Scheme Market Value
SGD% of Net
Asset ValueAIA Regional Equity Fund 1,264,252 26.19 AIA Emerging Markets Equity Fund 1,176,441 24.37 AIA US Equity Fund 888,959 18.42 AIA Regional Fixed Income Fund 572,247 11.86 AIA Global Bond Fund 552,670 11.45 AIA European Equity Fund 283,420 5.87 AIA Japan Equity Fund 86,458 1.79
Total 4,824,447 99.95

As at 31 December 2020
AIA ANNUAL FUNDS REPORT 2020112
AIA Multi SelectPORTFOLIO STATEMENTS
AIA Multi Select 30AIA Multi Select 30 invested more than 30% of its assets in AIA Global Bond Fund and AIA Regional Fixed Income Fund. The following are the top 10 holdings in the AIA Global Bond Fund and AIA Regional Fixed Income Fund.
AIA GLOBAL BOND FUND
Top 10 Holdings as at 31 December 2020* Market Value % of Net USD Asset Value
US Treasury N/B 2.125% 29/02/2024 32,281,712 6.95US Treasury N/B 1.625% 15/11/2022 31,213,308 6.72Bundesrepub. Deutschland (Br) 1.75% 15/02/2024 29,415,221 6.33US Treasury N/B 2.250% 15/11/2024 20,892,882 4.50US Treasury N/B 2% 31/10/2022 16,325,962 3.52US Treasury 2.875% 15/05/2049 14,168,800 3.05Bundesrepublik Deutschland Bundesanleihe (Reg S) (Br) .25% 15/02/2029 14,099,878 3.04Mex Bonds Desarr Fix Rt Ser M7.75% 13/11/2042 13,827,658 2.98UK Treasury 4.25% 07/12/2040 12,621,170 2.72Bonos Y Oblig Del Estado (Reg S)5.9% 30/07/2026 11,948,438 2.57
Top 10 Holdings as at 31 December 2019* Market Value % of Net USD Asset Value
US Treasury Bond 1.625% 15/11/2022 17,288,453 8.36Bundesrepub Deutschland (Br) 1.75% 15/02/2024 15,584,627 7.54US Treasury Bond 2.125% 29/02/2024 12,227,388 5.91US Treasury Bond 2% 31/10/2022 9,079,241 4.39Poland (Govt Of) (Ser 428) 2.75% 25 /04/2028 7,794,186 3.77UK Treasury 4.25% 07/12/2040 6,420,846 3.11Bonos Y Oblig Del Estado (Reg S) 5.9% 30/07/2026 6,330,837 3.06France (Rep Of) Ser Oat FRN 25/07/2027 6,223,125 3.01US Treasury 0.5% 15/04/2024 5,906,892 2.86Mex Bonds Desarr Fix RT Ser M 7.75% 13/11/2042 5,679,319 2.75
*Information extracted from the underlying Legg Mason Western Asset Global Bond Trust
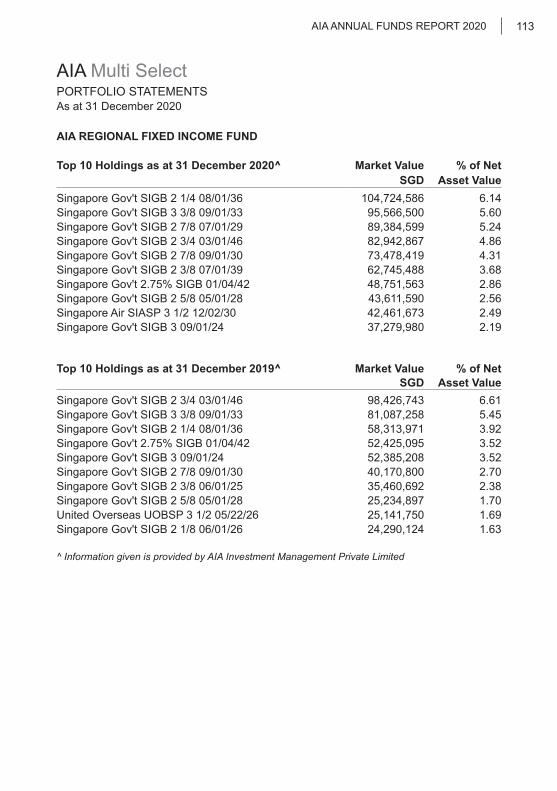
As at 31 December 2020
AIA ANNUAL FUNDS REPORT 2020 113
AIA Multi SelectPORTFOLIO STATEMENTS
AIA REGIONAL FIXED INCOME FUND
Top 10 Holdings as at 31 December 2020^ Market Value % of Net SGD Asset Value
Singapore Gov't SIGB 2 1/4 08/01/36 104,724,586 6.14 Singapore Gov't SIGB 3 3/8 09/01/33 95,566,500 5.60 Singapore Gov't SIGB 2 7/8 07/01/29 89,384,599 5.24 Singapore Gov't SIGB 2 3/4 03/01/46 82,942,867 4.86 Singapore Gov't SIGB 2 7/8 09/01/30 73,478,419 4.31 Singapore Gov't SIGB 2 3/8 07/01/39 62,745,488 3.68 Singapore Gov't 2.75% SIGB 01/04/42 48,751,563 2.86 Singapore Gov't SIGB 2 5/8 05/01/28 43,611,590 2.56 Singapore Air SIASP 3 1/2 12/02/30 42,461,673 2.49 Singapore Gov't SIGB 3 09/01/24 37,279,980 2.19
Top 10 Holdings as at 31 December 2019^ Market Value % of Net SGD Asset Value
Singapore Gov't SIGB 2 3/4 03/01/46 98,426,743 6.61 Singapore Gov't SIGB 3 3/8 09/01/33 81,087,258 5.45 Singapore Gov't SIGB 2 1/4 08/01/36 58,313,971 3.92 Singapore Gov't 2.75% SIGB 01/04/42 52,425,095 3.52 Singapore Gov't SIGB 3 09/01/24 52,385,208 3.52 Singapore Gov't SIGB 2 7/8 09/01/30 40,170,800 2.70 Singapore Gov't SIGB 2 3/8 06/01/25 35,460,692 2.38 Singapore Gov't SIGB 2 5/8 05/01/28 25,234,897 1.70 United Overseas UOBSP 3 1/2 05/22/26 25,141,750 1.69 Singapore Gov't SIGB 2 1/8 06/01/26 24,290,124 1.63
^ Information given is provided by AIA Investment Management Private Limited
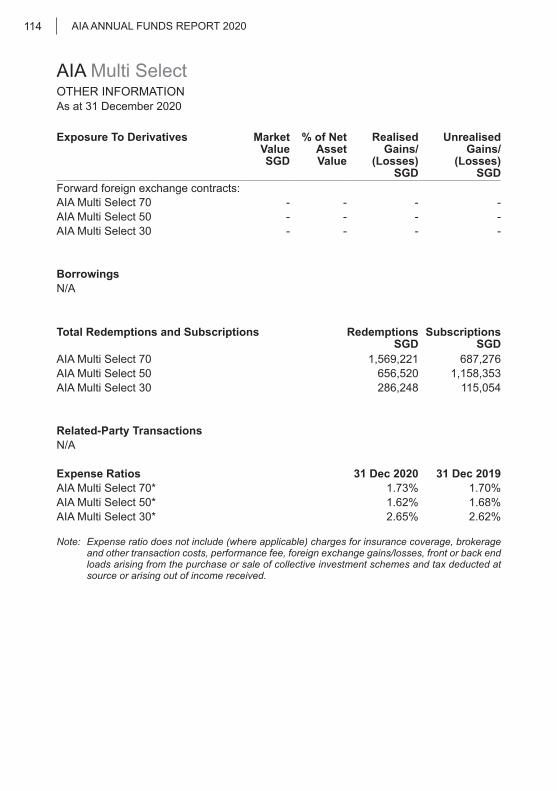
As at 31 December 2020
AIA ANNUAL FUNDS REPORT 2020114
Exposure To Derivatives Market Value SGD
% of NetAsset Value
Realised Gains/
(Losses) SGD
Unrealised Gains/
(Losses) SGD
Forward foreign exchange contracts:AIA Multi Select 70 - - - - AIA Multi Select 50 - - - - AIA Multi Select 30 - - - -
BorrowingsN/A
Total Redemptions and Subscriptions RedemptionsSGD
Subscriptions SGD
AIA Multi Select 70 1,569,221 687,276 AIA Multi Select 50 656,520 1,158,353 AIA Multi Select 30 286,248 115,054
Related-Party Transactions N/A
Expense Ratios 31 Dec 2020 31 Dec 2019AIA Multi Select 70* 1.73% 1.70%AIA Multi Select 50* 1.62% 1.68%AIA Multi Select 30* 2.65% 2.62%
Note: Expense ratio does not include (where applicable) charges for insurance coverage, brokerage and other transaction costs, performance fee, foreign exchange gains/losses, front or back end loads arising from the purchase or sale of collective investment schemes and tax deducted at source or arising out of income received.
AIA Multi SelectOTHER INFORMATION
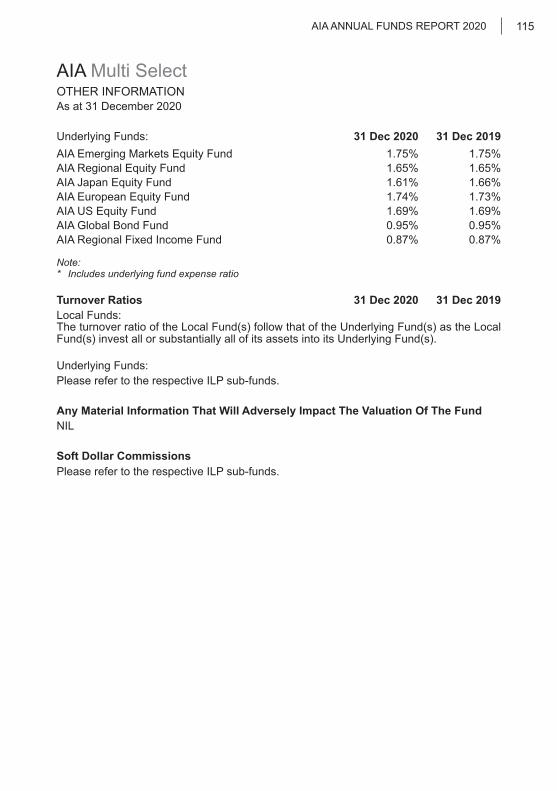
As at 31 December 2020
AIA ANNUAL FUNDS REPORT 2020 115
AIA Multi SelectOTHER INFORMATION
Underlying Funds: 31 Dec 2020 31 Dec 2019AIA Emerging Markets Equity Fund 1.75% 1.75%AIA Regional Equity Fund 1.65% 1.65%AIA Japan Equity Fund 1.61% 1.66%AIA European Equity Fund 1.74% 1.73%AIA US Equity Fund 1.69% 1.69%AIA Global Bond Fund 0.95% 0.95%AIA Regional Fixed Income Fund 0.87% 0.87%
Note: * Includes underlying fund expense ratio
Turnover Ratios 31 Dec 2020 31 Dec 2019 Local Funds:The turnover ratio of the Local Fund(s) follow that of the Underlying Fund(s) as the Local Fund(s) invest all or substantially all of its assets into its Underlying Fund(s).
Underlying Funds:Please refer to the respective ILP sub-funds.
Any Material Information That Will Adversely Impact The Valuation Of The FundNIL
Soft Dollar CommissionsPlease refer to the respective ILP sub-funds.
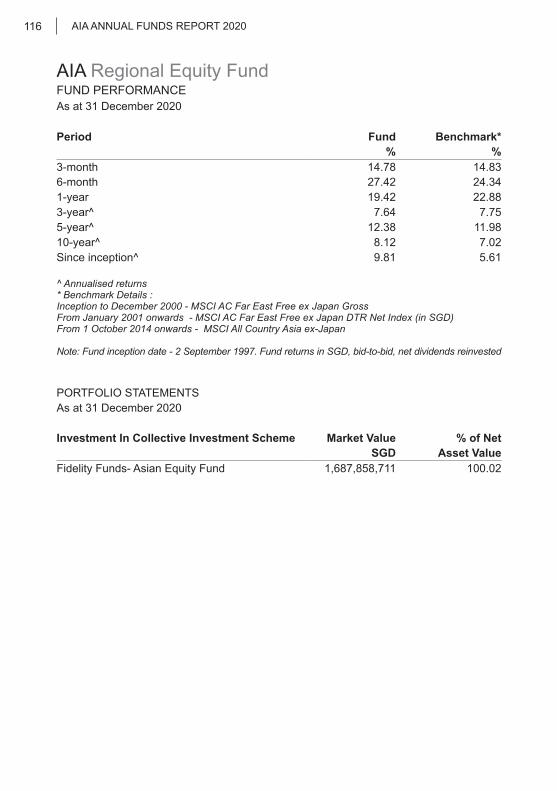
As at 31 December 2020
AIA ANNUAL FUNDS REPORT 2020116
AIA Regional Equity FundFUND PERFORMANCE
Period Fund Benchmark*% %
3-month 14.78 14.83 6-month 27.42 24.34 1-year 19.42 22.88 3-year^ 7.64 7.75 5-year^ 12.38 11.98 10-year^ 8.12 7.02 Since inception^ 9.81 5.61
^ Annualised returns* Benchmark Details : Inception to December 2000 - MSCI AC Far East Free ex Japan GrossFrom January 2001 onwards - MSCI AC Far East Free ex Japan DTR Net Index (in SGD)From 1 October 2014 onwards - MSCI All Country Asia ex-Japan
Note: Fund inception date - 2 September 1997. Fund returns in SGD, bid-to-bid, net dividends reinvested
PORTFOLIO STATEMENTSAs at 31 December 2020
Investment In Collective Investment Scheme Market Value % of NetSGD Asset Value
Fidelity Funds- Asian Equity Fund 1,687,858,711 100.02
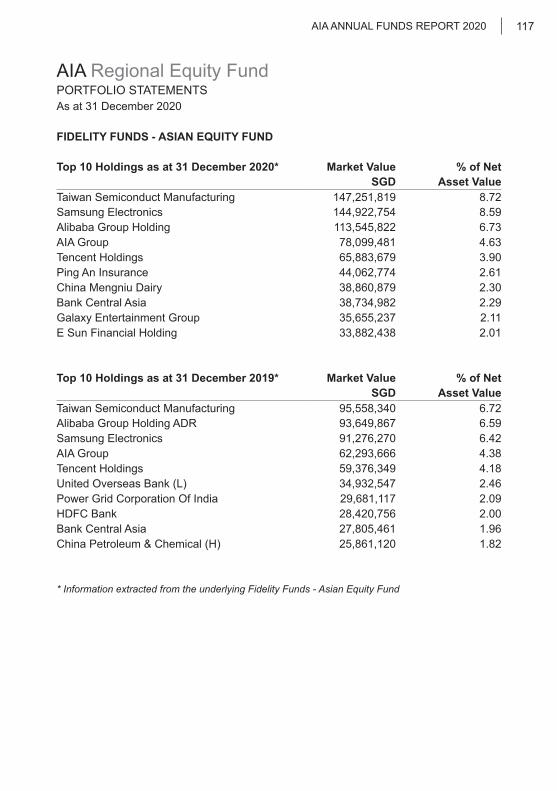
As at 31 December 2020
AIA ANNUAL FUNDS REPORT 2020 117
AIA Regional Equity FundPORTFOLIO STATEMENTS
FIDELITY FUNDS - ASIAN EQUITY FUND
Top 10 Holdings as at 31 December 2020* Market Value % of Net SGD Asset Value
Taiwan Semiconduct Manufacturing 147,251,819 8.72Samsung Electronics 144,922,754 8.59Alibaba Group Holding 113,545,822 6.73AIA Group 78,099,481 4.63Tencent Holdings 65,883,679 3.90Ping An Insurance 44,062,774 2.61China Mengniu Dairy 38,860,879 2.30Bank Central Asia 38,734,982 2.29Galaxy Entertainment Group 35,655,237 2.11E Sun Financial Holding 33,882,438 2.01
Top 10 Holdings as at 31 December 2019* Market Value % of Net SGD Asset Value
Taiwan Semiconduct Manufacturing 95,558,340 6.72Alibaba Group Holding ADR 93,649,867 6.59Samsung Electronics 91,276,270 6.42AIA Group 62,293,666 4.38Tencent Holdings 59,376,349 4.18United Overseas Bank (L) 34,932,547 2.46Power Grid Corporation Of India 29,681,117 2.09HDFC Bank 28,420,756 2.00Bank Central Asia 27,805,461 1.96China Petroleum & Chemical (H) 25,861,120 1.82
* Information extracted from the underlying Fidelity Funds - Asian Equity Fund
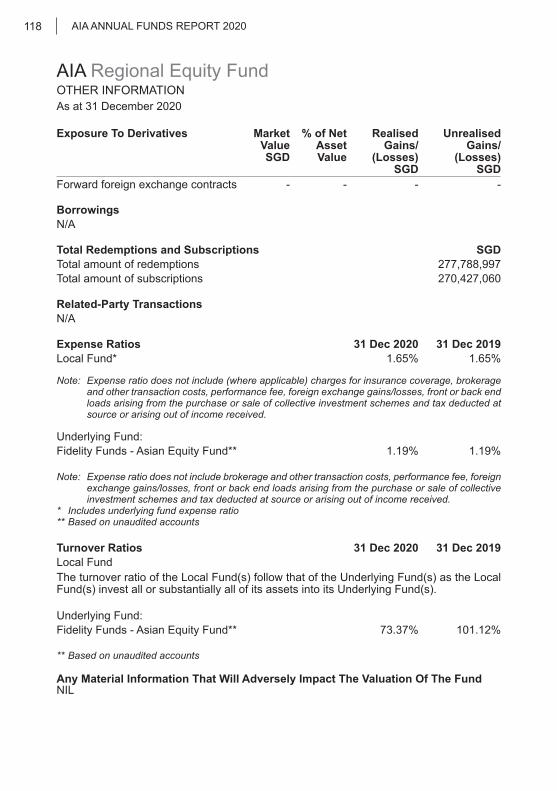
As at 31 December 2020
AIA ANNUAL FUNDS REPORT 2020118
AIA Regional Equity FundOTHER INFORMATION
Exposure To Derivatives Market Value SGD
% of NetAsset Value
Realised Gains/
(Losses) SGD
Unrealised Gains/
(Losses) SGD
Forward foreign exchange contracts - - - -
BorrowingsN/A
Total Redemptions and Subscriptions SGDTotal amount of redemptions 277,788,997Total amount of subscriptions 270,427,060
Related-Party Transactions N/A
Expense Ratios 31 Dec 2020 31 Dec 2019Local Fund* 1.65% 1.65%
Note: Expense ratio does not include (where applicable) charges for insurance coverage, brokerage and other transaction costs, performance fee, foreign exchange gains/losses, front or back end loads arising from the purchase or sale of collective investment schemes and tax deducted at source or arising out of income received.
Underlying Fund:Fidelity Funds - Asian Equity Fund** 1.19% 1.19%
Note: Expense ratio does not include brokerage and other transaction costs, performance fee, foreign exchange gains/losses, front or back end loads arising from the purchase or sale of collective investment schemes and tax deducted at source or arising out of income received.
* Includes underlying fund expense ratio** Based on unaudited accounts
Turnover Ratios 31 Dec 2020 31 Dec 2019 Local FundThe turnover ratio of the Local Fund(s) follow that of the Underlying Fund(s) as the Local Fund(s) invest all or substantially all of its assets into its Underlying Fund(s).
Underlying Fund:Fidelity Funds - Asian Equity Fund** 73.37% 101.12%
** Based on unaudited accounts
Any Material Information That Will Adversely Impact The Valuation Of The FundNIL
As at 31 December 2020
AIA ANNUAL FUNDS REPORT 2020 119
AIA Regional Equity FundOTHER INFORMATION
Soft Dollar CommissionsSoft dollar commisions for Fidelity Funds - Asian Equity Fund: The Investment Manager and any of its delegates may effect transactions by or through the agency of another person with whom the Investment Manager and any of its delegates have an arrangement under which that party will from time to time provide to or procure for the Investment Manager and any of its delegates goods, services or other benefits (such as research and advisory services, where permitted by regulation only), the nature of which is such that their provision can reasonably be expected to benefit the Fund as a whole and may contribute to an improvement in the performance of the Fund and that of the Investment Manager or any of its delegates in providing services to the Fund and for which no direct payment is made but instead the Investment Manager and any of its delegates undertake to place business with that party. For the avoidance of doubt, such goods and services do not include travel, accommodation, entertainment, general administrative goods or services, general office equipment or premises, membership fees, employee salaries or direct money payments. The Investment Manager and any of its delegates shall not retain the benefit of any cash commission rebate (being repayment of a cash commission made by a broker or dealer to the Investment Manager and/or any delegates) paid or payable from any such broker or dealer in respect of any business placed with such broker or dealer by the Investment Manager or any of its delegates for or on behalf the Fund. Any such cash commission rebate from any such broker or dealer will be held by the Investment Manager and any of its delegates for the account of the Fund. Brokerage rates will not be excessive of customary brokerage rates. All transactions will be done with best execution. Due to rounding, numbers presented throughout this report and other documents may not add up precisely to the totals provided and percentages may not precisely reflect the absolute figures.
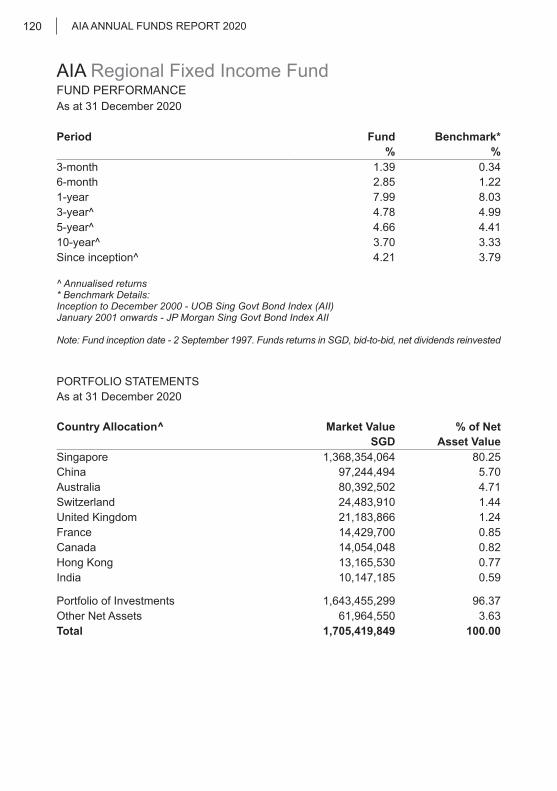
As at 31 December 2020
AIA ANNUAL FUNDS REPORT 2020120
AIA Regional Fixed Income FundFUND PERFORMANCE
Period Fund Benchmark*% %
3-month 1.39 0.34 6-month 2.85 1.22 1-year 7.99 8.03 3-year^ 4.78 4.99 5-year^ 4.66 4.41 10-year^ 3.70 3.33 Since inception^ 4.21 3.79
^ Annualised returns* Benchmark Details:Inception to December 2000 - UOB Sing Govt Bond Index (AII)January 2001 onwards - JP Morgan Sing Govt Bond Index AII
Note: Fund inception date - 2 September 1997. Funds returns in SGD, bid-to-bid, net dividends reinvested
PORTFOLIO STATEMENTSAs at 31 December 2020
Country Allocation^ Market Value % of Net SGD Asset Value
Singapore 1,368,354,064 80.25China 97,244,494 5.70Australia 80,392,502 4.71Switzerland 24,483,910 1.44United Kingdom 21,183,866 1.24France 14,429,700 0.85Canada 14,054,048 0.82Hong Kong 13,165,530 0.77India 10,147,185 0.59
Portfolio of Investments 1,643,455,299 96.37Other Net Assets 61,964,550 3.63Total 1,705,419,849 100.00
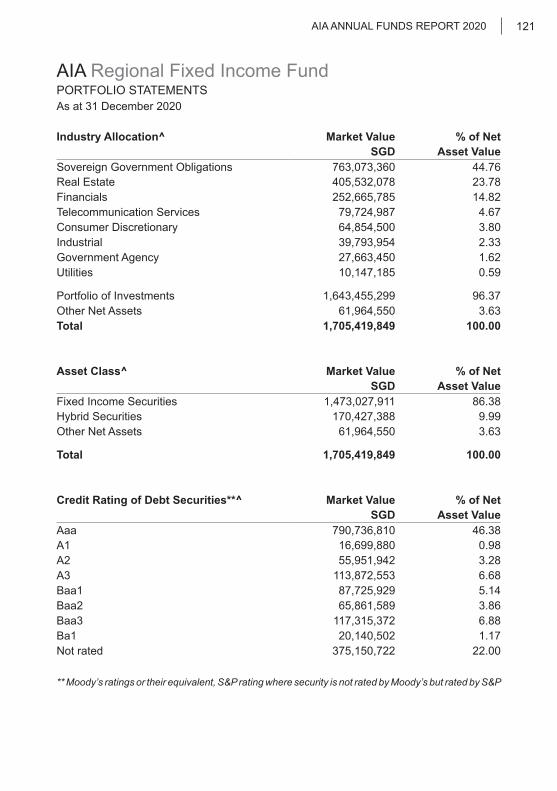
As at 31 December 2020
AIA ANNUAL FUNDS REPORT 2020 121
AIA Regional Fixed Income FundPORTFOLIO STATEMENTS
Industry Allocation^ Market Value % of Net SGD Asset Value
Sovereign Government Obligations 763,073,360 44.76Real Estate 405,532,078 23.78Financials 252,665,785 14.82Telecommunication Services 79,724,987 4.67Consumer Discretionary 64,854,500 3.80Industrial 39,793,954 2.33Government Agency 27,663,450 1.62Utilities 10,147,185 0.59
Portfolio of Investments 1,643,455,299 96.37Other Net Assets 61,964,550 3.63Total 1,705,419,849 100.00
Asset Class^ Market Value % of Net SGD Asset Value
Fixed Income Securities 1,473,027,911 86.38Hybrid Securities 170,427,388 9.99Other Net Assets 61,964,550 3.63
Total 1,705,419,849 100.00
Credit Rating of Debt Securities**^ Market Value % of Net SGD Asset Value
Aaa 790,736,810 46.38 A1 16,699,880 0.98 A2 55,951,942 3.28 A3 113,872,553 6.68 Baa1 87,725,929 5.14 Baa2 65,861,589 3.86 Baa3 117,315,372 6.88 Ba1 20,140,502 1.17 Not rated 375,150,722 22.00
** Moody’s ratings or their equivalent, S&P rating where security is not rated by Moody’s but rated by S&P

As at 31 December 2020
AIA ANNUAL FUNDS REPORT 2020122
AIA Regional Fixed Income FundPORTFOLIO STATEMENTS
Top 10 Holdings as at 31 December 2020^ Market Value % of Net SGD Asset Value
Singapore Gov't SIGB 2 1/4 08/01/36 104,724,586 6.14 Singapore Gov't SIGB 3 3/8 09/01/33 95,566,500 5.60 Singapore Gov't SIGB 2 7/8 07/01/29 89,384,599 5.24 Singapore Gov't SIGB 2 3/4 03/01/46 82,942,867 4.86 Singapore Gov't SIGB 2 7/8 09/01/30 73,478,419 4.31 Singapore Gov't SIGB 2 3/8 07/01/39 62,745,488 3.68 Singapore Gov't 2.75% SIGB 01/04/42 48,751,563 2.86 Singapore Gov't SIGB 2 5/8 05/01/28 43,611,590 2.56 Singapore Air SIASP 3 1/2 12/02/30 42,461,673 2.49 Singapore Gov't SIGB 3 09/01/24 37,279,980 2.19
Top 10 Holdings as at 31 December 2019^ Market Value % of Net SGD Asset Value
Singapore Gov't SIGB 2 3/4 03/01/46 98,426,743 6.61 Singapore Gov't SIGB 3 3/8 09/01/33 81,087,258 5.45 Singapore Gov't SIGB 2 1/4 08/01/36 58,313,971 3.92 Singapore Gov't 2.75% SIGB 01/04/42 52,425,095 3.52 Singapore Gov't SIGB 3 09/01/24 52,385,208 3.52 Singapore Gov't SIGB 2 7/8 09/01/30 40,170,800 2.70 Singapore Gov't SIGB 2 3/8 06/01/25 35,460,692 2.38 Singapore Gov't SIGB 2 5/8 05/01/28 25,234,897 1.70 United Overseas UOBSP 3 1/2 05/22/26 25,141,750 1.69 Singapore Gov't SIGB 2 1/8 06/01/26 24,290,124 1.63
^ Information given is provided by AIA Investment Management Private Limited

As at 31 December 2020
AIA ANNUAL FUNDS REPORT 2020 123
AIA Regional Fixed Income FundOTHER INFORMATION
Exposure To Derivatives Market Value SGD
% of NetAsset Value
Realised Gains/
(Losses) SGD
Unrealised Gains/
(Losses) SGD
Forward foreign exchange contracts 2,143,427 - 6,328,946 2,143,427
Investment In Collective Investment SchemesN/A
BorrowingsN/A
Total Redemptions and Subscriptions SGDTotal amount of redemptions 528,607,804Total amount of subscriptions 620,736,780
Related-Party Transactions N/A
Expense Ratios 31 Dec 2020 31 Dec 2019Local Fund 0.87% 0.87%
Note: Expense ratio does not include (where applicable) charges for insurance coverage, brokerage and other transaction costs, performance fee, foreign exchange gains/losses, front or back end loads arising from the purchase or sale of collective investment schemes and tax deducted at source or arising out of income received.
Turnover Ratios 31 Dec 2020 31 Dec 2019 Local Fund 118.53% 77.02%
Any Material Information That Will Adversely Impact The Valuation Of The FundNIL
Soft Dollar CommissionsNIL
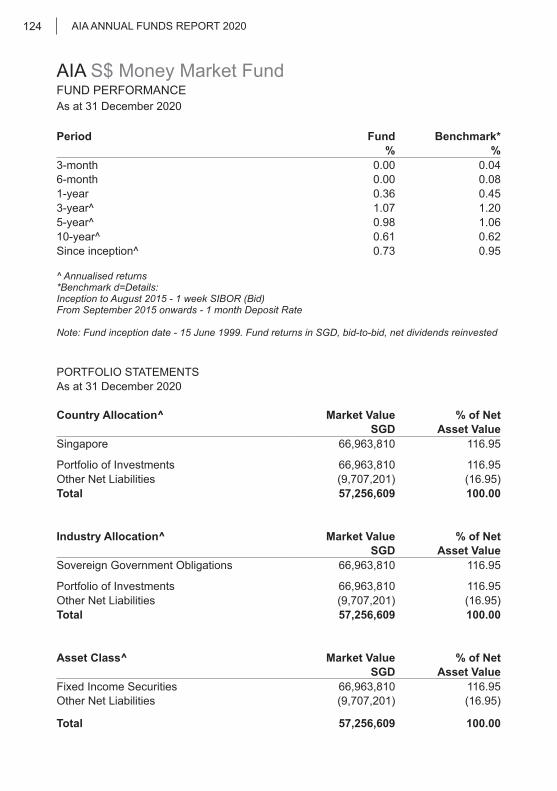
As at 31 December 2020
AIA ANNUAL FUNDS REPORT 2020124
AIA S$ Money Market FundFUND PERFORMANCE
Period Fund Benchmark*% %
3-month 0.00 0.04 6-month 0.00 0.08 1-year 0.36 0.45 3-year^ 1.07 1.20 5-year^ 0.98 1.06 10-year^ 0.61 0.62 Since inception^ 0.73 0.95
^ Annualised returns*Benchmark d=Details:Inception to August 2015 - 1 week SIBOR (Bid)From September 2015 onwards - 1 month Deposit Rate
Note: Fund inception date - 15 June 1999. Fund returns in SGD, bid-to-bid, net dividends reinvested
PORTFOLIO STATEMENTSAs at 31 December 2020
Country Allocation^ Market Value % of Net SGD Asset Value
Singapore 66,963,810 116.95
Portfolio of Investments 66,963,810 116.95Other Net Liabilities (9,707,201) (16.95)Total 57,256,609 100.00
Industry Allocation^ Market Value % of Net SGD Asset Value
Sovereign Government Obligations 66,963,810 116.95
Portfolio of Investments 66,963,810 116.95 Other Net Liabilities (9,707,201) (16.95)Total 57,256,609 100.00
Asset Class^ Market Value % of Net SGD Asset Value
Fixed Income Securities 66,963,810 116.95Other Net Liabilities (9,707,201) (16.95)
Total 57,256,609 100.00
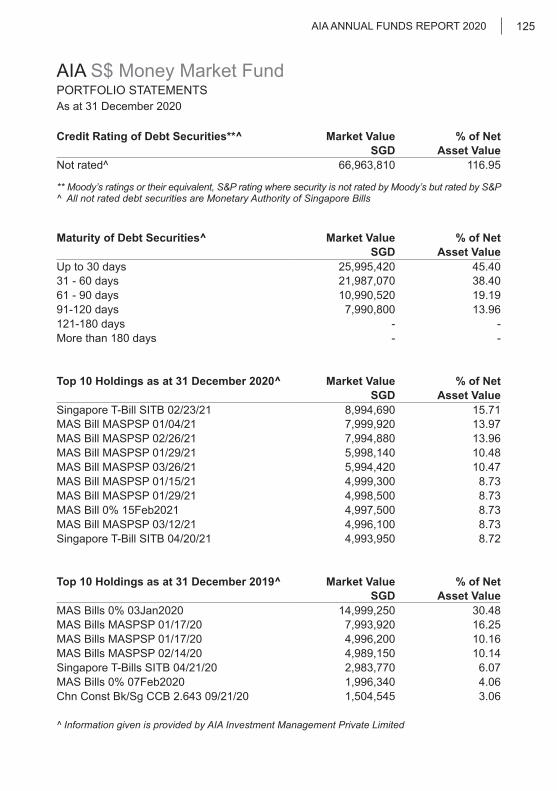
As at 31 December 2020
AIA ANNUAL FUNDS REPORT 2020 125
AIA S$ Money Market FundPORTFOLIO STATEMENTS
Credit Rating of Debt Securities**^ Market Value % of Net SGD Asset Value
Not rated^ 66,963,810 116.95
** Moody’s ratings or their equivalent, S&P rating where security is not rated by Moody’s but rated by S&P^ All not rated debt securities are Monetary Authority of Singapore Bills
Maturity of Debt Securities^ Market Value % of Net SGD Asset Value
Up to 30 days 25,995,420 45.40 31 - 60 days 21,987,070 38.4061 - 90 days 10,990,520 19.1991-120 days 7,990,800 13.96 121-180 days - - More than 180 days - -
Top 10 Holdings as at 31 December 2020^ Market Value % of Net SGD Asset Value
Singapore T-Bill SITB 02/23/21 8,994,690 15.71MAS Bill MASPSP 01/04/21 7,999,920 13.97MAS Bill MASPSP 02/26/21 7,994,880 13.96MAS Bill MASPSP 01/29/21 5,998,140 10.48MAS Bill MASPSP 03/26/21 5,994,420 10.47MAS Bill MASPSP 01/15/21 4,999,300 8.73MAS Bill MASPSP 01/29/21 4,998,500 8.73MAS Bill 0% 15Feb2021 4,997,500 8.73MAS Bill MASPSP 03/12/21 4,996,100 8.73Singapore T-Bill SITB 04/20/21 4,993,950 8.72
Top 10 Holdings as at 31 December 2019^ Market Value % of Net SGD Asset Value
MAS Bills 0% 03Jan2020 14,999,250 30.48MAS Bills MASPSP 01/17/20 7,993,920 16.25MAS Bills MASPSP 01/17/20 4,996,200 10.16MAS Bills MASPSP 02/14/20 4,989,150 10.14Singapore T-Bills SITB 04/21/20 2,983,770 6.07MAS Bills 0% 07Feb2020 1,996,340 4.06Chn Const Bk/Sg CCB 2.643 09/21/20 1,504,545 3.06
^ Information given is provided by AIA Investment Management Private Limited
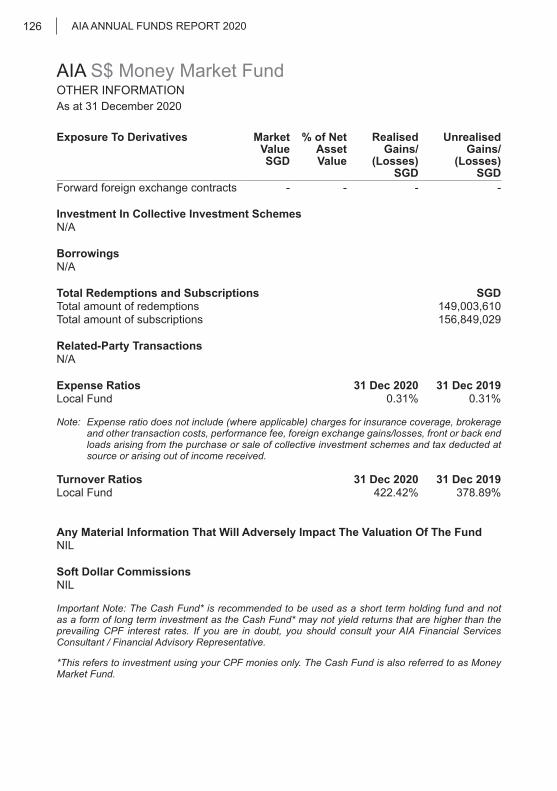
As at 31 December 2020
AIA ANNUAL FUNDS REPORT 2020126
AIA S$ Money Market FundOTHER INFORMATION
Exposure To Derivatives Market Value SGD
% of NetAsset Value
Realised Gains/
(Losses) SGD
Unrealised Gains/
(Losses) SGD
Forward foreign exchange contracts - - - -
Investment In Collective Investment SchemesN/A
BorrowingsN/A
Total Redemptions and Subscriptions SGDTotal amount of redemptions 149,003,610Total amount of subscriptions 156,849,029
Related-Party Transactions N/A
Expense Ratios 31 Dec 2020 31 Dec 2019Local Fund 0.31% 0.31%
Note: Expense ratio does not include (where applicable) charges for insurance coverage, brokerage and other transaction costs, performance fee, foreign exchange gains/losses, front or back end loads arising from the purchase or sale of collective investment schemes and tax deducted at source or arising out of income received.
Turnover Ratios 31 Dec 2020 31 Dec 2019 Local Fund 422.42% 378.89%
Any Material Information That Will Adversely Impact The Valuation Of The FundNIL
Soft Dollar CommissionsNIL
Important Note: The Cash Fund* is recommended to be used as a short term holding fund and not as a form of long term investment as the Cash Fund* may not yield returns that are higher than the prevailing CPF interest rates. If you are in doubt, you should consult your AIA Financial Services Consultant / Financial Advisory Representative.
*This refers to investment using your CPF monies only. The Cash Fund is also referred to as Money Market Fund.

As at 31 December 2020
AIA ANNUAL FUNDS REPORT 2020 127
AIA US Equity FundFUND PERFORMANCE
Period Fund Benchmark*% %
3-month 5.77 8.44 6-month 11.41 15.45 1-year 11.13 15.74 3-year^ 8.59 13.10 5-year^ 9.97 12.99 10-year^ 11.66 13.90 Since inception^ 1.66 4.59
^ Annualised returns* Standard & Poor’s 500
Note: Fund inception date - 18 March 2000. Fund returns in SGD, bid-to-bid, net dividends reinvested
PORTFOLIO STATEMENTSAs at 31 December 2020
Investment In Collective Investment Scheme Market Value SGD
% of NetAsset Value
PineBridge US Large Cap Research Enhanced Fund 66,602,110 99.86

As at 31 December 2020
AIA ANNUAL FUNDS REPORT 2020128
AIA US Equity FundPORTFOLIO STATEMENTS
PINEBRIDGE US LARGE CAP RESEARCH ENHANCED FUND
Top 10 Holdings as at 31 December 2020* Market Value % of Net USD Asset Value
Apple Inc. 9,873,330 7.51 Microsoft Corporation 8,054,273 6.13 Amazon.com, Inc. 5,637,746 4.29 Alphabet Inc. 5,242,457 3.99 iShares Core S&P 500 UCITS ETF 3,668,415 2.79 Facebook, Inc. 3,445,094 2.62 JPMorgan Chase & Co. 2,859,964 2.18 Home Depot, Inc. 2,173,303 1.65 Berkshire Hathaway Inc. 2,164,738 1.65 Accenture plc 1,926,424 1.47
Top 10 Holdings as at 31 December 2019* Market Value % of Net USD Asset Value
Apple Inc. 6,713,133 5.70Microsoft Corporation 5,548,675 4.71Berkshire Hathaway Inc. 3,113,469 2.64Alphabet Inc. 2,732,819 2.32Visa Inc. 2,580,055 2.19Exxon Mobil Corporation 2,463,094 2.09Intel Corporation 2,362,818 2.01Mastercard Incorporated 2,337,661 1.99Amazon.com, Inc. 2,246,973 1.91Pfizer Inc. 2,134,605 1.81
* Information extracted from the underlying PineBridge US Large Cap Research Enhanced Fund
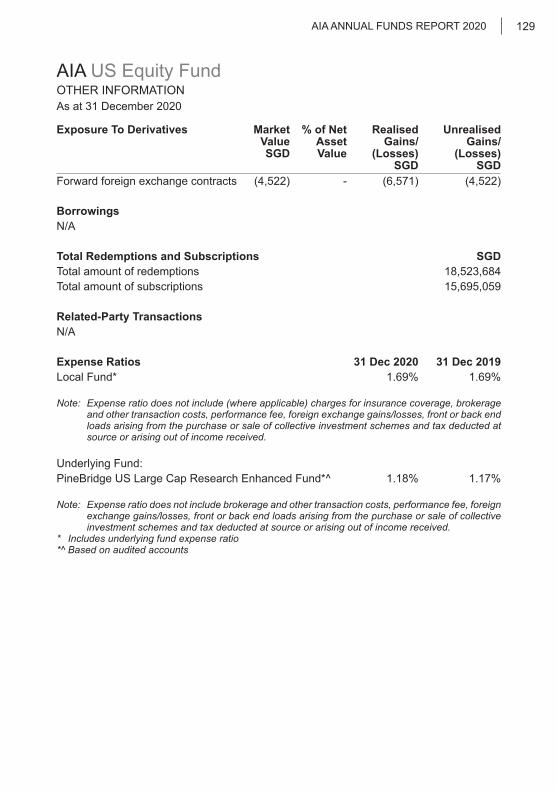
As at 31 December 2020
AIA ANNUAL FUNDS REPORT 2020 129
AIA US Equity FundOTHER INFORMATION
Exposure To Derivatives Market Value SGD
% of NetAsset Value
Realised Gains/
(Losses) SGD
Unrealised Gains/
(Losses) SGD
Forward foreign exchange contracts (4,522) - (6,571) (4,522)
BorrowingsN/A
Total Redemptions and Subscriptions SGDTotal amount of redemptions 18,523,684Total amount of subscriptions 15,695,059
Related-Party Transactions N/A
Expense Ratios 31 Dec 2020 31 Dec 2019Local Fund* 1.69% 1.69%
Note: Expense ratio does not include (where applicable) charges for insurance coverage, brokerage and other transaction costs, performance fee, foreign exchange gains/losses, front or back end loads arising from the purchase or sale of collective investment schemes and tax deducted at source or arising out of income received.
Underlying Fund:PineBridge US Large Cap Research Enhanced Fund*^ 1.18% 1.17%
Note: Expense ratio does not include brokerage and other transaction costs, performance fee, foreign exchange gains/losses, front or back end loads arising from the purchase or sale of collective investment schemes and tax deducted at source or arising out of income received.
* Includes underlying fund expense ratio*^ Based on audited accounts
As at 31 December 2020
AIA ANNUAL FUNDS REPORT 2020130
AIA US Equity FundOTHER INFORMATION
Turnover Ratios 31 Dec 2020 31 Dec 2019 Local FundThe turnover ratio of the Local Fund(s) follow that of the Underlying Fund(s) as the Local Fund(s) invest all or substantially all of its assets into its Underlying Fund(s).
Underlying Fund:PineBridge US Large Cap Research Enhanced Fund*^ 135.32% 126.46%
*^ Based on audited accounts
Any Material Information That Will Adversely Impact The Valuation Of The FundNIL
Soft Dollar CommissionsPineBridge Investments LLC (“PineBridge”) has entered into soft dollar commission arrangements with selected brokers where it obtains services from third parties. These services relate to research and are eligible under the safe harbor of Section 28(e) of the Securities and Exchange Act of 1934. These services generally benefit all of PineBridge’s clients in terms of input into the investment decision making process. The soft dollar credits utilized are not allocated on a specific client basis. PineBridge further confirms that, as per our Compliance Manual, we seek to obtain best execution on all transactions.
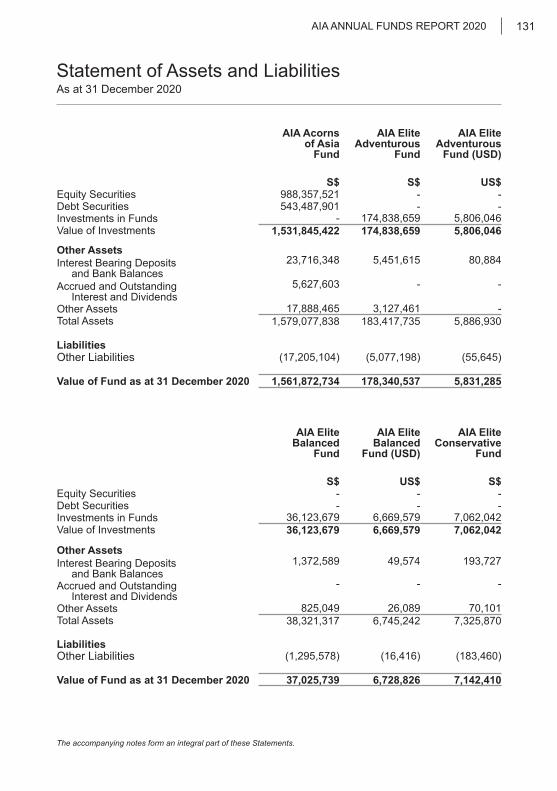
The accompanying notes form an integral part of these Statements.
Statement of Assets and LiabilitiesAs at 31 December 2020
AIA ANNUAL FUNDS REPORT 2020 131
AIA Acornsof Asia
Fund
AIA Elite Adventurous
Fund
AIA Elite Adventurous
Fund (USD)
S$ S$ US$Equity Securities 988,357,521 - - Debt Securities 543,487,901 - - Investments in Funds - 174,838,659 5,806,046 Value of Investments 1,531,845,422 174,838,659 5,806,046
Other AssetsInterest Bearing Deposits and Bank Balances
23,716,348 5,451,615 80,884
Accrued and Outstanding Interest and Dividends
5,627,603 - -
Other Assets 17,888,465 3,127,461 - Total Assets 1,579,077,838 183,417,735 5,886,930
LiabilitiesOther Liabilities (17,205,104) (5,077,198) (55,645)
Value of Fund as at 31 December 2020 1,561,872,734 178,340,537 5,831,285
AIA Elite Balanced
Fund
AIA Elite Balanced
Fund (USD)
AIA Elite Conservative
Fund
S$ US$ S$Equity Securities - - - Debt Securities - - - Investments in Funds 36,123,679 6,669,579 7,062,042 Value of Investments 36,123,679 6,669,579 7,062,042
Other AssetsInterest Bearing Deposits and Bank Balances
1,372,589 49,574 193,727
Accrued and Outstanding Interest and Dividends
- - -
Other Assets 825,049 26,089 70,101 Total Assets 38,321,317 6,745,242 7,325,870
LiabilitiesOther Liabilities (1,295,578) (16,416) (183,460)
Value of Fund as at 31 December 2020 37,025,739 6,728,826 7,142,410
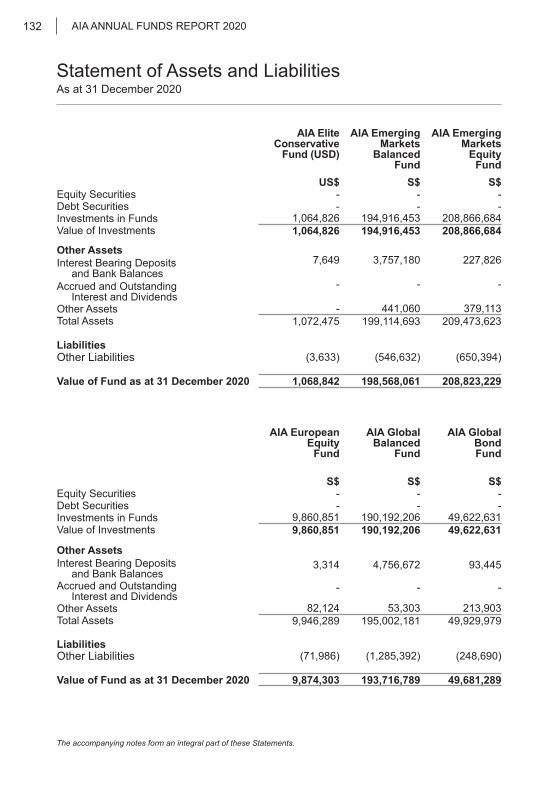
The accompanying notes form an integral part of these Statements.
Statement of Assets and LiabilitiesAs at 31 December 2020
AIA ANNUAL FUNDS REPORT 2020132
AIA Elite Conservative
Fund (USD)
AIA Emerging Markets
BalancedFund
AIA Emerging Markets
EquityFund
US$ S$ S$Equity Securities - - - Debt Securities - - - Investments in Funds 1,064,826 194,916,453 208,866,684 Value of Investments 1,064,826 194,916,453 208,866,684
Other AssetsInterest Bearing Deposits and Bank Balances
7,649 3,757,180 227,826
Accrued and Outstanding Interest and Dividends
- - -
Other Assets - 441,060 379,113 Total Assets 1,072,475 199,114,693 209,473,623
LiabilitiesOther Liabilities (3,633) (546,632) (650,394)
Value of Fund as at 31 December 2020 1,068,842 198,568,061 208,823,229
AIA European Equity
Fund
AIA Global Balanced
Fund
AIA Global BondFund
S$ S$ S$Equity Securities - - - Debt Securities - - - Investments in Funds 9,860,851 190,192,206 49,622,631 Value of Investments 9,860,851 190,192,206 49,622,631
Other AssetsInterest Bearing Deposits and Bank Balances
3,314 4,756,672 93,445
Accrued and Outstanding Interest and Dividends
- - -
Other Assets 82,124 53,303 213,903 Total Assets 9,946,289 195,002,181 49,929,979
LiabilitiesOther Liabilities (71,986) (1,285,392) (248,690)
Value of Fund as at 31 December 2020 9,874,303 193,716,789 49,681,289
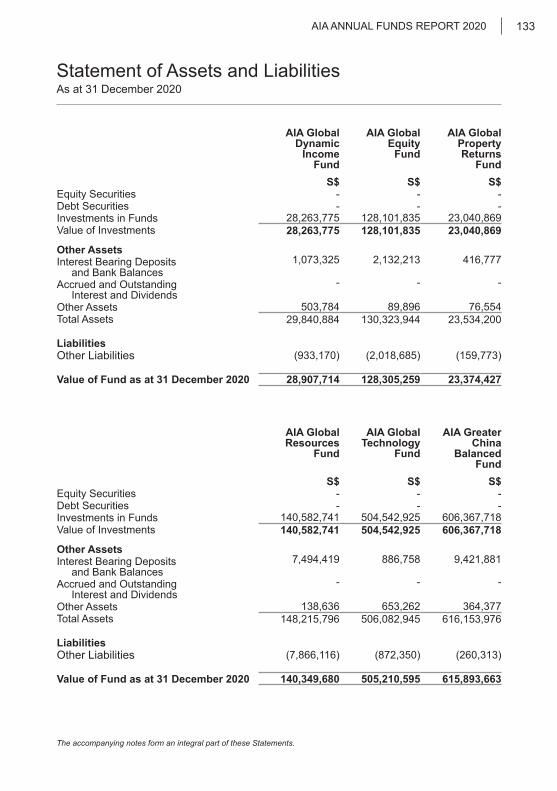
The accompanying notes form an integral part of these Statements.
Statement of Assets and LiabilitiesAs at 31 December 2020
AIA ANNUAL FUNDS REPORT 2020 133
AIA Global Dynamic
IncomeFund
AIA Global Equity
Fund
AIA Global Property Returns
FundS$ S$ S$
Equity Securities - - - Debt Securities - - - Investments in Funds 28,263,775 128,101,835 23,040,869 Value of Investments 28,263,775 128,101,835 23,040,869
Other AssetsInterest Bearing Deposits and Bank Balances
1,073,325 2,132,213 416,777
Accrued and Outstanding Interest and Dividends
- - -
Other Assets 503,784 89,896 76,554 Total Assets 29,840,884 130,323,944 23,534,200
LiabilitiesOther Liabilities (933,170) (2,018,685) (159,773)
Value of Fund as at 31 December 2020 28,907,714 128,305,259 23,374,427
AIA Global Resources
Fund
AIA Global Technology
Fund
AIA Greater China
Balanced Fund
S$ S$ S$Equity Securities - - - Debt Securities - - - Investments in Funds 140,582,741 504,542,925 606,367,718 Value of Investments 140,582,741 504,542,925 606,367,718
Other AssetsInterest Bearing Deposits and Bank Balances
7,494,419 886,758 9,421,881
Accrued and Outstanding Interest and Dividends
- - -
Other Assets 138,636 653,262 364,377 Total Assets 148,215,796 506,082,945 616,153,976
LiabilitiesOther Liabilities (7,866,116) (872,350) (260,313)
Value of Fund as at 31 December 2020 140,349,680 505,210,595 615,893,663
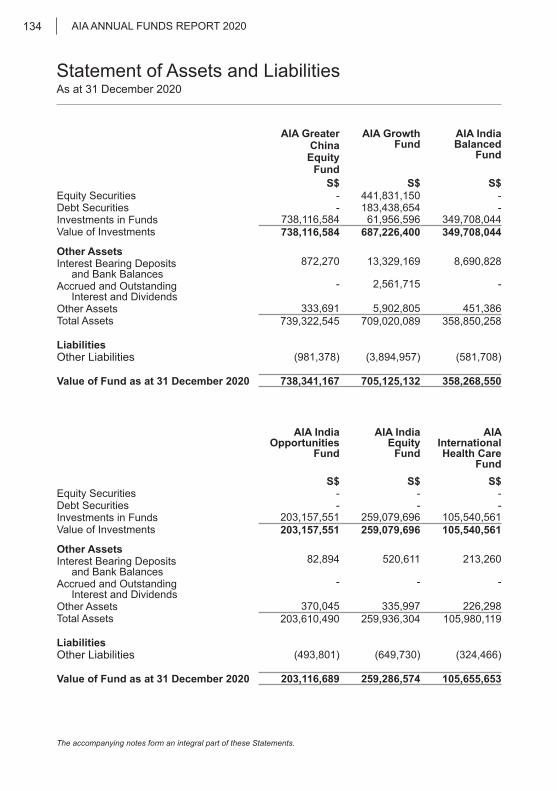
The accompanying notes form an integral part of these Statements.
Statement of Assets and LiabilitiesAs at 31 December 2020
AIA ANNUAL FUNDS REPORT 2020134
AIA Greater ChinaEquity
Fund
AIA Growth Fund
AIA India Balanced
Fund
S$ S$ S$Equity Securities - 441,831,150 - Debt Securities - 183,438,654 - Investments in Funds 738,116,584 61,956,596 349,708,044 Value of Investments 738,116,584 687,226,400 349,708,044
Other AssetsInterest Bearing Deposits and Bank Balances
872,270 13,329,169 8,690,828
Accrued and Outstanding Interest and Dividends
- 2,561,715 -
Other Assets 333,691 5,902,805 451,386 Total Assets 739,322,545 709,020,089 358,850,258
LiabilitiesOther Liabilities (981,378) (3,894,957) (581,708)
Value of Fund as at 31 December 2020 738,341,167 705,125,132 358,268,550
AIA India Opportunities
Fund
AIA India Equity
Fund
AIA International Health Care
FundS$ S$ S$
Equity Securities - - - Debt Securities - - - Investments in Funds 203,157,551 259,079,696 105,540,561 Value of Investments 203,157,551 259,079,696 105,540,561
Other AssetsInterest Bearing Deposits and Bank Balances
82,894 520,611 213,260
Accrued and Outstanding Interest and Dividends
- - -
Other Assets 370,045 335,997 226,298 Total Assets 203,610,490 259,936,304 105,980,119
LiabilitiesOther Liabilities (493,801) (649,730) (324,466)
Value of Fund as at 31 December 2020 203,116,689 259,286,574 105,655,653
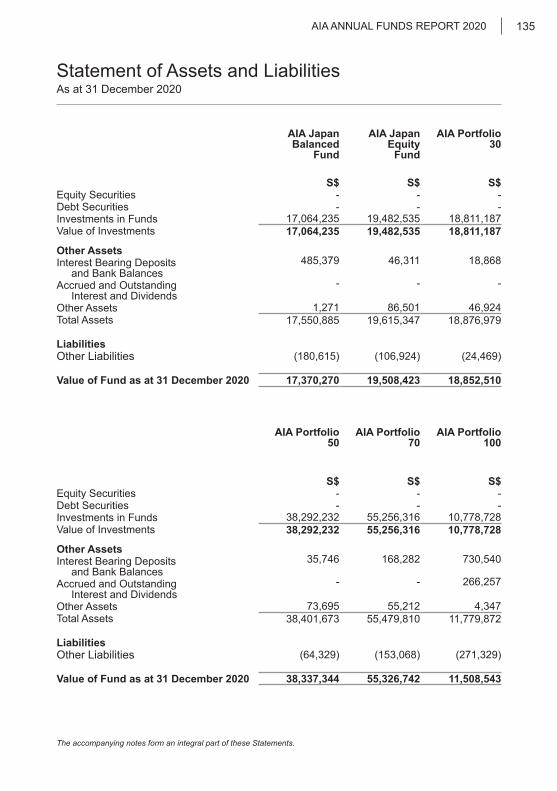
The accompanying notes form an integral part of these Statements.
Statement of Assets and LiabilitiesAs at 31 December 2020
AIA ANNUAL FUNDS REPORT 2020 135
AIA Japan Balanced
Fund
AIA Japan Equity
Fund
AIA Portfolio 30
S$ S$ S$Equity Securities - - - Debt Securities - - - Investments in Funds 17,064,235 19,482,535 18,811,187 Value of Investments 17,064,235 19,482,535 18,811,187
Other AssetsInterest Bearing Deposits and Bank Balances
485,379 46,311 18,868
Accrued and Outstanding Interest and Dividends
- - -
Other Assets 1,271 86,501 46,924 Total Assets 17,550,885 19,615,347 18,876,979
LiabilitiesOther Liabilities (180,615) (106,924) (24,469)
Value of Fund as at 31 December 2020 17,370,270 19,508,423 18,852,510
AIA Portfolio 50
AIA Portfolio 70
AIA Portfolio 100
S$ S$ S$Equity Securities - - - Debt Securities - - - Investments in Funds 38,292,232 55,256,316 10,778,728 Value of Investments 38,292,232 55,256,316 10,778,728
Other AssetsInterest Bearing Deposits and Bank Balances
35,746 168,282 730,540
Accrued and Outstanding Interest and Dividends
- - 266,257
Other Assets 73,695 55,212 4,347 Total Assets 38,401,673 55,479,810 11,779,872
LiabilitiesOther Liabilities (64,329) (153,068) (271,329)
Value of Fund as at 31 December 2020 38,337,344 55,326,742 11,508,543

The accompanying notes form an integral part of these Statements.
Statement of Assets and LiabilitiesAs at 31 December 2020
AIA ANNUAL FUNDS REPORT 2020136
AIA Multi Select 30
AIA Multi Select 50
AIA MultiSelect 70
S$ S$ S$Equity Securities - - - Debt Securities - - - Investments in Funds 682,827 4,661,019 4,824,447 Value of Investments 682,827 4,661,019 4,824,447
Other AssetsInterest Bearing Deposits and Bank Balances
16,263 5,976 5,966
Accrued and Outstanding Interest and Dividends
- - -
Other Assets - 144 375 Total Assets 699,090 4,667,139 4,830,788
LiabilitiesOther Liabilities (3,277) (3,239) (3,990)
Value of Fund as at 31 December 2020 695,813 4,663,900 4,826,798
AIA Regional Equity
Fund
AIA Regional Fixed Income
Fund
AIA S$Money
Market Fund
S$ S$ S$Equity Securities - 170,427,388 - Debt Securities - 1,473,027,911 66,963,810 Investments in Funds 1,687,858,711 - - Value of Investments 1,687,858,711 1,643,455,299 66,963,810
Other AssetsInterest Bearing Deposits and Bank Balances
1,416,085 26,413,405 8,452,637
Accrued and Outstanding Interest and Dividends
- 13,529,830 87
Other Assets 297,209 49,347,906 4,101,822 Total Assets 1,689,572,005 1,732,746,440 79,518,356
LiabilitiesOther Liabilities (2,044,349) (27,326,591) (22,261,747)
Value of Fund as at 31 December 2020 1,687,527,656 1,705,419,849 57,256,609

The accompanying notes form an integral part of these Statements.
Statement of Assets and LiabilitiesAs at 31 December 2020
AIA ANNUAL FUNDS REPORT 2020 137
AIA US Equity Fund
S$Equity Securities - Debt Securities - Investments in Funds 66,602,110 Value of Investments 66,602,110
Other AssetsInterest Bearing Deposits and Bank Balances
1,917,253
Accrued and Outstanding Interest and Dividends
-
Other Assets 48,013 Total Assets 68,567,376
LiabilitiesOther Liabilities (1,874,373)
Value of Fund as at 31 December 2020 66,693,003
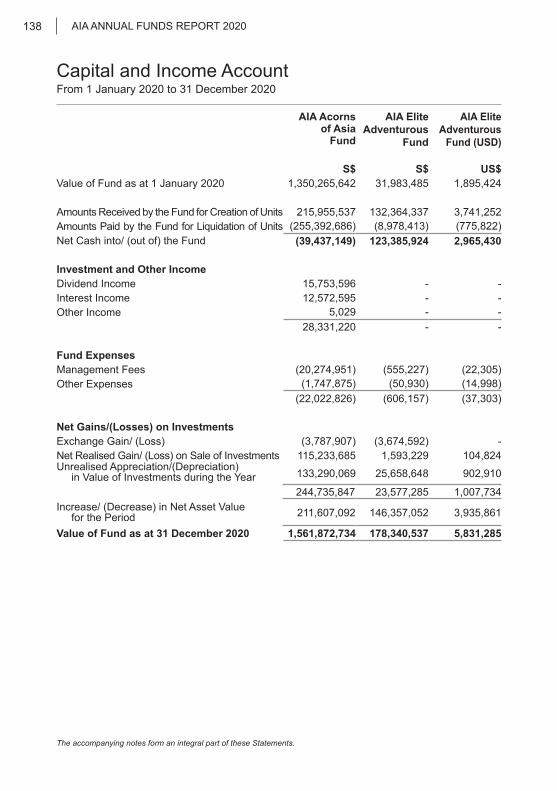
The accompanying notes form an integral part of these Statements.
Capital and Income AccountFrom 1 January 2020 to 31 December 2020
AIA ANNUAL FUNDS REPORT 2020138
AIA Acornsof Asia
Fund
AIA Elite Adventurous
Fund
AIA Elite Adventurous
Fund (USD)
S$ S$ US$ Value of Fund as at 1 January 2020 1,350,265,642 31,983,485 1,895,424
Amounts Received by the Fund for Creation of Units 215,955,537 132,364,337 3,741,252 Amounts Paid by the Fund for Liquidation of Units (255,392,686) (8,978,413) (775,822)Net Cash into/ (out of) the Fund (39,437,149) 123,385,924 2,965,430
Investment and Other IncomeDividend Income 15,753,596 - - Interest Income 12,572,595 - - Other Income 5,029 - -
28,331,220 - -
Fund ExpensesManagement Fees (20,274,951) (555,227) (22,305)Other Expenses (1,747,875) (50,930) (14,998)
(22,022,826) (606,157) (37,303)
Net Gains/(Losses) on InvestmentsExchange Gain/ (Loss) (3,787,907) (3,674,592) - Net Realised Gain/ (Loss) on Sale of Investments 115,233,685 1,593,229 104,824 Unrealised Appreciation/(Depreciation) in Value of Investments during the Year 133,290,069 25,658,648 902,910
244,735,847 23,577,285 1,007,734 Increase/ (Decrease) in Net Asset Value for the Period 211,607,092 146,357,052 3,935,861
Value of Fund as at 31 December 2020 1,561,872,734 178,340,537 5,831,285
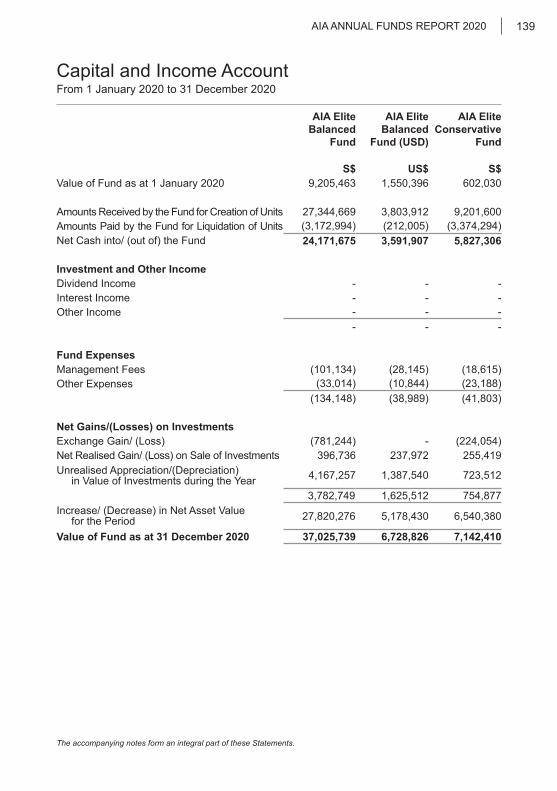
The accompanying notes form an integral part of these Statements.
Capital and Income AccountFrom 1 January 2020 to 31 December 2020
AIA ANNUAL FUNDS REPORT 2020 139
AIA Elite Balanced
Fund
AIA Elite Balanced
Fund (USD)
AIA Elite Conservative
Fund
S$ US$ S$ Value of Fund as at 1 January 2020 9,205,463 1,550,396 602,030
Amounts Received by the Fund for Creation of Units 27,344,669 3,803,912 9,201,600 Amounts Paid by the Fund for Liquidation of Units (3,172,994) (212,005) (3,374,294)Net Cash into/ (out of) the Fund 24,171,675 3,591,907 5,827,306
Investment and Other IncomeDividend Income - - - Interest Income - - - Other Income - - -
- - -
Fund ExpensesManagement Fees (101,134) (28,145) (18,615)Other Expenses (33,014) (10,844) (23,188)
(134,148) (38,989) (41,803)
Net Gains/(Losses) on InvestmentsExchange Gain/ (Loss) (781,244) - (224,054)Net Realised Gain/ (Loss) on Sale of Investments 396,736 237,972 255,419 Unrealised Appreciation/(Depreciation) in Value of Investments during the Year 4,167,257 1,387,540 723,512
3,782,749 1,625,512 754,877 Increase/ (Decrease) in Net Asset Value for the Period 27,820,276 5,178,430 6,540,380
Value of Fund as at 31 December 2020 37,025,739 6,728,826 7,142,410

The accompanying notes form an integral part of these Statements.
Capital and Income AccountFrom 1 January 2020 to 31 December 2020
AIA ANNUAL FUNDS REPORT 2020140
AIA Elite Conservative
Fund (USD)
AIA Emerging Markets
BalancedFund
AIA Emerging Markets
Equity Fund
US$ S$ S$ Value of Fund as at 1 January 2020 489,201 181,633,698 177,310,035
Amounts Received by the Fund for Creation of Units 542,785 25,162,494 67,594,402 Amounts Paid by the Fund for Liquidation of Units (115,816) (35,358,286) (71,354,728)Net Cash into/ (out of) the Fund 426,969 (10,195,792) (3,760,326)
Investment and Other IncomeDividend Income - - - Interest Income - 188 51 Other Income - 501 2,606
- 689 2,657
Fund ExpensesManagement Fees (3,839) (752,921) (781,040)Other Expenses (9,268) (23,035) (22,782)
(13,107) (775,956) (803,822)
Net Gains/(Losses) on InvestmentsExchange Gain/ (Loss) - (1,642,332) (2,693,968)Net Realised Gain/ (Loss) on Sale of Investments 18,478 11,400,490 8,103,791 Unrealised Appreciation/(Depreciation) in Value of Investments during the Year 147,301 18,147,264 30,664,862
165,779 27,905,422 36,074,685 Increase/ (Decrease) in Net Asset Value for the Period 579,641 16,934,363 31,513,194
Value of Fund as at 31 December 2020 1,068,842 198,568,061 208,823,229
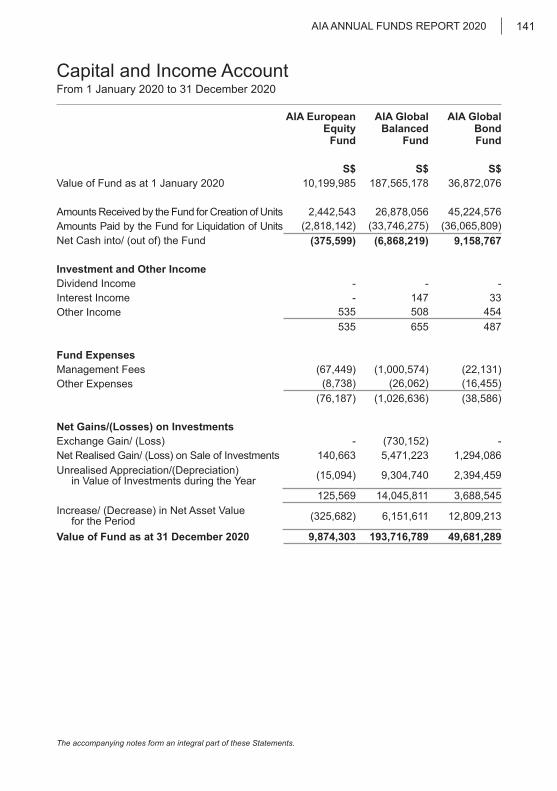
The accompanying notes form an integral part of these Statements.
Capital and Income AccountFrom 1 January 2020 to 31 December 2020
AIA ANNUAL FUNDS REPORT 2020 141
AIA European Equity
Fund
AIA Global Balanced
Fund
AIA Global BondFund
S$ S$ S$ Value of Fund as at 1 January 2020 10,199,985 187,565,178 36,872,076
Amounts Received by the Fund for Creation of Units 2,442,543 26,878,056 45,224,576 Amounts Paid by the Fund for Liquidation of Units (2,818,142) (33,746,275) (36,065,809)Net Cash into/ (out of) the Fund (375,599) (6,868,219) 9,158,767
Investment and Other IncomeDividend Income - - - Interest Income - 147 33 Other Income 535 508 454
535 655 487
Fund ExpensesManagement Fees (67,449) (1,000,574) (22,131)Other Expenses (8,738) (26,062) (16,455)
(76,187) (1,026,636) (38,586)
Net Gains/(Losses) on InvestmentsExchange Gain/ (Loss) - (730,152) - Net Realised Gain/ (Loss) on Sale of Investments 140,663 5,471,223 1,294,086 Unrealised Appreciation/(Depreciation) in Value of Investments during the Year (15,094) 9,304,740 2,394,459
125,569 14,045,811 3,688,545 Increase/ (Decrease) in Net Asset Value for the Period (325,682) 6,151,611 12,809,213
Value of Fund as at 31 December 2020 9,874,303 193,716,789 49,681,289

The accompanying notes form an integral part of these Statements.
Capital and Income AccountFrom 1 January 2020 to 31 December 2020
AIA ANNUAL FUNDS REPORT 2020142
AIA Global Dynamic
IncomeFund
AIA Global Equity
Fund
AIA Global Property Returns
Fund S$ S$ S$
Value of Fund as at 1 January 2020 - 93,526,822 20,213,557
Amounts Received by the Fund for Creation of Units 29,462,263 31,811,354 11,814,599 Amounts Paid by the Fund for Liquidation of Units (946,616) (18,237,736) (7,203,702)Net Cash into/ (out of) the Fund 28,515,647 13,573,618 4,610,897
Investment and Other IncomeDividend Income - - 573,021 Interest Income - 33 - Other Income - 2,647 758
- 2,680 573,779
Fund ExpensesManagement Fees (36,524) (512,965) (3,272)Other Expenses (6,654) (14,644) (9,474)
(43,178) (527,609) (12,746)
Net Gains/(Losses) on InvestmentsExchange Gain/ (Loss) (616,851) (1,601,887) - Net Realised Gain/ (Loss) on Sale of Investments 186,910 1,053,596 443,879 Unrealised Appreciation/(Depreciation) in Value of Investments during the Year 865,186 22,278,039 (2,454,939)
435,245 21,729,748 (2,011,060)Increase/ (Decrease) in Net Asset Value for the Period 28,907,714 34,778,437 3,160,870
Value of Fund as at 31 December 2020 28,907,714 128,305,259 23,374,427
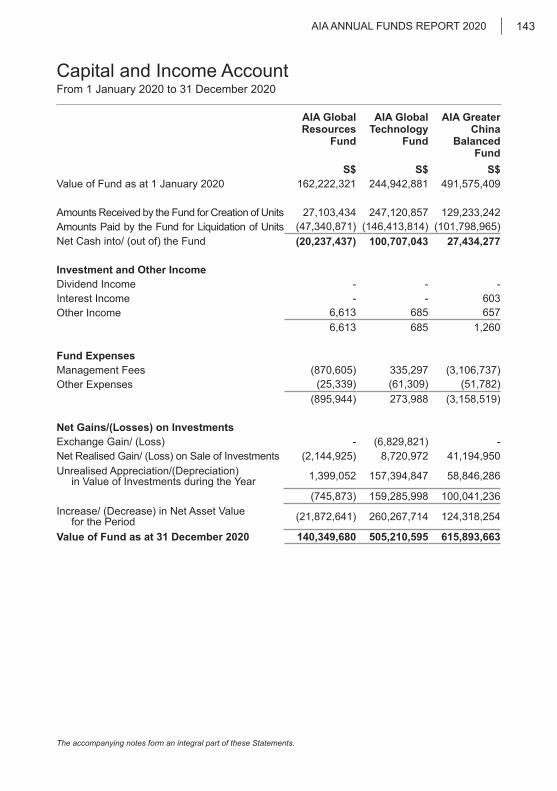
The accompanying notes form an integral part of these Statements.
Capital and Income AccountFrom 1 January 2020 to 31 December 2020
AIA ANNUAL FUNDS REPORT 2020 143
AIA Global Resources
Fund
AIA Global Technology
Fund
AIA Greater China
Balanced Fund
S$ S$ S$ Value of Fund as at 1 January 2020 162,222,321 244,942,881 491,575,409
Amounts Received by the Fund for Creation of Units 27,103,434 247,120,857 129,233,242 Amounts Paid by the Fund for Liquidation of Units (47,340,871) (146,413,814) (101,798,965)Net Cash into/ (out of) the Fund (20,237,437) 100,707,043 27,434,277
Investment and Other IncomeDividend Income - - - Interest Income - - 603 Other Income 6,613 685 657
6,613 685 1,260
Fund ExpensesManagement Fees (870,605) 335,297 (3,106,737)Other Expenses (25,339) (61,309) (51,782)
(895,944) 273,988 (3,158,519)
Net Gains/(Losses) on InvestmentsExchange Gain/ (Loss) - (6,829,821) - Net Realised Gain/ (Loss) on Sale of Investments (2,144,925) 8,720,972 41,194,950 Unrealised Appreciation/(Depreciation) in Value of Investments during the Year 1,399,052 157,394,847 58,846,286
(745,873) 159,285,998 100,041,236 Increase/ (Decrease) in Net Asset Value for the Period (21,872,641) 260,267,714 124,318,254
Value of Fund as at 31 December 2020 140,349,680 505,210,595 615,893,663
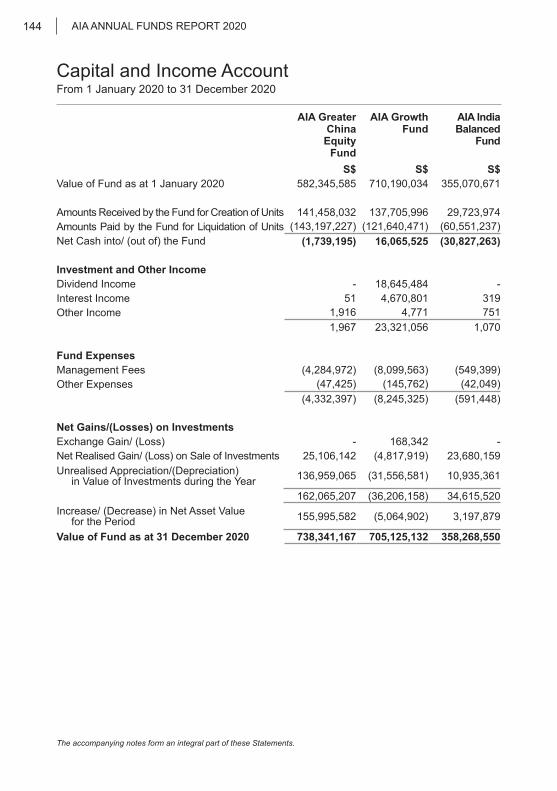
The accompanying notes form an integral part of these Statements.
Capital and Income AccountFrom 1 January 2020 to 31 December 2020
AIA ANNUAL FUNDS REPORT 2020144
AIA Greater ChinaEquity
Fund
AIA Growth Fund
AIA India Balanced
Fund
S$ S$ S$ Value of Fund as at 1 January 2020 582,345,585 710,190,034 355,070,671
Amounts Received by the Fund for Creation of Units 141,458,032 137,705,996 29,723,974 Amounts Paid by the Fund for Liquidation of Units (143,197,227) (121,640,471) (60,551,237)Net Cash into/ (out of) the Fund (1,739,195) 16,065,525 (30,827,263)
Investment and Other IncomeDividend Income - 18,645,484 - Interest Income 51 4,670,801 319 Other Income 1,916 4,771 751
1,967 23,321,056 1,070
Fund ExpensesManagement Fees (4,284,972) (8,099,563) (549,399)Other Expenses (47,425) (145,762) (42,049)
(4,332,397) (8,245,325) (591,448)
Net Gains/(Losses) on InvestmentsExchange Gain/ (Loss) - 168,342 - Net Realised Gain/ (Loss) on Sale of Investments 25,106,142 (4,817,919) 23,680,159 Unrealised Appreciation/(Depreciation) in Value of Investments during the Year 136,959,065 (31,556,581) 10,935,361
162,065,207 (36,206,158) 34,615,520 Increase/ (Decrease) in Net Asset Value for the Period 155,995,582 (5,064,902) 3,197,879
Value of Fund as at 31 December 2020 738,341,167 705,125,132 358,268,550
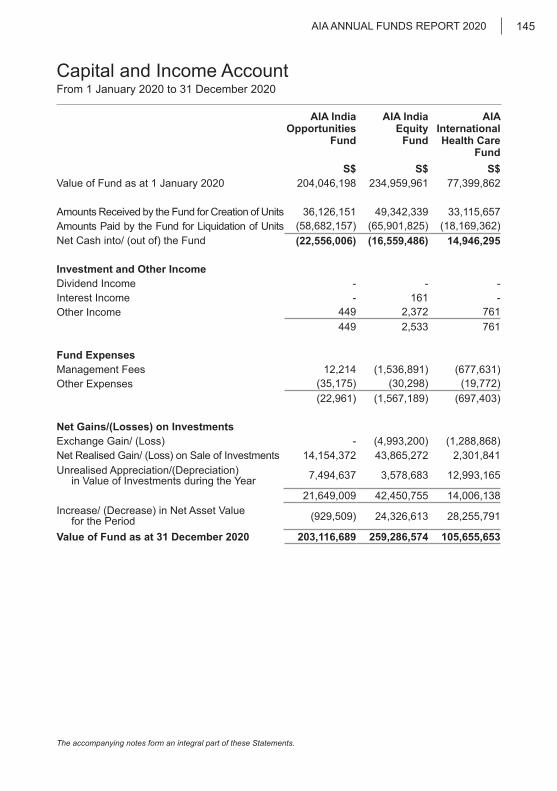
The accompanying notes form an integral part of these Statements.
Capital and Income AccountFrom 1 January 2020 to 31 December 2020
AIA ANNUAL FUNDS REPORT 2020 145
AIA India Opportunities
Fund
AIA India Equity
Fund
AIA International Health Care
Fund S$ S$ S$
Value of Fund as at 1 January 2020 204,046,198 234,959,961 77,399,862
Amounts Received by the Fund for Creation of Units 36,126,151 49,342,339 33,115,657 Amounts Paid by the Fund for Liquidation of Units (58,682,157) (65,901,825) (18,169,362)Net Cash into/ (out of) the Fund (22,556,006) (16,559,486) 14,946,295
Investment and Other IncomeDividend Income - - - Interest Income - 161 - Other Income 449 2,372 761
449 2,533 761
Fund ExpensesManagement Fees 12,214 (1,536,891) (677,631)Other Expenses (35,175) (30,298) (19,772)
(22,961) (1,567,189) (697,403)
Net Gains/(Losses) on InvestmentsExchange Gain/ (Loss) - (4,993,200) (1,288,868)Net Realised Gain/ (Loss) on Sale of Investments 14,154,372 43,865,272 2,301,841 Unrealised Appreciation/(Depreciation) in Value of Investments during the Year 7,494,637 3,578,683 12,993,165
21,649,009 42,450,755 14,006,138 Increase/ (Decrease) in Net Asset Value for the Period (929,509) 24,326,613 28,255,791
Value of Fund as at 31 December 2020 203,116,689 259,286,574 105,655,653
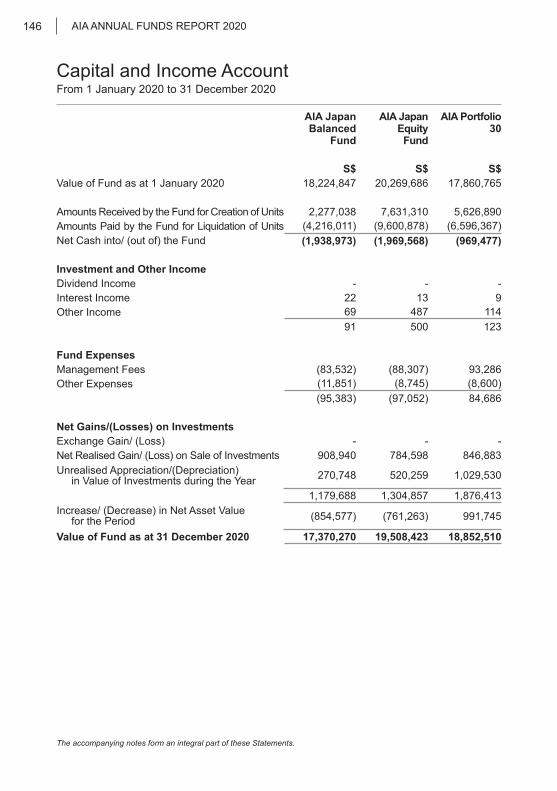
The accompanying notes form an integral part of these Statements.
Capital and Income AccountFrom 1 January 2020 to 31 December 2020
AIA ANNUAL FUNDS REPORT 2020146
AIA Japan Balanced
Fund
AIA Japan EquityFund
AIA Portfolio 30
S$ S$ S$ Value of Fund as at 1 January 2020 18,224,847 20,269,686 17,860,765
Amounts Received by the Fund for Creation of Units 2,277,038 7,631,310 5,626,890 Amounts Paid by the Fund for Liquidation of Units (4,216,011) (9,600,878) (6,596,367)Net Cash into/ (out of) the Fund (1,938,973) (1,969,568) (969,477)
Investment and Other IncomeDividend Income - - - Interest Income 22 13 9 Other Income 69 487 114
91 500 123
Fund ExpensesManagement Fees (83,532) (88,307) 93,286 Other Expenses (11,851) (8,745) (8,600)
(95,383) (97,052) 84,686
Net Gains/(Losses) on InvestmentsExchange Gain/ (Loss) - - - Net Realised Gain/ (Loss) on Sale of Investments 908,940 784,598 846,883 Unrealised Appreciation/(Depreciation) in Value of Investments during the Year 270,748 520,259 1,029,530
1,179,688 1,304,857 1,876,413 Increase/ (Decrease) in Net Asset Value for the Period (854,577) (761,263) 991,745
Value of Fund as at 31 December 2020 17,370,270 19,508,423 18,852,510

The accompanying notes form an integral part of these Statements.
Capital and Income AccountFrom 1 January 2020 to 31 December 2020
AIA ANNUAL FUNDS REPORT 2020 147
AIA Portfolio 50
AIA Portfolio 70
AIA Portfolio 100
S$ S$ S$ Value of Fund as at 1 January 2020 35,297,456 48,777,797 10,995,605
Amounts Received by the Fund for Creation of Units 3,250,034 9,761,754 2,128,821 Amounts Paid by the Fund for Liquidation of Units (4,179,978) (9,346,951) (1,929,495)Net Cash into/ (out of) the Fund (929,944) 414,803 199,326
Investment and Other IncomeDividend Income - - 505,256 Interest Income 5 11 66 Other Income 396 457 197
401 468 505,519
Fund ExpensesManagement Fees (10,034) 3,022 (13,235)Other Expenses (16,324) (16,636) (7,864)
(26,358) (13,614) (21,099)
Net Gains/(Losses) on InvestmentsExchange Gain/ (Loss) - - - Net Realised Gain/ (Loss) on Sale of Investments 795,548 1,581,240 (19,059)Unrealised Appreciation/(Depreciation) in Value of Investments during the Year 3,200,241 4,566,048 (151,749)
3,995,789 6,147,288 (170,808)Increase/ (Decrease) in Net Asset Value for the Period 3,039,888 6,548,945 512,938
Value of Fund as at 31 December 2020 38,337,344 55,326,742 11,508,543

The accompanying notes form an integral part of these Statements.
Capital and Income AccountFrom 1 January 2020 to 31 December 2020
AIA ANNUAL FUNDS REPORT 2020148
AIA Multi Select 30
AIA Multi Select 50
AIA Multi Select 70
S$ S$ S$ Value of Fund as at 1 January 2020 811,908 3,729,920 5,092,989
Amounts Received by the Fund for Creation of Units 115,054 1,158,353 687,276 Amounts Paid by the Fund for Liquidation of Units (286,248) (656,520) (1,569,221)Net Cash into/ (out of) the Fund (171,194) 501,833 (881,945)
Investment and Other IncomeDividend Income - - - Interest Income - - - Other Income 16 228 128
16 228 128
Fund ExpensesManagement Fees (585) (1,275) (991)Other Expenses (11,567) (11,570) (11,565)
(12,152) (12,845) (12,556)
Net Gains/(Losses) on InvestmentsExchange Gain/ (Loss) - - - Net Realised Gain/ (Loss) on Sale of Investments 39,716 37,975 233,855 Unrealised Appreciation/(Depreciation) in Value of Investments during the Year 27,519 406,789 394,327
67,235 444,764 628,182 Increase/ (Decrease) in Net Asset Value for the Period (116,095) 933,980 (266,191)
Value of Fund as at 31 December 2020 695,813 4,663,900 4,826,798
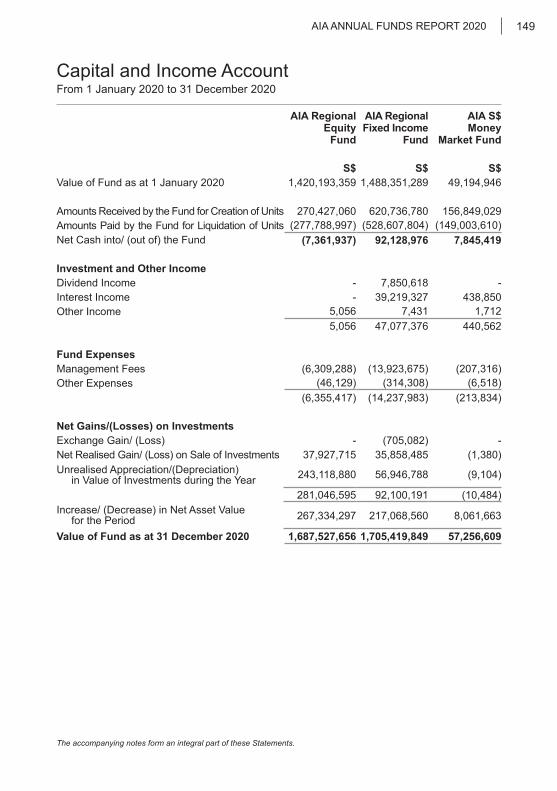
The accompanying notes form an integral part of these Statements.
Capital and Income AccountFrom 1 January 2020 to 31 December 2020
AIA ANNUAL FUNDS REPORT 2020 149
AIA Regional Equity
Fund
AIA Regional Fixed Income
Fund
AIA S$Money
Market Fund
S$ S$ S$ Value of Fund as at 1 January 2020 1,420,193,359 1,488,351,289 49,194,946
Amounts Received by the Fund for Creation of Units 270,427,060 620,736,780 156,849,029 Amounts Paid by the Fund for Liquidation of Units (277,788,997) (528,607,804) (149,003,610)Net Cash into/ (out of) the Fund (7,361,937) 92,128,976 7,845,419
Investment and Other IncomeDividend Income - 7,850,618 - Interest Income - 39,219,327 438,850 Other Income 5,056 7,431 1,712
5,056 47,077,376 440,562
Fund ExpensesManagement Fees (6,309,288) (13,923,675) (207,316)Other Expenses (46,129) (314,308) (6,518)
(6,355,417) (14,237,983) (213,834)
Net Gains/(Losses) on InvestmentsExchange Gain/ (Loss) - (705,082) - Net Realised Gain/ (Loss) on Sale of Investments 37,927,715 35,858,485 (1,380)Unrealised Appreciation/(Depreciation) in Value of Investments during the Year 243,118,880 56,946,788 (9,104)
281,046,595 92,100,191 (10,484)Increase/ (Decrease) in Net Asset Value for the Period 267,334,297 217,068,560 8,061,663
Value of Fund as at 31 December 2020 1,687,527,656 1,705,419,849 57,256,609
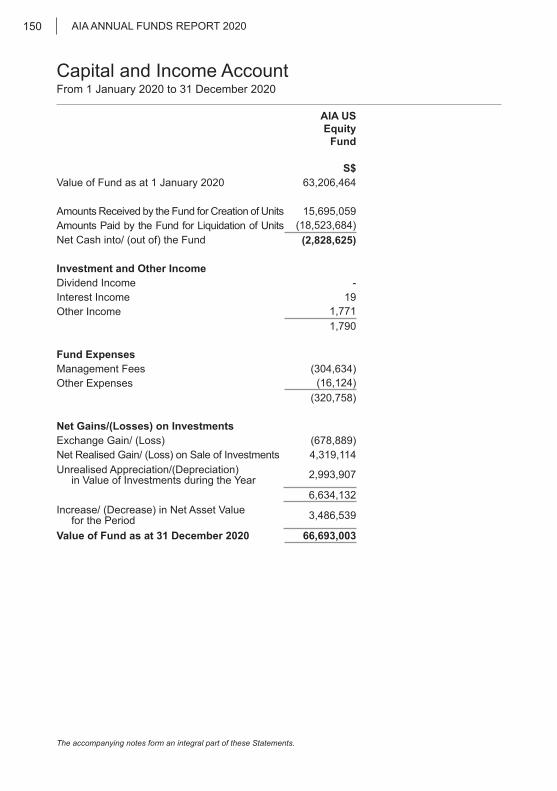
The accompanying notes form an integral part of these Statements.
Capital and Income AccountFrom 1 January 2020 to 31 December 2020
AIA ANNUAL FUNDS REPORT 2020150
AIA US Equity
Fund
S$ Value of Fund as at 1 January 2020 63,206,464
Amounts Received by the Fund for Creation of Units 15,695,059 Amounts Paid by the Fund for Liquidation of Units (18,523,684)Net Cash into/ (out of) the Fund (2,828,625)
Investment and Other IncomeDividend Income - Interest Income 19 Other Income 1,771
1,790
Fund ExpensesManagement Fees (304,634)Other Expenses (16,124)
(320,758)
Net Gains/(Losses) on InvestmentsExchange Gain/ (Loss) (678,889)Net Realised Gain/ (Loss) on Sale of Investments 4,319,114 Unrealised Appreciation/(Depreciation) in Value of Investments during the Year 2,993,907
6,634,132 Increase/ (Decrease) in Net Asset Value for the Period 3,486,539
Value of Fund as at 31 December 2020 66,693,003
As at 31 December 2020
AIA ANNUAL FUNDS REPORT 2020 151
Notes to the Statements
These notes form an integral part of and should be read in conjunction with the Statements.
1. SIGNIFICANT ACCOUNTING POLICIES
Accounting ConventionThe Statements, expressed in Singapore dollars and United States dollars, are prepared in accordance with the historical cost convention, modified by the revaluation of investments at market prices.
The Funds’ policyholders are mainly from Singapore with the subscriptions and redemptions of the units denominated in Singapore dollars and United States dollars.
Income and Expenditure RecognitionDividends are recognised when the right to receive payment is established. Interest income is recognised on a time-proportionate basis using the effective interest method. Fund expense subsidies are recognised under net management fees account. Other income and expenses are recognised on an accruals basis.
Investments at Fair ValuePurchases of investments are recognised on the trade date. Equity securities are valued at the market closing price prevailing at the balance sheet date. Debt securities are valued at the bid price prevailing at the balance sheet date. Investments in Funds are valued at quoted market prices. Changes in fair value of investments are recognised in the Capital and Income Account.
Disposal of InvestmentsSales of investments are recognised on the trade date. For the purpose of determining net realised gains or losses on sale of investment, the cost of disposal of investment is determined on the weighted average cost basis. All gains and losses are taken up in the Capital and Income Account.
Financial DerivativesFinancial derivatives are financial instruments which include forward contracts. Financial derivatives outstanding at the balance sheet date are measured at their respective fair values provided by a financial service provider. The resulting unrealised gains or losses are taken to the Capital and Income Account.
Foreign CurrenciesForeign currency monetary assets and liabilities are translated at exchange rates prevailing at the balance sheet date. Foreign currency transactions are translated at exchange rates on transaction dates. Differences in exchange are included in the Capital and Income Account.
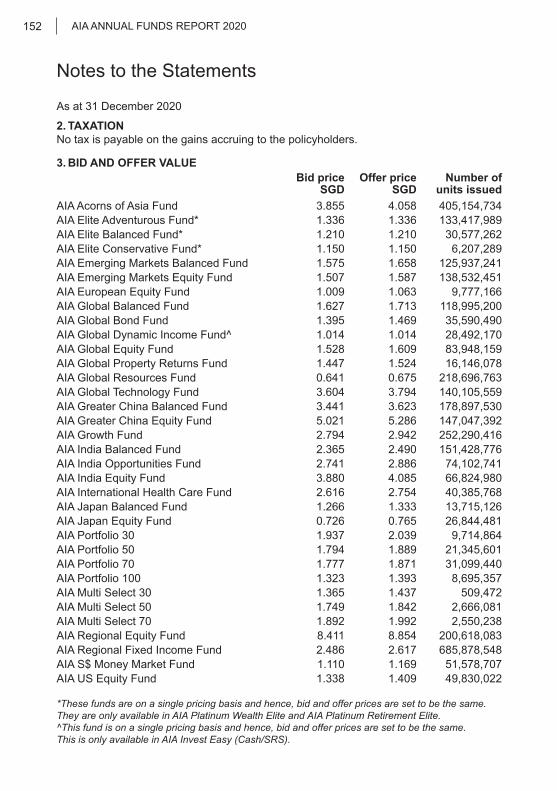
As at 31 December 2020
AIA ANNUAL FUNDS REPORT 2020152
Notes to the Statements
2. TAXATIONNo tax is payable on the gains accruing to the policyholders.
3. BID AND OFFER VALUEBid price
SGDOffer price
SGDNumber of
units issuedAIA Acorns of Asia Fund 3.855 4.058 405,154,734AIA Elite Adventurous Fund* 1.336 1.336 133,417,989AIA Elite Balanced Fund* 1.210 1.210 30,577,262AIA Elite Conservative Fund* 1.150 1.150 6,207,289AIA Emerging Markets Balanced Fund 1.575 1.658 125,937,241AIA Emerging Markets Equity Fund 1.507 1.587 138,532,451AIA European Equity Fund 1.009 1.063 9,777,166AIA Global Balanced Fund 1.627 1.713 118,995,200AIA Global Bond Fund 1.395 1.469 35,590,490AIA Global Dynamic Income Fund^ 1.014 1.014 28,492,170AIA Global Equity Fund 1.528 1.609 83,948,159AIA Global Property Returns Fund 1.447 1.524 16,146,078AIA Global Resources Fund 0.641 0.675 218,696,763AIA Global Technology Fund 3.604 3.794 140,105,559AIA Greater China Balanced Fund 3.441 3.623 178,897,530AIA Greater China Equity Fund 5.021 5.286 147,047,392AIA Growth Fund 2.794 2.942 252,290,416AIA India Balanced Fund 2.365 2.490 151,428,776AIA India Opportunities Fund 2.741 2.886 74,102,741AIA India Equity Fund 3.880 4.085 66,824,980AIA International Health Care Fund 2.616 2.754 40,385,768AIA Japan Balanced Fund 1.266 1.333 13,715,126AIA Japan Equity Fund 0.726 0.765 26,844,481AIA Portfolio 30 1.937 2.039 9,714,864AIA Portfolio 50 1.794 1.889 21,345,601AIA Portfolio 70 1.777 1.871 31,099,440AIA Portfolio 100 1.323 1.393 8,695,357AIA Multi Select 30 1.365 1.437 509,472AIA Multi Select 50 1.749 1.842 2,666,081AIA Multi Select 70 1.892 1.992 2,550,238AIA Regional Equity Fund 8.411 8.854 200,618,083AIA Regional Fixed Income Fund 2.486 2.617 685,878,548AIA S$ Money Market Fund 1.110 1.169 51,578,707AIA US Equity Fund 1.338 1.409 49,830,022
*These funds are on a single pricing basis and hence, bid and offer prices are set to be the same.They are only available in AIA Platinum Wealth Elite and AIA Platinum Retirement Elite.^This fund is on a single pricing basis and hence, bid and offer prices are set to be the same.This is only available in AIA Invest Easy (Cash/SRS).
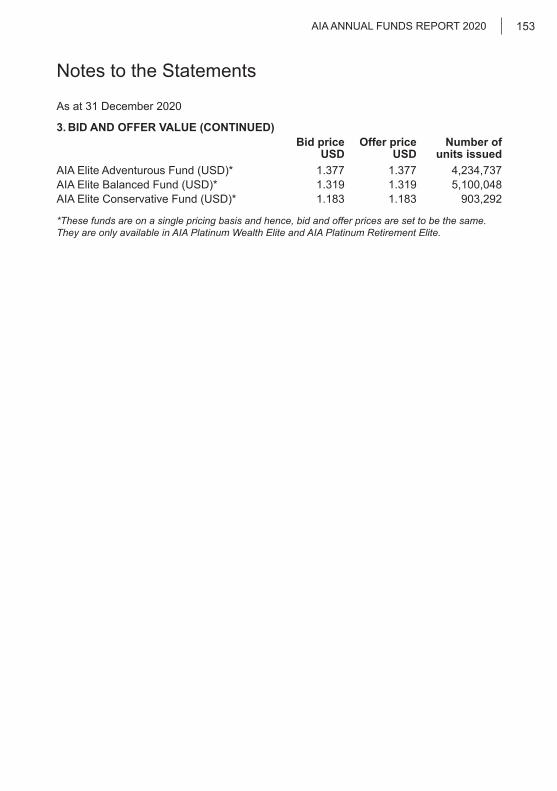
As at 31 December 2020
AIA ANNUAL FUNDS REPORT 2020 153
Notes to the Statements
3. BID AND OFFER VALUE (CONTINUED)Bid price
USDOffer price
USDNumber of
units issuedAIA Elite Adventurous Fund (USD)* 1.377 1.377 4,234,737AIA Elite Balanced Fund (USD)* 1.319 1.319 5,100,048AIA Elite Conservative Fund (USD)* 1.183 1.183 903,292
*These funds are on a single pricing basis and hence, bid and offer prices are set to be the same.They are only available in AIA Platinum Wealth Elite and AIA Platinum Retirement Elite.
AIA ANNUAL FUNDS REPORT 2020154
INDEPENDENT AUDITOR’S REPORT
INDEPENDENT AUDITOR’S REPORT TO AIA SINGAPORE PRIVATE LIMITED
Our Opinion
In our opinion, the accompanying financial statements of AIA Funds (the list of the funds is set out in Note 3) of AIA Singapore Private Limited (“the Company”) for the financial year/period ended 31 December 2020 are prepared, in all material respects, in accordance with the stated accounting policies as set out in Note 1.
What we have audited
The financial statements of the AIA Funds comprise:• the Statements of Assets and Liabilities as at 31 December 2020; • the Capital and Income Account for the financial year/period then ended; and• the notes to the financial statements, including a summary of significant accounting policies.
Basis for Opinion
We conducted our audit in accordance with Singapore Standards on Auditing (“SSAs”). Our responsibilities under those standards are further described in the Auditor’s Responsibilities for the Audit of the Financial Statements section of our report.
We believe that the audit evidence we have obtained is sufficient and appropriate to provide a basis for our opinion.
Independence
We are independent of the Company in accordance with the Accounting and Corporate Regulatory Authority Code of Professional Conduct and Ethics for Public Accountants and Accounting Entities (“ACRA Code”) together with the ethical requirements that are relevant to our audit of the financial statements in Singapore, and we have fulfilled our other ethical responsibilities in accordance with these requirements and the ACRA Code.
Emphasis of Matter - Basis of Accounting and Restriction on Distribution and Use
We draw attention to Note 1 to the financial statements which describes the basis of accounting. The financial statements are prepared to assist the Company to comply with MAS Notice 307 Investment Linked-Life Insurance Policies. As a result, the financial statements may not be suitable for another purpose. This report is intended for the sole benefit and use of the Company and is not intended to nor may it be relied upon by any other party, other than the Company. We accept no liability or responsibility to any other party to whom this report is disclosed or otherwise made available to. This report relates solely to the financial statements of the AIA Funds of the Company and does not extend to the financial statements of the Company taken as a whole. Our report is not modified in respect of this matter.
AIA ANNUAL FUNDS REPORT 2020 155
INDEPENDENT AUDITOR’S REPORT TO AIA SINGAPORE PRIVATE LIMITED (CONTINUED)
Other Information
Management is responsible for the other information. The other information comprises the relevant sections of the AIA Annual Funds Report 2020 included in pages 2 to 130 and pages 157 to 166 and excludes the financial statements and our auditor’s report thereon.
Our opinion on the financial statements does not cover the other information and we do not express any form of assurance conclusion thereon.
In connection with our audit of the financial statements, our responsibility is to read the other information and, in doing so, consider whether the other information is materially inconsistent with the financial statements or our knowledge obtained in the audit, or otherwise appears to be materially misstated. If, based on the work we have performed on the other information, we conclude that there is a material misstatement of this other information, we are required to report that fact. We have nothing to report in this regard.
Responsibilities of the Management and Those Charged with Governance for the Financial Statements
Management and Those Charged with Governance is responsible for the preparation of the financial statements in accordance with the accounting policies set out in Note 1, and for such internal control as Management and Those Charged with Governance determines is necessary to enable the preparation of the financial statements that are free from material misstatement, whether due to fraud or error.
In preparing the financial statements, Management and Those Charged with Governance are responsible for assessing the AIA Funds’ ability to continue as a going concern, disclosing, as applicable, matters related to going concern and using the going concern basis of accounting unless Management and Those Charged with Governance either intend to terminate the AIA Funds or to cease the AIA Funds’ operations, or have no realistic alternative but to do so.
Auditor’s Responsibilities for the Audit of the Financial Statements
Our objectives are to obtain reasonable assurance about whether the financial statements as a whole are free from material misstatement, whether due to fraud or error, and to issue an auditor’s report that includes our opinion. Reasonable assurance is a high level of assurance, but is not a guarantee that an audit conducted in accordance with SSAs will always detect a material misstatement when it exists. Misstatements can arise from fraud or error and are considered material if, individually or in the aggregate, they could reasonably be expected to influence the economic decisions of users taken on the basis of these financial statements.
AIA ANNUAL FUNDS REPORT 2020156
INDEPENDENT AUDITOR’S REPORT TO AIA SINGAPORE PRIVATE LIMITED (CONTINUED)
As part of an audit in accordance with SSAs, we exercise professional judgement and maintain professional scepticism throughout the audit. We also:
• Identify and assess the risks of material misstatement of the financial statements, whether due to fraud or error, design and perform audit procedures responsive to those risks, and obtain audit evidence that is sufficient and appropriate to provide a basis for our opinion. The risk of not detecting a material misstatement resulting from fraud is higher than for one resulting from error, as fraud may involve collusion, forgery, intentional omissions, misrepresentations, or the override of internal control.
• Obtain an understanding of internal control relevant to the audit in order to design audit procedures that are appropriate in the circumstances, but not for the purpose of expressing an opinion on the effectiveness of the Company’s internal control.
• Evaluate the appropriateness of accounting policies used and the reasonableness of accounting estimates and related disclosures made by management.
• Conclude on the appropriateness of management’s use of the going concern basis of accounting and, based on the audit evidence obtained, whether a material uncertainty exists related to events or conditions that may cast significant doubt on the AIA Funds’ ability to continue as a going concern. If we conclude that a material uncertainty exists, we are required to draw attention in our auditor’s report to the related disclosures in the financial statements or, if such disclosures are inadequate, to modify our opinion. Our conclusions are based on the audit evidence obtained up to the date of our auditor’s report. However, future events or conditions may cause the AIA Funds to cease to continue as a going concern.
We communicate with those charged with governance regarding, among other matters, the planned scope and timing of the audit and significant audit findings, including any significant deficiencies in internal control that we identify during our audit.
Public Accountants and Chartered AccountantsSingapore, 10 March 2021

AIA ANNUAL FUNDS REPORT 2020 157
It is important for you to know and understand your risk tolerance level as well as the level of risk associated with your investment before making any investment decisions. The investment options available to you may have very different features and risk profiles. Some of these investment features may contain higher risks than others.
The Strategic Asset Allocation which was constructed for AIA by Mercer provided herein is provided for reference only. The information contained herein does not take into account your particular investment objectives, financial situations or needs, nor is it intended to be an individualized investment advice relating to your particular circumstances. No investment decision should be made based on this information without first obtaining appropriate professional advice and considering your circumstances.1
The Guided Portfolio is how you can use AIA’s ILP funds to apply the Strategic Asset Allocation developed by Mercer.
You may contact our AIA Customer Service at 1800 248 8000 or [email protected] or contact your AIA Financial Services Consultant to adjust your portfolio to the new Guided Portfolio.
1 See Important Notices on the last page of this section.
Annual Strategic Asset Allocation Update for
Guided Portfolios
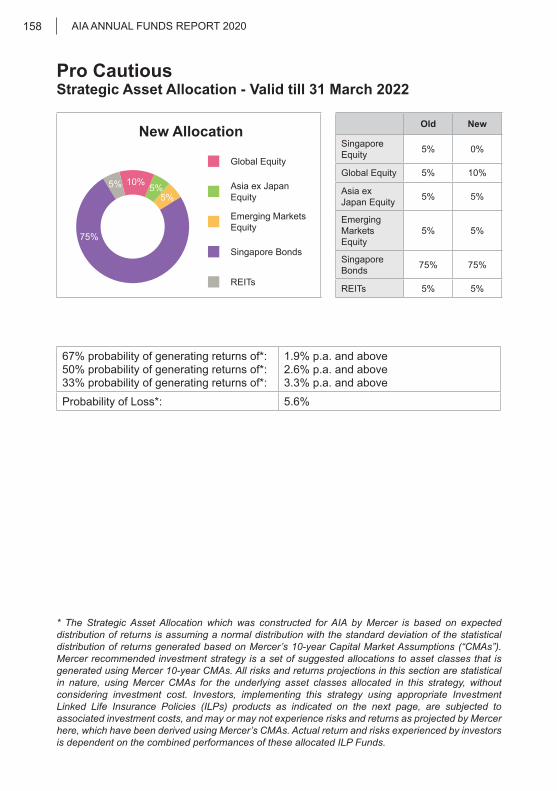
AIA ANNUAL FUNDS REPORT 2020158
Old New
Singapore Equity 5% 0%
Global Equity 5% 10%
Asia ex Japan Equity 5% 5%
Emerging Markets Equity
5% 5%
Singapore Bonds 75% 75%
REITs 5% 5%
67% probability of generating returns of*: 50% probability of generating returns of*: 33% probability of generating returns of*:
1.9% p.a. and above2.6% p.a. and above3.3% p.a. and above
Probability of Loss*: 5.6%
* The Strategic Asset Allocation which was constructed for AIA by Mercer is based on expected distribution of returns is assuming a normal distribution with the standard deviation of the statistical distribution of returns generated based on Mercer’s 10-year Capital Market Assumptions (“CMAs”). Mercer recommended investment strategy is a set of suggested allocations to asset classes that is generated using Mercer 10-year CMAs. All risks and returns projections in this section are statistical in nature, using Mercer CMAs for the underlying asset classes allocated in this strategy, without considering investment cost. Investors, implementing this strategy using appropriate Investment Linked Life Insurance Policies (ILPs) products as indicated on the next page, are subjected to associated investment costs, and may or may not experience risks and returns as projected by Mercer here, which have been derived using Mercer’s CMAs. Actual return and risks experienced by investors is dependent on the combined performances of these allocated ILP Funds.
Pro CautiousStrategic Asset Allocation - Valid till 31 March 2022
New Allocation
Global Equity
Asia ex Japan Equity
Emerging Markets Equity
Singapore Bonds
REITs
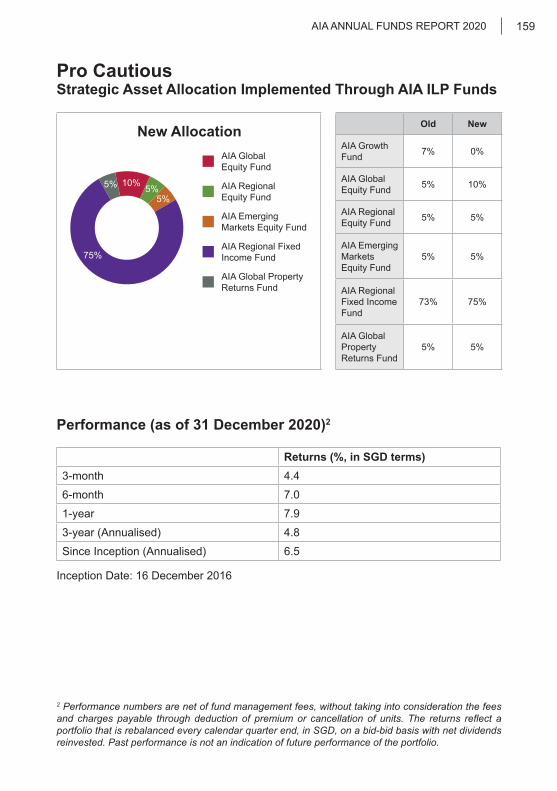
AIA ANNUAL FUNDS REPORT 2020 159
2 Performance numbers are net of fund management fees, without taking into consideration the fees and charges payable through deduction of premium or cancellation of units. The returns reflect a portfolio that is rebalanced every calendar quarter end, in SGD, on a bid-bid basis with net dividends reinvested. Past performance is not an indication of future performance of the portfolio.
Old New
AIA Growth Fund 7% 0%
AIA Global Equity Fund 5% 10%
AIA Regional Equity Fund 5% 5%
AIA Emerging Markets Equity Fund
5% 5%
AIA Regional Fixed Income Fund
73% 75%
AIA Global Property Returns Fund
5% 5%
Performance (as of 31 December 2020)2
Returns (%, in SGD terms)3-month 4.4
6-month 7.0
1-year 7.9
3-year (Annualised) 4.8
Since Inception (Annualised) 6.5
Inception Date: 16 December 2016
Pro CautiousStrategic Asset Allocation Implemented Through AIA ILP Funds
New AllocationAIA Global Equity Fund
AIA Regional Equity Fund
AIA Emerging Markets Equity Fund
AIA Regional Fixed Income Fund
AIA Global PropertyReturns Fund

AIA ANNUAL FUNDS REPORT 2020160
* The Strategic Asset Allocation which was constructed for AIA by Mercer is based on expected distribution of returns is assuming a normal distribution with the standard deviation of the statistical distribution of returns generated based on Mercer’s 10-year Capital Market Assumptions (“CMAs”). Mercer recommended investment strategy is a set of suggested allocations to asset classes that is generated using Mercer 10-year CMAs. All risks and returns projections in this section are statistical in nature, using Mercer CMAs for the underlying asset classes allocated in this strategy, without considering investment cost. Investors, implementing this strategy using appropriate Investment Linked Life Insurance Policies (ILPs) products as indicated on the next page, are subjected to associated investment costs, and may or may not experience risks and returns as projected by Mercer here, which have been derived using Mercer’s CMAs. Actual return and risks experienced by investors is dependent on the combined performances of these allocated ILP Funds.
Old New
Singapore Equity 10% 0%
Global Equity 15% 20%
Asia ex Japan Equity 15% 15%
Singapore Bonds 45% 45%
Greater China Equity 0% 5%
Emerging Markets Equity
10% 10%
REITs 5% 5%
67% probability of generating returns of*: 50% probability of generating returns of*: 33% probability of generating returns of*:
2.9% p.a. and above4.4% p.a. and above6.0% p.a. and above
Probability of Loss*: 10.3%
Pro BalancedStrategic Asset Allocation - Valid till 31 March 2022
New Allocation
Global Equity
Asia ex Japan Equity
Singapore Bonds
Greater China Equity
Emerging Markets Equity
REITs

AIA ANNUAL FUNDS REPORT 2020 161
3 Performance numbers are net of fund management fees, without taking into consideration the fees and charges payable through deduction of premium or cancellation of units. The returns reflect a portfolio that is rebalanced every calendar quarter end, in SGD, on a bid-bid basis with net dividends reinvested. Past performance is not an indication of future performance of the portfolio.
New AllocationAIA Global Equity Fund
AIA Regional Equity Fund
AIA Regional Fixed Income Fund
AIA Greater China Equity Fund
AIA Emerging Markets Equity Fund
AIA Global Property Returns Fund
Old New
AIA Growth Fund 14% 0%
AIA Global Equity Fund 15% 20%
AIA Regional Equity Fund 15% 15%
AIA Regional Fixed Income Fund
41% 45%
AIA Greater China Equity Fund
0% 5%
AIA Emerging Markets Equity Fund
10% 10%
AIA Global Property Returns Fund
5% 5%
Performance (as of 31 December 2020)3
Returns ((%, in SGD terms)3-month 8.4
6-month 13.0
1-year 10.1
3-year (Annualised) 5.7
Since Inception (Annualised) 8.2
Inception Date: 16 December 2016
Pro BalancedStrategic Asset Allocation Implemented Through AIA ILP Funds

AIA ANNUAL FUNDS REPORT 2020162
* The Strategic Asset Allocation which was constructed for AIA by Mercer is based on expected distribution of returns is assuming a normal distribution with the standard deviation of the statistical distribution of returns generated based on Mercer’s 10-year Capital Market Assumptions (“CMAs”). Mercer recommended investment strategy is a set of suggested allocations to asset classes that is generated using Mercer 10-year CMAs. All risks and returns projections in this section are statistical in nature, using Mercer CMAs for the underlying asset classes allocated in this strategy, without considering investment cost. Investors, implementing this strategy using appropriate Investment Linked Life Insurance Policies (ILPs) products as indicated on the next page, are subjected to associated investment costs, and may or may not experience risks and returns as projected by Mercer here, which have been derived using Mercer’s CMAs. Actual return and risks experienced by investors is dependent on the combined performances of these allocated ILP Funds.
New AllocationGreater China Equity
Global Equity
Asia ex Japan Equity
Emerging Markets Equity
Singapore Bonds
REITs
Old New
Singapore Equity 10% 0%
Global Equity 25% 30%
Asia ex Japan Equity 20% 20%
Emerging Markets Equity
20% 20%
Singapore Bonds 20% 20%
Greater China Equity 0% 5%
REITs 5% 5%
67% probability of generating returns of*: 50% probability of generating returns of*: 33% probability of generating returns of*:
3.3% p.a. and above5.5% p.a. and above7.8% p.a. and above
Probability of Loss*: 13.6%
Pro OptimiserStrategic Asset Allocation - Valid till 31 March 2022
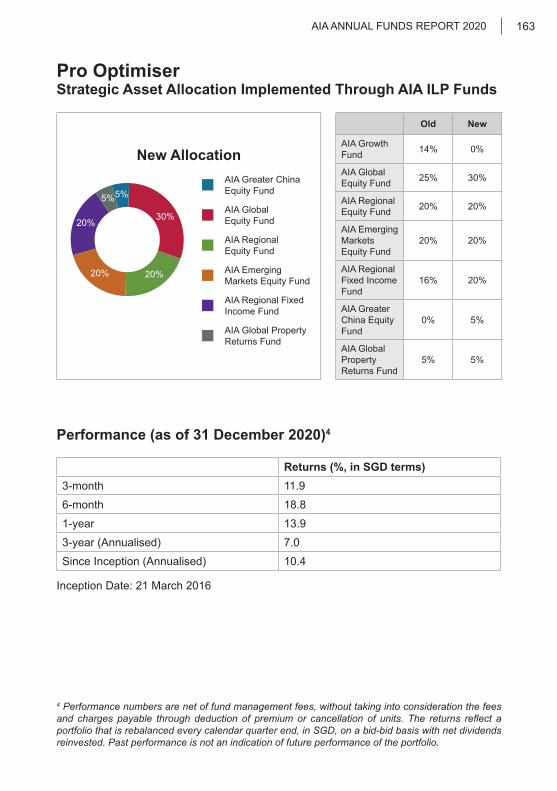
AIA ANNUAL FUNDS REPORT 2020 163
4 Performance numbers are net of fund management fees, without taking into consideration the fees and charges payable through deduction of premium or cancellation of units. The returns reflect a portfolio that is rebalanced every calendar quarter end, in SGD, on a bid-bid basis with net dividends reinvested. Past performance is not an indication of future performance of the portfolio.
New AllocationAIA Greater China Equity Fund
AIA Global Equity Fund
AIA Regional Equity Fund
AIA Emerging Markets Equity Fund
AIA Regional Fixed Income Fund
AIA Global Property Returns Fund
Old New
AIA Growth Fund 14% 0%
AIA Global Equity Fund 25% 30%
AIA Regional Equity Fund 20% 20%
AIA Emerging Markets Equity Fund
20% 20%
AIA Regional Fixed Income Fund
16% 20%
AIA Greater China Equity Fund
0% 5%
AIA Global Property Returns Fund
5% 5%
Performance (as of 31 December 2020)4
Returns (%, in SGD terms)3-month 11.9
6-month 18.8
1-year 13.9
3-year (Annualised) 7.0
Since Inception (Annualised) 10.4
Inception Date: 21 March 2016
Pro OptimiserStrategic Asset Allocation Implemented Through AIA ILP Funds

AIA ANNUAL FUNDS REPORT 2020164
* The Strategic Asset Allocation which was constructed for AIA by Mercer is based on expected distribution of returns is assuming a normal distribution with the standard deviation of the statistical distribution of returns generated based on Mercer’s 10-year Capital Market Assumptions (“CMAs”). Mercer recommended investment strategy is a set of suggested allocations to asset classes that is generated using Mercer 10-year CMAs. All risks and returns projections in this section are statistical in nature, using Mercer CMAs for the underlying asset classes allocated in this strategy, without considering investment cost. Investors, implementing this strategy using appropriate Investment Linked Life Insurance Policies (ILPs) products as indicated on the next page, are subjected to associated investment costs, and may or may not experience risks and returns as projected by Mercer here, which have been derived using Mercer’s CMAs. Actual return and risks experienced by investors is dependent on the combined performances of these allocated ILP Funds.
Pro AdventurousStrategic Asset Allocation - Valid till 31 March 2022
Old New
Singapore Equity 15% 0%
Global Equity 25% 30%
Emerging Markets Equity
20% 20%
Asia ex Japan Equity 25% 30%
Singapore Bonds 10% 10%
Greater China Equity 0% 5%
REITs 5% 5%
67% probability of generating returns of*: 50% probability of generating returns of*: 33% probability of generating returns of*:
3.5% p.a. and above6.0% p.a. and above8.7% p.a. and above
Probability of Loss*: 14.6%
New AllocationGreater China Equity
Global Equity
Emerging Markets Equity
Asia ex Japan Equity
Singapore Bonds
REITs
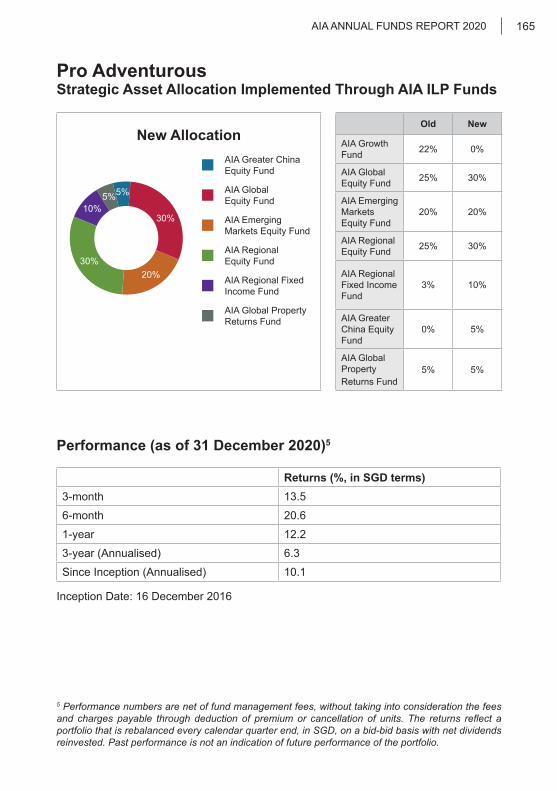
AIA ANNUAL FUNDS REPORT 2020 165
5 Performance numbers are net of fund management fees, without taking into consideration the fees and charges payable through deduction of premium or cancellation of units. The returns reflect a portfolio that is rebalanced every calendar quarter end, in SGD, on a bid-bid basis with net dividends reinvested. Past performance is not an indication of future performance of the portfolio.
Pro AdventurousStrategic Asset Allocation Implemented Through AIA ILP Funds
New AllocationAIA Greater China Equity Fund
AIA Global Equity Fund
AIA Emerging Markets Equity Fund
AIA Regional Equity Fund
AIA Regional Fixed Income Fund
AIA Global Property Returns Fund
Old New
AIA Growth Fund 22% 0%
AIA Global Equity Fund 25% 30%
AIA Emerging Markets Equity Fund
20% 20%
AIA Regional Equity Fund 25% 30%
AIA Regional Fixed Income Fund
3% 10%
AIA Greater China Equity Fund
0% 5%
AIA Global Property Returns Fund
5% 5%
Performance (as of 31 December 2020)5
Returns (%, in SGD terms)3-month 13.5
6-month 20.6
1-year 12.2
3-year (Annualised) 6.3
Since Inception (Annualised) 10.1
Inception Date: 16 December 2016
AIA ANNUAL FUNDS REPORT 2020166
Important Notices
This material has been prepared by Mercer for the use of AIA and is for informational purposes only. Investments in the ILP sub-fund(s) are subject to investment risks including the possible loss of the principal amount invested. Investments in the ILP sub-fund(s) are subject to investment risks including the possible loss of the principal amount invested. The performance of the ILP sub-fund(s) is not guaranteed and the value of the units in the ILP sub-fund(s) and the income accruing to the units, if any, may fall or rise. Past performance is not necessarily indicative of the future performance of the ILP sub-fund(s). Any access to confidential and proprietary information via Guided Portfolios that may be developed by AIA is intended for your exclusive reference, for general information purposes only. This information is not, nor intended to be, investment advice and shall not be relied on as such. AIA via Guided Portfolios do not give any representations or warranties as to the accuracy of any information provided to you and does not accept any responsibility or liability for any loss or damage which you may suffer arising out of or in connection with your purchase. Where appropriate, you are encouraged to seek independent legal, tax and other professional advice. This does not constitute an offer or a solicitation of an offer to buy or sell securities, commodities and/or any other financial instruments or products or constitute a solicitation on behalf of any of the investment managers, their affiliates, products or strategies the information of which may be contained herein. Such an offer may be made only by delivery of separate confidential offering documents to institutional investors or other qualified investors pursuant to the private placement provisions of the Securities and Futures Act (Cap. 289 of Singapore) and relevant rules and regulations. The contents and information contained herein have not been reviewed nor endorsed by the Monetary Authority of Singapore and/or any other regulatory authorities. Guided Portfolio investors are clients of AIA, not of Mercer. References to Mercer shall be construed to include Mercer LLC and/or its associated companies and include Mercer Investment Solutions (Singapore) Pte. Ltd. which provides AIA with certain non-discretionary investment consulting services.

This page is left intentionally blank.

This page is left intentionally blank.

AIA Singapore Private Limited (Reg. No. 201106386R)
1 Robinson Road, AIA Tower, Singapore 048542 Monday - Friday 8.45am - 5.30pm AIA Customer Care Hotline: 1800 248 8000 aia.com.sg