q n94-33468 nasa/larc jet plume research · q n94-33468 nasa/larc jet plume research john m....
TRANSCRIPT
q N94- 33468
NASA/LARC JET PLUME RESEARCH
JOHN M. SEINER, MICHAEL K. PONTON, AND JAMES C. MANNING
NASA LANGLEY RESEARCH CENTER
HAMPTON, VA
FIRST ANNUAL
HIGH-SPEED RESEARCH WORKSHOP
MAY 14-16, 1991
P_IE'-C_?Ir_T3 P_":;E _l:_.t,._r_ l"_(_T PI[.M_,'D 609
https://ntrs.nasa.gov/search.jsp?R=19940028962 2018-06-12T08:36:09+00:00Z

SCOPE OF RESEARCH
The following provides a summary for research being conducted by
NASA/LaRC and its contractors and grantees to develop jet engine noise
suppression technology under the NASA High Speed Research (HSR) program
for the High Speed Civil Transport (HSCT). The objective of this effort
is to explore new innovative concepts for reducing noise to Federally
mandated guidelines with minimum compromise on engine performance both in
take-off and cruise. The research program is divided into four major
technical areas as outlined below,
OUTLINE
A - JET NOISE RESEARCH ON ADVANCED NOZZLES
1 - LANGLEY AXISYMMETRIC MIXED FLOW NOZZLE
2 - PRATT & WHITNEY 2-D HYPERMIX NOZZLE
3 - HIGH TEMPERATURE EJECTOR LINERS4 - BOEING NACA NOZZLE5 - LANGLEY FORWARD FLIGHT SIMULATOR
6 - LDV AND WATER COOLED PROBE DEVELOPMENTS
B - PLUME PREDICTION AND VALIDATION
1 - EVALUATION OF RNS TO BASELINE AXISYMMETRIC JETS2 - AXISYMMETRIC PLUG VALIDATION EXPERIMENT3 - EVALUATION OF COMPRESSIBLE TURBULENCE MODELS
4 - SHOCK/VORTEX INTERACTION STUDY
C - PASSIVE AND ACTIVE CONTROL
1 - NOZZLE GEOMETRY EFFECTS
2 - MULTIPLE JET INTERACTIONS
3 - CURVED JET MIXING
4 - ACTIVE CONTROL OF INITIAL JET SHEAR LAYER
D - METHODOLOGY FOR NOISE PREDICTION
1 - SUPERSONIC INSTABILITY WAVES
2 - NON-LINEAR WAVE INTERACTIONS
3 - COMPRESSIBLE RAYLEIGH EQUATION DEVELOPMENT4 - PREDICTION OF NOISE FOR NON-ROUND JET GEOMETRY
5 - LOW REYNOLDS NUMBER RESEARCH
610
AI - LANGLEY AXISYMMETRIC MIXED FLOW NOZZLE
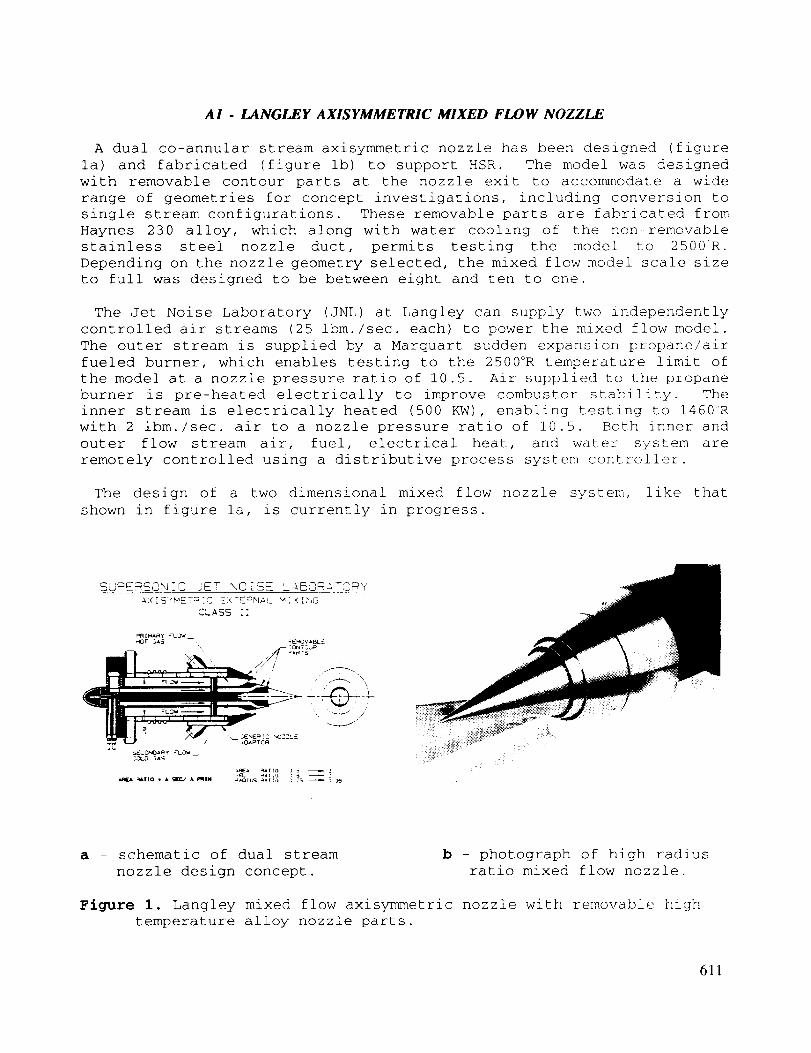
A dual co-annular stream axisymmetric nozzle has been designed (figure
la) and fabricated (figure ib) to support HSR. The model was designed
with removable contour parts at the nozzle exit to accommodate a wide
range of geometries for concept investigations, including conversion to
single stream configurations. These removable parts are fabricated from
Haynes 230 alloy, which along with water cooling of the non-removable
stainless steel nozzle duct, permits testing the model to 2500R.
Depending on the nozzle geometry selected, the mixed flow model scale size
to full was designed to be between eight and ten to one.
The Jet Noise Laboratory (JNL) at Langley can supply two independently
controlled air streams (25 ibm./sec, each) to power the mixed flow model.
The outer stream is supplied by a Marquart sudden expansion propane/air
fueled burner, which enables testing to the 2500°R temperature limit of
the model at a nozzle pressure ratio of 10.5. Air supplied to the propane
burner is pre-heated electrically to improve combustor stability. The
inner stream is electrically heated (500 KW), enabling testing to 1460°R
with 2 ibm./sec, air to a nozzle pressure ratio of 10.5. Both inner and
outer flow stream air, fuel, electrical heat, and water system are
remotely controlled using a distributive process system controller.
The design of a two dimensional mixed flow nozzle system, like that
shown in figure la, is currently in progress.
SU_E_SON[C lET ×_@ZSE L_OR:TSRY: ;'< _S'<"4ETm ' C E:< TEPr',;AL 'a [ < [,_G
CLASS i I
_,REA _ATIO • • _ A _IN,m. _AT:3 ;
aAo[us _At:o 3"5 _ ) 95
a - schematic of dual stream
nozzle design concept.
b - photograph of high radius
ratio mixed flow nozzle.
Figure i. Langley mixed flow axisymmetric nozzle with removable high
temperature alloy nozzle parts.
611

A2 - PRATT & WHITNEY 2-D HYPERMIX NOZZLE
A sharp focus schlieren apparatus with imaging radiometer is being
developed at Langley to provide flow visualization for diagnostic
evaluation of individual mixer elements of the Pratt & Whitney 2-D mixer
ejector nozzle. This nozzle is scheduled for test later this year in the
NASA Lewis 9 X 15 foot wind tunnel.
As shown in figure 2, the model contains four mixer lobes. These lobes
were designed as convergent-divergent passages to minimize shock noise.
High temperature air (2000<'R) is ducted from the NASA/Lewis hydrogen/air
fueled propulsion model through these mixer lobes. In addition to the
noise reduction produced by mass flow augmentation by the ejector, the
model additionally reduces noise through the creation of large scale axial
vorticity on the nozzle afterbody. The large scale vorticity accelerates
mixing of external air with hot flow from the lobes, thereby reducing flow
velocity and noise.
The flow visualization experiments will enable interpretation of noise
reduction to the flow physics inside the ejector. Figure 3 provides a
schematic for the sharp focus schlieren apparatus being assembled for the
NASA/Lewis tunnel. The designed of this apparatus is based on the methods
developed by Weinstein (1991). The optical axis is vertical. The
ejector's flat sidewalls will be replaced with a set having optical
viewports. The optical glass is Infrasil 302, which transmits in the
infra-red to 3.2 microns. This glass can be ground to achieve schlieren
quality. A double pulsed ND-YAG laser with 35 mJ output in the green (532
nm) is the light source. This laser can be fired as a single shot laser
or synchronized externally at 30 Hz. to a video camera. The laser's pulse
duration is 7 nsec, thus allowing instantaneous view of flow features.
Figure 2. Pratt & Whitney 2-D mixer ejector nozzle in NASA/Lewis 9 X 15
612
A2 - APPLICATION OF SHARP FOCUSED SCHLIEREN
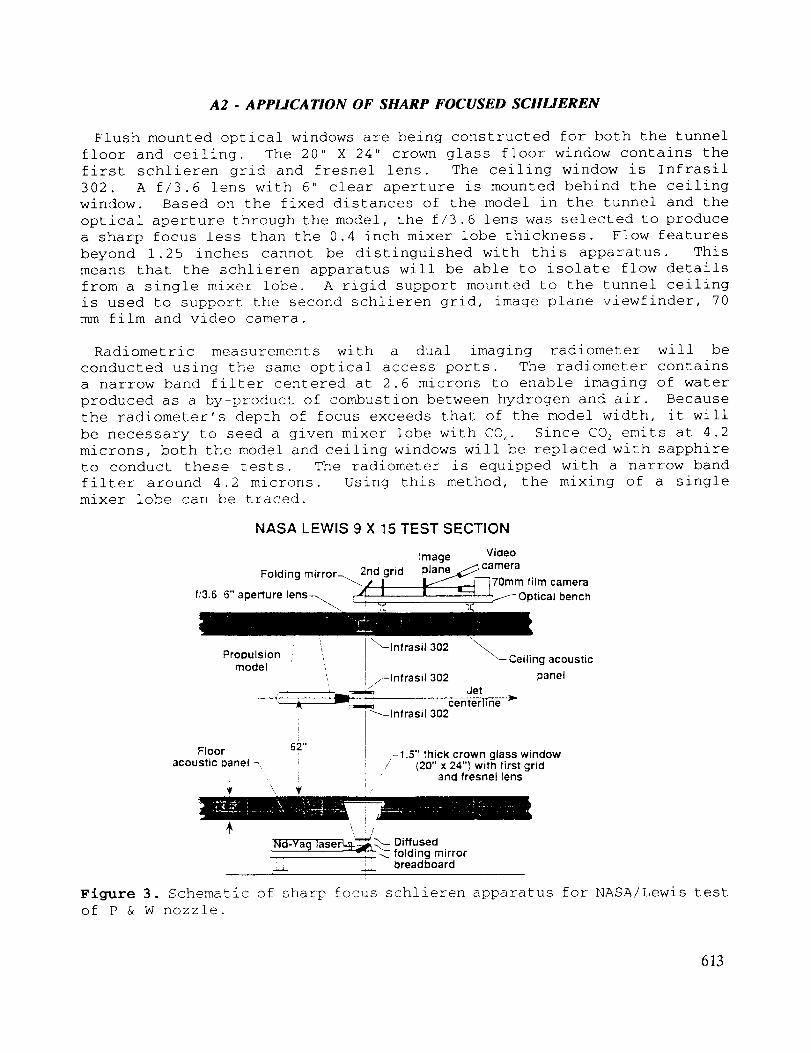
Flush mounted optical windows are being constructed for both the tunnel
floor and ceiling. The 20" X 24" crown glass floor window contains the
first schlieren grid and fresnel lens. The ceiling window is Infrasil
302. A f/3.6 lens with 6" clear aperture is mounted behind the ceiling
window. Based on the fixed distances of the model in the tunnel and the
optical aperture through the model, the f/3.6 lens was selected to produce
a sharp focus less than the 0.4 inch mixer lobe thickness. Flow features
beyond 1.25 inches cannot be distinguished with this apparatus. This
means that the schlieren apparatus will be able to isolate flow details
from a single mixer lobe. A rigid support mounted to the tunnel ceiling
is used to support the second schlieren grid, image plane viewfinder, 70
mm film and video camera.
Radiometric measurements with a dual imaging radiometer will be
conducted using the same optical access ports. The radiometer contains
a narrow band filter centered at 2.6 microns to enable imaging of water
produced as a by-product of combustion between hydrogen and air. Because
the radiometer's depth of focus exceeds that of the model width, it will
be necessary to seed a given mixer lobe with CO 2. Since CO_ emits at 4.2
microns, both the model and ceiling windows will be replaced with sapphire
to conduct these tests. The radiometer is equipped with a narrow band
filter around 4.2 microns. Using this method, the mixing of a single
mixer lobe can be traced.
NASA LEWIS 9 X 15 TEST SECTION
image Video
Folding mirror_ 2rid grid plane__ camera_/ I _ _.. 70ram film camera
f/3.6 6" aperture lens-_ _'_ I i =--_ )tical bench
'_ _-Infrasil 302Propulsion ' ", _-- Ceiling acousticmodel [
ii/-Infrasil 302 panel=...-_--... Jet
A _ centerline r_-Infrasil 302
Floor 62"acoustic panel _
-1.5" thick crown glass window/ (20" x 24") with first grid
' and fresnel lens
"#' '\ ii'
;Nd-Yag laser_-_ Diffused' - :_. folding mirror
__ breadboard
Figure 3. Schematic of sharp focus schlieren apparatus for NASA/Lewis test
of P & W nozzle.
613

A3 - HIGH TEMPERATURE EJECTOR LINERS
Application of acoustic treatment to mixer ejector walls has been
proposed as a method to achieve additional noise reduction. Both P & W,
GEAE, and Boeing have used ejector liners in previous suppressor nozzle
studies, achieving varying degrees of success. These liners have
typically been fabricated using a bulk absorber with perforated face
sheet. Little is known about the effectiveness of such a concept in the
presence of distributed broadband sources, whose locations and frequencies
depend on the mixer suppressor geometry. Temperature gradients and high
speed grazing flow with shocks provide a formidable challenge to existingliner technology.
NASA Langley has begun an investigation of acoustic liners for the HSCT.
The study will use the JNL to study candidate materials in the presence
of high speed and high temperature grazing flows. In parallel efforts to
this effort, T.L. Parrott, of the Langley Applied Acoustics Branch, will
develop candidate materials for these studies using a flow impedance tube,
and Gary Settles of Penn State Univ. will evaluate the aerodynamicperformance of these candidate materials.
The JNL studies will initially begin by using a small 2-D C-D 1460°R Mach
2 rectangular nozzle with ejector, as shown in figure 4a. The sidewalls
of the ejector are adjustable. The construction of this model is
complete. The aspect ratio of the nozzle is 7.2 to simulate two
dimensional wave emission. The sidewalls of the ejector contain optical
viewports to permit flow visualization. For large plume/wall separations,
it is possible to identify the emitted Mach wave angle to the impedance
boundary, provided no acoustic interaction occurs between the plume and
duct modes. This is illustrated in figure 4b, which provides indication
that in-situ measurements of material impedance will also be determined.
For small plume/wall separations the aerodynamic boundary layer over the
liner face sheet can be visualized. Both aerodynamic flow measurements
and far field acoustic measurements (ejector treated on four walls) will
be conducted to support this research.
_-- NOZZLE
"_ .,_ __ EJECTOR
_.. ::: ::,--.--
I I I l: ,'----"-_ ' '....---/ J:_J--nmmJ_ "T------I
.... rJ _ 4 MOVABLE VISUALIZATION
WINDOWk_4
a - model hardware b - experimental setup
Figure 4. Initial JNL study of acoustic liners for HSCT ejectors.
614

A3- HIGH TEMPERATURE EJECTOR LINERS
The upper and lower walls of the ejector will be lined with various
length and depth candidate materials being developed in the Flow Impedance
Tube Laboratory (FITL). Early concepts to be studied in the JNL include
investigation of ceramic honeycomb material with small diameter cells,
whose absorption is dominated by viscous dissipation. Such materials are
aerodynamically smooth and do not require a face sheet. Such smoothness
does, however, bring into question liner absorption capabilities at high
angles of grazing incidence. To achieve broadband absorption
characteristics using ceramic honeycomb, both stepped and variable depth
liners will be investigated. A broadband liner material, Permablique
(figure 5), will also be investigated. In addition to the ceramic
honeycomb, bulk liners using Kevlar with perforated face sheets will be
investigated to provide comparison to industry experience.
In the JNL, in-situ measurements of impedance will be conducted using
water cooled pressure transducers. This technology has been successfully
developed to enable measurement of dynamic pressure in high temperature
environments, as indicated in figure 6. To apply this technology to the
liner program will, however, require an investigation of the phase
characteristics of piezorestive transducers. Similar measurements will
be performed in FITL, with eventual development of a theoretical model to
describe absorption behavior.
Figure 5. Permablique, a locally reacting acoustic liner with spatially
dependent frequency tuning.
Instn4monted 7,3.q% eli-end model
(MIL power noz_es)
Waler-coole¢l dynamic
pressure transducer
Weter-cooie_:t transducer
technoloqy:
• Permits lesting to ie! total
_ernperatures ~ 1700" R
• Current tests to 1200 ° R
• Applicable to full-scale
testing
Figure 6. Water cooled piezorestive transducer for high temperature flow.
615

A4- BOEING NACA NOZZLE
In a joint effort with Boeing, a flow visualization investigation of the
Boeing NACA nozzle series was conducted in their LSAF by the Langley JNL
staff. The objective of the Langley effort was to assist Boeing with
analysis of the aeroacoustic data, primarily through acquisition of
flowfield data. For these tests both a conventional schlieren system and
imaging radiometer were used for flow visualization. Figure 7a shows the
NACA nozzle mounted in the Boeing LSAF. Both the imaging radiometer and
linear array are visible in this figure.
The naturally aspirated coannular (NACA) nozzle of Boeing is shown
schematically in figure 7b. Supersonic hot exhaust air from the turbine
is ducted to the outside duct of the nozzle. The outer stream shroud
could translate, thus providing an outer stream with adjustable area
ratio. Subsonic secondary air is entrained through the ejector and ducted
to the inner stream. The secondary air is augmented by air bypassed from
the turbine stage, since an HSCT engine should have margin at take-off.
The secondary air stream is unheated and subsonic. Acoustically, the
scaled NACA nozzle achieved between 9 and i0 EPNdB of suppression with
little performance penalty.
The conventional schlieren apparatus utilized a I00 nsec i0 kHz spark
source with capability of being fired externally to obtain conditionally
sampled data. A video camera was used to record data and post processed
using image analysis software. The most difficult part of the set-up
involved folding the optical axis with a mirror located in the upper left
hand corner of the forward flight nozzle. This requirement arises in LSAF
due to the proximity of the nozzle and forward flight nozzle to a wall.
a - schematic of NACA nozzle b - NACA nozzle mounted in LSAF
Figure 7. Boeing NACA nozzle flow visualizatlon study.
616

A4- NACA NOZZLE SCHLIEREN DATA
With the schlieren data, it was possible to determine the optimum
location for shock free flow. This was determined to occur at the
translating shroud position L_ = -0.5" The optimum shroud location was
found to be dependent on forward flight Mach number and turbine bypass
flow. Example schlieren results obtained with NACA 2.3 are shown in
figure 8. As can be observed, in addition to changes in shock structure,
the shear layer spread rate is very dependent on operational parameters
of the nozzle.
(M_ = 0.23, TTPA = 1460°R, LS = -0.5")
NPR = 3.50 NPR = 4.35
WBP
OFF
ON
M, = 0.0
(NPR : 3.5, TI'PA = 1460°R, WBP OFF)
M_ = 0.23
LS
Figure 8. Schlieren data from NACA nozzle study.
617

A4- NACA NOZZLE RADIOMETRIC DATA
The imaging radiometer used in this study proved valuable in providing
information on the flow uniformity of the model and post merged regions
of the flow. The radiometer was capable of simultaneously imaging
radiation between 8 and 12 microns through one channel, and 4.2 microns
through a second channel with narrow band filter. The long wavelength
channel is used to image metallics associated with the nozzle, while the
short wavelength is used to image CQ, a by-product of the propane air
combustion. Figure 9 shows the degree of flow non-uniformity (later
traced to unsymmetric flow in combustor) and the enhanced mixing produced
by application of the turbine bypass flow. These results, which represent
an average of i00 conse<:utive frames, were obtained for NPR = 3.5, TTPA
= 1460°R, and LS = -0.5"
NACA 6 CONFIGURATION 2.3
8-12 MICRON, _: = 0.95 4.2 MICRON, e = 0.12
NACA 6 CONFIGURATION 2.1 (4.2 MICRONS)WBP OFF WBP ON
i
Figure 9. NACA nozzle _I_1 wavelength band radiometric results.
618

A5 - LANGLEY FORWARD FLIGHT SIMULATOR
A forward flight simulator with propulsion model is currently being
designed on a FY-92 CoF for installation in the NASA/LaRC Jet Noise
Laboratory. The simulator and propulsion model will complete all facility
requirements necessary for HSCT research in the take-off mode. Figure i0
provides a schematic of the proposed forward flight system and propulsion
model.
The tunnel is powered by a i0 ft. diameter two stage axial flow fan that
is driven by a variable speed drive with a 4000 HP motor. The fan is
capable of pulling 50" H_O at 420,000 CFM. With a 4 X 5 foot nozzle exit,
this corresponds to a forward flight simulation velocity of 350 ft./sec.
The area contraction ratio of the nozzle is 11.25. The nozzle inlet duct
entrance is equipped with a honeycomb flow straighter and six continuously
woven wire mesh screens. The anechoic test section is 36 X 18 X 18 ft.,
wedge tip to wedge tip. The first diffuser utilizes a 2.5 degree half
angle with a 5 X 5 ft. throat. A collector is used to help recovery of
the free jet static pressure. A second diffuser, of 3° half angle, is
used to slow the flow for the final duct silencer.
The propulsion model will have similar features to existing JNL nozzle
hardware, allowing existing nozzle parts to be utilized. The model will
house a burner capable of heating i0 lbm./sec of air to 2460°R. The
primary mode of combustion will be propane/air, with capability of
operating from a hydrogen/air supply. A single component balance will be
installed for rudimentary performance assessments.
/_-- C_-LErTDR
PROPANE/AIR FUELED COMBUSTOR
T_, = 2500°R
Q = 420,000 CFM @ 50" WATER
Vm_, = 350 FTJSEC.
Figure 10. NASA/LaRC Jet Noise Laboratory Forward Flight Simulator.
619
A6- JNL LASER VELOCIMETER SYSTEM
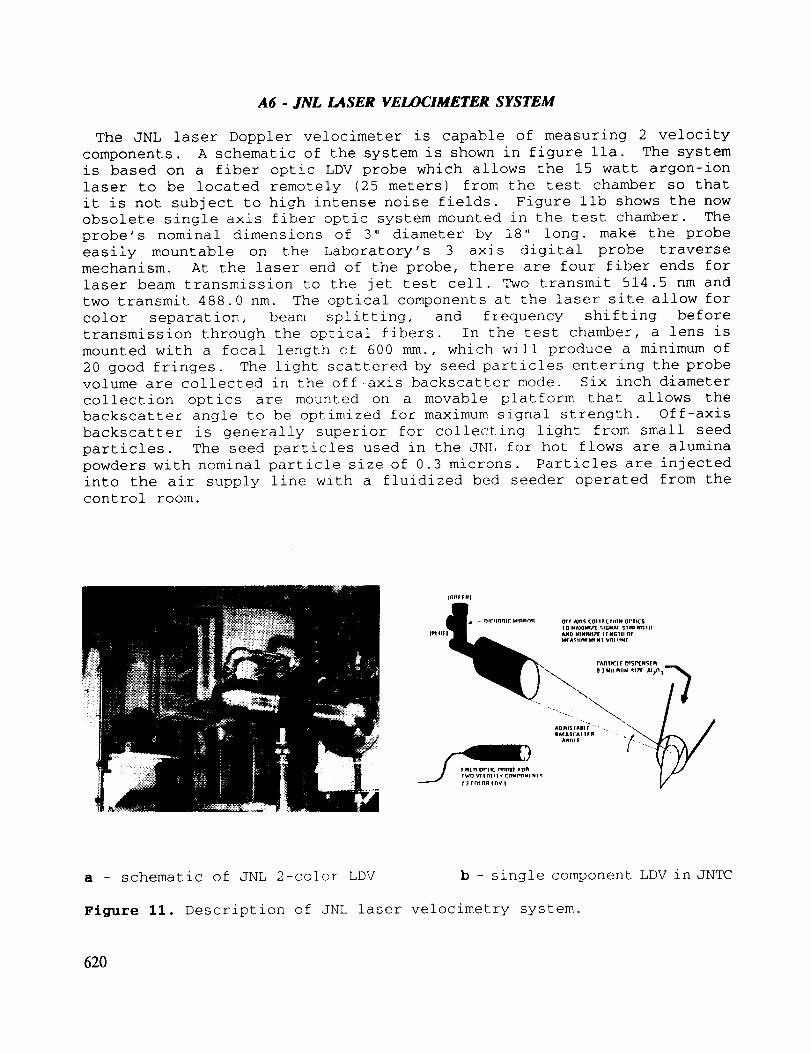
The JNL laser Doppler velocimeter is capable of measuring 2 velocity
components. A schematic of the system is shown in figure lla. The system
is based on a fiber optic LDV probe which allows the 15 watt argon-ion
laser to be located remotely (25 meters) from the test chamber so that
it is not subject to high intense noise fields. Figure llb shows the now
obsolete single axis fiber optic system mounted in the test chamber. The
probe's nominal dimensions of 3" diameter by 18" long. make the probe
easily mountable on the Laboratory's 3 axis digital probe traverse
mechanism. At the laser end of the probe, there are four fiber ends for
laser beam transmission to the jet test cell. Two transmit 514.5 nm and
two transmit 488.0 nm. The optical components at the laser site allow for
color separation, beam splitting, and frequency shifting before
transmission through the optical fibers. In the test chamber, a lens is
mounted with a focal length of 600 mm., which will produce a minimum of
20 good fringes. The light scattered by seed particles entering the probe
volume are collected in the off-axis backscatter mode. Six inch d_iameter
collection optics are mounted on a movable platform that allows the
backscatter angle to be optimized for maximum signal strength. Off-axis
backscatter is generally superior for collecting light from small seed
particles. The seed particles used in the JNL for hot flows are alumina
powders with nominal particle size of 0.3 microns. Particles are injected
into the air supply line with a fluidized bed seeder operated from the
control room.
a - schematic of JNL 2-color LDV b - single component LDV in JNTC
Figure II. Description of JNL laser velocimetry system.
620

A6- JNL WATER CO01_D PROBE DEVELOPMENTS
Three types of water cooled supersonic probes were developed and tested
to study high temperature jet plumes. The probe types include total
temperature and total and static pressure. All probes were designed witha diameter of 4.76 mm and a wall thickness of 0.38 mm. An annular coolant
system was utilized for all three designs, and proved satisfactory to
temperatures of 2460°R in Mach 2 flow. A three dimensional cut-away view
of the static pressure probe is shown in figure 12. A single center tube,
proceeding up to the backside of the tip, provides coolant water to the
probe. The water sprays the back of the tip, and symmetrically immerses
the region between the inlet water tube and inner wall of the probe as it
proceeds to the probe aft. Four tubes inside the probe serve to read the
average static pressure. The shape of the exterior probe geometry matches
that previously used with uncooled probes in the JNL. The total pressure
probe, not shown, is designed by similar methods. The total temperature
probe incorporated the annular cooling up to a region near the
thermocouple bead as shown in figure 13. The thermocouple bead is located
in a blackbody cavity and samples high temperature air, whose velocity is
controlled by the probe inlet and exit ports. The area ratio of inlet to
exit ports are selected to produce subsonic flow over the thermocouple
bead. A portion of the thermocouple sheath forms a liquid tight seal
between the test and coolant chambers.
Pressure tubesInlet water tube
_ (divider tube)/
Pressure ports
Fibre 12. Illustrated cut-away view of cooled static pressure probe.
Inlet water tube
(divider tube)
Vent holes Alumel leadVacuum braze
Stainlesssteelsheath
Bead
Chromel lead
Magnesium-oxide core
Fibre 13. Cut-away view of cooled total temperature probe tip.
621
A6- JNL WATER COOLED PROBE DEVELOPMENTS
The data obtained from the total and static pressure probes were found
satisfactory to temperatures of 2460°R in Mach 2 flow. The data from the
water cooled temperature probe, however, was affected by the water
coolant. This required the development of a phenomenological model for
heat transfer to the thermocouple bead to account for heat transferred to
the coolant. The rate of heat transfer to the TC junction was found, for
example, significantly higher with water coolant activated.
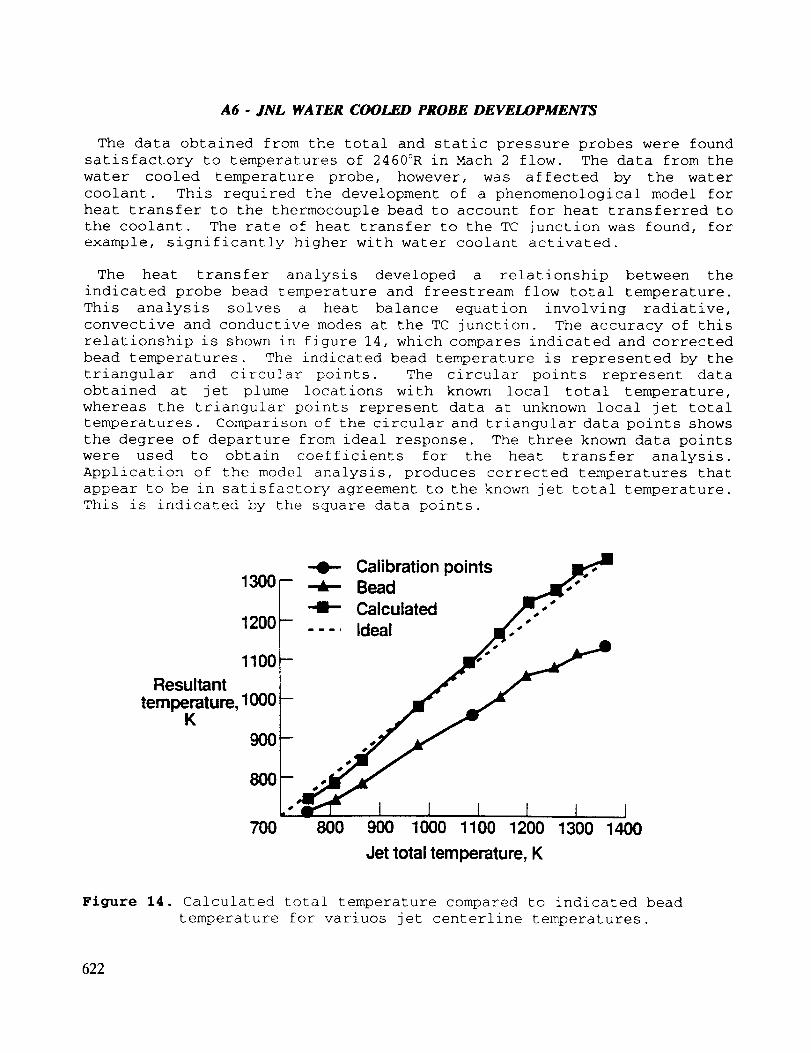
The heat transfer analysis developed a relationship between the
indicated probe bead temperature and freestream flow total temperature.
This analysis solves a heat balance equation involving radiative,
convective and conductive modes at the TC junction. The accuracy of this
relationship is shown in figure 14, which compares indicated and corrected
bead temperatures. The indicated bead temperature is represented by the
triangular and circular points. The circular points represent data
obtained at jet plume locations with known local total temperature,
whereas the triangular points represent data at unknown local jet total
temperatures. Comparison of the circular and triangular data points shows
the degree of departure from ideal response. The three known data points
were used to obtain coefficients for the heat transfer analysis.
Application of the model analysis, produces corrected temperatures that
appear to be in satisfactory agreement to the known jet total temperature.
This is indicated by the square data points.
1300
1200
1100
Resultanttemperature, 1000
K900
800
7O0
Calibration points-a,- Bead-41- Calculated.... Ideal
800 900I I ,I
1000 1100 1200 1300 1400
Jet total temperature, K
Figure 14. Calculated total temperature compared to indicated bead
temperature for variuos jet centerline temperatures.
622

B1 - EVALUATION OF RNS TO BASELINE AXISYMMETRIC JETS
Numerical prediction of jet plume structure provides support for
theoretical and empirical based jet noise prediction methods. For
extremely complex nozzle geometry, like that of an HSCT suppressor nozzle,
CFD prediction of flow structure is essential. Prior application of the
PNS code SCIPVIS to a Mach 2 underexpanded axisymmetric jet provided
satisfactory agreement to measured data as shown in the plume static
pressure variations of figure i0. In this example, SCIPVIS is using the
kW two equation turbulence model. These results are encouraging, however,
several important deficiencies exist in applying PNS to more complex jet
flows.
The PNS cannot handle non-uniform subsonic external flow, large Mach
discs, multiple jets, or large scale 3D vortical behavior. All these are
important in application to HSCT. Even for the simple axisymmetric jet,
it is remarkable that the PNS could achieve such good success, since it
neglects all streamwise stress/diffusive terms. In a recent study, SAIC
finds that neglect of the streamwise terms actually produce errors that
are compensated by those introduced by the simplified treatment of the
subsonic portion of the shear layer. Their results show that pressure
variations in the subsonic layer, which are produced by shock/shear layer
interactions, influence the upstream development of the flow.
SCIPVIS - KW
p CONTOUR 20
P/PI
I.¢
0.0 10.0 20.0 30.0 40.0
PR[ _un[ VARIATtON&LON_IIIj • 0
[1 _, ,.. ---- SCIPvlS. Kw
) I II I I
0 i .I • • • i I "L i I I I i • • • I • , . . I
PR[ $$UR[ ¥A RIAI ION
20 ALONG e/rj *.5
0 I0 20 30 4O
l/rj
Figure 15. PNS prediction of Mach 2 underexpanded jet with kW model.
623

BI - EVALUATION OF RNS TO BASELINE AXISYMMETRIC JETS
In the SAIC investigation of the Mach 2 underexpanded axisymmetric jet,
two RNS (Reynolds Averaged Navier-Stokes) codes, PARCH and CRAFT, were
studied using the k_ turbulence model. The SCIPVIS code with k_ was used
as a benchmark. The PARCH code uses an implicit central-differencing
Beam-Warming algorithm to solve the full Navier-Stokes equations. The
PARCH code contains blocking and complex griding schemes that make it
attractive for use with complex nozzle geometry. The CRAFT code is finite
volume with upwind numerics. Figure Ii shows a comparison between all
three codes in their prediction of the jet static pressure and total
enthalpy along the centerline of the Mach 2 underexpanded jet plume. As
can be observed, even though both RNS and PNS exhibit the same rate of
mixing, substantial differences exist between the codes with regard to
wave attenuation beyond the second shock cell. The CRAFT code produces
less wave attenuation than PARCH, but both RNS codes show significant waveattenuation relative to PNS.
2.0
1.5
_I.0
0.5
0.0
0.0
1.30
_[_1.25
E"_1.20
1.15
l.lO
0.0
i i i I I l i i i I i I I i | I i
10.0 20.0 • 30.0
CRAFT
-- -- PARCH
....... '_CIPVIS
;" ii ,.
_ " i"", -'. •
. .I ' ' .' " .". .. "'_
i I
40.[
I i I I I I I I i I I I I I [ I I I I i
10.0 20.0 30.0 40.0
X/RJ
Figrure 16. Comparison of PNS and RNS prediction of Mach 2 jet.
624
BI - EVALUATION OF RNS TO BASELINE AXISYMMETRIC JETS
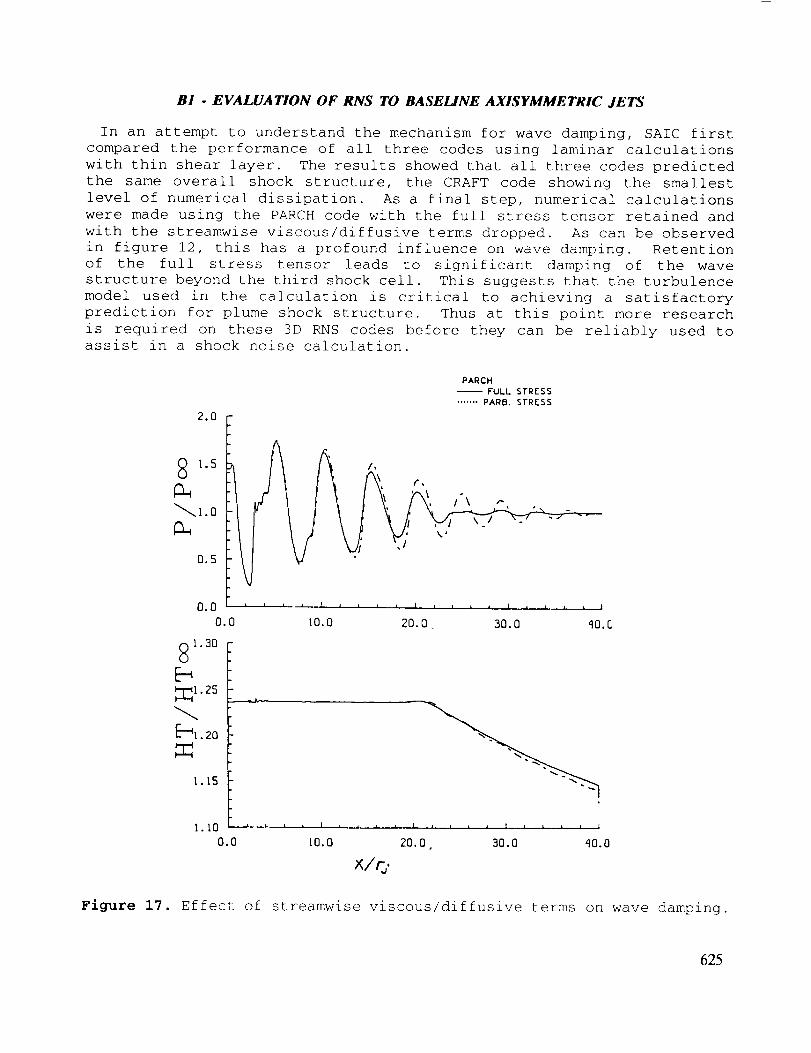
In an attempt to understand the mechanism for wave damping, SAIC first
compared the performance of all three codes using laminar calculations
with thin shear layer. The results showed that all three codes predicted
the same overall shock structure, the CRAFT code showing the smallest
level of numerical dissipation. As a final step, numerical calculations
were made using the PARCH code with the full stress tensor retained and
with the streamwise viscous/diffusive terms dropped. As can be observed
in figure 12, this has a profound influence on wave damping. Retention
of the full stress tensor leads to significant damping of the wave
structure beyond the third shock cell. This suggests that the turbulence
model used in the calculation is critical to achieving a satisfactory
prediction for plume shock structure. Thus at this point more research
is required on these 3D RNS codes before they can be reliably used to
assist in a shock noise calculation.
2.0
1.5
_I.0
0.5
0.00.0
1.30
_]_1.25
_1.20
1.15
PARCH
--FULL STRESS
.......PARB, STRESS
i i f A _ t A t i _ i I A i I l A i i I
I0.0 20.0 . 30.0 40.C
J I i i I i i i I I i i i i [ I i ¢ i ;
I0.0 20.0 , 30.0 '10.0
x/G.
Figure 17. Effect of streamwise viscous/diffusive terms on wave damping.
625

B2 - AXISYMMETRIC PLUG VALIDATION EXPERIMENT
The axisymmetric plug nozzle represents a good candidate for validation
of CFD for HSCT applications. The internal boundary and large wall
curvature are all features that can be associated with a complex
suppressor nozzle configuration. The nozzle design area ratio is
equivalent to Mach 1.5 at 206TR. For the present numerical/experimental
program a plug half angle of 15 ° is initially being considered. The plug
contains ventilation for boundary layer control to prevent separation and
for shock management. The geometry of the wall ports are selected to
minimize noise. The degree of ventilation can be controlled. Figure ii
illustrates the nozzle geometry. A removable hatch is used to enable
installation of various plug surface measuring devices. The plug is being
manufactured to include an non-instrumented and non-ventilated plugs. The
measurement methodologies to be utilized are as follows:
Plug Body PLUME ACOUSTICS
STATIC WALL PRESSURES
DYNAMIC WALL PRESSURE
SURFACE TEMPERATURE
HEAT TRANSFER MEAS.
WALL SHEAR STRESS
PLUG VENTILATION
TOTAL & STATIC PRESSURE
MEAN VELOCITY (LDV)
REYNOLDS STRESS (LDV)
TOTAL TEMPERATURE CONTOURS
STATIC TEMPERATURE MEAS.
FLOW VISUALIZATION
FAR FIELD LINEAR ARRAY
NEAR FIELD CONTOURS
SOURCE LOCATION
AXISYMMETRIC NOZZLE WITH 15 ° PLUGOESIGN POINT:
WIACH = 1.5To = 2060 ° R
DYN _.1'1C F_'Q'E5 S U_E,
CL";/;:L Z ;S L%'._l_
SLIRF ,_LT._ _EYt'_Er-, A TU_E
MODEL CAPABILITY:
/ _ NEAT I_"LIJX G_.E, ES
/
',z. "_"_" ZON T r.eOL _ A.UE
Po = t40 DmiTo = 2460 RM -- 10 Ib/_c:
Figure 18. Single stream axisymmetric plug flow nozzle for validation
experiment.
626
B2 - AXISYMMETRIC PLUG PARCH CODE RESULTS
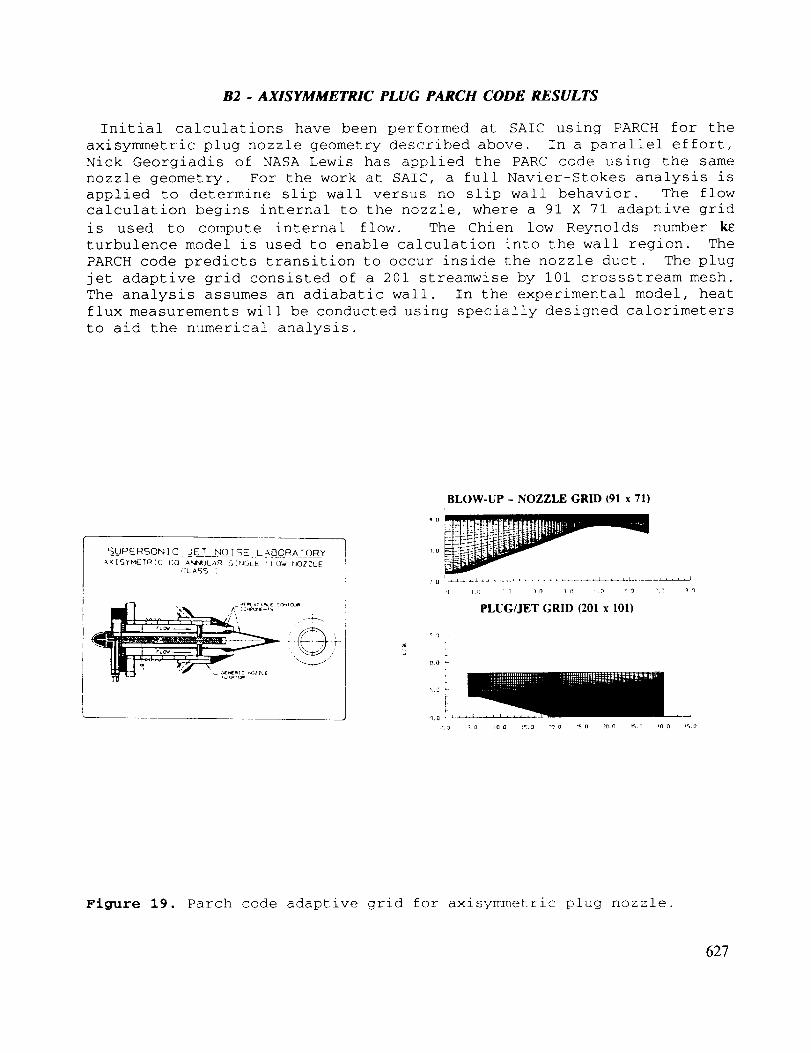
Initial calculations have been performed at SAIC using PARCH for the
axisymmetric plug nozzle geometry described above. In a parallel effort,
Nick Georgiadis of NASA Lewis has applied the PARC code using the same
nozzle geometry. For the work at SAIC, a full Navier-Stokes analysis is
applied to determine slip wall versus no slip wall behavior. The flow
calculation begins internal to the nozzle, where a 91 X 71 adaptive grid
is used to compute internal flow. The Chien low Reynolds number k_
turbulence model is used to enable calculation into the wall region. The
PARCH code predicts transition to occur inside the nozzle duct. The plug
jet adaptive grid consisted of a 201 streamwise by i01 crossstream mesh.
The analysis assumes an adiabatic wall. In the experimental model, heat
flux measurements will be conducted using specially designed calorimeters
to aid the numerical analysis.
S U_PER__S_ONIC JET N__O[SE LASORATOR__Y
_×[SYMETRIC CO-A_JtAR SI"4GLE _I OW biOZZLECLASS I
",. t(........_]_I_'F_. J
BLOW-UP - NOZZLE GRID (91 x 71)
1,o
PLUG/JET GRID (201 x 101}
_o _o lo.o :_.o -oo '_.o ]go _.o io o %0
Figure 19. Parch code adaptive grid for axisymmetric plug nozzle.
627
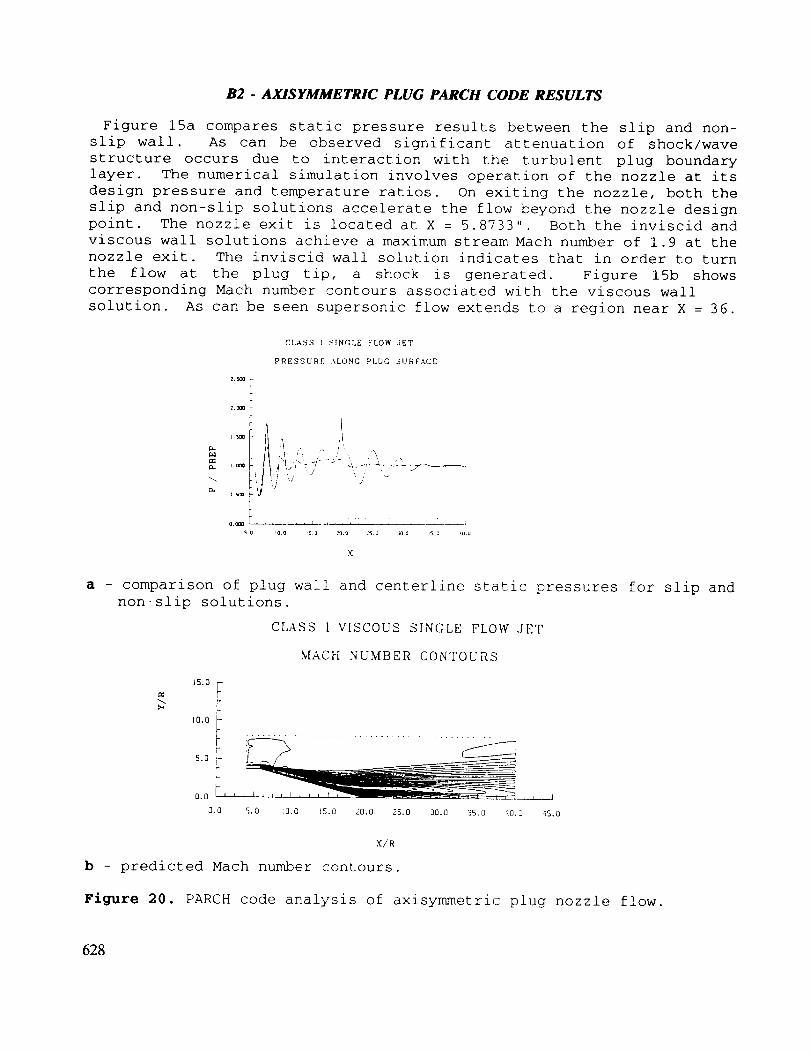
B2 - AXISYMMETRIC PLUG PARCH CODE RESULTS
Figure 15a compares static pressure results between the slip and non-
slip wall. As can be observed significant attenuation of shock/wave
structure occurs due to interaction with the turbulent plug boundary
layer. The numerical simulation involves operation of the nozzle at its
design pressure and temperature ratios. On exiting the nozzle, both the
slip and non-slip solutions accelerate the flow beyond the nozzle design
point. The nozzle exit is located at X = 5.8733" Both the inviscid and
viscous wall solutions achieve a maximum stream Mach number of 1.9 at the
nozzle exit. The inviscid wall solution indicates that in order to turn
the flow at the plug tip, a shock is generated. Figure 15b shows
corresponding Mach number contours associated with the viscous wall
solution. As can be seen supersonic flow extends to a region near X = 36.
CLASS [ SINGLE FLOW JET
PRESSURE \LONG PLUG SURFACE
2. _txlL
_ F ,110 % /\
Li
o.rll@ , , , i , , . i __, i
a - comparison of plug wall and centerline static pressures for slip and
non-slip solutions.
CLASS I VISCOUS SINGLE FLOW ,JET
MACH NUMBER CONTOURS
15.0
l°'°f ...........................................! <222
0.O _
0.0 5.0 iO.O t5.O 20.0 25.0 30.0 35.0 i0.0 _S.O
x/_
b - predicted Mach number contours.
Figure 20. PARCH code analysis of axisymmetric plug nozzle flow.
628
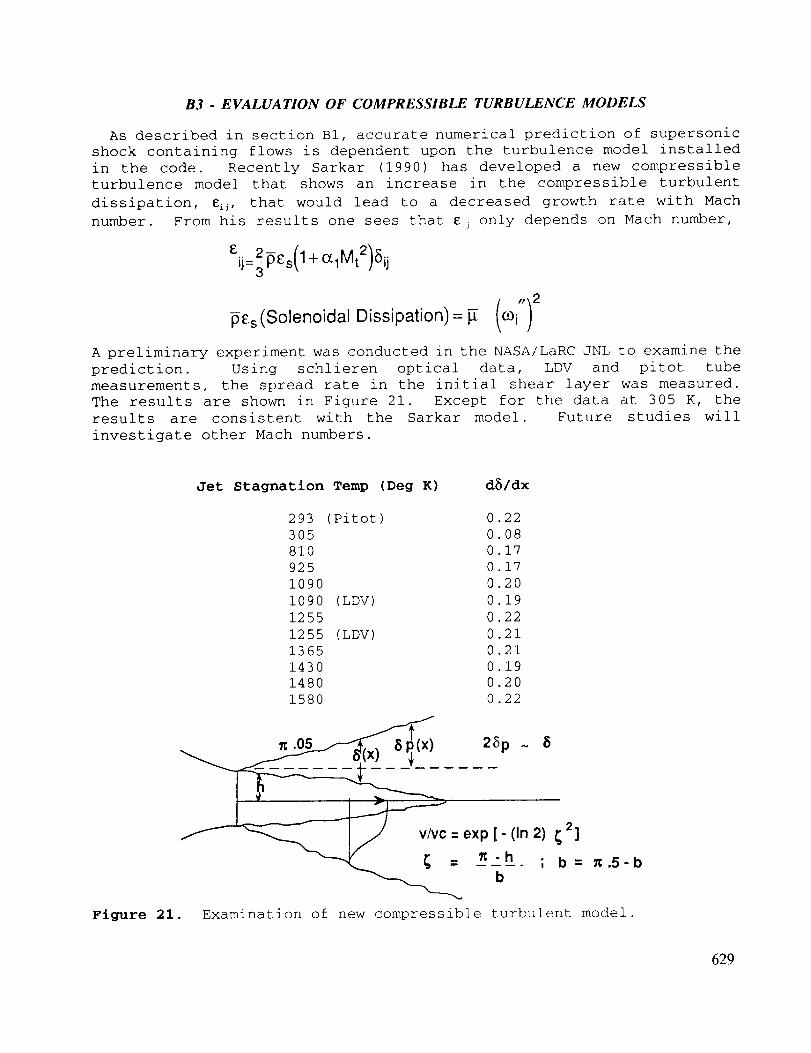
B3 - EVALUATION OF COMPRESSIBLE TURBULENCE MODELS
As described in section BI, accurate numerical prediction of supersonic
shock containing flows is dependent upon the turbulence model installed
in the code. Recently Sarkar (1990) has developed a new compressible
turbulence model that shows an increase in the compressible turbulent
dissipation, _ij, that would lead to a decreased growth rate with Hach
number. From his results one sees that cij only depends on Mach number,
Eij=2p_s(l+ O_lMt2)Sij
_Ss (Solenoidal Dissipation): _ (_i") 2
A preliminary experiment was conducted in the NASA/LaRC JNL to examine the
prediction. Using schlieren optical data, LDV and pitot tube
measurements, the spread rate in the initial shear layer was measured.
The results are shown in Figure 21. Except for the data at 305 K, the
results are consistent with the Sarkar model. Future studies will
investigate other Mach numbers.
Jet Stagnation Temp (Deg K) dS/dx
293 (Pitot)
3O5
810
925
1090
1090 (LDV)
1255
1255 (LDV)
1365
1430
1480
1580
0 22
0 O8
0 17
0 17
0 20
0 19
0 22
0 21
0 21
0 19
0 2O
0 22
_.05_ 25p ~ 8
= exp [-(In 21 _ 2]5"h__. " b=
b
Figure 21.
.5 - b
Examination of new compressible turbulent model.
629

CI . NOZZLE GEOMETRY EFFECTS, CENTERLINE VELOCITY
For a shock-free supersonic jet, the amplitude of the emitted noise is
a high power of the jet exit velocity. Therefore, any technique which
rapidly reduces the plume speed without generating any additional noise
will exhibit an acoustic benefit. Although round nozzle designs typically
are used for turbine engines, a viable passive control of noise may be the
use of asymmetric nozzles which promote rapid mixing thus lowering plume
velocities and the associated noise. Possible geometries whould be those
which can be designed shock-free to eliminate the presence of shock-associated noise.
An elliptic nozzle design method which produces a shock-free flow was
developed by Seiner, Baty, and Kumar at the NASA-Langley Research Center.
Two nozzles were constructed: Mach 2 of aspect ratio 3 and Mach 1.5 of
aspect ratio 2. A comparison of the centerline velocity distribution is
presented in figure 22 between the elliptic and shock-free axisymmetric
nozzles. The axial dimension is normalized by the equivalent diameter of
the nozzle. As is evident in the figure, the centerline velocity of the
elliptic nozzles decays more rapidly than that of the round nozzles. One
may expect a noise reduction through the use of this type of geometry.
I '
C
5_
.. -.
' i _ ec
b
J ] 20 _ 5
' - _ eq
a - Mach 1.5 Jet b - Mach 2.0 Jet
Figure 22. The effect of elliptic geometry on the centerline velocitydistribution.
630
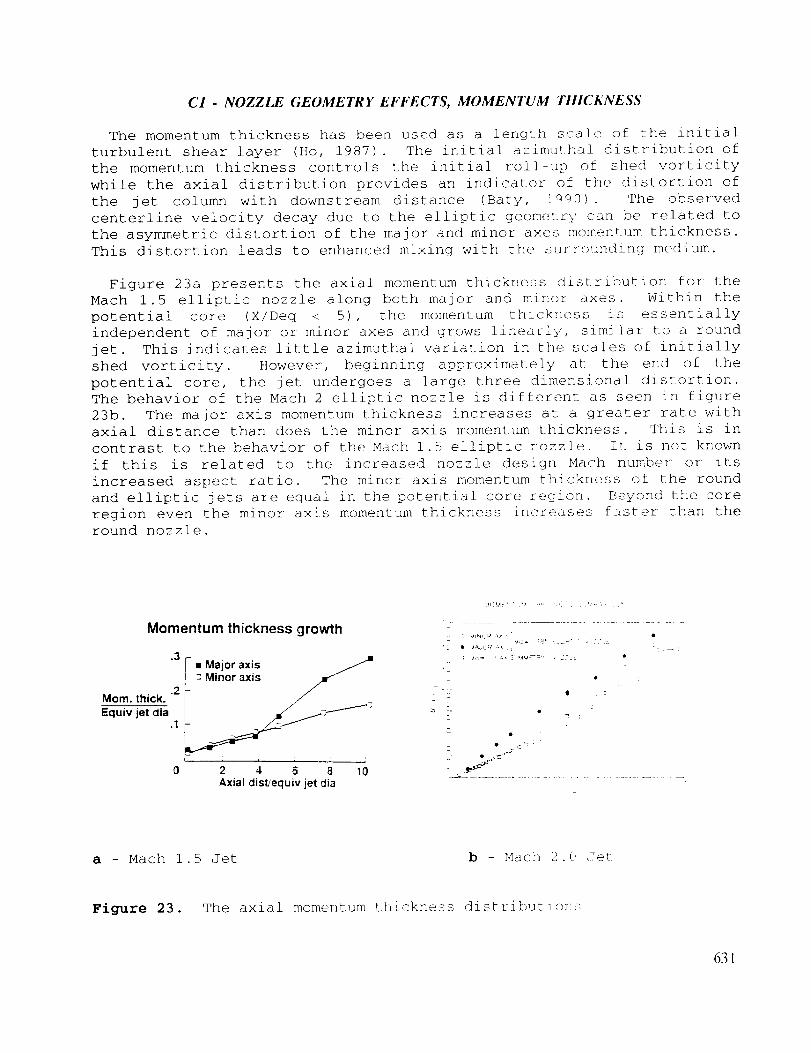
CI - NOZZLE GEOMETRY EFFECTS, MOMENTUM THICKNESS
The momentum thickness has been used as a length scale of the initial
turbulent shear layer (Ho, 1987). The initial azimuthal distribution of
the momentum thickness controls the initial roll-up of shed vorticity
while the axial distribution provides an indicator of the distortion of
the jet column with downstream distance (Baty, 1990) . The observed
centerline velocity decay due to the elliptic geometry can be related to
the asymmetric distortion of the major and minor axes momentum thickness.
This distortion leads to enhanced mixing with the surrounding medium.
Figure 23a presents the axial momentum thickness distribution for the
Mach 1.5 elliptic nozzle along both major and minor axes. Within the
potential core (X/Deq < 5), the momentum thicklless is essentially
independent of major or minor axes and grows linearly, similar to a round
jet. This indicates little azimuthal variation in the scales of initially
shed vorticity. However, beginning approximately at the end of the
potential core, the jet undergoes a large three dimensional distortion.
The behavior of the Mach 2 elliptic nozzle is different as seen in figure
23b. The major axis momentum thickness increases at a greater rate with
axial distance than does the minor axis momentum thickness. This is in
contrast to the behavior of the Mach 1.5 elliptic nozzle. It is not known
if this is related to the increased nozzle design Mach number or its
increased aspect ratio. The minor axis momentum thickness of the round
and elliptic jets are equal in the potential core region. Beyond the core
region even the minor axis momentum thickness increases faster than theround nozzle.
Momentum thickness growth
Morn. thick.Equiv jet dia
.3 < • Major axis _+./+'+J
.2 i = Minor axis /__/
.1 JJ=, [ + ,
0 2 4 6 8 10Axial distiequiv jet _ia
_,_r:= ¸ _:_ _=_ + +_i :.
_,_'_= i _ _ ;i r ',_Vi +_' ' _" = •
a - Mach 1.5 Jet b - Mach 2.0 Jet
Figure 23. The axial momentum thickness distributions
631

CI - NOZZLE GEOMETRY EFFECTS, SPECTRAL COMPARISON
The differences in the major and minor axes momentum thickness
measurements for the Mach 1.5 elliptic nozzle would indicate the existence
of a complex three-dimensional flow structure. This type of flow should
have equally complex stability properties which would be manifest in theacoustic emission.
Figure 24 is a spectral comparison between the acoustic radiation of two
azimuthal angles of the Mach 1.5 elliptic nozzle operating at a total
temperature of 1160 R. Also included is a spectrum of the Mach 1.5 round
nozzle corrected to the thrust of the elliptic nozzle. 0 = 0 degrees is
in a plane which contains the minor axis and the jet axis; _ = 90 degrees
represents a plane containing the major axis and jet axis. The _ angle
is referenced to the nozzle inlet axis and a value of 128 degrees is the
approximate direction of maximum overall acoustic emission. The data were
acquired at approximately 127 equivalent diameters from the nozzle exit.
As is evident in the figure, a strong dependency exists between the
spectral partitioning of acoustic energy and the nozzle geometry. Also,
the acoustic field of the elliptic nozzle is azimuthally varying similar
to the momentum thickness distribution. The overall sound pressure level
of the round nozzle is 1 dB greater than the elliptic at _ = 0 degrees and
4 dB greater than the elliptic at _ = 90 degrees. Thus, geometry alone
can yield acoustic amplitude benefits and possibly be used in the spectralredistribution of energy.
Figure 24. Spectral comparison of the acoustic emzssion from round and
elliptic nozzle geometries.
632
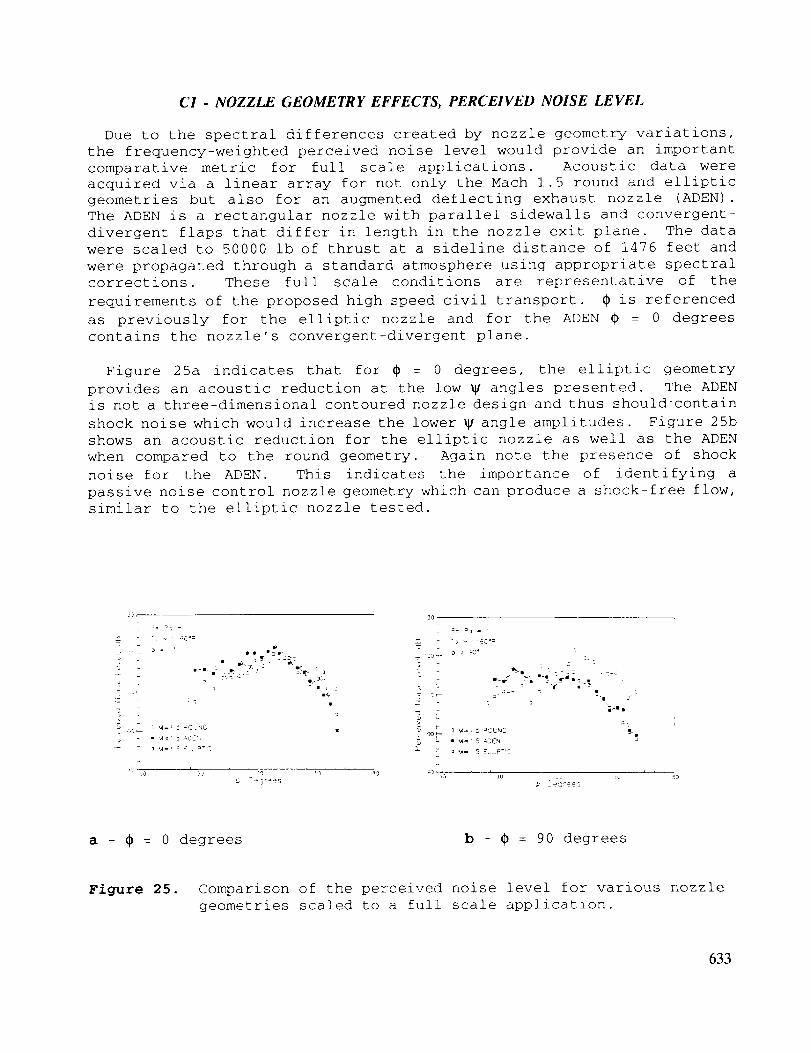
CI - NOZZLE GEOMETRY EFFECTS, PERCEIVED NOISE LEVEL
Due to the spectral differences created by nozzle geometry variations,
the frequency-weighted perceived noise level would provide an important
comparative metric for full scale applications. Acoustic data were
acquired via a linear array for not only the Mach 1.5 round and elliptic
geometries but also for an augmented deflecting exhaust nozzle (ADEN).
The ADEN is a rectangular nozzle with parallel sidewalls and convergent-
divergent flaps that differ in length in the nozzle exit plane. The data
were scaled to 50000 ib of thrust at a sideline distance of 1476 feet and
were propagated through a standard atmosphere using appropriate spectral
corrections. These full scale conditions are representative of the
requirements of the proposed high speed civil transport. ¢ is referenced
as previously for the elliptic nozzle and for the ADEN ¢ = 0 degrees
contains the nozzle's convergent-divergent plane.
Figure 25a indicates that for _ = 0 degrees, the elliptic geometry
provides an acoustic reduction at the low _ angles presented. The ADEN
is not a three-dimensional contoured nozzle design and thus should'contain
shock noise which would increase the lower _ angle amplitudes. Figure 25b
shows an acoustic reduction for the elliptic nozzle as well as the ADEN
when compared to the round geometry. Again note the presence of shock
noise for the ADEN. This indicates the importance of identifying a
passive noise control nozzle geometry which can produce a shock-free flow,
similar to the elliptic nozzle tested.
=. =: =
- iic
: = qle :_'<'
2-• ,,_=! g <__p-l::
3
w Im
"g 2> :,,
2,_
_] -s:0 Jo
a - (_ : 0 degrees b - ¢ = 90 degrees
Figure 25. Comparison of the perceived noise level for various nozzle
geometries scaled to a full scale application.
633
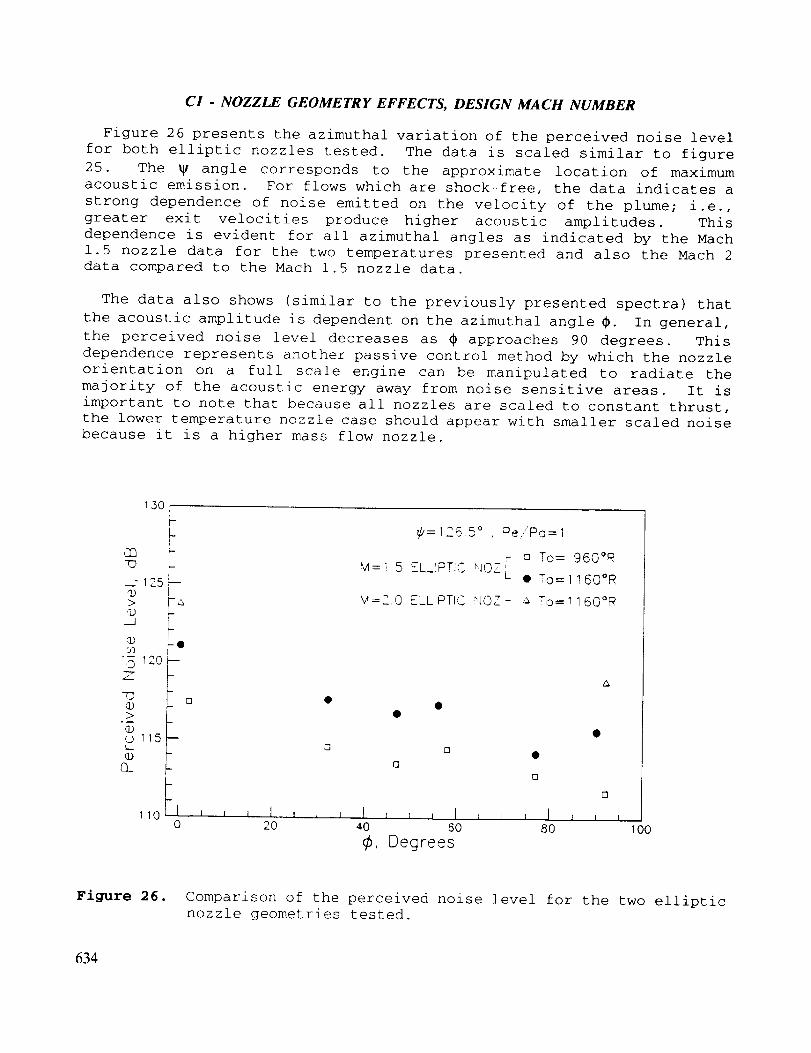
C1 - NOZZLE GEOMETRY EFFECTS, DESIGN MACH NUMBER
Figure 26 presents the azimuthal variation of the perceived noise level
for both elliptic nozzles tested. The data is scaled similar to figure
25. The _ angle corresponds to the approximate location of maximum
acoustic emission. For flows which are shock-free, the data indicates a
strong dependence of noise emitted on the velocity of the plume; i.e.,
greater exit velocities produce higher acoustic amplitudes. This
dependence is evident for all azimuthal angles as indicated by the Mach
1.5 nozzle data for the two temperatures presented and also the Mach 2
data compared to the Mach 1.5 nozzle data.
The data also shows (similar to the previously presented spectra) that
the acoustic amplitude is dependent on the azimuthal angle _. In general,
the perceived noise level decreases as # approaches 90 degrees. This
dependence represents another passive control method by which the nozzle
orientation on a full scale engine can be manipulated to radiate the
majority of the acoustic energy away from noise sensitive areas. It is
important to note that because all nozzles are scaled to constant thrust,
the lower temperature nozzle case should appear with smaller scaled noise
because it is a higher mass flow nozzle.
CD.To130 1
-125q)
> V-a<D
_J
u/
•_ _:o -_. -
7:3 a(1)>
.__
O 115
©G_
110 Jo
@:1265 ° , Pe/Pa=l
O To= 960°RM=!.5 ELLIPTIC NOZ[-
C • To=II60°R
M:..U ELLrPTIC NOZ- _ To=II60°R
rl •c]
m
, _ , I , j _ I , I , I _ , , I20 40 60 80
¢, Degrees
rl
1 I I
1O0
Figure 26. Comparison of the perceived noise level for the two ellipticnozzle geometries tested.
634

C2 - MULTIPLE JET INTERACTIONS
The HSCT suppressor nozzle, as currently envisioned, utilizes multiple
hot high speed jets surrounded by afterbodies that promote rapid mixing
with these jets. To show the types of interactions possible with multiple
jet configurations, figure 27 presents a phased-averaged Schlieren
photograph of unheated twin choked-tube nozzles (the strobe light is
locked to the screech frequency for a given phase of the measured acoustic
wave).
These nozzles were operated at a fully expanded Mach number of 1.32
where the dominant instability wave in the jet shear layer is a flapping
structure (double helix). Generally, this type of large scale structure
has no azimuthally preferred orientation. However, due to the mutual
excitation of the jets, the flapping motion of both jets is now oriented
in a plane containing the axes of both jets. This alters not only the
azimuthal directivity of the screech noise but also promotes a more rapid
mixing configuration as compared to a single nozzle. The potential thus
exists for using the passive control feature of multiple jet interaction
for acoustic benefits.
Figure 27. Phased-average Schlieren of twin choked-tube nozzles.
ORIGINAL PAGE
BLACK AND WHITE PHOTOGRA, PN
635
C2 - MULTIPLE JET INTERACTIONS
The envelope geometry for multiple jets in an HSCT application is either
round or a low aspect ratio rectangular. The high speed jets emerge from
geometries that are complex, but often driven by the geometric constraint
of packaging in the envelope shape. The suppresor also makes use of an
acoustically treated ejector that provides augmentation to the engine massflow.
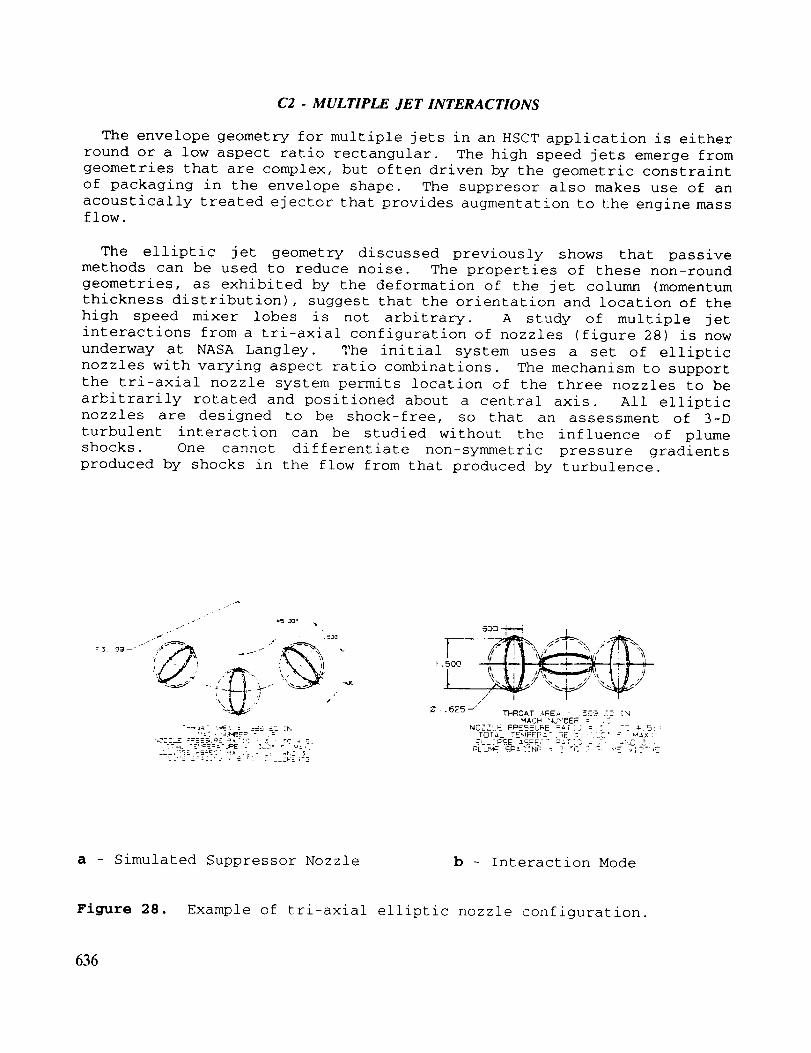
The elliptic jet geometry discussed previously shows that passive
methods can be used to reduce noise. The properties of these non-round
geometries, as exhibited by the deformation of the jet column (momentum
thickness distribution), suggest that the orientation and location of the
high speed mixer lobes is not arbitrary. A study of multiple jet
interactions from a tri-axial configuration of nozzles (figure 28) is now
underway at NASA Langley. The initial system uses a set of elliptic
nozzles with varying aspect ratio combinations. The mechanism to support
the tri-axial nozzle system permits location of the three nozzles to be
arbitrarily rotated and positioned about a central axis. All elliptic
nozzles are designed to be shock-free, so that an assessment of 3-D
turbulent interaction can be studied without the influence of plume
shocks. One cannot differentiate non-symmetric pressure gradients
produced by shocks in the flow from that produced by turbulence.
3 gg --" "" "7"='_
r : i 'P
\ ,. •
z. :. : _-4_ @ !N
•CZZL-- :=-=--% _: =_-:'= rC * 5.
2_-;::5= _==r- ..... :, -r2 5
" 50Q "-_ 1 I
.50Q _ .._ ..
/
•625--/ T_0AT aNEa : .-Z.=-_ 'ZD "N
MA'.]H "L_'F'E_ : ,NC//'_E FF_ES_LF, E =_T : _ : _ -C 4- 5: ;
/OTa_ TEMPFP.:.- .=E : : ::C" : M_.X i-L_:I:SE :',S:E,:- -_-_::3 - S _LC ":: :
GLU'4E SP_g[N6 : - TC "; --_.'.'- 'lI]-4E
a - Simulated Suppressor Nozzle b - Interaction Mode
Figure 28. Example of tri-axial elliptic nozzle configuration.
636

C4 - ACTIVE CONTROL OF INITIAL JET SHEAR LAYER
The primary noise generation mechanisms of supersonic jet flows have
been attributed to the presence of large scale structures in the shear
layer. These dominant structures develop when small scale disturbances
in the initial region of the jet grow in amplitude as they convect
downstream. Therefore it may be reasonable to assume that by actively
controlling initial shear layer instabilities, which have maximum growth
rates, one can also control the noise emission.
C.M. Ho at University of Southern California is investigating practical
methods for controlling the most unstable modes and their azimuthal energy
distribution. These methods involve the use of sound, temperature, tuned
cavities, and piezo-ceramic actuators to control the initial shear layer
disturbances of axisymmetric and asymmetric nozzles operating in both the
subsonic and supersonic regimes. Acoustic measurements have been made for
a circular jet tested from the low subsonic to the transonic range. These
measurements span the near field pressure fluctuations to the far field
noise. The far field spectra presented in figure 29 indicate that for
M=.2 to .35, the noise generated by large scale coherent structures in the
thin shear layer dominates (high frequency peaks), while beginning at
M=.4, the noise of the preferred mode dominates (broadband peak). The
data will be compared to that acquired when various control methodologies
are implemented.
--M=9
..... M--.82
IO
• M=.6
p,2/f ---. '_ - - M--.S
t":'""_222.2222"21• ''%,, --- - M=.4
10. 4_._ _-"/ , ,'- _'_ ,.\._,, "v..'_"'%.,",,<.,.,_ " M=35
" "_'_ '"_._.. "%_,£1 -- M=,].. _ .'_ .( _ "\'.
JO6_ _ " i ',d,"]
10 ......................................
100 1000 f[Hz] 10000
Figure 29. Far field spectra for an unheated circular jet operating
subsonically.
637

DI - SUPERSONIC INSTABILITY WAVES
An experiment is being planned in the NASA/LaRC JNL to verify the
theoretical predictions of Tam (1990) on the occurrence of supersonic
instability waves in high temperature jets where T_/T a > 2.5. The
predictions of figure 30 show that with increasing jet temperature ratio,
the Kelvin-Helmholtz instability wave amplitude decreases, but there is
the appearance of a supersonic instability wave. These waves are produced
by turbulence structure in the shear layer that convect supersonically
relative to the local jet sound speed.
Total wave amplificationb/R
A (co, n) = exp [f- ki (S, n, b/R) Rd(b/R) ]
bo/R
Where, b =_.5" h (jet half width)
a = db/dx (jet spread rate)
ki = 0 (neutral PT; max growth)
.20 Axisymmetric hot jet (Tj/T a = 2.1)
I /_ °de1 Mj =1.4 o
.16= ,,,,,,"'_M?de2.._.. To ~ 1100 F
.12 // _'_'_-'._ Mode 0
.08 //'
o
1 I I I I I I I.040 1 2 3 4 5 6 7 8 9
Strouha[ number (fD/uj)
b c
(-k I) db.05
2Strouhalnumber
(fD/uj) 1
Prediction of most highlyamplified fixed frequency wave
k • Experiment
-- Theory
bc
-k _) db"08.05
.04
0 I I I I
0.5 1.0 1.5 2.0 2.5
•16 Axisymmetric hot jet (Tj/'T a = 2.7)
Mach 2
.12 ,,.-.xMode 1 To ~ 2100 = F
,'" "',Mode2at ,
a "_'x
",.Instability wave
0 2 3 4 5 6 7 8
Strouhal number (fD/uj)
Figure 30. Instability waves in high temperature supersonic jets.
638

DI - HIGH TEMPERATURE WATER COOLED NOZZLE
As a preliminary investigation into properties of hot supersonic jets
and the questions regarding the directivity frequency and amplitude of the
supersonic instability wave, Schlieren records were acquired from the hot
Mach 2 axisymmetric nozzle shown in figure 31. This nozzle was designed
to be shock-free at Mach 2 and a temperature of 2460 R. The nozzle exit
diameter is 3.6 inches and is heated by the sudden expansion (SUE) burner
in the JNL facility. This nozzle is water cooled and capable of being
tested to 3000 R.
_ , _,G_
BLA_K A_'_D ¢_'HiTii _-'nOTOGRA_H
ii!ii¸ .............
Figure 31. Mach 2 high temperature water cooled axisymmetric nozzle
mounted in the JNL.
639

DI - MEASURED AND PREDICTED MACH WAVE EMISSION ANGLE
Figure 32 illustrates a specific example between the measured and
predicted Mach wave emission angle for a hot supersonic jet. In this
example, the Mach 2 jet is being operated overexpanded at Mj = 1.5 and atemperature of 2466 R. Figure 32a shows the measured Schlieren data for
this example. The Mach waves, which emerge from the edge of the shear
layer, have wave normals that appear orientated 60 degrees to the jet
axis. Based on Tam's (1990) large scale wave model, instability waves for
this example will convect at 61% of the jet exit velocity. Based on this,
the predicted wave angle is 59 degrees to the jet axis, as shown in figure32b.
MACH WAVE EMISSION
Inner edge
a - Schlieren of Mach 2 Jet b - Predicted Mach Wave Angle
Figure 32. Measured and predicted Mach wave emission for a hot jet.
640
D2 - NON-LINEAR WAVE INTERACTIONS
Under certain operating conditions, shock-containing supersonic free
jets have been shown to emit high amplitude narrowband acoustic signals
referred to as screech tones. It has been suggested that the generation
of this noise component is due to the interaction of the dominant large
scale coherent structure in the turbulent shear layer with the shock cell
system (Tam, 1986). Screech has been observed to be multi-modal, i.e. the
jet exhibits different instability characteristics depending on the
operating condition of the nozzle (Ponton, 1989) . To better understand
this noise mechanism, it is important to determine whether different
screech modes are independent or interact non-linearly.
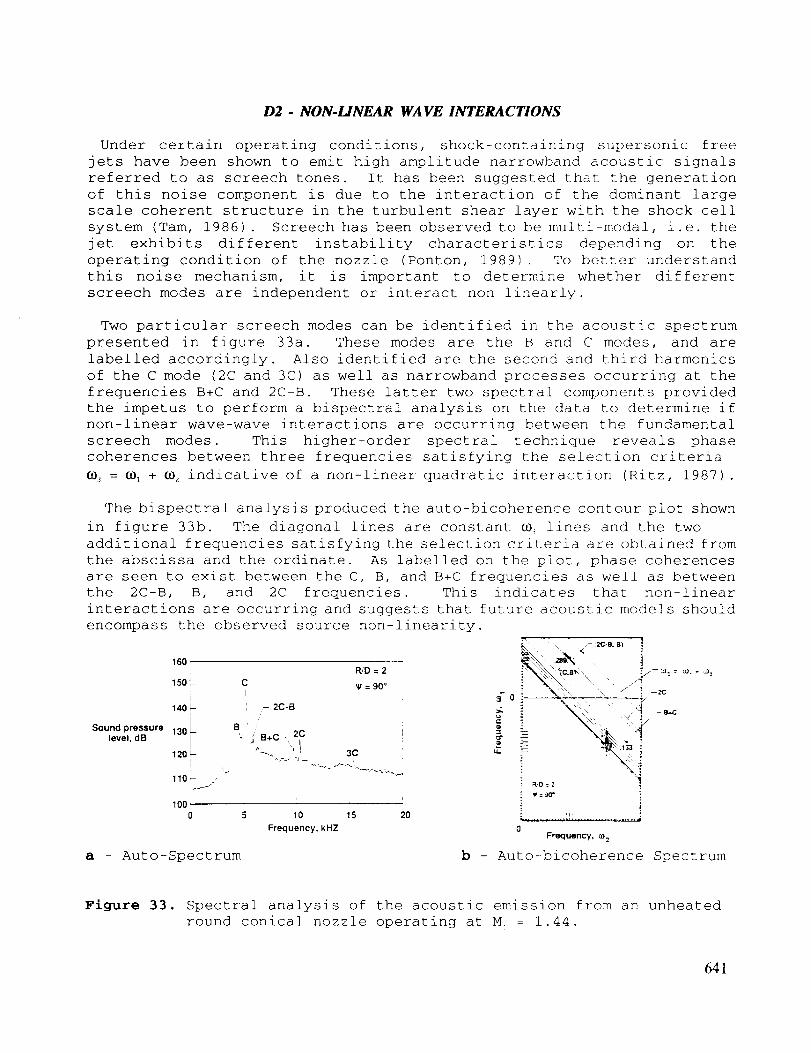
Two particular screech modes can be identified in the acoustic spectrum
presented in figure 33a. These modes are the B and C modes, and are
labelled accordingly. Also identified are the second and third harmonics
of the C mode (2C and 3C) as well as narrowband processes occurring at the
frequencies B+C and 2C-B. These latter two spectral components provided
the impetus to perform a bispectral analysis on the data to determine if
non-linear wave-wave interactions are occurring between the fundamental
screech modes. This higher-order spectral technique reveals phase
coherences between three frequencies satisfying the selection criteria
_3 = _ + _2 indicative of a non-linear quadratic interaction (Ritz, 1987).
The bispectral analysis produced the auto-bicoherence contour plot shown
in figure 33b. The diagonal lines are constant _ lines and the two
additional frequencies satisfying the selection criteria are obtained from
the abscissa and the ordinate. As labelled on the plot, phase coherences
are seen to exist between the C, B, and B+C frequencies as well as between
the 2C-B, B, and 2C frequencies. This indicates that non-linear
interactions are occurring and suggests that future acoustic models should
encompass the observed source non-linearity.
160"
150
i14o_
iSound pressure 130
level, dB !
12oil
110 --
1000
R;D = 2
C _/: 90 °
i - 2C-BI /
8 ,l: /
'_' .i 8+C _k 2C'_ 1 ! 3C
10 15
Frequency, kHZ
2O
a - Auto-Spectrum
,\ < ,- (2C-B. BI ]
,I, ,
Frequency, _2
b - Auto-bicoherence Spectrum
Figure 33. Spectral analysis of the acoustic emission from an unheated
round conical nozzle operating at M_ = 1.44.
641

D4 - PREDICTION OF NOISE FOR NON-ROUND JET GEOMETRY
The dominant sources of supersonic jet noise may be associated with the
coherent structures in the jet mixing region, the jet's shock cell
structure, and the interaction between these two phenomena. In this study
the changes to the noise radiation associated with a change in the nozzle
exit geometry is examined. An elliptic jet of aspect ratio 2 has been
considered. The large scale structures in the jet are modelled as
instability waves. These structures convect downstream with a velocity
on the order of the jet exit velocity. For high Mach number or heated
jets there is a direct coupling between the pressure fluctuations in the
jet flow field and the acoustic field. This results in intense noise
radiation. In the present study the characteristics of the large scale
structures or instability waves are obtained from a solution of the
compressible Rayleigh equation. In the region just outside the jet flow
the pressure fluctuations are described in terms of Mathieu functions and
modified Mathieu functions. These fluctuations are matched with the
acoustic field using the method of matched asymptotic expansions. Figure
34 shows a typical far field calculation for the se_ flapping mode. The
two sections through the directivity pattern shown in figure 34 show (a)
the variation with azimuthal angle _ for a polar angle of 30 degrees, and
(b) the variation with polar angle @ for an azimuthal angle of 0 degrees.
The decibel levels are in arbitrary units. Experimental data acquired at
similar operating conditions, indicate the pzefe_ence for axisymmetric
structure and a wave direction at a steeper angle to the jet axis. Future
calculations are being made to investigate stability properties of
axisymmetric structure.
POL_._' D:_ECTIVITY A_]WLTHAL DIFR[CTIVITY
9o 9_
_,ec r "L/ /
270 270
¢=0.0
O--O TH[OP['TICAL, I._DRRIS
$el; t'LA_'PINC, laOD[
$t=0.2
8:28 O"
[_P[R41a[NTAL, L_NGL[Y JNL
Wb= 1.54
e--e $1=0.2 (B_=._/f :.04)tSOTH[R_AL (;.: {.0)
0:38 9"
* S_=0.2
ISOTH[R_.L (_.: 1.0)
e=25 5"
o St:0.2
NON-ISOTH[_I4&L ]'J'T,: 1.5
_: 389'
NON-L%OTH[RMAL T_/T : 1._
0=3_.9"
ND_-ISOTHEP_Z/_L Tb/T = 1.5
6:38 9'
NON-ISOT_[R_L T,_T.= 1.5
_'=25 _"
- Polar Directivity b - Azimuthal Directivity
Figure 34. Far field directivity with azimuthal and polar angles.
642
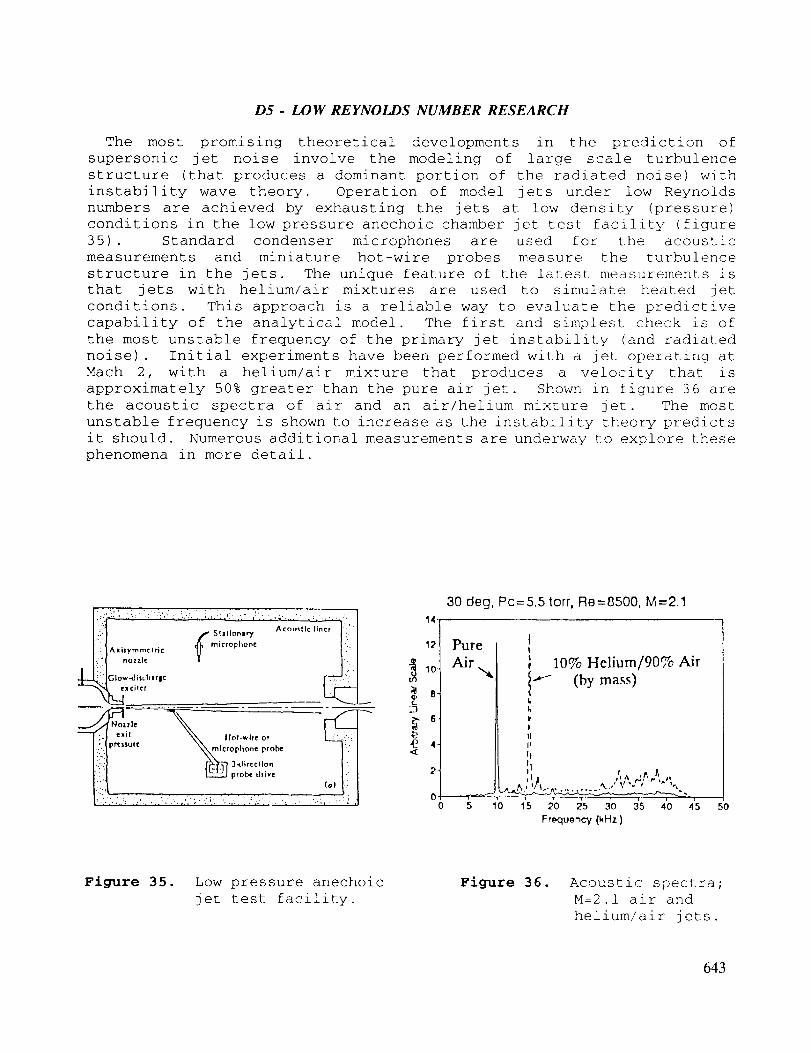
D5 - LOW REYNOLDS NUMBER RESEARCH
The most promising theoretical developments in the prediction of
supersonic jet noise involve the modeling of large scale turbulence
structure (that produces a dominant portion of the radiated noise) with
instability wave theory. Operation of model jets under low Reynolds
numbers are achieved by exhausting the jets at low density (pressure)
conditions in the low pressure anechoic chamber jet test facility (figure
35). Standard condenser microphones are used for the acoustic
measurements and miniature hot-wire probes measure the turbulence
structure in the jets. The unique feature of the latest measurements is
that jets with helium/air mixtures are used to simulate heated jet
conditions. This approach is a reliable way to evaluate the predictive
capability of the analytical model. The first and simplest check is of
the most unstable frequency of the primary jet instability (and radiated
noise). Initial experiments have been performed with a jet operating at
Mach 2, with a helium/air mixture that produces a velocity that is
approximately 50% greater than the pure air jet. Shown in figure 36 are
the acoustic spectra of air and an air/helium mixture jet. The most
unstable frequency is shown to increase as the instability theory predicts
it should. Numerous additional measurements are underway to explore these
phenomena in more detail.
[:.).it \\ .o,..ir,o, L :
I'/
30 deg, Pc=5.5 torr, Re=8500, M=2.1
14-
12-
:..3
"£ 4-<
2
00
IPure t!
Air if'10%(byHelium/90%mass)Airkkkk
IfI1iti
;I I. _ A
5 10 15 20 25 30 35 40 45 50
Frequency (kHz)
Figure 35. Low pressure anechoic
jet test facility.
Figure 36. Acoustic spectra;
M=2.1 air and
helium/air jets.
643
REFERENCES
Baty, R.S., Seiner, J.M. & Ponton, M.K. 1990 Instability of a
supersonic shock-free elliptic jet. AIAA Paper 90-3959.
Ho, C.M. & Gutmark, E. 1987 Vortex induction and mass entrainment
in a small aspect ratio elliptic jet. J. Fluid Mech., 179, 383.
Ponton, M.K. & Seiner, J.M. 1989 The effects of initial jet exit
conditions on plume resonance. AIAA Paper 89-1054.
Ritz, Ch.P., Powers, E.J. & An, C.K. 1987 Applications of digital
bispectral analysis to nonlinear wave phenomena. ISSPA 87 Signal
Processing, Theories, Implementations and Applications, 352.
Tam, C.K.W. 1990 Broadband shock associated noise of moderately
expanded supersonic jets. J. Sound and Vib., 140, 55.
Tam, C.K.W., Selner, J.M. & Yu, J.C. 1986 Proposed relationship
between broadband shock associated noise and screech tones.
J. Sound and Vib. ii0, 309.
weinstein, L.M. 1991 An improved large-field focusing Schlieren
system. AIAA Paper 91-0567.
644