pyroclastic density currents using experimental … density currents using sustained gas-fluidized...
TRANSCRIPT
8/8/2014 e.Proofing
http://eproofing.springer.com/journals/printpage.php?token=E4P6x4pOzu4bAL6WnU4qN2SVJIZb_86631kmJ6rZyIQ 1/32
Experimental study of densepyroclastic density currents usingsustained gas-fluidized granular flows
Pete J. Rowley
Email [email protected]
Olivier Roche
Timothy H. Druitt
Ray Cas
Université Blaise Pascal, Clermont-Ferrand, France
Abstract
We present the results of laboratory experiments investigating the
behaviour of relatively long-lived dense granular flows on horizontal slope
in which we simulate long-lived high pore pressure through the continuous
injection of gas through the flow base. Sustained (>30 s) supply of fine
(75 ± 15 μm) particles from a hopper simulates pyroclastic density current
formation fed by long-lived fountain collapse, which is inferred to deposit
very large volume and often widespread ignimbrites. Material is released at
initial particle concentrations of ∼3 to 45 %, and dense flows form readily
at the impingement surface even at lowest concentrations due to particle
accumulation. When gas is supplied at the flow base at rates below the
minimum fluidization velocity (i.e. aeration), three flow phases and
regimes are identified; (i) an initial dilute spray travelling at 1–2 m s ,
then (ii) a dense gas-particle flow travelling at 0.5–1 m s , which comes
to rest at a distance linearly dependent on the initial mass flux and finally
(iii) dense flow pulses that aggrade a deposit much thicker than the phase
2 flow itself. The flow front velocity in phase 2 has a square-root
dependence on mass flux, while the propagation speed of phase 3 deposit
front has a linear relationship with it. The mass of the charge released has
no significant control on either flow velocity or runout. In contrast, fully
fluidized flows with gas supply equal to the minimum fluidization velocity
1,*
1
1
1
1
−1
−1
8/8/2014 e.Proofing
http://eproofing.springer.com/journals/printpage.php?token=E4P6x4pOzu4bAL6WnU4qN2SVJIZb_86631kmJ6rZyIQ 2/32
remain within phase 2 for their duration, no deposit forms, and the
material exits the flume, precluding quantification of the effect of mass
flux on runout. During phase 3 in aerated conditions, high-frequency
unsteadiness leads to flow waxing and waning, creating deposit
architectures that exhibit features observed in many ignimbrites, including
localised progradational and retrogradational phases of deposition and
erosive contacts.
Keywords
Fluidization
Pyroclastic flow
Density current
Pore pressure
Sustained supply
Experiments
Editorial responsibility: V. Manville
Electronic supplementary material
The online version of this article (doi: 10.1007/s00445-014-0855-1 ) contains
supplementary material, which is available to authorized users.
IntroductionPyroclastic density currents (PDCs) are particle-laden flows produced by the
gravitational collapse of lava domes, lateral explosion (cf. Mount St. Helens)
or by the fallback of eruption columns (Druitt 1998 ; Branney and Kokelaar
2002 ). They have runouts ranging from hundreds of metres to more than a
hundred of kilometres (Lube et al. 2007 ; Cas et al. 2011 ), are able to
surmount topographic obstacles (Loughlin et al. 2002 ) and contain a wide
range of particle sizes and densities. Density currents propagate across the
ground due to a combination of initial momentum and density contrast with
the atmosphere, with density contrast usually acting as the main driving force
(Middleton 1966 ; Simpson 1999 ; Esposti-Ongaro et al. 2011 ). PDCs
exhibit a spectrum of flow behaviours and bulk densities, from dense
granular flows (commonly termed the basal avalanche) with over-riding
dilute ash clouds, to dilute, turbulent flows with bedload layers (e.g. Dufek
and Bergantz 2007a , b ; Dufek et al. 2009 ; Andrews and Manga 2011 ,
8/8/2014 e.Proofing
http://eproofing.springer.com/journals/printpage.php?token=E4P6x4pOzu4bAL6WnU4qN2SVJIZb_86631kmJ6rZyIQ 3/32
1
2012 ).
Pyroclastic density currents are hazardous to populations living on and
around active volcanoes, and the understanding of their dynamics is vital to
both improved hazard assessment and better interpretation of their deposits.
The ability of some PDCs to traverse topographic obstacles and achieve long
runouts even on subhorizontal slopes (e.g. Cas et al. 2011 ) makes them a
particular focus of hazard mitigation planning. The high mobility of the dense
basal avalanche of some PDCs is attributed to the combined effects of (i)
low intergranular friction caused by excess (i.e. above atmospheric pressure)
gas pore pressures and consequent fluidization effects (Sparks 1976 ; Wilson
1980 ; Druitt et al. 2007 ), and (ii) long-lived high pore pressure favoured by
slow pore diffusion due to the low permeability of the particulate material,
dominated by very fine ash (Druitt et al. 2007 ; Roche et al. 2010 ; Roche
2012 ). Possible origins of excess gas pore pressures caused by gas-particle
differential motion in dense PDCs include (hindered) settling of particles
from an initially expanded state (Girolami et al. 2008 ), exsolution of gas
from juvenile clasts (Wilson 1980 ), ingestion of air at the flow front and
sides (Bareschino et al. 2008 ) and air escape from a rough substrate
(Chédeville and Roche 2014 ).
Fluidization is a process with many industrial applications in the transport
and storage of granular materials (Fan and Zhu 2005 ; Rhodes 2008 ; Savage
and Oger 2013 ). By injecting gas vertically into a granular bed, a condition
can be reached whereby the drag exerted by the gas counterbalances the
weight of the particles, at which point intergranular friction is lost and the
bed behaves in a liquid-like manner (Geldart 1972 ; Gilbertson et al. 2008 ).
The superficial vertical gas velocity, U (equal to the gas volumetric flux
divided by the surface area across which gas is supplied) at which this occurs
is dependent on the material properties and is termed the minimum
fluidization (U ) velocity.
where k is the bed permeability, μ is the dynamic gas viscosity, h is the
bed height, ρ is the bulk density of the mixture and g is the gravitational
acceleration. Beds of volcanic ash representative of the matrix material
within pyroclastic flows have low permeabilities (k ∼ 10 –10 m and
mf
= × g,Umf
kmf
μρmf
mf mf
mf
mf−12 −11 2
−1
8/8/2014 e.Proofing
http://eproofing.springer.com/journals/printpage.php?token=E4P6x4pOzu4bAL6WnU4qN2SVJIZb_86631kmJ6rZyIQ 4/32
2
U as low as ∼1 mm s ), and they expand homogeneously when fluidized
at gas velocities above U until gas bubbles form at U > U (Druitt et al.
2007 ), showing that they belong to group A of Geldart’s classification
(Geldart 1973 ). Shear in a moving dense particulate flow moreover favours
homogeneous fluidization-generated expansion by breaking down any
bubbles (Nezzal et al. 1998 ; Druitt et al. 2004 ). A bed in which 0 < U < U
is termed aerated and one in which U ≥ U is termed fluidized. When gas is
no longer provided to fluidized beds of group A particles, negligible internal
friction can be maintained for a while as excess pore pressure decreases
slowly by diffusion on a typical time scale of:
where D is the diffusion coefficient of the gas in the granular mixture
(Iverson and LaHusen 1989 ; Druitt et al. 2007 ; Roche 2012 ).
In experiments on fluidized granular flows applied to dense PDCs, the use of
group A particles is required to ensure dynamic similarity with the natural
system as discussed by Roche ( 2012 ). Previous experimental studies on
dense PDCs focussed on releasing almost instantaneously a volume of
initially fluidized group A powder onto a horizontal surface (Roche et al.
2004 ; Girolami et al. 2008 ). One problem is that the similar material mean
grain size, and hence permeability and diffusion coefficient, in both
experiments and PDCs leads to pore pressure diffusion timescales that are
significantly different, since the experimental flows are 1–3 orders of
magnitude thinner than the natural ones (Hoblitt 1986 ; Palladino and
Valentine 1995 ; Dellino et al. 2007 ). As such, pore pressure is lost more
rapidly in fluidized experimental flows than in natural PDCs. Experimental
flows come to a relatively rapid halt and form relatively much shorter
deposits than those of their natural counterparts. One way to overcome the
relatively rapid decrease of pore pressure in experimental flows is to sustain
fluidization through a continuous air supply at the flow base (Eames and
Gilbertson 2000 ; Savage and Oger 2013 ). We have developed a
methodology for sustaining fluidization during flow in order to better model
the emplacement of ignimbrite-forming PDCs with long-lived high pore
pressure. By supplying a continuous gas flux through the flow substrate, we
can simulate the behaviours of natural flows with long diffusion timescales.
This paper reports the results of experiments on sustained fluidized dense
mf−1
mf mb mf
mf
mf
∝ /Dtd hmf2
8/8/2014 e.Proofing
http://eproofing.springer.com/journals/printpage.php?token=E4P6x4pOzu4bAL6WnU4qN2SVJIZb_86631kmJ6rZyIQ 5/32
granular flows (approaching maximum particle concentration) in which the
material supply duration is equal to or greater than the time taken for the
flow front to reach its distal limit. We explore how the mass of particles, the
mass flux and the degree of fluidization affect the speed, runout and
depositional behaviour of the flows. These experiments differ from previous
studies on dam-break granular flows produced by instantaneous gravitational
fluidized column collapse and with no air supply from below.
AQ1
Methods and materialsThe experimental apparatus is shown in Fig. 1 . A 35-kg capacity hopper
supplied the particles to a 3.5-m-long horizontal flume through a lock-gate
release mechanism, with a variable aperture to control the mass flux. The
particles dropped 60 cm onto an impingement plate consisting of a porous
plate inclined at 10°, then propagated into the horizontal channel section,
which also had a porous base. The drop height was selected through testing
in order to allow the particles to approach their terminal velocity when falling
as clusters (Nakashima et al. 2009 ). Air was supplied through both the
impingement plate and the channel base at the calculated velocity required to
provide a given degree of gas fluidization. The flume was 10 cm wide, with
vertical Perspex sidewalls 30 cm tall. These dimensions were selected to
ensure that the flume was wide enough to minimise sidewall effects
(Girolami et al. 2008 ) without increasing the necessary particle volumes to
impractical values. We refer to the volume above the impingement plate as
the ‘reservoir’, as it is analogous to the reservoir in dam-break experiments
(e.g. Roche et al. 2010 ). All experiments were recorded using high-speed
video at 500 frames per second with a horizontal resolution of 1,024 pixels,
enabling frame-by-frame analysis to record front propagation, as well as to
observe qualitative details of the flow and deposit formation. By filling the
hopper with alternating dyed and undyed particles, it was possible to analyse
the behaviour of flow and deposition in detail. The particles exited the
hopper in such a way as to provide continuous variation in deposit colour
(Fig. 2 ), providing a high-resolution method of imaging the internal flow and
deposit structure. All runout measurements are expressed as distance from
the entry into the channel, and times are given relative to the instant at which
the flow first enters the channel from the reservoir.
Fig. 1

8/8/2014 e.Proofing
http://eproofing.springer.com/journals/printpage.php?token=E4P6x4pOzu4bAL6WnU4qN2SVJIZb_86631kmJ6rZyIQ 6/32
Scaled longitudinal section of the experimental apparatus. The flume exit
(right) and top are open to prevent air recirculation or reflection artifacts
Fig. 2
Sequence of three photographs showing emptying of the hopper using a 3-
layer charge. Note the temporal variation in the proportion of different
coloured ballotini being supplied
The experiments were carried out using glass ballotini with a grain size of 75
± 15 μm and repose angle of 27°, identical to those of Roche et al. ( 2004 ).
These particles are fine enough to exhibit Geldart group A properties
(significant expansion prior to the onset of bubbling) and long pore pressure

8/8/2014 e.Proofing
http://eproofing.springer.com/journals/printpage.php?token=E4P6x4pOzu4bAL6WnU4qN2SVJIZb_86631kmJ6rZyIQ 7/32
diffusion timescales, but are coarse enough to experience negligible cohesion
(Schellart 2000 ; Gilbertson and Eames 2003 ). U for the particles has been
determined previously as 0.83 cm s and U as 1.6 cm s (i.e. about
2U , Roche et al. 2006 ).
The three variables in the experiments are (i) the total mass of particles
leaving the reservoir and entering the channel, (ii) the mass flux of particles
leaving the reservoir and (iii) the gas supply velocity through the base of the
flume. The mass of particles ranged from 10 to 25 kg. The mass flux was
calculated by dividing the total mass by the time it took for the reservoir to
empty. Mass fluxes of 0.8 to 65 kg s were achieved through a variable
aperture at the base of the hopper of 1 to 20 cm width, respectively. The
experiments were conducted with the same fluidization conditions
simultaneously in the reservoir and channel: non-fluidized (U = 0), aerated
(U = 0.5 U ) or fluidized (U = U ).
Results
Calibration of the particle supply
Visual inspection of videos of the falling material in the reservoir showed
that it was quite heterogeneous in both the early and latter stages (as the
ballotini were first released and then as the hopper finally emptied),
consisting of clumps and curtains of particles of different concentrations.
This overprints a very rapid (<0.3 s) waxing as the first material is supplied
and waning as the hopper empties. Arrival of heterogeneities on the
impingement plate caused splashing and a high-frequency unsteadiness in
particle supply that was then transmitted to the horizontal flows, as described
below. We calibrated the time-variation of mass flux for different aperture
sizes of the hopper by placing a balance on the floor of the reservoir and
recording the force exerted on the balance as a function of time (0.04 s
intervals and 0.1 g precision). The results (Fig. 3a ) show that the time-
averaged flux was approximately constant, but increased slightly as the
reservoir emptied. We concluded that our hopper supplied particles at an
approximately constant flux when averaged over periods greater than 0.12 s
upon which the higher frequency, splash-generated unsteadiness was
superimposed. The observed velocity of impact on the impingement plate
was approximately 3.4 m s , which is equal to the freefall velocity √(2gh),
where h is the 60 cm drop height.
mf−1
mb−1
mf
−1
mf mf
−1

8/8/2014 e.Proofing
http://eproofing.springer.com/journals/printpage.php?token=E4P6x4pOzu4bAL6WnU4qN2SVJIZb_86631kmJ6rZyIQ 8/32
Fig. 3
a Plot demonstrating steady supply of a 15 kg charge from the hopper,
measured using a data logging balance placed 60 cm below the mouth of the
hopper at an aperture of 5 cm, providing a calculated mean mass flux of
∼5 kg s . b Calculated particle concentrations for varying mass flux
conditions, using high-speed footage to estimate particle fall rate, assuming
constant mass flux and that the cross-sectional area of impingement is the
same as the hopper aperture. Fit curve is applied demonstrating concentration
has a power law dependence on mass flux. c Reproducibility of flow
propagation for a 15 kg charge supplied at 5 kg s , fluidized at U = U . The
flows exit the video frame at approximately 2.3 s. All distances are measured
from the start of the channel. d Flow speed derived from (b), with individual
flows plotted in grey, and an average curve plotted in black. Of note is the
rapid deceleration on entering the channel, followed by a pulsing unsteady flow
head
−1
−1mf
8/8/2014 e.Proofing
http://eproofing.springer.com/journals/printpage.php?token=E4P6x4pOzu4bAL6WnU4qN2SVJIZb_86631kmJ6rZyIQ 9/32
3
We also estimated the time-averaged concentration of particles, C, impacting
the impingement plate under conditions of different mass fluxes from the
relationship.
where
is the measured mean mass flux, d is the distance particles fall during the
period between frames t, ρ is the particle density (2,500 kg m ) and A is
the cross-sectional area of the aperture. The results are presented in Fig. 3b
and show that higher mass fluxes generated higher particle concentrations
upon impingement. Mass fluxes of <1 kg s are calculated to generate time-
averaged concentrations as small as 3–4 %, which must have then densified
significantly before forming the dense flows that propagated through the
channel as described hereafter. In contrast, the higher mass flux experiments
(65 kg s ) produced concentrations on impingement of approximately 45 %
(note that maximum particle concentration of randomly packed spheres
approaches 64 %; (Bernal and Mason 1960 ; Song et al. 2008 ).
A series of initial tests, in which we repeated measurements under the same
conditions, showed that our experimental results were highly reproducible.
This is true of the particle mass flux exiting the reservoir (Fig. 3a ), distance-
time plots for the flow fronts (Fig. 3c ) and flow front velocity, obtained
from the slope of the distance-time curves (Fig. 3d ). Comparing flow front
position through time of the five repeated experiments in Fig. 3c , taking the
flow front distance in each experiment at each 0.04 s step, for 80 time steps
gives a mean correlation coefficient (Pearson’s r) of 0.998.
Flow and deposition behaviour
As the charge impinged on the reservoir base, it rapidly coalesced into a thin
(<20 mm), dense flow. Even in low mass flux experiments, for which the
calculated particle concentration prior to impingement was less than 20 %,
the bulk of falling material had gravitationally collapsed to form a coherent
dense flow within 0.1 s. Flow behaviour and deposition varied according to
the fluidization state of the particles.
C = ,tM
dAρs
M
s−3
−1
−1

8/8/2014 e.Proofing
http://eproofing.springer.com/journals/printpage.php?token=E4P6x4pOzu4bAL6WnU4qN2SVJIZb_86631kmJ6rZyIQ 10/32
Non-fluidized and aerated flows
Emplacement of these flows took place in three overlapping phases (see
representative video, Online Resource 1 ).
Phase 1
The force of the initial impact of particles on the base of the reservoir
generated a violent spray of particles at high speed (up to ∼2 m s ) down
the channel. This spray formed a rapidly moving, millimeter-thin dense flow
of particles, accompanied by an ephemeral dilute cloud of particles travelling
down the flume above and in front of the denser flow, which rapidly formed
a deposit just a few particle diameters in thickness with a diffuse front. The
volume of particles involved in phase 1 was less than 1 % of that involved in
the subsequent main flow (phases 2 and 3). In most, but not all,
experiments, the deposit from phase 1 was completely covered during phase
2. Phase 1 can be attributed in part to the generation of high pore pressure
when the granular mass first impacted the impingement plate and was
translated laterally. A similar phenomenon was observed in the 3D dam-
break experiments of Roche et al. ( 2011 ) as a result of rapid pore pressure
release at the base of a collapsing fluidized granular column.
Phase 2
The precursor flow was followed, and in most experiments overtaken, by a
slower-moving (0.1–1.0 m s ) dense granular flow. A key observation was
that this flow formed even at lowest initial mass fluxes (i.e. lowest
impingement concentrations) as particles accumulated at the impingement
surface. The flow had thicknesses from a few particle diameters up to 10–
20 mm (increasing with mass flux) and was highly unsteady due to the high-
frequency unsteadiness in particle supply. It travelled down the flume as a
series of pulsed waves; larger waves travelled faster than smaller ones and
entrained any smaller waves that they over-rode. As each flow pulse
travelled down the flume, it decreased in velocity and thickness. Arrival of
each successive flow pulses at the flow front caused transient fluctuations in
frontal velocity that are evident on a plot of flow front velocity versus
distance (Fig. 3c ).
Under aerated conditions, a granular jump (Boudet et al. 2007 ) appeared to
form during phase 2 and phase 3 at the transition from the impingement plate
to the flume, with a possible chute-and-pool structure (Schmincke et al.
−1
−1
8/8/2014 e.Proofing
http://eproofing.springer.com/journals/printpage.php?token=E4P6x4pOzu4bAL6WnU4qN2SVJIZb_86631kmJ6rZyIQ 11/32
1973 ). The granular jump and chute and pool were not observed in fluidized
flows and occurred too late in propagation to impact the flow front
measurements.
Phase 3
Once the initial dense flow pulse had reached its distal limit, further supply
then thickened the existing deposit and the distal limit moved at much slower
rate, if at all. In non-fluidized cases, this growth occurred as a simple
granular wedge, while in aerated flows the deposit formed through
subhorizontal aggradation, with the runout of individual flow pulses inhibited
by friction with the developing substrate. Non-fluidized phase 3 flows
constantly prograded with a deposit front angle of between 15 and 20°,
depending on the mass flux (high-mass fluxes producing lower angles). It is
notable that these are below the angle of the rest of the ballotini particles
(27°), likely as a result of flow momentum. Aerated phase 3 flows
demonstrated more varied behaviour, including retrogradational deposit
growth. The deposit surface from the aerated flows had more consistent
angles, determined by the gas flow velocity (approximately 10° for 0.5 U
aeration) and generated deposits that were thinner and longer than those
from equivalent non-fluidized flows. Whether or not, the phase 3 flow over-
rode the distal extent of phase 1 and 2 deposits was controlled by the angle
of the advancing slope and the total mass of the charge in the experiment,
with large total masses and low angles favouring longer runouts. The
fluidized flows travelled rapidly (up to 1 m s ) down the length of the flume
and exited at the distal end. Source-generated unsteadiness caused the frontal
velocity to fluctuate, as in the non-fluidized and aerated flows. The thin
precursor flow (phase 1) and the following main flow (phase 2) could not be
distinguished. The fluidized flows (5–100 mm in thickness) remained
mobilised by gas support throughout their duration and can be considered
non-depositional.
A typical example an aerated flow is shown in Fig. 4 . Following rapid
emplacement of the precursor flow (phase 1), the front of the initial dense
flow reached its distal limit by 1.0 s (phase 2). The deposit then aggraded,
with no further advance of the front (phase 3). During phase 3, (which lasted
until shortly after the particle supply ceased at 2.0 s), the successive flow
pulses interacted with an increasingly steep and undulating depositional
surface. Coloured beads within the final deposit revealed a millimeter-thick
stratification with multiple, stacked progradational and retrogradational
mf
−1
8/8/2014 e.Proofing
http://eproofing.springer.com/journals/printpage.php?token=E4P6x4pOzu4bAL6WnU4qN2SVJIZb_86631kmJ6rZyIQ 12/32
surfaces resulting from the waxing and waning of individual flow pulse.
These surfaces occurred in localised groupings throughout the deposit, due to
the flow waxing at one point in the flume, while simultaneously waning at
another. The progradational surfaces (associated with waxing flow) also
demonstrate erosive contacts, indicating that the flow was not completely
depositional. A final flow pulse formed a drape over the entire deposit. As
the deposit built, interaction with existing (and developing) topography
became a strongly controlling factor in flow behaviour and the resulting
deposit architecture.
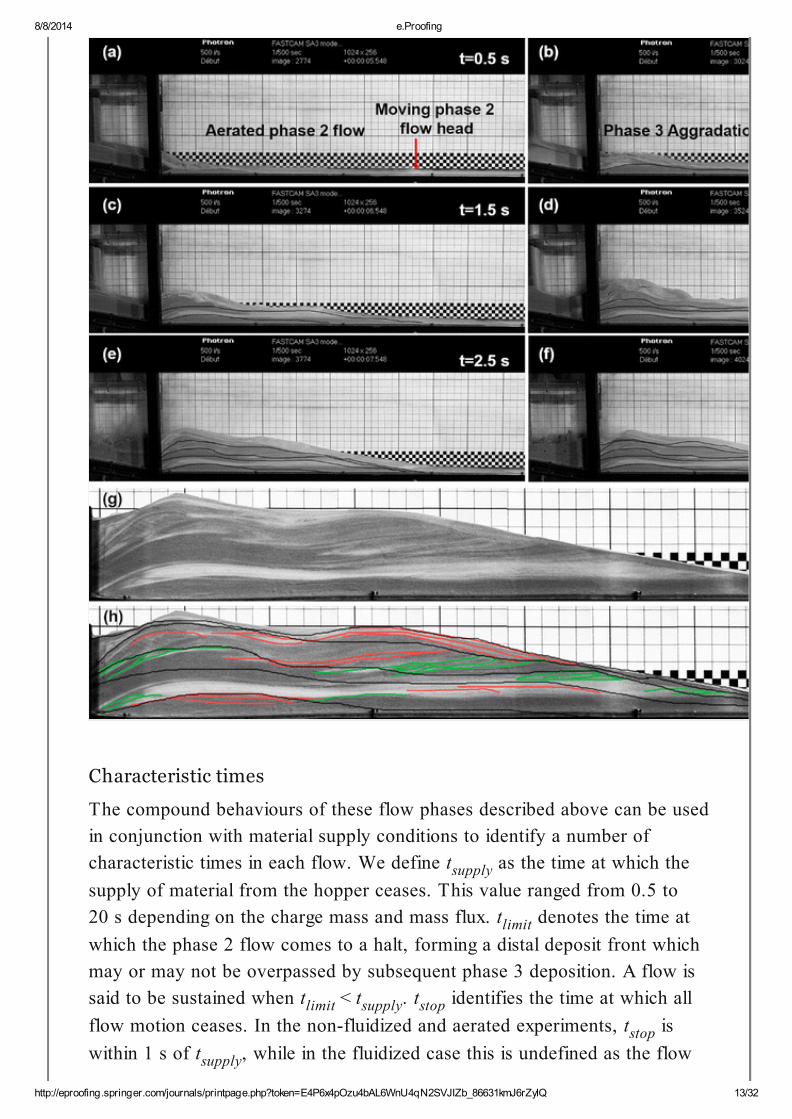
Fig. 4
a–f High-speed video frames taken at 0.5 s intervals through the flow and
deposition of a 10 kg multi-coloured charge supplied at 5 kg s with a gas
supply providing aeration at 0.5 U . Charge has been fully released by 2 s,
with the flow at complete rest by 3 s. The chequerboard squares are 1 cm
across for scale. Black lines indicate the deposit growth, highlighting the
location of the top of the deposit at each 0.5-s time interval. A video of this
experiment is presented in Online Resource 1. g The final deposit, showing
complex internal structure from the aggradational formation. h Final deposit in
(g) with interpretation and deposit growth lines, highlighting a range of contacts
including (red) progradational and (green) retrogradational phases of
deposition. The progradational features frequently demonstrate erosive style
contacts (e.g. the unit in the lower left of the deposit)
−1
mf
8/8/2014 e.Proofing
http://eproofing.springer.com/journals/printpage.php?token=E4P6x4pOzu4bAL6WnU4qN2SVJIZb_86631kmJ6rZyIQ 13/32
Characteristic times
The compound behaviours of these flow phases described above can be used
in conjunction with material supply conditions to identify a number of
characteristic times in each flow. We define t as the time at which the
supply of material from the hopper ceases. This value ranged from 0.5 to
20 s depending on the charge mass and mass flux. t denotes the time at
which the phase 2 flow comes to a halt, forming a distal deposit front which
may or may not be overpassed by subsequent phase 3 deposition. A flow is
said to be sustained when t < t . t identifies the time at which all
flow motion ceases. In the non-fluidized and aerated experiments, t is
within 1 s of t , while in the fluidized case this is undefined as the flow
supply
limit
limit supply stop
stop
supply
8/8/2014 e.Proofing
http://eproofing.springer.com/journals/printpage.php?token=E4P6x4pOzu4bAL6WnU4qN2SVJIZb_86631kmJ6rZyIQ 14/32
left the channel. These characteristic times are illustrated by labels for a
10 kg flow in Fig. 5a .
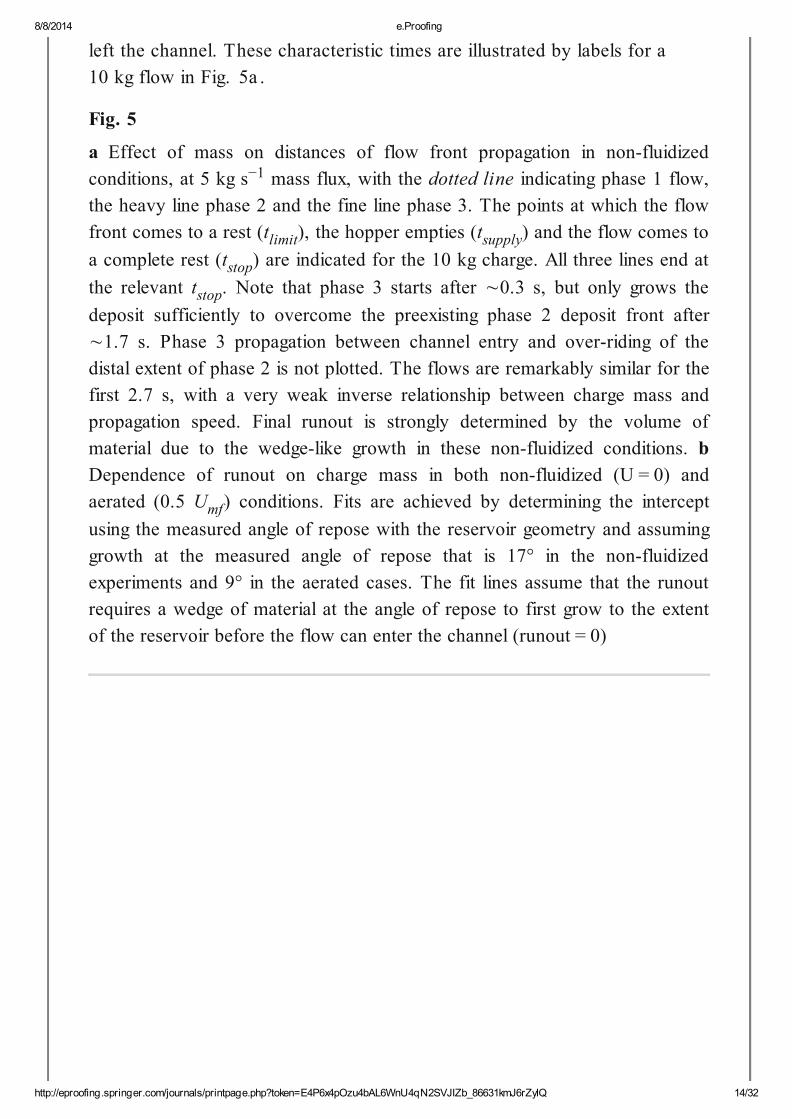
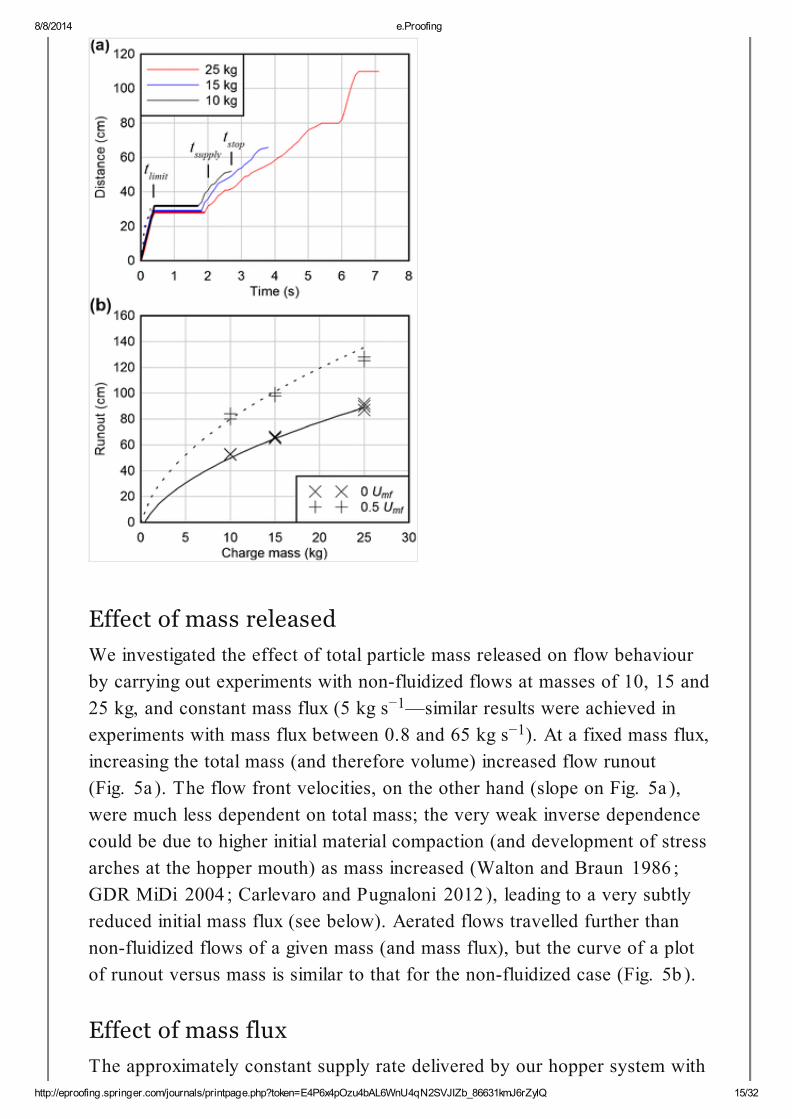
Fig. 5
a Effect of mass on distances of flow front propagation in non-fluidized
conditions, at 5 kg s mass flux, with the dotted line indicating phase 1 flow,
the heavy line phase 2 and the fine line phase 3. The points at which the flow
front comes to a rest (t ), the hopper empties (t ) and the flow comes to
a complete rest (t ) are indicated for the 10 kg charge. All three lines end at
the relevant t . Note that phase 3 starts after ∼0.3 s, but only grows the
deposit sufficiently to overcome the preexisting phase 2 deposit front after
∼1.7 s. Phase 3 propagation between channel entry and over-riding of the
distal extent of phase 2 is not plotted. The flows are remarkably similar for the
first 2.7 s, with a very weak inverse relationship between charge mass and
propagation speed. Final runout is strongly determined by the volume of
material due to the wedge-like growth in these non-fluidized conditions. b
Dependence of runout on charge mass in both non-fluidized (U = 0) and
aerated (0.5 U ) conditions. Fits are achieved by determining the intercept
using the measured angle of repose with the reservoir geometry and assuming
growth at the measured angle of repose that is 17° in the non-fluidized
experiments and 9° in the aerated cases. The fit lines assume that the runout
requires a wedge of material at the angle of repose to first grow to the extent
of the reservoir before the flow can enter the channel (runout = 0)
−1
limit supply
stop
stop
mf
8/8/2014 e.Proofing
http://eproofing.springer.com/journals/printpage.php?token=E4P6x4pOzu4bAL6WnU4qN2SVJIZb_86631kmJ6rZyIQ 15/32
Effect of mass released
We investigated the effect of total particle mass released on flow behaviour
by carrying out experiments with non-fluidized flows at masses of 10, 15 and
25 kg, and constant mass flux (5 kg s —similar results were achieved in
experiments with mass flux between 0.8 and 65 kg s ). At a fixed mass flux,
increasing the total mass (and therefore volume) increased flow runout
(Fig. 5a ). The flow front velocities, on the other hand (slope on Fig. 5a ),
were much less dependent on total mass; the very weak inverse dependence
could be due to higher initial material compaction (and development of stress
arches at the hopper mouth) as mass increased (Walton and Braun 1986 ;
GDR MiDi 2004 ; Carlevaro and Pugnaloni 2012 ), leading to a very subtly
reduced initial mass flux (see below). Aerated flows travelled further than
non-fluidized flows of a given mass (and mass flux), but the curve of a plot
of runout versus mass is similar to that for the non-fluidized case (Fig. 5b ).
Effect of mass flux
The approximately constant supply rate delivered by our hopper system with
−1
−1

8/8/2014 e.Proofing
http://eproofing.springer.com/journals/printpage.php?token=E4P6x4pOzu4bAL6WnU4qN2SVJIZb_86631kmJ6rZyIQ 16/32
a given aperture (Fig. 3a ) allowed us to investigate the effect of mass flux on
flow behaviour. This is illustrated in Fig. 6 using non-fluidized, aerated and
fluidized flows of 15 kg total mass at fluxes of 0.8, 1.8 and 5 kg s .
Increasing mass flux increased both the flow front velocity and runout
distance in all cases, with phase 2 and phase 3 flows responding differently
to mass flux (Fig. 6d ). Plotting of phase 2, front propagation velocity against
mass flux up to 5 kg s shows a square-root relationship, perhaps related to
the similar power-law dependence of particle concentration as a function of
mass flux (see section 2.1). Higher mass fluxes are excluded from these
analyses due to their very short duration, resulting in low confidence in both
the identification of flow phase transitions and measurement of average
velocities. However, tentative observations in the order of 3–4 m s for
phase 2 front speed in an aerated flow with a 65 kg s mass flux are in line
with these measurements and related conclusions at a mass flux <5 kg s
since the fit curve for 0.5 U suggests 3.5 m s at 65 kg s . Front
velocities of phase 3 propagation have a linear relationship of slope of 3.0
for both non-fluidized and aerated flows.
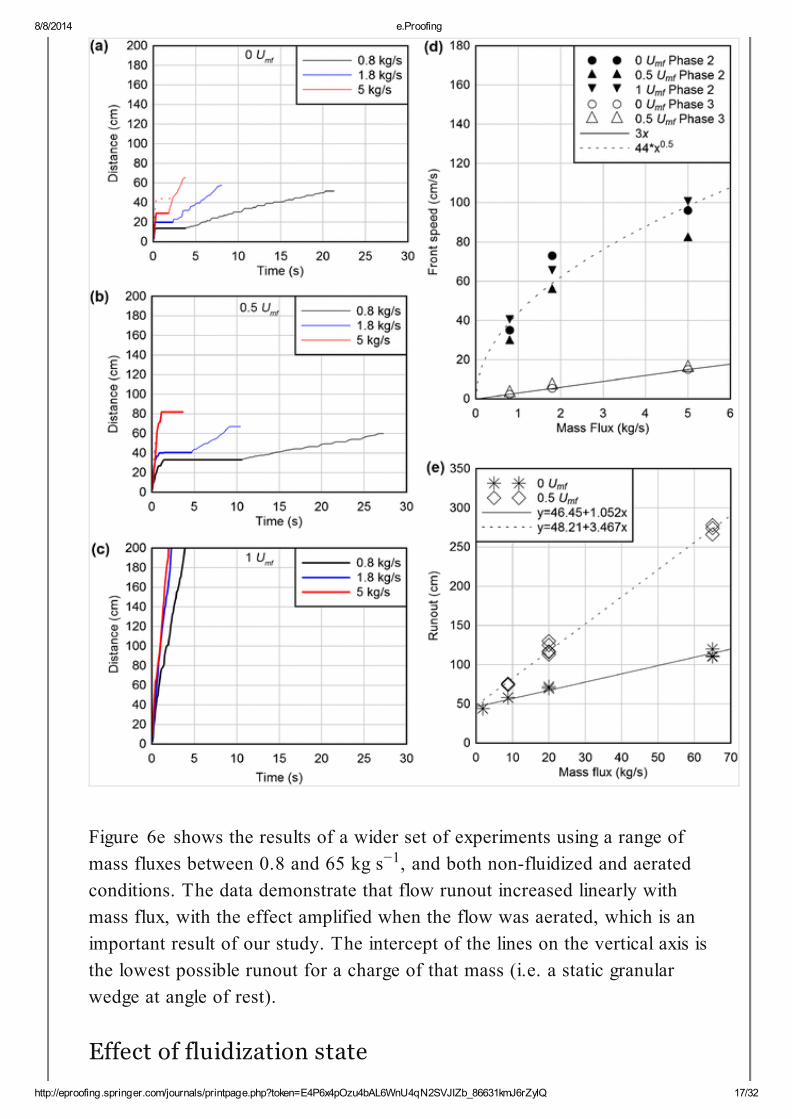
Fig. 6
Flow front propagation for various mass fluxes, using a 15 kg supply which is
a non-fluidized (hence the deposit growth occurs largely as a granular wedge at
the angle of repose), b aerated at 0.5 U and c fluidized at 1 U . The dotted
line represents phase 1 (where present), the heavy line represents phase 2 and
the fine line represents phase 3 (where present). Lines end when all flow has
ceased (t ), or, in the fluidized (U = U ) case, when the flow exits the video
frame. It should be noted that in the 5 kg s non-fluidized experiment (red
line in (a)) the initial phase 1 deposit forms a front which is not over-ridden by
phase 2, but which is eventually over-ridden by phase 3 at ∼2.3 s. Phase 3
propagation between channel entry and overriding the distal extent of phase 2
is not plotted. d Average front speeds calculated for phases 2 (filled) and 3
(open) in experiments using low mass fluxes from 0.8–5 kg s , to illustrate
that in phase 2 the velocities respond to an inverse quadratic of mass flux
while in phase 3 front progradation has a linear relationship with mass flux. e
Runout distances for different mass fluxes (0.8–65 kg s ) in non-fluidized and
aerated conditions. Larger mass fluxes correlate with a longer runout, with this
effect further increased when aeration is present
−1
−1
−1
−1
−1
mf−1 −1
mf mf
stop mf−1
−1
−1
8/8/2014 e.Proofing
http://eproofing.springer.com/journals/printpage.php?token=E4P6x4pOzu4bAL6WnU4qN2SVJIZb_86631kmJ6rZyIQ 17/32
Figure 6e shows the results of a wider set of experiments using a range of
mass fluxes between 0.8 and 65 kg s , and both non-fluidized and aerated
conditions. The data demonstrate that flow runout increased linearly with
mass flux, with the effect amplified when the flow was aerated, which is an
important result of our study. The intercept of the lines on the vertical axis is
the lowest possible runout for a charge of that mass (i.e. a static granular
wedge at angle of rest).
Effect of fluidization state
−1
8/8/2014 e.Proofing
http://eproofing.springer.com/journals/printpage.php?token=E4P6x4pOzu4bAL6WnU4qN2SVJIZb_86631kmJ6rZyIQ 18/32
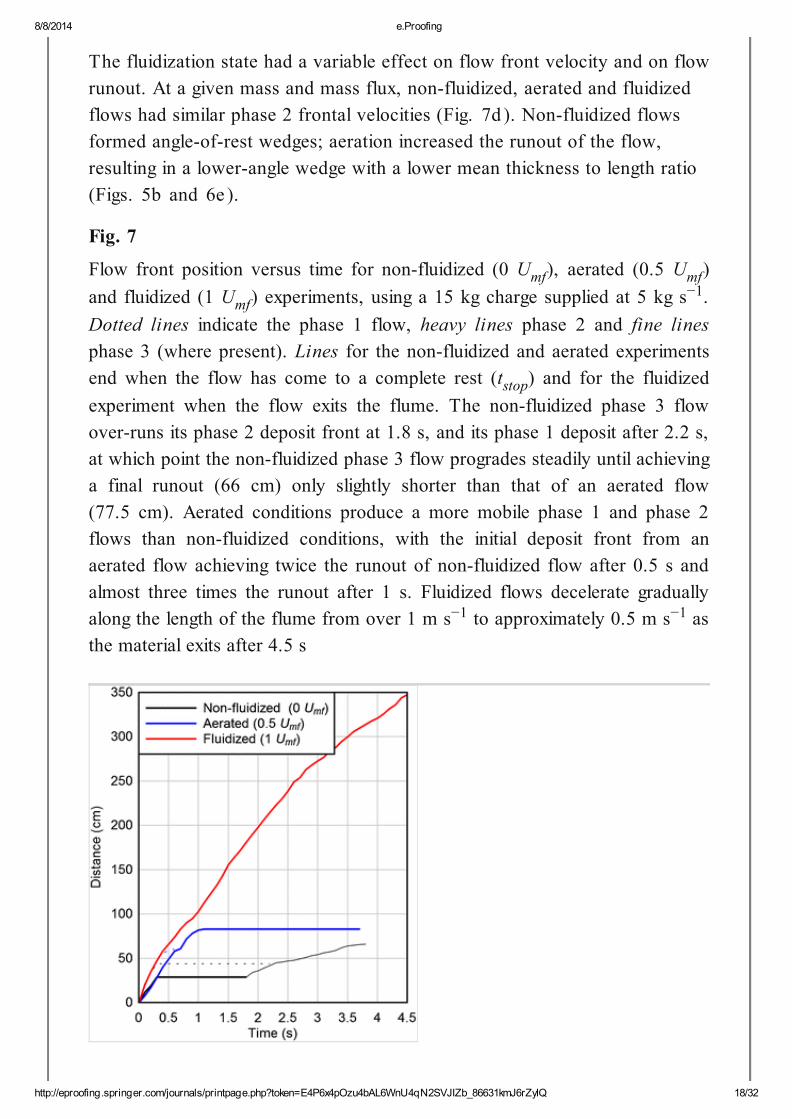
The fluidization state had a variable effect on flow front velocity and on flow
runout. At a given mass and mass flux, non-fluidized, aerated and fluidized
flows had similar phase 2 frontal velocities (Fig. 7d ). Non-fluidized flows
formed angle-of-rest wedges; aeration increased the runout of the flow,
resulting in a lower-angle wedge with a lower mean thickness to length ratio
(Figs. 5b and 6e ).
Fig. 7
Flow front position versus time for non-fluidized (0 U ), aerated (0.5 U )
and fluidized (1 U ) experiments, using a 15 kg charge supplied at 5 kg s .
Dotted lines indicate the phase 1 flow, heavy lines phase 2 and fine lines
phase 3 (where present). Lines for the non-fluidized and aerated experiments
end when the flow has come to a complete rest (t ) and for the fluidized
experiment when the flow exits the flume. The non-fluidized phase 3 flow
over-runs its phase 2 deposit front at 1.8 s, and its phase 1 deposit after 2.2 s,
at which point the non-fluidized phase 3 flow progrades steadily until achieving
a final runout (66 cm) only slightly shorter than that of an aerated flow
(77.5 cm). Aerated conditions produce a more mobile phase 1 and phase 2
flows than non-fluidized conditions, with the initial deposit front from an
aerated flow achieving twice the runout of non-fluidized flow after 0.5 s and
almost three times the runout after 1 s. Fluidized flows decelerate gradually
along the length of the flume from over 1 m s to approximately 0.5 m s as
the material exits after 4.5 s
mf mf
mf−1
stop
−1 −1
8/8/2014 e.Proofing
http://eproofing.springer.com/journals/printpage.php?token=E4P6x4pOzu4bAL6WnU4qN2SVJIZb_86631kmJ6rZyIQ 19/32
Discussion
Relative significance of variables
The effects of each of the three variables (mass, mass flux and fluidization
state) on the dense flow velocity and runout are now summarized and
discussed.
Velocity
Phase 2 front velocity of the non-fluidized (U = 0), aerated (U = 0.5 U )
and fluidized (U = 1.0 U ) flows increased with mass flux according to a
square-root relationship for mass fluxes up to at least 5 kg s (Fig. 6d ), but
was rather insensitive to either total particle mass (Fig. 5a ) or fluidization
state (Figs. 6d and 7 ). This differs from the phase 3 whose velocity
followed a linear relationship with the mass flux in both the non-fluidized and
aerated flows, with flows of larger mass simply lasting longer due to the
longer supply time. The fundamental difference between these 2 phases is
that phase 2 represents the movement of a single flow pulse, while phase 3 is
dependant entirely on the rate at which subsequent flow pulses over-run the
deposits of earlier pulses. Preexisting deposit surfaces are uneven and
unconsolidated, and therefore act to dissipate energy from the over-riding
flow, leading to generally reduced runout, except where the slope angle
becomes sufficient to add a compensating acceleration.
Flow runout
The runout of the non-fluidized (U = 0) and aerated (U = 0.5 U ) flows
with initial particle concentration up to ∼ 45 % (at 65 kg s ) increased
linearly with mass flux (Fig. 6e ). Increasing mass flux from 0.8 to 65 kg s
caused a trebling of runout in non-fluidized flows, while having a nearly
sixfold effect on the runout of aerated currents (Fig. 6e ). Runout also
increased with the total mass (Fig. 5b ) and with the degree of fluidization
(Fig. 7 ). The runout of fully fluidized flow (U = Umf) exceeded the 350 cm
length of the flume.
Owing to the characteristics of the hopper particle-feed system, changing the
mass flux also resulted in a change of the particle concentration in the
collapsing granular mass. Lower mass fluxes were associated with lower
initial concentrations so that the granular material had to first density (by gas
expulsion) prior to flow generation. Further experiments are required to
mf
mf−1
mf−1
−1
8/8/2014 e.Proofing
http://eproofing.springer.com/journals/printpage.php?token=E4P6x4pOzu4bAL6WnU4qN2SVJIZb_86631kmJ6rZyIQ 20/32
separate the effects of mass flux and initial concentration on flow behaviour.
However, it is interesting to note that runout of non-fluidized and aerated
flows correlates linearly with mass flux up to at least 65 kg s . This
suggests that the initial particle concentration was unimportant in governing
flow behaviour, as dense flows rapidly formed (<0.1 s after impingement)
even in the most dilute supply conditions and that mass flux was the major
controlling variable.
Behaviours of sustained versus transient laboratoryflows
Our experiments serve to highlight some significant difference between
transient, dam-break flows (e.g. Roche et al. 2004 , 2008 ; Girolami et al.
2008 ) and sustained granular flows presented here. First, t in sustained
flows is longer that t , in contrast to dam-break flows, so that particles
continue to be supplied to the flow system after the maximum runout
distance has been reached. Second, in the dam-break case, almost the entire
particle volume is mobilised at once, with the flow steadily thinning as it
propagates and deposits. The final deposit thickness is less than or equal to
the flow thickness. This is in contrast to the sustained flow case, in which
the dense flow pulses, caused by high-frequency fluctuations of the source
supply, accumulated to form a final deposit that could be orders of
magnitude thicker than the flow.
Another feature of our sustained experimental flows is that the series of
pulses formed the deposit through a series of waxing-waning cycles. This
contrasts with dam-break experiments in which there is a single, rapid cycle
of waxing, then waning, flow (Girolami et al. 2008 ; Roche et al. 2004 ;
Roche 2012 ). This unsteadiness in the sustained flows generated deposits
with complex internal architectures characterized by multiple, stacked
progradational and retrogradational surfaces. While these conditions are
interesting from a field perspective, as discussed below, a challenge in future
experiments will be to employ source supply conditions that do not generate
such strong flow unsteadiness, in order to properly evaluate the influence of
other parameters.
Finally, the frontal velocity and runout of dam-break flows are controlled by
the initial bed height and the fluidization state (Roche et al. 2008 ). In
sustained flows, an additional factor is the mass flux (and through it the
particle supply duration), which has an additional strong effect not relevant
−1
supply
limit
8/8/2014 e.Proofing
http://eproofing.springer.com/journals/printpage.php?token=E4P6x4pOzu4bAL6WnU4qN2SVJIZb_86631kmJ6rZyIQ 21/32
in transient flows. Though higher bed height in dam-break experiments
causes higher flow velocity and hence mass flux, we recall that our sustained
flows were generated from a source at constant height, demonstrating that
the mass flux also controls flow emplacement.
Implications for dense pyroclastic density currents
While fluidized granular flows generated in dam-break configurations provide
insight into the dynamics of either a single pyroclastic flow unit during a
sustained eruption or a transient flows from lava dome collapse or the
fallback of vulcanian columns, our present experimental system offers a way
of investigating pyroclastic flows and ignimbrites formed by sustained
fountain collapse. Moreover, sustaining high pore pressure by injection of
gas during flow allows us to mimic experimentally long-lived pore pressure
due to sustained external and/or internal gas sources, particle hindered
settling and slow pressure diffusion characteristic of natural pyroclastic
flows, which could not be achieved in experiments with initial fluidization at
source only. Sustained high pore pressure enables even thin (mm-scale)
experimental flows to propagate for several metres. Moreover, the apparatus
allows even relatively thin flows (millimetres to centimetres in these
experiments) to progressively accrete a deposit, the final thickness of which
is much greater than the flow pulses themselves.
Although our results are very preliminary, it is worth noting some possible
applications to the transport and deposition behaviour of high-concentration
PDCs (i.e. pyroclastic flows) and the formation of thick ignimbrites. First,
the experiments show that sustained aerated flows are emplaced as three
phases. In phase 1, initial impact of the collapsing particles (crudely
analogous to a collapsing eruption column) may generate high gas pressures
and a ‘spray’ of particles that shoots ahead of the main flow, accompanied
by a dilute cloud of particles. This precursor flow lays down a very thin
deposit, typically displaying a highly asymmetric and/or lobate front, which is
then over-run by the main phase 2 flow. Although our experiments in no way
scale to the natural system in this respect, regarding particularly turbulence,
we speculate that this kind of phenomenon might account in some cases for
the ‘ground surge deposits’ commonly observed at the base of ignimbrites
(Sparks et al. 1973 ; Wilson 1980 ; Wright et al. 1980 ; Valentine et al.
1989 ; Fisher et al. 1993 ; Dellino and La Volpe 2000 ). The experiments
presented here represent the dense end of the PDC spectrum while natural

8/8/2014 e.Proofing
http://eproofing.springer.com/journals/printpage.php?token=E4P6x4pOzu4bAL6WnU4qN2SVJIZb_86631kmJ6rZyIQ 22/32
flows are likely to encompass a broader range of characteristics, including
the turbulent dilute end member (e.g. Andrews and Manga 2012 ). The spray
observed in our experiments has some similarities with the initial blast wave
generated by collapsing eruption columns in the numerical models of
Wohletz et al. ( 1984 ). Also, the deposit resembles that of the so-called
‘surge’ observed by Roche et al. ( 2011 ) in their experiments, as high pore
pressure at base of a fluidized granular column is suddenly released, being
very thin and emplaced rapidly and asymmetrically ahead of the larger dense
flow.
The second feature of our experiments is that the main phase 2 dense flow
forms readily at the impingement surface even with collapsing material
concentrations as low as ∼3–4 vol.%. This is an important result of our
study. The phase 2 flow travels out to a distal limit, determined by the mass
flux, total mass and particle fluidization state. Phase 3 sees the deposit
aggrade vertically to a final thickness much greater than that of the phase-2
flow. During the extended deposition of phase 3 material, the distal limit may
or may not advance further, essentially because the pulses have lower
velocity than the main phase 2 flow. We infer from this that sustained
pyroclastic flows may reach a distal limit relatively early in their
emplacement, after which the remainder of the deposit will vertically aggrade
through accumulation of pulses to form thick ignimbrite. The exact
behaviour in nature would, of course, depend on temporal variations in the
source mass flux, the fluidization state of the flow and/or the ground slope.
Nevertheless, the experimental flows support the interpretation that thick
ignimbrites can aggrade progressively from a sustained supply of thin,
flowing granular material, without the necessity of thick individual flow units
(Sparks 1976 ; Wright and Walker 1981 ; Hayashi and Self 1992 ; Palladino
and Valentine 1995 ; Calder et al. 2000 ; Branney and Kokelaar 2002 ;
Wilson and Hildreth 2003 ; Brown and Branney 2004b ; Fierstein and Wilson
2005 ).
Third, although the unsteadiness in our experimental flows was inherent to
the feeder mechanism, it is likely that natural pyroclastic flows are similarly
unsteady on a short timescale (even if they are quasi-steady on a longer
timescale). Unsteadiness leads to temporal and spatial variations of
thickness, velocity and momentum in the flow system. In addition to the
high-frequent unsteadiness, the experiments show a waxing (as first material
is provided) and then waning (as there is no more material from the hopper)
8/8/2014 e.Proofing
http://eproofing.springer.com/journals/printpage.php?token=E4P6x4pOzu4bAL6WnU4qN2SVJIZb_86631kmJ6rZyIQ 23/32
phase, as is thought to occur in some cases of ignimbrite emplacement
(Williams et al. 2014 ). The complex internal architectures of the
experimental deposits (Fig. 4 ), including stacked progradational and
retrogradational surfaces, resemble those of some natural ignimbrites (e.g.
Branney and Kokelaar 2002 ; Wilson and Hildreth 2003 ; Brown and
Branney 2004a ; Brown et al. 2007 ). It is possible such features are present
in many deposits, but are masked by uniform grain size characteristics
(Rowley et al. 2011 ). The response of the later stages of the experimental
flows to topography formed by earlier phases is entirely fitting with PDC
behaviour, which is seen to have strong responses to even relatively minor
changes in topography (e.g. Giordano 1998 ; Pittari et al. 2006 ; Doronzo
and Dellino 2014 ).
The ability of the experimental flows to aggrade deposits that are much
thicker than the flows themselves is notably similar to the aggradation
mechanism invoked in a number of ignimbrite deposits (e.g. (Branney and
Kokelaar 1997 ; Cas et al. 2011 ). These experimental dense flows were fed
purely from the proximal end of the flume, with material ranging from highly
dilute (∼3–4 vol.%) to highly concentrated (∼45 vol.%).
ConclusionsOur experiments using granular flows on a horizontal slope fed by a
continuous supply of collapsing material onto an impingement surface enable
the investigation of some of the behaviours of sustained PDCs. They
consider non-fluidized flows as well as aerated and fully fluidized flows
generated by continuous gas supply to their base, which permits the
simulation of long-lived high pore pressure that favours propagation. Non-
fluidized and aerated flows propagate in three distinct but overlapping
phases; an initial fast dilute spray (phase 1), a subsequent slower dense
unsteady flow which may over-ride the phase 1 deposit (phase 2), and finally
sustained aggradation through unsteady dense flow pulses (phase 3). An
important result of our study is that dense flows at almost maximum particle
concentration are generated as particles accumulate at the impingement
surface, even when the particle concentration at source is of a few percent.
Mass flux has a strong control on flow behaviour, with an inverse-quadratic
relationship to phase 2 flow front velocity in the ranges observed, becoming
a linear control on the propagation velocity of the front of the deposit during
phase 3, formed by accumulation of pulses in both non-fluidized and aerated

8/8/2014 e.Proofing
http://eproofing.springer.com/journals/printpage.php?token=E4P6x4pOzu4bAL6WnU4qN2SVJIZb_86631kmJ6rZyIQ 24/32
flows. A linear dependence is observed in the runout distance of non-
fluidized and aerated flows for a range of mass fluxes up to 65 kg s ,
corresponding to a particle concentration of ∼45 %. Fluidized flows remain
mobile, with essentially infinite runouts. As in dam-break experiments,
charge mass is of secondary importance in the control of flow speed or
runout, whatever the degree of fluidization of the flows.
The experiments demonstrate the ability of sustained granular flows to
aggrade deposits many times thicker than the primary phase-2 flow and the
subsequent phase-3 pulses, with complex internal architectures typical of
many ignimbrites produced by temporal and spatial variation in flow
properties.
Acknowledgments
PR was supported by a Université Blaise Pascal postdoctoral fellowship,
with experimental work funded by a grant from the volcanology group of the
Laboratoire Magmas et Volcans. This is Laboratory of Excellence ClerVolc
(ANR-10-LABX-0006) contribution number 106. We thank the reviewers B.
Andrews and C. Wilson, whose comments and suggestions significantly
improved this manuscript.
Electronic supplementary materialBelow is the link to the electronic supplementary material.
Online Resource 1 (MPG 74368 kb)
References
Andrews B, Manga M (2011) Effects of topography on pyroclastic
density current runout and formation of coignimbrites. Geology
39(12):1099–1103. doi:1010.1130/G32226.32221
Andrews BJ, Manga M (2012) Experimental study of turbulence,
sedimentation, and coignimbrite mass partitioning in dilute pyroclastic
density currents. J Volcanol Geotherm Res 225:30–44. doi:
10.1016/j.jvolgeores.2012.02.011
−1
8/8/2014 e.Proofing
http://eproofing.springer.com/journals/printpage.php?token=E4P6x4pOzu4bAL6WnU4qN2SVJIZb_86631kmJ6rZyIQ 25/32
Bareschino P, Lirer L, Marzocchella A, Petrosino P, Salatino P (2008)
Self-fluidization of subaerial rapid granular flows. Powder Technol
182:323–333. doi: 10.1016/j.powtec.2007.12.010
Bernal J, Mason J (1960) Packing of spheres: Coordination of randomly
packed spheres. Nature 188:910–911. doi: 10.1038/188910a0
Boudet J, Amarouchene Y, Bonnier B, Kellay H (2007) The granular
jump. J Fluid Mech 572:413–432. doi: 10.1017/S002211200600365X
Branney MJ, Kokelaar P (1997) Giant bed from a sustained catastrophic
density current flowing over topography: Acatlan ignimbrite, Mexico.
Geology 25:115–118. doi: 10.1130/0091-
7613(1997)025<0115:GBFASC>2.3.CO;2
Branney MJ, Kokelaar BP (2002) Pyroclastic density currents and the
sedimentation of ignimbrites. Geol Soc London Memoir, 27
AQ2
Brown RJ, Branney MJ (2004a) Bypassing and diachronous deposition
from density currents: Evidence from a giant regressive bed form in the
Poris ignimbrite, Tenerife, Canary Islands. Geology 32:445–448. doi:
10.1130/G20188.1
Brown RJ, Branney MJ (2004b) Event-stratigraphy of a caldera-forming
ignimbrite eruption on Tenerife: the 273 ka Poris formation. Bull
Volcanol 66:392–416. doi: 10.1007/s00445-003-0321-y
Brown RJ, Kokelaar B, Branney MJ (2007) Widespread transport of
pyroclastic density currents from a large silicic tuff ring: the Glaramara
tuff, Scafell caldera, English Lake District, UK. Sedimentology 54:1163–
1190. doi: 10.1111/j.1365-3091.2007.00877.x
Calder E, Sparks R, Gardeweg M (2000) Erosion, transport and
segregation of pumice and lithic clasts in pyroclastic flows inferred from
ignimbrite at Lascar Volcano, Chile. J Volcanol Geotherm Res 104:201–
235. doi: 10.1016/S0377-0273(00)00207-9
Carlevaro CM, Pugnaloni LA (2012) Arches and contact forces in a
8/8/2014 e.Proofing
http://eproofing.springer.com/journals/printpage.php?token=E4P6x4pOzu4bAL6WnU4qN2SVJIZb_86631kmJ6rZyIQ 26/32
granular pile. Eur Phys J E 35:1–7. doi: 10.1140/epje/i2012-12044-7
Cas RA, Wright HM, Folkes CB, Lesti C, Porreca M, Giordano G,
Viramonte JG (2011) The flow dynamics of an extremely large volume
pyroclastic flow, the 2.08-Ma Cerro Galán Ignimbrite, NW Argentina,
and comparison with other flow types. Bull Volcanol 73:1583–1609. doi:
10.1007/s00445-011-0564-y
Chédeville C, Roche O (2014) Autofluidization of pyroclastic flows
propagating on rough substrates as shown by laboratory experiments. J
Geophys Res 119:1764–1776. doi: 10.1002/2013JB010554
Dellino P, La Volpe L (2000) Structures and grain size distribution in
surge deposits as a tool for modelling the dynamics of dilute pyroclastic
density currents at La Fossa di Vulcano (Aeolian Islands, Italy). J
Volcanol Geotherm Res 96:57–78. doi: 10.1016/S0377-0273(99)00140-7
Dellino P, Zimanowski B, Büttner R, La Volpe L, Mele D, Sulpizio R
(2007) Large-scale experiments on the mechanics of pyroclastic flows:
Design, engineering, and first results. J Geophys Res 112:B04202. doi:
10.1029/2006JB004313
Doronzo DM, Dellino P (2014) Pyroclastic density currents and local
topography as seen with the conveyer model. J Volcanol Geotherm Res
278:25–39. doi: 10.1016/j.jvolgeores.2014.03.012
Druitt TH (1998) Pyroclastic density currents. In: Gilbert JS, Sparks RSJ
(eds) The physics of explosive volcanic eruptions. Special Publications
145, London, pp 145–182
Druitt TH, Bruni G, Lettieri P, Yates JG (2004) The fluidization
behaviour of ignimbrite at high temperature and with mechanical
agitation. Geophys Res Lett 31, L02604. doi: 10.1029/2003GL018593
Druitt TH, Avard G, Bruni G et al (2007) Gas retention in fine-grained
pyroclastic flow materials at high temperatures. Bull Volcanol 69:881–
901. doi: 10.1007/s00445-007-0116-7
Dufek J, Bergantz G (2007a) Suspended load and bed-load transport of

8/8/2014 e.Proofing
http://eproofing.springer.com/journals/printpage.php?token=E4P6x4pOzu4bAL6WnU4qN2SVJIZb_86631kmJ6rZyIQ 27/32
particle-laden gravity currents: the role of particle-bed interaction. Theor
Comp Fluid Dyn 21:119–145. doi: 10.1007/s00162-007-0041-6
Dufek J, Bergantz GW (2007b) Dynamics and deposits generated by the
Kos Plateau Tuff eruption: Controls of basal particle loss on pyroclastic
flow transport. Geochem Geophy Geosy 8:1525–2027
Dufek J, Wexler J, Manga M (2009) Transport capacity of pyroclastic
density currents: Experiments and models of substrate-flow interaction. J
Geophys Res 114:B11203. doi: 10.1029/2007GC001741
Eames I, Gilbertson M (2000) Aerated granular flow over a horizontal
rigid surface. J Fluid Mech 424:169–195. doi:
10.1017/S0022112000001920
Esposti-Ongaro T, Barsotti S, Neri A, Salvetti MV (2011) Large-eddy
simulation of pyroclastic density currents. In: Salvetti MV, Geurts B,
Meyers J, Sagaut P (eds) Quality and reliability of large-eddy simulations
II. Springer, Netherlands, pp 161–170. doi: 10.1007/978-94-007-0231-
8_15
Fan L-S, Zhu C (2005) Principles of gas-solid flows. Cambridge
University Press, USA
Fierstein J, Wilson CJN (2005) Assembling an ignimbrite:
Compositionally-defined flow packages in the 1912 valley of ten thousand
smokes ignimbrite, Alaska. Geol Soc Am Bull 117:1094–1107. doi:
10.1130/B25621.1
Fisher RV, Orsi G, Ort M, Heiken G (1993) Mobility of a large-volume
pyroclastic flow—Emplacement of the Campanian ignimbrite, Italy. J
Volcanol Geotherm Res 56:205–220. doi: 10.1016/0377-0273(93)90017-
L
Geldart D (1972) The effect of particle size and size distribution on the
behaviour of gas-fluidised beds. Powder Technol 6:201–215. doi:
10.1016/0032-5910(72)83014-6
Geldart D (1973) Types of gas fluidization. Powder Technol 7:285–292.
8/8/2014 e.Proofing
http://eproofing.springer.com/journals/printpage.php?token=E4P6x4pOzu4bAL6WnU4qN2SVJIZb_86631kmJ6rZyIQ 28/32
doi: 10.1016/0032-5910(73)80037-3
Gilbertson MA, Eames I (2003) The influence of particle size on the flow
of fluidised powders. Powder Technol 131:197–205. doi: 10.1016/S0032-
5910(02)00343-1
Gilbertson MA, Jessop DE, Hogg AJ (2008) The effects of gas flow on
granular currents. Phil Trans R Soc A 366:2191–2203. doi:
10.1098/rsta.2007.0021
Giordano G (1998) The effect of paleotopography on lithic distribution
and facies associations of small volume ignimbrites: the WTT Cupa
(Roccamonfina volcano, Italy). J Volcanol Geotherm Res 87:255–273.
doi: 10.1016/S0377-0273(98)00096-1
Girolami L, Druitt TH, Roche O, Khrabrykh Z (2008) Propagation and
hindered settling of laboratory ash flows. J Geophys Res 113, B02202.
doi: 10.1029/2007JB005074
Hayashi J, Self S (1992) A comparison of pyroclastic flow and debris
avalanche mobility. J Geophys Res 97:9063–9071. doi:
10.1029/92JB00173
Hoblitt RP (1986) Observations of the eruptions of July 22 and August 7,
1980, at Mount St. Helens, Washington. USGS Professional Paper 1335
Iverson RM, LaHusen RG (1989) Dynamic pore-pressure fluctuations in
rapidly shearing granular materials. Science 246:796–799. doi:
10.1126/science.246.4931.796
Loughlin S, Baxter P, Aspinall W et al (2002) Eyewitness accounts of the
25 June 1997 pyroclastic flows and surges at Soufrière Hills Volcano,
Montserrat, and implications for disaster mitigation. Geol Soc London
Memoirs 21:211–230. doi: 10.1144/GSL.MEM.2002.021.01.10
Lube G, Cronin SJ, Platz T et al (2007) Flow and deposition of
pyroclastic granular flows: a type example from the 1975 Ngauruhoe
eruption, New Zealand. J Volcano Geotherm Res 161:165–186. doi:
10.1016/j.jvolgeores.2006.12.003
8/8/2014 e.Proofing
http://eproofing.springer.com/journals/printpage.php?token=E4P6x4pOzu4bAL6WnU4qN2SVJIZb_86631kmJ6rZyIQ 29/32
Middleton GV (1966) Experiments on density and turbidity currents: I.
motion of the head. Can J Earth Sci 3:523–546. doi: 10.1139/e66-038
MiDi GDR (2004) On dense granular flows. Eur Phys J E 14:341–365.
doi: 10.1140/epje/i2003-10153-0
Nakashima K, Johno Y, Shigematsu T (2009) Free fall characteristics of
particle clusters in a vertical pipe. J Phys: Conf Ser 147:012070. doi:
10.1088/1742-6596/147/1/012070
Nezzal A, Large J, Guigon P (1998) Fluidisation behaviour of very
cohesive powders under mechanical agitation. In: Fluidization VIII, Proc
Eighth Engineering Foundation Conference on Fluidization, May 14–19.
Am Inst Chem Eng 77–82
Palladino DM, Valentine GA (1995) Coarse-tail vertical and lateral
grading in pyroclastic flow deposits of the Latera Volcanic Complex
(Vulsini, central Italy): Origin and implications for flow dynamics. J
Volcanol Geotherm Res 69:343–364. doi: 10.1016/0377-0273(95)00036-
4
Pittari A, Cas R, Edgar C, Nichols HJ, Wolff JA, Marti J (2006) The
influence of palaeotopography on facies architecture and pyroclastic flow
processes of a lithic-rich ignimbrite in a high gradient setting: the Abrigo
Ignimbrite, Tenerife, Canary Islands. J Volcanol Geotherm Res 152:273–
315. doi: 10.1016/j.jvolgeores.2005.10.007
Rhodes MJ (2008) Introduction to particle technology. Wiley, Chichester
Roche O (2012) Depositional processes and gas pore pressure in
pyroclastic flows: an experimental perspective. Bull Volcanol 74:1807–
1820. doi: 10.1007/s00445-012-0639-4
Roche O, Gilbertson MA, Phillips JC, Sparks RSJ (2004) Experimental
study of gas-fluidized granular flows with implications for pyroclastic
flow emplacement. J Geophys Res 109:B10201. doi:
10.1029/2003JB002916
Roche O, Gilbertson MA, Phillips JC, Sparks RSJ (2006) The influence
8/8/2014 e.Proofing
http://eproofing.springer.com/journals/printpage.php?token=E4P6x4pOzu4bAL6WnU4qN2SVJIZb_86631kmJ6rZyIQ 30/32
of particle size on the flow of initially fluidised powders. Powder Technol
166:167–174. doi: 10.1016/j.powtec.2006.05.010
Roche O, Montserrat S, Niño Y, Tamburrino A (2008) Experimental
observations of water-like behavior of initially fluidized, unsteady dense
granular flows and their relevance for the propagation of pyroclastic
flows. J Geophys Res 113:B12203. doi: 10.1029/2008JB005664
Roche O, Montserrat S, Niño Y, Tamburrino A (2010) Pore fluid
pressure and internal kinematics of gravitational laboratory air-particle
flows: Insights into the emplacement dynamics of pyroclastic flows. J
Geophys Res 115:B09206. doi: 10.1029/2009JB007133
Roche O, Attali M, Mangeney A, Lucas A (2011) On the run-out distance
of geophysical gravitational flows: Insight from fluidized granular collapse
experiments. Earth Planet Sci Lett 311:375–385. doi:
10.1016/j.epsl.2011.09.023
Rowley PJ, Kokelaar P, Menzies M, Waltham D (2011) Shear-derived
mixing in dense granular flows. J of Sed Res 81:874–884. doi:
10.2110/jsr.2011.72
Savage SB, Oger L (2013) Airslide flows, part 1-experiments, review and
extension. Chem Eng Sci 91:35–43. doi: 10.1016/j.ces.2012.12.043
Schellart W (2000) Shear test results for cohesion and friction
coefficients for different granular materials: Scaling implications for their
usage in analogue modelling. Tectonophysics 324:1–16. doi:
10.1016/S0040-1951(00)00111-6
Schmincke H-U, Fisher RV, Waters AC (1973) Antidune and chute and
pool structures in the base surge deposits of the Laacher See area,
Germany. Sedimentology 20:553–574. doi: 10.1111/j.1365-
3091.1973.tb01632.x
Simpson JE (1999) Gravity currents: In the environment and the
laboratory. Cambridge University Press, Cambridge
Song C, Wang P, Makse HA (2008) A phase diagram for jammed matter.
8/8/2014 e.Proofing
http://eproofing.springer.com/journals/printpage.php?token=E4P6x4pOzu4bAL6WnU4qN2SVJIZb_86631kmJ6rZyIQ 31/32
Nature 453:629–632. doi: 10.1038/nature06981
Sparks RSJ (1976) Grain size variations in ignimbrites and implications
for the transport of pyroclastic flows. Sedimentology 23:147–188. doi:
10.1111/j.1365-3091.1976.tb00045.x
Sparks RSJ, Self S, Walker GPL (1973) Products of ignimbrite eruptions.
Geology 1:115–118. doi: 10.1130/0091-
7613(1973)1<115:POIE>2.0.CO;2
Valentine GA, Buesch DC, Fisher RV (1989) Basal layered deposits of
the Peach Springs Tuff, northwestern Arizona, USA. Bull Volcanol
51:395–414. doi: 10.1007/BF01078808
Walton OR, Braun RL (1986) Viscosity, granular-temperature, and stress
calculations for shearing assemblies of inelastic, frictional disks. J Rheol
30:949–980. doi: 10.1122/1.549893
Williams R, Branney MJ, Barry TL (2014) Temporal and spatial
evolution of a waxing then waning catastrophic density current revealed
by chemical mapping. Geology 42:107–110, doi:110.1130/G34830.34831
Wilson CJN (1980) The role of fluidization in the emplacement of
pyroclastic flows: an experimental approach. J Volcanol Geotherm Res
8:231–249. doi: 10.1016/0377-0273(80)90106-7
Wilson CJN, Hildreth W (2003) Assembling an ignimbrite: Mechanical
and thermal building blocks in the Bishop Tuff, California. J Geol
111:653–670. doi: 10.1086/378335
Wohletz KH, McGetchin T, Sandford M II, Jones E (1984)
Hydrodynamic aspects of caldera-forming eruptions: Numerical models. J
Geophys Res 89:8269–8285. doi: 10.1029/JB089iB10p08269
Wright JV, Walker GP (1981) Eruption, transport and deposition of
ignimbrite: a case study from Mexico. J Volcanol Geotherm Res 9:111–
131. doi: 10.1016/0377-0273(81)90001-9
Wright JV, Smith AL, Self S (1980) A working terminology of pyroclastic

8/8/2014 e.Proofing
http://eproofing.springer.com/journals/printpage.php?token=E4P6x4pOzu4bAL6WnU4qN2SVJIZb_86631kmJ6rZyIQ 32/32
deposits. J Volcanol Geotherm Res 8:315–336. doi: 10.1016/0377-
0273(80)90111-0