density currents in the chicago river, illinois · density currents in the chicago river, illinois...
TRANSCRIPT

1 INTRODUCTION
The City of Chicago, Illinois (IL) and many of its suburbs lie within the glacial Lake Chicago Plain. The Lake Chicago Plain encompasses the Chicago, Des Plaines, and Calumet Rivers. Early explorers discovered and used the Chicago Portage, an area within Mud Lake that was only 4.6 meters (m) above the level of Lake Michigan and near the wa-tershed divide between the Mississippi River and the Great Lakes basins. Because of the low relief, the area was poorly drained. The level of Lake Michi-gan in the late 1800s was only 0.61 m below the river banks, making subsurface drainage ineffective (Juhl, 2005). Flow from the North Branch Chicago River (NB) and the South Branch Chicago River (SB) joined just north of present-day Lake Street (Fig. 1) and flowed eastward into Lake Michigan. Sewage dis-charged into the Chicago River caused serious health hazards during the late 1800s as this sewage affected the drinking water supply from Lake Michigan. In 1900, a canal dug by the Sanitary Dis-trict of Chicago linking the Chicago River to the Des Plaines River (Mississippi River basin) was com-pleted and reversed the flow in the Chicago River. This canal, the Chicago Sanitary and Ship Canal (CSSC) is 45 kilometers (km) from the SB to Lock-
port, IL. The CSSC carries waste waters away from the city and Lake Michigan
Figure 1. The Chicago River and the North and South Branches of the Chicago River at Chicago, IL.
Today (2005), the Chicago River (CR) flows west from Lake Michigan, through downtown Chi-cago, and joins flow coming from the NB where it enters the SB/CSSC. Flow in the CR is controlled by the Lockport Powerhouse and Controlling Works (near Joliet, IL) and by the Chicago River Control-ling Works (CRCW) and the Chicago Lock. During summer, water from Lake Michigan flows into the CR through sluice gates in the CRCW and, because of lockages, through the Chicago Lock at CRCW.
Density currents in the Chicago River, Illinois
Carlos M. García & Claudia Manríquez Graduate Research Assistants, Ven Te Chow Hydrosystems Laboratory, Dept. of Civil Engineering, University of Illinois at Urbana-Champaign
Kevin Oberg U.S. Geological Survey, Office of Surface Water, Urbana, IL
Marcelo H. García Chester and Helen Siess Professor, Ven Te Chow Hydrosystems Laboratory, Dept. of Civil Engineering, University of Illinois at Urbana-Champaign
ABSTRACT: Bi-directional flow observed in the main branch of the Chicago River is due, in most cases, to density currents generated by density differences between the water in the North Branch Chicago River and the Chicago River. An upward-looking 600-KHz acoustic Doppler current profiler was installed by the U.S. Geological Survey (USGS) in the center line of the Chicago River at Columbus Drive at Chicago, IL, to char-acterize these flow conditions. Bi-directional flow was observed eight times in January 2004 at Columbus Drive. Three bi-directional flow events, with temperature stratification of approximately 4°C, were also ob-served on the North Branch Chicago River. Analysis of these data indicates that the plunging point of the density current moves upstream or downstream on the North Branch Chicago River, depending on the density difference. Complementary water-quality and meterologic data from January 2004 help confirm the mecha-nism causing the formation of the density currents.
Flow of water from Lake Michigan into the CR dur-ing the summer months, called discretionary diver-sion; is used to preserve or improve the water qual-ity in the CR and CSSC. During winter, flow from Lake Michigan into the CR is small and typically re-sults from leakage through the gates and sea walls at CRCW and some lockages. Other contributions to the CR discharge include water from direct precipi-tation and discharges of water used for cooling pur-poses from neighboring buildings. The NB carries runoff from the watershed up-stream and treated municipal sewage effluent released by a water-treatment plant located 16 km upstream from the confluence of the branches. Most or all of this ef-fluent is transported down the SB into the CSSC and then to the Des Plaines and Illinois Rivers.
Discharge measurements made by the U.S. Geo-logical Survey (USGS) beginning in 1998, indicated bi-directional flow in the CR. Although the duration of this bi-directional flow was not known, it indi-cated the possibility that water from the NB might be flowing into the CR and perhaps even into Lake Michigan. The possibility of flow from the NB en-tering the CR meant that water quality in the CR, and hence Lake Michigan, might be impaired.
The Metropolitan Water Reclamation District of Greater Chicago (MWRDGC) manages the flow and quality of the CR. Because of the possible effects that bi-directional flow may have on water quality, the MWRDGC contacted researchers at the Ven Te Chow Hydrosystems Laboratory (VTCHL) at the University of Illinois at Urbana-Champaign to in-vestigate the possible causes of these flows. The staff of the VTCHL suggested that the bi-directional flows could indicate the presence of density currents in the CR. It was hypothesized that these density currents developed because of differences in density between waters from the NB and CR. Density dif-ferences might be caused by temperature differ-ences, or by the presence of salt or sediment in sus-pension or some combination thereof. Density currents are well known for having the capacity to transport contaminants, dissolved substances, and suspended particles for long distances (Garcia, 1994).
The hypothesis of density currents in the CR was supported initially by the results from a three-dimensional hydrodynamic simulation conducted by Bombardelli and Garcia (2001). Field information is presented herein to support this hypothesis through the analysis of a unique set of water-velocity meas-urements (vertical profiles of three dimensional wa-ter-velocity components) collected continuously by the USGS near Columbus Drive on the CR (Fig. 1) during January 2004. In addition, hydrological, wa-ter-quality, and meteorological data collected by the USGS and MWRDGC are used as complementary information to both characterize the flow conditions
at the NB and to evaluate the boundary conditions in the CR.
In this paper, we first present a description of the available data. This presentation is followed by an analysis for the flow conditions observed during the entire month of January 2004. Density current events are identified based on the water-velocity re-cords, and the main characteristics of each identified event are described (for example, duration, flow conditions in the NB, and aver-age air temperature). Finally, one of the observed density current events in January 2004 is analyzed in detail, and includes an estimation of the force driving the underflow and the description of the time evolution of both the ver-tical velocity profiles and the bed shear stress. Causes for the observed flows are established based on analysis of the boundary conditions.
2 DATA DESCRIPTION
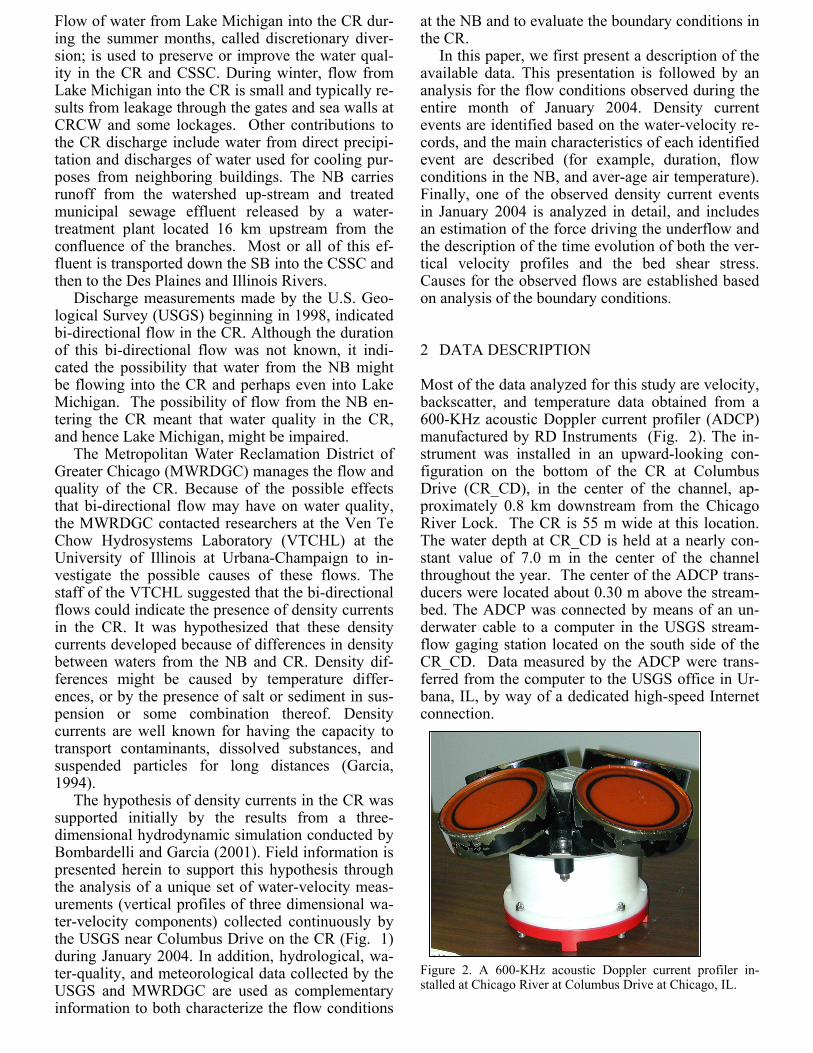
Most of the data analyzed for this study are velocity, backscatter, and temperature data obtained from a 600-KHz acoustic Doppler current profiler (ADCP) manufactured by RD Instruments (Fig. 2). The in-strument was installed in an upward-looking con-figuration on the bottom of the CR at Columbus Drive (CR_CD), in the center of the channel, ap-proximately 0.8 km downstream from the Chicago River Lock. The CR is 55 m wide at this location. The water depth at CR_CD is held at a nearly con-stant value of 7.0 m in the center of the channel throughout the year. The center of the ADCP trans-ducers were located about 0.30 m above the stream-bed. The ADCP was connected by means of an un-derwater cable to a computer in the USGS stream-flow gaging station located on the south side of the CR_CD. Data measured by the ADCP were trans-ferred from the computer to the USGS office in Ur-bana, IL, by way of a dedicated high-speed Internet connection.
Figure 2. A 600-KHz acoustic Doppler current profiler in-stalled at Chicago River at Columbus Drive at Chicago, IL.

The ADCP provided continuous three-dimensional velocity profiles at a sampling fre-quency of 0.2 Hz (a complete water-velocity profile is recorded every 5 seconds (s)). The 600-KHz ADCP was configured to collect velocity profiles using a pulse-coherent technique known as mode 5 in RD Instruments profilers. Depth-cell size for the velocity measurements was 0.1 m and the blanking distance was set to 0.25 m. With this depth-cell size and blanking distance, the deepest velocity meas-urement was made in a depth cell centered approxi-mately 0.65 m above the stream-bed. Therefore, no velocity data were available for analysis in the first 0.65 m above the stream-bed. Velocity measure-ments were also not possible near to the water sur-face because of side-lobe interference (Simpson, 2001) and decorrelation near the surface. This un-measured region extended 1.3 m below the free sur-face for most of the profiles analyzed. For the nor-mal water depth of approximately 7.0 m, valid water-velocity measurements in each profile were obtained for nearly 72 percent of the total depth.
A temperature sensor mounted near the ADCP transducers (0.3 m above the streambed) measured the temperature of the water close to the transducer at the same sampling frequency as the velocity data (0.2 Hz). These temperatures measurements are pri-marily used by the ADCP to compute the speed of sound at the transducer face. The measurements from this sensor are also used herein to characterize the water temperature of the underflow caused by the density current. The technical specifications pro-vided by the manufacturer state that the temperature sensor operates in a temperature range from -5° Cel-sius (C) to 45°C, with a precision of 0.4°C and a resolution of 0.01°C (RD Instruments, 2001). In ad-dition to water velocity and temperature, the ADCP also can be used to measure backscatter. Sound emitted from the ADCP is scattered by suspended sediments and other material in the water. The ADCP measures the intensity of echoes returned to the instrument, called received signal strength indi-cator (RSSI), using an arbitrary scale of 0 to 255. RSSI profiles for each beam may be converted to backscatter, as measured in decibels, by accounting for propagation losses and other characteristics of the ADCP. Backscatter can be used as a surrogate of the vertical distribution of the suspended sedi-ment in the flow (Gartner, 2004).
Complementary hydrological and meteorological data are analyzed herein to characterize the flow conditions at the NB and to evaluate the boundary conditions presented in the CR system during a den-sity current event. The discharge and water tempera-ture at the NB are measured by the USGS at a streamgaging station located on right upstream side of Grand Avenue bridge in Chicago (Lat 41°53'30", Long 87°38'30"), about 1,000 m upstream from the confluence with the main stem of the CR. The
streamflow gaging station, NB at Grand Avenue at Chicago, IL (NB_GA), has a SonTek/YSI Argonaut-SL (Side-Looking) current meter that is located at about half of the depth (1.55 m above the streambed) on the right bank. This side-looking sensor is used to quantify the discharge by the index-velocity method. In addition, a string of six water-temperature sensors are used to measure water temperatures at various elevations along the right bank at Grand Avenue. The water-temperature probes are located at 0.6-m increments in the vertical with sensor 6 (T6) being the lowest in the water column (located at 0.15 m above the streambed at the wall) and sensor 1 (T1) being the highest. Water-temperature time series for each sensor are available at a sampling frequency of 5 minutes.
Daily effluent discharges to the NB from North Side Water Reclamation treatment Plant (NS WRP) are used here to validate the USGS discharge data collected at NB_GA. The plant is located 16 km up-stream from the NB_GA streamflow gaging station. A preliminary study (Manriquez, 2005) showed that more than 75 percent of the observed discharge measured at NB_GA is from the NS WRP effluent discharge. The plant has a design capacity of 1,260 million liters per day or a maximum daily discharge equal to 14.6 cubic meters per second (m3/s) (Man-riquez, 2005).
Wind speed and direction used in the analysis were recorded at the Chicago meteorological station that is operated as part of the real–time meteorologi-cal observation network operated by the Great Lakes Environmental Research Laboratory (GLERL). This station is located approximately 5 km offshore from the City of Chicago. The anemometer is located at 25.9 m above station elevation. Meteorological measurements are made every 5 seconds at the sta-tion and then averaged together and recorded every 5 minutes. Meteorological data recorded by the Chi-cago O’Hare International Airport meteorological station (ORD), located 24 km from the measurement site, are used to evaluate spatial variability in the aforementioned properties. The ORD data, which include wind speed and direction, air temperature, snow depth, are available in 3-hour intervals.
Results of preliminary studies (Bombardelli and Garcia, 2001, Manriquez, 2005) indicated that den-sity current events in the CR are more likely to oc-cur during the winter season. For that reason, the analysis reported herein focuses on flow conditions observed in January 2004.
3 DATA ANALYSIS
3.1 Analysis for January 2004 Water-velocity profiles recorded every 5 seconds during January 2004 at CR_CD were analyzed to identify density current events. Based on the pres-

-0.05 -0.025 0 0.025 0.05
0
3
6
9
12
1/1/04 1/6/04 1/11/04 1/16/04 1/21/04 1/26/04 1/31/04
Wat
er te
mpe
ratu
re [°
C]
T1 T6
ence of bi-directional flow, a total of eight density currents events were identified in January 2004. Characteristics of these events are shown in table 1 and include: starting time (in military time); duration of the bi-directional flow conditions at CR_CD; wa-ter temperature before the density current event oc-curred at both the sensor nearest to the streambed at NB_GA and at the ADCP transducer at CR_CD; the mean daily discharge at NB_GA; and the mean air temperature during the event. The ADCP water-velocity data were not available during some periods during event 8; however, water-temperature data in-dicate that the bi-directional flow persisted for more than 9 days, ending on February 2, 2005, at 11:38. Table 1. Characteristics of the density current events at the Chicago River at Columbus Drive at Chicago, IL. __________________________________________________
Mean daily Mean
discharge air Start Dur. Water Temp [°C] [m3/s] temp
No. Time [hs] NB_GA CR_CD NB_GA [°C] __________________________________________________ 1 1/1 01:50 21.1 8.5 5 9.74 3.3 2 1/2 15:19 5.0 9.3 7 9.51 14.3 3 1/4 03:41 24.0 10.1 5 9.23 -1.2 4 1/7 13:37 64.7 6.0** 2 8.88*** -5.1 5 1/13 12:18 21.8 7.9 4 10.52 -1.8 6 1/15 11:23 56.6 6.9 3 9.84 -2.8 7 1/19 12:45 55.4 6.1** 2 8.97*** -7.5 8 1/23 23:21 228.3* 4.6** 3 8.81*** -10.8 __________________________________________________ * Estimated. 192.6 hours of the total duration included in Janu-ary 2004 ** Stratified conditions in NB during the event at CR_CD. *** Discharge estimated using discharge from NS WRP plant.
A contour plot of velocity in the east-west direc-tion from profiles recorded by the ADCP during 5 days (starting January 5, 2004, at 00:09 and ending on January 5, 2004, at 23:58) is shown in Figure 3. A bi-directional flow is detected in this plot starting January 7, 2004, at 13:37 (ensemble 3524002). Dur-ing this event, the lowest part of the flow is moving east (to the lake) whereas the upper part is moving west (to the confluence). The bi-directional flow conditions persisted at CR_CD for more than 64 hours.
Figure 3. Time series of east velocity [m/s] profiles measured at Chicago River at Columbus Drive at Chicago, IL, starting January 5, 2004, at 00:09 (ensemble 3479744). Dark lines de-fine different stages in the density current event starting Janu-ary 7, 2004, at 13:37.
Figure 4. Near-surface (T1) and near-streambed (T6) time se-ries of water temperature recorded at North Branch Chi-cago River at Grand Ave, Chicago, IL.
The time series of water temperatures recorded
for the near-bed (T6) and the near-surface (T1) tem-perature sensors at the NB_GA streamgaging station are shown in Figure 4. Three temperature stratifica-tion events were observed at NB_GA in January 2004, occurring simultaneously with the density cur-rent events 4, 7, and 8. The maximum observed dif-ferences in water temperature between the deep and the shallow sensors at NB_GA were 3.8°C, 3.7°C, and 3.0°C for density current events 4, 7, and 8, re-spectively. For each event, the upper part of the wa-ter column was coldest. Meteorological data also indicate that the 3 days with the lowest mean daily air temperature for January 2004 occurred at the be-ginning of each of these three events.
During the periods when thermal stratification was observed at NB_GA, it appears that there were also bi-directional flows at this location as well. The index velocities measured at this site by the Ar-gonaut SL confirm this flow condition. Negative ve-locities (in other words water was flowing upstream at the elevation measured by the Argonaut SL) were measured during the periods with thermal stratifica-tion conditions at NB_GA (Fig. 5). Negative veloci-ties were measured in the upper layer of a bi-directional flow.
-12
-8
-4
0
4
8
12
1/1/04 1/6/04 1/11/04 1/16/04 1/21/04 1/26/04 1/31/04
Velo
city
[cm
/s]
0
2
4
6
8
10
12
Diff
. tem
pera
ture
(T6-
T1) [
°C]

0
1
2
3
4
5
6
-10 -5 0 5 10 15
Dis
tanc
e ab
ove
the
bed
[m]
Figure 5. Index velocities and the difference between near-bed (T6) and near-surface (T1) water temperatures meas-ured at the North Branch Chicago River at Grand Avenue at Chicago, IL.
If the discharges at NB_GA are computed using only the existing index-velocity rating developed by the USGS, negative net discharge will be computed for these time periods. This result, however, does not agree with the records of the effluent discharge from the NS WRP located 16 km above this section. For these events, the discharges computed using the measured index velocities are not valid and the val-ues for discharge at NB_GA reported in table 1 cor-respond to the daily mean effluent discharge at NS WRP.
The time series of wind-velocity data from the GLERL station were analyzed, and no relation was found between the occurrence of the bi-directional flow at either CR_CD or NB_GA and the presence of wind blowing in the upstream or downstream di-rection in each branch. Some wind effects, however, were observed on the shape of the vertical profiles of water velocity recorded at CD_CR during a den-sity current event. These effects are discussed later in this paper, for the density current event starting on January 7, 2004.
3.2 Analysis of density current event starting January 7, 2004
Density current event 4 (see table 1 for details) start-ing on January 7, 2004, at 13:37 is described in de-tail in this section. As previously mentioned, strati-fied conditions were present at NB_GA during this event. At the time when the event was observed, ex-tremely low air temperatures were observed in Chi-cago (< -5°C) (see table 1). The time series of water temperature recorded by five different sensors (T6 is nearest to the streambed and T1 is nearest to the wa-ter surface) located at NB_GA, along the ADCP wa-ter-temperature sensor (T0) located at CR_CD are shown in Figure 6.
Figure 6. Water temperature measured at North Branch Chi-cago River at Grand Avenue (NB_GA) and the Chicago River at Columbus Drive (CR_CD), Chicago, IL. For NB_GA, sen-sor T6 is located nearest to the streambed and T1 is located nearest to the water surface for the six-temperature string.
The average air temperature recorded at ORD meteorological station during this event was -5.1°C and the minimum was -9.4°C. As the bi-directional flow starts (January 7, 2004, at 13:37), the water temperature recorded by the ADCP at the centerline at CR_CD increases from 2.4°C to 6.2°C, approxi-mately the same as the water temperature observed by the water-temperature sensor located nearest to the streambed at NB_GA at the same time. This re-sult seems to indicate that underflow water coming from NB is present as an underflow at CR_CD
Stages in the development of the density current within the event were delimited based on periods with homogenous vertical velocity-profile patterns for velocities in the east direction (see Fig. 3). Stage 1 is completely unsteady and includes the time dur-ing which the velocity profile changes from a well-mixed condition to a developed density current pro-file (stage 2). For stage 2, the scatter of the instanta-neous velocity profile recorded by the ADCP when compared with the mean computed profile in the stage is shown in Figure 7. The mean velocity pro-files observed in each stage are shown in Figure 8. Stage 6 also presented a highly unsteady behavior; the mean profile for this stage, included in Figure 8 and characterized in table 2, represents the flow conditions observed on January 9, 2004, between 16:18 and 19:05. Figure 7. Instantaneous and mean velocity profiles in the east-erly direction measured at the Chicago River at Columbus Drive,Chicago, IL, during stage 2 of the January 7, 2004, event.
0
2
4
6
8
1/7/200412:00:00
1/8/20040:00:00
1/8/200412:00:00
1/9/20040:00:00
1/9/200412:00:00
1/10/20040:00:00
Wat
er te
mpe
ratu
re [°
C]
CR_CD T0 NB_GA T1 NB_GA T2 NB_GA T3 NB_GA T5 NB_GA T6
0
1
2
3
4
5
6
7
-10 -5 0 5 10 15East Velocity [cm/s]
Dis
tanc
e ab
ove
the
bed
[m]

Figure 8. Mean velocity profiles in the easterly direction meas-ured at the Chicago River at Columbus Drive, Chicago, IL, during different stages of the density current event number 4.
The main flow characteristics observed at CR_CD for each stage of the density current event starting January 7, 2004 at 13:37 are included in ta-ble 2. The flow characteristics included in this table are: starting time (in military time) of each stage, duration, discharge per unit width in the underflow qu, depth of the underflow H, the layer-averaged ve-locity in the underflow U, an estimate of the relative difference in density driving the flow R = (ρu-ρ0)/ρ0 (ρ0 is the ambient water density) and the shear ve-locity, us. Average values for stage 1 and 6 are not included in table 2 because of the strong unsteadi-ness observed in those stages.
Table 2. Flow characteristics for each stage of the density cur-rent event observed at Chicago River at Columbus Drive at Chicago, IL, starting January 7, 2004. __________________________________________________ Stage Start Dur. qu H U R us No. Time [hs] [m2/s] [m] [m/s] % [m/s] _________________________________________________ 1 1/7 13:37 4.17 -- -- -- -- -- 2 1/7 17:47 11.8 0.13 2.0 0.09 0.044 0.022 3 1/8 05:35 7.00 0.14 2.5 0.08 0.023 0.023 4 1/8 12:35 8.97 0.14 3.9 0.06 0.008 0.034 5 1/8 21:33 4.87 0.12 3.3* 0.04 -- -- 6 1/9 02:25 27.9 -- -- -- -- --_________________________________________________ * H is computed for this stage as the portion of the flow depth with positive east velocities.
The layer-averaged velocity, U, is defined from
the observed east velocity (Veast) profiles via a set of moments (Garcia, 1994) through the ratio of the integrals indicated in equations (1) and (2) below as-suming that β =1.
(1) (2) The parameter R is computed using the observed
average profile for each stage based in the following relation:
(3) The shear velocity us is computed for each stage
based on the assumption that the lower portion of the underflow velocity profile presented a logarith-mic shape. The number of point pairs (velocity, dis-tance above the streambed) used in the log-law fit-
ting were 3, 8, and 12 for stages 2, 3, and 4, respectively.
Wind data at GLERL station were analyzed to evaluate the boundary conditions during the differ-ent stages in event 4. Time series of the average wind speed and the wind direction (0°=from north, 90°=from east) recorded during the analyzed density current event are shown in Figure 9. At stage 1 and 2, the wind blew from west to east at speeds ranging between 5 and 10 meters per second (m/s). The wind changed direction with very slow speed in stage 3 and then blew from east to west most of the time in stages 4, 5, and 6 (average wind speed around 10 m/s). Wind data of ORD meteorological station also were analyzed and included in Figure 9 to represent the spatial variability of the data and to validate the assumption that the wind conditions at CD_CR are acceptably well represented by GLERL data (re-corded around 5 km away from the measurement site). The same pattern is observed in Figure 9 for the time evolution of the wind data for both loca-tions. Figure 9. Time series of average wind speed and direction re-corded at GLREL and ORD meteorological station.
Underflow velocity profiles recorded during
stages 2 to 5 of the analyzed density current event were made dimensionless and plotted in Figure 10 based on the parameters commonly used in turbulent wall jet studies. This approach has been used in other density current studies (Kneller and Buckee, 2000, Gray and others, 2005). East velocities (Veast) were made dimensionless by dividing them by the maximum observed value (Veastmax) whereas the distance above the stream-bed (Y) was divided by the distance above the streambed corresponding to the point where the underflow velocity value is equal to half of the maximum observed value (Y1/2).
∫ ⋅=H
dyVeastUH0
( )∫ ⋅=⋅H
dyVeastHU0
22β
gHUR u
2
0
0 =−
=∆
=ρρρ
ρρ
0
5
10
15
20
1/7/0412:00
1/8/040:00
1/8/0412:00
1/9/040:00
1/9/0412:00
1/10/040:00
Aver
age
win
d sp
eed
[m/s
]
0
90
180
270
360
Win
d di
r. [0
°=N
orth
, 90°
=Eas
t]
Wind speed. GLERL Wind speed. ORDWind direction. GLERL Wind direction. ORD
Stage 1 Stage 2 Stage 3Stage 4Stage 5 Stage 6

0
1
2
3
4
5
6
50 55 60 65 70 75 80East Velocity [cm/s]
Dis
tanc
e ab
ove
the
bed
[m]
Stage 2 Stage 3 Stage 4 Stage 5
0.0
0.2
0.4
0.6
0.8
1.0
1.2
1.4
1.6
0.0 0.2 0.4 0.6 0.8 1.0Veast / Veast max
Y /
Y 1/2
Stage 2 Stage 3 Stage 4 Stage 5 Figure 10. Dimensionless water-velocity profiles recorded at Chicago River at Columbus Drive at Chicago, IL, dur-ing dif-ferent stages of event number 4.
For stages 2 to 5, the dimensionless profiles all had approximately the same shape. This result indi-cates the density current is the process driving the underflow for stages 2 to 5. For example, a wind-driven flow would result in different dimensionless profiles than those obtained from these data.
The average acoustic backscatter levels observed for the four ADCP beams in each stage are plotted in Figure 11. These profiles can be used as a surrogate of the vertical distribution of the suspended sedi-ment in the flow (Gartner, 2004). During the density current event, the profiles indicate that the greatest acoustic backscatter occurs in the underflow, which in turn indicates that the highest levels of suspended sediment are in this region (0 to 2.5 m above the streambed for stage 2). Inconsistency, however, is observed in some of the deepest bins for stages 2 and 3 that could be generated by the technique used to compute backscatter for observations in the near field.
Figure 11. Vertical profiles of acoustic backscatter reported by ADCP at Chicago River at Columbus Drive at Chicago, IL, for different stages of the density current event, number 4. The values included in the plots are averaged values reported for the four ADCP beams.
The presence of suspended sediment in the under-
flow during the density current event agrees with an increase in the suspended sediment in the NB ac-cording to daily water-quality measurements of the treated effluent from the NS WRP plant at the NB
(Catherine O’Conner, MWRDGC, written comm., 2005). The SS values [in milligrams per liter (mg/L)] for the first 2 weeks of January 2004 are shown in Figure 12. The water-quality data indicate elevated suspended-solids concentration (SS) values (above background levels) during the period from January 5, 2004, and January 10, 2004.
0
5
10
15
20
25
1/1/04 1/3/04 1/5/04 1/7/04 1/9/04 1/11/04 1/13/04 1/15/04
Susp
ende
d S
olid
s, in
mg/
L
Figure 12. Time series of suspended-solid concentrations in ef-fluent of the North Side Water Reclamation Plant on the North Branch Chicago River, Chicago, IL. (data provided by MWRDGC)
Finally, the time series of east water-velocity val-ues recorded by the ADCP at different depths were analyzed to describe the different random process (for example, turbulence, internal waves, driven-force pulsing, and others) presented in the flow at the time that each signal was recorded. The time se-ries of east water velocity recorded by the ADCP at the deepest bin (0.64 m from the streambed) at CR_CD during stage 2 of event 4 (starting January 7, 2004) is shown in Figure 13. A steady signal is observed for this stage with an average east velocity value of 9.4 centimeters per second (cm/s).
0
4
8
12
16
20
1/7/200418:00:00
1/7/200421:00:00
1/8/20040:00:00
1/8/20043:00:00
East
vel
ocity
[cm
/s]
Figure 13. Time series of east water velocity recorded at Chi-cago River at Columbus Drive at Chicago, IL, at bin 1 (0.64 m above the streambed).
Garcia and others (2005) presented some tools to evaluate the capabilities of acoustic sensors to sam-ple the flow turbulence under different flow condi-tions. One of these tools, a dimensionless power spectrum, is used here. A minimum dimensionless

sampling frequency F = f L / Uc =1 is required to get a minimum description of the flow turbulence (Garcia and others, 2005, Fig. 7). The parameters f, L, and Uc represent the instrument sampling fre-quency, the length scale of the energy containing eddies in the flow, and the flow-convective velocity, respectively. For stage 2 of event 4, a value of F = 4 (higher than the minimum required value) is com-puted by using f = 0.2 Hz and assuming L is of the order of H = 2 m and Uc is of the order of the ob-served east velocity, or 0.1 m/s. Higher values of F (larger H and slower velocities) were obtained for other stages of the analyzed event.
A value of F higher than the minimum required indicates that some turbulence characterization would be possible from the recorded signal. The di-mensionless plot, however, presented by Garcia and others (2005) is based on the assumption that the signal noise is much smaller than the turbulence en-ergy for all the analyzed frequencies. High values of Doppler noise, which are included in the recorded signal, reduce the value of maximum useful fre-quency (Garcia and others, 2005). The power spec-trum computed from the velocity signal plotted in Figure 13 is shown in Figure 14. The Doppler noise energy level is detected as a flat plateau (white noise characteristics) at frequencies higher than fn = 0.01 Hz. A value of F = 0.2 < 1 is obtained using the value of 2 fn instead of f in the computation of di-mensionless frequency. This result indicates that no description of the turbulence can be made because the turbulence process occurs at smaller time scales where energy is dominated by the Doppler noise.
0.1
1
10
100
1000
10000
0.0001 0.001 0.01 0.1frequency [Hz]
E11
[cm
2 /s]
Figure 14: Power spectrum in the frequency domain of the time series of east water velocity recorded at Chicago River at Columbus Drive at Chicago, IL, represented in figure 13.
Although no description of the flow turbulence can be performed on the basis of the water-velocity signal recorded by the ADCP, other periodic random components in the flow with frequency smaller than 0.01Hz (length scales longer than the turbulence structures) can be described using the recorded se-ries.
The random periodic processes presented at CR_CD during stage 2 of event 4 can be detected
based on the computed autocorrelation functions plotted in Figure 15 for the recorded east velocity signals at six different distances above the stream-bed. Two main random periodic processes can be detected for all the flow depths with periods around 180 and 4,800 s. In addition, the signal recorded close to the density current interface at stage 2 (2.54 m and 3.54 m from the bottom) present a new ran-dom periodic component with a period of the order of 1,200 s.
Figure 15: Autocorrelation function of the east velocity time series recorded Chicago River at Columbus Drive at Chicago, IL, at different distance above the streambed for stage 2 of event 4.
The vertical profile of standard deviation of the
time series of east velocity signal for stage 2 of event 4 (January 7, 2004), is shown in Figure 16. A vertical profile of standard deviation generated only by the turbulence process during a density current event should show the highest values of turbulent energy near the bottom and in the interface between the under and overflow. A uniform vertical profile, however, is observed because no turbulence descrip-tion is achieved by the instrument and because al-most the same random periodic components were observed throughout the flow depth.
0
1
2
3
4
5
6
0 0.5 1 1.5 2Standard deviation [cm/s]
Dis
tanc
e ab
ove
the
bed
[m]
Figure 16. Vertical profile of standard deviation of the time se-ries of east velocity signal recorded at Chicago River at Co-lumbus Drive at Chicago, IL, for stage 2 of event 4 (January 7, 2004).
-0.4
-0.2
0
0.2
0.4
0.6
0.8
1
1 10 100 1000 10000 100000Time [sec]
Rxx
0.64m 1.54m 2.54m 3.54m 4.54m 5.54m

4 DISCUSSION
A total of eight density currents events were de-tected at CR_CD based on ADCP velocity-profile measurements. Bi-directional flow conditions were observed for a total of 441 hours in January 2004 (59 percent of the time). These conditions indicate that density current events occur frequently at CR during winter periods. Events, as short as 5 hours and as long as 9 days, were observed in the period with a wide variability in the main characteristics of each event (see table 1). The water temperature re-corded near the streambed at the centerline of the CR_CD cross section increased at the time when the density current event started from the ambient fluid temperature at CR_CD to the temperature recorded by the sensor nearest to the streambed at NB_GA at the same time. This result indicates that the under-flow coming from NB is also detected as an under-flow at CD_CR.
Three bi-directional flow events with temperature stratification conditions were also observed at NB_GA (see figs. 4 and 5). Each time that a bi-directional flow event was observed at NB_GA, a density current event was also observed at CR_CD. Flow conditions observed at NB and CR during event 4 are illustrated in Figure 17.
Figure 17. Schematic view of flow conditions observed during event 4 at junction of the Chicago River, North Branch Chi-cago River, and the South Branch Chicago River, Chicago, IL.
Other density currents events were observed at
CR_CD when no temperature stratification was ob-served at NB_GA. For such events, this result may be explained if the plunging point for the density current occurred downstream of NB_GA.
The location of the plunging point depends on the characteristic of each density current event (relative difference in density) and the NB flow discharge. Manriquez (2005) analyzed this behavior through laboratory experiments performed on a distorted physical model (horizontal scale 1:250; vertical scale 1:20) of the CR system. Manriquez (2005) found that for the same discharge at NB, increasing the density of the underflow caused the plunging point to migrate upstream in the NB, sometimes up-stream of NB_GA. Therefore, for the weakest den-sity current event, bi-directional flow would not likely be observed at NB_GA. The presence of the
bi-directional flow at NB_GA would require changes to the methodology for computing dis-charge at this station.
The driving force for the observed density cur-rents events could be caused by different factors, in-cluding temperature differences, salinity differences, and differences in suspended-sediment concentra-tion. Water temperatures at NB_GA are always higher than at CR_CD in the winter period accord-ing to historical data for both branches (James J. Duncker, USGS, written comm., 2005; see table 1). Flow in the NB at NB_GA consists mostly of efflu-ent discharge from the NS WRP plant. The average daily temperature of the effluent during January 2004 was 11.8°C with a standard deviation of 1.1°C. The only time that warmer water results in denser water (without the presence of high suspended-sediment concentrations or salinity) is when the temperature ranges between 0° C and 4° C (see Fig. 18). The maximum possible relative difference in density R (assuming temperatures of 4°C and 0°C for the NB and CR, respectively), however, is 0.012 percent smaller than the values of R estimated for some of the events. This result indicates that other factors are causing the difference in density. Figure 18. Water density as a function of the water temperature (suspended-solid concentration or salinity effects are not in-cluded in this analysis)
An increase in suspended-solid concentration of
the effluent of the NS WRP similar to the increase observed for the density current event 4 started at January 7, 2004, (see Fig. 12) was observed for events 7 and 8 (see table 1). This increase was also detected in the acoustic backscatter profiles (see Fig. 11 for profiles of event 4).
Salinity in the effluent discharged to the river could increase as a result of salt applications to roads and subsequent inflow from streets or other areas to the treatment plant. Based on data from the ORD meteorological station, 0.1 m of snow depth was observed on January 5, 2004 and the snow stayed on the ground (decreasing in depth) until January 14, 2004. It seems likely that, because of this snowfall, salt was applied to the roadways. Wa-ter-quality data for the NS WRP indicate elevated
CR
NB SB
underflow underflow
SL Argonaut
NB_GA
Plunging point
entrainment
999
999.2
999.4
999.6
999.8
1000
0 4 8 12 16Temperature [°C]
Den
sity
[kg/
m3 ]

chloride concentrations (above normal levels) for at least two of the eight observed density currents events in January 2004 (events 4 and 8).
Event 4 is one of the strongest density current events observed during January 2004. The maxi-mum underflow velocity recorded at CR_CD during this event was 0.12 m/s. The shape of the bi-directional, vertical velocity profile changes during the event. Six stages were defined during the event in order to define periods with quasi-steady behavior that were longer than 4.8 hours.
Different processes were investigated as a possi-ble cause of the unsteady behavior in the vertical profiles of event 4 (for example, changes in time se-ries of difference in density, wind effects, and back-water effects from locks). A quasi-uniform under-flow discharge per unit width observed in stages 2 to 5 of event 4 (see table 2) would indicate that the un-steady behavior does not result from changes in the difference in density-driven flow. It is possible that the steadiness could result because of backwater ef-fects from the locks, which would result in the depth (thickness) of the underflow being less at the begin-ning and greater towards the end for the entire event. The January 15, 2004, event (number 6) indicated an inverse time evolution (the depth of the under-flow was greater at the beginning and less towards the end). An analysis of event 6, similar to the one per-formed for event 4, showed the same pattern in the relation between the depth of the underflow and the wind speed and direction (see Fig. 9): wind blowing in the downstream or up-stream direction would generate underflows that have a greater or smaller thickness, respectively. Thus, wind speed and direc-tion provided the best explanation to the time evolu-tion of the east velocity profiles.
Underflow velocity profiles recorded during stages 2 to 5 of the analyzed density current event were made dimensionless in Figure 10 using the pa-rameters commonly used in turbulent wall jet studies (Gray and others, 2005, Kneller and Buckee, 2000). Although the average east velocity profiles for the different stages within event 4 had different shapes, a good collapse was obtained when these event pro-files were made dimensionless using the above-mentioned approach.
No turbulence parameters could be estimated based on the measured east velocity time signal be-cause of the noise energy level of the signal; how-ever, main features of the other random periodic processes presented in the flow field could be repre-sented for stage 2 of event 4. Two scales were ob-served for all flow depths. The first scale, of the or-der of 180 s, could be generated by a local effect and the second scale (around 4,800 s or 1.33 hours) could be generated by a large-scale process. Random periods of the order of 1,200 s (20 minutes) were observed in the velocity signals recorded near the in-
terface. These signals could represent the period of the interfacial waves.
5 SUMMARY AND CONCLUSIONS
This paper presents evidence for the occurrence of density current events in the Chicago River system. A unique set of water-velocity profiles recorded at the Chicago River at Columbus Drive provide the primary basis for the analyses presented here.
Analysis of the complementary meteorological and water-quality data collected in January 2004 in-dicate that the presence of bi-directional flow is not restricted only to the main stem of the Chicago River, but also could travel upstream on the North Branch depending on the density difference of the generated underflow. The greater the density differ-ence, the farther upstream on the North Branch the plunging point is observed. This result is an impor-tant consideration for projects designed to minimize the occurrence of the density current events because design alter-natives need to consider all parts of the Chicago River system, including both the North Branch and South Branch.
The data obtained from velocity and temperature measurements indicate that bi-directional flow is a common feature at Chicago River at Columbus Drive (CR_CD) and at North Branch Chicago River at Grand Avenue (NB_GA) during January 2004. The characteristics of the observed events indicate that there is no single cause for the development of density currents. For one event analyzed, the differ-ence in temperature, suspended sediment, and salin-ity contributed to the driving force of the underflow. Analysis of meteorological information measured simultaneously with the water-velocity data indi-cated that vertical profiles of the underflow at CR_CD are strongly affected by wind speed and di-rection. The continuous record of water-velocity data recorded by the ADCP allowed detection of three different random, periodic processes.
On the basis of the analyzed data, the following suggestions are offered for consideration regarding future monitoring and streamflow computation.
o An upward-looking ADCP should be installed in the river at the USGS streamflow gaging station, NB_GA.
o A string of water-temperature sensors should be installed at the USGS streamflow gaging station, CR_CD.
o Consideration should be given to the installa-tion of salinity and other water-quality probes at NB_GA and CR_CD.
o The methods used to compute streamflow at the streamflow gaging station, NB_GA, should be al-tered to account for the presence of bi-directional flows.

The use of trade, product, or firm names in this
paper is for descriptive purposes only and does not imply endorsement by the U.S. Government.
6 ACKNOWLEDGEMENTS
The research summarized in this paper was sup-ported by both the U.S. Geological Survey (Office of Surface Water) and the Metropolitan Water Rec-lamation District of Greater Chicago. Comments from Dr. Jim Best provided valuable insights for the data analysis.
7 REFERENCES
Bombardelli, F. A., and García, M. H. 2001. Simulation of density currents in urban environments. Application to the Chicago River, Illinois. 3rd. Int. Symposium on Environ-mental Hydraulics, Tempe, Arizona, USA.
Garcia, M.H. 1994. Depositional turbidity current laden with poorly sorted sediment. Journal of Hydraulic Engi-neering 120 (11): 1240-1262.
Garcia, C.M., Cantero, M.,Niño, Y.,& Garcia, M.H. 2005. Turbulence Measurements with Acoustic Doppler Ve-locimeters. Approved to be published in the Journal of Hy-draulic Engineering.
Gartner, J.W. 2004. Estimating suspended solids concentration from backscatter intensity measured by acoustic Doppler current profiler in San Francisco Bay, California. Marine Geology 211: 169-187.
Gray, T.E., Alexander, J. & Leeder, M.R. 2005. Quantifying velocity and turbulence structure in depositing sus-tained turbidity currents across breaks in slope. Sedimentology 1-22.
Juhl, A., 2005, A History of Flood Control & Drainage in Northeastern Illinois: accessed June 27, 2005, at
http://dnr.state.il.us/owr/OWR_chicago.htm#owrnortheast Kneller, B. and Buckee, C. 2000. The structure and fluid me-
chanics of turbidity currents: a review of some recent stud-ies and their geological implications. Sedimentology 47: 62-94.
Manriquez, C. 2005."Hydraulic model study of Chicago River density currents". Master's thesis, University of Illi-nois, 2005.
RD Instruments, Inc., 2001, Workhorse installation guide: San Diego, Calif., RD Instruments P/N 957-6152-00 (January 2001), 64 p.
Simpson, M.R., 2001, Discharge measurements using a Broad-Band Acoustic Doppler Current Profiler: U.S. Geo-logical Survey Open-file Report 01-01, 123 p.: accessed June 28, 2005, at http://water.usgs.gov/pubs/of/ofr0101/