pwp-085 trends in electricity consumption ... in electricity consumption, peak demand, and...
TRANSCRIPT

PWP-085
TRENDS IN ELECTRICITY CONSUMPTION, PEAKDEMAND, AND GENERATING CAPACITY IN
CALIFORNIA AND THE WESTERN GRID1977-2000
Jolanka V. Fisher and Timothy P. Duane
September, 2001
This paper is part of the working papers series of the Program on Workable EnergyRegulation (POWER). POWER is a program of the University of California EnergyInstitute, a multicampus research unit of the University of California, located on theBerkeley campus.
University of California Energy Institute2539 Channing Way
Berkeley, California 94720-5180www.ucei.org

TRENDS IN ELECTRICITY CONSUMPTION, PEAKDEMAND, AND GENERATING CAPACITY IN
CALIFORNIA AND THE WESTERN GRID1977-2000
27 July 2001
Jolanka V. Fisher*Timothy P. Duane**
AbstractThis study analyzes state and regional electricity supply and demand trends for the eleven states in theWestern Systems Coordinating Council (WSCC) from 1977 to 2000. New utility capacity additionsdropped off throughout the west beginning around 1989-1990, lowering reserve margins and installedcapacity per consumption ratios. Only two of the eleven western states installed more new utility-ownedcapacity during the second decade of the 1977-1998 period than during the first decade. California’sinstalled utility capacity grew by only 28% from 1977 to 1998, but the state added another 10,000 MW ofnon-utility capacity (resulting in an overall capacity increase of 57%). California therefore added newgenerating capacity relative to increases in its consumption at a higher rate than all but two states (in partbecause California is the lowest user of electricity per capita and per dollar of gross state product in thewest). Annual WSCC consumption increased 64% from 1977 to 1998, but California’s consumptiongrew by only 44% during this period. Summer peak demand increased throughout the WSCC from 1995to 1999 by roughly 13,000 MW, but California accounted for only 5-6% of the total increase during thisperiod. Finally, winter peak demand increased throughout the WSCC from 1995 to 1999 by roughly6,700 MW; California accounted for about 45% of the total increase during this period.
Legal noticeThis report was prepared as an account of work sponsored by the California Public Utilities Commission.It does not necessarily represent the views of the Commission or any of its employees except to theextent, if any, that it has been approved formally by the Commission at a public meeting. For informationregarding any such action, communicate directly with the Commission at 505 Van Ness Avenue, SanFrancisco, California, 94102. Neither the Commission nor the State of California, nor any officer,employee, or any of its contractors or subcontractors makes any warranty, express or implied, or assumesany legal liability whatsoever for the contents of this document.
*Graduate Student Researcher, Energy and Resources Group, University of California, Berkeley,California, 94720-3050, [email protected]
**Associate Professor, Energy and Resources Group, City and Regional Planning, LandscapeArchitecture and Environmental Planning, University of California, Berkeley, California, 94720-2000,[email protected]

1
EXECUTIVE SUMMARY
Much of the debate about the causes of physical and financial problems in California’s electricitysystem has focused on recent events within California, but the state’s electricity system isinterconnected with and depends upon other states in the western grid. Eleven states are closelyinterconnected to California as part of the Western Systems Coordinating Council (WSCC) area:Arizona, California, Colorado, Idaho, Montana, Nevada, New Mexico, Utah, Washington, andWyoming.1 This study therefore examines long-term trends in consumption, peak demand, andgenerating capacity throughout the western grid from 1977 to 2000.2 Changes in any of thoseparameters of supply and demand have a bearing on the situation in the California system.
Several trends stand out as significant when California is examined in this broader context:
• New utility capacity additions dropped off precipitously throughout the west beginningaround 1988-1989, lowering reserve margins and installed capacity per consumption ratios.3See Chart ES-1.
• Only two of the eleven western states (Nevada and Idaho) installed more new utility-ownedcapacity during the second decade of the 1977-1998 period than during the first decade. SeeChart ES-2.
• California’s installed capacity grew by only 28% from 1977 to 1998 if only utility capacity isincluded, but a successful independent electricity program added another 10,000 MW of non-utility capacity in the form of qualifying facilities (QFs), resulting in an overall capacityincrease of 57%.4 See Chart ES-3. Oregon and Washington added just over 1,000 MW ofnon-utility capacity, but the other eight states averaged less than 400 MW of new non-utilitycapacity.5 See Chart ES-4. California therefore added new generating capacity relative toincreases in its consumption at a higher rate than every state except Montana, Utah, andWyoming.
• California is the lowest user of electricity per capita and per dollar of gross state product, butthe size of its population and economy mean that it accounts for about two-fifths of WSCC
1 The WSCC includes not only these eleven states but also some regions of Mexico and Canada, as wellas small pieces of South Dakota, Nebraska, and Texas. (For a complete map, see page 29.) This reportstudies only the consumption and capacity of these eleven states. Only when the official WSCC regionsare referenced do the data refer to the full WSCC.2 The relevant time periods vary by data set. Consumption and capacity data run from 1977 to 1998.Peak annual demand data run from 1982 to 1998. Peak summer demand data run from 1995 to 1999.Peak winter demand data run from 1995/1996 to 1999/2000.3 Utility capacity data include both investor-owned utilities and municipal utility districts.4 Public Utility Regulatory Policies Act (PURPA; see 16 USCS § 824 et seq.). Though not thelegislation’s primary goal, PURPA regulations encouraged the development of independent electricity,particularly from cogeneration and renewable resources (“qualifying facilities” under PURPA).5 These data come from the Department of Energy (DOE), while the California QF capacity data comefrom California Energy Commission (CEC) data sources. The DOE data include all non-utility capacity,which represents a larger universe of categories than the CEC data, which include only QFs.

2
annual consumption and summer peak demand, and about one-third of winter peak demand.See Chart ES-5.
• Annual consumption increased 64% throughout the WSCC from 350,000 GWh in 1977 tonearly 570,000 GWh in 1998, but California’s consumption grew only 44% during thisperiod. Its share of overall WSCC consumption therefore declined from 45% to 40%. SeeCharts ES-6 and ES-7.
• Non-coincidental summer peak demand increased throughout the WSCC from 1995 to 1999by roughly 13,000 MW. California, which uses about 40% of the peak summer demand,accounted for only 5% of the total increase during this period.6
• Non-coincidental winter peak demand increased throughout the WSCC from 1995/1996 to1999/2000 by roughly 6,700 MW. California, which uses about 35% of the peak winterdemand, accounted for 45% of the total increase during this period.
Data limitations sometimes make it difficult to make consistent comparisons across states or sub-regions of the WSCC, and more detailed annual data (e.g., for winter vs. summer peak demandby state) are sometimes only available for limited periods. Moreover, very little data areavailable for 2000 in a consistent form at an appropriate level of disaggregation. The analysis inthis study is nevertheless a useful historical foundation for more detailed examination of the2000-2001 period. More detailed discussion of individual trends is presented below by state andregion.
A. CONSUMPTION
Consumption in all states has risen since 1977. Consumption by the states of the western gridrose from 350,000 GWh in 1977 to nearly 570,000 GWh in 1998, an average annual growth rateof 2.4%. Growth rates fluctuated widely during the first half of the time period and leveled offafter 1988, with all staying below 10% and most hovering near the WSCC mean. In total, theWSCC’s consumption rose by 64%.
During the twenty years between 1977 and 1998, California’s share of total electricityconsumption fell from over 45% to 40%, as its consumption grew from about 160,000 GWh tonearly 230,000 GWh. Arizona overtook Oregon, the state with the smallest percentage increasein consumption, as the third largest consumer of electricity during this period. Nevada had thehighest percentage increase; its consumption more than tripled. The northwest region, Oregon,Washington, Idaho, and Montana, had its share of total consumption drop from 34% to 30%. Incontrast, the southwest region of Arizona, Nevada, and New Mexico had its share rise from 11%to over 17% and the Rocky Mountain region of Colorado, Utah, and Wyoming, saw its share risefrom 9% to nearly 13%.
6 This is only an approximate value. The overall WSCC peak is not necessarily the sum of the individualregional peaks.

3
Officially, the WSCC is divided into four regions: the Northwest Power Pool (NWPP), theRocky Mountain Power Association (RMPA), the California and Mexico region (CA/MX), andthe Arizona, New Mexico, and southern Nevada region (AZ/NM/SNV).7 The last two regions,CA/MX and AZ/NM/SNV, were reorganized in 1997 and Mexico was added. Prior to that date,the California region had instead included California and southern Nevada and the Arizonaregion had included only Arizona and New Mexico. Unfortunately, the data are not uniformthroughout the time period, but the changes do not drastically alter the results. Nevertheless, thedata should be taken only as approximate. In addition, some data are only available as far backas 1995, but go through 1999, so they can only be used as a snapshot of current usage, nothistorical change. Using these geographic breakdowns, the NWPP uses about 37% of the WSCCtotal, the RMPA uses about 6%, AZ/NM/SNV uses about 16%, and CA/MX uses the remaining42% of the WSCC total. These percentages have held steady over the five years for which dataare available.
B. CONSUMPTION PER CAPITA
Consumption per capita varies widely among states in the WSCC and has not convergedconsiderably during the past two decades. Some states have decreased their consumption percapita slightly, as other states have increased their consumption per capita greatly. In general,most states’ per capita consumption varied during the 1980s and then stabilized during the1990s. Some states experienced net increases in the 1980s, peaked at the turn of the decade, andthen began a decline in per capita usage during the 1990s. Overall, the WSCC’s per capitaconsumption rose by 9.4%, from 8.9 to 9.7 MWh/person.
California’s electricity use per capita is now the lowest of any state in the WSCC, though itended the 1970s with only the fourth lowest rate. While California’s consumption per capitadropped slightly during the last two decades, to below 7 MWh/person, California’s currentrelative rank is primarily a result of increases in consumption per capita by other states. NewMexico, Colorado, and Utah began the period with lower per capita consumption, but thosevalues all increased during the time period. Wyoming’s per capita consumption grew by morethan 85%, to over 24 MWh/person.
C. CONSUMPTION PER DOLLAR OF GROSS STATE PRODUCT
All states exhibited a marked decline in consumption per dollar of gross state product (GSP)between 1977 and 1998. The values all converged to within 0.5 kWh/$GSP of each other andhad all fallen below 0.7 kWh/$GSP. In general, per GSP consumption varied widely in the1980s, and then exhibited a generally steady decline over the remaining period.
California began the two decades with per GSP consumption nearly three times less than thehighest per GSP user. The state’s consumption per GSP then dropped by more then 70%, from0.69 to 0.20 kWh/$GSP. More than 80% of the decline came during the first decade. Its 1998per GSP consumption was three times less than that of the largest per GSP consuming state and 7 For a complete map of these regions, see page 30.

4
40% less than the consumption of the next most efficient state. On a regional basis, thenorthwest is the highest per GSP user of electricity, a result of high usage by Montana and Idahomoderated by the usage of Washington and Oregon. In the southwest, the second highestregional user of electricity on a per GSP basis, the high usage is driven equally by all three states.The Rocky Mountain region’s low usage is driven by Colorado and moderated by Wyoming, thestate that experienced the smallest per GSP consumption decline of any state in the WSCC.
D. PEAK DEMAND
For peak demand, data are available for the time period from 1982 to 1998. Since 1982, the peakelectricity consumption of the total WSCC rose by nearly 50,000 MW, from 84,000 MW to over130,000 MW. Regionally, the NWPP continued to have the highest peak electricity demandfrom 1982 through 1998, but the region’s percentage growth was the smallest in the WSCC,rising by 37% to 60,000 MW. The CA/MX region’s peak consumption grew by 55%, to 55,000MW. The greatest increase in peak demand occurred in the AZ/NM/SNV region, which grew by135%, to more than 20,000 MW. The RMPA has a comparatively small peak demand and itspeak grew by less than 50%, to 8,000 MW.
Peak summer demand data are available for the time period from 1995 to 1999.8 Peak winterdemand data are available for the time period from 1995/1996 to 1999/2000. The peak summerdemand for the WSCC increased by 10% from 1995 to 130,000 MW in 1999. The WSCC’speak winter demand rose by 5% from 1995/1996 to 120,000 in 1999/2000. The AZ/NM/SNVregion experienced the greatest peak demand. The region's winter and summer peak demandboth increased by more than 30%. The NWPP winter peak dropped while its summer peakincreased by nearly 10%, to over 48,000 MW and began to approach the CA/MX peak summerusage. The RMPA experienced a summer peak increase of 5%, rising to 7,700 MW. Its winterpeak rose by over 10%, to 7,600 MW. The CA/MX region experienced the smallest peakdemand increases in both summer and winter of any of the regions in the WSCC. Its summerpeak rose 1% to 53,100 MW, accounting for 6% of the combined regional summer peakincrease. The state’s winter peak rose by 7% to 40,000 MW.
E. CAPACITY
Over the last decade, capacity additions dropped off dramatically. While there was considerableutility capacity addition during the 1980s, installations nearly stopped in 1988 when the eleven-state average growth rate dropped from 4.5% to less than 0.5% during the second decade. TheWSCC average growth rate dropped from 3.5% to two-tenths of a percent during this period.Only Arizona, Nevada, and, to a lesser extent, Utah had real growth during the second decade.Overall, the WSCC increased its capacity by 48% to 133,000 MW.9
8 Peak summer demand crested in 1998 and then dropped slightly in 1999. The values reported here referto 1999; when 1998 values are used the trends are unchanged.9 The capacity data included in this report indicate a generator’s nameplate capacity. While nameplatecapacity matches closely the average annual peak capacity of fossil fuel generators, it can be significantly
5
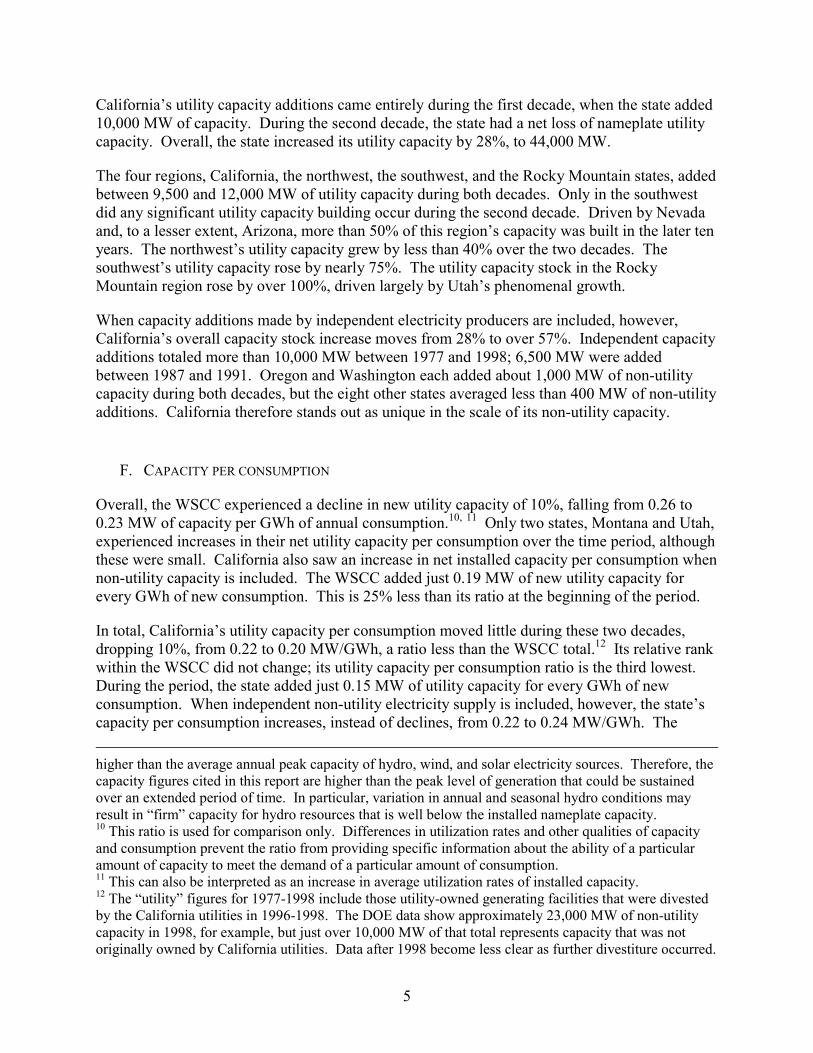
California’s utility capacity additions came entirely during the first decade, when the state added10,000 MW of capacity. During the second decade, the state had a net loss of nameplate utilitycapacity. Overall, the state increased its utility capacity by 28%, to 44,000 MW.
The four regions, California, the northwest, the southwest, and the Rocky Mountain states, addedbetween 9,500 and 12,000 MW of utility capacity during both decades. Only in the southwestdid any significant utility capacity building occur during the second decade. Driven by Nevadaand, to a lesser extent, Arizona, more than 50% of this region’s capacity was built in the later tenyears. The northwest’s utility capacity grew by less than 40% over the two decades. Thesouthwest’s utility capacity rose by nearly 75%. The utility capacity stock in the RockyMountain region rose by over 100%, driven largely by Utah’s phenomenal growth.
When capacity additions made by independent electricity producers are included, however,California’s overall capacity stock increase moves from 28% to over 57%. Independent capacityadditions totaled more than 10,000 MW between 1977 and 1998; 6,500 MW were addedbetween 1987 and 1991. Oregon and Washington each added about 1,000 MW of non-utilitycapacity during both decades, but the eight other states averaged less than 400 MW of non-utilityadditions. California therefore stands out as unique in the scale of its non-utility capacity.
F. CAPACITY PER CONSUMPTION
Overall, the WSCC experienced a decline in new utility capacity of 10%, falling from 0.26 to0.23 MW of capacity per GWh of annual consumption.10, 11 Only two states, Montana and Utah,experienced increases in their net utility capacity per consumption over the time period, althoughthese were small. California also saw an increase in net installed capacity per consumption whennon-utility capacity is included. The WSCC added just 0.19 MW of new utility capacity forevery GWh of new consumption. This is 25% less than its ratio at the beginning of the period.
In total, California’s utility capacity per consumption moved little during these two decades,dropping 10%, from 0.22 to 0.20 MW/GWh, a ratio less than the WSCC total.12 Its relative rankwithin the WSCC did not change; its utility capacity per consumption ratio is the third lowest.During the period, the state added just 0.15 MW of utility capacity for every GWh of newconsumption. When independent non-utility electricity supply is included, however, the state’scapacity per consumption increases, instead of declines, from 0.22 to 0.24 MW/GWh. The higher than the average annual peak capacity of hydro, wind, and solar electricity sources. Therefore, thecapacity figures cited in this report are higher than the peak level of generation that could be sustainedover an extended period of time. In particular, variation in annual and seasonal hydro conditions mayresult in “firm” capacity for hydro resources that is well below the installed nameplate capacity.10 This ratio is used for comparison only. Differences in utilization rates and other qualities of capacityand consumption prevent the ratio from providing specific information about the ability of a particularamount of capacity to meet the demand of a particular amount of consumption.11 This can also be interpreted as an increase in average utilization rates of installed capacity.12 The “utility” figures for 1977-1998 include those utility-owned generating facilities that were divestedby the California utilities in 1996-1998. The DOE data show approximately 23,000 MW of non-utilitycapacity in 1998, for example, but just over 10,000 MW of that total represents capacity that was notoriginally owned by California utilities. Data after 1998 become less clear as further divestiture occurred.

6
state’s total new capacity per total new consumption between 1977 and 1998 ratio moves from0.14 MW/GWh without independent capacity to 0.30 MW/GWh with independent capacity.This latter ratio shifts California from the third-lowest to the third-highest position in the west.
During this period, the four regions maintained their relative positions. The order, from lowestutility capacity per consumption ratio to highest, remained: California, the northwest, the RockyMountain states, and the southwest. The differences between the four regions converged,however, as all regions experienced a decline in their utility capacity per consumption ratios. In1977, the southwest had a ratio nearly double that of California. By 1998, the difference wasmore than halved, a result of the southwest’s slowed capacity additions in relation to its highconsumption growth. While California, the northwest, and the Rocky Mountain region haddeclines in utility capacity per consumption of less than 10%, the southwest’s ratio declined bymore than 30%. Nevertheless, the region’s ratio of 0.28 MW/GWh continued to be the highestin the WSCC. The Rocky Mountain region had the highest ratio of new utility capacity per newconsumption, 0.24 MW/GWh. California had the highest ratio of total new capacity per newconsumption, 0.30 MW/GWh, however, due to 10,000 MW of non-utility capacity additions.
CONCLUSION
This study shows how long-term trends in consumption, peak demand, and generating capacityhave changed throughout the western grid from 1977 to 2000 and affected California’s supplyand demand balance. It shows that California has been similar to other states in some respects(e.g., increasing installed capacity to consumption ratios at a greater rate from 1977 to 1988 thanfrom 1989 to 1998), but that it has also been quite different in many other respects. The mostimportant differences include heavy reliance on non-utility capacity additions in the 1980s andearly 1990s and significantly lower growth in either annual consumption or summer peakdemand on either a per capita or per dollar of GSP basis than other western states. California’swinter peak demand grew at a relatively high rate, however, compared to other parts of the west.
Although California has been widely criticized for not building adequate generating capacityduring the 1990s, the state actually exceeded the WSCC average for new capacity additionsrelative to increases in demand from 1977 to 1998. California’s higher-than-average newcapacity to consumption ratio is due to both demand factors and supply factors. On the demandside, California accounted for a disproportionately lower level of growth in overall WSCCdemand from 1977 to 1998 as other states grew at a faster rate and failed to achieve California’slow consumption per capita or per dollar of GSP ratio. On the supply side, investment has beendriven primarily by non-utility capacity additions since 1987. The state’s growth in newcapacity appears low when only utility-owned generation is included, but QF capacity more thandoubled the total increase in generating capacity installed in the state from 1977 to 1998.
Neither increases in California’s annual consumption (or peak demand) nor decreases inCalifornia’s historical share of WSCC-wide generating capacity is therefore at the heart of thestate’s supply and demand relationship from 1977 to 1998. Instead, the tightening of suppliesthroughout the WSCC during this period primarily reflects increases in consumption and peakdemand in other states and a region-wide decline in new capacity additions relative to thoseincreases in consumption. Above-average hydropower production (especially in the Pacific

7
Northwest) from 1996 to 1999 masked this shift, then hydropower availability decreasedsignificantly in 2000 (combined with significant increases in consumption in California andthroughout the WSCC) to reveal apparent shortages. This study does not examine production oroperating data, however, so we are unable to address how weather and other factors may haveaffected apparent shortages in 2000 and 2001. This study only addresses installed generatingcapacity.
These findings clearly have important policy implications, but this study is focused only onexploratory compilation and analysis of the historical data for electricity consumption, peakdemand, and generating capacity in California and the western grid. We will leave it to othersand future papers to address the relationship between these data and the electricity crisis thatcontinues to grip California and the west. We are hopeful that this study offers some of thehistorical data necessary to address those policy issues in a well-informed manner.

8
Chart ES-1
Chart ES-2
New utility capacity by state, 1977-1997
-4000
-2000
0
2000
4000
6000
8000
1977
1978
1979
1980
1981
1982
1984
1985
1986
1987
1988
1989
1990
1991
1992
1993
1994
1995
1996
1997
Year
Cap
acit
y ad
ded
du
rin
g y
ear
(MW
)
AZ
CA
CO
ID
MT
NM
NV
OR
UT
WA
WY
New utility capacity during ten-year periods by state, 1977-1998
(2,000)
-
2,000
4,000
6,000
8,000
10,000
12,000
AZ CA CO ID MT NM NV OR UT WA WY
State
Cap
acit
y ad
ded
du
rin
g p
erio
d (M
W)
1977-1986
1987-1998

9
Chart ES-3
Chart ES-4
New utility and QF capacity in California, 1977-1997
-2,000
-1,000
0
1,000
2,000
3,000
4,000
5,000
1977
1978
1979
1980
1981
1982
1983
1984
1985
1986
1987
1988
1989
1990
1991
1992
1993
1994
1995
1996
1997
Year
Cap
acit
y ad
ded
du
rin
g y
ear
(MW
)
Utility
QF
Non-utility capacity by state, 1998
0
200
400
600
800
1,000
1,200
AZ CO ID MT NM NV OR UT WA WY
State
Cap
acit
y (M
W)

10
Chart ES-5
Chart ES-6
Consumption per GSP and per capita by state, 1998
0
0.2
0.4
0.6
0.8
CA
CO U
TNM N
VAZ
OR
WA
WY ID M
T
WSC
C
State
Co
nsu
mp
tio
n p
er G
SP (k
Wh
/co
nst
ant
do
llar
)
Consumption/GSPConsumption/person
Co
nsu
mp
tio
n p
er c
apit
a (M
Wh
/per
son
)
30
20
10
0
Consumption by state, 1977-1998
0
50,000
100,000
150,000
200,000
250,000
1977 1979 1981 1983 1985 1987 1989 1991 1993 1995 1997
Year
Co
nsu
mp
tio
n (G
Wh
)
AZ
CA
CO
ID
MT
NM
NV
OR
UT
WA
WY

11
Chart ES-7
Share of total consumption by state, 1977-1998
0%
10%
20%
30%
40%
50%
60%
70%
80%
90%
100%
1977 1979 1981 1984 1986 1988 1990 1992 1994 1996 1998
Year
Am
ou
nt
of t
ota
l WSC
C c
on
sum
pti
on
(GW
h)
WY
NM
NV
UT
MT
ID
CO
AZ
OR
WA
CA

12
FULL REPORT
A. CONSUMPTION
Consumption in all states has risen since 1977. Consumption by the states of the western grid,Arizona, California, Colorado, Idaho, Montana, Nevada, New Mexico, Utah, Washington, andWyoming rose from 350,000 GWh in 1977 to nearly 570,000 GWh in 1998.13 This correspondsto an average annual growth rate of 2.4%. While growth rates fluctuated widely during the firsthalf of the time period, from between 25% and -10%, the growth rates leveled off after 1988,with all staying below 10% and most hovering near the 2.4% average. In total, the WSCC’sconsumption rose by 64%.
California’s electricity usage dwarfs that of all other states; its consumption is nearly two and ahalf times that of the next largest user. The state’s annual consumption rose by nearly 70,000GWh, from about 160,000 GWh to nearly 230,000 GWh. This corresponds to an annual growthrate of 1.7%, below the WSCC average. This trend can also be observed by analyzing the state’sshare of total consumption in the WSCC. During the twenty years between 1977 and 1998,California’s share of total electricity consumption fell from over 45% to below 40%.
Washington remained the second largest user of electricity during this time period; it showedsimilar trends to California, growing at rates slower than the average. The state’s annualconsumption grew by over 50%, from under 60,000 GWh to over 90,000 GWh, at an averageannual rate of 2.1%. While the state peaked in its share of consumption, using close to 20% ofthe WSCC total in 1984, its final share in 1998 dropped only slightly from its 1977 share, bothnear 16%.
While Oregon had been the third largest user of electricity, it was overtaken by Arizona in1992. Oregon’s consumption grew by nearly one-third, from 34,000 GWh to over 45,000 GWh,equaling an average annual growth rate of 1.3%, the lowest in the western grid. The state’s shareof electricity consumption fell from nearly 10% to under 8%.
Arizona exhibited phenomenal growth in electricity consumption, as it overtook Oregon as thethird largest user of electricity in the WSCC. Its consumption grew by nearly 140%, from under24,000 GWh to over 55,000 GWh. Its annual average growth rate of 4.2% was exceeded only byNevada. During this time its share of total electricity consumption grew from under 7% tonearly 10%, switching profiles with Oregon.
Colorado experienced considerable growth as well, adding over 20,000 GWh of new annualconsumption, more than doubling its 1977 consumption. Its annual consumption rose from over17,000 GWh, about 5% of the WSCC total, to nearly 40,000 GWh, nearly 7% of the WSCCtotal. While the state remains the fifth largest user of electricity, its growth indicates that it islikely to overtake Oregon within the next decade. 13 The WSCC includes not only these eleven states but also some regions of Mexico and Canada, as wellas small pieces of South Dakota, Nebraska, and Texas. (For a complete map, see page 29.) This reportstudies only the consumption and capacity of these eleven states. Only when the official WSCC regionsare referenced do the data refer to the full WSCC.

13
Idaho is the largest of the small users in the WSCC, each of which uses less than 5% of the total.Over the past two decades, the state’s usage has increased by over one-half, making it a slowgrowth state, comparatively. Its usage has grown from 13,500 GWh per year to over 21,000GWh per year, converting to an average annual growth rate of 2.2%. Idaho has exhibitedmarked fluctuations in its consumption; in five of twenty years its consumption fell.
Over the past two decades, Montana has dropped from seventh to tenth in total electricity usage;only Wyoming uses less electricity. Its average annual growth rate, 1.5%, is the second lowest.During that time period, its consumption grew by one-third, from 10,000 GWh per year to nearly14,000 GWh per year. The state’s share of total electricity consumption dropped slightly from2.9% to 2.4%. The state’s consumption also varied similarly to Idaho’s.
Utah has experienced significant growth in electricity consumption, more than doubling over thelast twenty years. Its consumption grew from less than 9,000 GWh per year to over 20,000GWh. In spite of this growth of 4.2% per year, which is above the western grid’s average, thestate remained the eighth smallest user of electricity in the western grid. As a percentage of thegrid’s total consumption, however, the state’s share rose from 2.5% to over 3.6%.
Nevada experienced phenomenal growth over the last two decades, outpacing Arizona in rate,though not absolute growth. The state’s consumption more than tripled over the last twodecades, rising from 8,000 GWh per year to over 25,000 GWh per year. This rise corresponds tothe highest average annual growth rate, 5.6%, in the entire western grid. As a result of thisgrowth, Nevada moved from ninth to sixth in total electricity usage. The state’s share of theWSCC total rose from 2.3% to 4.4%.
New Mexico experienced growth similar to that of Nevada. Its share of the western grid’selectricity usage remains small, moving from 2.2% to 3.2%. Its total consumption more thandoubled, growing from under 8,000 GWh per year to over 18,000 GWh per year, a 4.2% growthrate. During these decades, the state moved from tenth to ninth in total electricity consumptionin the western grid.
Finally, Wyoming has paralleled the trend of Nevada and New Mexico over the last decade,more than doubling from 5,000 GWh per year to over 11,000 GWh per year. Its average annualgrowth rate, 3.7%, is above the western grid’s average, but the state remains last in totalconsumption. Wyoming’s share of total electricity consumption rose during this time, from1.6% to 2.1%.
Total consumption can also be broken down by region. California’s trends over the last twodecades mirror the aggregate trend of the northwest states of Oregon, Washington, Montana,and Idaho. While California’s total usage moved from 46% to 40%, this group’s share droppedfrom 34% to 30%. In contrast, two smaller regions, the southwest states of Arizona, Nevada,and New Mexico and the Rocky Mountain states of Colorado, Utah, and Wyoming,experienced more significant growth in electricity consumption. The southwest region’sconsumption grew by over 150%, from 39,000 GWh to nearly 100,000 GWh per year. Its sharerose from 11% to over 17%. The Rocky Mountain region’s consumption rose by over 120%during this period, rising from 32,000 GWh to nearly 72,000 GWh. The region’s share of totalconsumption rose from 9% to nearly 13%.

14
Officially, the WSCC is divided into four regions: the Northwest Power Pool (NWPP), theRocky Mountain Power Association (RMPA), the California and Mexico region (CA/MX), andthe Arizona, New Mexico, and southern Nevada region (AZ/NM/SNV).14 The last two regions,CA/MX and AZ/NM/SNV, were reorganized in 1997 and Mexico was added. Prior to that date,the California region had instead included California and southern Nevada and the Arizonaregion had included only Arizona and New Mexico. Unfortunately, the data are not uniformthroughout the time period, but the changes do not drastically alter the results. Nevertheless, thedata should be taken only as approximate. In addition, some data are only available as far backas 1995, but go through 1999, so they can only be used as a snapshot of current usage, nothistorical change. Using these geographic breakdowns, the NWPP uses about 37% of theWSCC total, the RMPA uses about 6%, AZ/NM/SNV uses about 16%, and CA/MX uses theremaining 42% of the WSCC total. These percentages have held steady over the five years forwhich data are available.
B. CONSUMPTION PER CAPITA
As expected, total consumption is related to each state’s population. However, consumption percapita varies widely among states in the WSCC and has not converged considerably during thepast two decades. While some states have decreased their consumption per capita slightly, somestates have increased their consumption per capita greatly. In general, most states’ per capitaconsumption varied during the 1980s and then stabilized during the 1990s. Some statesexperienced net increases in the 1980s, peaked at the turn of the decade, and then began a declinein per capita usage during the 1990s.
As a rough measure, a state’s consumption per capita value is inversely proportional to its totalelectricity usage, e.g., the state with the highest total electricity usage will have the lowest percapita electricity usage. It is difficult to use consumption per capita to compare across states,because the states of the WSCC are very heterogeneous. Weather, geography, and industry areprimary determinates in total electricity usage, along with population. However, comparisonsare valuable for giving general trends in consumption efficiency. Overall, the WSCC’s percapita consumption rose by 9.4%, from 8.9 to 9.7 MWh/person.
California’s electricity use per capita is now the lowest of any state in the WSCC, though itended the 1970s with only the fourth lowest rate. While California’s consumption per capitadropped slightly during the last two decades, from slightly above to slightly below 7MWh/person, California’s rank is mainly a result of increases in consumption per capita byother states. New Mexico, Colorado, and Utah began the two-decade period with the first,second, and third lowest consumptions per capita, respectively, but those values all increasedduring the period. New Mexico’s usage per person nearly doubled, from 6 MWh/person to over10 MWh/person and dropping from first to fourth in lowest electricity consumed per person.Colorado and Utah’s usage each rose by about 50% during this time, from below 7MWh/person to nearly 10 MWh/person.
14 For a complete map of these regions, see page 30.

15
Arizona’s consumption per capita rose by one-quarter over the two decades, from under 10MWh/person to nearly 12 MWh/person. This slight increase in consumption per capita resultedin no net change in the state’s relative consumption; it continues to be the fifth smallest user ofconsumption on a per capita basis.
Nevada’s per capita consumption rose more than 20%, from under 12 MWh to over 14 MWhduring the two-decade period. As a result of this relatively small increase, the state’s rank in percapita consumption moved from sixth to seventh lowest.
Montana’s consumption per capita grew a relatively modest 20% during the past two decades.Its relative position dropped slightly as well, from the seventh to the eighth smallest consumer ofelectricity per capita. Its consumption moved from 13 MWh/person to nearly 16 MWh/person.
Wyoming experienced phenomenal growth in consumption per capita, increasing by more than85%. While its usage began near the WSCC average of 10.8 MWh/person (averaged over theeleven states, not total population), its ultimate consumption ballooned to over 24 MWh/person,40% higher than the closest state. Nearly all of this growth occurred during the 1980s; 77% ofthe change occurred between 1985 and 1989 when annual consumption per capita rose by nearly9 MWh. During the 1990s, the state’s consumption per capita began to decline slightly eachyear, falling from 26 MWh/person to its final value.
Like most states, Oregon’s per capita consumption varied during the 1980s and steadied in the1990s. Along with California, Oregon was one of just two states to experience a decline in percapita consumption. The state’s consumption per capita dropped slightly from its 1977 value,falling only 0.3 MWh/person to nearly exactly the eleven-state average of 13.7 MWh/person. Asa result of this slight decline, the state’s relative position in the WSCC changed significantly; itmoved from the ninth to the sixth lowest user of electricity per capita.
Idaho’s per capita usage remains high after two decades; the state remains tenth out of 11 interms of lowest consumption per capita. The state’s usage per person grew a modest 13%, from15.3 to 17.3 MWh annually. The state’s consumption growth varied during the 1980s, like moststates, and leveled off during the 1990s. All of the state’s consumption per capita growthoccurred during the 1980s; the state’s consumption dropped just slightly from the beginning tothe end of the 1990s.
Two decades ago, Washington had the highest annual per capita consumption. Its 15.6MWh/person was two and a half times that of the lowest per capita user, New Mexico.Washington’s consumption per capita exhibited strong growth during the 1980s and strongdecline during the 1990s. In aggregate, the state’s consumption rose slightly, less than 3%, to 16MWh/person. As a result of Wyoming and Idaho’s larger increases, however, the state’srelative ranking moved to ninth overall.
C. CONSUMPTION PER DOLLAR OF GROSS STATE PRODUCT
All states exhibited a marked decline in consumption per dollar of gross state product (GSP)between the 1977 and 1998. While values ranged from 0.7 to nearly 2 kWh per dollar of GSP

16
($GSP) in 1977, by 1998 the values had all converged to within 0.5 kWh/$GSP of each other andhad all fallen below 0.7 kWh/$GSP. Similar to the pattern of per capita consumption, per GSPconsumption varied widely in the 1980s, with some states increasing and decreasing inalternating years. While some states switched places in terms of relative consumption per GSP,in general the relative positions of states remained the same, e.g. those states with high relativeper GSP consumption in 1977 had high per GSP consumption in 1998, though the absolute valuewas much lower. Except for one, all states exhibited a generally steady decline in per GSPconsumption over the two decades, though the first decade had more fluctuating noise andgenerally accounted for a larger share of the total decline. Only Wyoming experienced anincrease in per GSP consumption during the first decade, a peak, and then a decline.Nevertheless, it also ended the 1990s with a net decrease, though small, in per GSP consumption.
California began the two decades with per GSP consumption nearly three times less than thehighest per GSP user. Over the course of the two decades its consumption per GSP dropped bymore then 70%, from 0.69 kWh/$GSP to 0.20 kWh/$GSP. More than 80% of the decline cameduring the first decade. In fact, more than half of the decrease occurred during the first fiveyears, between 1977 and 1982. During those years the decline hovered near 10% per year, afterwhich time it dropped to near 3% or 4% per year. Its 1998 per GSP consumption was threetimes less than that of the largest per GSP consuming state and 40% less than the consumption ofthe next most efficient state per GSP.
Colorado’s decline mimicked that of California. It experienced a decline in per GSPconsumption of over 60%, more than half of which occurred during the first five years after1977. Overall, its per GSP usage fell from 0.71 to 0.28 kWh/$GSP.
New Mexico experienced a pronounced decline during the 1980s, an increase beginning in 1986,and then another decline beginning in 1990. The steady decline during the 1990s more thanoffset the increases of the late 1980s. Overall, the state’s per GSP usage dropped 50%, from0.74 to 0.38 kWh/$GSP. Nevertheless, the state’s ranking rose slightly; it moved from the thirdto the fourth lowest user of electricity on a per capita basis.
Utah’s initial per GSP consumption was close to California’s, within 20%, but because itexperienced a less pronounced decline than California, its final value diverged fromCalifornia’s by more than 70%. The state’s overall decline was slightly less than 60%, fallingfrom 0.85 to 0.35 kWh/$GSP. Utah’s relative rank changed slightly during the period; it movedfrom the fourth to the third smallest consumer on a per GSP basis, switching rankings with NewMexico.
Due in part to fluctuating population, Wyoming’s per GSP consumption varied widely duringthe 1980s. The state fell from 0.95 kWh/$GSP to a low of 0.58 kWh/$GSP in 1981. By 1987,however, the state exceeded the 1977 value and peaked at nearly 1 kWh/$GSP. Over the nextdecade the state’s per GSP consumption began a steady decline, and finally settled at 0.66kWh/$GSP. Overall, the state’s per GSP usage fell by 30%. The state fell from the fifth to theninth lowest consumer per dollar of GSP.
Nevada, Arizona, and Oregon all experienced significant declines in per GSP consumptionduring this period, about 70%. These declines were generally steady, though higher declines

17
were seen in the first five years. Nevada’s usage fell from above 1 to below 0.4 kWh/$GSP.The state’s rank moved from the sixth to the fifth lowest per GSP consumer. Arizona’s per GSPconsumption fell from 1.2 to nearly 0.42 kWh/$GSP as it moved from the seventh to the sixthsmallest per GSP consumer of electricity. Oregon experienced the greatest percentage declineof any state, 72%, falling from over 1.5 to nearly 0.43 kWh/$GSP. Its rank moved from eighthto seventh.
Montana, Washington, and Idaho began the 1980s with the highest per GSP usage in theWSCC. Only Washington experienced sufficient decline in consumption to become a mid-range user of electricity per GSP. Its consumption fell from over 1.6 kWh/$GSP to under 0.5, adecline of over 70%. As a result, its rank fell from the tenth to the sixth smallest consumer ofelectricity per GSP. Montana and Idaho remained the highest users of electricity per GSP.Idaho’s usage fell from nearly 2 kWh/$GSP to 0.7. Montana’s usage fell from 1.6 kWh/$GSPto less than 0.7. Montana’s 1998 per GSP consumption was higher than California’s 1977 perGSP consumption.
On a regional basis, the differences are slightly obfuscated. Within each region, individual statesdrive the differences and there is not a strong geographic similarity driving the per GSPconsumption trends. For example, the northwest is the highest per GSP user of electricity, butthis is a result of high usage by Montana and Idaho moderated by the usage of Washington andOregon. While in 1977 these four states were the four highest users of per GSP electricity,during the last two decades Oregon and Washington have reduced their usage per GSPsignificantly. In the southwest, the second highest regional user of electricity on a per GSPbasis, the high usage is driven almost equally by all three states. Finally, the Rocky Mountainregion’s low usage is driven by Colorado and moderated by Wyoming, the state thatexperienced the smallest per GSP consumption decline of any state in the WSCC.
D. PEAK DEMAND
The data of historical peak demand are available only by WSCC region and for the time periodfrom 1982 to 1998. These data indicate the incidental peak electricity demand in each year.15
Since 1982, all regions have experienced an increase of at least one-third. Generally, the growthprogressed steadily over the sixteen years, though all regions experienced both increases anddecreases in peak demand from year to year. From 1982 to 1998 the peak electricityconsumption of the total WSCC rose by nearly 50,000 MW, from 84,000 MW to over 130,000MW, a greater than 50% increase.
The NWPP continued to have the highest peak electricity demand from 1982 through 1998, butthe region’s percentage growth was the smallest in the WSCC. Its peak demand rose 16,000MW, 37%, from 44,000 MW to 60,000 MW. The state’s demand fluctuated by as much as 15%from a previous year, though in most of the 1990s its peak demand fluctuated less.
15 These data indicate the peak demand on a single day during the year or a particular season. Becausepeak demand is heavily weather-dependent, an individual region’s peak demand may not occur on thesame day as the WSCC’s peak demand. Therefore the overall WSCC peak demand may be less than thesum of regional peak demands.

18
The CA/MX region’s peak consumption grew by 55%, from 36,000 MW to 55,000 MW. Whilethe region’s peak demand remained below the NWPP, it often approached the NWPP region’slevel. In both 1986 and 1988, CA/MX’s demand came within 1,000 MW of the NWPP’s peakdemand. The state’s demand fluctuated widely as well, alternating increased and decreased peakdemand for ten years, from 1987 through 1996.
The greatest increase in peak demand occurred in the AZ/NM/SNV region. Between 1982 and1998 the region’s peak demand grew by 135%, more than doubling from 8,700 MW to above20,000 MW. Unlike the other regions, which experienced frequent increased and decreased peakdemand, the AZ/NM/SNV had only one year when the peak demand decreased from the yearbefore.
The RMPA has a comparatively small peak demand and its peak grew at a rate similar to that ofCA/MX and the NWPP, by less than 50%. Between 1982 and 1998, the region’s peak rose from5,400 MW to 8,000 MW. Its year-to-year fluctuations were less pronounced than the otherregions. In particular, it had only a few years where its peak demand dropped from the previousyear. Nevertheless, it did have increases of over 7% in one year.
A small set of data shows the western grid’s winter and summer peak demands separately. Forsummer the data span 1995 to 1999. For winter the data span 1995/1996 to 1999/2000.However, the geographic definitions underlying these data were changed in 1997 (southernNevada was moved to a different region and Mexico was added to a region), so the data are onlyapproximate. The summer peak for all regions crested in 1998 and then dropped down slightlyin 1999. The following discussion refers to the 1999 values, but the trends do not change if theprevious year’s numbers are used.
Overall, these data follow the trends observed in the annual incidental peak data. The peaksummer demand for the WSCC increased by 10%, 13,000 MW, from 117,000 MW in 1995 to130,000 MW in 1999. The WSCC’s peak winter demand rose by 5%, 8,000 MW, from 112,000MW in 1995/1996 to 118,000 in 1999/2000.
The AZ/NM/SNV region experienced the greatest increase in peak demand. Both its winter andsummer peak demand had the greatest increases of any region. The summer-peaking region hada 37% increase, 5,000 MW, in its summer peak, moving from 15,000 MW to 20,000 MW. Thewinter peak rose 32%, 3,000 MW, from 11,000 MW to 14,000 MW.
As a winter peaking region, the NWPP summer peak increase is obfuscated by the annual peakvalue. In fact, its winter peak dropped slightly from 1995/1996 to 1999/2000, but this may be aresult of the data re-aggregation. Its summer peak, however, increased by nearly 10%, 4,000MW, from 44,000 MW to over 48,000 MW. During this time, the NWPP’s summer peak ofelectricity usage approached that of CA/MX. By the summer of 1999, the NWPP was within of5,000 MW of CA/MX, a differential decrease of over 40% over the five years.
The RMPA’s winter and summer peak demand increased modestly during this five-year period.The region, which peaks in the winter, experienced a summer peak increase of 5%, just 400 MW,rising to 7,700 MW. Its winter peak rose by 11%, 700 MW, from 6,900 MW to 7,600 MW.

19
The CA/MX region experienced the smallest peak demand increases in both summer and winterof any of the regions in the WSCC. The region, which peaks in the summer, experienced only a1% increase in its summer peak, just 600 MW, rising from 52,500 MW in 1995 to 53,100 MW in1999. The 600 MW rise accounts for only 5% of the combined summer peak increases for all ofthe regions in the WSCC. In the winter, the region’s peak demand increased by nearly 7%,3,000 MW, from 37,500 MW to 40,000 MW. The region therefore accounted for more than45% of the combined winter peak increase for all of the regions in the WSCC.
E. CAPACITY
Over the last decade, utility capacity additions dropped off dramatically.16, 17 There wasconsiderable capacity addition during the 1980s, but installations nearly stopped in 1988. Whilenew additions averaged 4.5% over the eleven states from 1978 to 1988, the eleven-state averagegrowth rate dropped to less than 0.5% during the second decade. Looking at the WSCC as asingle unit, the numbers are even smaller. In total, the WSCC’s growth rate was 3.5% during thefirst decade and fell to two-tenths of a percent during the second decade. Only a handful ofstates had real growth during the second decade: Idaho, Nevada, and, to a lesser extent,Arizona. Some states had capacity removals during some periods. Overall, the WSCCincreased its capacity by 48%, to 133,000 MW.
California’s utility capacity additions came entirely during the first decade. During this timeperiod the state added 10,000 MW of capacity. Between 1977 and 1981 the state added 3,400MW. Between 1982 and 1986, 6,900 MW were added. During the second decade, the state hada net loss of nameplate capacity. Between 1987 and 1992 the state removed 675 MW ofcapacity, which was replaced by only 123 MW during the most recent five-year period, 1993through 1998. Overall, the state increased its capacity from 35,000 in 1977 to 44,000 MW in1998, an increase of 28%, the second smallest increase.
Overall, Arizona’s capacity increased by 83% during the last two decades. The state added7,500 MW of capacity during the period, giving it a total of 16,600 MW. Unlike most states,Arizona had significant capacity additions during the second decade, though most of thatoccurred during the first half of the decade. Between 1977 and 1981 the state added 1,200 MWof capacity. During the next five years the state added another 3,400 MW. Between 1987 and1992 the state increased its installed capacity by 2,900 MW. Finally, during the final five yearsthe state added just 40 MW of new capacity.
Colorado’s installed nameplate capacity rose by 50% between 1977 and 1998, from 4,600 to7,000 MW. Like California, all of these additions occurred during the first half of the two
16 Utility capacity data include both investor-owned utilities and municipal utility districts.17 The capacity data included in this report indicate a generator’s nameplate capacity. While nameplatecapacity matches closely the average annual peak capacity of fossil fuel generators, it can be significantlyhigher than the average annual peak capacity of hydro, wind, and solar electricity sources. Therefore, thecapacity figures cited in this report are higher than the peak level of generation that could be sustainedover an extended period of time. In particular, variation in annual and seasonal hydro conditions mayresult in “firm” capacity for hydro resources that is well below the installed nameplate capacity.

20
decades. Between 1977 and 1981 the state added 1,800 MW of capacity. It added 900 moreduring the next half-decade. Between 1987 and 1992 the state lost 520 MW of capacity. In thefollowing five years only 240 MW were replaced. The drop in capacity came entirely from asingle year decline in 1990.
Idaho is one of only two states that had a larger capacity increase during the second half of thetwo-decade period than the first (the other is Nevada). The state lost 270MW between 1977 and1981 but added 570 MW of capacity between 1982 and 1986. During the next five years thestate added 93 MW of capacity. During the final five years, 1993 to 1998, the state added 260MW. The increase was not the greatest absolute addition during this period, but as a percentageof a state’s total new capacity, it dwarfs all other states. Overall, the state’s capacity increasedby 38%, from 1,700 to 2,400 MW.
Montana added more than 2,000 MW of capacity, an increase of close to 70%. Most of theadditions occurred during the period between 1982 and 1986, when it added 2,000 MW ofcapacity. It lost 160 MW in the preceding five years. In the last ten years the state added lessthan 200 MW of capacity.
New Mexico had the third smallest percentage increase in capacity during the last two decades.The state’s installed capacity rose by 30%, from 4,300 MW to 5,600 MW. Almost all of theseadditions occurred during the first half of the two-decade period. Between 1977 and 1981 thestate’s capacity increased by 760 MW. During the next five years the state added 500 MW.During the next decade the state added 85 MW.
Although Nevada had high net capacity growth during the last two decades, nearly none of thisgrowth occurred during the first half of the time period. The state added 1,000 MW of newcapacity between 1977 and 1981 but lost nearly all of that capacity during the next five years, thelargest decrease of any five-year period. Between 1987 and 1992, however, the state added2,600 MW of capacity. Finally, during the most recent five-year period, the state added 530 MWof capacity, resulting in a net increase over the twenty-year period of over 3,000 MW, or 115%.Only Utah had a greater percentage increase. Overall, the state increased its capacity from 2,700MW in 1977 to 5,900 MW in 1998.
Oregon had only a tiny capacity increase during the last two decades. Its net capacity rose byless than 3%, or 300 MW, to 9,900 MW. The capacity dropped by nearly 1,000 MW during thefirst five years of the time period. In the following five years, all new capacity for the entiretwenty-year period was added, nearly 1,900 MW. In the next decade some of these additionswere eroded by reductions of over 750 MW.
Overall, Utah’s installed capacity rose by a phenomenal 360%. The state added over 4,000 MWof capacity to its existing stock of 1,100. In one year, 1987, the state added 1,250 MW ofcapacity. In total, nearly 80% of these additions came during the first decade, roughly equallydivided between the first and second half of the decade. The state added nearly 1,000 new MWof capacity between 1987 and 1992. During the last five years, the state’s stock declined by 126MW.

21
Washington’s capacity growth was the most skewed towards the early decade. More than 90%of the state’s 8,800 new MW of capacity were added during the first half of the time period. Thestate lost 72 MW between 1987 and 1992 and gained 900 MW from 1992 to 1998. In total, thestate’s capacity stock rose by 60%, to 25,000 MW.
Wyoming capacity additions were also heavily skewed to the early years. The state added morethan 80% of its total additions during the first decade. Between 1977 and 1981, the state added1,000 MW of capacity. During the years between 1982 and 1986, the state added more than1,500 MW. Between 1987 and 1992, only 350 MW were added. Finally, during the last fiveyears the state’s capacity increased by only 180 MW. In aggregate, the state’s capacity stockrose by over 3,000 MW, or 90%, to 6,400 MW.
When analyzed regionally, the new capacity additions appear less divergent. The four regions,California, the northwest, the southwest, and the Rocky Mountain states, added similaramounts of capacity, between 9,500 and 12,000 MW. Only in the southwest did any significantcapacity building occur during the second decade. Driven by Nevada and, to a lesser extent,Arizona, more than 50% of this region’s capacity was built in the later ten years.
While the capacity additions by the northwest and California were large in magnitude, theywere smaller on a percentage basis than other regions. Overall, California’s capacity grew lessthan 30% over the period, and the northwest’s capacity grew by less than 40%. In contrast, thesouthwest’s capacity rose by nearly 75%. The capacity stock in the Rocky Mountain regionrose by over 100%, driven largely by Utah’s phenomenal growth. In total, the western grid’scapacity rose by about 50%.
Non-utility capacity
Utility-only capacity data partially obfuscate the real trends in installed capacity in the westerngrid. In particular, California experienced significant growth in capacity between 1986 and1990 as a result of the newly-created qualifying facility (QF) category. Federal legislationadopted in 1978 required that independent electricity producers be allowed to sell electricityback to utilities.18 California, which developed generous payment rates for QF electricity, hadthe sharpest capacity additions of any state in the nation. Unfortunately, data limitations preventa rigorous quantitative comparison across states in the western grid.
While California’s utility-owned capacity additions nearly stopped in 1987, additions madethrough the QF program were relatively large. In fact, the state’s overall capacity stock increasedoubles from 28% without QF supply to over 57% with QF supply. The state’s utility-ownedcapacity stock declined by nearly 600 MW between 1987 and 1998 but QF additions totalednearly 8,000 MW during the same period. Most of these additions occurred between 1987 and1991, when more than 6,500 MW were added. By 1992, QF additions had also declined to anaverage of less than 170 MW per year. In spite of these declines, by 1998 QF facility capacityaccounted for nearly 20 percent of the state’s total. 18 Public Utility Regulatory Policies Act (PURPA; see 16 USCS § 824 et seq.). Though not thelegislation’s primary goal, PURPA regulations encouraged the development of independent electricity,particularly from cogeneration and renewable resources (“qualifying facilities” under PURPA).

22
Time series data of other states’ QF capacity are not available, but the 1998 single-year non-utility capacity totals for the rest of the western grid are available. While California’s QFcapacity totaled more than 10,000 MW, only 2 other states had more than 1,000 MW of QFs(Washington had 1,046 MW and Oregon had 1,006 MW). The other eight states had anaverage of less than 400 MW each.20 The unavailability of QF data for these other states before1998 should therefore not significantly affect the general trends in installed capacity outlinedabove.
F. CAPACITY PER CONSUMPTION
While absolute capacity additions by state or region are important measures of capacity stockgrowth, they do not account for the consumption differences across these areas. California islikely to make the largest absolute additions to its stock simply due to its size, but the magnitudeof each state’s additions does not indicate whether those additions were in proportion to itsusage. A more useful statistic is installed capacity per consumption. States or regions with highcapacity per consumption are likely to be exporters of electricity and states with lower values arelikely to import a share of theirs.21 While not exact markers, these statistics suggest whether astate or region is supporting its consumption increases with its existing capacity and imports orwith new capacity and possibly exporting the excess.22
Overall, the WSCC experienced a decline in its utility capacity-to-consumption ratio of 10%,falling from 0.26 to 0.23 MW of capacity per GWh of annual consumption.23 Only two states,Montana and Utah, opposed this trend and experienced net utility capacity per consumptionincreases over the time period. California increased its total net capacity per consumption ratiothrough extensive non-utility additions, however, that are discussed below. Washington’s ratioremained nearly unchanged. Consistent with the capacity building trends, many statesexperienced utility capacity per consumption peaks during the first half of the two decades, onlyto see these increases eroded during the subsequent decade
This ratio can also be analyzed entirely from the perspective of new capacity and newconsumption. This measure can be used to account for the general decline of most states. Liketotal capacity additions, the measure can be separated into smaller time periods to see when astate’s increase or decline occurred. The WSCC added just 0.19 MW of new capacity for everyGWh of new consumption. This is 25% less than its ratio at the beginning of the period. 20 These data come from the Department of Energy (DOE), while the California QF capacity data comefrom California Energy Commission (CEC) data sources. The DOE data include all non-utility capacity,which represents a larger universe of categories than the CEC data, which include only QFs.21 This ratio is used for comparison only. Differences in utilization rates and other qualities of capacityand consumption prevent the ratio from providing specific information about the ability of a particularamount of capacity to meet the demand of a particular amount of consumption.22 As noted above, however, variations in these figures could also reflect fuel availability or generatingtechnology choice. Areas with high levels of dependence on hydro, wind, or solar resources willgenerally require higher installed nameplate generating capacity to meet a given level of annual loads.The load profile (e.g., winter- vs. summer-peaking, load factors, etc.) also influences capacity utilization.The ratios described here are meant to serve as general indicators.23 This can also be interpreted as an increase in average utilization rates of installed capacity.

23
In total, California’s installed utility capacity per consumption moved little during these twodecades, dropping 10%, from 0.22 to 0.20 MW/GWh, a ratio less than the WSCC value.24 Itsrelative rank within the WSCC did not change; its capacity per consumption ratio is the thirdlowest. During the two-decade period, the state added just 0.15 MW of utility-owned capacityfor every GWh of new consumption. This is the fifth lowest capacity addition ratio. Between1977 and 1981 the state added utility capacity at a rate of 0.22 MW/GWh. The ratio rose to 0.44MW/GWh between 1982 and 1986. In the following decade the utility capacity addition ratiosbecame negligible, resulting in a net decline.
The data used in these ratios understate significantly California’s total installed generatingcapacity per consumption, however, since they do not include California’s QF capacity. WhenQF supply is included, the state’s capacity per consumption ratios increase dramatically. Forexample, instead of declining, the state’s overall installed capacity per consumption ratio rosefrom 0.22 to 0.24 MW/GWh. In addition, the state’s new capacity per new consumptionbetween 1977 and 1998 ratio moves from 0.14 MW/GWh without QF capacity to 0.30MW/GWh with QF capacity, well above the WSCC average of 0.24 MW/GWh. Californiatherefore added new capacity between 1977 and 1998 at a higher rate relative to its increases inconsumption than any other state except Montana, Utah, and Wyoming. Inclusion of QFcapacity shifts California’s position from being the third-lowest to the third-highest state in theWSCC from 1977 to 1998 in terms of capacity per consumption.
Arizona’s ratio of installed capacity to consumption remained relatively high during these twodecades, but it dropped from third to fourth as its ratio fell by 24%. The state’s ratio fell from0.39 MW of capacity per GWh of consumption to 0.30 MW/GWh, a result of adding 0.23 MWof capacity for every GWh of new consumption between 1977 and 1998. In the decade from1982 to 1992, the state added capacity in excess of its initial ratio, but these additions weretempered by small capacity additions per new consumption between 1977 and 1981 andnegligible new additions in the last five years of the period.
Colorado fell from eighth to tenth in capacity per consumption in the WSCC as a result of a30% decline in capacity per consumption during the period. The state added new capacity on aper consumption basis at a rate of just 40% of its ratio in 1977. Its new capacity per newconsumption additions were the third smallest in the WSCC, less than 0.11 MW/GWh. All ofthese additions occurred during the first half of the two-decade period; the state was a net loserof capacity in the remaining decade.
Idaho added the second smallest stock of new capacity per new consumption in the WSCC. Asa result of the state’s 13% decline overall, its relative ranking fell from second lowest to lowest.The state added just 0.08 MW of new capacity for each GWh of new consumption, dropping itstotal ratio from 0.13 to 0.11 MW capacity/GWh consumption. Nearly all of the state’s capacityadditions per consumption occurred in the five-year period between 1982 and 1986, when it
24 The “utility” figures for 1977-1998 include those utility-owned generating facilities that were divestedby the California utilities in 1996-1998. The DOE data show approximately 23,000 MW of non-utilitycapacity in 1998, for example, but just over 10,000 MW of that total represents capacity that was notoriginally owned by California utilities. Data after 1998 become less clear as further divestiture occurred.

24
added 0.30 MW of capacity for each GWh of new consumption. During the final five years ofthe period, the state added some new capacity at a rate of 0.11 MW/GWh, its final ratio.
Montana is one of just two states that exhibited a net rise in capacity per consumption during thetwo decades. The state’s capacity per consumption ratio rose by 21%, increasing the state’s ratioof consumption per capacity from the fifth highest to the second highest in the western grid.Overall the state added capacity at a rate of 0.54 MW of new capacity per GWh of newconsumption. The state’s ratio rose from 0.30 to 0.37 MW/GWh. The state made above averageadditions to its capacity stock during the first decade; it continued to add capacity during thesecond decade, but at a ratio lower than its net average. Unlike most states, the lower additionratio in the second decade did not significantly erode the gains made from the high capacityaddition rate of the previous decade.
New Mexico had the third lowest new capacity per new consumption ratio of the two decadesfollowing 1977. Despite this low ratio, the state maintained its relatively high ratio of capacity toconsumption, dropping from second to third. The ratio fell by 45%, from 0.56 to 0.31MW/GWh. While the state had a high new capacity per new consumption ratio in the first fiveyears of the two decades, 0.57 MW/GWh, the ratio dropped by nearly an order of magnitude inthe following 15 years, to 0.06 MW/GWh.
Nevada experienced dramatic fluctuations in its ratio of capacity to consumption. In aggregatethe state’s ratio fell by 31%, dropping its ranking from fourth to seventh. In the process, thestate’s ratio fell from 0.34 MW/GWh to 0.24 MW/GWh. In terms of new capacity per newconsumption, the state’s ratio was the western grid’s median and mean, 0.19 new MW per newGWh. Large increases that occurred during the first five years were entirely offset by decreasesin the second five years. Between 1987 and 1992 the state had the largest new capacity per newconsumption of any state in the WSCC, 0.48 MW/GWh, but these gains were also offset by theweak per new consumption additions made in the following five years when it added just 0.08MW of new capacity per GWh of new consumption.
Oregon’s new capacity per new consumption ratio was the smallest in the western grid duringthese two decades. It added just 0.03 MW of new capacity per GWh of new consumption, a ratealmost twenty times smaller than that of Montana, the state with the highest ratio of newcapacity to new consumption over the period. As a result of these small ratios, Oregon’scapacity per consumption fell by 22% during these two decades, from 0.28 to 0.22 MW/GWh.This decline is a result of capacity removals during the second and last five years of the twodecades, when the state lost more than 1,000 MW of capacity. These losses were partially offsetby a relatively high capacity addition per new consumption ratio of 0.35 MW/GWh between1977 and 1981.
Utah, along with Montana, is the only other state that had a utility capacity per consumptionincrease during these two decades. (California also saw an increase when QF capacity isincluded.) The state, which had the lowest capacity per consumption ratio in 1977, rose to be themedian state as a result of its 96% growth in capacity per consumption. The state rose from 0.13MW/GWh to 0.25 MW/GWh. Overall, the state’s ratio of new capacity per new consumptionwas 0.34 MW/GWh, the third highest in the western grid. Although the state had high newcapacity per new consumption ratios during the first half of the two decades, nearly all of its

25
growth occurred between 1982 and 1986 when the state had a new capacity per newconsumption ratio of 0.9 MW/GWh, the highest of any comparable period.
Washington’s capacity per consumption trends mirrored those of California during these twodecades. Overall the state’s capacity per consumption ratio was flat; it increased by half apercent. As a result, the state’s relative ranking rose from seventh to fifth, while its ratio held at0.27 MW/GWh. The state had moderate ratios during most of the two decades; between 1987and 1992, however, the state had a slightly negative ratio, the result of a small net loss ofcapacity.
Although Wyoming experienced a decline in its capacity per consumption ratio between 1977and 1998, it remained the state with the highest capacity per consumption ratio in the westerngrid. It began the period with a ratio of 0.61 MW/GWh, more than double the WSCC averageand nearly five times that of the lowest ratio. Overall, the state’s ratio dropped by just 10%, to0.55 MW/GWh. Between 1977 and 1986 the state had a moderate capacity addition ratio of0.44. During the last five years the state technically had negative growth, but this is a falsestatistic; the state had a decline in consumption so it actually added net capacity when itsconsumption was reduced. In total, the state had the second highest ratio of added capacity tonew consumption, 0.49 MW/GWh.
Regionally, the utility capacity per consumption statistics mirror the absolute capacity trends.The four regions maintained their relative positions. The order from lowest utility capacity perconsumption ratio to highest remained California, the northwest, the Rocky Mountain states,and the southwest. However the differences between the four regions converged during the twodecades as all regions experienced a decline in their utility capacity per consumption ratios. In1977 the southwest had a ratio nearly double that of California. By 1998, the percentage andabsolute differences were more than halved. This is a result of the southwest’s slowed utilitycapacity additions in relation to its high consumption growth. While California, the northwest,and the Rocky Mountain states had declines in utility capacity per consumption of 10% or less,the southwest’s ratio declined by more than 30%. Nevertheless, the region’s ratio of 0.28MW/GWh continued to be the highest in the WSCC.
In terms of new utility capacity per new consumption, the Rocky Mountain region had thehighest ratio. The region added 0.24 MW of capacity for each new GWh of consumption. Thenorthwest’s capacity additions per consumption were also slightly larger than the southwest’s,though they both added approximately 0.20 MW/GWh during the two-decade period.California had the lowest new utility capacity per new consumption ratio, less than 0.15MW/GWh. Inclusion of QF capacity additions pushes California into a leadership position,however; the state added 0.30 MW/GWh during the two decades, the highest rate in the WSCC.
CONCLUSION
This study shows how long-term trends in consumption, peak demand, and generating capacityhave changed throughout the western grid from 1977 to 2000 and affected California’s supplyand demand balance. It shows that California has been similar to other states in some respects(e.g., increasing installed capacity to consumption ratios at a greater rate from 1977 to 1988 than

26
from 1989 to 1998), but that it has also been quite different in many other respects. The mostimportant differences include heavy reliance on non-utility capacity additions in the 1980s andearly 1990s and significantly lower growth in either annual consumption or summer peakdemand on either a per capita or per dollar of GSP basis than other western states. California’swinter peak demand grew at a relatively high rate, however, compared to other parts of the west.
Although California has been widely criticized for not building adequate generating capacityduring the 1990s, the state actually exceeded the WSCC average for new capacity additionsrelative to increases in demand from 1977 to 1998. California’s higher-than-average newcapacity to consumption ratio is due to both demand factors and supply factors. On the demandside, California accounted for a disproportionately lower level of growth in overall WSCCdemand from 1977 to 1998 as other states grew at a faster rate and failed to achieve California’slow consumption per capita or per dollar of GSP. On the supply side, investment has beendriven primarily by non-utility capacity additions since 1987. The state’s growth in newcapacity appears low when only utility-owned generation is included, but QF capacity more thandoubled the total increase in generating capacity installed in the state from 1977 to 1998.
Neither increases in California’s annual consumption (or peak demand) nor decreases inCalifornia’s historical share of WSCC-wide generating capacity is therefore at the heart of thestate’s supply and demand relationship from 1977 to 1998. Instead, the tightening of suppliesthroughout the WSCC during this period primarily reflects increases in consumption and peakdemand in other states and a region-wide decline in new capacity additions relative to thoseincreases in consumption. Above-average hydropower production (especially in the PacificNorthwest) between 1996 and 1999 masked this shift, then hydropower availability decreasedsignificantly in 2000 (combined with significant increases in consumption in California andthroughout the WSCC) to reveal apparent shortages. This study does not examine production oroperating data, however, so we are unable to address how weather and other factors may haveaffected apparent shortages in 2000 and 2001. This study only addresses installed generatingcapacity.
To summarize, the following trends stand out from our analysis of trends in electricityconsumption, peak demand, and generating capacity in California and the western grid:
• New utility capacity additions dropped off precipitously throughout the west beginningaround 1988-1989, lowering reserve margins and installed capacity per consumption ratios.
• Only two of the eleven western states (Nevada and Idaho) installed more new utility-ownedcapacity during the second decade of the 1977-1998 period than during the first decade.
• California’s installed capacity grew by only 28% from 1977 to 1998 if only utility capacityis included, but a successful QF program added another 10,000 MW of non-utility capacity(resulting in an overall capacity increase of 57%). Oregon and Washington added just over1,000 MW of non-utility capacity, but the other eight states averaged less than 400 MW ofnew non-utility capacity. California therefore added new generating capacity relative toincreases in its consumption at a higher rate than every state except Montana, Utah, andWyoming.

27
• California is the lowest user of electricity per capita and per dollar of gross state product, butthe size of its population and economy mean that it accounts for about two-fifths of WSCCannual consumption and summer peak demand, and about one-third of winter peak demand.
• Annual consumption increased 64% throughout the WSCC from 350,000 GWh in 1977 tonearly 570,000 GWh in 1998, but California’s consumption grew only 44% during thisperiod. Its share of overall WSCC consumption therefore declined from 45% to 40%.
• Non-coincidental summer peak demand increased throughout the WSCC from 1995 to 1999by roughly 13,000 MW, but California accounted for only 5% of the total increase duringthis period.
• Non-coincidental winter peak demand increased throughout the WSCC from 1995/1996 to1999/2000 by roughly 6,700 MW, but California accounted for 45% of the total increaseduring this period.
These findings clearly have important policy implications, but this study is focused only onexploratory compilation and analysis of the historical data for electricity consumption, peakdemand, and generating capacity in California and the western grid. We will leave it to othersand future papers to address the relationship between these data and the electricity crisis thatcontinues to grip California and the west. We are hopeful that this study offers some of thehistorical data necessary to address those policy issues in a well-informed manner.

28
KEY TO ACRONYMS AND REGIONS
AZ/NM/SNV Arizona-New Mexico-Southern Nevada Power Area, subregion ofthe WSCC that also includes the western tip of Texas
CA/MX California-Mexico Power Area, subregion of the WSCC
NWPP Northwest Power Pool, subregion of the WSCC that includesWashington, Oregon, northern California, Idaho, Wyoming,western Montana, northern Nevada, Utah, southwestern SouthDakota, and western Canada
RMPA Rocky Mountain Power Area, subregion of the WSCC that coversColorado
WSCC Western Systems Coordinating Council, one of ten state orregional electricity grids in the United States; see regional map
Northwest region Idaho, Montana, Oregon, and Washington
Rocky Mountain region Colorado, Utah, and WyomingSouthwest region Arizona, New Mexico, and Nevada
GSP gross state product
GWh gigawatt-hour, one billion watt-hours of electricity
$GSP constant dollar of gross state product
kWh kilowatt-hour, one thousand watt-hours of electricity
MW megawatt, one million watts of electricity generation capacity
MWh megawatt-hour, one million watt-hours of electricity

29
REGIONAL ELECTRICITY GRIDS IN NORTH AMERICA
Western Systems Coordinating CouncilBritish Columbia, CanadaAlberta, CanadaWashingtonIdahoWyomingCaliforniaNevadaUtahArizonaOregonWestern MontanaWestern New MexicoWestern tip of TexasSouthwestern tip of South DakotaSouthern tip of Mexico

30
REGIONS OF THE WESTERN SYSTEMS COORDINATING COUNCIL
Western Systems Coordinating CouncilI Northwest Power Pool Area (NWPP)II Rocky Mountain Power Area (RMPA)III Arizona-New Mexico-Southern Nevada Power Area (AZ/NM/SNV)IV California-Mexico Power Area (CA/MX)

31
SOURCES OF DATA
Population
1970-1990 United States Census Bureau, Historical Annual Time Series of StatePopulation Estimates and Demographic Components of Change 1900 to1990: Total Population Estimate, [cited 12 February 2001]; available fromwww.census.gov/population/www/estimates/st_stts.html.
1990-1999 United States Census Bureau, State Population Estimates: Annual TimeSeries, July 1, 1990 to July 1, 1999, ST-99-3, [cited 12 February 2001];available from www.census.gov/population/estimates/state/st-99-3.txt.
2000 United States Census Bureau, Resident Population Census 2000 Results,[cited 12 February 2001]; available fromwww.census.gov/population/www/cen2000/respop.html#t2.
Capacity
Utility United States Department of Energy, Energy Information Administration,Inventory of Electric Utility Power Plants in the United States, DOE/EIA-0095(XX)/1, “Table 17/18. Operable Capacity and Planned CapacityAdditions at U.S. Electric Utilities by Energy Source and State”; recentissues available fromwww.eia.doe.gov/cneaf/electricity/ipp/ipp99_sum.html.
California QF California Energy Commission, Databases, Database of California PowerPlants, [cited 20 June 2001]; available fromhttp://38.144.192.166/database/index.html.
WSCC non-utility United States Department of Energy, Energy Information Administration,Inventory of Nonutility Electric Power Plants in the United States 1998,DOE/EIA-0095(98)/2, “Table 6. Existing Capacity and Planned CapacityAdditions at U.S. Nonutilities by Energy Source and State, 1998”;available fromhttp://www.eia.doe.gov/cneaf/electricity/ipp/ipp_sum2.html.
Peak demand
Western Systems Coordinating Council, Documents and Publications, “WSCC InformationSummary,” [cited 12 February 2001]; available from www.wscc.com.

32
Consumption
United States Department of Energy, Energy Information Administration, Electric PowerAnnual, DOE/EIA-0348(XX/1), “Table 26. Estimated Retail Sales by U.S. Electric Utilities toUltimate Consumers by Sector, Census Division, and State”; recent issues available fromwww.eia.doe.gov/cneaf/electricity/epm/epm_sum.html.
Note: Data from 1983 diverges widely from the year before and after. Typically the value isalways less than one-half and often close to one-quarter of the value of consumption in 1982 and1984. Since this is likely an error in the data, the value has been omitted from the analysis.When necessary, modifications or omissions of other data have been made. These changes donot alter the results of this report.
GSP
United States Department of Commerce, Bureau of Economic Analysis, Regional AccountsData: Gross State Product Data, [cited 12 February 2001]; available fromwww.bea.doc.gov/bea/regional/gsp/.

Chart index
Key to categoriesGroup 1: CA; ID, MT, OR, & WA; AZ, NM, & NV; CO, UT, & WYGroup 2: NWPP, RMPA, AZ/NM/SNV, CA/MXState: AZ, CA, CO, ID, MT, NM, NV, OR, UT, WA, WY
Chart Title X-axis Y-axis CategoryA-1 Consumption by state, 1977-1998 Year Consumption (GWh) StateA-2 Consumption by state, 1977-1998 Year Consumption (GWh) StateA-3 Share of total consumption by state, 1977-1998 Year Amount of total WSCC consumption (GWh) StateA-4 Consumption by region, 1977-1998 Year Consumption (GWh) Group 1A-5 Share of total consumption by region, 1977-1998 Year Amount of total WSCC consumption (GWh) Group 1A-6 Consumption by region, 1982-1998 Year Consumption (GWh) Group 2B-1 Consumption per capita by state, 1977-1998 Year Consumption per capita (MWh/person) State & WSCCB-2 Consumption per capita by state; 1977, 1988, 1998 State Consumption per capita (MWh/person) State & WSCCB-3 Consumption per capita by region; 1977, 1988, 1998 Region Consumption per capita (MWh/person) Group 1 & WSCC
B-4, C-1 Consumption per GSP and per capita by state, 1998 StateConsumption per GSP (kWh/constant dollar)Consumption per capita (MWh/person) State & WSCC
C-2 Consumption per GSP by state, 1977-1998 Year Consumption per GSP (kWh/constant dollar) State & WSCCC-3 Consumption per GSP by state; 1977, 1988, 1998 State Consumption per GSP (kWh/constant dollar) State & WSCCC-4 Consumption per GSP by region; 1977, 1988, 1998 Region Consumption per GSP (kWh/constant dollar) Group 1 & WSCCD-1 Peak incidental demand by region, 1982-1998 Year Peak incidental demand (MW) Group 2D-2 Peak incidental demand by region; 1982, 1990, 1998 Region Peak incidental demand (MW) Group 2D-3 Peak incidental summer demand by region, 1995-1999 Summer Peak incidental demand (MW) Group 2D-4 Peak incidental winter demand by region, 1995-2000 Winter Peak incidental demand (MW) Group 2D-5 Peak incidental summer and winter demand by region, 1995-2000 Season Peak incidental demand (MW) Group 2E-1 Utility capacity by state, 1977-1998 Year Capacity (MW) StateE-2 New utility capacity by state, 1977-1997 Year Capacity added during year (MW) StateE-3 New utility capacity by state, 1977-1998 State Capacity added during period (1977-1998; MW) StateE-4 New utility capacity during ten-year periods by state, 1977-1998 State Capacity added during period (MW) StateE-5 New utility capacity during five-year periods by state, 1977-1998 State Capacity added during period (MW) StateE-6 New utility capacity during five-year periods by state, 1977-1998 State Capacity added during period (MW) StateE-7 Share of total new utility capacity during five-year periods by state, 1977-1998 State Amount of capacity added during period (MW) State & WSCCE-8 New utility capacity during five-year periods by region, 1977-1998 Region Capacity added during period (MW) Group 1

Chart index
Key to categoriesGroup 1: CA; ID, MT, OR, & WA; AZ, NM, & NV; CO, UT, & WYGroup 2: NWPP, RMPA, AZ/NM/SNV, CA/MXState: AZ, CA, CO, ID, MT, NM, NV, OR, UT, WA, WY
Chart Title X-axis Y-axis CategoryE-9 New utility capacity during five-year periods by region, 1977-1998 Region Capacity added during period (MW) Group 1E-10 Utility and QF capacity in California, 1977-1998 Year Capacity (MW) CaliforniaE-11 New utility and QF capacity in California, 1977-1997 Year Capacity added during year (MW) CaliforniaE-12 New utility and QF capacity in California, 1977-1997 Year Capacity added during year (MW) California
E-13New utility capacity during five-year periods by state including QF capacity inCalifornia, 1977-1998 State Capacity added during period (MW) State
E-14New utility capacity during five-year periods by state including QF capacity inCalifornia, 1977-1998 State Capacity added during period (MW) State
E-15 Non-utility capacity by state, 1998 State Capacity (MW) State w/o CAF-1 Utility capacity per consumption by state, 1977-1998 Year Capacity per consumption (MW/GWh) State & WSCCF-2 Utility capacity per consumption by state, 1977-1998 State Capacity per consumption (MW/GWh) State & WSCCF-3 Utility capacity per consumption by region, 1977-1998 Region Capacity per consumption (MW/GWh) Group 1 & WSCC
F-4 New utility capacity per new consumption by state, 1977-1998 StateTotal new capacity per total new consumption duringperiod (1977-1998; MW/GWh) State & WSCC
F-5 New utility capacity per new consumption during five-year periods by state, 1977-1998 StateNew capacity per new consumption during period(MW/GWh) State & WSCC
F-6 New utility capacity per new consumption by region, 1977-1998 RegionTotal new capacity per total new consumption duringperiod (1977-1998; MW/GWh) Group 1 & WSCC
F-7New utility capacity per new consumption during five-year periods by region, 1977-1998 Region
New capacity per new consumption during period(MW/GWh) Group 1 & WSCC

Chart A-1
Consumption by state, 1977-1998
0
50,000
100,000
150,000
200,000
250,000
1977 1979 1981 1983 1985 1987 1989 1991 1993 1995 1997
Year
Co
nsu
mp
tio
n (G
Wh
)
AZ
CA
CO
ID
MT
NM
NV
OR
UT
WA
WY

Chart A-2
Consumption by state, 1977-1998
0
100,000
200,000
300,000
400,000
500,000
600,000
1977 1979 1981 1984 1986 1988 1990 1992 1994 1996 1998
Year
Co
nsu
mp
tio
n (G
Wh
)
WY
NM
NV
UT
MT
ID
CO
AZ
OR
WA
CA

Chart A-3
Share of total consumption by state, 1977-1998
0%
10%
20%
30%
40%
50%
60%
70%
80%
90%
100%
1977 1979 1981 1984 1986 1988 1990 1992 1994 1996 1998
Year
Am
ou
nt
of t
ota
l WSC
C c
on
sum
pti
on
(GW
h)
WY
NM
NV
UT
MT
ID
CO
AZ
OR
WA
CA

Chart A-4
Consumption by region, 1977-1998
-
100,000
200,000
300,000
400,000
500,000
600,000
1977 1979 1981 1984 1986 1988 1990 1992 1994 1996 1998
Year
Co
nsu
mp
tio
n (G
Wh
)
CO, UT, & WY
AZ, NM, & NV
ID, MT, OR, & WA
CA

Chart A-5
Share of total consumption by region, 1977-1998
0%
10%
20%
30%
40%
50%
60%
70%
80%
90%
100%
1977 1979 1981 1984 1986 1988 1990 1992 1994 1996 1998
Year
Am
ou
nt
of t
ota
l WSC
C c
on
sum
pti
on
(GW
h)
CO, UT, & WY
AZ, NM, & NV
ID, MT, OR, & WA
CA

Chart A-6
Consumption by region, 1982-1998
0
50,000
100,000
150,000
200,000
250,000
300,000
350,000
400,000
1982 1984 1986 1988 1990 1992 1994 1996 1998
Year
Co
nsu
mp
tio
n (G
Wh
)
NWPP
RMPA
AZ/NM/SNV
CA/MX

Chart B-1
Consumption per capita by state, 1977-1998
0
5
10
15
20
25
30
1977 1979 1981 1983 1985 1987 1989 1991 1993 1995 1997
Year
Co
nsu
mp
tio
n p
er c
apit
a (M
Wh
/per
son
) AZ
CA
CO
ID
MT
NM
NV
OR
UT
WA
WY
WSCC

Chart B-2
Consumption per capita by state; 1977, 1988, 1998
0
5
10
15
20
25
NM CO UT CA AZ NV MT WY OR ID WA WSCC
State
Co
nsu
mp
tio
n p
er c
apit
a (M
Wh
/per
son
)
1977
1988
1998

Chart B-3
Consumption per capita by region; 1977, 1988, 1998
0
2
4
6
8
10
12
14
16
18
CA ID, MT, OR, & WA AZ, NM, & NV CO, UT, & WY WSCC
Region
Co
nsu
mp
tio
n p
er c
apit
a (M
Wh
/per
son
)
1977
1988
1998

Chart B-4, C-1
Consumption per GSP and per capita by state, 1998
0
0.2
0.4
0.6
0.8
CA
CO UT
NM NV
AZ
OR
WA
WY ID MT
WSC
C
State
Co
nsu
mp
tio
n p
er G
SP (k
Wh
/co
nst
ant
do
llar)
Consumption/GSPConsumption/person
Co
nsu
mp
tio
n p
er c
apit
a (M
Wh
/per
son
)
30
20
10
0

Chart C-2
Consumption per GSP by state, 1977-1998
0
0.2
0.4
0.6
0.8
1
1.2
1.4
1.6
1.8
2
1977 1979 1981 1983 1985 1987 1989 1991 1993 1995 1997
Year
Co
nsu
mp
tio
n p
er G
SP (k
Wh
/co
nst
ant
do
llar)
AZ
CA
CO
ID
MT
NM
NV
OR
UT
WA
WY
WSCC

Chart C-3
Consumption per GSP by state; 1977, 1988, 1998
0
0.2
0.4
0.6
0.8
1
1.2
1.4
1.6
1.8
2
CA CO NM UT WY NV AZ OR MT WA ID WSCC
State
Co
nsu
mp
tio
n p
er G
SP (k
Wh
/co
nst
ant
do
llar)
1977
1988
1998

Chart C-4
Consumption per GSP by region; 1977, 1988, 1998
0
0.2
0.4
0.6
0.8
1
1.2
1.4
1.6
1.8
CA ID, MT, OR, & WA AZ, NM, & NV CO, UT, & WY WSCC
Region
Co
nsu
mp
tio
n p
er G
SP (k
Wh
/co
nst
ant
do
llar)
1977
1988
1998

Chart D-1
Peak incidental demand by region, 1982-1998
0
10,000
20,000
30,000
40,000
50,000
60,000
70,000
1982 1984 1986 1988 1990 1992 1994 1996 1998
Year
Pea
k in
cid
enta
l dem
and
(MW
)
NWPP
RMPA
AZ/NM/SNV
CA/MX

Chart D-2
Peak incidental demand by region; 1982, 1990, 1998
0
10,000
20,000
30,000
40,000
50,000
60,000
70,000
NWPP RMPA AZ/NM/SNV CA/MX
Region
Pea
k in
cid
enta
l dem
and
(MW
)
1982
1990
1998

Chart D-3
Peak incidental summer demand by region, 1995-1999
0
10,000
20,000
30,000
40,000
50,000
60,000
1995 1996 1997 1998 1999
Summer
Pea
k in
cid
enta
l dem
and
(MW
)
NWPP
RMPA
AZ/NM/SNV
CA/MX

Chart D-4
Peak incidental winter demand by region, 1995-2000
0
10,000
20,000
30,000
40,000
50,000
60,000
70,000
1995/1996 1996/1997 1997/1998 1998/1999 1999/2000
Winter
Pea
k in
cid
enta
l dem
and
(MW
)
NWPP
RMPA
AZ/NM/SNV
CA/MX

Chart D-5
Peak incidental summer and winter demand by region, 1995-2000
0
10,000
20,000
30,000
40,000
50,000
60,000
70,000
Summer 1995Winter 1995/1996
Summer 1996Winter 1996/1997
Summer 1997Winter 1997/1998
Summer 1998Winter 1998/1999
Summer 1999Winter 1999/2000
Season
Pea
k in
cid
enta
l dem
and
(MW
) NWPP (summer)
NWPP (winter)
RMPA (summer)
RMPA (winter)
AZ/NM/SNV (summer)
AZ/NM/SNV (winter)
CA/MX (summer)
CA/MX (winter)

Chart E-1
Utility capacity by state, 1977-1998
0
5,000
10,000
15,000
20,000
25,000
30,000
35,000
40,000
45,000
50,000
1977 1979 1981 1983 1985 1987 1989 1991 1993 1995 1997
Year
Cap
acit
y (M
W)
AZ
CA
CO
ID
MT
NM
NV
OR
UT
WA
WY

Chart E-2
New utility capacity by state, 1977-1997
-4000
-2000
0
2000
4000
6000
8000
1977 1979 1981 1984 1986 1988 1990 1992 1994 1996
Year
Cap
acit
y ad
ded
du
rin
g y
ear
(MW
)
AZ
CA
CO
ID
MT
NM
NV
OR
UT
WA
WY

Chart E-3
New utility capacity by state, 1977-1998
-
1,000
2,000
3,000
4,000
5,000
6,000
7,000
8,000
9,000
10,000
AZ CA CO ID MT NM NV OR UT WA WY
State
Cap
acit
y ad
ded
du
rin
g p
erio
d (1
97
7-1
99
8; M
W)

Chart E-4
New utility capacity during ten-year periods by state, 1977-1998
(2,000)
-
2,000
4,000
6,000
8,000
10,000
12,000
AZ CA CO ID MT NM NV OR UT WA WY
State
Cap
acit
y ad
ded
du
rin
g p
erio
d (M
W)
1977-1986
1987-1998

Chart E-5
New utility capacity during five-year periods by state, 1977-1998
(2,000)
-
2,000
4,000
6,000
8,000
10,000
12,000
AZ CA CO ID MT NM NV OR UT WA WY
State
Cap
acit
y ad
ded
du
rin
g p
erio
d (M
W)
1993-1998
1987-1992
1982-1986
1977-1981

Chart E-6
New utility capacity during five-year periods by state, 1977-1998
(2,000)
(1,000)
-
1,000
2,000
3,000
4,000
5,000
6,000
7,000
8,000
AZ CA CO ID MT NM NV OR UT WA WY
State
Cap
acit
y ad
ded
du
rin
g p
erio
d (M
W)
1977-1981
1982-1986
1987-1992
1993-1998

Chart E-7
Share of total new utility capacity during five-year periods by state, 1977-1998
-60%
-40%
-20%
0%
20%
40%
60%
80%
100%
AZ CA CO ID MT NM NV OR UT WA WY WSCC
State
Am
ou
nt
of c
apac
ity
add
ed d
uri
ng
per
iod
(MW
)
1993-1998
1987-1992
1982-1986
1977-1981

Chart E-8
New utility capacity during five-year periods by region, 1977-1998
(2,000)
-
2,000
4,000
6,000
8,000
10,000
12,000
14,000
CA ID, MT, OR, & WA AZ, NM, & NV CO, UT, & WY
Region
Cap
acit
y ad
ded
du
rin
g p
erio
d (M
W)
1993-1998
1987-1992
1982-1986
1977-1981

Chart E-9
New utility capacity during five-year periods by region, 1977-1998
(2,000)
(1,000)
-
1,000
2,000
3,000
4,000
5,000
6,000
7,000
8,000
CA ID, MT, OR, & WA AZ, NM, & NV CO, UT, & WY
Region
Cap
acit
y ad
ded
du
rin
g p
erio
d (M
W)
1977-1981
1982-1986
1987-1992
1993-1998

Chart E-10
Utility and QF capacity in California, 1977-1998
0
5,000
10,000
15,000
20,000
25,000
30,000
35,000
40,000
45,000
50,000
1977 1979 1981 1983 1985 1987 1989 1991 1993 1995 1997
Year
Cap
acit
y (M
W)
Utility
QF

Chart E-11
New utility and QF capacity in California, 1977-1997
-2,000
-1,500
-1,000
-500
0
500
1,000
1,500
2,000
2,500
3,000
3,500
1977
1978
1979
1980
1981
1982
1983
1984
1985
1986
1987
1988
1989
1990
1991
1992
1993
1994
1995
1996
1997
Year
Cap
acit
y ad
ded
du
rin
g y
ear
(MW
)
QF
Utility

Chart E-12
New utility and QF capacity in California, 1977-1997
-2,000
-1,000
0
1,000
2,000
3,000
4,000
5,000
1977
1978
1979
1980
1981
1982
1983
1984
1985
1986
1987
1988
1989
1990
1991
1992
1993
1994
1995
1996
1997
Year
Cap
acit
y ad
ded
du
rin
g y
ear
(MW
)
Utility
QF

Chart E-13
New utility capacity during five-year periods by state including QF capacity in California, 1977-1998
-2,000
0
2,000
4,000
6,000
8,000
10,000
12,000
AZ CA CO ID MT NM NV OR UT WA WY
State
Cap
acit
y ad
ded
du
rin
g p
erio
d (M
W)
1977-1981
1982-1986
1987-1992
1993-1998

Chart E-14
New utility capacity during five-year periods by state including QF capacity in California, 1977-1998
-5,000
0
5,000
10,000
15,000
20,000
25,000
AZ CA CO ID MT NM NV OR UT WA WY
State
Cap
acit
y ad
ded
du
rin
g p
erio
d (M
W)
1993-1998
1987-1992
1982-1986
1977-1981

Chart E-15
Non-utility capacity by state, 1998
0
200
400
600
800
1,000
1,200
AZ CO ID MT NM NV OR UT WA WY
State
Cap
acit
y (M
W)

Chart F-1
Utility capacity per consumption by state, 1977-1998
0.1
0.2
0.3
0.4
0.5
0.6
0.7
1977 1979 1981 1983 1985 1987 1989 1991 1993 1995 1997
Year
Cap
acit
y p
er c
on
sum
pti
on
(MW
/GW
h) AZ
CA
CO
ID
MT
NM
NV
OR
UT
WA
WY
WSCC

Chart F-2
Utility capacity per consumption by state, 1977-1998
0
0.1
0.2
0.3
0.4
0.5
0.6
0.7
AZ CA CO ID MT NM NV OR UT WA WY WSCC
State
Cap
acit
y p
er c
on
sum
pti
on
(MW
/GW
h)
1977
1982
1988
1992
1998

Chart F-3
Utility capacity per consumption by region, 1977-1998
0
0.05
0.1
0.15
0.2
0.25
0.3
0.35
0.4
0.45
0.5
CA ID, MT, OR, & WA AZ, NM, & NV CO, UT, & WY WSCC
Region
Cap
acit
y p
er c
on
sum
pti
on
(MW
/GW
h)
1977
1982
1988
1992
1998

Chart F-4
New utility capacity per new consumption by state, 1977-1998
0
0.1
0.2
0.3
0.4
0.5
0.6
AZ CA CO ID MT NM NV OR UT WA WY WSCC
State
Tota
l new
cap
acit
y p
er t
ota
l new
co
nsu
mp
tio
n d
uri
ng
p
erio
d (1
97
7-1
99
8; M
W/G
Wh
)

Chart F-5
New utility capacity per new consumption during five-year periods by state, 1977-1998
-0.8
-0.6
-0.4
-0.2
0
0.2
0.4
0.6
0.8
1
AZ CA CO ID MT NM NV OR UT WA WY WSCC
State
New
cap
acit
y p
er n
ew c
on
sum
pti
on
du
rin
g p
erio
d
(MW
/GW
h)
1977-1981
1982-1986
1987-1992
1993-1998
All years
1.19

Chart F-6
New utility capacity per new consumption by region, 1977-1998
0
0.05
0.1
0.15
0.2
0.25
CA ID, MT, OR, & WA AZ, NM, & NV CO, UT, & WY WSCC
Region
Tota
l new
cap
acit
y p
er t
ota
l new
co
nsu
mp
tio
n
du
rin
g p
erio
d (1
97
7-1
99
8; M
W/G
Wh
)

Chart F-7
New utility capacity per new consumption during five-year periods by region, 1977-1998
-0.1
0
0.1
0.2
0.3
0.4
0.5
0.6
CA ID, MT, OR, &WA
AZ, NM, & NV CO, UT, & WY WSCC
Region
New
cap
acit
y p
er n
ew c
on
sum
pti
on
du
rin
g
per
iod
(MW
/GW
h)
1977-1981
1982-1986
1987-1992
1993-1998
All years

Table index
Key to categoriesGroup 1: CA; ID, MT, OR, WA; AZ, NM, NV; CO, UT, WYGroup 2: NWPP, RMPA, AZ/NM/SNV, CA/MXState: AZ, CA, CO, ID, MT, NM, NV, OR, UT, WA, WY
Table Title Time series CategoryA-1 Consumption by state (gigawatt-hours) 1977-1998 State & WSCCA-2 Consumption by region (gigawatt-hours) 1977-1998 Group 1 & WSCCB-1 Population by state (number of people) 1977-1998 State & WSCCB-2 Consumption per capita by state (megawatt-hours/person) 1977-1998 State & WSCCB-3 Consumption per capita by region (megawatt-hours/person) 1977-1998 Group 1 & WSCCC-1 Gross state product by state (millions of constant dollars) 1977-1998 State & WSCCC-2 Consumption per GSP by state (kilowatt-hours/constant dollar) 1977-1998 State & WSCCC-3 Consumption per GSP by region (kilowatt-hours/constant dollar) 1977-1998 Group 1 & WSCCD-1 Peak annual incidental demand by region (megawatts) 1982-1998 Group 2 & WSCCD-2 Peak seasonal incidental demand by region (megawatts) 1995-2000 Group 2 & WSCCE-1 Utility capacity by state (megawatts) 1977-1998 State & WSCCE-2 Utility capacity by region (megawatts) 1977-1998 Group 1 & WSCCE-3 Capacity in California (megawatts) 1977-1998 CaliforniaE-4 Non-utility capacity in 1998 (megawatts) 1998 State & USE-5 Capacity by state (including QF capacity in California; megawatts) 1977-1998 State & WSCCF-1 Utility capacity per consumption by state (megawatts/gigawatt-hour) 1977-1998 State & WSCCF-2 Utility capacity per consumption by region (megawatts/gigawatt-hour) 1977-1998 Group 1 & WSCCF-3 Capacity per consumption (including QF capacity in California; megawatts/gigawatt-hour) 1977-1998 Group 1 & WSCC

Table A-1
Consumption by state (gigawatt-hours)
AZ CA CO ID MT NM NV OR UT WA WY WSCC1977 23,315 158,800 17,836 13,514 10,013 7,679 8,032 34,288 8,808 58,789 5,418 346,4921978 24,028 162,647 18,908 12,961 10,786 8,050 8,896 36,004 9,748 65,340 6,150 363,5181979 26,052 169,590 20,153 13,988 11,129 8,582 10,340 38,273 10,415 68,551 6,716 383,7891980 26,762 167,567 20,870 13,707 10,825 8,778 10,408 37,848 10,705 69,658 7,196 384,3241981 29,769 174,419 21,145 14,316 10,931 8,944 11,409 37,878 11,502 71,842 7,710 399,8651982 26,863 165,843 23,692 16,117 10,276 8,847 10,568 34,791 12,391 75,549 8,073 393,0101984 30,252 175,197 26,414 16,542 11,466 9,204 11,332 36,302 13,958 83,342 8,396 422,4051985 32,409 178,767 27,264 16,649 11,822 9,570 11,742 34,708 14,428 82,359 8,696 428,4141986 33,968 184,613 27,554 15,767 11,593 11,756 10,966 34,945 13,025 74,618 10,407 429,2121987 36,647 190,324 29,027 16,247 12,616 12,421 13,102 38,491 13,473 78,047 10,921 451,3161988 38,916 200,637 29,335 17,165 12,942 12,755 13,684 39,312 14,507 84,832 10,964 475,0491989 40,748 204,139 30,139 17,821 13,061 13,370 14,968 41,619 14,965 86,674 11,234 488,7381990 41,470 211,093 30,795 18,003 13,125 13,821 16,352 42,977 15,402 91,046 11,769 505,8531991 41,848 208,650 31,457 18,046 13,407 14,084 16,625 43,651 15,907 92,714 11,757 508,1461992 43,651 213,447 31,822 19,008 13,096 14,431 17,696 42,910 16,567 89,319 11,700 513,6471993 44,234 209,971 33,882 18,839 12,966 14,876 18,506 44,036 16,831 88,086 12,036 514,2631994 47,453 211,531 33,639 19,941 13,237 15,703 20,067 44,695 17,860 88,727 11,850 524,7031995 48,295 213,693 34,869 19,389 13,567 16,230 20,582 45,526 18,358 89,322 11,196 531,0271996 51,719 219,802 37,400 21,121 12,413 16,824 22,502 47,391 19,824 86,661 11,624 547,2811997 54,035 223,857 37,667 21,288 12,497 17,307 23,871 47,059 20,449 85,090 12,164 555,2841998 55,843 226,396 39,574 21,276 13,774 18,173 25,037 45,083 20,700 91,050 11,641 568,547
Rank (1-highest)1977 4 1 5 6 7 10 9 3 8 2 111998 3 1 5 7 10 9 6 4 8 2 11
Share of total1977 6.7% 45.8% 5.1% 3.9% 2.9% 2.2% 2.3% 9.9% 2.5% 17.0% 1.6%1998 9.8% 39.8% 7.0% 3.7% 2.4% 3.2% 4.4% 7.9% 3.6% 16.0% 2.0%
Total increasePercent 139.5% 42.6% 121.9% 57.4% 37.6% 136.7% 211.7% 31.5% 135.0% 54.9% 114.9% 64.1%Absolute 32,528 67,596 21,738 7,762 3,761 10,494 17,005 10,795 11,892 32,261 6,223 222,055
Average annual growth rate4.2% 1.7% 3.9% 2.2% 1.5% 4.2% 5.6% 1.3% 4.2% 2.1% 3.7% 2.4%

Table A-2
Consumption by region (gigawatt-hours)
CA ID, MT, OR, & WA AZ, NM, & NV CO, UT, & WY WSCC1977 158,800 116,604 39,026 32,062 346,4921978 162,647 125,091 40,974 34,806 363,5181979 169,590 131,941 44,974 37,284 383,7891980 167,567 132,038 45,948 38,771 384,3241981 174,419 134,967 50,122 40,357 399,8651982 165,843 136,733 46,278 44,156 393,0101984 175,197 147,652 50,788 48,768 422,4051985 178,767 145,538 53,721 50,388 428,4141986 184,613 136,923 56,690 50,986 429,2121987 190,324 145,401 62,170 53,421 451,3161988 200,637 154,251 65,355 54,806 475,0491989 204,139 159,175 69,086 56,338 488,7381990 211,093 165,151 71,643 57,966 505,8531991 208,650 167,818 72,557 59,121 508,1461992 213,447 164,333 75,778 60,089 513,6471993 209,971 163,927 77,616 62,749 514,2631994 211,531 166,600 83,223 63,349 524,7031995 213,693 167,804 85,107 64,423 531,0271996 219,802 167,586 91,045 68,848 547,2811997 223,857 165,934 95,213 70,280 555,2841998 226,396 171,183 99,053 71,915 568,547
Rank (1-highest)1977 1 2 3 41998 1 2 3 4
Share of total1977 45.8% 33.7% 11.3% 9.3%1998 39.8% 30.1% 17.4% 12.6%
Total increasePercent 42.6% 46.8% 153.8% 124.3% 64.1%Absolute 67,596 54,579 60,027 39,853 222,055

Table B-1
Population by state (number of people)
AZ CA CO ID MT NM NV OR UT WA WY WSCC1977 2,425,197 22,352,396 2,696,140 883,469 769,953 1,215,720 678,333 2,446,673 1,319,512 3,776,050 413,354 38,976,7971978 2,515,316 22,835,958 2,766,748 910,690 782,317 1,238,034 719,436 2,518,298 1,367,510 3,889,073 432,880 39,976,2601979 2,635,571 23,256,880 2,849,234 932,627 787,305 1,284,722 765,367 2,588,012 1,420,238 4,017,632 454,378 40,991,9661980 2,718,215 23,667,902 2,889,964 943,935 786,690 1,302,894 800,493 2,633,105 1,461,037 4,132,156 469,557 41,805,9481981 2,810,107 24,285,933 2,977,898 962,204 795,328 1,332,748 847,655 2,667,982 1,515,471 4,235,731 491,712 42,922,7691982 2,889,861 24,820,009 3,061,564 973,721 803,986 1,363,823 881,537 2,664,922 1,558,314 4,276,552 506,400 43,800,6891983 2,968,925 25,360,026 3,133,630 981,869 814,031 1,394,361 901,977 2,653,066 1,594,943 4,300,266 510,345 44,613,4391984 3,067,135 25,844,393 3,169,992 990,839 820,905 1,416,717 924,922 2,666,588 1,622,342 4,343,656 504,896 45,372,3851985 3,183,538 26,441,109 3,208,723 994,051 822,320 1,438,361 951,030 2,672,652 1,642,910 4,400,098 499,695 46,254,4871986 3,308,262 27,102,237 3,237,450 990,224 813,739 1,462,729 980,613 2,683,528 1,662,834 4,452,720 495,633 47,189,9691987 3,437,103 27,777,158 3,260,480 984,997 805,063 1,478,520 1,023,376 2,700,991 1,678,119 4,531,901 476,965 48,154,6731988 3,535,183 28,464,249 3,262,281 985,664 800,202 1,490,337 1,075,022 2,741,297 1,689,372 4,639,893 465,101 49,148,6011989 3,622,185 29,218,164 3,275,818 994,416 799,636 1,503,901 1,137,382 2,790,575 1,705,864 4,746,316 458,374 50,252,6311990 3,665,228 29,760,021 3,294,394 1,006,749 799,065 1,515,069 1,201,833 2,842,321 1,722,850 4,866,692 453,588 51,127,8101991 3,762,394 30,414,114 3,367,567 1,038,915 807,837 1,547,115 1,285,046 2,918,745 1,771,941 5,013,443 457,739 52,384,8561992 3,867,333 30,875,920 3,459,995 1,066,490 822,436 1,580,750 1,330,694 2,973,934 1,821,498 5,139,011 463,491 53,401,5521993 3,993,390 31,147,208 3,560,884 1,101,204 839,876 1,614,937 1,380,197 3,034,490 1,875,993 5,247,704 469,033 54,264,9161994 4,147,561 31,317,179 3,653,910 1,135,459 854,923 1,653,329 1,456,388 3,087,142 1,930,436 5,334,896 474,982 55,046,2051995 4,306,908 31,493,525 3,738,061 1,165,000 868,522 1,682,417 1,525,777 3,141,421 1,976,774 5,431,024 478,447 55,807,8761996 4,432,308 31,780,829 3,812,716 1,187,706 876,656 1,706,151 1,596,476 3,195,087 2,022,253 5,509,963 480,085 56,600,2301997 4,552,207 32,217,708 3,891,293 1,210,638 878,706 1,722,939 1,675,581 3,243,254 2,065,397 5,604,105 480,031 57,541,8591998 4,667,277 32,682,794 3,968,967 1,230,923 879,533 1,733,535 1,743,772 3,282,055 2,100,562 5,687,832 480,045 58,457,295
Rank (1-highest)1977 5 1 3 8 9 7 10 4 6 2 111998 3 1 4 9 10 8 7 5 6 2 11
Share of total1977 6.2% 57.3% 6.9% 2.3% 2.0% 3.1% 1.7% 6.3% 3.4% 9.7% 1.1%1998 8.0% 55.9% 6.8% 2.1% 1.5% 3.0% 3.0% 5.6% 3.6% 9.7% 0.8%
Total increasePercent 92.4% 46.2% 47.2% 39.3% 14.2% 42.6% 157.1% 34.1% 59.2% 50.6% 16.1% 50.0%Absolute 2,242,080 10,330,398 1,272,827 347,454 109,580 517,815 1,065,439 835,382 781,050 1,911,782 66,691 19,480,498
Average annual growth rate3.2% 1.8% 1.9% 1.6% 0.6% 1.7% 4.6% 1.4% 2.2% 2.0% 0.7% 1.9%

Table B-2
Consumption per capita by state (megawatt-hours/person)
AZ CA CO ID MT NM NV OR UT WA WY WSCC1977 9.61 7.10 6.62 15.30 13.00 6.32 11.84 14.01 6.68 15.57 13.11 8.891978 9.55 7.12 6.83 14.23 13.79 6.50 12.37 14.30 7.13 16.80 14.21 9.091979 9.88 7.29 7.07 15.00 14.14 6.68 13.51 14.79 7.33 17.06 14.78 9.361980 9.85 7.08 7.22 14.52 13.76 6.74 13.00 14.37 7.33 16.86 15.33 9.191981 10.59 7.18 7.10 14.88 13.74 6.71 13.46 14.20 7.59 16.96 15.68 9.321982 9.30 6.68 7.74 16.55 12.78 6.49 11.99 13.06 7.95 17.67 15.94 8.971984 9.86 6.78 8.33 16.69 13.97 6.50 12.25 13.61 8.60 19.19 16.63 9.311985 10.18 6.76 8.50 16.75 14.38 6.65 12.35 12.99 8.78 18.72 17.40 9.261986 10.27 6.81 8.51 15.92 14.25 8.04 11.18 13.02 7.83 16.76 21.00 9.101987 10.66 6.85 8.90 16.49 15.67 8.40 12.80 14.25 8.03 17.22 22.90 9.371988 11.01 7.05 8.99 17.41 16.17 8.56 12.73 14.34 8.59 18.28 23.57 9.671989 11.25 6.99 9.20 17.92 16.33 8.89 13.16 14.91 8.77 18.26 24.51 9.731990 11.31 7.09 9.35 17.88 16.43 9.12 13.61 15.12 8.94 18.71 25.95 9.891991 11.12 6.86 9.34 17.37 16.60 9.10 12.94 14.96 8.98 18.49 25.68 9.701992 11.29 6.91 9.20 17.82 15.92 9.13 13.30 14.43 9.10 17.38 25.24 9.621993 11.08 6.74 9.52 17.11 15.44 9.21 13.41 14.51 8.97 16.79 25.66 9.481994 11.44 6.75 9.21 17.56 15.48 9.50 13.78 14.48 9.25 16.63 24.95 9.531995 11.21 6.79 9.33 16.64 15.62 9.65 13.49 14.49 9.29 16.45 23.40 9.521996 11.67 6.92 9.81 17.78 14.16 9.86 14.09 14.83 9.80 15.73 24.21 9.671997 11.87 6.95 9.68 17.58 14.22 10.05 14.25 14.51 9.90 15.18 25.34 9.651998 11.96 6.93 9.97 17.28 15.66 10.48 14.36 13.74 9.85 16.01 24.25 9.73
Rank (1-lowest)1977 5 4 2 10 7 1 6 9 3 11 81998 5 1 3 10 8 4 7 6 2 9 11
Difference from lowest1977 52.2% 12.5% 4.7% 142.2% 105.9% - 87.5% 121.9% 5.7% 146.5% 107.5%1998 72.7% - 43.9% 149.5% 126.1% 51.3% 107.3% 98.3% 42.3% 131.1% 250.1%
Total increasePercent 24.5% -2.5% 50.7% 13.0% 20.4% 66.0% 21.3% -2.0% 47.6% 2.8% 85.0% 9.4%

Table B-3
Consumption per capita by region (megawatt-hours/person)
CA ID, MT, OR, & WA AZ, NM, & NV CO, UT, & WY WSCC1977 7.10 14.80 9.04 7.24 8.891978 7.12 15.44 9.16 7.62 9.091979 7.29 15.85 9.60 7.89 9.361980 7.08 15.54 9.53 8.04 9.191981 7.18 15.58 10.04 8.10 9.321982 6.68 15.68 9.01 8.61 8.971984 6.78 16.74 9.39 9.21 9.311985 6.76 16.37 9.64 9.42 9.261986 6.81 15.32 9.86 9.45 9.101987 6.85 16.11 10.47 9.86 9.371988 7.05 16.83 10.71 10.12 9.671989 6.99 17.06 11.03 10.36 9.731990 7.09 17.36 11.23 10.60 9.891991 6.86 17.16 11.00 10.56 9.701992 6.91 16.43 11.18 10.46 9.621993 6.74 16.03 11.11 10.62 9.481994 6.75 16.00 11.47 10.45 9.531995 6.79 15.82 11.32 10.40 9.521996 6.92 15.56 11.77 10.90 9.671997 6.95 15.17 11.98 10.92 9.651998 6.93 15.45 12.16 10.98 9.73
Rank (1-lowest)1977 1 4 3 21998 1 4 3 2
Difference from lowest1977 - 108.4% 27.2% 1.9% 25.1%1998 - 123.0% 75.6% 58.5% 40.4%
Total increasePercent -2.5% 4.4% 34.6% 51.7% 9.4%

Table C-1
Gross state product by state (millions of constant dollars)
AZ CA CO ID MT NM NV OR UT WA WY WSCC1977 19,214 229,311 25,216 7,035 6,370 10,403 7,494 22,310 10,426 35,965 5,681 379,4251978 22,823 263,435 29,396 8,323 7,494 11,921 9,105 25,908 12,114 42,014 6,897 439,4301979 27,154 294,882 33,956 9,190 8,248 13,587 10,634 29,083 13,858 48,181 8,320 497,0931980 30,231 327,907 38,446 9,816 9,016 16,186 12,047 30,700 15,479 51,964 10,779 552,5711981 33,405 368,301 44,071 10,533 10,311 19,068 13,626 32,081 17,542 57,694 13,256 619,8881982 34,307 392,914 47,649 10,506 10,361 19,913 14,237 31,899 18,573 60,731 13,056 654,1461983 38,252 425,811 50,484 11,580 10,677 20,564 15,316 33,890 19,878 65,380 12,212 704,0441984 44,471 484,068 56,013 12,483 11,256 22,263 16,908 37,821 22,257 71,086 12,932 791,5581985 49,261 528,950 59,034 12,979 11,211 23,481 18,417 39,923 24,094 74,494 13,022 854,8661986 54,615 567,025 59,914 13,083 11,257 22,539 20,030 42,004 24,453 80,462 11,224 906,6061987 58,996 624,022 63,346 13,814 11,629 23,154 22,156 45,046 25,177 86,898 11,084 985,3221988 63,328 684,452 66,720 15,036 11,887 24,032 25,389 49,715 27,215 95,651 11,668 1,075,0931989 65,938 742,866 70,004 16,689 12,826 25,479 28,473 53,522 28,683 104,758 12,011 1,161,2491990 68,780 798,237 74,649 17,714 13,449 27,151 31,630 57,853 31,325 115,642 13,416 1,249,8461991 71,798 814,216 79,396 18,627 14,088 30,835 33,652 60,666 33,626 122,597 13,532 1,293,0331992 78,930 830,950 85,786 20,326 15,097 32,824 36,468 64,297 35,632 130,772 13,535 1,344,6171993 85,442 846,994 93,553 22,662 16,148 37,021 39,844 70,050 38,407 138,379 14,360 1,402,8601994 95,780 878,124 101,636 24,773 17,023 41,651 44,842 75,328 42,295 146,543 14,871 1,482,8661995 104,638 924,582 109,198 27,020 17,664 42,016 49,094 81,301 46,424 151,469 15,697 1,569,1031996 113,099 971,777 117,470 27,948 18,214 43,825 54,033 91,902 51,631 161,954 17,059 1,668,9121997 123,132 1,043,669 129,653 29,086 19,060 46,484 58,488 98,837 56,062 176,226 17,770 1,798,4671998 133,801 1,118,945 141,791 30,936 19,861 47,736 63,044 104,771 59,624 192,864 17,530 1,930,903
Rank (1-highest)1977 5 1 3 9 10 7 8 4 6 2 111998 4 1 3 9 10 8 6 5 7 2 11
Share of total1977 5.1% 60.4% 6.6% 1.9% 1.7% 2.7% 2.0% 5.9% 2.7% 9.5% 1.5%1998 6.9% 57.9% 7.3% 1.6% 1.0% 2.5% 3.3% 5.4% 3.1% 10.0% 0.9%
Total increasePercent 596.4% 388.0% 462.3% 339.7% 211.8% 358.9% 741.3% 369.6% 471.9% 436.3% 208.6% 408.9%Absolute 114,587 889,634 116,575 23,901 13,491 37,333 55,550 82,461 49,198 156,899 11,849 1,551,478

Table C-2
Consumption per GSP by state (kilowatt-hours/constant dollar)
AZ CA CO ID MT NM NV OR UT WA WY WSCC1977 1.21 0.69 0.71 1.92 1.57 0.74 1.07 1.54 0.84 1.63 0.95 0.911978 1.05 0.62 0.64 1.56 1.44 0.68 0.98 1.39 0.80 1.56 0.89 0.831979 0.96 0.58 0.59 1.52 1.35 0.63 0.97 1.32 0.75 1.42 0.81 0.771980 0.89 0.51 0.54 1.40 1.20 0.54 0.86 1.23 0.69 1.34 0.67 0.701981 0.89 0.47 0.48 1.36 1.06 0.47 0.84 1.18 0.66 1.25 0.58 0.651982 0.78 0.42 0.50 1.53 0.99 0.44 0.74 1.09 0.67 1.24 0.62 0.601984 0.68 0.36 0.47 1.33 1.02 0.41 0.67 0.96 0.63 1.17 0.65 0.531985 0.66 0.34 0.46 1.28 1.05 0.41 0.64 0.87 0.60 1.11 0.67 0.501986 0.62 0.33 0.46 1.21 1.03 0.52 0.55 0.83 0.53 0.93 0.93 0.471987 0.62 0.30 0.46 1.18 1.08 0.54 0.59 0.85 0.54 0.90 0.99 0.461988 0.61 0.29 0.44 1.14 1.09 0.53 0.54 0.79 0.53 0.89 0.94 0.441989 0.62 0.27 0.43 1.07 1.02 0.52 0.53 0.78 0.52 0.83 0.94 0.421990 0.60 0.26 0.41 1.02 0.98 0.51 0.52 0.74 0.49 0.79 0.88 0.401991 0.58 0.26 0.40 0.97 0.95 0.46 0.49 0.72 0.47 0.76 0.87 0.391992 0.55 0.26 0.37 0.94 0.87 0.44 0.49 0.67 0.46 0.68 0.86 0.381993 0.52 0.25 0.36 0.83 0.80 0.40 0.46 0.63 0.44 0.64 0.84 0.371994 0.50 0.24 0.33 0.80 0.78 0.38 0.45 0.59 0.42 0.61 0.80 0.351995 0.46 0.23 0.32 0.72 0.77 0.39 0.42 0.56 0.40 0.59 0.71 0.341996 0.46 0.23 0.32 0.76 0.68 0.38 0.42 0.52 0.38 0.54 0.68 0.331997 0.44 0.21 0.29 0.73 0.66 0.37 0.41 0.48 0.36 0.48 0.68 0.311998 0.42 0.20 0.28 0.69 0.69 0.38 0.40 0.43 0.35 0.47 0.66 0.29
Rank (1-lowest)1977 7 1 2 11 9 3 6 8 4 10 51998 6 1 2 10 11 4 5 7 3 8 9
Difference from lowest1977 75.2% - 2.1% 177.4% 127.0% 6.6% 54.8% 121.9% 22.0% 136.0% 37.7%1998 106.3% - 37.9% 239.9% 242.8% 88.2% 96.3% 112.7% 71.6% 133.3% 228.2%
Total increasePercent -65.6% -70.8% -60.5% -64.2% -55.9% -48.4% -62.9% -72.0% -58.9% -71.1% -30.4% -67.8%

Table C-3
Consumption per GSP by region (kilowatt-hours/constant dollar)
CA ID, MT, OR, & WA AZ, NM, & NV CO, UT, & WY WSCC1977 0.69 1.63 1.05 0.78 0.911978 0.62 1.49 0.93 0.72 0.831979 0.58 1.39 0.88 0.66 0.771980 0.51 1.30 0.79 0.60 0.701981 0.47 1.22 0.76 0.54 0.651982 0.42 1.20 0.68 0.56 0.601984 0.36 1.11 0.61 0.53 0.531985 0.34 1.05 0.59 0.52 0.501986 0.33 0.93 0.58 0.53 0.471987 0.30 0.92 0.60 0.54 0.461988 0.29 0.90 0.58 0.52 0.441989 0.27 0.85 0.58 0.51 0.421990 0.26 0.81 0.56 0.49 0.401991 0.26 0.78 0.53 0.47 0.391992 0.26 0.71 0.51 0.45 0.381993 0.25 0.66 0.48 0.43 0.371994 0.24 0.63 0.46 0.40 0.351995 0.23 0.60 0.43 0.38 0.341996 0.23 0.56 0.43 0.37 0.331997 0.21 0.51 0.42 0.35 0.311998 0.20 0.49 0.40 0.33 0.29
Rank (1-lowest)1977 1 4 3 21998 1 4 3 2
Difference from lowest1977 - 134.9% 51.9% 12.0% 31.9%1998 - 142.8% 100.2% 62.3% 45.5%
Total increasePercent -70.8% -69.8% -61.5% -57.7% -67.8%

Table D-1
Peak annual incidental demand by region (megawatts)
NWPP RMPA AZ/NM/SNV CA/MX WSCC1982 43,700 5,410 8,710 35,800 84,1001983 46,700 5,590 8,900 37,500 88,4001984 44,800 5,700 9,380 40,900 89,2001985 45,300 5,740 10,070 42,700 93,2001986 42,600 5,900 10,350 41,600 91,8001987 44,500 6,020 12,410 40,800 94,0001988 45,900 6,100 13,240 44,800 101,9001989 52,700 6,330 14,470 43,000 103,0001990 56,100 6,790 14,990 47,800 110,0001991 51,900 6,490 14,450 44,300 107,9001992 51,800 6,380 15,670 48,200 112,3001993 54,100 6,730 15,960 46,800 111,0001994 53,000 6,960 17,130 49,600 115,8001995 52,600 7,270 17,890 49,200 117,4001996 57,200 7,430 18,700 51,300 123,4001997 55,300 7,930 19,030 53,200 124,9001998 60,000 7,980 20,430 55,400 131,700
Total increasePercent 37.3% 47.5% 134.6% 54.7% 56.6%Absolute 16,300 2,570 11,720 19,600 47,600
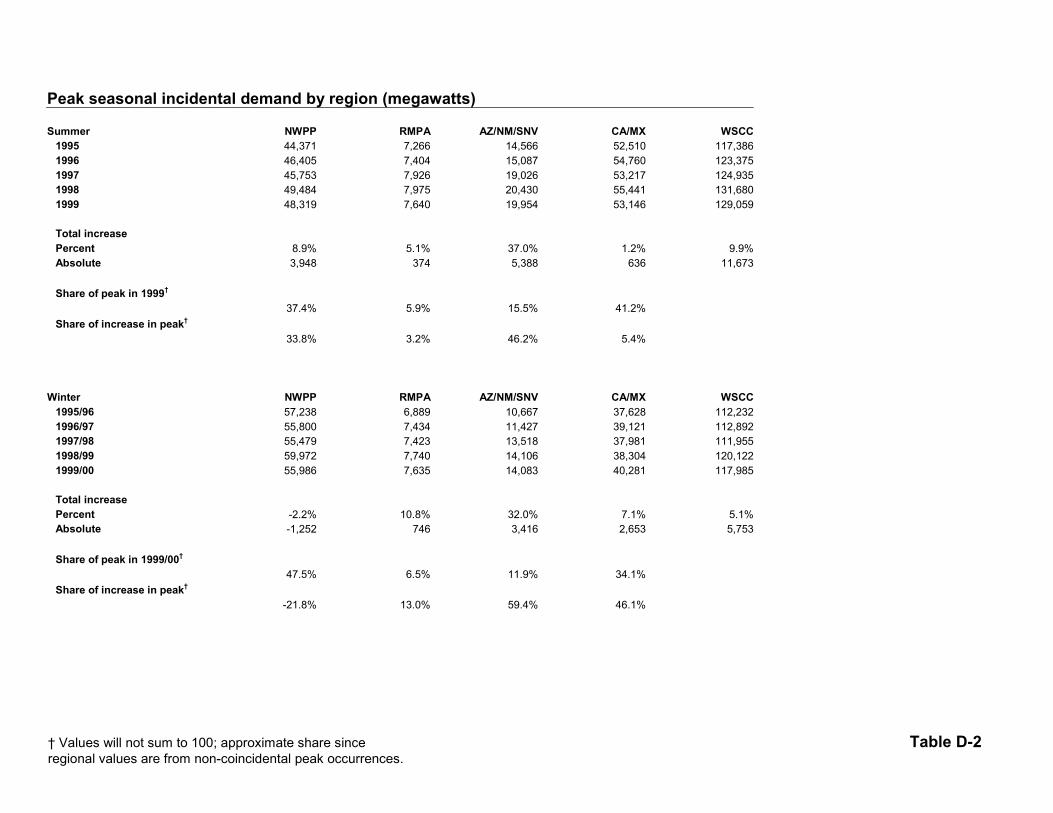
† Values will not sum to 100; approximate share since Table D-2regional values are from non-coincidental peak occurrences.
Peak seasonal incidental demand by region (megawatts)
Summer NWPP RMPA AZ/NM/SNV CA/MX WSCC1995 44,371 7,266 14,566 52,510 117,3861996 46,405 7,404 15,087 54,760 123,3751997 45,753 7,926 19,026 53,217 124,9351998 49,484 7,975 20,430 55,441 131,6801999 48,319 7,640 19,954 53,146 129,059
Total increasePercent 8.9% 5.1% 37.0% 1.2% 9.9%Absolute 3,948 374 5,388 636 11,673
Share of peak in 1999†
37.4% 5.9% 15.5% 41.2%Share of increase in peak†
33.8% 3.2% 46.2% 5.4%
Winter NWPP RMPA AZ/NM/SNV CA/MX WSCC1995/96 57,238 6,889 10,667 37,628 112,2321996/97 55,800 7,434 11,427 39,121 112,8921997/98 55,479 7,423 13,518 37,981 111,9551998/99 59,972 7,740 14,106 38,304 120,1221999/00 55,986 7,635 14,083 40,281 117,985
Total increasePercent -2.2% 10.8% 32.0% 7.1% 5.1%Absolute -1,252 746 3,416 2,653 5,753
Share of peak in 1999/00†
47.5% 6.5% 11.9% 34.1%Share of increase in peak†
-21.8% 13.0% 59.4% 46.1%

Table E-1
Utility capacity by state (megawatts)
AZ CA CO ID MT NM NV OR UT WA WY WSCC1977 9,111 34,724 4,559 1,739 3,049 4,314 2,742 9,620 1,117 15,779 3,312 90,0661978 8,227 35,716 4,363 1,842 3,233 4,331 3,508 9,510 1,554 16,687 3,318 92,2891979 9,068 37,425 4,664 1,636 3,176 4,410 3,646 10,121 2,107 19,303 3,647 99,2031980 9,667 37,760 5,479 1,472 2,890 5,003 3,676 10,121 2,109 20,219 3,671 102,0671981 10,316 38,120 6,400 1,470 2,890 5,029 3,747 10,877 2,518 20,919 4,328 106,6141982 10,916 38,176 6,242 1,978 3,183 4,988 4,127 8,707 2,580 23,346 5,258 109,5011983 10,862 38,456 6,785 2,002 3,163 5,494 4,262 10,847 2,579 21,530 5,638 111,6181984 10,862 39,847 6,797 2,027 3,212 5,413 4,532 10,609 3,034 21,795 5,846 113,9741985 11,026 41,942 7,493 2,026 4,044 5,648 4,532 10,573 3,044 23,239 5,846 119,4131986 12,089 45,107 7,285 2,040 4,903 5,540 5,554 10,578 3,028 23,739 5,845 125,7071987 13,680 45,045 7,265 2,041 4,903 5,542 2,769 10,578 4,278 23,739 5,845 125,6851988 15,732 45,405 7,231 2,048 4,867 5,512 4,831 10,366 5,087 24,127 5,854 131,0601989 15,923 45,944 7,263 2,089 4,936 5,598 4,993 10,366 5,221 23,276 5,853 131,4621990 16,112 45,876 6,704 2,063 4,929 5,562 5,085 10,606 5,209 23,258 5,865 131,2691991 16,494 44,548 6,722 2,064 4,936 5,502 5,133 10,616 5,247 23,389 6,176 130,8271992 16,488 44,473 6,717 2,063 4,967 5,488 5,374 10,616 5,236 23,615 6,176 131,2131993 16,603 44,370 6,744 2,134 5,002 5,501 5,374 10,628 5,257 23,667 6,197 131,4771994 16,627 44,957 6,757 2,089 5,002 5,501 5,464 9,422 5,273 23,699 6,197 130,9881995 16,682 44,073 6,778 2,318 5,044 5,519 5,714 9,471 5,132 23,880 6,201 130,8121996 16,687 44,071 6,754 2,375 5,096 5,519 5,792 9,814 5,134 23,895 6,283 131,4201997 16,634 44,699 6,907 2,369 5,097 5,521 5,893 9,894 5,130 23,840 6,258 132,2421998 16,642 44,493 6,979 2,393 5,084 5,627 5,901 9,919 5,131 24,590 6,378 133,137
Rank (1-highest)1977 4 1 5 10 8 6 9 3 11 2 71998 3 1 5 11 10 8 7 4 9 2 6
Share of total1977 10.1% 38.6% 5.1% 1.9% 3.4% 4.8% 3.0% 10.7% 1.2% 17.5% 3.7%1998 12.5% 33.4% 5.2% 1.8% 3.8% 4.2% 4.4% 7.5% 3.9% 18.5% 4.8%
Total increasePercent 82.7% 28.1% 53.1% 37.6% 66.7% 30.4% 115.2% 3.1% 359.4% 55.8% 92.6% 47.8%Absolute 7,531 9,769 2,420 654 2,035 1,313 3,159 299 4,014 8,811 3,066 43,071
Average annual growth rate2.9% 1.2% 2.0% 1.5% 2.5% 1.3% 3.7% 0.1% 7.5% 2.1% 3.2% 1.9%

Table E-2
Utility capacity by region (megawatts)
CA ID, MT, OR, & WA AZ, NM, & NV CO, UT, & WY WSCC1977 34,724 30,187 16,167 8,988 90,0661978 35,716 31,272 16,066 9,235 92,2891979 37,425 34,236 17,124 10,418 99,2031980 37,760 34,702 18,346 11,259 102,0671981 38,120 36,156 19,092 13,246 106,6141982 38,176 37,214 20,031 14,080 109,5011983 38,456 37,542 20,618 15,002 111,6181984 39,847 37,643 20,807 15,677 113,9741985 41,942 39,882 21,206 16,383 119,4131986 45,107 41,260 23,183 16,158 125,7071987 45,045 41,261 21,991 17,388 125,6851988 45,405 41,408 26,075 18,172 131,0601989 45,944 40,667 26,514 18,337 131,4621990 45,876 40,856 26,759 17,778 131,2691991 44,548 41,005 27,129 18,145 130,8271992 44,473 41,261 27,350 18,129 131,2131993 44,370 41,431 27,478 18,198 131,4771994 44,957 40,212 27,592 18,227 130,9881995 44,073 40,713 27,915 18,111 130,8121996 44,071 41,180 27,998 18,171 131,4201997 44,699 41,200 28,048 18,295 132,2421998 44,493 41,986 28,170 18,488 133,137
Rank (1-highest)1977 1 2 3 41998 1 2 3 4
Share of total1977 38.6% 33.5% 18.0% 10.0%1998 33.4% 31.5% 21.2% 13.9%
Total increasePercent 28.1% 39.1% 74.2% 105.7% 47.8%Absolute 9,769 11,799 12,003 9,500 43,071

Table E-3
Capacity in California (megawatts)
Utility-owned Qualifying facilities Total1977 34,724 163 34,8871978 35,716 237 35,9531979 37,425 237 37,6621980 37,760 269 38,0281981 38,120 407 38,5271982 38,176 433 38,6091983 38,456 545 39,0011984 39,847 1,030 40,8771985 41,942 1,645 43,5871986 45,107 2,487 47,5941987 45,045 3,599 48,6441988 45,405 5,198 50,6031989 45,944 6,336 52,2801990 45,876 8,109 53,9851991 44,548 9,203 53,7511992 44,473 9,631 54,1041993 44,370 9,859 54,2291994 44,957 9,967 54,9241995 44,073 10,067 54,1401996 44,071 10,196 54,2671997 44,699 10,344 55,0431998 44,493 10,386 54,879
Total increasePercent 28.1% 6287.0% 57.3%Absolute 9,769 10,223 19,992

Table E-4
Non-utility capacity in 1998 (megawatts)
US 98,085AZ 184CA 23,513CO 778ID 452MT 843NM 129NV 259OR 1,006UT 136WA 1,046WY 105

Table E-5
Capacity by state (including QF capacity in California; megawatts)
AZ CA CO ID MT NM NV OR UT WA WY WSCC1977 9,111 34,887 4,559 1,739 3,049 4,314 2,742 9,620 1,117 15,779 3,312 90,2291978 8,227 35,953 4,363 1,842 3,233 4,331 3,508 9,510 1,554 16,687 3,318 92,5261979 9,068 37,662 4,664 1,636 3,176 4,410 3,646 10,121 2,107 19,303 3,647 99,4401980 9,667 38,028 5,479 1,472 2,890 5,003 3,676 10,121 2,109 20,219 3,671 102,3361981 10,316 38,527 6,400 1,470 2,890 5,029 3,747 10,877 2,518 20,919 4,328 107,0211982 10,916 38,609 6,242 1,978 3,183 4,988 4,127 8,707 2,580 23,346 5,258 109,9341983 10,862 39,001 6,785 2,002 3,163 5,494 4,262 10,847 2,579 21,530 5,638 112,1631984 10,862 40,877 6,797 2,027 3,212 5,413 4,532 10,609 3,034 21,795 5,846 115,0041985 11,026 43,587 7,493 2,026 4,044 5,648 4,532 10,573 3,044 23,239 5,846 121,0581986 12,089 47,594 7,285 2,040 4,903 5,540 5,554 10,578 3,028 23,739 5,845 128,1941987 13,680 48,644 7,265 2,041 4,903 5,542 2,769 10,578 4,278 23,739 5,845 129,2841988 15,732 50,603 7,231 2,048 4,867 5,512 4,831 10,366 5,087 24,127 5,854 136,2581989 15,923 52,280 7,263 2,089 4,936 5,598 4,993 10,366 5,221 23,276 5,853 137,7981990 16,112 53,985 6,704 2,063 4,929 5,562 5,085 10,606 5,209 23,258 5,865 139,3781991 16,494 53,751 6,722 2,064 4,936 5,502 5,133 10,616 5,247 23,389 6,176 140,0301992 16,488 54,104 6,717 2,063 4,967 5,488 5,374 10,616 5,236 23,615 6,176 140,8441993 16,603 54,229 6,744 2,134 5,002 5,501 5,374 10,628 5,257 23,667 6,197 141,3361994 16,627 54,924 6,757 2,089 5,002 5,501 5,464 9,422 5,273 23,699 6,197 140,9551995 16,682 54,140 6,778 2,318 5,044 5,519 5,714 9,471 5,132 23,880 6,201 140,8791996 16,687 54,267 6,754 2,375 5,096 5,519 5,792 9,814 5,134 23,895 6,283 141,6161997 16,634 55,043 6,907 2,369 5,097 5,521 5,893 9,894 5,130 23,840 6,258 142,5861998 16,642 54,879 6,979 2,393 5,084 5,627 5,901 9,919 5,131 24,590 6,378 143,523
Rank (1-highest)1977 4 1 5 10 8 6 9 3 11 2 71998 3 1 5 11 10 8 7 4 9 2 6
Share of total1977 10.1% 38.7% 5.1% 1.9% 3.4% 4.8% 3.0% 10.7% 1.2% 17.5% 3.7%1998 11.6% 38.2% 4.9% 1.7% 3.5% 3.9% 4.1% 6.9% 3.6% 17.1% 4.4%
Total increasePercent 82.7% 57.3% 53.1% 37.6% 66.7% 30.4% 115.2% 3.1% 359.4% 55.8% 92.6% 59.1%Absolute 7,531 19,992 2,420 654 2,035 1,313 3,159 299 4,014 8,811 3,066 53,294

Table F-1
Utility capacity per consumption by state (megawatts/gigawatt-hour)
AZ CA CO ID MT NM NV OR UT WA WY WSCC1977 0.39 0.22 0.26 0.13 0.30 0.56 0.34 0.28 0.13 0.27 0.61 0.261978 0.34 0.22 0.23 0.14 0.30 0.54 0.39 0.26 0.16 0.26 0.54 0.251979 0.35 0.22 0.23 0.12 0.29 0.51 0.35 0.26 0.20 0.28 0.54 0.261980 0.36 0.23 0.26 0.11 0.27 0.57 0.35 0.27 0.20 0.29 0.51 0.271981 0.35 0.22 0.30 0.10 0.26 0.56 0.33 0.29 0.22 0.29 0.56 0.271982 0.41 0.23 0.26 0.12 0.31 0.56 0.39 0.25 0.21 0.31 0.65 0.281984 0.36 0.23 0.26 0.12 0.28 0.59 0.40 0.29 0.22 0.26 0.70 0.271985 0.34 0.23 0.27 0.12 0.34 0.59 0.39 0.30 0.21 0.28 0.67 0.281986 0.36 0.24 0.26 0.13 0.42 0.47 0.51 0.30 0.23 0.32 0.56 0.291987 0.37 0.24 0.25 0.13 0.39 0.45 0.21 0.27 0.32 0.30 0.54 0.281988 0.40 0.23 0.25 0.12 0.38 0.43 0.35 0.26 0.35 0.28 0.53 0.281989 0.39 0.23 0.24 0.12 0.38 0.42 0.33 0.25 0.35 0.27 0.52 0.271990 0.39 0.22 0.22 0.11 0.38 0.40 0.31 0.25 0.34 0.26 0.50 0.261991 0.39 0.21 0.21 0.11 0.37 0.39 0.31 0.24 0.33 0.25 0.53 0.261992 0.38 0.21 0.21 0.11 0.38 0.38 0.30 0.25 0.32 0.26 0.53 0.261993 0.38 0.21 0.20 0.11 0.39 0.37 0.29 0.24 0.31 0.27 0.51 0.261994 0.35 0.21 0.20 0.10 0.38 0.35 0.27 0.21 0.30 0.27 0.52 0.251995 0.35 0.21 0.19 0.12 0.37 0.34 0.28 0.21 0.28 0.27 0.55 0.251996 0.32 0.20 0.18 0.11 0.41 0.33 0.26 0.21 0.26 0.28 0.54 0.241997 0.31 0.20 0.18 0.11 0.41 0.32 0.25 0.21 0.25 0.28 0.51 0.241998 0.30 0.20 0.18 0.11 0.37 0.31 0.24 0.22 0.25 0.27 0.55 0.23
Rank (1-highest)1977 3 9 8 10 5 2 4 6 11 7 11998 4 9 10 11 2 3 7 8 6 5 1
Difference from highest1977 -36.1% -64.2% -58.2% -78.9% -50.2% -8.1% -44.2% -54.1% -79.3% -56.1% -1998 -45.6% -64.1% -67.8% -79.5% -32.6% -43.5% -57.0% -59.8% -54.8% -50.7% -
Total increasePercent -23.7% -10.1% -31.0% -12.6% 21.2% -44.9% -31.0% -21.6% 95.5% 0.6% -10.4% -9.9%
New capacity/new consumption1977-1998 0.23 0.14 0.11 0.08 0.54 0.13 0.19 0.03 0.34 0.27 0.49 0.19

Table F-2
Utility capacity per consumption by region (megawatts/gigawatt-hour)
CA ID, MT, OR, & WA AZ, NM, & NV CO, UT, & WY WSCC1977 0.22 0.26 0.41 0.28 0.261978 0.22 0.25 0.39 0.27 0.251979 0.22 0.26 0.38 0.28 0.261980 0.23 0.26 0.40 0.29 0.271981 0.22 0.27 0.38 0.33 0.271982 0.23 0.27 0.43 0.32 0.281984 0.23 0.25 0.41 0.32 0.271985 0.23 0.27 0.39 0.33 0.281986 0.24 0.30 0.41 0.32 0.291987 0.24 0.28 0.35 0.33 0.281988 0.23 0.27 0.40 0.33 0.281989 0.23 0.26 0.38 0.33 0.271990 0.22 0.25 0.37 0.31 0.261991 0.21 0.24 0.37 0.31 0.261992 0.21 0.25 0.36 0.30 0.261993 0.21 0.25 0.35 0.29 0.261994 0.21 0.24 0.33 0.29 0.251995 0.21 0.24 0.33 0.28 0.251996 0.20 0.25 0.31 0.26 0.241997 0.20 0.25 0.29 0.26 0.241998 0.20 0.25 0.28 0.26 0.23
Rank (1-highest)1977 4 3 1 21998 4 3 1 2
Difference from highest1977 -47.2% -37.5% - -32.3% -37.3%1998 -30.9% -13.8% - -9.6% -17.7%
Total increasePercent -10.1% -5.3% -31.3% -8.3% -9.9%
New capacity/new consumption1977-1998 0.14 0.22 0.20 0.24 0.19

Table F-3
Capacity per consumption by region (including QF capacity in California; megawatts/gigawatt-hour)
CA ID, MT, OR, & WA AZ, NM, & NV CO, UT, & WY WSCC1977 0.22 0.26 0.41 0.28 0.261978 0.22 0.25 0.39 0.27 0.251979 0.22 0.26 0.38 0.28 0.261980 0.23 0.26 0.40 0.29 0.271981 0.22 0.27 0.38 0.33 0.271982 0.23 0.27 0.43 0.32 0.281984 0.23 0.25 0.41 0.32 0.271985 0.24 0.27 0.39 0.33 0.281986 0.26 0.30 0.41 0.32 0.291987 0.26 0.28 0.35 0.33 0.281988 0.25 0.27 0.40 0.33 0.281989 0.26 0.26 0.38 0.33 0.271990 0.26 0.25 0.37 0.31 0.261991 0.26 0.24 0.37 0.31 0.261992 0.25 0.25 0.36 0.30 0.261993 0.26 0.25 0.35 0.29 0.261994 0.26 0.24 0.33 0.29 0.251995 0.25 0.24 0.33 0.28 0.251996 0.25 0.25 0.31 0.26 0.241997 0.25 0.25 0.29 0.26 0.241998 0.24 0.25 0.28 0.26 0.23
Rank (1-highest)1977 4 3 1 21998 4 3 1 2
Difference from highest1977 -47.0% -37.5% - -32.3% -37.3%1998 -14.8% -13.8% - -9.6% -17.7%
Total increasePercent 10.3% -5.3% -31.3% -8.3% -9.9%