determinants of household electricity consumption in
TRANSCRIPT
RESEARCH Open Access
Determinants of household electricityconsumption in Greece: a statistical analysisDimitra Kotsila1 and Persefoni Polychronidou2,3*
* Correspondence: [email protected] of Economics,International Hellenic University,Serres, Greece3Hellenic Open University, Patras,GreeceFull list of author information isavailable at the end of the article
Abstract
Over the last decades, the contemporary way of living, as well as the technologydevelopment, has increased the household electricity consumption. The excessiveuse of electricity has a negative impact on the environment, increasing the carbonfootprint and contributing to the climate change. Governments are more and moreconcerned about the way our societies consume energy and are committed toreduce the greenhouse emissions. As the residential sector contributes significantlyto energy use, it is crucial to investigate the socio-economic parameters, dwellings’characteristics, and climate conditions that determine the electricity consumption inhouseholds. The data of this study are collected from 1801 dwellings from all regionsof Greece and two statistical models are built. Both of them conclude that the mostsignificant determinants influencing the electricity consumption are the number ofoccupants, the size of the dwelling, the heating type, the heating and cooling hours,and the weather conditions.
Keywords: Electricity, Consumption, Determinants, Socio-economic, Statisticalanalysis
IntroductionIn the last decades due to the increased demand and the improved lifestyle, energy de-
mand in the residential sector has increased rapidly causing the policymakers’ concern.
The international climate negotiation is an opportunity for decision-makers to pro-
mote enhancement of energy efficiency and reduction of greenhouse emissions and set
commitments for renewable energy consumption. The recent “2030 Energy Strategy”
and the Paris climate conference (COP21) focus on the previous objectives to keep a
global temperature rise this century below 2 °C. According to IEA (2020a), based on
the most recent data of 2018 in Greece, the CO2 emissions from fuel combustion only
come from electricity and heat producers (46.8%), transport (27.4%), industry (8.1%),
other energy industries (8.1%), residential (6.5%), commercial and public services
(1.6%), and other (1.6%).
In the last two decades, the Greek governments have given a high priority to the en-
vironmental protection; thus, they promoted the Renewable Energy Sources (RES). The
main aim concerning the RES is to be able to participate in the electricity consumption
for at least 40% by the end of 2020. Specifically, under the European Renewable Energy
© The Author(s). 2021 Open Access This article is licensed under a Creative Commons Attribution 4.0 International License, whichpermits use, sharing, adaptation, distribution and reproduction in any medium or format, as long as you give appropriate credit to theoriginal author(s) and the source, provide a link to the Creative Commons licence, and indicate if changes were made. The images orother third party material in this article are included in the article's Creative Commons licence, unless indicated otherwise in a creditline to the material. If material is not included in the article's Creative Commons licence and your intended use is not permitted bystatutory regulation or exceeds the permitted use, you will need to obtain permission directly from the copyright holder. To view acopy of this licence, visit http://creativecommons.org/licenses/by/4.0/.
Journal of Innovation andEntrepreneurship
Kotsila and Polychronidou Journal of Innovation and Entrepreneurship (2021) 10:19 https://doi.org/10.1186/s13731-021-00161-9
Directive 2009/28/EC (European Parliament and Council, 2009) and the Law 3851/
2010 (Official Government Gazette, 2018), Greece needs to meet the following targets
for RES contribution:
� 20% of the final energy consumption for heating and cooling
� 40% of the final electricity consumption
� 10% of the final energy consumption in transportation
According to the most recent provided data by IEA (2017), Greece has achieved its
goal in the sector of heating and cooling (58.90%), but is far from its aim in the other
two sectors (22.09% and 1.43%, respectively). However, Greece has made an impressive
progress in the electricity sector, thanks to the rapid growth in installed wind and solar
parks and the decrease in the total electricity demand.
In 2019, RES and gas are the primary fuels of electricity production in Greece (IEA,
2020b). In particular, the total electricity production is based on RES (35.2%), gas
(35.2%), coal (22.2%), and oil (9.2%), while in 2017 the corresponding percentages were
the following: RES (25.1%), gas (31%), coal (34%), and oil (10%).
Policymakers must focus on the distribution of the electricity consumption, in order
to detect and improve the most inefficient sectors. In 2018, the distribution of electri-
city consumption per sector has been the following: commercial and public services
(36%), residential (33.9%), industry (25.1%), agriculture/foster (4.6%), and transport
(0.6%); it must be noted that this is similar in the last ten years (IEA, 2020c).
In the residential sector, the final energy consumption is used to heat the space
(57%), for lighting and appliances (20%), for heater heating (12%), for cooking (7%), and
for space cooling (4%) (Eurostat, 2018).
Consumption per capita is an important indicator to observe the tendency of electri-
city consumption through the years, as it offers a clear view of the electricity that every
individual consumes. In Greece, in 2014 the per capita electricity consumption was
5062.61 kWh/capita while in 2010 was 5333.44 kWh/capita and in 2008 was 5805.19
kWh/capita (DataBank, 2020). The economic crisis in Greece since 2008–2009 influ-
enced the electricity consumption as in 2013 the average consumption fell to 5029
kWh/capita. Consumption per household is another indicator to monitor the electricity
consumption in the residential sector. In 2000, the electricity per household (hh) was
3717 kWh/hh, while in 2010 it was 4023 kWh/hh (World Energy Council, 2016).
The increasing trend of electricity consumption is a reality. Since the residential sec-
tor is one of the most demanding sectors regarding electricity consumption, it should
be studied. Unfortunately, in Greece, the socio-economic parameters that influence the
electricity consumption have never been extensively examined. From the previous stud-
ies, that are outlined in the “Literature review” section, the electricity consumption is
relevant with demographic data, dwelling characteristics and geographical and climate
conditions. This study analyzes the aforementioned parameters in Greece and it is
based on real data from 1801 customers of a Greece’s electricity provider. The variables
and the methodology that are used in the current analysis are in line with the deep lit-
erature review that was conducted by Jones et al. (2015).
This paper is organized as follows: in the “Literature review” section, an overview of
the literature review relevant for this study is included. A description of the regression
Kotsila and Polychronidou Journal of Innovation and Entrepreneurship (2021) 10:19 Page 2 of 20
models and the data sources is given in the “Method” section. In the “Results and dis-
cussion” section, the main results are summarized. Finally, the conclusions are pre-
sented in the “Conclusions” section.
Literature reviewOn the international stage, residential electricity consumption is a considerably studied
subject. Relevant studies are sequenced with the oldest first and the most recent last.
Studies regarding European countries
Halicioglu (2007) examines how the energy demand in residential sector in Turkey was
influenced from the price and income. The income positively influences the electricity
demand and accelerates purchases of electrical goods and services. The price of electri-
city negatively influences the electricity demand, while the urbanization positively influ-
ences the electricity demand, as it provides greater access to electricity.
Gram-Hanssen (2011) points out that the user’s practices influence the energy con-
sumption. He examines 8500 detached houses in Denmark and he finds that the in-
come, the size of the house, and the presence of teenagers (13–19 years old) all have a
positive effect on electricity consumption.
Wiesmann et al. (2011) examine the relationship between the per capita electricity
consumption and dwelling characteristics in Portuguese consumers. They conclude that
the income, the appliance ownership, and the floor area have a positive influence on
per capita electricity consumption. People who live in single-family houses and/or in
urban households consume more electricity than those living in a block of flats and/or
rural households. People per household, dwellings per building and more heating
degree-days negatively influence the consumption per capita, since in colder regions
households consume less electricity per capita than those in more moderate climates.
McLoughlin et al. (2012) examine the influence of dwelling and occupant characteris-
tics on electricity consumption of 3941 Irish dwellings. Dwelling type, number of bed-
rooms, age of the head of household, and electrical appliances used for water heating
and cooking have a positive effect on electricity consumption.
Bedir et al. (2013) point out that in Netherlands the household size, the dwelling type,
and the duration of electrical appliances’ use (such as dryers and washing machines)
have significant effect on the electricity consumption. Also, in the Netherlands, Brou-
nen et al. (2012) analyze data of 300,000 dwellings. The dwelling type affects electricity
consumption as the detached and semi-detached houses consume more electricity per
capita than row houses or apartments. Houses with children and especially those that
have teenagers are found to have a positive effect on per capita electricity consumption.
The income has positive influence whereas the number of persons in household has a
negative effect on per capita electricity consumption.
Studies regarding non-European countries
Ndiaye and Gabriel (2011) analyze electricity consumption of 62 dwellings of Oshawa
(Ontario, Canada). Number of residents, house status, type of fuel used to heat the
pool, type of fuel used in the heating system, type of fuel used in the domestic hot
water heater, type of air-conditioning, and number of air changes per hour at 50 Pa are
Kotsila and Polychronidou Journal of Innovation and Entrepreneurship (2021) 10:19 Page 3 of 20
found to have a positive effect on the electricity consumption. On the other hand, the
average number of weeks that the family leaves for vacation and the existence or not of
an air conditioning system have a negative effect on the electricity.
Sanquist et al. (2012) base their research on data from the Residential Energy Consump-
tion Survey (RECS) conducted on 2005 in the USA. The air-conditioning, laundry usage,
personal computers, climate zone of dwelling, and TV use significantly influence the elec-
tricity consumption. Kavousian et al. (2013) examine the residential electricity consump-
tion of 952 US dwellings in a view of daily maximum and minimum. Daily minimum
consumption is influenced by weather, location, dwelling size, and the number of refriger-
ators when daily maximum consumption is influenced by the use of appliances that con-
sume a lot and the number of residents. In the summer model, the primary factor that
influences the electricity consumption is the cooling degrees days.
Tewathia (2014) conducts a survey in Delhi to find the determinants of electricity
consumption. The household income, the number and the usage of electrical appli-
ances, the size of the house, the family size, time spent out of the house, and the higher
educational level influence the monthly electricity consumption through all the seasons.
The educational level has a negative relationship as the higher educated families tend
to consume less electricity. Filippini and Pachauri (2004) analyze the electricity demand
in urban Indian households. The price is inelastic in electricity demand, so the price is
not an inhibiting factor in residential electricity consumption. The income, the size, the
regions, and the degrees of urbanity have a significant influence into the electricity con-
sumption. Dwellings with more residents and younger households head had the ten-
dency to consume less electricity from those that had less elder people.
Jones et al. (2015) conduct a broad literature review to investigate the factors that in-
fluence or not the domestic electricity consumption. They study 62 factors as potential
factors that determine the electricity consumption. In relation to socio-economic fac-
tors, the higher household and disposable income, the more occupants and presence of
teenagers have a positive effect on electricity consumption. In relation to dwelling fac-
tors, the dwelling age, the number of rooms, the number of bedrooms, and the floor
area influence the electricity consumption. Regarding appliance factors, the following
ones have a positive effect: more appliances, the existence of desktop computer, televi-
sion, electric oven, refrigerator, dishwasher, tumble dryer, and higher use of washing
machines and tumble dryer.
Esmaeilimoakher et al. (2016) accomplish an introduction to the factors that influ-
ence the electricity consumption. Their analysis is based on a survey conducted in nine
households of Perth of Western Australia. The main results are that the average annual
electricity consumption per person per m2 floor area (AAEC/P m2) has a negative cor-
relation with the number of occupants and the dwellings size.
Studies regarding Greece
The research in the field of socio-economic determinants that influence electricity con-
sumption in Greece is poor. There are a lot of works focused on macroeconomic fac-
tors that determine energy consumption. Only the study of Sardianou (2007) provides
research that includes demographic data and examines electricity conservation
behavior.
Kotsila and Polychronidou Journal of Innovation and Entrepreneurship (2021) 10:19 Page 4 of 20
Donatos and Mergos (1991) examine the residential electricity demand in Greece
during the period 1961–1986. Data are collected from a public database. It is found
that the electricity demand is price inelastic and income elastic. The sales of appliances,
as well as the heating degrees-days, are found to have an insignificant effect on electri-
city demand in contrast with the number of consumers that has a significant effect.
Hondroyiannis (2004) examines the elasticity of price and income in long-run and
short-run demand for residential electricity. The examined period is 1986–1999
employing monthly data. In the short-run, the electricity demand is income inelastic
and independent of the price, while in the long-run period, all variables, income, price,
and weighted average temperature are found to affect electricity demand.
Polemis and Dagoumas (2013) conduct a similar with Hondroyiannis (2004) research.
They use cointegration techniques and the vector error correction model to observe
the long-run and short-run electricity demand. The data that are taken into account
are for a longer period, from 1970 to 2011. In the long-run, the electricity demand is
price inelastic and income elastic, while in the short-run the relevant elasticities are
inelastic.
Sardianou (2007) investigates the determinants of household energy conservation. The
analysis is based on a survey that has been conducted in 586 households of five main
Athens’ regions. One of the findings is that people with higher income that own their
houses, and have a large family are more willing to conserve energy. Also, the number of
rooms, the dwelling’s size, sex, educational level, and marital status are found that do not
have a significant influence in energy conservation. However, it is found that the larger
electricity expenditures negatively influence the energy conservation behaviors and the
older people are more energy-intensive users than the younger ones.
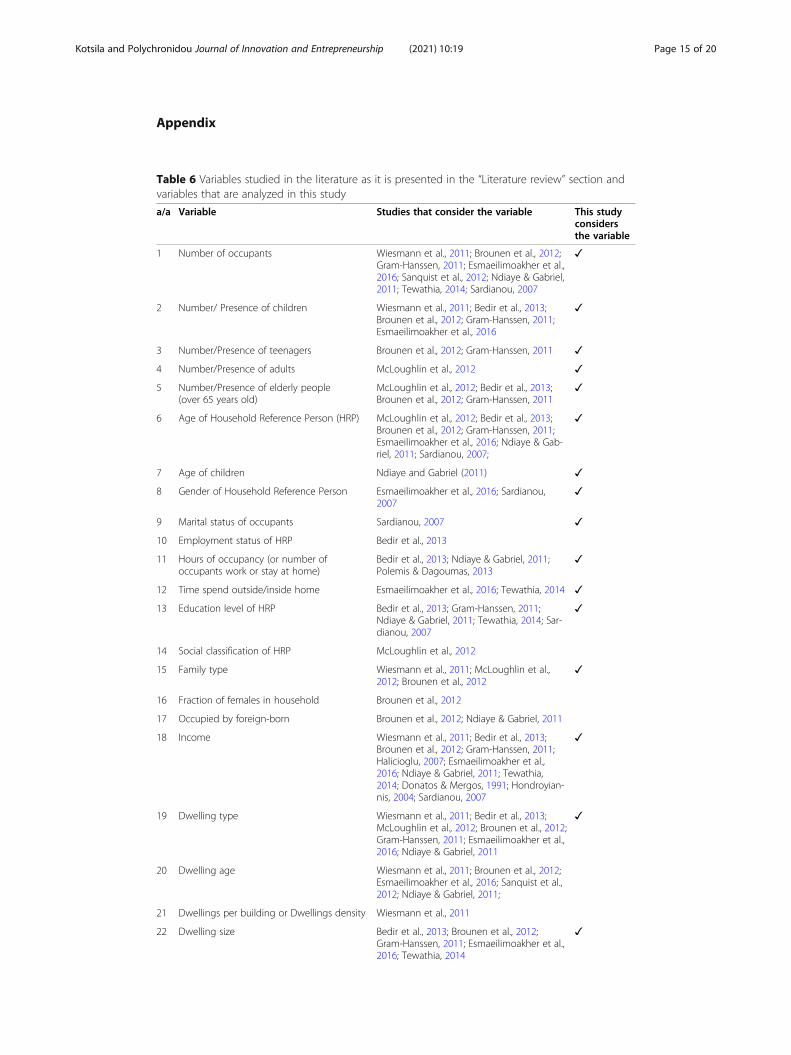
All variables that have been studied in the above papers are indicated in Tables 6 and
7 in the Appendix section. Tables 6 and 7 also present which of these variables have
been studied in this paper.
MethodModel specification
The ordinary least squares (OLS) regression is used to estimate the determinants that
affect the electricity consumption in Greek households. A variety of studies that examined
the determinants of electricity consumption have been conducted using OLS regression
(Bedir et al., 2013; Brounen et al., 2012; Filippini & Pachauri, 2004; Gram-Hanssen, 2011;
Halicioglu, 2007; Kavousian et al., 2013; McLoughlin et al., 2012; Ndiaye & Gabriel, 2011;
Sanquist et al., 2012; Sardianou, 2007; Wiesmann et al., 2011). Two different models are
employed to determine the electricity consumption. More specifically, a simple OLS re-
gression model and a log-linear regression model are used to build the aforementioned
models.
Data sources and description
Data are collected from a Greek electricity provider and refer only to residential dwell-
ings. Data for the consumption and square meters area have been provided through the
actual bills. The period of actual bills is not the same between bills and differs among
dwellings. Thus, in order to calculate the consumption with accuracy, the consumption
Kotsila and Polychronidou Journal of Innovation and Entrepreneurship (2021) 10:19 Page 5 of 20
per day is calculated at first. Afterwards, consumption per month is calculated and only
dwellings that have consumption 2017 are selected.
Demographics and behavior data are retrieved from a questionnaire that was pro-
vided through the electricity provider’s online platform. The questionnaire was an-
swered from every individual that covers the bill. Only dwellings that already had a
monthly consumption for 2017 and have also answered all the questions are selected.
The dwellings with invalid values have been excluded from the data, so the final num-
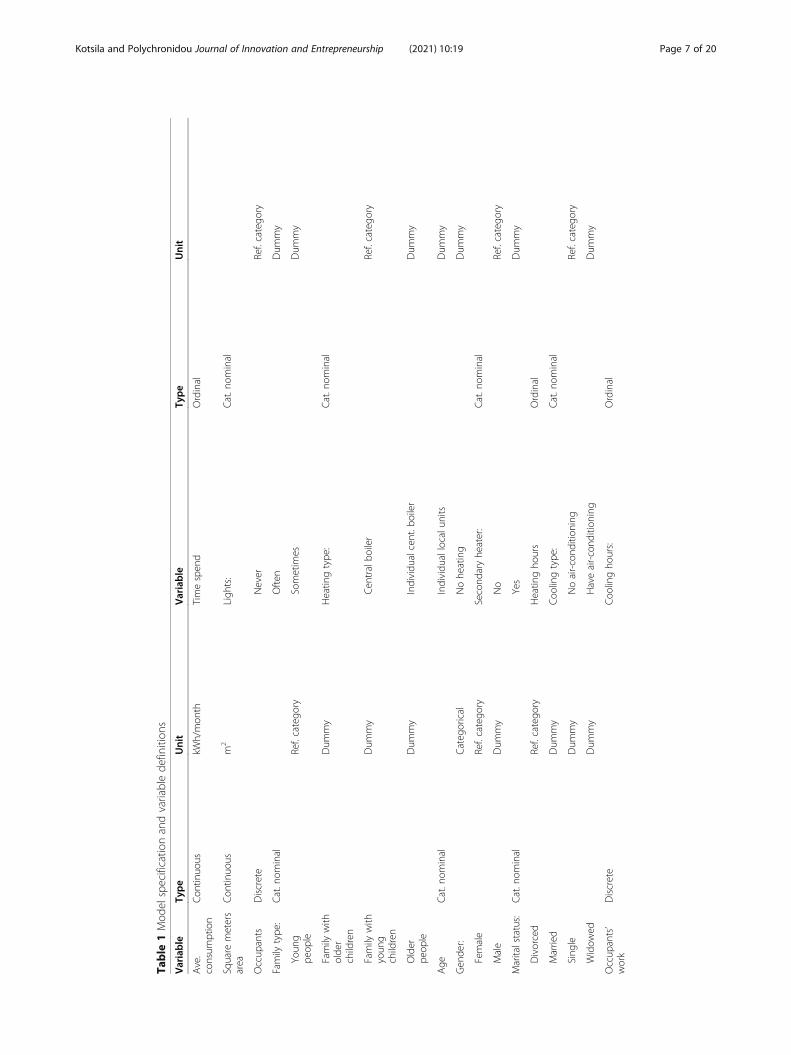
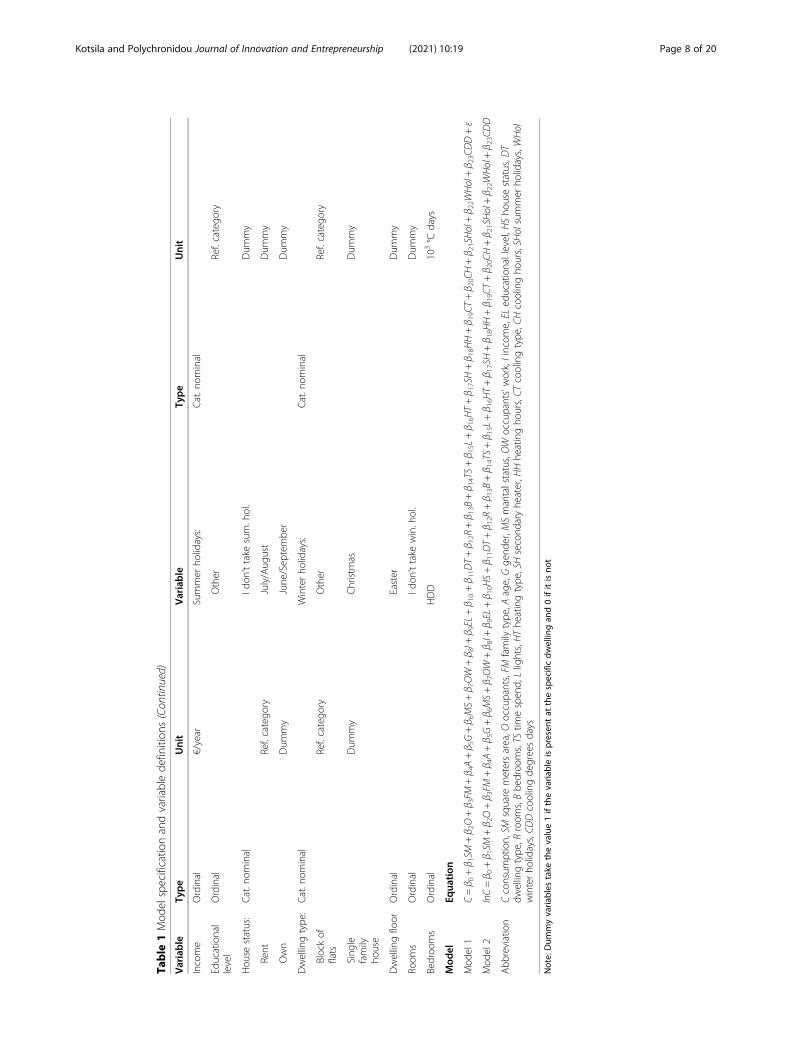
ber of dwellings that are included in the analysis is 1801. Table 1 illustrates all available
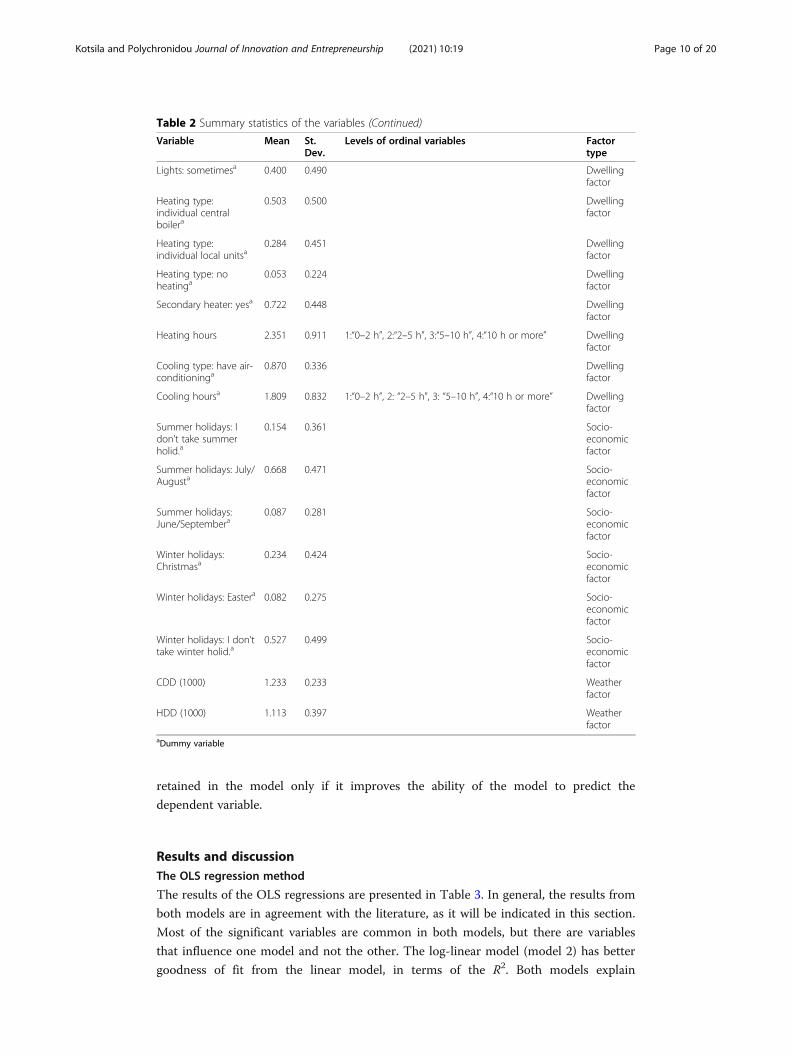
variables, as well as the type and the units of the variables of both models. Table 2 illus-
trates the summary of statistics of the variables of both models and it shows the levels
of ordinal variables and their correspondence to the converted numbers. In addition,
the factor type of each variable is indicated.
In the literature review, we have found out that many studies (Donatos & Mergos,
1991; Kavousian et al., 2013; Ndiaye & Gabriel, 2011; Sanquist et al., 2012; Wiesmann
et al., 2011) include in their models the weather factors of heating degrees-days (HDD)
and cooling degrees-days (CDD). HDD and CDD is the difference, in degrees, of out-
side temperature and base (18.3 °C) temperature. HDD and CDD data for each prefec-
ture and for 2017 have been downloaded from the weather stations of National
Observatory of Athens (NOA). Data have been available in the weather website (www.
meteo.gr) and have been recorded at a daily basis (Petrou, 2018). The yearly HDD and
CDD have been calculated per prefecture and the weather data are then connected to
the consumption data based on prefecture. Units of HDD and CDD are in 1000 °C days
(the values of these variables are big numbers and they should be fitted in the model as
in Wiesmann et al., 2011).
The data preparation, manipulation, visualization, and the regression analysis is con-
ducted using programming language R through RStudio program.
The Model
Before conducting a regression analysis, an advanced statistical analysis is conducted to
observe any associations or correlation between variables. Thus, pairwise comparisons
and a correlation analysis (correlation matrix can be found in Table 8 in the Appendix
section) are used. The insights of the analysis show a very high negative correlation be-
tween HDD and CDD, approximately −0.809 (see Table 8), so HDD is removed from
the model. Furthermore, a high correlation between family type and number of occu-
pants is observed, so family type is removed from the model.
In the sample, the final independent variables along with the dummy variables count
to thirty three (33). It is essential to determine whether the subset of all independent
variables yields to an adequate and appropriate model. Stepwise regression is a method
that attempts to find the best regression model, without examining all the possible
models (Berenson et al., 2014). There are two approaches of stepwise regression, the
“forward selection” and the “backward elimination”. Both approaches use the Akaike
Information Criterion (AIC) to find the best combination of variables based on balan-
cing the model’s complexity and accuracy. The best model is the one with minimum
AIC value. The regression model is built using the forward selection, where an initial
model is defined that contains only the constant and each independent variable is
Kotsila and Polychronidou Journal of Innovation and Entrepreneurship (2021) 10:19 Page 6 of 20
Table
1Mod
elspecificatio
nandvariablede
finition
s
Variable
Type
Unit
Variable
Type
Unit
Ave.
consum
ption
Con
tinuo
uskW
h/mon
thTimespen
dOrdinal
Square
meters
area
Con
tinuo
usm
2Ligh
ts:
Cat.nom
inal
Occup
ants
Discrete
Never
Ref.catego
ry
Family
type
:Cat.nom
inal
Often
Dum
my
Youn
gpe
ople
Ref.catego
rySometim
esDum
my
Family
with
olde
rchildren
Dum
my
Heatin
gtype
:Cat.nom
inal
Family
with
youn
gchildren
Dum
my
Cen
tralbo
iler
Ref.catego
ry
Older
peop
leDum
my
Individu
alcent.b
oiler
Dum
my
Age
Cat.nom
inal
Individu
allocalu
nits
Dum
my
Gen
der:
Categ
orical
Nohe
ating
Dum
my
Female
Ref.catego
rySecond
aryhe
ater:
Cat.nom
inal
Male
Dum
my
No
Ref.catego
ry
Maritalstatus:
Cat.nom
inal
Yes
Dum
my
Divorced
Ref.catego
ryHeatin
gho
urs
Ordinal
Married
Dum
my
Coo
lingtype
:Cat.nom
inal
Sing
leDum
my
Noair-cond
ition
ing
Ref.catego
ry
Widow
edDum
my
Haveair-cond
ition
ing
Dum
my
Occup
ants’
work
Discrete
Coo
lingho
urs:
Ordinal
Kotsila and Polychronidou Journal of Innovation and Entrepreneurship (2021) 10:19 Page 7 of 20
Table
1Mod
elspecificatio
nandvariablede
finition
s(Con
tinued)
Variable
Type
Unit
Variable
Type
Unit
Income
Ordinal
€/year
Summer
holidays:
Cat.nom
inal
Educational
level
Ordinal
Other
Ref.catego
ry
Hou
sestatus:
Cat.nom
inal
Idon
’ttake
sum.hol.
Dum
my
Rent
Ref.catego
ryJuly/Aug
ust
Dum
my
Own
Dum
my
June
/Sep
tembe
rDum
my
Dwellingtype
:Cat.nom
inal
Winterho
lidays:
Cat.nom
inal
Blockof
flats
Ref.catego
ryOther
Ref.catego
ry
Sing
lefamily
house
Dum
my
Christm
asDum
my
Dwellingfloor
Ordinal
Easter
Dum
my
Room
sOrdinal
Idon
’ttake
win.hol.
Dum
my
Bedroo
ms
Ordinal
HDD
103°C
days
Mod
elEq
uation
Mod
el1
C=β 0
+β 1SM
+β 2O+β 3FM
+β 4A+β 5G+β 6MS+β 7OW+β 8I+
β 9EL
+β 1
0+β 1
1DT+β 1
2R+β 1
3B+β 1
4TS+β 1
5L+β 1
6HT+β 1
7SH+β 1
8HH+β 1
9CT+β 2
0CH+β 2
1SHol+β 2
2WHol+β 2
3CDD+ε
Mod
el2
lnC=β 0
+β 1SM
+β 2O+β 3FM
+β 4A+β 5G+β 6MS+β 7OW+β 8I+
β 9EL
+β 1
0HS+β 1
1DT+β 1
2R+β 1
3B+β 1
4TS+β 1
5L+β 1
6HT+β 1
7SH+β 1
8HH+β 1
9CT+β 2
0CH+β 2
1SHol+β 2
2WHol+β 2
3CDD
Abb
reviation
Cconsum
ption,SM
square
metersarea,O
occupants,FM
family
type
,Aage,Gge
nder,M
Smaritalstatus,OW
occupants’work,Iincom
e,EL
educationallevel,H
Sho
usestatus,D
Tdw
ellingtype
,Rroom
s,Bbe
droo
ms,TS
timespen
d,Llights,HThe
atingtype
,SHsecond
aryhe
ater,H
Hhe
atingho
urs,CT
coolingtype
,CHcoolingho
urs,SH
olsummer
holidays,WHol
winterho
lidays,CD
Dcoolingde
greesdays
Note:Dum
myvaria
bles
take
thevalue1ifthevaria
bleispresen
tat
thespecificdw
ellin
gan
d0ifitisno
t
Kotsila and Polychronidou Journal of Innovation and Entrepreneurship (2021) 10:19 Page 8 of 20
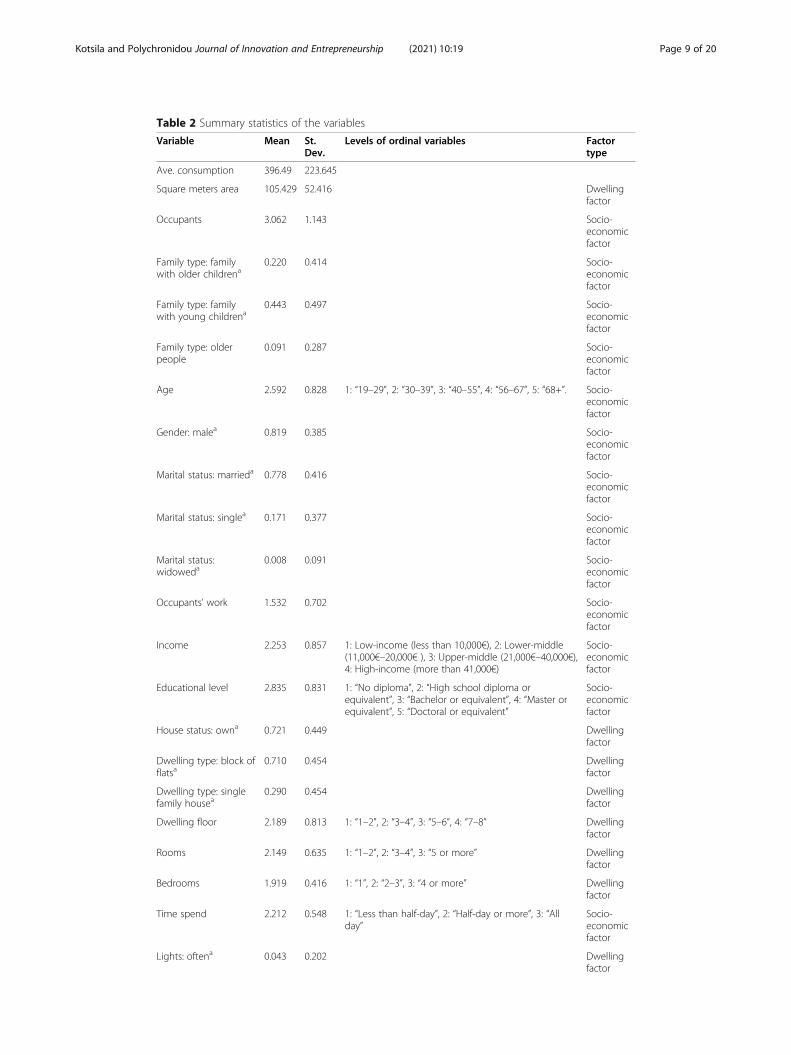
Table 2 Summary statistics of the variables
Variable Mean St.Dev.
Levels of ordinal variables Factortype
Ave. consumption 396.49 223.645
Square meters area 105.429 52.416 Dwellingfactor
Occupants 3.062 1.143 Socio-economicfactor
Family type: familywith older childrena
0.220 0.414 Socio-economicfactor
Family type: familywith young childrena
0.443 0.497 Socio-economicfactor
Family type: olderpeople
0.091 0.287 Socio-economicfactor
Age 2.592 0.828 1: “19–29”, 2: “30–39”, 3: “40–55”, 4: “56–67”, 5: “68+”. Socio-economicfactor
Gender: malea 0.819 0.385 Socio-economicfactor
Marital status: marrieda 0.778 0.416 Socio-economicfactor
Marital status: singlea 0.171 0.377 Socio-economicfactor
Marital status:widoweda
0.008 0.091 Socio-economicfactor
Occupants’ work 1.532 0.702 Socio-economicfactor
Income 2.253 0.857 1: Low-income (less than 10,000€), 2: Lower-middle(11,000€–20,000€ ), 3: Upper-middle (21,000€–40,000€),4: High-income (more than 41,000€)
Socio-economicfactor
Educational level 2.835 0.831 1: “No diploma”, 2: “High school diploma orequivalent”, 3: “Bachelor or equivalent”, 4: “Master orequivalent”, 5: “Doctoral or equivalent”
Socio-economicfactor
House status: owna 0.721 0.449 Dwellingfactor
Dwelling type: block offlatsa
0.710 0.454 Dwellingfactor
Dwelling type: singlefamily housea
0.290 0.454 Dwellingfactor
Dwelling floor 2.189 0.813 1: “1–2”, 2: “3–4”, 3: “5–6”, 4: “7–8” Dwellingfactor
Rooms 2.149 0.635 1: “1–2”, 2: “3–4”, 3: “5 or more” Dwellingfactor
Bedrooms 1.919 0.416 1: “1”, 2: “2–3”, 3: “4 or more” Dwellingfactor
Time spend 2.212 0.548 1: “Less than half-day”, 2: “Half-day or more”, 3: “Allday”
Socio-economicfactor
Lights: oftena 0.043 0.202 Dwellingfactor
Kotsila and Polychronidou Journal of Innovation and Entrepreneurship (2021) 10:19 Page 9 of 20
retained in the model only if it improves the ability of the model to predict the
dependent variable.
Results and discussionThe OLS regression method
The results of the OLS regressions are presented in Table 3. In general, the results from
both models are in agreement with the literature, as it will be indicated in this section.
Most of the significant variables are common in both models, but there are variables
that influence one model and not the other. Τhe log-linear model (model 2) has better
goodness of fit from the linear model, in terms of the R2. Both models explain
Table 2 Summary statistics of the variables (Continued)
Variable Mean St.Dev.
Levels of ordinal variables Factortype
Lights: sometimesa 0.400 0.490 Dwellingfactor
Heating type:individual centralboilera
0.503 0.500 Dwellingfactor
Heating type:individual local unitsa
0.284 0.451 Dwellingfactor
Heating type: noheatinga
0.053 0.224 Dwellingfactor
Secondary heater: yesa 0.722 0.448 Dwellingfactor
Heating hours 2.351 0.911 1:“0–2 h”, 2:“2–5 h”, 3:“5–10 h”, 4:“10 h or more” Dwellingfactor
Cooling type: have air-conditioninga
0.870 0.336 Dwellingfactor
Cooling hoursa 1.809 0.832 1:“0–2 h”, 2: “2–5 h”, 3: “5–10 h”, 4:“10 h or more” Dwellingfactor
Summer holidays: Idon’t take summerholid.a
0.154 0.361 Socio-economicfactor
Summer holidays: July/Augusta
0.668 0.471 Socio-economicfactor
Summer holidays:June/Septembera
0.087 0.281 Socio-economicfactor
Winter holidays:Christmasa
0.234 0.424 Socio-economicfactor
Winter holidays: Eastera 0.082 0.275 Socio-economicfactor
Winter holidays: I don’ttake winter holid.a
0.527 0.499 Socio-economicfactor
CDD (1000) 1.233 0.233 Weatherfactor
HDD (1000) 1.113 0.397 Weatherfactor
aDummy variable
Kotsila and Polychronidou Journal of Innovation and Entrepreneurship (2021) 10:19 Page 10 of 20
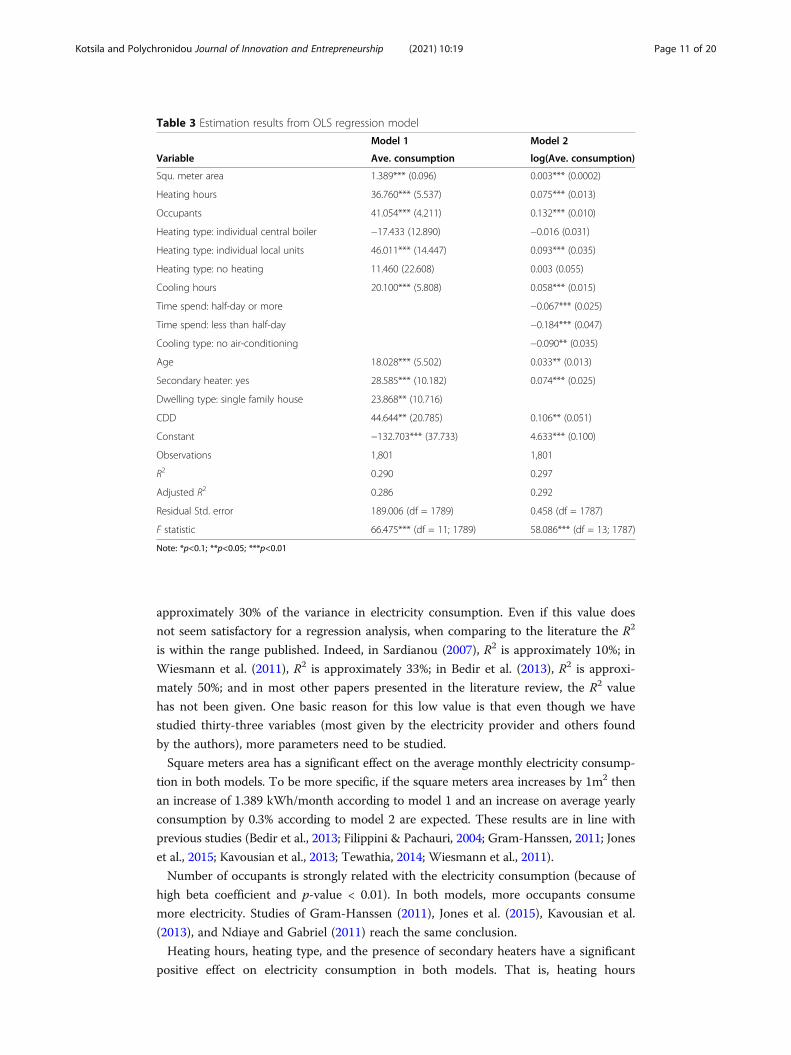
approximately 30% of the variance in electricity consumption. Even if this value does
not seem satisfactory for a regression analysis, when comparing to the literature the R2
is within the range published. Indeed, in Sardianou (2007), R2 is approximately 10%; in
Wiesmann et al. (2011), R2 is approximately 33%; in Bedir et al. (2013), R2 is approxi-
mately 50%; and in most other papers presented in the literature review, the R2 value
has not been given. One basic reason for this low value is that even though we have
studied thirty-three variables (most given by the electricity provider and others found
by the authors), more parameters need to be studied.
Square meters area has a significant effect on the average monthly electricity consump-
tion in both models. To be more specific, if the square meters area increases by 1m2 then
an increase of 1.389 kWh/month according to model 1 and an increase on average yearly
consumption by 0.3% according to model 2 are expected. These results are in line with
previous studies (Bedir et al., 2013; Filippini & Pachauri, 2004; Gram-Hanssen, 2011; Jones
et al., 2015; Kavousian et al., 2013; Tewathia, 2014; Wiesmann et al., 2011).
Number of occupants is strongly related with the electricity consumption (because of
high beta coefficient and p-value < 0.01). In both models, more occupants consume
more electricity. Studies of Gram-Hanssen (2011), Jones et al. (2015), Kavousian et al.
(2013), and Ndiaye and Gabriel (2011) reach the same conclusion.
Heating hours, heating type, and the presence of secondary heaters have a significant
positive effect on electricity consumption in both models. That is, heating hours
Table 3 Estimation results from OLS regression model
Model 1 Model 2
Variable Ave. consumption log(Ave. consumption)
Squ. meter area 1.389*** (0.096) 0.003*** (0.0002)
Heating hours 36.760*** (5.537) 0.075*** (0.013)
Occupants 41.054*** (4.211) 0.132*** (0.010)
Heating type: individual central boiler −17.433 (12.890) −0.016 (0.031)
Heating type: individual local units 46.011*** (14.447) 0.093*** (0.035)
Heating type: no heating 11.460 (22.608) 0.003 (0.055)
Cooling hours 20.100*** (5.808) 0.058*** (0.015)
Time spend: half-day or more −0.067*** (0.025)
Time spend: less than half-day −0.184*** (0.047)
Cooling type: no air-conditioning −0.090** (0.035)
Age 18.028*** (5.502) 0.033** (0.013)
Secondary heater: yes 28.585*** (10.182) 0.074*** (0.025)
Dwelling type: single family house 23.868** (10.716)
CDD 44.644** (20.785) 0.106** (0.051)
Constant −132.703*** (37.733) 4.633*** (0.100)
Observations 1,801 1,801
R2 0.290 0.297
Adjusted R2 0.286 0.292
Residual Std. error 189.006 (df = 1789) 0.458 (df = 1787)
F statistic 66.475*** (df = 11; 1789) 58.086*** (df = 13; 1787)
Note: *p<0.1; **p<0.05; ***p<0.01
Kotsila and Polychronidou Journal of Innovation and Entrepreneurship (2021) 10:19 Page 11 of 20
influence the electricity consumption regardless the heating type. On the other hand,
heating type of local units significantly influences the electricity consumption. Dwell-
ings that use local units for heating the space seem to consume more electricity. The
results reveal that houses with heating type of local units use possibly electrical appli-
ances to heat their space which has an impact on their total consumption. The pres-
ence of secondary heaters has also a significant positive effect on the electricity
consumption. Those results enhance the perspective that the electrical appliances used
to heat the space have an impact on electricity consumption. Jones et al. (2015) men-
tion that there are eight studies that found a positive effect of presence of electric space
heating system on electricity consumption.
Cooling hours is also related with the electricity consumption. Both models agree to the
positive relationship between cooling hours and electricity consumption, as expected. CDD
also is found that has a positive effect on electricity consumption in both models. The pres-
ence of air-conditioning to cool the space has a significant effect in model 2 while in model 1
it is not found that influences the electricity consumption. This result is aligned with the lit-
erature review presented by Jones et al. (2015), since they present studies with both results.
According to model 1, the dwelling type has a significant effect on electricity con-
sumption, as the single family houses seem to consume more electricity. This result is
aligned with past studies of Bedir et al. (2013), Brounen et al. (2012), McLoughlin et al.
(2012), and Wiesmann et al. (2011).
Both models reveal that the age of inhabitants positively influences the electricity con-
sumption. So, as long as the occupants that cover the bill are elderly, the more electricity is
consumed. This result is aligned with and also mentioned that there are eight studies that
marked the positive effect of age of head of the household on the electricity consumption.
According to model 2, dwellings with occupants that spent more time in home are
found to have a positive significant effect on electricity consumption, as it is expected
and it is aligned with Ndiaye and Gabriel (2011) and Tewathia (2014), respectively.
Many variables of the collected data are found that have no significant influence on
the electricity consumption. Those variables are gender, educational level, house status,
marital status, dwelling floor, income, light behavior, and summer holidays.
As mentioned above, most of the variables that are found significant are common in
both models, but there are variables that influence one model and not the other. This
happens because in model 2 a non-linear relationship exists between the independent
and dependent variables.
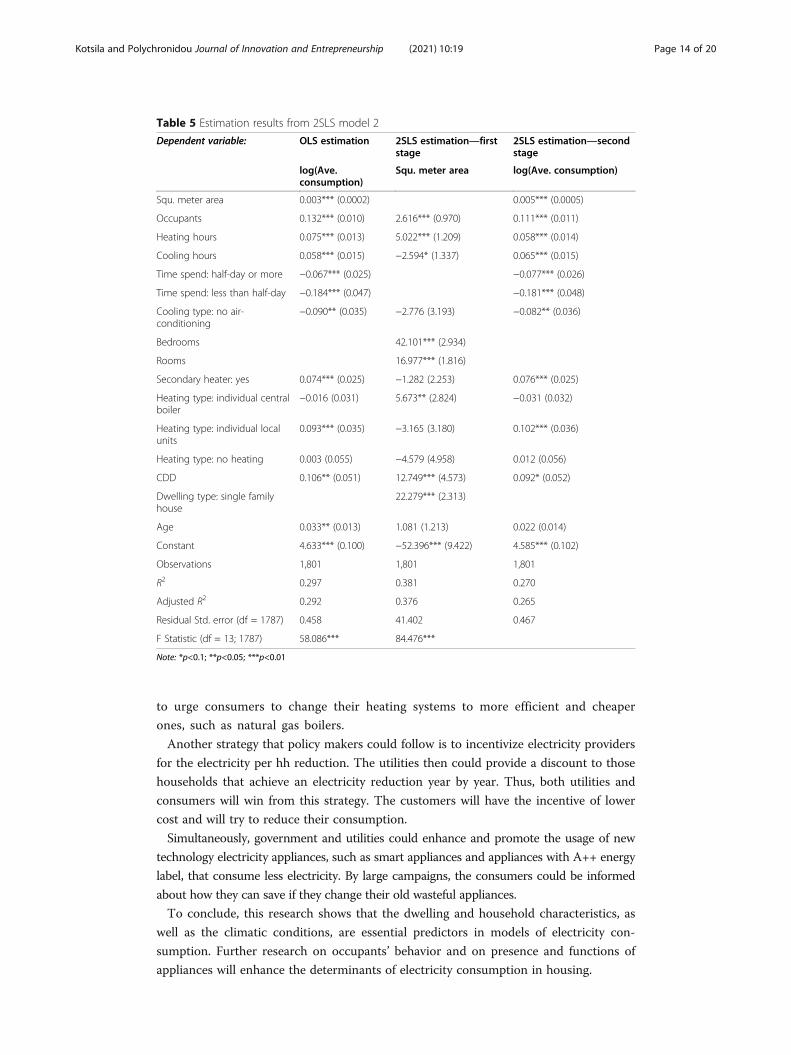
Two-stage least squares method (2SLS)
It is possible that a two-way causation exists between variables of the above models; thus,
there is the need to test for endogeneity. Variables that are tested for endogeneity are
those of square meter area, number of occupants, and heating hours. Square meter area is
found as significant at the level of 10%; thus, 2SLS is conducted with endogenous variable
the square meters area. Number of bedrooms and number of rooms have been inserted in
the model as instrumental variables. Tables 4 and 5 illustrate the results of OLS, first stage
of 2SLS and second stage of 2SLS for model 1 and model 2, respectively. The coefficients
of square meter area and other variables have been fitted and the significant variables are
the same with the OLS method.
Kotsila and Polychronidou Journal of Innovation and Entrepreneurship (2021) 10:19 Page 12 of 20
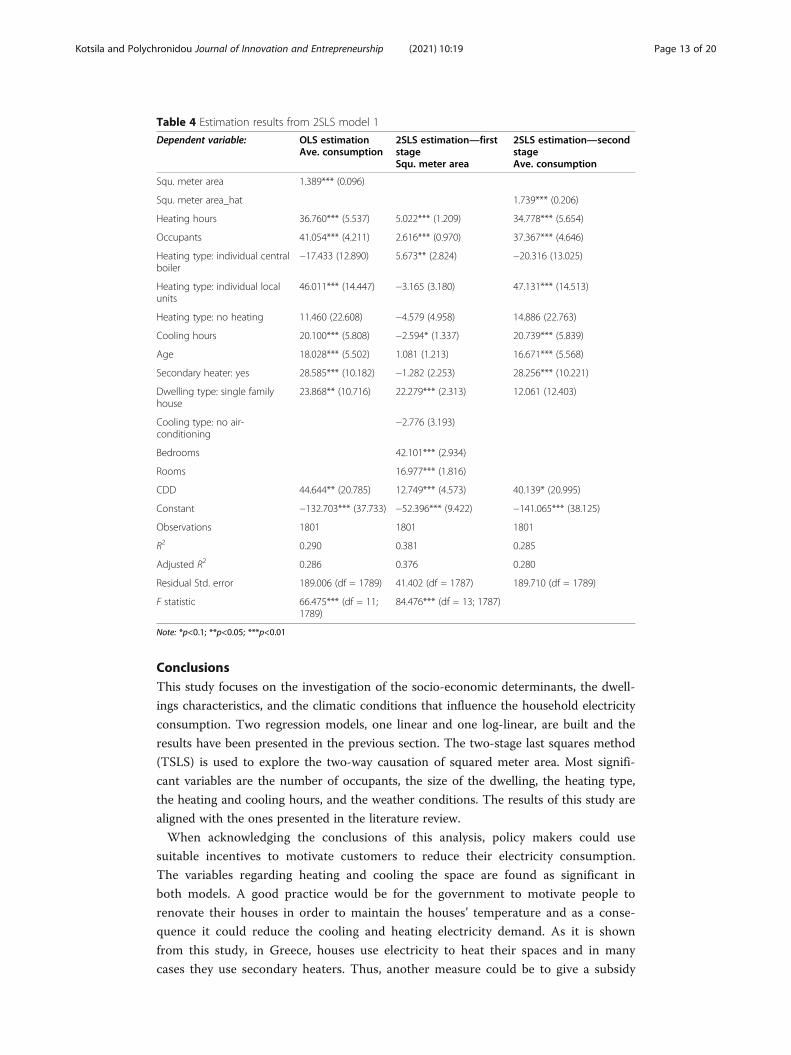
ConclusionsThis study focuses on the investigation of the socio-economic determinants, the dwell-
ings characteristics, and the climatic conditions that influence the household electricity
consumption. Two regression models, one linear and one log-linear, are built and the
results have been presented in the previous section. The two-stage last squares method
(TSLS) is used to explore the two-way causation of squared meter area. Most signifi-
cant variables are the number of occupants, the size of the dwelling, the heating type,
the heating and cooling hours, and the weather conditions. The results of this study are
aligned with the ones presented in the literature review.
When acknowledging the conclusions of this analysis, policy makers could use
suitable incentives to motivate customers to reduce their electricity consumption.
The variables regarding heating and cooling the space are found as significant in
both models. A good practice would be for the government to motivate people to
renovate their houses in order to maintain the houses’ temperature and as a conse-
quence it could reduce the cooling and heating electricity demand. As it is shown
from this study, in Greece, houses use electricity to heat their spaces and in many
cases they use secondary heaters. Thus, another measure could be to give a subsidy
Table 4 Estimation results from 2SLS model 1
Dependent variable: OLS estimationAve. consumption
2SLS estimation—firststageSqu. meter area
2SLS estimation—secondstageAve. consumption
Squ. meter area 1.389*** (0.096)
Squ. meter area_hat 1.739*** (0.206)
Heating hours 36.760*** (5.537) 5.022*** (1.209) 34.778*** (5.654)
Occupants 41.054*** (4.211) 2.616*** (0.970) 37.367*** (4.646)
Heating type: individual centralboiler
−17.433 (12.890) 5.673** (2.824) −20.316 (13.025)
Heating type: individual localunits
46.011*** (14.447) −3.165 (3.180) 47.131*** (14.513)
Heating type: no heating 11.460 (22.608) −4.579 (4.958) 14.886 (22.763)
Cooling hours 20.100*** (5.808) −2.594* (1.337) 20.739*** (5.839)
Age 18.028*** (5.502) 1.081 (1.213) 16.671*** (5.568)
Secondary heater: yes 28.585*** (10.182) −1.282 (2.253) 28.256*** (10.221)
Dwelling type: single familyhouse
23.868** (10.716) 22.279*** (2.313) 12.061 (12.403)
Cooling type: no air-conditioning
−2.776 (3.193)
Bedrooms 42.101*** (2.934)
Rooms 16.977*** (1.816)
CDD 44.644** (20.785) 12.749*** (4.573) 40.139* (20.995)
Constant −132.703*** (37.733) −52.396*** (9.422) −141.065*** (38.125)
Observations 1801 1801 1801
R2 0.290 0.381 0.285
Adjusted R2 0.286 0.376 0.280
Residual Std. error 189.006 (df = 1789) 41.402 (df = 1787) 189.710 (df = 1789)
F statistic 66.475*** (df = 11;1789)
84.476*** (df = 13; 1787)
Note: *p<0.1; **p<0.05; ***p<0.01
Kotsila and Polychronidou Journal of Innovation and Entrepreneurship (2021) 10:19 Page 13 of 20
to urge consumers to change their heating systems to more efficient and cheaper
ones, such as natural gas boilers.
Another strategy that policy makers could follow is to incentivize electricity providers
for the electricity per hh reduction. The utilities then could provide a discount to those
households that achieve an electricity reduction year by year. Thus, both utilities and
consumers will win from this strategy. The customers will have the incentive of lower
cost and will try to reduce their consumption.
Simultaneously, government and utilities could enhance and promote the usage of new
technology electricity appliances, such as smart appliances and appliances with A++ energy
label, that consume less electricity. By large campaigns, the consumers could be informed
about how they can save if they change their old wasteful appliances.
To conclude, this research shows that the dwelling and household characteristics, as
well as the climatic conditions, are essential predictors in models of electricity con-
sumption. Further research on occupants’ behavior and on presence and functions of
appliances will enhance the determinants of electricity consumption in housing.
Table 5 Estimation results from 2SLS model 2
Dependent variable: OLS estimation 2SLS estimation—firststage
2SLS estimation—secondstage
log(Ave.consumption)
Squ. meter area log(Ave. consumption)
Squ. meter area 0.003*** (0.0002) 0.005*** (0.0005)
Occupants 0.132*** (0.010) 2.616*** (0.970) 0.111*** (0.011)
Heating hours 0.075*** (0.013) 5.022*** (1.209) 0.058*** (0.014)
Cooling hours 0.058*** (0.015) −2.594* (1.337) 0.065*** (0.015)
Time spend: half-day or more −0.067*** (0.025) −0.077*** (0.026)
Time spend: less than half-day −0.184*** (0.047) −0.181*** (0.048)
Cooling type: no air-conditioning
−0.090** (0.035) −2.776 (3.193) −0.082** (0.036)
Bedrooms 42.101*** (2.934)
Rooms 16.977*** (1.816)
Secondary heater: yes 0.074*** (0.025) −1.282 (2.253) 0.076*** (0.025)
Heating type: individual centralboiler
−0.016 (0.031) 5.673** (2.824) −0.031 (0.032)
Heating type: individual localunits
0.093*** (0.035) −3.165 (3.180) 0.102*** (0.036)
Heating type: no heating 0.003 (0.055) −4.579 (4.958) 0.012 (0.056)
CDD 0.106** (0.051) 12.749*** (4.573) 0.092* (0.052)
Dwelling type: single familyhouse
22.279*** (2.313)
Age 0.033** (0.013) 1.081 (1.213) 0.022 (0.014)
Constant 4.633*** (0.100) −52.396*** (9.422) 4.585*** (0.102)
Observations 1,801 1,801 1,801
R2 0.297 0.381 0.270
Adjusted R2 0.292 0.376 0.265
Residual Std. error (df = 1787) 0.458 41.402 0.467
F Statistic (df = 13; 1787) 58.086*** 84.476***
Note: *p<0.1; **p<0.05; ***p<0.01
Kotsila and Polychronidou Journal of Innovation and Entrepreneurship (2021) 10:19 Page 14 of 20
Appendix
Table 6 Variables studied in the literature as it is presented in the “Literature review” section andvariables that are analyzed in this study
a/a Variable Studies that consider the variable This studyconsidersthe variable
1 Number of occupants Wiesmann et al., 2011; Brounen et al., 2012;Gram-Hanssen, 2011; Esmaeilimoakher et al.,2016; Sanquist et al., 2012; Ndiaye & Gabriel,2011; Tewathia, 2014; Sardianou, 2007
✓
2 Number/ Presence of children Wiesmann et al., 2011; Bedir et al., 2013;Brounen et al., 2012; Gram-Hanssen, 2011;Esmaeilimoakher et al., 2016
✓
3 Number/Presence of teenagers Brounen et al., 2012; Gram-Hanssen, 2011 ✓
4 Number/Presence of adults McLoughlin et al., 2012 ✓
5 Number/Presence of elderly people(over 65 years old)
McLoughlin et al., 2012; Bedir et al., 2013;Brounen et al., 2012; Gram-Hanssen, 2011
✓
6 Age of Household Reference Person (HRP) McLoughlin et al., 2012; Bedir et al., 2013;Brounen et al., 2012; Gram-Hanssen, 2011;Esmaeilimoakher et al., 2016; Ndiaye & Gab-riel, 2011; Sardianou, 2007;
✓
7 Age of children Ndiaye and Gabriel (2011) ✓
8 Gender of Household Reference Person Esmaeilimoakher et al., 2016; Sardianou,2007
✓
9 Marital status of occupants Sardianou, 2007 ✓
10 Employment status of HRP Bedir et al., 2013
11 Hours of occupancy (or number ofoccupants work or stay at home)
Bedir et al., 2013; Ndiaye & Gabriel, 2011;Polemis & Dagoumas, 2013
✓
12 Time spend outside/inside home Esmaeilimoakher et al., 2016; Tewathia, 2014 ✓
13 Education level of HRP Bedir et al., 2013; Gram-Hanssen, 2011;Ndiaye & Gabriel, 2011; Tewathia, 2014; Sar-dianou, 2007
✓
14 Social classification of HRP McLoughlin et al., 2012
15 Family type Wiesmann et al., 2011; McLoughlin et al.,2012; Brounen et al., 2012
✓
16 Fraction of females in household Brounen et al., 2012
17 Occupied by foreign-born Brounen et al., 2012; Ndiaye & Gabriel, 2011
18 Income Wiesmann et al., 2011; Bedir et al., 2013;Brounen et al., 2012; Gram-Hanssen, 2011;Halicioglu, 2007; Esmaeilimoakher et al.,2016; Ndiaye & Gabriel, 2011; Tewathia,2014; Donatos & Mergos, 1991; Hondroyian-nis, 2004; Sardianou, 2007
✓
19 Dwelling type Wiesmann et al., 2011; Bedir et al., 2013;McLoughlin et al., 2012; Brounen et al., 2012;Gram-Hanssen, 2011; Esmaeilimoakher et al.,2016; Ndiaye & Gabriel, 2011
✓
20 Dwelling age Wiesmann et al., 2011; Brounen et al., 2012;Esmaeilimoakher et al., 2016; Sanquist et al.,2012; Ndiaye & Gabriel, 2011;
21 Dwellings per building or Dwellings density Wiesmann et al., 2011
22 Dwelling size Bedir et al., 2013; Brounen et al., 2012;Gram-Hanssen, 2011; Esmaeilimoakher et al.,2016; Tewathia, 2014
✓
Kotsila and Polychronidou Journal of Innovation and Entrepreneurship (2021) 10:19 Page 15 of 20
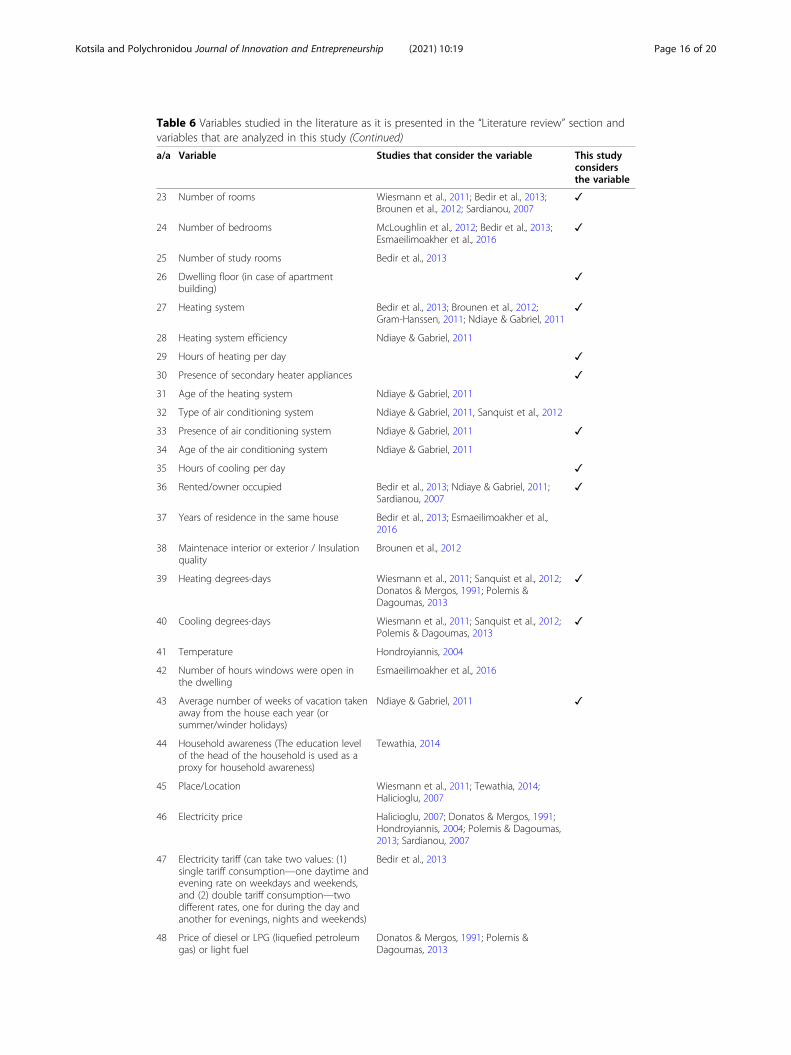
Table 6 Variables studied in the literature as it is presented in the “Literature review” section andvariables that are analyzed in this study (Continued)
a/a Variable Studies that consider the variable This studyconsidersthe variable
23 Number of rooms Wiesmann et al., 2011; Bedir et al., 2013;Brounen et al., 2012; Sardianou, 2007
✓
24 Number of bedrooms McLoughlin et al., 2012; Bedir et al., 2013;Esmaeilimoakher et al., 2016
✓
25 Number of study rooms Bedir et al., 2013
26 Dwelling floor (in case of apartmentbuilding)
✓
27 Heating system Bedir et al., 2013; Brounen et al., 2012;Gram-Hanssen, 2011; Ndiaye & Gabriel, 2011
✓
28 Heating system efficiency Ndiaye & Gabriel, 2011
29 Hours of heating per day ✓
30 Presence of secondary heater appliances ✓
31 Age of the heating system Ndiaye & Gabriel, 2011
32 Type of air conditioning system Ndiaye & Gabriel, 2011, Sanquist et al., 2012
33 Presence of air conditioning system Ndiaye & Gabriel, 2011 ✓
34 Age of the air conditioning system Ndiaye & Gabriel, 2011
35 Hours of cooling per day ✓
36 Rented/owner occupied Bedir et al., 2013; Ndiaye & Gabriel, 2011;Sardianou, 2007
✓
37 Years of residence in the same house Bedir et al., 2013; Esmaeilimoakher et al.,2016
38 Maintenace interior or exterior / Insulationquality
Brounen et al., 2012
39 Heating degrees-days Wiesmann et al., 2011; Sanquist et al., 2012;Donatos & Mergos, 1991; Polemis &Dagoumas, 2013
✓
40 Cooling degrees-days Wiesmann et al., 2011; Sanquist et al., 2012;Polemis & Dagoumas, 2013
✓
41 Temperature Hondroyiannis, 2004
42 Number of hours windows were open inthe dwelling
Esmaeilimoakher et al., 2016
43 Average number of weeks of vacation takenaway from the house each year (orsummer/winder holidays)
Ndiaye & Gabriel, 2011 ✓
44 Household awareness (The education levelof the head of the household is used as aproxy for household awareness)
Tewathia, 2014
45 Place/Location Wiesmann et al., 2011; Tewathia, 2014;Halicioglu, 2007
46 Electricity price Halicioglu, 2007; Donatos & Mergos, 1991;Hondroyiannis, 2004; Polemis & Dagoumas,2013; Sardianou, 2007
47 Electricity tariff (can take two values: (1)single tariff consumption—one daytime andevening rate on weekdays and weekends,and (2) double tariff consumption—twodifferent rates, one for during the day andanother for evenings, nights and weekends)
Bedir et al., 2013
48 Price of diesel or LPG (liquefied petroleumgas) or light fuel
Donatos & Mergos, 1991; Polemis &Dagoumas, 2013
Kotsila and Polychronidou Journal of Innovation and Entrepreneurship (2021) 10:19 Page 16 of 20
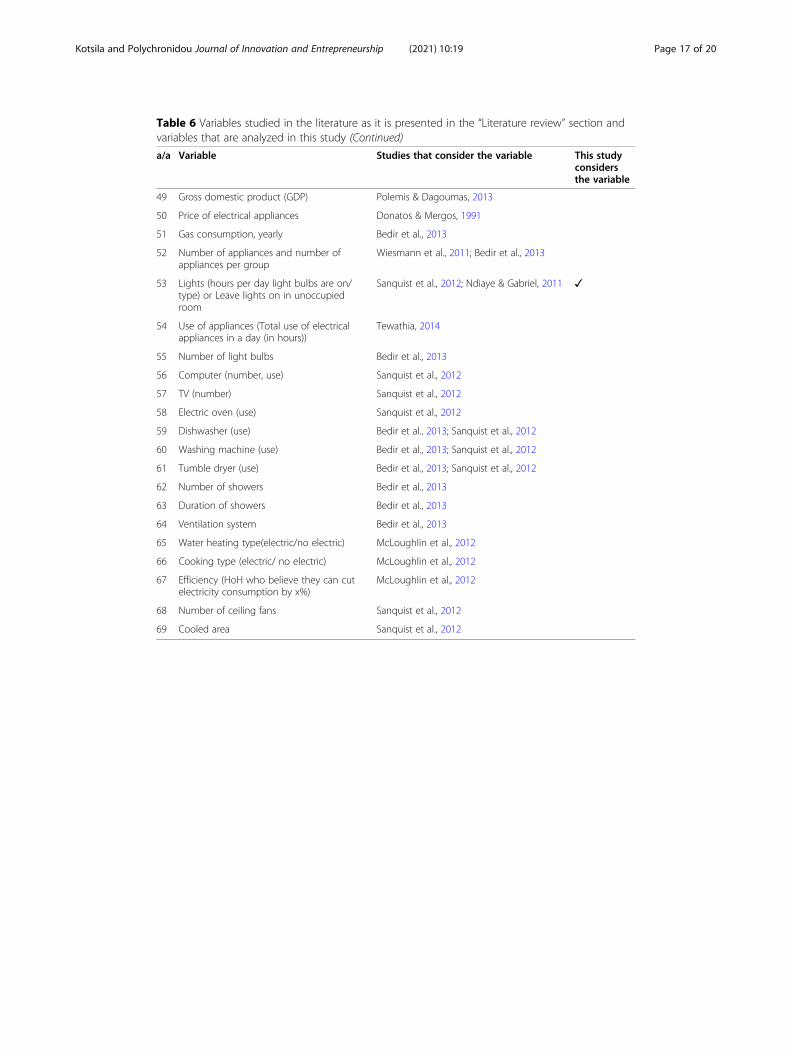
Table 6 Variables studied in the literature as it is presented in the “Literature review” section andvariables that are analyzed in this study (Continued)
a/a Variable Studies that consider the variable This studyconsidersthe variable
49 Gross domestic product (GDP) Polemis & Dagoumas, 2013
50 Price of electrical appliances Donatos & Mergos, 1991
51 Gas consumption, yearly Bedir et al., 2013
52 Number of appliances and number ofappliances per group
Wiesmann et al., 2011; Bedir et al., 2013
53 Lights (hours per day light bulbs are on/type) or Leave lights on in unoccupiedroom
Sanquist et al., 2012; Ndiaye & Gabriel, 2011 ✓
54 Use of appliances (Total use of electricalappliances in a day (in hours))
Tewathia, 2014
55 Number of light bulbs Bedir et al., 2013
56 Computer (number, use) Sanquist et al., 2012
57 TV (number) Sanquist et al., 2012
58 Electric oven (use) Sanquist et al., 2012
59 Dishwasher (use) Bedir et al., 2013; Sanquist et al., 2012
60 Washing machine (use) Bedir et al., 2013; Sanquist et al., 2012
61 Tumble dryer (use) Bedir et al., 2013; Sanquist et al., 2012
62 Number of showers Bedir et al., 2013
63 Duration of showers Bedir et al., 2013
64 Ventilation system Bedir et al., 2013
65 Water heating type(electric/no electric) McLoughlin et al., 2012
66 Cooking type (electric/ no electric) McLoughlin et al., 2012
67 Efficiency (HoH who believe they can cutelectricity consumption by x%)
McLoughlin et al., 2012
68 Number of ceiling fans Sanquist et al., 2012
69 Cooled area Sanquist et al., 2012
Kotsila and Polychronidou Journal of Innovation and Entrepreneurship (2021) 10:19 Page 17 of 20
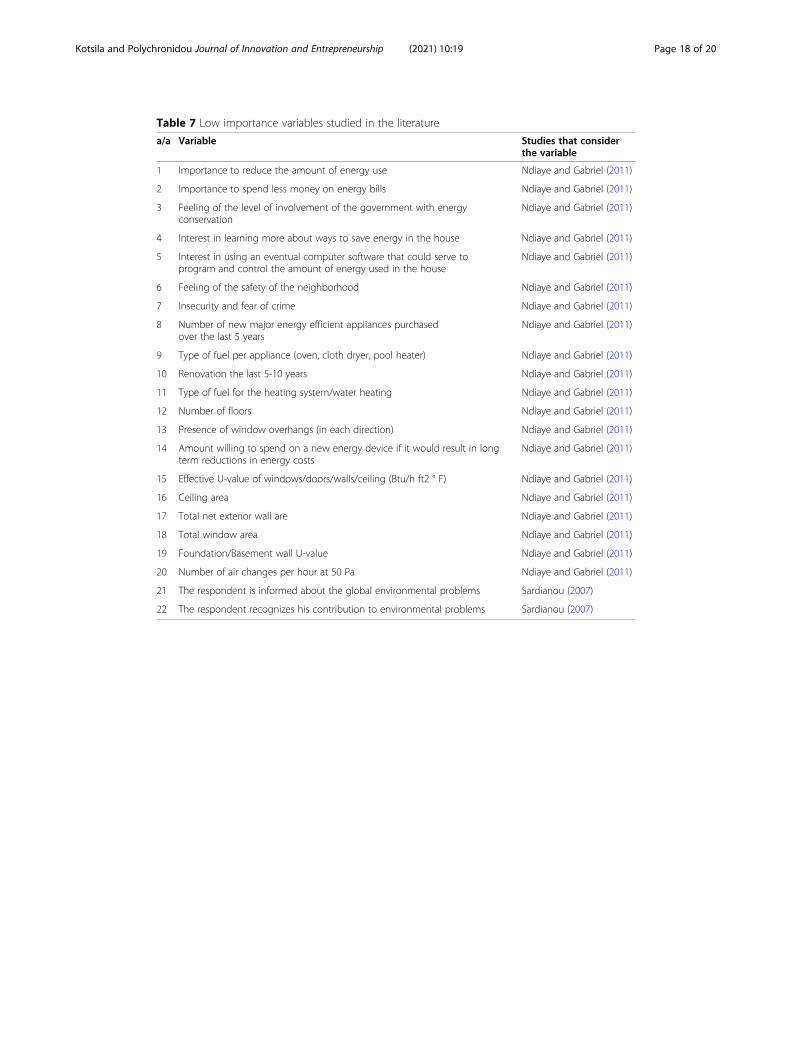
Table 7 Low importance variables studied in the literature
a/a Variable Studies that considerthe variable
1 Importance to reduce the amount of energy use Ndiaye and Gabriel (2011)
2 Importance to spend less money on energy bills Ndiaye and Gabriel (2011)
3 Feeling of the level of involvement of the government with energyconservation
Ndiaye and Gabriel (2011)
4 Interest in learning more about ways to save energy in the house Ndiaye and Gabriel (2011)
5 Interest in using an eventual computer software that could serve toprogram and control the amount of energy used in the house
Ndiaye and Gabriel (2011)
6 Feeling of the safety of the neighborhood Ndiaye and Gabriel (2011)
7 Insecurity and fear of crime Ndiaye and Gabriel (2011)
8 Number of new major energy efficient appliances purchasedover the last 5 years
Ndiaye and Gabriel (2011)
9 Type of fuel per appliance (oven, cloth dryer, pool heater) Ndiaye and Gabriel (2011)
10 Renovation the last 5-10 years Ndiaye and Gabriel (2011)
11 Type of fuel for the heating system/water heating Ndiaye and Gabriel (2011)
12 Number of floors Ndiaye and Gabriel (2011)
13 Presence of window overhangs (in each direction) Ndiaye and Gabriel (2011)
14 Amount willing to spend on a new energy device if it would result in longterm reductions in energy costs
Ndiaye and Gabriel (2011)
15 Effective U-value of windows/doors/walls/ceiling (Btu/h ft2 ° F) Ndiaye and Gabriel (2011)
16 Ceiling area Ndiaye and Gabriel (2011)
17 Total net exterior wall are Ndiaye and Gabriel (2011)
18 Total window area Ndiaye and Gabriel (2011)
19 Foundation/Basement wall U-value Ndiaye and Gabriel (2011)
20 Number of air changes per hour at 50 Pa Ndiaye and Gabriel (2011)
21 The respondent is informed about the global environmental problems Sardianou (2007)
22 The respondent recognizes his contribution to environmental problems Sardianou (2007)
Kotsila and Polychronidou Journal of Innovation and Entrepreneurship (2021) 10:19 Page 18 of 20
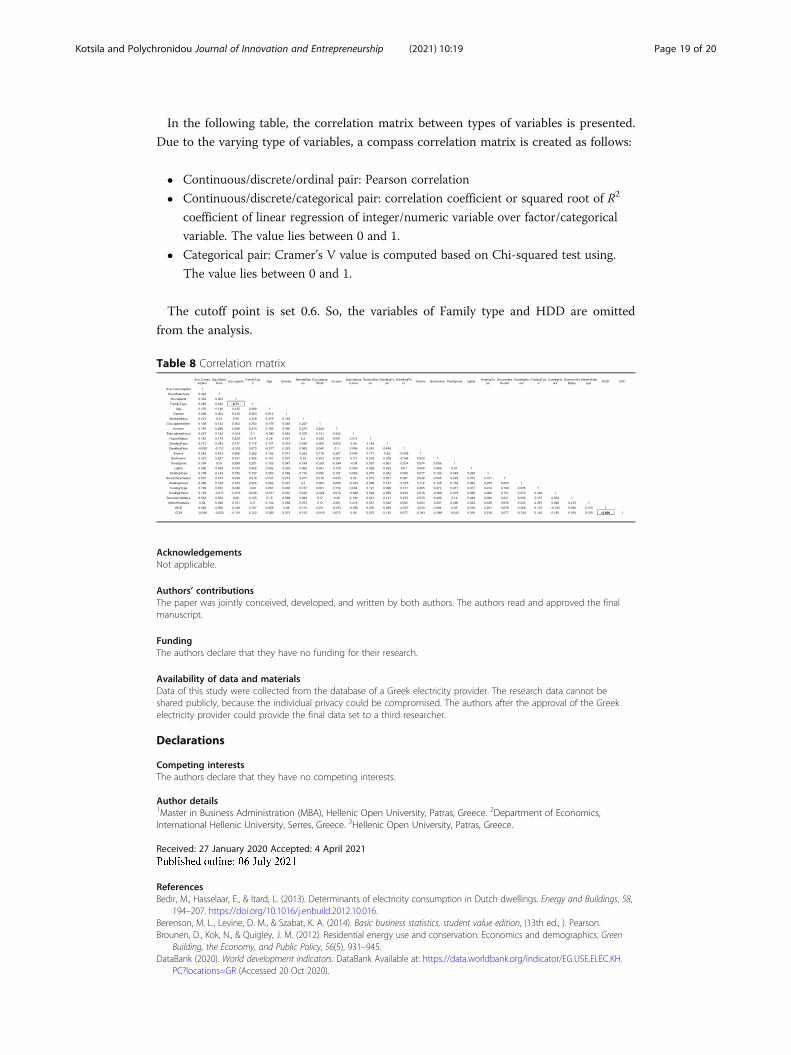
In the following table, the correlation matrix between types of variables is presented.
Due to the varying type of variables, a compass correlation matrix is created as follows:
� Continuous/discrete/ordinal pair: Pearson correlation
� Continuous/discrete/categorical pair: correlation coefficient or squared root of R2
coefficient of linear regression of integer/numeric variable over factor/categorical
variable. The value lies between 0 and 1.
� Categorical pair: Cramer’s V value is computed based on Chi-squared test using.
The value lies between 0 and 1.
The cutoff point is set 0.6. So, the variables of Family type and HDD are omitted
from the analysis.
AcknowledgementsNot applicable.
Authors’ contributionsThe paper was jointly conceived, developed, and written by both authors. The authors read and approved the finalmanuscript.
FundingThe authors declare that they have no funding for their research.
Availability of data and materialsData of this study were collected from the database of a Greek electricity provider. The research data cannot beshared publicly, because the individual privacy could be compromised. The authors after the approval of the Greekelectricity provider could provide the final data set to a third researcher.
Declarations
Competing interestsThe authors declare that they have no competing interests.
Author details1Master in Business Administration (MBA), Hellenic Open University, Patras, Greece. 2Department of Economics,International Hellenic University, Serres, Greece. 3Hellenic Open University, Patras, Greece.
Received: 27 January 2020 Accepted: 4 April 2021
ReferencesBedir, M., Hasselaar, E., & Itard, L. (2013). Determinants of electricity consumption in Dutch dwellings. Energy and Buildings, 58,
194–207. https://doi.org/10.1016/j.enbuild.2012.10.016.Berenson, M. L., Levine, D. M., & Szabat, K. A. (2014). Basic business statistics, student value edition, (13th ed., ). Pearson.Brounen, D., Kok, N., & Quigley, J. M. (2012). Residential energy use and conservation: Economics and demographics. Green
Building, the Economy, and Public Policy, 56(5), 931–945.DataBank (2020). World development indicators. DataBank Available at: https://data.worldbank.org/indicator/EG.USE.ELEC.KH.
PC?locations=GR (Accessed 20 Oct 2020).
Table 8 Correlation matrix
Kotsila and Polychronidou Journal of Innovation and Entrepreneurship (2021) 10:19 Page 19 of 20

Donatos, G. S., & Mergos, G. J. (1991). Residential demand for electricity: The case of Greece. Energy Economics, 13(1), 41–47.https://doi.org/10.1016/0140-9883(91)90054-4.
Esmaeilimoakher, P., Urmee, T., Pryor, T., & Baverstock, G. (2016). Identifying the determinants of residential electricityconsumption for social housing in Perth, Western Australia. Energy and Buildings, 133, 403–413. https://doi.org/10.1016/j.enbuild.2016.09.063.
European Parliament and Council (2009). Directive 2009/28/EC of the European Parliament and of the Council of 23 April2009 on the promotion of the use of energy from renewable sources and amending and subsequently repealingDirectives 2001/77/EC and 2003/30/EC. Official Journal of the European Union, 52(L140), 16–62.
Eurostat. (2018). Energy consumption in households - statistics explained, available at: http://ec.europa.eu/eurostat/statistics-explained/images/1/16/Energy_consumption_households_final.xlsx (Accessed 26 Apr 2018).
Filippini, M., & Pachauri, S. (2004). Elasticities of electricity demand in urban Indian households. Energy Policy, 32(3), 429–436.https://doi.org/10.1016/S0301-4215(02)00314-2.
Gram-Hanssen, K. (2011). Households’ energy use - which is the more important: efficient technologies or user practices?, EnergyEnd-Use Efficiency Issues (EEE), (pp. 992–999).
Halicioglu, F. (2007). Residential electricity demand dynamics in Turkey. Energy Economics, 29(2), 199–210. https://doi.org/10.1016/j.eneco.2006.11.007.
Hondroyiannis, G. (2004). Estimating residential demand for electricity in Greece. Energy Economics, 26(3), 319–334. https://doi.org/10.1016/j.eneco.2004.04.001.
International Energy Agency (2017). Energy policies of IEA Countries, Greece 2017 review, available at: https://euagenda.eu/upload/publications/untitled-110952-ea.pdf (accessed 19 October 2020).
International Energy Agency (2020a). CO2 emissions by sector, Greece 1990-2018, available at:https://www.iea.org/data-and-statistics?country=GREECE&fuel=CO2%20emissions&indicator=CO2BySector (accessed 19 October 2020).
International Energy Agency (2020b). Electricity generation by source, Greece 1990-2019, available at: https://www.iea.org/data-and-statistics?country=GREECE&fuel=Electricity%20and%20heat&indicator=ElecGenByFuel (Accessed 19 Oct 2020).
International Energy Agency (2020c). Electricity final consumption by sector, Greece 1990-2018, available at: https://www.iea.org/data-and-statistics?country=GREECE&fuel=Electricity%20and%20heat&indicator=ElecConsBySector (Accessed 19 Oct 2020).
Jones, R. V., Fuertes, A., & Lomas, K. J. (2015). The socio-economic, dwelling and appliance related factors affecting electricityconsumption in domestic buildings. Renewable and Sustainable Energy Reviews, 43, 901–917. https://doi.org/10.1016/j.rser.2014.11.084.
Kavousian, A., Rajagopal, R., & Fischer, M. (2013). Determinants of residential electricity consumption: Using smart meter datato examine the effect of climate, building characteristics, appliance stock, and occupants’ behavior. Energy, 55, 184–194.https://doi.org/10.1016/j.energy.2013.03.086.
McLoughlin, F., Duffy, A., & Conlon, M. (2012). Characterising domestic electricity consumption patterns by dwelling andoccupant socio-economic variables: an Irish case study. Energy and Buildings, 48, 240–248. https://doi.org/10.1016/j.enbuild.2012.01.037.
Ndiaye, D., & Gabriel, K. (2011). Principal component analysis of the electricity consumption in residential dwellings. Energyand Buildings, 43(2), 446–453. https://doi.org/10.1016/j.enbuild.2010.10.008.
Official Government Gazette. (2018). Accelerating the development of renewable energy sources to deal with climate change andother regulations addressing issues under the authority of the Ministry of Environment, Energy and Climate Change, 3851/2010, 1753–1779.
Petrou A.M. J. (2018). “meteo.gr”, meteo.gr - weather forecasts for Greece, available at: http://www.meteo.gr/ (Accessed 10 Mar 2018).Polemis, M. L., & Dagoumas, A. S. (2013). The electricity consumption and economic growth nexus: Evidence from Greece.
Energy Policy, 62, 798–808. https://doi.org/10.1016/j.enpol.2013.06.086.Sanquist, T. F., Orr, H., Shui, B., & Bittner, A. C. (2012). Lifestyle factors in U.S. residential electricity consumption. Energy Policy,
42, 354–364. https://doi.org/10.1016/j.enpol.2011.11.092.Sardianou, E. (2007). Estimating energy conservation patterns of Greek households. Energy Policy, 35(7), 3778–3791. https://doi.
org/10.1016/j.enpol.2007.01.020.Tewathia, N. (2014). Determinants of the household electricity consumption: a case study of Delhi. International Journal of
Energy Economics and Policy, 4(3), 337–348.Wiesmann, D., Lima Azevedo, I., Ferrão, P., & Fernández, J. E. (2011). Residential electricity consumption in Portugal: findings
from top-down and bottom-up models. Energy Policy, 39(5), 2772–2779. https://doi.org/10.1016/j.enpol.2011.02.047.World Energy Council. (2016). Electricity use per household | Electricity Consumption Efficiency| WEC, available at: https://wec-
indicators.enerdata.net/xls/household-electricity-use.xls (Accessed 26 Feb 2018).
Publisher’s NoteSpringer Nature remains neutral with regard to jurisdictional claims in published maps and institutional affiliations.
Kotsila and Polychronidou Journal of Innovation and Entrepreneurship (2021) 10:19 Page 20 of 20