climate impacts: temperature and electricity consumption
TRANSCRIPT

1
Climate Impacts: Temperature and Electricity Consumption
Chen Zhang 1,2,3,4, Hua Liao 1,2,3, 4,5*, Zhifu Mi 6
1 School of Management and Economics, Beijing Institute of Technology, Beijing 100081, China.
2 Center for Energy and Environmental Policy Research, Beijing Institute of Technology, Beijing 100081, China.
3 Sustainable Development Research Institute for Economy and Society of Beijing, Beijing 100081, China.
4 Beijing Key Laboratory of Energy Economics and Environmental Management, Beijing 100081, China.
5 Collaborative Innovation Center of Electric Vehicles in Beijing, Beijing 100081, China.
6 The Bartlett School of Construction and Project Management, University College London
*Corresponding Author
Dr. Hua Liao is currently Deputy Director and professor of the Center for Energy and Environmental Policy Research
(CEEP), Beijing Institute of Technology (BIT). E-mail: [email protected], [email protected], [email protected] Tel:
+86-10-68914459, Fax: +86-10-68918651
http://www.ceep.net.cn/english/index.htm
https://scholar.google.com/citations?hl=en&user=-TFrj1UAAAAJ

2
Climate Impacts: Temperature and Electricity Consumption
Abstract: One of the aspects of climate change is temperature rise. Temperature rise or fluctuations affect human economic
activities and electricity consumption. This paper estimates the changes in electricity consumption due to temperature
fluctuation at the county scale in rural China. By using the statistics of counties from 2006 to 2015 in a fixed-effect panel
model, the results indicate that a one-degree temperature increase in summer days may lead to 0.015% more electricity
consumption per capita, and this correlation may be weaker as income increases. Moreover, a one-degree temperature
decrease in winter days may lead to 0.002% more electricity consumption. The northern region may consume 0.021% more
electricity than the southern region when facing the same temperature drop. Overall, the effect of temperature on electricity
consumption is modest, particularly for a drop in temperature, but the usage of other types of energy may increase to adapt
to the cold.
Key words: Temperature fluctuation; Electricity consumption; Rural area, Fixed-effect panel model

3
1. Introduction
Many economic activities are exposed to weather changes, and expected revenues may thus be seriously affected by
extreme weather. A growing body of literature has estimated the historical effects of temperature on economic growth,
human health and armed conflicts with reduced-form statistical methods (Burke et al. 2015, Burke et al. 2009, Deschenes
and Greenstone 2012, Hsiang 2010, Nordhaus 1996, Yang and Gao 2007). For countries or cities in the tropical and
subtropical regions, warmer/cooler weather induces a higher demand for indoor temperature conditioning. As electricity is
the primary energy source for indoor temperature conditioning, for which air-conditioners and electric fans are used, this
would in turn lead to a higher demand for electricity. Since temperature fluctuation could cause diverse consequences on
electricity through multiple social and economic characters and different temperature patterns may present different
regional estimates (Bessec and Fouquau 2008, Fan et al. 2014, Hekkenberg et al. 2009, Istiaque and Khan 2018, Jovanović
et al. 2015, Liu et al. 2014, Miller et al. 2008, Sun et al. 2017). However, many questions remain to be explored in China.
China is a vast country with complex and diverse climate types. Currently, there is not enough evidence to characterize the
temperature-electricity relationship under different climate patterns in multi-locations across China, a country with a wide
range of climates and a highly diverse population.
The paper provides a large-scale study on the effects of temperature change on electricity consumption in China.
Besides, taking the economic interaction effect on the temperature impact into consideration, it overcomes the bias of
estimate on the effects of temperature change from limited observation and comparable solo climate type. The paper also
provides an effective and reasonable theoretical basis for policymakers to increase people’s ability to adapt to climate
change. The potential impacts of climate change on electricity consumption are important to both adaptation and mitigation
policies. In particular, electricity consumption plays a crucial role in adapting to climate change in terms of helping to
adjust to heating and cooling needs in the face of temperature changes. It is also important in mitigation planning as
electricity accounts for more greenhouse gas emissions than any other sector in China(Qi et al. 2007). Therefore,
information on the potential impacts of climate change on electricity consumption will be valuable in developing adaptation

4
and mitigation strategies.
This paper attempts to explore the effects that temperature fluctuation has on rural electricity consumption.
Specifically, we attempt to estimate the effect of the higher/lower temperature on household electricity consumption. We
also want to answer the following two questions. a) To what extent could a rise/drop in temperature affect rural household
electricity consumption? b) How would the temperature that is induced by a different climate affect rural household
electricity consumption?
The paper proceeds as follows. Section 2 briefly provides the hypothesis and literature review regarding temperature
and electricity consumption. Section 3 explains the methodology and the data sources that are used in the paper. Section 4
reports the results of temperature fluctuation’s effects. Section 5 discusses a mechanism from the result. Section 6 concludes
and provides practical implications.
2. Literature review and Hypothesis
2.1 Literature review on related works
There exists abundant literature on how the temperature affects electricity consumption. Brown et al. (2014)
summarize earlier studies, noting that it is unclear which is a better predictor of electricity demand-temperature or
heating/cooling degree days and whether this relationship follows a U-shape with a flat bottom or a sharp V.
From the perspective of model used in the issue of temperature and electricity consumption, the statistical models
have been developed by using two sets of independent variables: a) primitive variables, such as temperature, precipitation,
relative humidity, wind speed, atmospheric pressure and solar radiation; b)derived variables, including heating degree-days
(HDD) (Narayan et al. 2007, Valor et al. 2001), cooling degree-days (CDD) (Lam et al. 2008, Sailor 2001).These earlier
literatures have econometrically estimated the relationship between electricity load and temperature using total load from
all users. Alternatively, they have used model-based approaches to build bottom-up estimates of the change in electricity

5
usage under future climate scenarios, as in Dirks et al. (2015), whose approach is strictly based on the existing stock of
buildings in the US, and Afshari and Friedrich (2017), who modelled urban energy systems using hourly electricity demand
and weather measurements.
From the perspective of area of interest, the regional heterogeneity, which is induced by social and economic factors,
determines the extent of the consequences in climatic impacts. For example, Auffhammer et al. (2017) use daily data from
the balancing authorities in US, from 2006 to 2014, and find that while in certain zones, the temperature-load relationship
is symmetric around 21 C , for others on the East Coast loads grow much more sharply as the temperature rises above
21 C . Franco and Sanstad (2008) and Khanna and Cropper (2012) concluded that annual electricity demand in California
can be expected to increase by 0.8 - 17.8% relative to the 1961-1990 base period and 15%, respectively, over the course of
the century. Studies for the European Union reach different conclusions. For most countries in European Union, the
relationship between electricity demand and temperature has a hockey-stick shape.
As for cases in China, Chen et al. (2006) reported that the winter heating energy consumption reduced by 5% to 30%
in northern China and by more than 30% in the Yangtze delta from 1985 to 2004 due to global warming. Yi-Ling et al.
(2014) used data of daily electricity consumption and temperature for the period 2003-2007 in Shanghai and analysed the
variation of electricity consumption and the correlations between electricity consumption and temperature. Ang et al. (2017)
estimated that total annual electricity consumption would increase by between 4% and 5% in Hong Kong in 2015 if there
were to be a 1 C rise in temperature.
Among the literatures mentioned above, the different conclusions are drawn from different regions. Their conclusions
are drawn from resident sector based on limited observations and comparable solo climate type. What’s more, they ignored
the interaction effect about economic factors and temperature on response. In fact, the response from the residents to
temperature fluctuation differed with multi climate types and social lifestyles. When facing to temperature shocks, the
individual’s income would be a significant factor that determines the adaption and response to temperature. It’s necessary

6
to provide a large-scale research in resident sector about the relationship between temperature and electricity consumption
in China, to estimate the precise impact of temperature on electricity consumption with consideration of adaption.
2.2 Hypotheses on temperature impact on electricity consumption
In term of pattern of life, temperature affects rural residents more seriously than urban residents. First, in China, rural
families have their own land to engage in agricultural activities with the ‘Family Contract Responsibility System’. This
land reform has stimulated the production desire of farmers and has greatly improved agricultural output. Temperature and
precipitation are direct inputs for agriculture production.
Higher temperatures have greatly impact on rural residents. Electricity consumption in rural household is affected by
two aspects: agricultural production by households and households’ daily living demand. Temperature is a key factor that
affects agricultural output, because extreme temperature may interrupt the field crop growth. As a result, electric appliances
for household agriculture may place upward pressure on the power grid load. In the short term, higher temperatures that
are caused by climate change would likely lead to less precipitation. Farmers may use electrical machinery to irrigate the
field crops to compensate for the lost precipitation. Moreover, higher temperatures may lead to decreases in the amount of
oxygen in the water and contribute to fish dying from hypoxia. Fisherman may artificially increase the oxygen level in the
water with electric motors. When temperatures increase, residents may prolong the usage time of electrical appliances (e.g.,
refrigerators, electric fans, and air conditioning).
However, low temperatures have a minor impact on rural residents. Lower temperatures always occur in winter when
the harvest period has passed, which requires less time for agricultural activities. Production activities may not result in a
significant increase in electricity consumption. When temperatures drop, there are two reasons that electricity consumption
may not increase as strongly as with rising temperatures. The first reason is the residents may choose various heating
systems to live through the winter according to their income level (Luo and Wang 2007, Peng and Pan 2008). In urban
areas, residents economically adopt a water-heating system in winter rather than an electric heating system. In heating

7
efficiency, electric heating to adapt to falling temperatures is used only after the adoption of heating systems that are based
on coal combustion and natural gas, but in winter, residents may choose to shift the activity space from outdoors to indoors,
which causes an increased possibility of using electric devices reserved in the households. As a result, the common choice
of fuels in heating systems has saved considerable expenditures for residents, leaving residents scarcely sensible to energy
saving behaviours in using household electric appliances. The second reason that electricity consumption may not increase
when temperatures drop is that the grid load capacity of the rural areas does not operate as well as in the urban areas (Shen
2014). Due to the dispersed rural population, the power voltage in rural areas fails to sustain a normal operation in high-
power heating appliances. Moreover, when the temperature drops, the growing season for agriculture has already concluded,
and the supply of electricity for rural areas may not be as essential as it is in the growing season (Zhang et al. 2009, Zheng
et al. 2014, Zhou et al. 2009). Thus, these two reasons determine that temperature drops may not greatly increase electricity
consumption.
According to the review above, we build a hypothesis on the relationship between temperature fluctuation and
electricity consumption: when the temperature rises, electricity consumption will increase, while electricity consumption
may increase slightly with drops in the temperature. In the following sections of the paper, we will test the hypothesis with
the data and econometric model that we use.
3. Methodology and Data
3.1 Methodology
We interpret how climate change would impact rural household electricity consumption based on Deschênes and
Greenstone (2011). We set the consumer utility function as ( , , )U U LF EC RE= , where LF refers to the consumption of
daily-life goods. We assume that the electricity consumption in rural areas is a function of LF because electricity is supposed
to provide utilities with the consumption of LF ( / 0EC LF ). Meanwhile, we set LF to be a function of temperature.

8
Then, we define EC as the electricity consumption and set [ ( )]EC EC LF T= . We build the assumption that daily life and
production activities are both affected by temperature. RE is denoted as other aggregated consumption goods.
( , , ) ( , )U U LF EC RE U LF RE= = (0)
An individual faces a budget constraint of the form =0I RE LF pEC− − − , where the prices of RE and LF are 1, and
the price of EC is p. I refers to income. In this case, temperature is a key factor that affects agricultural output, and rural
household income heavily depends on one’s own agriculture output ( / 0I T ). Therefore, we denote ( )I I T= .
Consequently, for a given level of utility and fixed p, there is an associated equation: ( , , ) [ ( ), ]EC I T p EC I T T=
We consider the impact of temperature on EC in the following equation:
I
dEC dI ECEC
dT dT T
= +
(0)
According to equation (0), the first term I
dIEC
dT is the change in electricity consumption due to the income
fluctuation that is induced by weather shock (through weather’s effect on quantity). The first term can be considered the
change that is derived from rural production activities because rural productive activities are the main source of household
income. The second term in equation (0), EC
T
, is considered to be the direct temperature impact on electricity, which is
called the change in daily life electricity consumption.
According to the description of equation (0), we attempt to estimate the direct effect of temperature on electricity and
the indirect effect of this direct effect on electricity combined with income. The baseline estimation strategy is shown in
equation (0):
, ,0 1 2 , 3 , ,ln( ) ln( )i t i t i t i t i trecper income HDDK CDDK = + + + + (0)
where ( )ln recper is the natural logarithm of electricity consumption per capita, ln(income) is the natural logarithm of
net income per capita, HDDK is the annual aggregation centigrade degree of the daily temperature that is lower than 5 C ,
CDDK is the annual aggregation centigrade degree of the daily temperature that exceeds 26 C , and ,i t is the error term.
9
3.2 Data
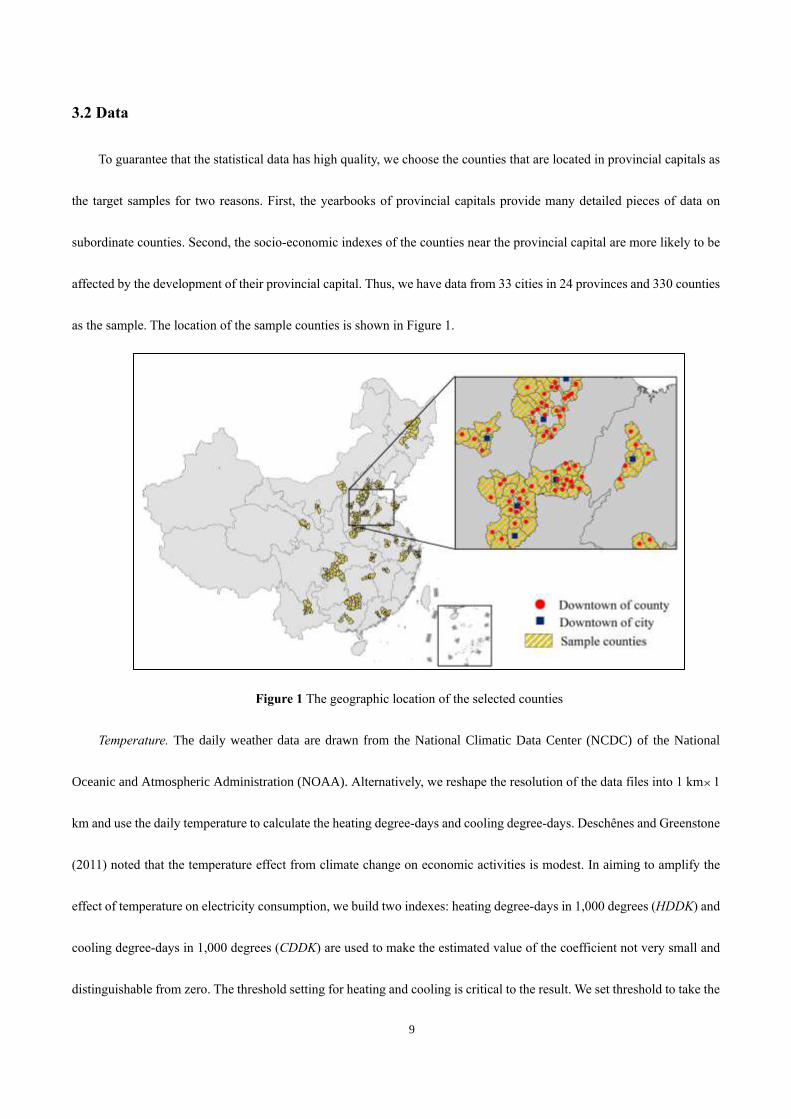
To guarantee that the statistical data has high quality, we choose the counties that are located in provincial capitals as
the target samples for two reasons. First, the yearbooks of provincial capitals provide many detailed pieces of data on
subordinate counties. Second, the socio-economic indexes of the counties near the provincial capital are more likely to be
affected by the development of their provincial capital. Thus, we have data from 33 cities in 24 provinces and 330 counties
as the sample. The location of the sample counties is shown in Figure 1.
Figure 1 The geographic location of the selected counties
Temperature. The daily weather data are drawn from the National Climatic Data Center (NCDC) of the National
Oceanic and Atmospheric Administration (NOAA). Alternatively, we reshape the resolution of the data files into 1 km1
km and use the daily temperature to calculate the heating degree-days and cooling degree-days. Deschênes and Greenstone
(2011) noted that the temperature effect from climate change on economic activities is modest. In aiming to amplify the
effect of temperature on electricity consumption, we build two indexes: heating degree-days in 1,000 degrees (HDDK) and
cooling degree-days in 1,000 degrees (CDDK) are used to make the estimated value of the coefficient not very small and
distinguishable from zero. The threshold setting for heating and cooling is critical to the result. We set threshold to take the

10
non-linear effect on temperature into consideration. In winter the main appliances for heating is radiator rather than air
conditioner. What’s more, in north of China the standard of heating policy is the successive 5 days with daily average
temperature below 5 C . In summer, the main appliances for cooling is the air conditioner. In current regulation of energy-
saving design standards, cooling degree days is calculated at the threshold of 26 C . Consequently, different from previous
work that sets 18 C as the threshold temperature, we set 5 C as the threshold for heating and 26 C as the threshold for
cooling based on Wei’s works (Wei et al. 2014) since China is a vast country with complex and diverse climate types. The
detailed procedures to calculate the heating degree-days in 1,000 degrees (HDDK) and cooling degree-days in 1,000
degrees (CDDK) are shown as follows:
, , ,
1
,/1000 max(0,5 ), 1,2,3,...,330, 1,2,3... 3 5, ., 6tn
i t i t
min
i ti t
i
T i tHDDK Tem Tem=
= −= = = (0)
, ,, ,
1
,/1000 max(0, 26), 1,2,3,...,330, 1,2,3....,365t
max
i
n
i t i t i t
i
tCDDK Tem T i tem T=
== = = − (0)
where max
,i tT and min
,i tT are the daily highest and lowest temperatures, respectively, in the unit of centigrade degrees.
Rural population and households. Rural population refers to the residents who lived in a certain county for more than
6 months. Rural households refer to the number of families whose members lived there for over one year.
Electricity consumption per capita. National Statistical of Bureau of China hopes to separate household electricity
consumption from total rural electricity consumption. However, at the county scale, the statistics on the electricity
consumption for rural households are not available and are aggregated in total rural electricity consumption (excluding
electricity consumption by the rural public sector). Therefore, electricity consumption per capita is equal to the rural
households electricity consumption divided by the rural population. Moreover, electricity consumption per household is
equal to electricity consumption divided by the number of rural households.
Gross farm production is the total production value of the primary sector in which rural residents are mainly engaged.
Furthermore, to make production values comparable, deflator indexes for the agriculture value that is added are used to
eliminate the effect of the price fluctuation in different years.

11
Rural household annual net income. The rural household annual net income is measured at the current year’s price
level. To keep the net income comparable, the consumer price indexes for each city from 2006-2015 are used to eliminate
the effects of inflation.
Rural population and households, Gross farm production, Electricity consumption and Rural household annual net
income at the county scale are collected from the yearbooks of the administrative affiliation cities for 2006-2015.
Precipitation. The dataset is provided by the Data Center for Resources and Environmental Sciences at the Chinese
Academy of Sciences (RESDC) (http://www.resdc.cn/). We control for the precipitation to avoid the effect from farmer’s
agricultural production customs that are induced by long-term precipitation trends.
Distance. We acquired the geographical coordinates not only of the downtown in each county but also of the
downtown in the corresponding prefecture-level city. The distances are calculated by the ARCGIS in the equidistant
projection. The shorter the distance between the county and city, the more numerous the economic connections. Moreover,
the infrastructure of the counties that are located at a shorter distance from a city will be better than the infrastructure of
the other counties that are further from a city.
4. Results
This section includes three parts. Section 4.1 shows the situation of the electricity consumption in rural China. Section
4.2 reports the results from the model. Section 4.3 explorers the further determinants that affect electricity consumption.
4.1 Electricity consumption in rural China
As shown in Figure 2(a), electricity consumption per capita has been increasing since 2006. At the national level, the
average electricity consumption per capita increased from 782 KWh in 2006 to 1,393 KWh in 2015 with an annual increase
rate of 6.7%. Electricity consumption per household has a similar trend with the above electricity per capita in Figure 2(b).
In total, the average annual increase rate at the national level is 5.8%, and electricity per household increased from 2,048

12
KWh in 2006 to 3,420 KWh in 2015. According to the scatter plots of Figure 3, the net income per capita has a significant
positive correlation with electricity consumption. However, it is not obvious that HDDK has a significant correlation with
electricity consumption or that CDDK has an insignificant correlation with electricity consumption. Concerning
precipitation, there is no significant correlation with electricity consumption.
2006 2007 2008 2009 2010 2011 2012 2013 2014 20150
400
800
1200
1600
2000
2006 2007 2008 2009 2010 2011 2012 2013 2014 20150
1000
2000
3000
4000
5000
6000
North Northeast East Central Southeast Northwest whole nation
units: KWh per captia(a) units: KWh per household
(b)
Figure 2 (a) The change in the annual rural electricity consumption per capita from 2006-2015. (b) The change in
the annual rural electricity consumption per household from 2006-2015. Source: the authors’ calculation from the
collected dataset. North group includes four provinces (109 counties): Beijing, Hebei, Shanxi and Neimenggu.
Northeast group includes two provinces (13 counties): Jilin and Heilongjiang. East group includes five provinces (64
counties): Jiangsu, Anhui, Zhejiang, Jiangxi and Shandong. Central group includes five provinces (85 counties):
Henan, Hubei, Hunan, Guangdong and Guangxi. Southwest group includes one province and one municipality (44
counties): Yunnan and Chongqing. Northwest group includes 2 provinces (10 counties): Qinghai and Ningxia.
5 10 15 20 25 30-6
-4
-2
0
2
0 1 2 3 4 5-6
-4
-2
0
2
0.0 0.5 1.0 1.5-6
-4
-2
0
2
0 10000 20000 30000-6
-4
-2
0
2
(b)
ln(
Ele
ctr
icit
y p
er c
ap
ita
)
ln(income)
(a)
ln(
Ele
ctr
icit
y p
er c
ap
ita)
HDDK
(c) (d)
ln(
Ele
ctr
icit
y p
er c
ap
ita
)
CDDK
ln(
Ele
ctr
icit
y p
er c
ap
ita
)
Precipitation 2006 2007 2008 2009 2010 2011 2012 2013 2014 2015 Average0
20
40
60
80
100
120
140 Days Below 5 ˚Ϲ Days Above 26 ˚Ϲ
(e)
Figure 3 (a) Scatter plots of the net income and rural electricity consumption per capita. (b) Scatter plots of the
heating degree-days and rural electricity consumption per capita. (c) Scatter plots of the cooling degree-days and
rural electricity consumption per capita. (d) Precipitation and rural electricity consumption per capita. (e) Annual

13
number of days below 5 C or above 26 C between 2006 and 2015.
4.2 Main Results: CDDK and HDDK with Electricity Consumption
Table 1 reports the correlation between electricity consumption per capita and HDDK and CDDK with the OLS
(Ordinate Least-Square method) and panel model. As we discussed above, Table 1 shows the correlation between electricity
consumption and HDDK and CDDK in the baseline estimation. The result in column A1 shows that HDDK and CDDK
both have a significant positive correlation with electricity consumption and CDDK; specifically, CDDK has a more
positive correlation with electricity consumption than HDDK. Column A2 shows that by considering HDDK and CDDK
and controlling for precipitation, CDDK still has a positive relationship with electricity consumption. However, HDDK
seems to have a negative correlation with electricity consumption without satisfying any significant levels.
Since the time span of the dataset that we use is from 2006-2015 and the samples that we collect include 33 cities in
24 provinces, it is evident that the heterogeneity in the samples from the year, regional and individual effects may influence
the estimate of the effect from HDDK and CDDK on electricity consumption. Deschenes and Greenstone (2012) noted that
the absence of a regional effect would obviously underestimate the effect of climate change on socio-economic activities.
Therefore, we consider the regional effect to employ the fixed-effect panel data model.
In Table 1, columns B1-B3 show the results of the panel model considering the year and region effects. After adding
the income and its interaction with HDDK and CDDK, column B3 shows that CDDK shares approximate coefficients with
column A2. Moreover, the coefficient of ln(income)*CDDK shows that the positive relationship between CDDK and
electricity consumption may become lower as income increases. However, HDDK still has no significant impact on the
electricity consumption in the models that are shown in columns B1-B3 of Table 1.
Table 1 Income, Temperature and Electricity Consumption
OLS Panel Model
A1 A2 B1 B2 B3
CDDK 0.039*** 0.504*** -0.151* -0.128 0.492* (-4.121) (-5.264) (-1.921) (-1.632) (-1.842)
HDDK 0.148*** -0.006 -0.007 -0.004 0.024 (-5.123) (-0.173) (-1.463) (-0.885) (-0.401)

14
ln(income) 0.345*** 0.440***
(-10.237) (-8.652)
ln(income)*CDDK -0.146** (-2.443)
ln(income)*HDDK -0.006 (-0.483)
Year & Regional effect No No Yes Yes Yes
Precipitation No Yes No No No
Observations 3,228 3,228 3,228 3,228 3,228
R- Square 0.11 0.28 - - -
Note: The t statistics are in parentheses; * p < 0.1, ** p < 0.05, *** p < 0.01.
4.3 North-South division determines diverse modes of electricity consumption
Columns C1-C3 of Table 2 show that the coefficients of CDDK and ln(income)*CDDK keep their significance after
controlling for precipitation, distance, household, and gross farm production. The geographic differences form different
climate patterns. Particularly in China, the geographical division of the north and south gradually shapes the diverse
lifestyles in each region (Ebenstein et al. 2017). Here, we define the North effect as being equal to 1 if the county is located
in the north with 800 mm of annual isohyet in meteorology; otherwise, the North effect is 0. The remarkable feature of the
North-South difference is the way that the residents live through winter. Moreover, in winter, the formation of the habit of
winter heating helps the residents to live through the cold winter. Due to income inequality, the different choices of heating
fuel and devices may affect energy and electricity consumption (Zheng et al. 2014). In column D3, we estimate the effect
of CDDK and HDDK on electricity consumption under the average net income. According to Figure 2(e), the average
amount of cooling days in summer is approximately 120, and the average amount of heating days in winter is 111. With
the average net income fixed, a one-degree temperature increase in the summer days may lead to a 0.015% (0.128%0.12)
increase in electricity consumption with a significance level of 10%. Moreover, a one-degree temperature decrease in
winter days would lead to a 0.002% (0.016%0.11) increase in electricity consumption with a significance level of 10%.
Furthermore, the North effect would lead to 0.021% (0.189%0.11) more electricity consumption than the South effect.
Table 2 Temperature and Electricity Consumption Conditions and the North-South Effect
No habits of winter heating Habits of winter heating
C1 C2 C3 D1 D2 D3
CDDK 0.603** 0.572** 0.560** 0.549** 0.610* 0.128*
(2.231) (2.093) (2.054) (2.012) (1.814) (1.732)

15
HDDK 0.027 0.035 0.046 0.038 0.019* 0.016*
(0.441) (0.573) (0.753) (0.627) (0.767) (0.756)
ln(income) 0.446*** 0.440*** 0.422*** 0.415*** 0.392*** 0.394***
(8.753) (8.563) (8.243) (8.101) (8.115) (8.116)
ln(income)*CDDK -0.150** -0.0142** -0.143** -0.135** -0.114**
(-2.524) (-2.343) (-2.362) (-2.215) (-2.001)
ln(income)*HDDK -0.007 -0.008 -0.011 -0.010
(-0.492) (-0.642) (-0.852) (-0.711)
North* HDDK 0.229* 0.189*
(1.801) (1.801)
[ln(income)- ln( )income ]*CDDK -0.09**
(-2.321)
Year& Regional effect Yes Yes Yes Yes Yes Yes
Precipitation Yes Yes Yes Yes Yes Yes
Distance No Yes Yes Yes Yes Yes
Amount of rural household No No Yes Yes Yes Yes
Gross farm production No No No Yes Yes Yes
Observations 3,234 3,234 3,151 3,151 3,151 3,151
Note: Dependent variable: ln (electricity consumption per capita). The t statistics are in parentheses; * p < 0.1, ** p < 0.05,
*** p < 0.01.
To determine the distinct effect of temperature fluctuation on rural household electricity consumption in various
regions, we divide all samples into 5 groups by the administration code of county, which are the north group, northeast
group, east group, central group, and southwest group as Fig.2. Each group was processed with a regression with the same
model in column D2 of Table 2.
Column (1) in Table 3 shows that CDDK has a positive correlation with electricity consumption in the north region.
A one-degree temperature increase in summer days may cause a 0.39% (3.256%0.12) increase in electricity consumption.
In addition, column (2) shows a similar result for the northeast region. The north and northeast regions share a similar
result with column D3 in Table 2. However, Table 3 shows that income has a significant positive correlation with electricity
consumption in the eastern, central and southwestern regions. Thus, temperature fluctuation is not the key factor that affects
rural electricity consumption.
Table 3 Temperature and Electricity Consumption from a Regional Perspective
North Northeast East Central Southwest
(1) (2) (3) (4) (5)
CDDK 3.256*** 41.550* -0.578 -0.624 0.462

16
(3.157) (1.779) (-0.491) (-0.712) (0.853)
HDDK 0.474 5.414** 1.365* -0.520 -0.886
(1.182) (2.241) (1.674) (-0.589) (-0.986)
ln(income) 0.885*** 7.150** 0.504* 0.615*** 0.380***
(3.472) (2.371) (1.773) (3.212) (2.631)
ln(income)*CDDK -0.8413*** -10.07* 0.223 0.200 -0.171
(-3.589) (-1.831) (0.928) (1.067) (-1.302)
ln(income)*HDDK -0.1601* -1.442** -0.290* 0.115 0.121
(-1.756) (-2.404) (-1.912) (0.693) (0.522)
North* HDDK - - 0.0543 0.517 -
- - (0.171) (1.412) -
Year & Regional effect Yes Yes Yes Yes Yes
Observations 1,054 130 786 774 440
Note: Dependent variable is ln (electricity consumption per capita). Control variables include precipitation, distance, rural
household and gross farm production. The t statistics are in parentheses; * p < 0.1, ** p < 0.05, *** p < 0.01.
5. Discussion
This section is divided into two parts. The first part explains how the change in temperature affects rural electricity
consumption in diverse ways. The second part clarifies the origin of how temperature fluctuation affects electricity
consumption in different regions under different climate conditions.
5.1 Temperature affects electricity consumption in rural China
5.1.1 An increase in temperature impacts productive activities
We explain how an increase in temperature affects the electricity of rural households in two ways. As Figure 4(a)
shows, currently, colour TVs, refrigerators and washing machines are three of the most popular electric appliances in rural
households. In 2015, the average number of air conditioners in rural households was approximately 38 sets in every 100
houses. This number is much higher (114 sets) in urban households. When the temperature increases in summer, the use of
air conditioners, refrigerators and electric fans may increase the small consumption of electricity. As income increases,
families tend to increase their living standard by purchasing more efficient devices, which means that with the same
electricity consumption, a family would achieve a better living environment. Furthermore, an increase in income may help
the residents to own or construct homes with better heat preservation to allow the indoors to be less susceptible to outdoor

17
weather changes.
In terms of productive activities, a sustained increase in temperature generally occurs in the summer, which is the
busy farming season. Take agricultural activities as an example. Field crops are more sensitive to temperature and
precipitation. A high dew-point temperature may accelerate the evaporation of water in the field. To compensate, farmers
may choose to use electric motors to irrigate the fields with river or reservoir water in case of drought. Consequently, more
frequently increasing temperatures would lead to more electricity consumption.
5.1.2 A decrease in temperature increases the time spent indoors
A decrease in temperature below 5 C mainly affects rural electricity consumption in terms of daily life. A sustained
decrease in temperature occurs in the winter when the autumn harvest has finished. At this time, field crop productive
activities have finished, and the decrease in temperature leads to less willingness for outdoor farming. As a result, the
productive activities in winter make an insignificant contribution to electricity consumption. However, in terms of daily
life, the primary energy demand for rural households in winter is cooking and heating. Based on Hou et al. (2017) work,
there are significant rural-urban deviations in cooking fuel choices (see Figure 4(b)). The electricity for cooking occupies
only a small portion (14.4% for rural areas in Figure 4(b)) and is not the conclusive factor that changes the rural household
electricity in winter.
2004 2006 2008 2010 2012 2014 2016
0
30
60
90
120
Cloth Washing Refrigerator Air conditioner
B&W TV Color TV Computer
units:set (a)
Figure 4 (a) Quantity of rural household electric appliances for every 100 households. Source: Chinese Statistical
Yearbook (2006-2016), NBS National Bureau of Statistics. (b) Different energy sources of cooking fuels in Chinese rural
households in 2012. Source: (Hou et al. 2017).
0% 20% 40% 60% 80% 100%
Rural Areas
Township
Urban Areas
(b)
Biomass Coal Marsh gas Natural gas
LPG Electricity Other

18
It is very cold in northern China during the winter, and people traditionally adopt winter heating. Although a heating
policy is implemented in urban areas, heating customs may inevitably be introduced into some portion of rural households.
Moreover, rural areas have economically adopted a water heating system in winter rather than the electric heating system
of urban areas. Two of the most common types of heating systems are the Chinese Kang (23.78%) and stove heating
(28.72%) (Zheng et al. 2016, Zhuang et al. 2009). We believe that the direct increase in electricity consumption that is
induced by electric heating appliances occupies a small proportion of the total winter electricity consumption in rural areas.
The results evidently support the estimates that we obtained in column D3 of Table 2. The counties with habits of winter
heating are mainly located in the north China plain and northeast region. The average temperature level is lower than 0 C
in winter in these regions. Therefore, the residents who live in houses with heating systems in winter may tend to reduce
their time outdoors. The shift in the activity space from outdoors to indoors increases the possibility of using electric
devices in the household. Moreover, the common choice of fuels for heating systems has saved considerable expenditures
for residents and leaves residents scarcely aware of energy-saving behaviours when using household electric appliances.
5.1.3 Comparison with related works
In section 4, our results show that temperature fluctuations may increase electricity consumption. Due to the limitation
of the available data, there is no similar research on China. Chong (2012) indicates that a rising temperature may increase
electricity consumption. With the threshold temperature of 18 C for cooling and heating, Chong (2012) work showed in
California’s residential sector that a one-degree temperature increase in CDD would lead to 0.056% more of daily electricity
use, while a one-degree temperature increase in HDD would lead to 0.027% more of daily electricity use. We use annual
electricity consumption to estimate the aggregate effect in the long run. As a result, we obtain similar correlations between
temperature and electricity consumption although the short-term temperature effect that Chong estimated on electricity is
much more than our short-term temperature effect.
It is evident that the effects of climate on electricity consumption are elastic in the short term, while it may be inelastic

19
in the long term, which leads to the short-term effect being greater than the long-term effect. Moreover, the progress of
agriculture electrification and an under-developed grid infrastructure restrain the effects of temperature on electricity.
Specifically, the difference between Chong’s findings and our findings is that we provide an estimate regarding the
remarkable effect of temperature that is induced by the division of the North and South effects on electricity consumption
in China. The underlying disparity in lifestyle between the north and south forms considerable electricity consumption
behaviours. Although our results contradict the hypothesis that ‘global warming decreases energy use in winter but it may
increase it in summer’ (Pilli-Sihvola et al. 2010), we believe that the shock of a decreasing temperature and adaption
definitely have an impact on electricity consumption.
5.2 Effects of climate type on electricity consumption by region
As Figure 5 shows, the annual temperature distribution in China is gradually shifting from north to south, and the
average precipitation of the northern region is approximately 20 mm. The certain level of precipitation is much lower than
the level of precipitation that is needed for field crop growth. To some extent, the initiative of manual irrigation to
compensate for the loss in precipitation is a measure of adaptation to weather change. The even lower level of precipitation
makes a substantial contribution to the rural electricity increase in the northern region, while a sustainable increase in
temperature occurs in the summer. Moreover, the counties all have habits of winter heating, which leads to the decrease in
temperature having no significant upward impact on rural electricity consumption.
In addition, the situation in the northeast is quite similar to the northern region and leaves field crops heavily
dependent on agriculture irrigation. However, the situation in the eastern and central regions is different from the situation
in the north. The CDDK has no significant correlation with rural electricity consumption. In the central and eastern regions,
the hot temperature and humid climate may combine with heavy precipitation because of the rainy season. The productive
activities in the summer have a minor impact on the rural electricity consumption increment. Regarding the eastern region,

20
in the winter, the perceived temperature would be much lower than the actual temperature due to the humidity. The coldness
that is induced by the humid climate causes the incremental change in rural electricity consumption in the winter. The effect
of an increase in income would help residents to choose a more comfortable shelter accommodation from the cold.
Concerning the central and southwestern regions, the major factor determining rural electricity consumption is
income. The average levels of precipitation and temperature are much higher than the national average levels. Furthermore,
the share of the productive values of animal agricultural such as husbandry and fisheries is much smaller than in the
northern and north-eastern regions. Consequently, the climate condition and the structure of industries result in the
insignificant correlation between temperature fluctuations and rural electricity consumption.
Figure 5 (a) Annual average temperature from 2006 to 2015 in China. (b) Annual average precipitation from 2006 to 2015
in China.
6. Conclusions
This paper attempts to estimate the effect of temperature fluctuations on electricity consumption in rural China due to
weather changes. We use annual electricity consumption to estimate the temperature effect on the rural residential sector
with a fixed-effect panel model. The results show that CDDK has a positive correlation. Simultaneously, this correlation
tends to disappear as the net income per capita increases. Moreover, a one-degree temperature increase in the summer days
leads to a 0.015% increase in electricity consumption with the average net income. To explore the correlation between

21
HDD and electricity consumption, we divide the samples into two groups: north and south. The results show that the
electricity consumption in the counties in the south increases by 0.002% with a one-degree temperature decrease in the
winter days. In addition, the households in north China tend to use 0.021% more electricity than the households in the
south with a one-degree temperature increase in the winter days.
Global warming contributes to the occurrence of extreme weather, which leads to higher temperatures in the summer
and lower temperatures in the winter. In our analysis, the effect of the increase in temperature is more powerful than the
decrease in temperature, which is consistent with the works of Chong (2012) and Pilli-Sihvola et al. (2010). Additionally,
income and the reduction in the time that is spent outdoors are both remarkable adaptions to the weather changes in rural
China. Income would help the residents to live in comfortable shelter accommodations from the temperature changes
(Aroonruengsawat and Auffhammer 2011). Furthermore, the reduction in the time that is spent outdoors may directly
reduce the exposure to the cold (NIEH 2010, IPCC 2014). We conclude that the extreme weather that is induced by global
warming may increase energy use, particularly electricity consumption. Our hypothesis that is presented in section 2 is
therefore supported. Global warming increases electricity consumption in rural China during both the winter and the
summer.
We attempted to collect the statistical data of 330 counties from 2006-2015 as much as possible. Unfortunately, some
limitations still exists, such as the lack of information for households (e.g., by age, gender, and education level) (Chen et
al. 2013, Santamouris et al. 2007, Zhou and Teng 2013) and the recognition of energy saving behaviours (Bhattacharyya
and Ohiare 2012). These two aspects of the variables help to emphasize the effect that temperature has on electricity
consumption indirectly. Climate change has influenced rural households in China, and these effects should not be
overlooked.

22
Acknowledgements
This study is supported by China’s National Key R&D Program (2016YFA0602801), National Natural Science
Foundation of China (Nos.71673026, 71642004), the Special Fund for Joint Development Program of Beijing Municipal
Commission of Education, the Fundamental Research Funds for the Central Universities and the Fok Ying Tung Education
Foundation for financial support. The views expressed in this paper are solely the authors’ own and do not necessarily
reflect the views of the supporting agencies and authors’ affiliations. The authors alone are responsible for any remaining
deficiencies.
References
Afshari A, Friedrich LA. 2017. Inverse modeling of the urban energy system using hourly electricity demand and weather
measurements, Part 1: Black-box model. Energy and Buildings.157:126-138.
Ang BW, Wang H, Ma X. 2017. Climatic influence on electricity consumption: The case of Singapore and Hong Kong.
Energy.127:534-543.
Aroonruengsawat A, Auffhammer M. 2011. Impacts of climate change on residential electricity consumption: evidence
from billing data. In: The Economics of climate change: Adaptations past and present. University of Chicago Press,
Chicago, USA, pp. 311-342.
Auffhammer M, Baylis P, Hausman CH. 2017. Climate change is projected to have severe impacts on the frequency and
intensity of peak electricity demand across the United States. Proceedings of the National Academy of
Sciences.114:1886-1891.
Bessec M, Fouquau J. 2008. The non-linear link between electricity consumption and temperature in Europe: A threshold
panel approach. Energy Economics.30:2705-2721.
Bhattacharyya SC, Ohiare S. 2012. The Chinese electricity access model for rural electrification: Approach, experience
and lessons for others. Energy Policy.49:676-687.
Brown MA, Cox M, Staver B, Baer P. 2014. Climate change and energy demand in buildings. Proceedings of the American
Council for an Energy Efficient Economy (ACEEE) Summer Study on Energy Efficiency in Buildings Pacific Grove.
Burke M, Dykema J, Lobell DB, Miguel E, Satyanath S. 2015. Incorporating Climate Uncertainty into Estimates of Climate
Change Impacts. Review of Economics and Statistics.97:461-471.
Burke MB, Miguel E, Satyanath S, Dykema JA, Lobell DB. 2009. Warming increases the risk of civil war in Africa.
Proceedings of the National Academy of Sciences 106:20670-20674.
Chen J, Wang XH, Steemers K. 2013. A statistical analysis of a residential energy consumption survey study in Hangzhou,
China. Energy and Buildings.66:193-202.
Chen L, Fang X-M, Fang X-Q. 2006. Impacts of climate warming on heating climatic conditions and energy requirements
over China in the past 20 years. Journal of Natural Resources.7:590-597. (in Chinese).
Chong H. 2012. Building vintage and electricity use: Old homes use less electricity in hot weather. European Economic
Review.56:906-930.
Deschênes O, Greenstone M. 2011. Climate Change, Mortality, and Adaptation: Evidence from Annual Fluctuations in

23
Weather in the US. American Economic Journal: Applied Economics.3:152-185.
Deschenes O, Greenstone M. 2012. The Economic Impacts of Climate Change: Evidence from Agricultural Output and
Random Fluctuations in Weather. American Economic Review.102:3761-3773.
Dirks JA, Gorrissen WJ, Hathaway JH, Skorski DC, Scott MJ, Pulsipher TC, Huang M, Liu Y, Rice JS. 2015. Impacts of
climate change on energy consumption and peak demand in buildings: a detailed regional approach. Energy.79:20-
32.
Ebenstein A, Fan M, Greenstone M, He G, Zhou M. 2017. New evidence on the impact of sustained exposure to air
pollution on life expectancy from China's Huai River Policy. Proceedings of the National Academy of
Sciences.114:10384-10389.
Fan J-L, Tang B-J, Yu H, Hou Y-B, Wei Y-M. 2014. Impact of climatic factors on monthly electricity consumption of
China’s sectors. Natural Hazards.75:2027-2037.
Franco G, Sanstad AH. 2008. Climate change and electricity demand in California. Climatic Change.87:139-151.
Hekkenberg M, Benders RMJ, Moll HC, Schoot Uiterkamp AJM. 2009. Indications for a changing electricity demand
pattern: The temperature dependence of electricity demand in the Netherlands. Energy Policy.37:1542-1551.
Hou BD, Tang X, Ma CB, Liu L, Wei YM, Liao H. 2017. Cooking fuel choice in rural China: results from microdata.
Journal of Cleaner Production.142:538-547.
Hsiang SM. 2010. Temperatures and cyclones strongly associated with economic production in the Caribbean and Central
America. Proceedings of the National Academy of Sciences 107:15367-15372.
IPCC (2007) Climate change 2007: Impacts, adaptation and vulnerability. contribution of working group II to the fourth
assessment report of the intergovernmental panel on climate change. In: Parry ML, Canziani OF, Palutikof JP, van
der Linden PJ, Hanson CE (eds) Cambridge University Press, Cambridge,UK
Istiaque A, Khan SI. 2018. Impact of Ambient Temperature on Electricity Demand of Dhaka City of Bangladesh. Energy
and Power Engineering.10:319-331.
Jovanović S, Savić S, Bojić M, Djordjević Z, Nikolić D. 2015. The impact of the mean daily air temperature change on
electricity consumption. Energy.88:604-609.
Khanna S, Cropper M. 2012. Impact of climate change on residential electricity consumption: evidence from weather
fluctuations across building climate zones in California. University of Maryland, College Park, USA.
Lam JC, Tang HL, Li DHW. 2008. Seasonal variations in residential and commercial sector electricity consumption in
Hong Kong. Energy.33:513-523.
Liu G, Zhang L, He B, Jin X, Zhang Q, Razafindrabe B, You H. 2014. Temporal changes in extreme high temperature, heat
waves and relevant disasters in Nanjing metropolitan region, China. Natural Hazards.76:1415-1430.
Luo G, Wang Y. 2007. The Analysis on Current Situation, Difficulties and Strategies on Power Universal Service in China
Rural Areas. Journal of North China Electric Power University(Social Sciences).3:1-5. (in Chinese).
Miller NL, Hayhoe K, Jin J, Auffhammer M. 2008. Climate, extreme heat, and electricity demand in California. Journal of
Applied Meteorology and Climatology.47:1834-1844.
Narayan PK, Smyth R, Prasad A. 2007. Electricity consumption in G7 countries: A panel cointegration analysis of
residential demand elasticities. Energy Policy.35:4485-4494.
NIEH. 2010. A human health perspective on climate change. http://www.niehs.nih.gov/health/docs/climatereport2010.pdf.
Accessed 26 Apr 2018
Nordhaus WD (1996) Do real-output and real-wage measures capture reality? The history of lighting suggests not. In:
Bresnahan TF, Gordon RJ (eds) The economics of new goods. University of Chicago Press, Chicago, USA, pp 27–
70
Peng W, Pan J (2008) Factors influencing rural electricity demand: Based on the empirical analysis of sample survey in
Hubei province. Chin Rural Econ 6:66–73 (in Chinese)

24
Pilli-Sihvola K, Aatola P, Ollikainen M, Tuomenvirta H. 2010. Climate change and electricity consumption-Witnessing
increasing or decreasing use and costs? Energy Policy.38:2409-2419.
Qi Y, Ma L, Zhang L. 2007. Climate Change Governance in China: A Case Study. China Population, Resources and
Environment.17:8-12.
Sailor DJ. 2001. Relating residential and commercial sector electricity loads to climate - evaluating state level sensitivities
and vulnerabilities. Energy.26:645-657.
Santamouris M, Kapsis K, Korres D, Livada I, Pavlou C, Assimakopoulos MN. 2007. On the relation between the energy
and social characteristics of the residential sector. Energy and Buildings.39:893-905.
Shen X. 2014. Influencing Factors on Rural Residential Electricity Demand in China. Statistical Research.31:84-90. (in
Chinese).
Sun L, Wang Q, Ge S. 2017. Urban resident energy-saving behavior: a case study under the A2SC framework. Natural
Hazards.91:515-536.
Valor E, Meneu V, Caselles V. 2001. Daily air temperature and electricity load in Spain. J Appl Meteorol.40:1413-1421.
Wei Y-M, Liao H, Wang K. 2014. China Energy Report(2014):Energy Poverty Research. Beijing: Science Press.
Yang D, Gao F. 2007. Quantitative Evaluation and Analysis on Human Health Risk. China Population, Resources and
Environment.17:55-59.
Yi-Ling H, Hai-Zhen M, Guang-Tao D, Jun S. 2014. Influences of Urban Temperature on the Electricity Consumption of
Shanghai. Advances in Climate Change Research.5:74-80.
Zhang LX, Yang ZF, Chen B, Chen GQ. 2009. Rural energy in China: Pattern and policy. Renewable Energy.34:2813-2823.
Zheng X, Wei C, Yu Y, Qin P. 2016. Chinese Household Energy Consumption Report 2016. Beijing: Science Press.
Zheng XY, Wei C, Qin P, Guo J, Yu YH, Song F, Chen ZM. 2014. Characteristics of residential energy consumption in
China: Findings from a household survey. Energy Policy.75:126-135.
Zhou SJ, Teng F. 2013. Estimation of urban residential electricity demand in, China using household survey data. Energy
Policy.61:394-402.
Zhou ZR, Wu WL, Wang XH, Chen Q, Wang O. 2009. Analysis of changes in the structure of rural household energy
consumption in northern China: A case study. Renewable & Sustainable Energy Reviews.13:187-193.
Zhuang Z, Li YG, Chen B, Guo JY. 2009. Chinese kang as a domestic heating system in rural northern China-A review.
Energy and Buildings.41:111-119.