public xpenditures in south sudan: are they...
TRANSCRIPT

World Bank – Poverty Reduction and Economic Management Unit (PREM), Africa Region, 2013 P a g e | 1
Public Expenditures In South Sudan: Are They Delivering?
1. Introduction: Context and Objectives
Budget expenditures have been on the rise in South Sudan since the
Comprehensive Peace Agreement (CPA), reaching levels that are quite in
excess of those of its East African neighbors. The approved budget surged
from SSP3.4 billion in 2006 to SSP5.9 billion after independence in 2011,
almost a twofold increase. The vast oil resources that fund almost entirely
these expenditures have allowed the newly born South Sudan to sustain public
expenditures of more than US$ 300 per person1, much higher than its
neighbors.
Figure 1: Government per capita current expenditures are comparatively large.
This note examines to what extent the oil resources that finance most public
expenditure are productively used to address the huge development
challenges of South Sudan. The quality of leadership and economic
management with respect to these issues will largely determine whether
South Sudan will follow the path of those middle-income oil producing
countries, such as Gabon, Nigeria, or Equatorial Guinea which have been
unable to provide basic services to the majority of their population, or
alternatively reflect the experience of those other African countries, which in
the last decade, have seen remarkable progress in both economic growth and
social indicators.
1 Over most of 2011, the official and black market exchange rate were not markedly different, so this figure is resilient to the
use of either measure of the exchange rate.
0 100 200 300 400
Ethiopia
Sierra Leone
Liberia
Uganda
Rwanda
Kenya
Sudan
South Sudan
Current USD per Capita, 2011 or last available year
World Bank
South Sudan Economic Brief
Issue No.2, February 2013
This is the 2nd
in a series of
briefs on economic policy, public
expenditure management and
current development challenges
in South Sudan, published by the
World Bank.
Acknowledgements: The note relies on three main data
sources: MoFEP, MoH and NBS. The
World Bank is grateful for data and
assistance provided by these institutions
in drafting of this note.
This note was written by Kimo Adiebo,
with contributions from Luca Bandiera,
and Paolo Zacchia
Task Team Leader: Kimo Adiebo
Lead Economist: Paolo Zacchia
Acting Sector Manager: Paolo Zacchia
Comments on draft should be submitted
to [email protected] and
Pub
lic D
iscl
osur
e A
utho
rized
Pub
lic D
iscl
osur
e A
utho
rized
Pub
lic D
iscl
osur
e A
utho
rized
Pub
lic D
iscl
osur
e A
utho
rized
Pub
lic D
iscl
osur
e A
utho
rized
Pub
lic D
iscl
osur
e A
utho
rized
Pub
lic D
iscl
osur
e A
utho
rized
Pub
lic D
iscl
osur
e A
utho
rized

World Bank – Poverty Reduction and Economic Management Unit (PREM), Africa Region, 2013 P a g e | 2
The note looks at the three key dimensions in which the public budget affects development outcomes:
(i) the macro-dimension, i.e. the ability of the budget to shape an overall macro-economic policy that
promotes stability and economic growth; (ii) the strategic dimension, i.e. the ability of the budget to
translate consistently the nation’s strategic priorities into actual spending patterns; and (iii) the service
delivery dimension, i.e. the ability of the budget to deliver quality public goods and services to the
population. The primary objective of this brief review of budget policy is to assist the Ministry of Finance
and economic Planning (MoFEP) in identifying appropriate measures to improve the effectiveness of
government expenditure with particular focus on health and education sectors.
2. The budget as an instrument of stability and economic growth
The purpose of this section is to analyze the capacity of the government to maintain fiscal discipline,
and review the impact of public expenditure on political and economic stability, and on economic
growth. As an oil-dependent country, South Sudan faces important challenges to its fiscal management.
Oil revenues tend to show high volatility and uncertainty compared with other fiscal revenues given
volatility of oil prices and possible uncertainty associated with the size and exhaustibility of oil reserves.
Moreover, as oil revenues are largely originating from abroad in the form of export proceeds, they may
also impact on the real exchange rate. Therefore, South Sudan should address a number of critical
questions, including: (i) how to protect social expenditures and the non-oil economy from the high
volatility in oil revenues? and (ii) how to achieve long-term fiscal sustainability and adequate savings for
future generations while allocating sufficient resources to meet development needs?
In the context of South Sudan, where oil revenues are mostly determined by exogenous factors and non-
oil revenues are still very limited, due to the underdevelopment of the non-oil economy, the overall
fiscal policy stance is overwhelmingly determined by public expenditure policy rather than by revenue
policy. It is hoped that this analysis will assist the government in identifying its medium-term fiscal
challenges and appropriate policy responses.
The aggregate parameters of fiscal policy have a direct impact on state security. As the recent events
following the shutdown of oil production in January 2012 have demonstrated, given the extremely
volatile security situation in which South Sudan operates, the ability of fiscal policy to set aside fiscal
reserves is a critical ingredient in allowing the country to weather the political shocks. This requires both
a responsible overall fiscal policy, by setting aside some fiscal reserves, as well as the ability to
implement consistently the set fiscal policy during the budget year.
The aggregate parameters of fiscal policy have a direct impact on the economic stability. The marked
increase in the level of public expenditures since the beginning of 2011 had been associated with very
high price inflation and currency depreciation in South Sudan in 20112. Rising levels of public
expenditures have translated into an almost corresponding increase in the demand for imported goods
2 See World Bank, South Sudan Economic Brief, Issue No.1, May 2012: “Inflation in South Sudan”.

World Bank – Poverty Reduction and Economic Management Unit (PREM), Africa Region, 2013 P a g e | 3
and services, given the extremely limited domestic productive capacity. This has, in turn, led to a
depreciating exchange rate on the parallel market, since the Bank of South Sudan was holding some of
the foreign currency to build up its reserves, creating therefore an imbalance in the demand for and
supply of foreign currency. The depreciation of the currency, in turn, had fuelled inflation through higher
import prices in local currency. As shown in Figures 2 and 3, this had led to a situation in which public
expenditure, the parallel exchange rate and consumer inflation moved jointly in 2011. Another sign of
this dynamics was seen in the summer of 2012, when public expenditure fell drastically, both price
inflation and exchange rate depreciation continued shortly, but, since September 2012, helped also by
the announcement of the Addis Ababa agreement with Sudan, they subsided drastically.
Figure 2: Inflation has increased with Government
expenditure.
Figure 3: Inflation and Exchange Rate have shown similar trends.
While approved budgets in the last few years have been inspired by a cautious fiscal policy, high public
expenditures have been caused mainly by large budget overruns, making approved budgets of little
significance to actual macroeconomic policy. Actual spending in the first six months of 2011 was SDG
4.4 billion. Overspending exceeded 50% of the approved budget, as highlighted in Fig. 4. As shown in
Fig. 5, 2011 was not an exception, since the CPA spending had also been driven by available revenue
rather than by sticking to planned expenditure levels.
Figure 6 highlights budget and outturn by broad functions. For the education sector, outturns were far
less than budgetary allocation in 2011. Budgetary allocations were almost identical with outturns for
the health sector, except that most of the outturns accrued to the Ministry of Health, and very little to
HIV/AIDS Commission. Outturns were more than double the budgetary allocations for public
administration and security and 60 percent more than budgeted for infrastructure.
0
20
40
60
80
100
120
140
160
0
200
400
600
800
1000
1200
No
v-09
Jan
-10
Mar
-10
May
-10
Jul-
10
Sep
-10
No
v-10
Jan
-11
Mar
-11
May
-11
Jul-
11
Sep
-11
No
v-11
Jan
-12
CP
I
Go
vt E
xpen
dit
ure
Month
Govt Exp Govt Exp (Est) CPI
0
0.5
1
1.5
2
2.5
3
3.5
4
4.5
0.0
20.0
40.0
60.0
80.0
100.0
120.0
140.0
160.0
Ap
r-07
Sep
-07
Feb
-08
Jul-
08
Dec
-08
May
-09
Oct
-09
Mar
-10
Au
g-10
Jan
-11
Jun
-11
No
v-11
Sou
th S
ud
an E
xcan
ge R
ate
(SSP
/USD
an
d U
SD/S
DG
)
CP
I So
uth
Su
dan
CPI Exchange rate

World Bank – Poverty Reduction and Economic Management Unit (PREM), Africa Region, 2013 P a g e | 4
Figure 4: Systematic overspending of the budget in 2011
Figure 5: Since CPA expenditures driven by revenues , not approved budget
3
Figure 6: 2011 Budget and Outturn (‘000 SSP).
The Government is fully aware of the weakness in
execution control, and the Minister of Finance
announced in the 2012/13 budget speech very
significant measures to tighten budget execution
control procedures in line with the Public Finance
Management & Accountability Act, 2011. These
measures are aimed at ensuring that only claims
which have been properly approved by accounting
officers and directors general within the approved
monthly expenditure limits will be paid, by using
only cheques printed directly from FMIS while the
manual transfer letter system is eliminated; that all
required contracting procedures have been
followed, including advance approval by the
Ministry of Justice and MoFEP, and that payments
are made only to vendors who have delivered the goods or services in the contract.
The economic growth orientation of the budget can be analyzed by looking at the share of
expenditure dedicated to investment and to support priority productive sectors, such as agriculture.
3 Analysis of the 2011/12 Draft Budget and the 2012/13 Budget Ceilings, Peter D’Souza, Economic Advisor, Joint Donor Team
0
200,000,000
400,000,000
600,000,000
800,000,000
1,000,000,000
1,200,000,000
1,400,000,000
1,600,000,000
1,800,000,000
2,000,000,000
1 2 3 4 5 6 7 8 9 10 11 12
Gov Exp Monthly Ceiling Actual Monthly gov exp
-
2,000,000,000
4,000,000,000
6,000,000,000
8,000,000,000
10,000,000,000
12,000,000,000
Original budget Expenditure outturn
Revenue outturn
0 2,000,000,000
Accountability
Economic…
Education
Health
Infrastructure
Natural…
Public…
Rule of Law
Security
Social &…
Block Transfers
Contingencies
2011 Outturn
2011 Budget

World Bank – Poverty Reduction and Economic Management Unit (PREM), Africa Region, 2013 P a g e | 5
High growth countries in East Asia were able to allocate above 30 percent of their expenditures to
capital during the years of fast growth and poverty reduction.
In the early years of the CPA, the government was able to spend a reasonable share of its resources on
capital, but since 2008 the investment share has been declining. In 2006 and 2008, capital
expenditures were above 25% of the total, and after 2008, the capital share started gradually declining
reaching below 20% in 2010 and 2011, and 17% in the first 6 months of 2012 (see Figure 7) . Capital
expenditure decreased only in relative terms. In USD equivalent, capital expenditure decreased in 2009,
in correspondence of a sharp decrease in oil revenue, due to falling oil prices, and then increased
gradually, but less than current expenditure.
The declining trends in investment spending over the last 4 years were dramatically accelerated by the
need to adopt austerity budget. The budgeted amounts for capital expenditures show even a more
dramatic decline in the last three budgets, going from 17% in the FY2011/12 budget to 6% in the
FY2012/13 budget (see Figure 8), demonstrating how capital expenditures bore the brunt of the fiscal
austerity adjustment. In fact capital expenditures have been cut by 80% in the FY2012/13 budget,
compared to 22% for salaries, 9% for transfers, and other expenditures have been cut by 47%. This is
largely expected as it is easier to cut investment spending than to reduce salary payments in the face of
temporary revenue shortfalls.
Figure 7: Share of Capital Exp. in Total Actual Expenditures (%)
Figure 8: Share of Capital Exp. in Total Budgeted Expenditures (%)
Without policy reforms to reduce its very large public wage bill, South Sudan will find it difficult to
fund capital expenditures at a satisfactory level. The declining share of capital expenditures from 2009
to 2011 was actually accompanied also by a reduction in the share of the wage bill (the wage bill
increased, but at a slower pace than overall expenditures, hence lowering its share). However, because
of their rigidity, the share of wages and salaries went up again in the context of the last austerity budget,
0
100
200
300
400
500
600
700
800
900
0
0.05
0.1
0.15
0.2
0.25
0.3
2006 2008 2010 2011/12
Mill
ion
s
In % of total exp. USD equivalent
Righ axis
17%
13%
6%
0%
2%
4%
6%
8%
10%
12%
14%
16%
18%
20% Budget: FY2011/12
AusterityBudget Feb.2012 - Jun2012
Budget FY2012/13

World Bank – Poverty Reduction and Economic Management Unit (PREM), Africa Region, 2013 P a g e | 6
as they are difficult to cut (see Figure 9). This seems to indicate that the level of the wage bill, which is
on the very high side by international standards, needs to be addressed structurally to allow for a more
investment- and growth-oriented budget in the years to come.
Figure 9: Wage bill Share in Total Expenditures (%)
Figure 10: Wage Bill in SSP (‘000)
A rationalization of operating expenditures also appears necessary in view of their high and growing
share in total expenditures. Operating expenditures are high, at around 40 percent of total expenditure,
and they have been growing in the last few years. It will be important to analyze, and in case re-classify,
operating expenditures, which often include many wage and salary elements and transfers. It may also
be necessary to identify areas for cost savings and rationalization.
0%
10%
20%
30%
40%
50%
60%
70%2006 outturn
2007 outturn
2008 outturn
2009 outturn
2010 outturn
2011/12 outturn(Provisional)
2012/13 Budget
0
500
1,000
1,500
2,000
2,500
3,000
3,500
4,000
4,500
Mill
ion
s
2006 outturn
2007 outturn
2008 outturn
2009 outturn
2010 outturn
2011/12 outturn(Provisional)
2012/13 Budget
Section’s Take Away
The inability to implement the budget as approved, leading to significant expenditure overruns, has
been at the root of the budget’s inability to provide enough fiscal reserves for managing security
shocks, and also behind the strongly inflationary impact of recent fiscal policy. In this respect, the
government commitment to enforce control measures introduced in the FY2012/13 budget is to be
highly commended, and their effective implementation will be a critical element to monitor. The
adoption of an Oil Revenue Management law that sets aside a proportion of annual oil revenues to
provide an adequate fiscal buffer will also be critical.
In order to reverse the decline in the growth orientation of the budget, by increasing the share of
capital expenditures, there will be a need to look for creative and bold initiatives to reduce the
weight of the wage bill, in a way that is consistent with security considerations, and with the role of
public wages as an instrument of national political and socio-economic cohesion. Rationalizing
operating expenditures is also important.
World Bank – Poverty Reduction and Economic Management Unit (PREM), Africa Region, 2013 P a g e | 7
3. The budget as an instrument of implementation of national choices
3.1. Recent trends
This sub-section reviews to what extent the Budget has allocated resources in a way that is consistent
with the Government’s own strategic priorities. The Government of Southern Sudan (GoSS) had
identified six top expenditure priorities for the period 2008-2011, which included: (1) security; (2) roads;
(3) primary health care; (4) basic education; (5) water; and (6) production. For the 2011-13 period, the
Government’s strategy and outlined priority programs are set out in the South Sudan Development Plan
(SSDP). SSDP emphasizes channeling resources towards development, basic education and health
service delivery and development of a vibrant agricultural sector. It also recognizes the importance of
continuing to provide security to the people of South Sudan. The Government’s budget documents
recognize that “the budget for 2012/13 comes against a background which was not envisaged at the
time the SSDP was completed. As a result, the ability of the Government to allocate resources to the
budget sectors in order to deliver SSDP priorities has been constrained.”
Security sectors and core public administration functions were indeed prioritized in the 2011 budget.
Figure 11 and Figure 12 below show that 38% of public expenditures were allocated to the security and
rule of law sectors while the outturns were 40% in 2011 for the same sectors. Overspending was also
visible in the public administration sector: the budget allocated 13% of total public expenditure to the
sector while outturns amounted to 19%.
The road sector was also prioritized, although to a lesser extent. The 2011 budget appropriated 10% of
total public expenditures to the infrastructure sector, and the actual allocation was 11%, of which 88%
accrued to the Ministry of Roads and Bridges.
Health and education expenditures, on the contrary, appear to be very low priority in the 2011 budget.
For health and education, the 2011 budget appropriated 8% and 4% respectively, and for the two
sectors together, only 6% was in fact actually disbursed to them, meaning that the actual allocation to
the two sectors was halved. These sectors are left highly dependent on donor funding, a fact which may
have been internalized by the government to limit the budget funding of these sectors. For instance,
prior to oil shutdown in January 2012, donors were funding 75% of South Sudan’s health provision.
However, in the face of austerity and delayed resumption of oil production, this proportion is likely to
remain the same or increase. Most donors provide health services using parallel systems with the view
of minimizing fiduciary risk, but this practice entails high operating costs and limits domestic ownership.
Productive sectors, i.e. mainly agriculture, have not been prioritized in the 2011 budget. The share of
the natural resources function in the budget was 5%, while almost 80% of the population lives in rural
areas, mainly engaged in agriculture and livestock. Execution was particularly problematic at 2% of total
expenditures. This represented only a modest increase of the allocated expenditure, compared to
previous budget years, and a reduction in USD equivalent terms. It is important to note that while the
share of public spending on agriculture is important for the sector, public spending on other sectors
such as education, roads and water, for example, also supports the development of agriculture.

World Bank – Poverty Reduction and Economic Management Unit (PREM), Africa Region, 2013 P a g e | 8
Figure 11: Allocation of Expenditures by functions: 2011 budget.
Figure 12: Allocation of Expenditures by functions: 2011 outturn.
3.2. Achievement of long-term strategic objectives on education and health
This sub-section projects the analysis of the previous pages into the future by asking whether
continuing the current expenditure policies is consistent with attaining South Sudan’s objectives for
primary education and health spelled out in Vision 2040.
Figure 13: Gross Enrollment Ratio.
Figure 14: Budget for Primary Education, in percent of total budget expenditure.
Through simple macroeconomic, unit cost, and population assumptions (see Annex 1 for detailed
assumptions), projections show that it will take South Sudan a generation, under current policies, to
reach gross enrollment rates (GER) for primary education similar to today’s EAC average, which is
Accountability 3%
Economic Functions
4% Education
8%
Health 4%
Infrastructure
10%
Natural Resources
5%
Public Administrati
on 13%
Rule of Law 10%
Security 28%
Social & Humanitaria
n Affairs 2%
Block Transfers
13%
Accountability 10%
Economic Functions
2% Education
4%
Health 2%
Infrastructure 11%
Natural Resources
2%
Public Administrati
on 19%
Rule of Law 9%
Security 31%
Social & Humanitaria
n Affairs 2%
Block Transfers
8%
40%
60%
80%
100%
120%
140%
20
11
20
13
20
15
20
17
20
19
20
21
20
23
20
25
20
27
20
29
20
31
20
33
20
35
20
37
20
39
Pop. 6-13 grows at 2.3% on average
Pop. 6-13 grows at 3.0% on average
0.0%
2.0%
4.0%
6.0%
8.0%
10.0%
12.0%
14.0%
16.0%
18.0%
Average 2008-2011 Free and universalprimary education
(unchanged per pupilexpenditure)
Free and universaleducation (EAC
average expenditureper pupil)
Source: NBS, “Education in the Republic of South Sudan”, The
World Bank, 2012, EMIS 2011 and World Bank staff estimates
and projections.
Source: World Development Report, NBS, EMIS 2011 and World
Bank staff estimates and projections.

World Bank – Poverty Reduction and Economic Management Unit (PREM), Africa Region, 2013 P a g e | 9
slightly below universal primary education. Under the assumptions of constant expenditure per
student for primary education (see Figure13, including donors’ financing), constant share of expenditure
for primary education in total budget expenditure and growth of pupils aged 6-13 averaging between
2.3% and 3%, the GER is expected to increase above 2011 level of 64% only in 2018, reach 100% in 2031
and the average for EAC countries (127%, see Figure 14) only in 2040. Higher population growth would
slow down the catch-up, unless more resources are destined to primary education.
Projections for the Health Sector, (see Annex 1 for the underlying macro, population and budget
assumptions), show that the percent of women receiving ante-natal care would not even approach the
EAC average in the next 30 years if additional resources are not provided. According to the 2010 NHBS,
only 44.4% of pregnant women have at least one ante-natal visit before delivery. Under the assumption
of no increase in the efficiency of delivery of PHC services and that donors would continue to finance
about 80% of health expenditure, as in FY2012/13, the percentage of women receiving pre-natal visits
would increase to 63% by 2040. If donors support decreases to the average for 2008-2011 (about 70% of
total PHC expenditure), given plausible projections of total fertility rates, there would be a large drop in
the percentage of women accessing ante-natal services, and more so if donors support would not be
available (see Figure 15).
Figure 15: Women receiving one or more ante-natal visit, in % of women giving birth in the previous 2 years.
Figure 16: Budget for ante-natal care in 2010, in percent of total budget expenditure.
0
20
40
60
20
10
20
12
20
14
20
16
20
18
20
20
20
22
20
24
20
26
20
28
20
30
20
32
20
34
20
36
20
38
20
40
Donors financing constant as expected in 2012/13Donors financing equal to 2008-2011 averageNo donor financing
0.0%
0.5%
1.0%
1.5%
2.0%
2.5%
Current publicfinancing
100% coverage,with constant
share of donorsfinancing
100% coverageentirley publicly
financed
Source: 2010 Household Health Survey, NBS; GRSS 2011 budget;
World Bank staff estimates and projections.
Source: 2010 Household Health Survey, NBS; GRSS 2011 budget;
World Bank staff estimates and projections.

World Bank – Poverty Reduction and Economic Management Unit (PREM), Africa Region, 2013 P a g e | 10
4. The budget as an instrument to deliver quality basic services to the
population at large
This section looks at how much South Sudan is getting in terms of service delivery from its public
expenditures in education and health.
4.1. Education expenditure
This section analyses the education budget of GRSS and how it relates to the achievement of key
indicators of access to primary education. It compares GRSS education budget and key education
indicators with countries in the East African Community (EAC) and other Low Income Countries (LICs).
Overall spending in absolute per-capita terms on education in South Sudan is not low compared to
countries in the EAC, but it accounts for a much lower share of the government budget. According to
the latest available budget data, on average EAC countries invest 20% of their budget in education,
compared to 5% in South Sudan (see Figure 17a). Among the other comparator countries, Laos, the
poorest among the East-Asian Countries invests 14% of total expenditure, while Vietnam, the fastest
growing East-Asian LICs invests almost 20%. Average spending per student in primary schools in current
USD, as measured over the period 2008-2011, is comparable to that of other EAC countries (Figure 17b)
if donor contributions are accounted for.
Figure 17a: Public spending on education (% of government expenditure).
Figure 17b: Expenditure per student, primary (in USD).
0.0%
5.0%
10.0%
15.0%
20.0%
25.0%
Bu
run
di
Ken
ya
Rw
and
a
Tan
zan
ia
Uga
nd
a
EAC
Ave
rage
Lao
PD
R
Vie
tnam
Sou
th S
ud
an
0.0
50.0
100.0
150.0
200.0
250.0
Bu
run
di
Ken
ya
Rw
and
a
Tan
zan
ia
Uga
nd
a
EAC
Ave
rage
Vie
tnam
Bu
dge
t
Incl
. do
no
rs f
in.
South Sudan
Note: For South Sudan, average 2007-2011, including Donors’
financing, for all other countries, average 2006-2010.Source:
World Development Report; 2012/13 Approved Budget and
NBS.
Note: For South Sudan, average 2008-2011, for all other countries,
average 2006-2010. Source: World Development Report; 2012/13
Approved Budget, NBS, and World Bank staff estimates.

World Bank – Poverty Reduction and Economic Management Unit (PREM), Africa Region, 2013 P a g e | 11
South Sudan lags behind in terms of gross primary enrollment. GER in South Sudan was 64% in 2011,
half of the average for EAC countries and Laos and well below Vietnam’s.
Even though unit costs for primary education in South Sudan are comparable to the average for EAC,
low gross enrollment rate and a prevalence of untrained teachers are likely to have significant
implications for learning quality. South Sudan has a number of pupils per teacher comparable with the
average for EAC countries, but it has a much lower percentage of trained teachers in primary schools.
Actually, only 44% of primary school teachers are considered trained in South Sudan, compared to more
than 90% for all other countries. Also, about 40% of teachers are volunteers and therefore not on the
Government payroll, a situation that reduces costs, but is hardly sustainable. There are also wide
disparities in the resources available to the different states, which results in wide differences of per
student spending in primary schools (see Education in the Republic of South Sudan, 2012).
Figure 18: Key input indicators for primary education.
Figure 19 Share of Education in Total Expenditure, 2006-2012.
Figure 20 Total Expenditure in Education, 2006-2012.
0
20
40
60
80
100
120
140
School enrollment, primary (%gross)
Pupil-teacher ratio, primaryTrained teachers in primary
education (% of total teachers)
EAC Average Lao PDR Vietnam South Sudan
0%
2%
4%
6%
8%
10%
12%
20
06
20
07
20
08
20
09
20
10
20
11
20
11
/12
20
12
/13
Budget Outturn
0
50
100
150
200
20
06
20
07
20
08
20
09
20
10
20
11
20
11
/12
20
12
/13
In U
S d
olla
rs
Budget Outturn

World Bank – Poverty Reduction and Economic Management Unit (PREM), Africa Region, 2013 P a g e | 12
After the remarkable progress in the early years of the CPA, the recent trends in the education sector
are not particularly encouraging, as a number of indicators in the education sector have deteriorated
since 2009. In South Sudan, demand for school has increased rapidly. Primary enrollment has doubled
from 0.7 million in 2005 to 1.4 million in 2009 and then remained constant until 2011. The GER
decreased from 72% in 2009 to 63% in 2011 (for 8 year cycle). The pupil-teacher ratio (PTR) slightly
increased from 52.0 in 2009 to 52.4 in 2011; the pupil-classroom ratio decreased from 129.5 in 2009 to
124.7 in 2011, and from 2010 to 2011, the pupil-textbook ratio has worsened from 4.0 to 4.9 for English
textbooks and from 4.1 to 4.8 for math textbooks.
Moreover, in education budget allocations have been trending downwards, and budget outturns were
always lower than initial budget allocations. Budget outturns for education, including higher education
and transfers to States, have varied from a maximum of 8% in 2007 to a minimum of 4% in 2011. Budget
allocations were on average 2 percentage points higher than final outturns (see Figure 13). Since 2009,
the budget outturns, in U.S. dollar terms, were always lower than the approved budget allocation,
despite significant increases of the actual overall public expenditure with respect to the approved total
budget.
Overall, relatively low, and declining, education expenditures, in face of growing demand for
education, mean education is provided to still too few South Sudanese children and with lower-
quality human and material inputs. It would appear that the current spending levels and composition
of public expenditures for education are not putting the country on the path to achieve neither universal
nor quality primary education.
4.2. Health expenditure Government budget expenditure in health has been declining since 2006, per capita spending
is low and budget execution averages only 65%. Since 2010, the share of health in the budget
has been below 4%. In FY2012/13 health expenditure has declined further to 3% of public
expenditure. The share of capital expenditure in health expenditures averaged less than 19%
since 2009, and has been further reduced to less than 6% (i.e. 5.3%) in the FY12/13 budget.
Budget outturns deviated from the approved budget by 65% on average over the period 2006-
2012 (see Figure 21). In addition, the share of capital budget outturn has been consistently
below the approved one, which could undermine the planning and financing of investment in
health facilities.

World Bank – Poverty Reduction and Economic Management Unit (PREM), Africa Region, 2013 P a g e | 13
Figure 21: Public spending on health (% of government expenditure).
Figure 22: Recurrent and capital expenditure in health (% of government health expenditure).
Since 2009, donors have been financing more than 70% of total expenditure for health. The
share of donors financing has remained constant over time, ensuring the delivery of basic
health services in the States. However, as argued further below, the dependency on donors
poses a problem for the type of health system that the GRSS will choose to develop and the
financing that will be necessary to offer free primary health care, as stated in the South Sudan
Transitional Constitution, 2011.
The total public and private health
expenditure in 2009 was comparable to
other EAC countries, but the share of
health expenditure in the budget is about
half of that of the EAC average. In 2009,
private spending on health care roughly
equaled government spending, and
consequently wealth is a crucial
determinant of health outcomes. Thanks to
continued donor financing, the GRSS has
been spending much less than the EAC
average. Given its context, South Sudan
needs to exceed its neighbors’ spending in
order to achieve the same outcome.
0%
1%
2%
3%
4%
5%
6%
7%
8%
9%2
00
6
20
07
20
08
20
09
20
10
20
11
20
11
/12
20
12
/13
Budget Outturn
0%
10%
20%
30%
40%
50%
60%
70%
80%
90%
100%
Ap
pro
ved
Ou
ttu
rn
Ap
pro
ved
Ou
ttu
rn
Ap
pro
ved
Ou
ttu
rn
Ap
pro
ved
Ou
ttu
rn
Ap
pro
ved
Ou
ttu
rn
Ap
pro
ved
Ap
pro
ved
Ou
ttu
rn
Ap
pro
ved
2006 2007 2008 2009 2010 2011 FY12 FY13
Capital Salaries Operating
Fig. 23: Donors financing for health (% of total health expenditure)
0%
20%
40%
60%
80%
100%
20
07
20
08
20
09
20
10
20
11
20
12
/13
Budget Outturn
Source: GRSS Approved Budget Documents. Source: GRSS Approved Budget Documents.
Source: GRSS, Approved Budget Documents; NBS.

World Bank – Poverty Reduction and Economic Management Unit (PREM), Africa Region, 2013 P a g e | 14
Figure 24: Health expenditure per capita, 2009 (current US$).
Figure 25: Public health expenditure (% of government expenditure).
The country has made impressive progress in provision of basic health services since the
signing of the CPA but still faces massive challenges. In 2006, one year after the signing of the
CPA, under-five mortality rate was 135 per 1000 live births and decreased to 105 per 1000 live
births by 2010. Infant mortality rate was estimated at 75 per 1,000 live births in 2010; this is
compared to 102 per 1,000 live births in 2006. Among women of reproductive age with a
pregnancy, skilled birth attendance (births attended by a doctor, nurse midwife or village
midwife) increased from 41% of live births between 2004 and 2006 to 48% between 2008 and
2010. This result was driven by an increase in the number of births delivered by nurse
midwives, medical assistants and health visitors. The gains in professional support during
childbirth, however, have been limited primarily to women in urban areas. On average, health
interventions for children under the age of five reach about 50% of children in need. Between
2006 and 2010, the nutritional status of South Sudan's children improved.
Despite the dramatic improvement in health outcome indicators, since the signing of the CPA,
South Sudan still lags far behind its EAC neighbors and other comparator countries. Under-
five mortality rate remains well above EAC average. The number of pregnant women receiving
health services is extremely low, only 12.8%, compared to EAC average of 94%. Only 28% of
infants are immunized against DPT, compared to an average of 82% in the EAC.
0102030405060708090
Bu
run
di
Ken
ya
Rw
and
a
Tan
zan
ia
Uga
nd
a
EAC
ave
rage
Lao
PD
R
Vie
tnam
Sou
th S
ud
an
0.0%
5.0%
10.0%
15.0%
20.0%
25.0%
Bu
run
di
Ken
ya
Rw
and
a
Tan
zan
ia
Uga
nd
a
EAC
ave
rage
Lao
PD
R
Vie
tnam
Sou
th S
ud
an
Note: for South Sudan, average 2007-2011; for all other countries,
average 2006-2010. Sources: World Development Report, The World
Bank; for South Sudan, approved budgets of the Government of
Southern Sudan, and GRSS.
Sources: World Development Report, The World Bank; for South
Sudan, approved budgets of the Government of Southern Sudan,
2010 and NBHS, 2009.

World Bank – Poverty Reduction and Economic Management Unit (PREM), Africa Region, 2013 P a g e | 15
Figure 26: Key health indicators, 2010.
Overall, the health sector has experienced positive developments since the CPA, but the
government budget seems to have played a relatively minor role, as most of the sector is
financed by donors and most health operations are managed by non-government actors. It is
unlikely that the current structure and level of funding will allow South Sudan to see significant
further progress in the health status of the population, and it would leave any potential for
improvement in the hands of donors to continue and/or expand their health programs.
0 20 40 60 80 100 120
Immunization, DPT (% of children ages 12-23months)
Pregnant women receiving prenatal care (%)
Mortality rate, under-5 (per 1,000 live births)
South Sudan Vietnam Lao PDR EAC Average
Section’s Take Away
Since the signing of the CPA in 2005, the government has been able to guarantee significant
improvement to the health and education status of the population.
The current level and composition of public expenditures in these two sectors is however
insufficient to guarantee that similar progress will be achieved in the 5 first years of
independence, as relatively low and declining budget shares translate into insufficient levels
and low quality of service delivery, while high reliance on donor funding limits the ability of the
government to influence these sectors.
The government needs to create the conditions (PFM safeguards and capacity for service
delivery) for donors’ money to be channeled through, and align with, the government budget
to support local service delivery through country systems. This would reduce operating costs
and ensure domestic ownership of the health sector
Sources: World Development Report, the World Bank; for South
Sudan, NBS.

World Bank – Poverty Reduction and Economic Management Unit (PREM), Africa Region, 2013 P a g e | 16
5. Key Policy Issues
This section discusses the key policy implications of the analysis carried in the note.
5.1 South Sudan Budget as an instrument of stability and economic growth
It would be important for the government to reach a broad and firm internal consensus on an explicit
medium-term fiscal policy framework that recognizes that the aggregate parameters of fiscal policy
are of critical significance for state security and economic stability. Given the extremely volatile
security situation in which South Sudan operates, the fiscal policy should be able to set aside fiscal
reserves to allow the country to weather political and economic shocks, and curb the inflationary impact
of current fiscal policy. The level and growth of public expenditures should be determined as to be
consistent with low inflation and an appropriate debt and exchange rate policy.
There is need for strict adherence to budget discipline, especially to implement the commitment
control reforms measures embodied in the FY2012/13 Budget Speech. Since the signing of the CPA in
2005, expenditures have been driven by available revenue rather than by sticking to planned
expenditure levels. The government commitment to enforce control measures introduced in the
FY2012/13 budget is to be highly commended, and their effective implementation will be a critical
element to monitor.
The government will want to put effort in finding an internal consensus to start an agenda of policy
reforms aimed at reducing the very huge public wage bill in South Sudan, as a prerequisite for funding
capital and social expenditures at satisfactory levels. In order to reverse the decline in the growth
orientation of the budget, by increasing the share of capital expenditures, there is a need to look for
creative and bold initiatives to reduce the weight of the wage bill, in a way that is consistent with
security considerations, and with the role of public wages as an instrument of national and soci-
economic cohesion. Rationalizing operating expenditures is also important.
5.2 South Sudan Budget as an instrument to meet its national strategic objectives of delivering
quality basic services to the population.
This note shows that the current pattern of public expenditures, if left unchanged, will not allow
meaningful gains in social outcomes in health and education over the foreseeable future. The
Government would want to review whether the current arrangements in terms of strategic planning,
budget preparation, and the link between these, are sufficient to tackle the challenges of reallocating
expenditures towards development and achieving quality service delivery. South Sudan has developed
a long-term vision, a shorter-term South Sudan Development Plan, and a well-designed process of
budget preparation. As important and well-run these processes are, the Government needs to ascertain
whether, in the current operating environment, they will be able to deliver a radically different pattern
of budgetary spending, attuned with the Government’s strategic objectives.
As oil revenues are expected to start flowing again, the government will have the opportunity to
implement appropriate fiscal arrangements to fund development expenditures. The government has
finalized an oil revenue management bill which operationalizes a constitutionally-mandated future
generation fund. It will be important to allocate a portion of this fund to invest in the human capital of
the country, while ensuring competent and transparent management of the service delivery chain.
World Bank – Poverty Reduction and Economic Management Unit (PREM), Africa Region, 2013 P a g e | 17
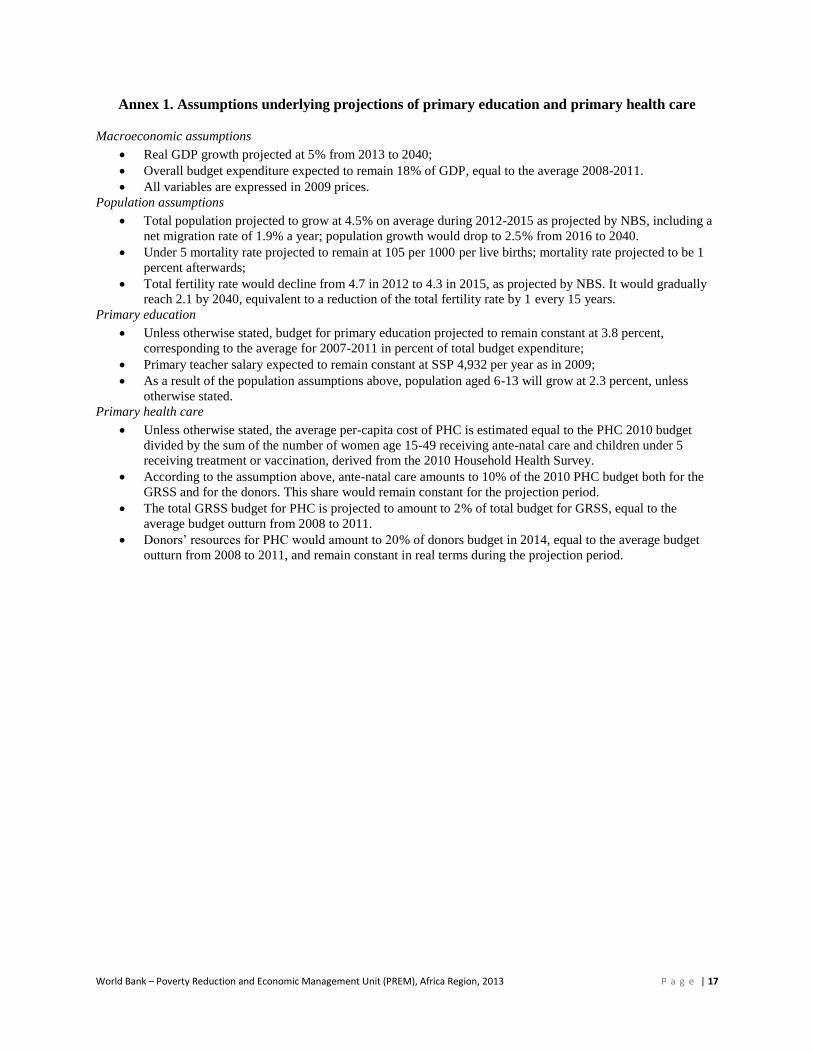
Annex 1. Assumptions underlying projections of primary education and primary health care
Macroeconomic assumptions
Real GDP growth projected at 5% from 2013 to 2040;
Overall budget expenditure expected to remain 18% of GDP, equal to the average 2008-2011.
All variables are expressed in 2009 prices.
Population assumptions
Total population projected to grow at 4.5% on average during 2012-2015 as projected by NBS, including a
net migration rate of 1.9% a year; population growth would drop to 2.5% from 2016 to 2040.
Under 5 mortality rate projected to remain at 105 per 1000 per live births; mortality rate projected to be 1
percent afterwards;
Total fertility rate would decline from 4.7 in 2012 to 4.3 in 2015, as projected by NBS. It would gradually
reach 2.1 by 2040, equivalent to a reduction of the total fertility rate by 1 every 15 years.
Primary education
Unless otherwise stated, budget for primary education projected to remain constant at 3.8 percent,
corresponding to the average for 2007-2011 in percent of total budget expenditure;
Primary teacher salary expected to remain constant at SSP 4,932 per year as in 2009;
As a result of the population assumptions above, population aged 6-13 will grow at 2.3 percent, unless
otherwise stated.
Primary health care
Unless otherwise stated, the average per-capita cost of PHC is estimated equal to the PHC 2010 budget
divided by the sum of the number of women age 15-49 receiving ante-natal care and children under 5
receiving treatment or vaccination, derived from the 2010 Household Health Survey.
According to the assumption above, ante-natal care amounts to 10% of the 2010 PHC budget both for the
GRSS and for the donors. This share would remain constant for the projection period.
The total GRSS budget for PHC is projected to amount to 2% of total budget for GRSS, equal to the
average budget outturn from 2008 to 2011.
Donors’ resources for PHC would amount to 20% of donors budget in 2014, equal to the average budget
outturn from 2008 to 2011, and remain constant in real terms during the projection period.