public financial management (pfmx) module 03fiscal year 2016) source: imf office of budget and...
TRANSCRIPT

This training material is the property of the International Monetary Fund (IMF) and is intended for use in IMF Fiscal Affairs Department (FAD) courses.Any reuse requires the permission of the IMF and FAD.
Module
PFM and Fiscal Policy Design
Public Financial Management (PFMx)03

A Tool to Deliver Fiscal Policy Objectives and Outcomes

Role of the International Monetary Fund (IMF)
SurveillanceandOversight
56%
Lending15%
CapacityDevelopment
29%
SurveillanceandOversight
Lending
CapacityDevelopment
Shareofactivitiesbycost.(Fiscalyear2016)
Source:IMFOfficeofBudgetandPlanning.Note.TheIMF’sfinancialyearisMay1throughApril30.

IMF Public Financial Management Technical Assistance

PFM Technical Assistance in Article IV Reports – Nigeria

Role of the International Monetary Fund (IMF)
SurveillanceandOversight
56%
Lending15%
CapacityDevelopment
29%
SurveillanceandOversight
Lending
CapacityDevelopment
Shareofactivitiesbycost.(Fiscalyear2016)
Source:IMFOfficeofBudgetandPlanning.Note.TheIMF’sfinancialyearisMay1throughApril30.

An Example – Jordan
External Shock Impact Result
Imports of fuel cost more
Public debt increases
Increase in fuel prices
Increase in losses of state-owned electricity company (NEPCO)
More government guaranteed debt and transfers to NEPCO

FiscalPolicy
Howpoliciesshouldbedesigned
Whattodo Howtodo
PublicFinancial
Management
Howpoliciesshouldbeimplemented
HighcapacityintheMoF

Coverage of the Public Sector

Coverage of the Public Sector
Source: IMF Fiscal Transparency Evaluations.
BudgetaryCentral
Government
SocialSecurity
ExtrabudgetaryCentral
Government
SubnationalGovernment
GeneralGovernment
PublicCorporations
Finland(2013)
Guatemala(2014)
28.8 13.4
19.8 2.2
–– 2.0
24.1 2.9
58.1 17.5
14.2 1.6
PublicSector
GeneralGovernment
PublicCorporations
PublicFinancial
Corporations
PublicNon-financialCorporations
StateGovernments
CentralGovernment
LocalGovernments
SocialSecurity
BudgetaryCentral
Government
ExtrabudgetaryCentral
Government

Coverage of the Public Sector
GUATEMALA (2014)FINLAND (2013)
Reported
Not Reported
Source: IMF Fiscal Transparency Evaluations.

An Example – Jordan
External Shock Impact Result
Imports of fuel cost more
Public debt increases
Increase in fuel prices
Increase in losses of state-owned electricity company (NEPCO)
More government guaranteed debt and transfers to NEPCO
Coverage

Coverage
Important because:
Fiscal policy is carried out by different levels of government
Budget allocations need to be made in a comprehensive manner
Partial coverage is a source of fiscal risk


Anticipating Fiscal Risks
60
70
80
90
100
110
2007 2008 2009 2010 2011 2012 2013 2014 2015 2016
Spring2016
Spring2007
37%ofGDP
AdvancedEconomies:PublicDebt,2007-2016.(PercentofGDP)
Source:IMF.


Fiscal Costs of Contingent Liabilities
Source: IMF Fiscal Monitor Database; and IMF estimates
0
10
20
30
40
50
60
1990 1992 1994 1996 1998 2000 2002 2004 2006 2008 2010 2012 2014
Fisc
al C
osts
(Per
cent
of G
DP)
YearLegal Natural Disaster(s) Other SOEs + PPPs Subnational Government

Fiscal Costs of Contingent Liabilities
Source: IMF Fiscal Monitor Database; and IMF estimates
0
10
20
30
40
50
60
1990 1992 1994 1996 1998 2000 2002 2004 2006 2008 2010 2012 2014
Fisc
al C
osts
(Per
cent
of G
DP)
YearFinancial Sector Legal Natural Disaster(s) Other SOEs + PPPs Subnational Government
Indonesia
Algeria
IcelandThailand
Ireland
TurkeyKorea
Greece


An Example – Jordan
External Shock Impact Result
Imports of fuel cost more
Public debt increases
Increase in fuel prices
Increase in losses of state-owned electricity company (NEPCO)
More government guaranteed debt and transfers to NEPCO


IdentifyingandAnalyzing
Source: Where does the source oftheriskreside?
Incidence: What is the probablity of risk?

IdentifyingandAnalyzing
Source: Where does the source oftheriskreside?
Incidence: What is the probablity of risk?
Endogenous Exogenous Continuous:regularevents
Discrete:occurringirregularly

IdentifyingandAnalyzing
Source: Where does the source oftheriskreside?
Incidence: What is the probablity of risk?
Endogenous Exogenous Continuous:regularevents
Discrete:occurringirregularly


An Example – Jordan
Risk MitigationEfficiency gainsTariff
adjustmentsDiversification of fuel supply
External Shock Impact Result
Imports of fuel cost more
Public debt increases
Increase in fuel prices
Increase in losses of state-owned electricity company (NEPCO)
More government guaranteed debt and transfers to NEPCO


Bigscreenshot.

Iamnotsurewecanopenthefiscalriskstatement

Definition of Public Corporations

Public Corporations
Classified as:
A separate entity by law
Generate profit or other financial gain
Set up for market production
Controlled by government

Scope of Public Corporations
Airlines
Ports
Electricity Postal services
Natural Resource companies
TelecommunicationsRailways
Water
Transport Utilities Other

Monitoring Public Corporations is important
PublicCorporations:Marketvalue(PercentofGNI)
Source:Kowalski,P.;M.Büge;M.Sztajerowska;M.Egeland.2013.OECDTradePolicyPaper147.Note:DatafromForbesGlobal2000areyear2011;anddataforGNIareyear2010.
0%
10%
20%
30%
40%
50%
China
Russia
Norw
ay
India
Brazil
Poland
CzechRe
public
Indo
nesia
Finland
Sweden
France
Switzerland
Korea
Greece
Unite
dKingdo
m
Austria
Belgium
SouthAfrica
Japan
Turkey
Unite
dStates
Ireland
Germ
any
Italy

0 500 1000 1500 2000 2500
SlovakiaLithuaniaEstoniaHungary
CzechRepublicLatvia
SloveniaCroatia
RomaniaBulgariaSwedenPoland
NumberofState-owned enterprises(Average2012-14)
Source:U.Böwer,IMFWorkingPaper.
Public Corporations account for large share of the economy

Public Corporations account for large share of the economy
Source:U.Böwer,IMFWorkingPaper.Note.Healthcaresectorisexcluded
0123456789
Bulgaria Croatia CzechRepublic
Estonia Hungary Latvia Lithuania Poland Romania Slovakia Slovenia Sweden
Output Employment
ShareofState-ownedenterprisesintheeconomy(Percentoftotal;annualaverage2012-2014)

Public corporations impose economic and fiscal costs
Source:U.Böwer,IMFWorkingPaper.
0 50 100 150 200 250
PolandRomaniaSwedenHungaryCroatiaSlovakia
CzechRepublicSloveniaBulgariaLatvia
Estonia
Averagecostperenergysectoremployee,2012-14.(Costperstate-ownedenterprise employeeinpercentofcostinprivatefirms.)

Public Corporations can increase Public Debt
Source:Eurostat.
0102030405060708090
100
Slovakia Lithuania Estonia Romania Croatia CzechRepublic
Bulgaria Hungary Latvia Poland Sweden Slovenia
2013
2014
2015
Contingentliabilities(outsideGeneralGovernment)(PercentofGDP)

Monitoring Public Corporations
Ensures that Public Corporations are not a mechanism:
§ for circumventing traditional fiscal controls; and
§ a conduit for financial misconduct.

Effective Oversight of Public Corporations

Effective Oversight of Public Corporations

Effective Oversight of Public Corporations
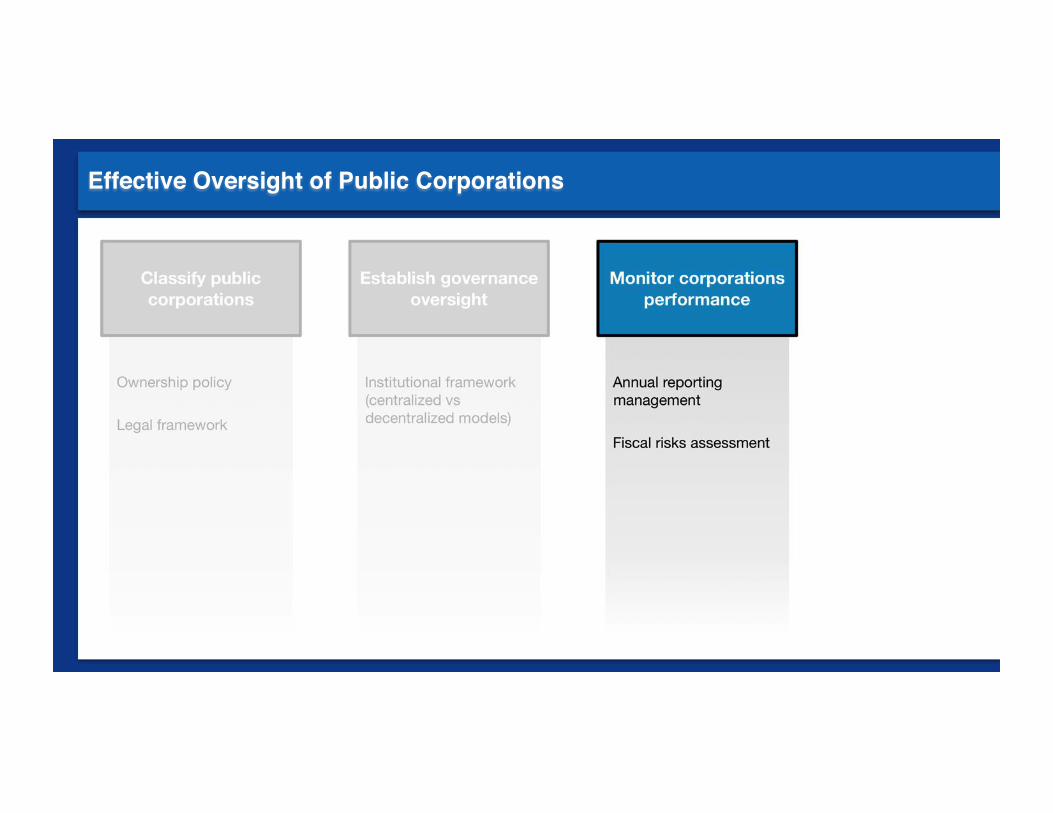
Effective Oversight of Public Corporations

Effective Oversight of Public Corporations

FiscalPolicy
Howpoliciesshouldbedesigned
Whattodo Howtodo
PublicFinancial
Management
Howpoliciesshouldbeimplemented
HighcapacityintheMoF

An Example – Jordan
Risk MitigationEfficiency gainsTariff
adjustmentsDiversification of fuel supply
External Shock Impact Result
Imports of fuel cost more
Public debt increases
Increase in fuel prices
Increase in losses of state-owned electricity company (NEPCO)
More government guaranteed debt and transfers to NEPCO