public financial management (pfmx) module 6 · tax revenue analysis public financial management ......
TRANSCRIPT

This training material is the property of the International Monetary Fund (IMF) and is intended for use in IMF Fiscal Affairs Department (FAD) courses.Any reuse requires the permission of the IMF and FAD.
Module
Tax Revenue Analysis
Public Financial Management (PFMx)6

Taxation and the Budget Cycle
LegalFramework
FiscalFramework
#1
BudgetPreparation
#2ControlandAudit
#5
AccountingandReporting
#4Budget
Execution
#3
Revenueforecasting
Accountability
TaxPolicy
Revenuecollection

Topics Covered

“In this world, nothing can be said to be certain except death and taxes.”– Benjamin Franklin (1789)

Tax Revenue Supports Budget Expenditure

The Importance of Tax Revenue
OTHER
71 %
29%
01020304050607080
Taxandotherrevenue:average2014-2016
Source:IMFWoRLD
TaxRevenue OtherRevenue

Non-Tax Revenues
Ø Grants
Ø Natural Resources
Ø State-Owned Enterprises
Ø Central Banks
OTHER
TaxRevenue OtherRevenue

44%
29%
21%
6%Taxrevenue
Grants
OilRevenue
Other
90%
10%
Belgium
Taxrevenuein2016(%totalrevenue)
Chad
Illustrating Cross-Country Differences
Source:IMFWoRLD
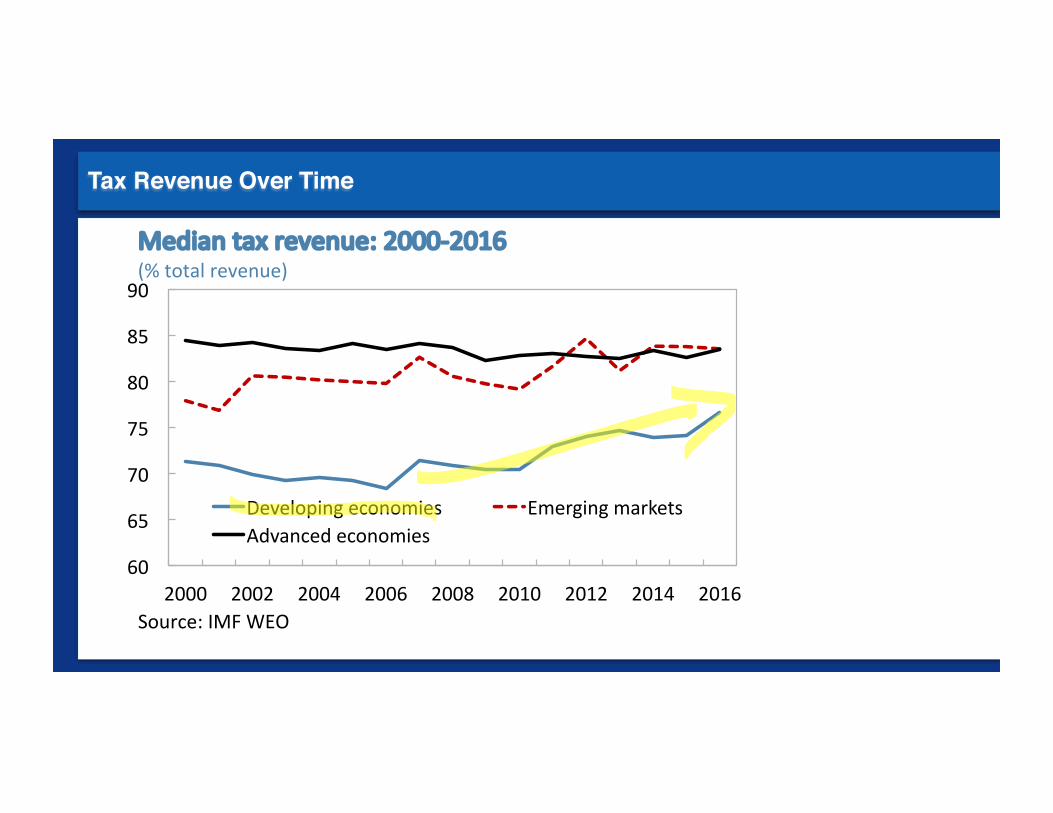
Tax Revenue Over Time
60
65
70
75
80
85
90
2000 2002 2004 2006 2008 2010 2012 2014 2016
Developingeconomies EmergingmarketsAdvancedeconomies
Mediantaxrevenue:2000-2016(%totalrevenue)
Source:IMFWEO

Tax Revenue Comparison
0
50
100
150
200
250
300
350
400
450
2010 2011 2012 2013 2014 201535
37
39
41
43
45
47
49
51
53
55Greece Turkey
TaxRevenue:GreeceandTurkey2010-2015(InBillionslocalcurrency,Greeceplottedonsecondaryaxis)
Source:IMFWEO
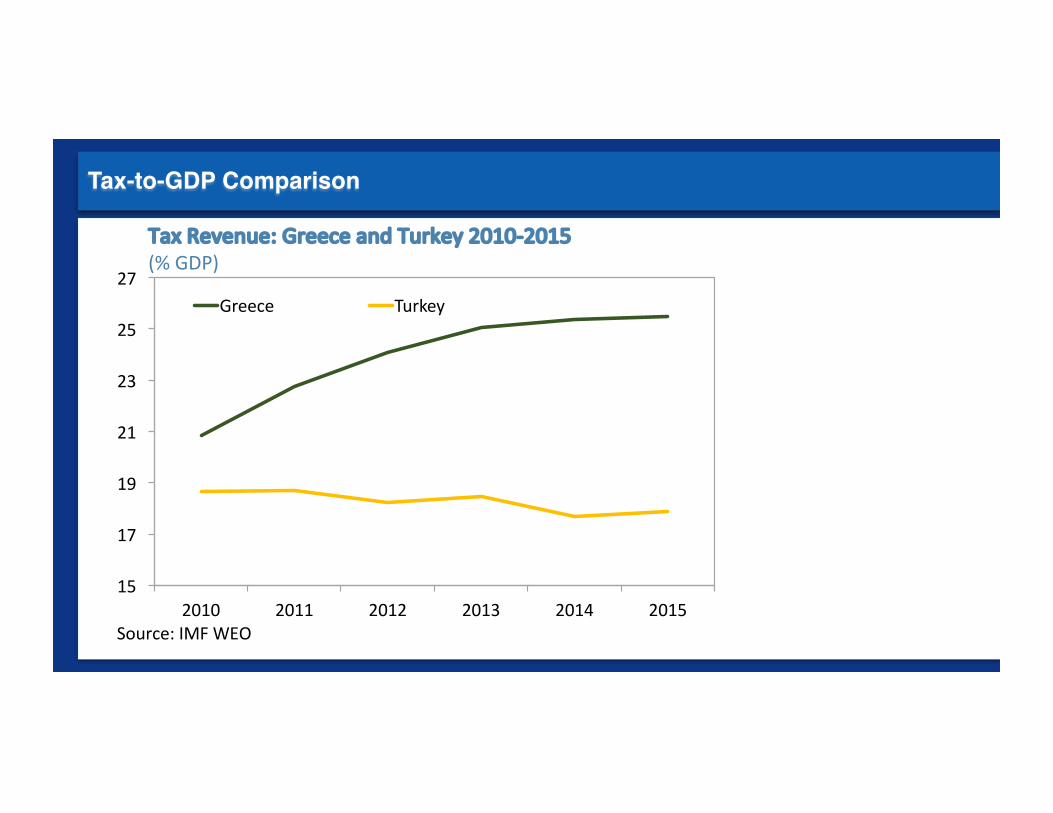
Tax-to-GDP Comparison
15
17
19
21
23
25
27
2010 2011 2012 2013 2014 2015
Greece Turkey
TaxRevenue:GreeceandTurkey2010-2015(%GDP)
Source:IMFWEO

Tax Ratio Averages
15%18%
22%
0
5
10
15
20
25
Developingeconomies
Emergingmarkets Advancedeconomies
Averagetaxrevenuein2016(%GDP)
Source:IMFWEO

Disparity in Tax Revenue (advanced economies)
0.6% 2%
Average22%
40%
47%
05
101520253035404550
Bahrain SaudiArabia AdvancedEconomies
Denmark Sweden
Taxratio(average2014-2016)
Source:IMFWEO
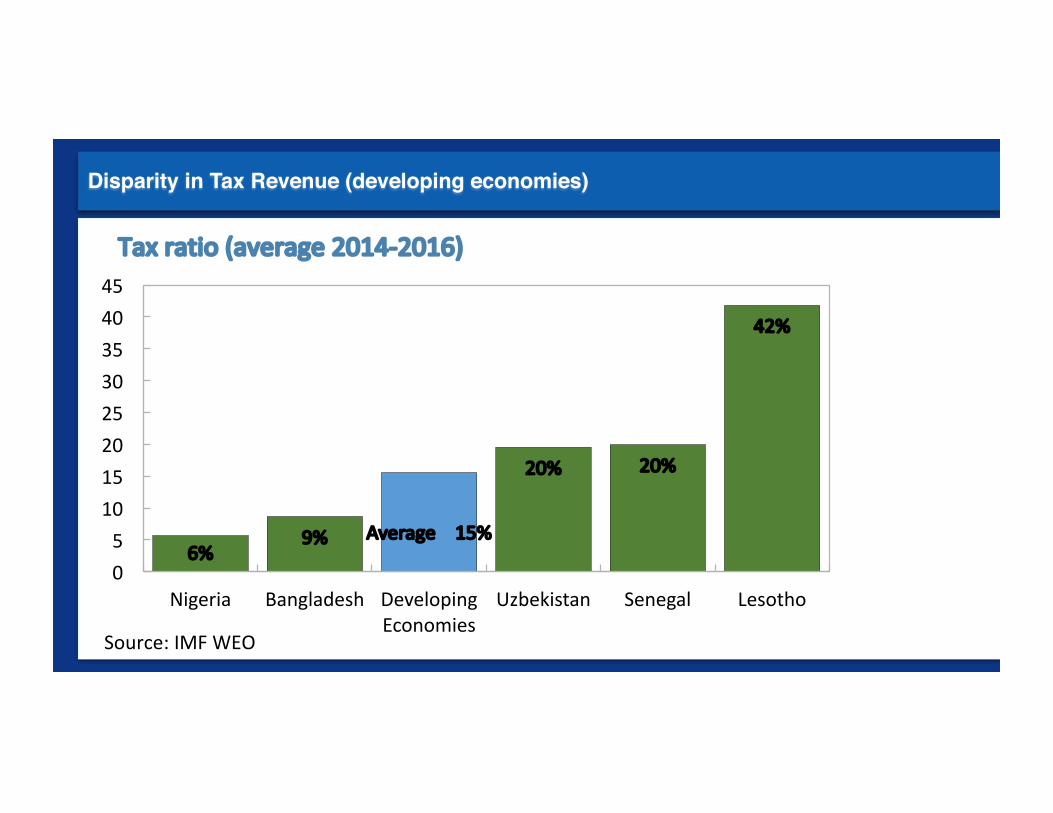
Disparity in Tax Revenue (developing economies)
6%9% Average15%
20% 20%
42%
05
1015202530354045
Nigeria Bangladesh DevelopingEconomies
Uzbekistan Senegal Lesotho
Source:IMFWEO
Taxratio(average2014-2016)

Key Elements Supporting Tax Revenue

Trend in Tax Ratio
0
5
10
15
20
25
19901992199419961998200020022004200620082010201220142016
Developingeconomies Emergingmarkets
Advancedeconomies
Averagetaxrevenuebyincomegroup:1990-2016
Source:IMFWEO

Characteristics of a Tax

Components of Tax Revenue
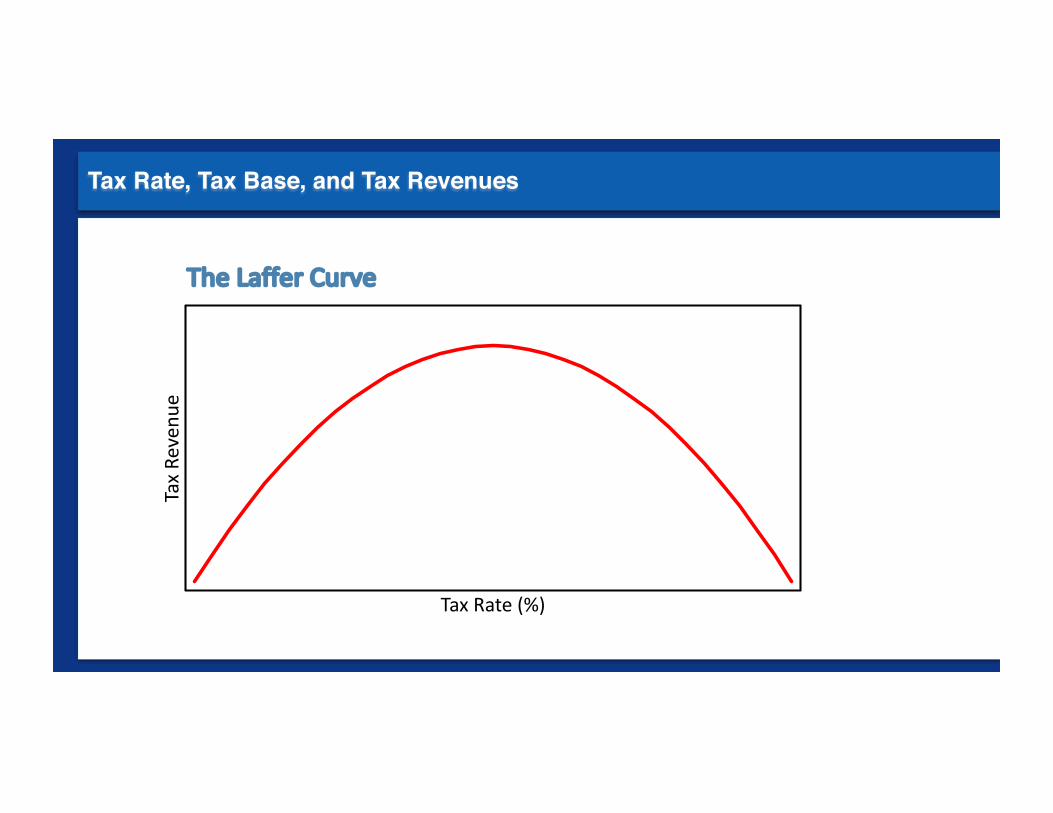
Tax Rate, Tax Base, and Tax RevenuesTaxRe
venu
e
TaxRate(%)
TheLafferCurve

Income, Consumption, and Savings
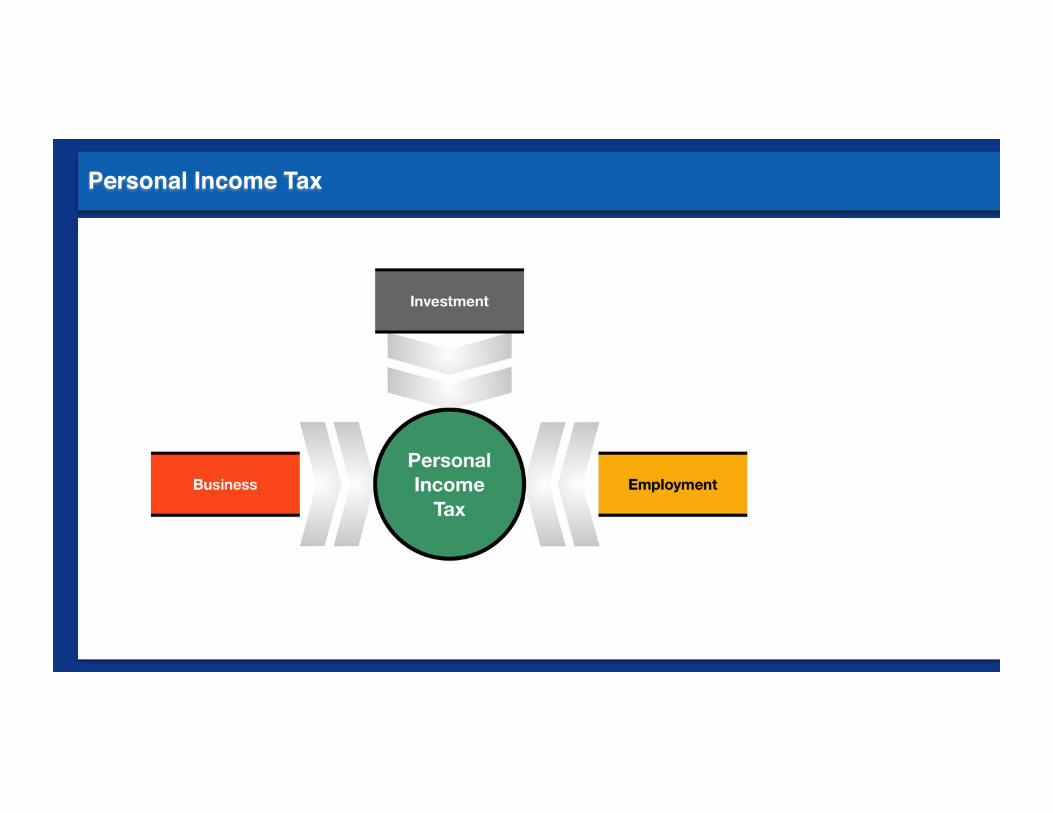
Personal Income Tax

Corporate Income Tax
DividendsOwnership

Value Added Tax

Excise Tax

Tax Mix Comparison
10%
30%
44%
1% 15%
CorporateIncomeTax
PersonalIncomeTax
DomesticConsumptionTaxesTaxesonInternationalTradeOtherTaxes
16%
14%
51%
11%
8%
Advanced Economies Developing Economies
Averagetaxmix:2013-2015 (%taxrevenue)
Sources:IMFWoRLD

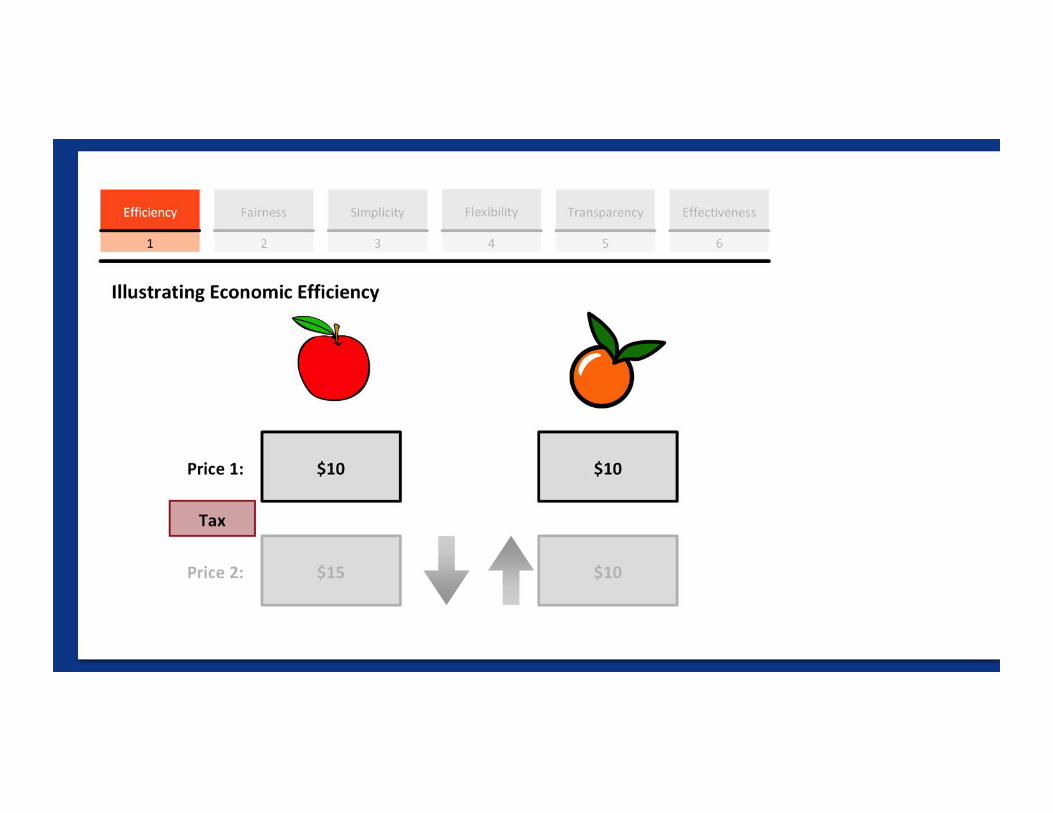
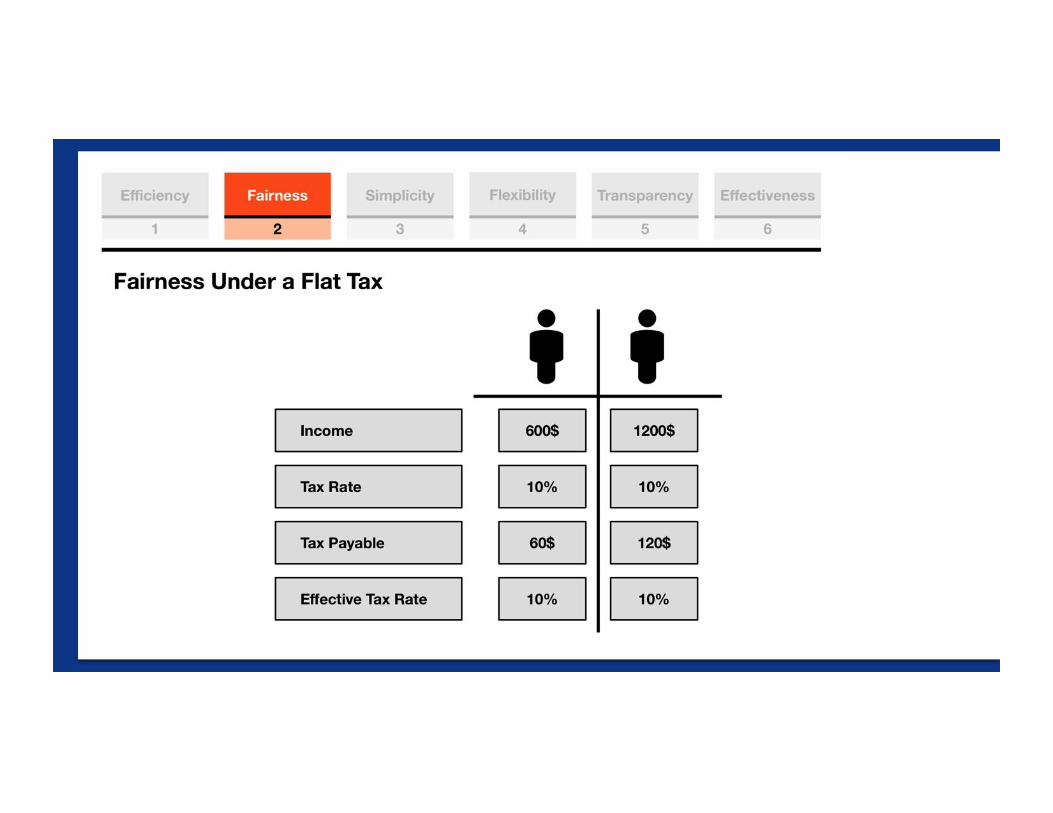
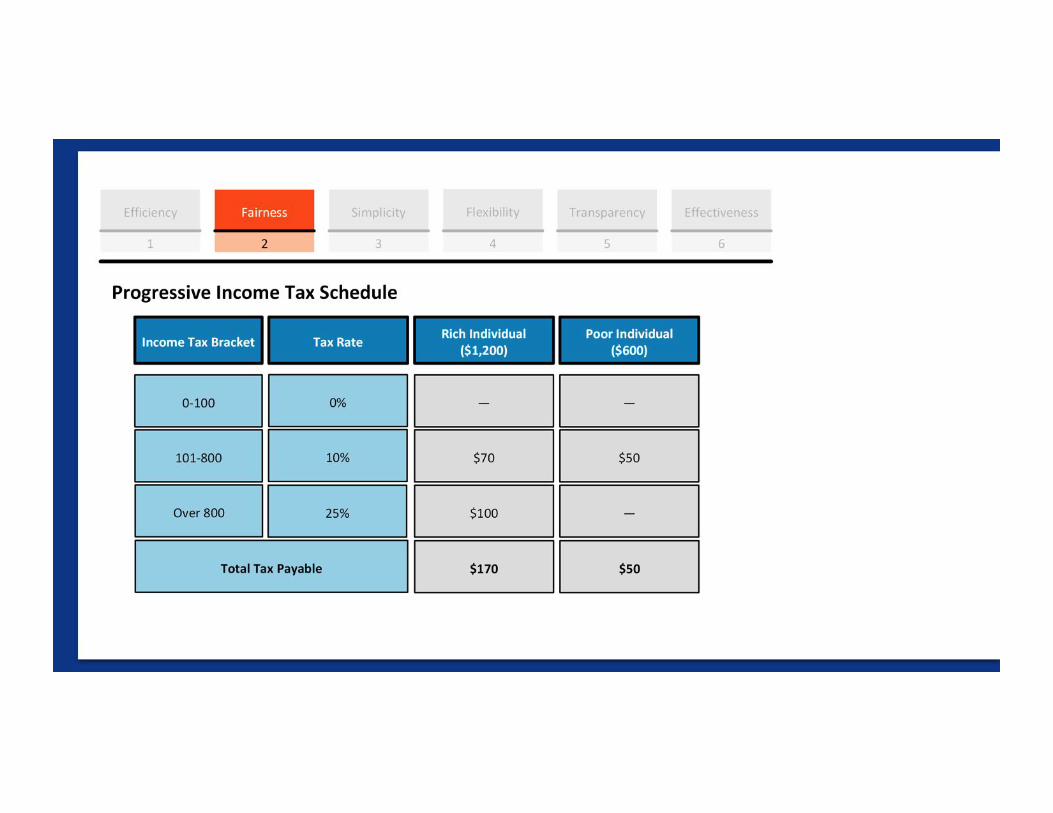
Criteria of a Good Tax


$1,000 $1,000 $1,000 $1,000 $1,000


0
2
4
6
8
10
12
14
16
18
100 300 500 700 900 1100 1300 1500
Effe
ctiv
e ta
x ra
te (%
)
Gross Income ($)
Progressive tax
Proportional flat tax
RichPoor


0
2
4
6
8
10
12
14
16
18
100 200 300 400 500 600 700 800 900 100011001200130014001500
Effe
ctiv
e ta
x ra
te (%
)
Gross Income ($)
Progressive tax
BoomCrisis

Supporting Sound Tax Policy Through Tax Transparency
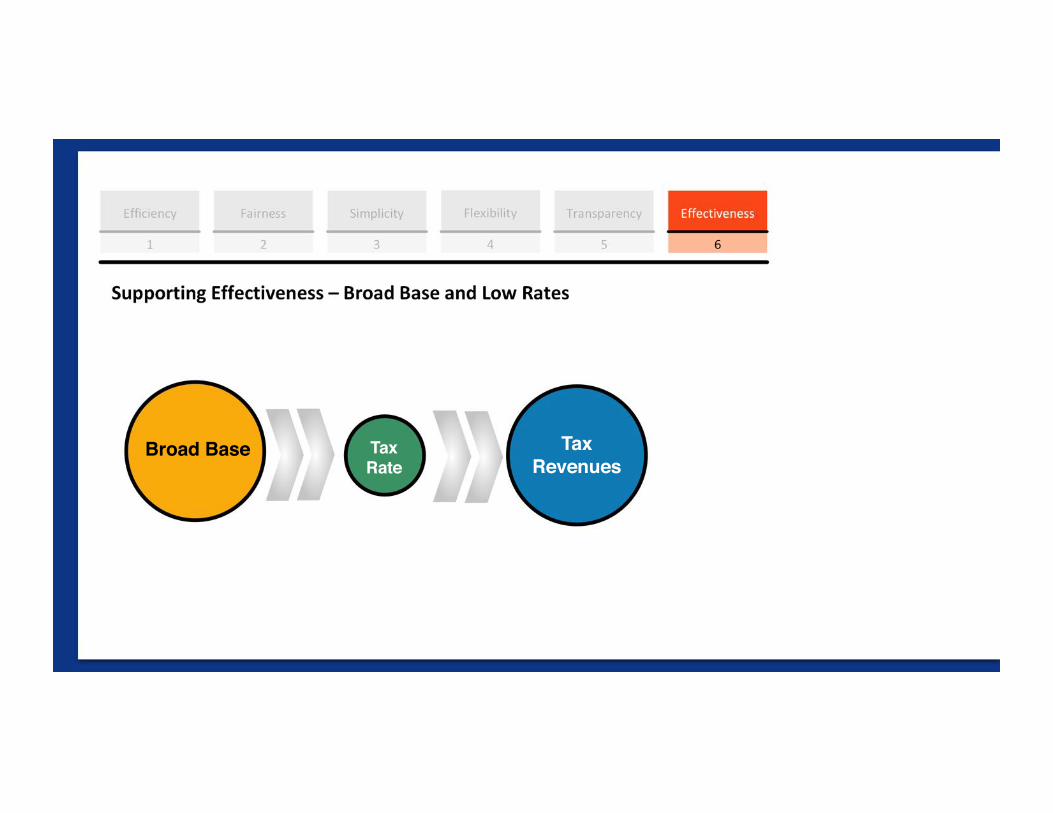
Broad Base Tax Rate
TaxRevenues
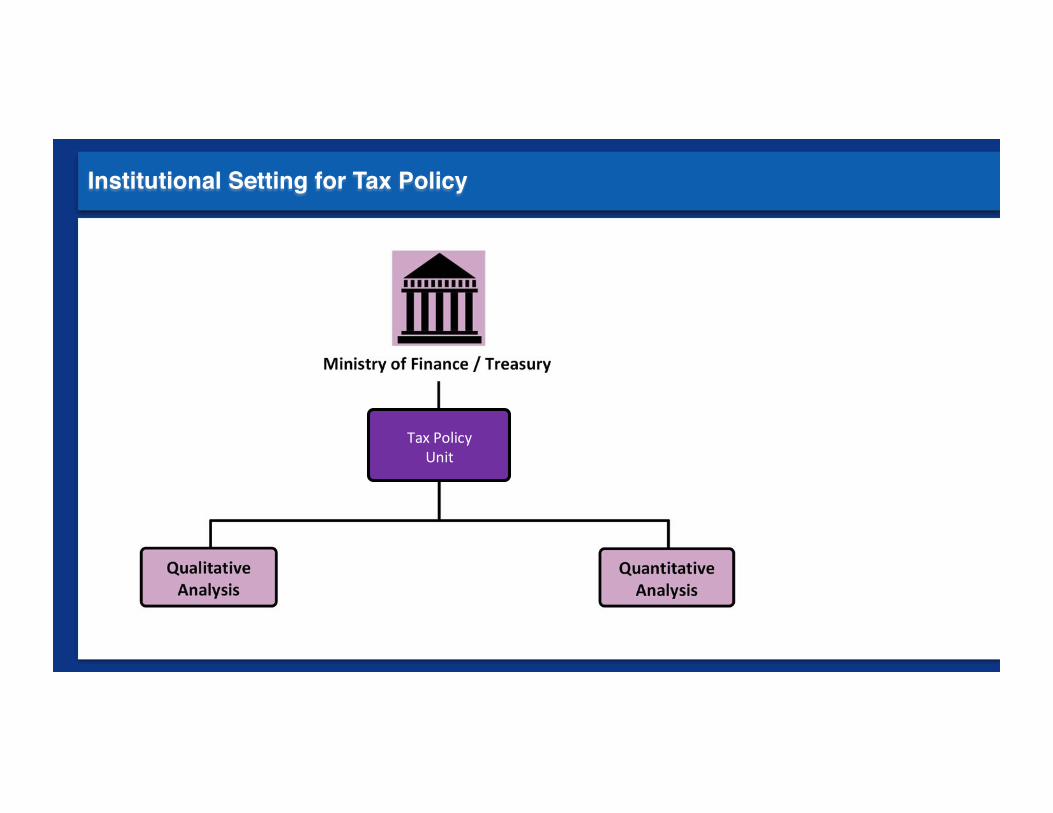
Institutional Setting for Tax Policy
TaxPolicyUnit

MinistryofFinance/Treasury
OtherMinistries
TaxAdministration
PrivateSector
SettingtheTaxPolicyReformAgenda

Tax Policy Process
TaxPolicyUnit

Ministry of Finance, Tax Administration, and Tax Policy
TaxPolicy